the geisinger model: a systematic approach to quality and
TRANSCRIPT

Heal • Teach • Discover • Serve © 2011 by Geisinger Health System – All Rights Reserved
Not for reuse or distribution without permission
The Geisinger Model: A Systematic
Approach to Quality and Value
National Health Policy Forum
Washington, DC
October 14, 2011
Glenn Steele, Jr., MD, PhD
President & CEO
Geisinger Health System
Heal • Teach • Discover • Serve © Geisinger Health System 2011
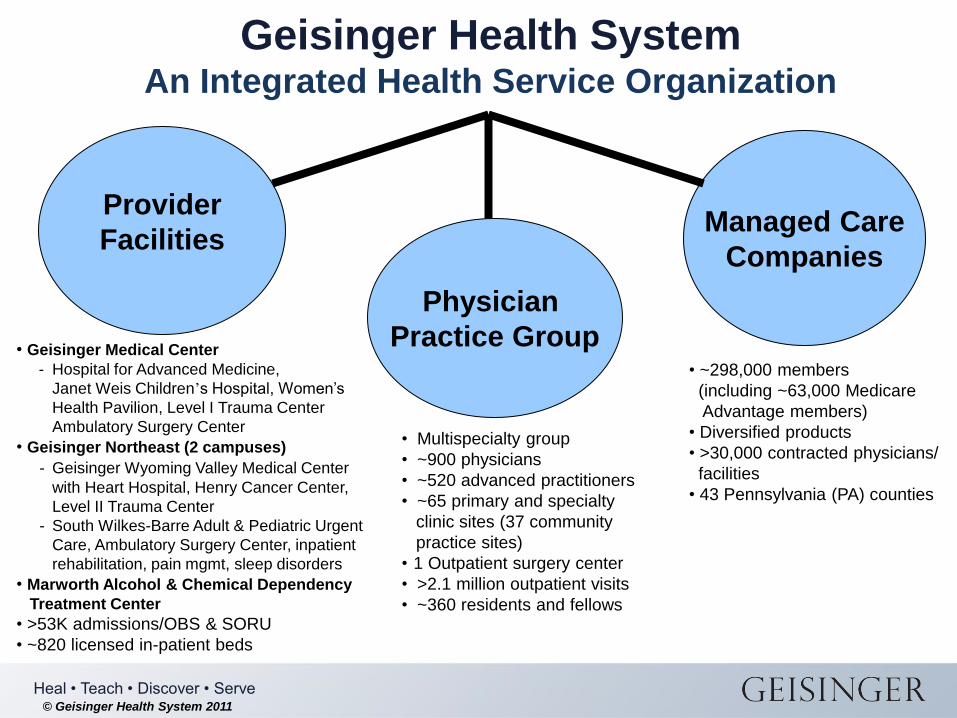
Geisinger Health System An Integrated Health Service Organization
Provider
Facilities
Physician
Practice Group
Managed Care
Companies
• Geisinger Medical Center
- Hospital for Advanced Medicine,
Janet Weis Children’s Hospital, Women’s
Health Pavilion, Level I Trauma Center
Ambulatory Surgery Center
• Geisinger Northeast (2 campuses)
- Geisinger Wyoming Valley Medical Center
with Heart Hospital, Henry Cancer Center,
Level II Trauma Center
- South Wilkes-Barre Adult & Pediatric Urgent
Care, Ambulatory Surgery Center, inpatient
rehabilitation, pain mgmt, sleep disorders
• Marworth Alcohol & Chemical Dependency
Treatment Center
• >53K admissions/OBS & SORU
• ~820 licensed in-patient beds
• Multispecialty group
• ~900 physicians
• ~520 advanced practitioners
• ~65 primary and specialty
clinic sites (37 community
practice sites)
• 1 Outpatient surgery center
• >2.1 million outpatient visits
• ~360 residents and fellows
• ~298,000 members
(including ~63,000 Medicare
Advantage members)
• Diversified products
• >30,000 contracted physicians/
facilities
• 43 Pennsylvania (PA) counties

Last updated 12/16/10
Non-Geisinger Physicians With HER
LifeFlight Base
Geisinger-Shamokin Area Community Hospital, Bloomsburg Hospital*, and Community Medical Center
Geisinger ProvenHealth Navigator Sites
Contracted ProvenHealth Navigator Sites
Geisinger Medical Groups
Geisinger Specialty Clinics
Geisinger Inpatient Facilities
Ambulatory Care Facility
Geisinger Health System Hub and Spoke Market Area
Geisinger Health Plan Service Area
Careworks Convenient Healthcare
* A campus of Geisinger Medical Center
Geisinger Health System
Community Medical Center
Geisinger-Shamokin
Area Community Hospital*
Bloomsburg Hospital

Heal • Teach • Discover • Serve
• >$135M invested (hardware, software, manpower, training)
• Running costs: ~4.4% of annual revenue of >$3B
• Fully-integrated EHR: 37 community practice sites; 2 hospitals; 2 EDs; 6 Careworks retail-based and worksite clinics
– Acute and chronic care management
– Optimized transitions of care
• Networked PHR - ~178,000 active users (34% of ongoing patients)
– Patient self-service (self-scheduling, kiosks)
– Home monitoring integrated with Medical Home
• “Outreach Health IT” – 3,159 users in 612 non-Geisinger practices
– Remote support for regional ICUs
– Telestroke services to regional EDs
• Active Regional Health-Information Exchange (KeyHIE)
– 18 hospitals, 100+ practices, 500,000 patients consented
• e-health (eICU®) Programs
• Keystone Beacon Community - $16M Grant from ONCHIT over 3 years
– HIT-enabled, Community-wide care coordination in 5 rural counties
Electronic Health Record (EHR) update
Heal • Teach • Discover • Serve
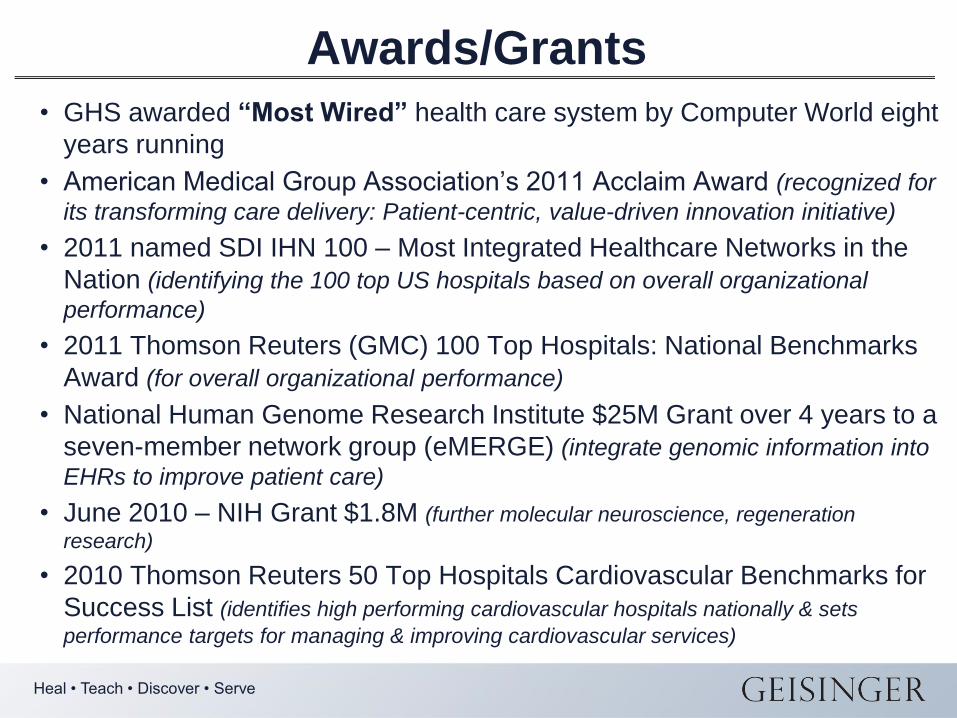
Awards/Grants
• GHS awarded “Most Wired” health care system by Computer World eight
years running
• American Medical Group Association’s 2011 Acclaim Award (recognized for
its transforming care delivery: Patient-centric, value-driven innovation initiative)
• 2011 named SDI IHN 100 – Most Integrated Healthcare Networks in the
Nation (identifying the 100 top US hospitals based on overall organizational
performance)
• 2011 Thomson Reuters (GMC) 100 Top Hospitals: National Benchmarks
Award (for overall organizational performance)
• National Human Genome Research Institute $25M Grant over 4 years to a
seven-member network group (eMERGE) (integrate genomic information into
EHRs to improve patient care)
• June 2010 – NIH Grant $1.8M (further molecular neuroscience, regeneration
research)
• 2010 Thomson Reuters 50 Top Hospitals Cardiovascular Benchmarks for
Success List (identifies high performing cardiovascular hospitals nationally & sets
performance targets for managing & improving cardiovascular services)
Heal • Teach • Discover • Serve © Geisinger Health System 2011
• Quality
• Innovation
• Market Leadership
Growth
Scale and Generalize Innovation
• The Geisinger Family
Legacy
Personal and Professional Well-being
The Vision

Heal • Teach • Discover • Serve © Geisinger Health System 2011
Where Do We Want to Be as a Nation?
1. Affordable coverage for all
2. Payment for value
3. Coordinated care
4. Continuous improvement/innovation
5. National health goals, leadership, accountability
The Path to a High Performance US Health System “A 2020 Vision and the Policies to Pave the
Way”, pg. 16-21, The Commonwealth Fund

Heal • Teach • Discover • Serve © 2011 by Geisinger Health System – All Rights Reserved
Not for reuse or distribution without permission 8
State of the Evidence…
Volume 348(26) 26 June 2003 pp 2635-2645
The Quality of Health Care Delivered To Adults In the United States
McGlynn, Elizabeth A.: Asch, Steven M.: Adams, John: Jeesey, Joan: Hicks, Jennifer:
DeCristofaro, Alison: Kerr, Eve A.
BACKGROUND
We have little systematic information about the extent to which standard processes involved in healthcare—a
key element of quality—are delivered in the United States.
METHODS
We telephoned a random sample of adults living in 12 metropolitan areas in the United States and…received
written consent to copy their medical records…to evaluate performance on 439 indicators of quality of care
for 30 acute and chronic conditions as well as preventative care…
RESULTS
Participants received 54.9 percent of recommended care.
CONCLUSIONS
The deficits we have identified in adherence to recommended processes for basic care pose serious threats
to the health of the American public. Strategies to reduce these deficits are warranted.

Heal • Teach • Discover • Serve © 2011 by Geisinger Health System – All Rights Reserved
Not for reuse or distribution without permission Adapted from Regence Blue Shield; Arnie Milstein, MD - Mercer
MD Longitudinal Cost Efficiency Index
(total cost per case mix-adjusted treatment episode)
Low Efficiency Low Quality (Nightmare Suppliers)
MD
Qu
ali
ty I
nd
ex
(ou
tco
me
s o
r %
ad
he
ren
ce
to
EB
M) High Efficiency
High Quality (Dream Suppliers)
High Efficiency Low Quality
Low Efficiency High Quality
L
ow
er
Hig
he
r
50th %ile
50th %ile
Lower Efficiency/
Higher Cost
Higher Efficiency/
Lower Cost
Cost/Quality “Correlation”

Heal • Teach • Discover • Serve
Cost or Quality
1993-1994
Hillary-Care ‘Debate’
Cost/Quality ≠ R
2003
Cost = Quality
2006-2010
GHS Innovations

Heal • Teach • Discover • Serve © Geisinger Health System 2011
The Key Issues
• Unjustified variation
• Fragmentation of care-giving
• Perverse payment incentives
– Units of work
– Outcome irrelevant
• Patient as passive recipient of care

Heal • Teach • Discover • Serve © Geisinger Health System 2011
ProvenCare® for Acute Episodic Care
(the “Warranty”)

Heal • Teach • Discover • Serve © Geisinger Health System 2011
ProvenCare® for Acute Episodic Care
ProvenCare®
• Identify high-volume DRGs
• Determine best practice techniques
• Deliver evidence-based care
• GHP pays global fee
• No additional payment for complications

Heal • Teach • Discover • Serve © Geisinger Health System 2011
ProvenCare® CABG: Quality/Value - Clinical Outcomes
Before
ProvenCare® ProvenCare® % Improvement
(n=132) (n=321)
In-hospital mortality 1.5 % 0.3 % 80 %
Patients with any complication (STS) 38 % 33 % 13 %
Patients with >1 complication 8.4 % 5.9 % 30 %
Atrial fibrillation 24 % 21 % 13 %
Neurologic complication 1.5 % 0.9 % 40 %
Any pulmonary complication 7 % 5 % 29 %
Re-intubation 2.3 % 0.9 % 61 %
Blood products used 24 % 22 % 8 %
Re-operation for bleeding 3.8 % 2.8 % 26 %
Deep sternal wound infection 0.8 % 0.3 % 63 %
Readmission within 30 days 6.9 % 5.6 % 20 %

Heal • Teach • Discover • Serve © Geisinger Health System 2011
• 80% improvement in In-hospital mortality
• 61% reduction in re-intubations
• 63% reduction in deep sternal wound infection rate
• 40% reduction in neurologic complications
• 29% reduction in pulmonary complications
• 20% reduction in 30 day readmissions w/ 8%
reduction in ALOS
ProvenCare® CABG: Clinical Outcomes (Comparison of before (n=132) and after (n=321) ProvenCare®)

Heal • Teach • Discover • Serve © Geisinger Health System 2011
Hospital:
• Contribution margin increased 17.6%
• Total inpatient profit per case improved $1946
Health Plan:
• Paid out 4.8% less per case for CAB with ProvenCare®
than it would have without
• Paid out 28 to 36% less for CAB with GHS than with other providers
ProvenCare® CABG: Financial Outcomes

Heal • Teach • Discover • Serve © Geisinger Health System 2011
ProvenCare® Portfolio
ProvenCare®:
– CABG
– PCI (Percutaneous Coronary Interventions Angioplasty/Angioplasty + AMI)
– Hip replacement
– Cataract
– EPO
– Perinatal
– Bariatric surgery
– Low back
– Lung cancer
– Knee Replacement

Heal • Teach • Discover • Serve © Geisinger Health System 2011
ProvenCare® - Chronic Disease

Heal • Teach • Discover • Serve © Geisinger Health System 2011
Chronic Disease Portfolio
• Diabetes
• Congestive Heart Failure
• Coronary Artery Disease
• Hypertension
• Prevention Bundle

Heal • Teach • Discover • Serve © 2011 by Geisinger Health System – All Rights Reserved
Not for reuse or distribution without permission
Improving Diabetes Care for 24,402 Patients
3/06 3/07 10/09 10/10
Diabetes Bundle Percentage 2.4% 7.2% 12.9% 11.8%
% Influenza Vaccination 57% 73% 72% 74%
% Pneumococcal Vaccination 59% 83% 84% 84%
% Microalbumin Result 58% 87% 79% 78%
% HgbA1c at Goal 33% 37% 45% 50%
% LDL at Goal 50% 52% 62% 55%*
% BP < 130/80 39% 44% 52% 53%
% Documented Non-Smokers 74% 84% 85% 85%
*Measure change resulted in a 9% decrease February 2010
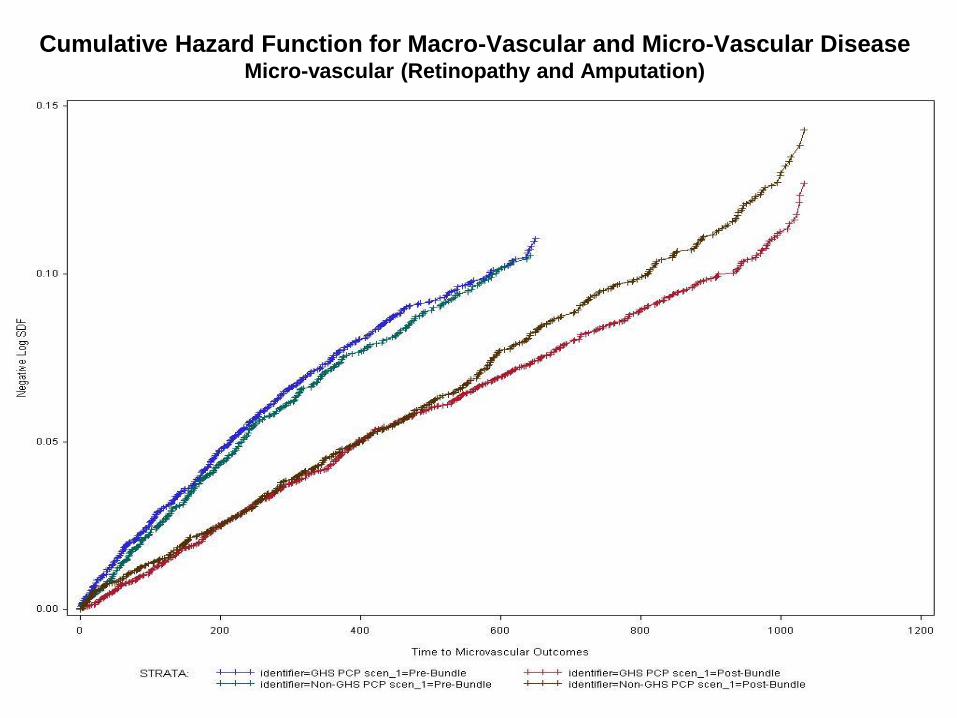
Cumulative Hazard Function for Macro-Vascular and Micro-Vascular Disease Micro-vascular (Retinopathy and Amputation)
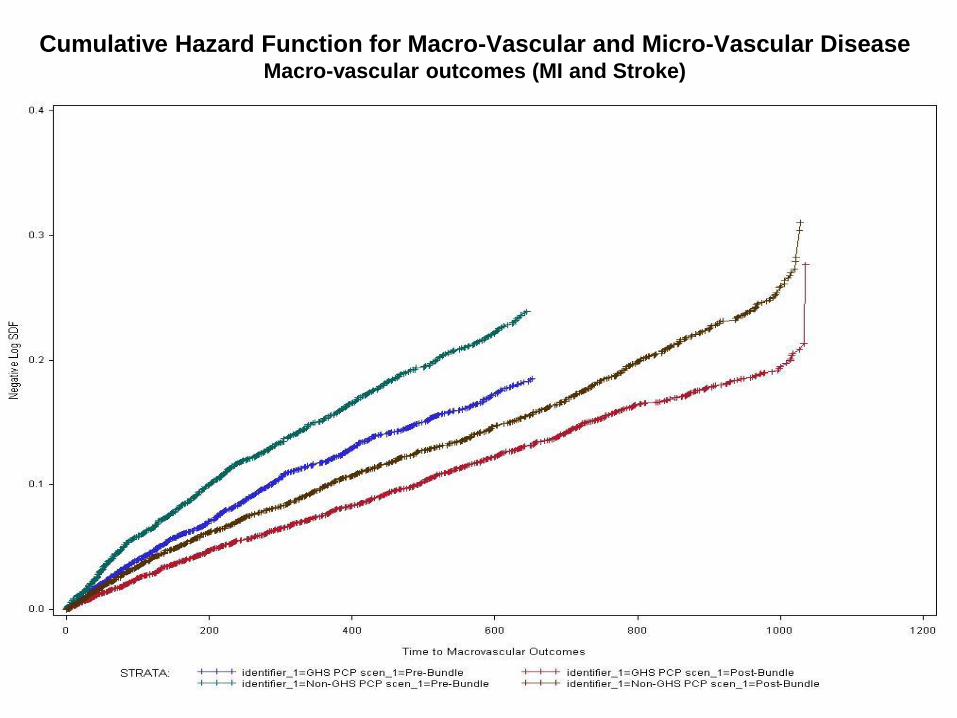
Cumulative Hazard Function for Macro-Vascular and Micro-Vascular Disease Macro-vascular outcomes (MI and Stroke)

Heal • Teach • Discover • Serve © Geisinger Health System 2011
•Microvascular
• Retinopathy
• 10 fewer cases per 1000
• 750 over six years
• Amputations
• One less case per 1000
• 75 over six years
•Macrovascular
• Heart Attack
• 30 fewer cases per 1000
• 2250 less over six years
• Stroke
• 20 fewer cases per 1000
• 1500 less over six years
Value Driven Primary Care
Patient Centered Outcome Improvements

Heal • Teach • Discover • Serve © Geisinger Health System 2011
Ongoing Issues
• More individualized targets?
• Smaller cohorts?
• Specialist / PCP interactions
Heal • Teach • Discover • Serve © Geisinger Health System 2011
ProvenHealth Navigator®
(Advanced Medical Home)
Heal • Teach • Discover • Serve © Geisinger Health System 2011
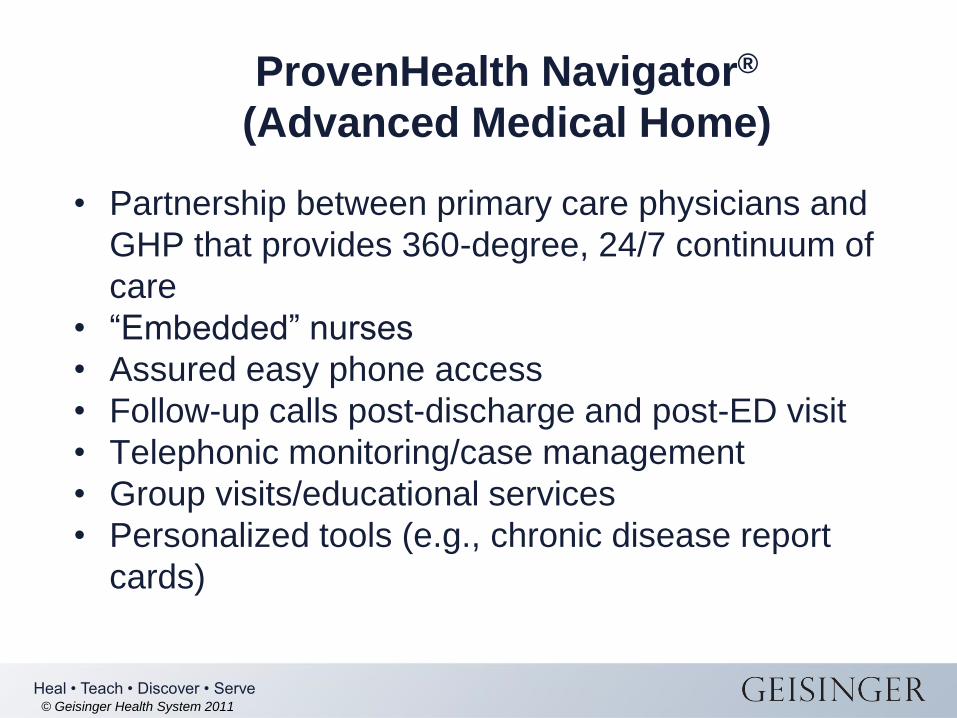
ProvenHealth Navigator®
(Advanced Medical Home)
• Partnership between primary care physicians and
GHP that provides 360-degree, 24/7 continuum of
care
• “Embedded” nurses
• Assured easy phone access
• Follow-up calls post-discharge and post-ED visit
• Telephonic monitoring/case management
• Group visits/educational services
• Personalized tools (e.g., chronic disease report
cards)

Heal • Teach • Discover • Serve © Geisinger Health System 2011
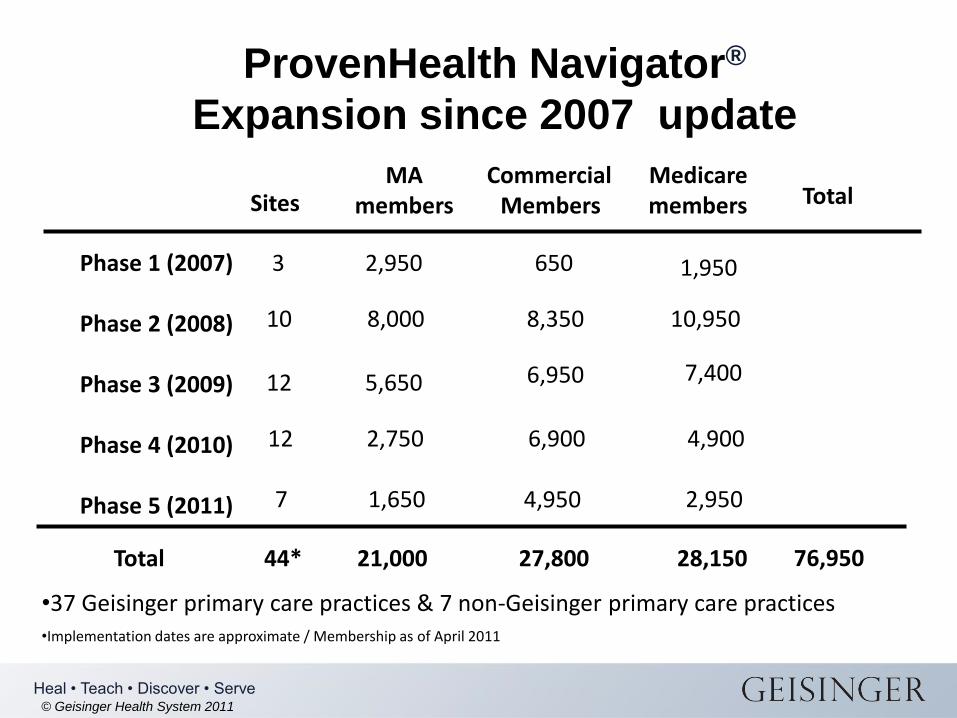
ProvenHealth Navigator®
Expansion since 2007 update
4,900
Total 44* 21,000
27,800
28,150
•37 Geisinger primary care practices & 7 non-Geisinger primary care practices •Implementation dates are approximate / Membership as of April 2011
2,950
76,950
7,400
12 2,750 6,900
7 1,650 4,950
Sites MA
members Commercial
Members
Medicare members
Phase 1 (2007) Phase 2 (2008) Phase 3 (2009) Phase 4 (2010) Phase 5 (2011)
3 2,950 650
10 8,000 8,350 10,950
12 5,650 6,950
1,950
Total

Cumulative percent difference in spending attributable to PHN
-12%
-10%
-8%
-6%
-4%
-2%
0%Q
1 2
00
5
Q3
20
05
Q1
20
06
Q3
20
06
Q1
20
07
Q3
20
07
Q1
20
08
Q3
20
08
Q1
20
09
Q3
20
09
95% Confidence Interval
Median Estimate
95% Confidence Interval
Cumulative percent difference in spending (Pre-Rx Allowed PMPM $) attributable to PHN in the first 21 PHN clinics for calendar years 2005-2009. Dotted lines represent 95% confidence interval. P = < 0.003
Heal • Teach • Discover • Serve Copyright Geisinger Health System 2011
Not for reuse or distribution without permission
Geisinger Health System Confidential and Proprietary 30
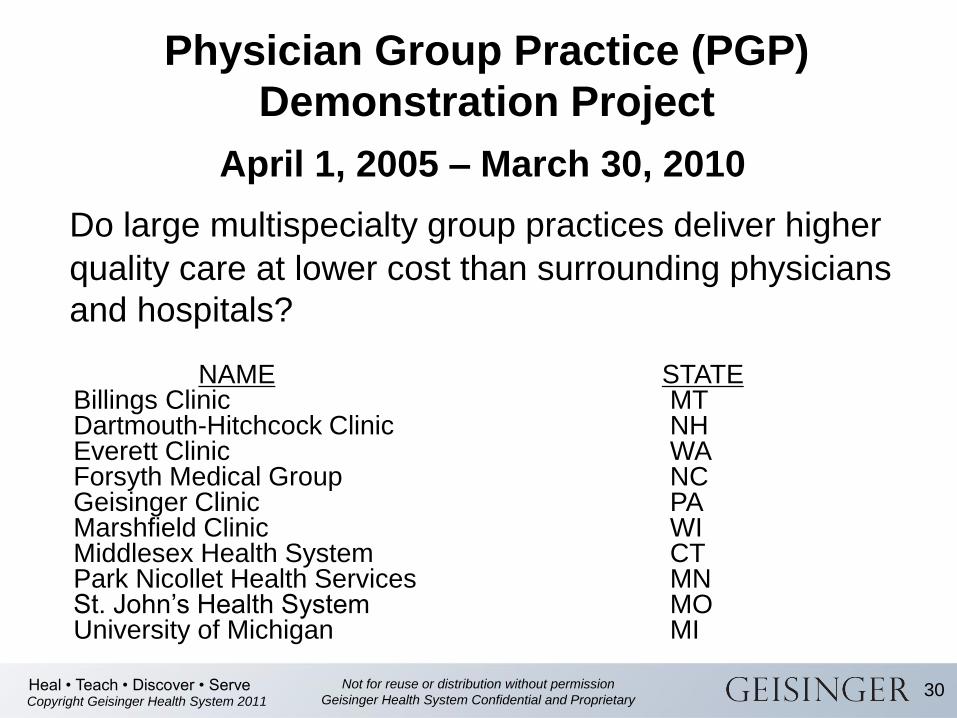
Physician Group Practice (PGP)
Demonstration Project
April 1, 2005 – March 30, 2010
Do large multispecialty group practices deliver higher
quality care at lower cost than surrounding physicians
and hospitals?
NAME STATE Billings Clinic MT Dartmouth-Hitchcock Clinic NH Everett Clinic WA Forsyth Medical Group NC Geisinger Clinic PA Marshfield Clinic WI Middlesex Health System CT Park Nicollet Health Services MN St. John’s Health System MO University of Michigan MI

Heal • Teach • Discover • Serve © Geisinger Health System 2011
Physician Group Practice (PGP)
Year 5 – GHS Results
TCC – 1.4% vs. 5.8% National
All quality metrics achieved
No shared Savings

Heal • Teach • Discover • Serve Copyright Geisinger Health System 2011
Not for reuse or distribution without permission
Geisinger Health System Confidential and Proprietary 32
Key changes
• Population/Attribution
• Shared Savings Split/“Corridor” of significance
• Quality Criteria/Leading Quality optional module
PGP to “Transitions Demonstration”
(ACO #1)
Heal • Teach • Discover • Serve © Geisinger Health System 2011
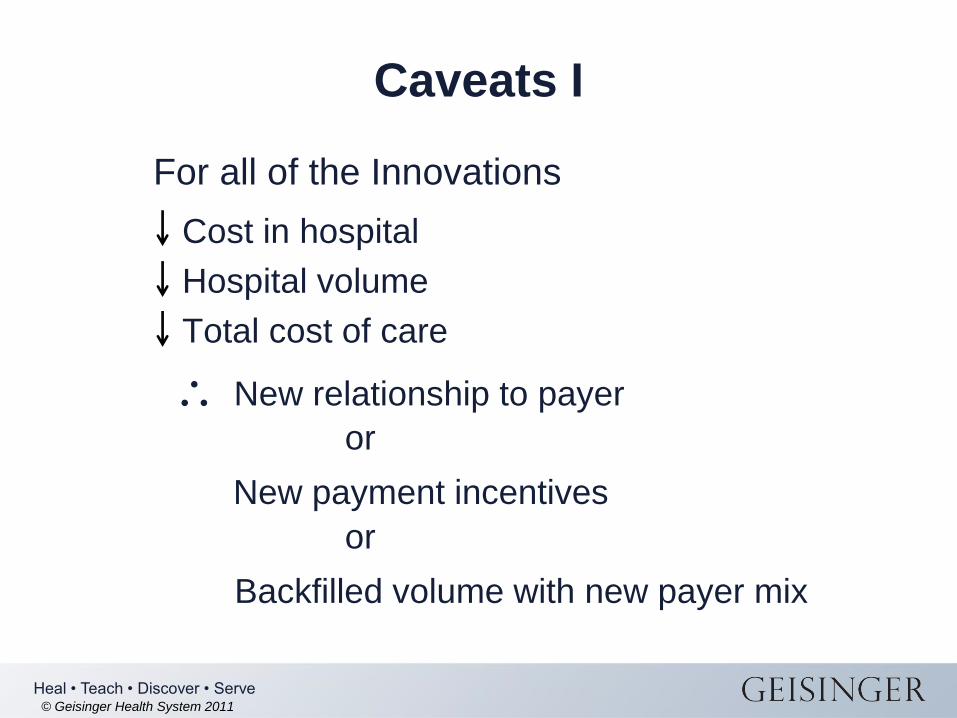
For all of the Innovations
Cost in hospital
Hospital volume
Total cost of care
New relationship to payer
or
New payment incentives
or
Backfilled volume with new payer mix
Caveats I

Heal • Teach • Discover • Serve © Geisinger Health System 2011
Caveats II
• Scalable?
• Applicable to non-Integrated Delivery Systems?
• Applicable in absence of real-time EHR?
• Applicable in fee-for-service settings?
• Pending wider use in marketplace
• Support for innovation from CMMI/CMS?
• What will the market based response be?
Heal • Teach • Discover • Serve © Geisinger Health System 2011
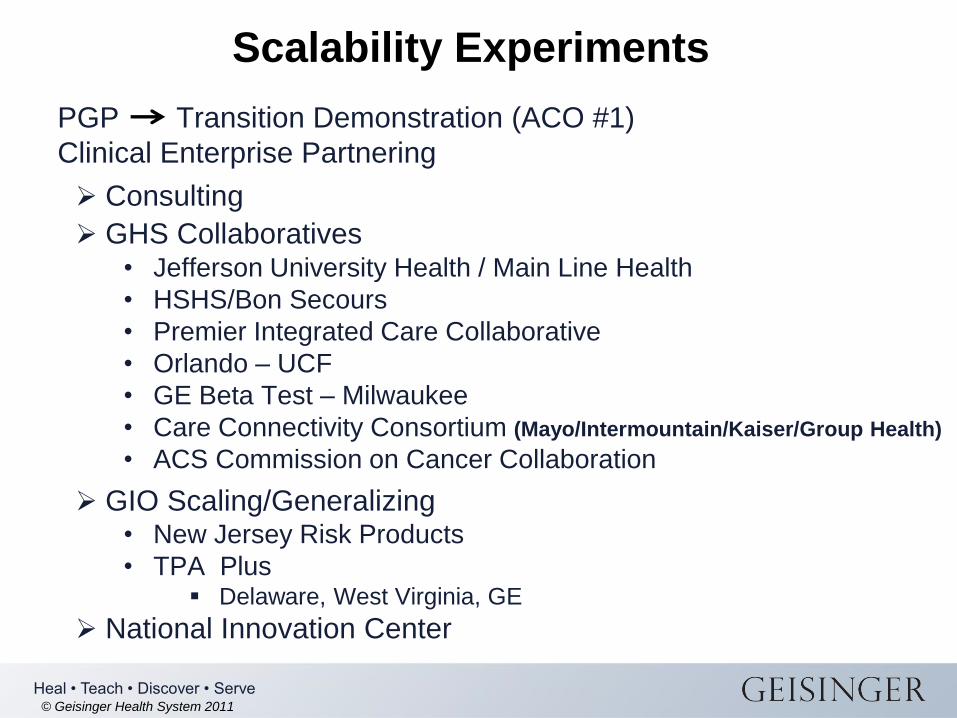
PGP Transition Demonstration (ACO #1)
Clinical Enterprise Partnering
Consulting
GHS Collaboratives • Jefferson University Health / Main Line Health
• HSHS/Bon Secours
• Premier Integrated Care Collaborative
• Orlando – UCF
• GE Beta Test – Milwaukee
• Care Connectivity Consortium (Mayo/Intermountain/Kaiser/Group Health)
• ACS Commission on Cancer Collaboration
GIO Scaling/Generalizing • New Jersey Risk Products
• TPA Plus Delaware, West Virginia, GE
National Innovation Center
Scalability Experiments