the gender wage gap among university vice chancellors in
TRANSCRIPT
Social Research Institute
The Gender Wage Gap Among University
Vice Chancellors in the UK
Ray Bachan
Alex Bryson
Quantitative Social Science
Working Paper No. 21-04
February 2021
Disclaimer
Any opinions expressed here are those of the author(s) and not those of the UCL Social
Research Institute. Research published in this series may include views on policy, but the
institute itself takes no institutional policy positions.
QSS Workings Papers often represent preliminary work and are circulated to encourage
discussion. Citation of such a paper should account for its provisional character. A revised
version may be available directly from the author.
Quantitative Social Science
UCL Social Research Institute
University College London
55-59 Gordon Square
London WC1H 0NU
Social Research Institute
The Gender Wage Gap Among University Vice
Chancellors in the UK
Ray Bachan1
Alex Bryson2
Abstract
The gender wage gap has closed gradually in the United Kingdom, as in other countries, but convergence is slower among top earners. Using linked employer-employee data over two decades we examine the gap among university Vice Chancellors who are among the most highly paid employees in the UK. Traditionally dominated by men the occupation has experienced a recent influx of women. The substantial gender wage gap of 12 log points in the first decade of the 21st Century closed markedly during the second decade, becoming statistically non-significant in later years. The closure in the gap is accounted for by change in the attributes of male and female VCs and the universities they lead - in particular, the financial performance of universities employing female VCs. The unexplained component of the gap is small and explains none of the convergence in the gap. A “new starter” wage penalty women faced in the early 2000s disappeared. However, women continued to receive a lower wage when replacing an outgoing male Vice Chancellor, whereas no differential was apparent between incoming male Vice Chancellors and the women they replaced. .
Keywords: gender wage gap; vice chancellors; higher education; decompositions; linked employer-employee data
JEL Codes: J16; J31; J44;
1 University of Brighton 2 University College London, Corresponding author: [email protected]. Alex Bryson thanks the Economic and Social Research Council for funding (grant number ES/S012583/1). We thank participants at a University of Bournemouth seminar and a UCL Lunchtime Seminar, and Heather Joshi, Almudena Sevilla, Nikos Theodoropoulos and Bozena Wielgoszewska for comments.
1. Introduction
The gender wage gap (GWG) has been closing, albeit gradually, in a number of countries
over the last few decades (Kunze, 2018), including Britain (Bryson et al., 2020).
However, the rate of convergence has been slower at the top of the earnings
distribution (Blau and Kahn, 2017), despite women’s increasing ability to break the
“glass ceiling” previously limiting their entry to the top professions. One reason for the
persistence of the GWG at the top of the earnings distribution has been substantial
within-occupation gaps linked to gender roles in household production and social norms
governing what men and women are expected to be doing at home and work (Bertrand,
2018). GWGs are larger among the highly educated in professions where it is costly for
employers to offer flexible hours schedules which are compatible with child-care
responsibilities. In those professions substantial wage penalties are attached to part-
time work and to avoidance of long hours (Goldin, 2014; Bertrand et al., 2010). Women
of child-rearing age also face difficulties being promoted within top occupations when
employers fear care responsibilities will affect their continuity of employment or in
other ways interfere with their duties as employees (Kunze and Miller, 2017).
In this paper we examine trends in the GWG over two decades among the Vice
Chancellors (VCs)3 who run UK universities, in much the same way as CEOs run public
listed firms. Ours is the first paper to track the GWG among VCs over such a long period
of time. Universities are large organisations, employing an average of 2,490 full-time
equivalent (FTE) staff, teaching 13,695 FTE students (Appendix Table A1, author
calculations based on our data). It is a highly paid profession, and one that has seen
very substantial real wage growth since the turn of the century. By 2019 our data
(described in more detail in Section Four) indicate mean earnings for VCs were £282,000,
having risen 142 percent in nominal terms and 63 percent in real terms (2015 prices)
since 2000. The profession is male-dominated with men outnumbering women 5:1
across the whole period. But, as in other top professions, the percentage of women has
been rising, from 11 percent in 2000 to 24 percent in 2019. People come to these jobs
3 The acronym ‘VC’ will be used as a generic term to describe all heads of UK higher education
institutions encompassing: Vice Chancellors; Principals; Rectors; Directors and Provosts. Similarly, pro-
VC is used to describe assistant or deputy heads or equivalent.
late in their careers: those in our data range between 43 and 76 years old, with a mean
of 58 years. Only two VCs had been appointed to their position before the age of 40.
Consequently, issues related to childrearing and childcare which are central to much of
the literature regarding equal pay in top professions are less relevant in this profession
(although, of course, they may affect the acquisition of human capital earlier in VCs’
careers).
In the next section of the paper we consider the changing role of VCs in the UK and the
previous literature on Vice Chancellors’ pay. In Section Three we use our data to
present trends in women’s increased presence in the VC labour market in the UK and
trends in the raw GWG, as well as identifying some important features of the VC labour
market which should be taken into account when trying to understand the origins of a
GWG among VCs. Section Four presents our data and estimation methods. Section Five
estimates the GWG among VCs and presents decompositions to identify potential
reasons for the closure of the GWG taking advantage of our longitudinal linked
employer-employee data to examine trends within and across universities.
Two important features of this labour market are worth noting at the outset. The first
is that universities differ markedly in the wages they offer VCs. This, coupled with the
fact that over half the institutions in our data only ever employ men as VCs, indicates
that women’s ability to enter higher-paying universities is likely to impact on changes in
their relative wages. Second, VCs rarely switch institutions. So, movement across
institutions is not a major source of wage growth. This means changes in starter wages
within and across institutions, and wage progression within institutions, are potentially
important determinants of changes in the GWG.
We find that, at the beginning of the 21st Century, there was a substantial raw GWG of
19 log points in annual salary, but the gap closed rapidly such that it was no longer
statistically significant towards the end of the period. The average gap in the period
2000-2009 was 12 log points. The gap was accounted for by observed differences
between male and female VCs and the universities employing them. The gap was much
smaller from 2010 and, again, was accounted for by observed differences in VCs and the

universities they ran. The unexplained component of the gap was small and statistically
non-significant throughout. A substantial within-institution wage difference between
men and women in the first decade disappeared in the second decade. Consistent with
this, a “new starter” wage penalty women faced in the early 2000s disappeared.
However, women continued to receive a lower wage when replacing an outgoing male
Vice Chancellor, whereas no differential was apparent between incoming male Vice
Chancellors and the women they replaced. The findings indicate that, even in top
professions where women continue to face entry barriers, the gender wage gap can
close where the profession is dominated by older workers who are beyond childrearing
age.
2. The Role of Vice Chancellors and the Literature on VC Pay
Following the publication of the Jarratt Report (1985) universities were required to
become more ‘efficient’ and their VCs more business-like having direct responsibility for
the institution’s financial position and executive decisions rather than delegating these
tasks to bursars and administrators. Universities were expected to look to the private
sector for potential candidates. Although VC appointments from the private sector
remain the exception it is still argued that the leadership and managerial skills needed
to run a modern UK university are similar to those required to lead large private listed
companies (Bargh, et al. 2000; Whitchurch, 2006). In many cases the VC is expected to
attract private funds and secure institutional growth. VCs also have ultimate
responsibility for academic standards, facilitating research, financial probity, and
defining the institution’s short and long-term strategy (Breakwell and Tytherleigh,
2008).
Over the last 60 years the UK university sector experienced three periods of major
expansion when new universities were created and when former higher education
institutions (HEIs) were granted university status along with independent degree
awarding power. The first period of expansion occurred in the wake of the Robbins
Report in 1963 (Robbins, 1963). The universities that were in existence prior to Robbins
and those created in the 1960s are collectively referred to as pre-1992 or ‘old’
universities in the literature. The second wave of expansion followed the Further and
Higher Education Act 1992, when former Polytechnics were granted the Royal Charter,
which confirmed university status and gave these institutions independent degree
awarding power. These institutions are often referred to as post-1992 universities or
‘new’ universities. The most recent expansion followed the publication of the Higher
Education White Paper in 2003 (Department for Education and Skills, 2003) when
several university colleges and other HEIs were granted the Royal Charter. In 2019 there
were 2 million FTE students enrolled in 169 UK HEIs employing 370,000 FTE academic
staff. Of these, 142 are classified as universities (including post-graduate, arts, drama
and music colleges), the rest being predominantly small specialist institutions.
A principal motivation for the enlargement of the sector was to widen university
participation. The policy was given a major impetus in 1999 when the then Prime
Minister, Tony Blair, declared a desire to increase higher education participation of
young adults to 50%, including amongst those from disadvantaged socio-economic
backgrounds and those from families with no previous history of higher education
participation.4 Universities have now made ‘widening participation’ a focus of their
mission.
2.1 Literature on Vice Chancellors’ Pay
The small literature for the UK has tested propositions from human capital theory
(Mincer, 1974; Becker, 1993), agency theory (Jensen and Meckling 1976; Hölmstrom,
1979) and tournament theory (Lazear and Rosen, 1981) when examining the
determinants of VC pay. An early study using a cross section of 64 VCs for the academic
year 1993/94, found that university income from research grants and tuition fees, the
VC’s public status and academic discipline exerted statistically significant effects on VC
pay, but gender did not feature in the analysis (Bainbridge and Simpson, 1996). Dolton
and Ma (2003) examined the pay determination process using information on VC and
institution characteristics for the period 1994-2002. The relationship was estimated
using OLS and random institutional effects. A GWG between 4 - 7% in favour of men was
4 This commitment was made in a speech delivered at the Labour Party’s conference in 1999. This policy
orientation has led to increased interest in the fortunes of those who were the first in their family to
undertake higher education (Henderson et al., 2019).
detected in the various specifications reported. Bachan (2008) analysed a sample of
1,473 observations on 148 HEIs covering the period 1997-2006. Using fixed and random
institutional effects he found a GWG in VC pay in the range 5-8% in favour of men, with
women representing 12% of the sample. These latter studies also find that VC age,
tenure, academic specialism, previous VC or pro-VC appointments, previous work
experience outside the university sector and public honours had a significant influence
on pay. The results also point to the importance of university characteristics such as
university size, type, income and internal pay structures (measure by the presence of
highly paid staff in the institution) as determinants of pay.
Against a backdrop of rising tuition fees, cuts in public funding and concern over large
increases in VC pay towards the end of 1990s, the focus of research shifted from
identifying the determinants of VC pay to examining whether the ‘hikes’ in pay were
justified. Tarbert et al. (2008) investigated the relationship between VC pay and
university performance using 635 observations for the period 1997–2002. The authors
found little evidence that VC pay was influenced by university performance in terms of
research income. However, when their sample was divided by university type, they
found that changes in VC pay were related to changes in research income and changes
in the number of postgraduate students for pre-1992 universities, and changes in the
total number of students for post-1992 universities. These results were interpreted as
being ‘mission’ driven.
In a more comprehensive study, Bachan and Reilly (2015) investigated the pay-
performance relationship for 193 VCs in pre-1992 and post-1992 universities between
1999 and 2009. The study employed a sample of 1,045 observations and a VC fixed
effects estimator. They found a positive association between VC pay and meeting the
objectives of the university’s mission5 and securing income from UK funding councils.
They concluded that to a certain extent VC pay awards were associated with various
performance measures but much of the variation in VC pay remained unexplained.
5 The variables used to capture university mission were related to ‘widening participation’ in higher
education. Specifically, they included the participation rate of students from state schools and the
participation rate for students from areas where traditionally there is a low take up of university places. A
variable capturing institutional growth, which also features in mission statements, was also included.
Similar findings were found in an updated study using data covering the period 1999-
2015 (Bachan and Reilly, 2018). Although it was not possible to identify a GWG due to
the statistical methodology adopted the studies conducted by Bachan and Reilly (2015,
2018) confirm the importance of the role played by VC characteristics that were not
immutable over time – such as age, tenure, university internal pay structure, size and
income - in determining VC pay.
Using data on 149 VCs over the period 2009-2017 Johnes and Virmani (2019) examined
the relationship between university performance and VC pay. They employed three
measures of university performance: a measure of managerial efficiency, performance
in media produced university rankings and a measure of financial stability. Using a
random effects estimator they found evidence of a significant and positive association
between university performance in media rankings and VC pay. Women accounted for
20% of their sample, but no evidence of a GWG was found.
Walker et. al. (2019) using data covering the period 2014-2017 find that the size of the
remuneration committee influences VC pay. They conjecture that VCs use their internal
power to extract excess rents. They also confirm the importance of VC and university
characteristics in explaining the wage variance. They found no evidence of a GWG in
‘new’ universities, but they did find a substantial GWG among VCs in ‘old’ universities in
favour of females.
The issue of VC pay has attracted international interest particularly in the United States
and Australia. Studies using data from the United States find university Presidents’
personal characteristics (e.g. age, tenure experience) and university characterises (e.g.
size, income and type) significantly affect President pay (taken to be equivalent to a VC
in the UK). These studies provide mixed results on the association between gender and
pay. For instance, from a sample of 593 observations in 1978 and 706 observations in
1983 for public and private universities where women accounted for 6% and 9% of each
sample respectively, a GWG of around 10% in both years was identified in favour of men
(Pfeffer and Ross, 1988). In contrast, Bartlett and Sorokina (2005) using a sample of 506
Liberal Arts Colleges covering the period 1999-2003 found evidence of a GWG of 9% in
favour of women in top tier universities. However, Ehrenberg, et. al. (2001) using a
sample of 2,074 observations on 400 Presidents for a sample of private colleges and
universities between 1993 and 1998 found no evidence of a GWG. Similarly, Monks
(2007) for the period 2001-2003, Huang and Chen (2003) for the period 1997-2004 and
Cheng (2014) for the period 2005-2009 found no evidence of a GWG in presidential pay
for public and private universities and colleges. Very little information on the GWG can
be gleaned from the few Australian studies that exist (Clements and Izan, 2008; Soh,
2007). Beyond this literature very little is known about the GWG in executive pay in
higher education for the UK or internationally.
3. The Gender Composition of the Vice Chancellor Profession and the Raw Gender Wage Gap6
University leadership is predominately male dominated. In 1995 there were only 7
women leading HEIs in the UK accounting for around 6% of VCs. However, women have
been “breaking the glass ceiling” in universities over the last two decades. By 2000 11%
of the VCs in our sample of 115 universities in the UK were women. This had doubled
to 20% by 2010 and rose further to 24% by 2019, the last year in our data. The ratio of
men to women over the period shifted from 5:1 to 3:1.
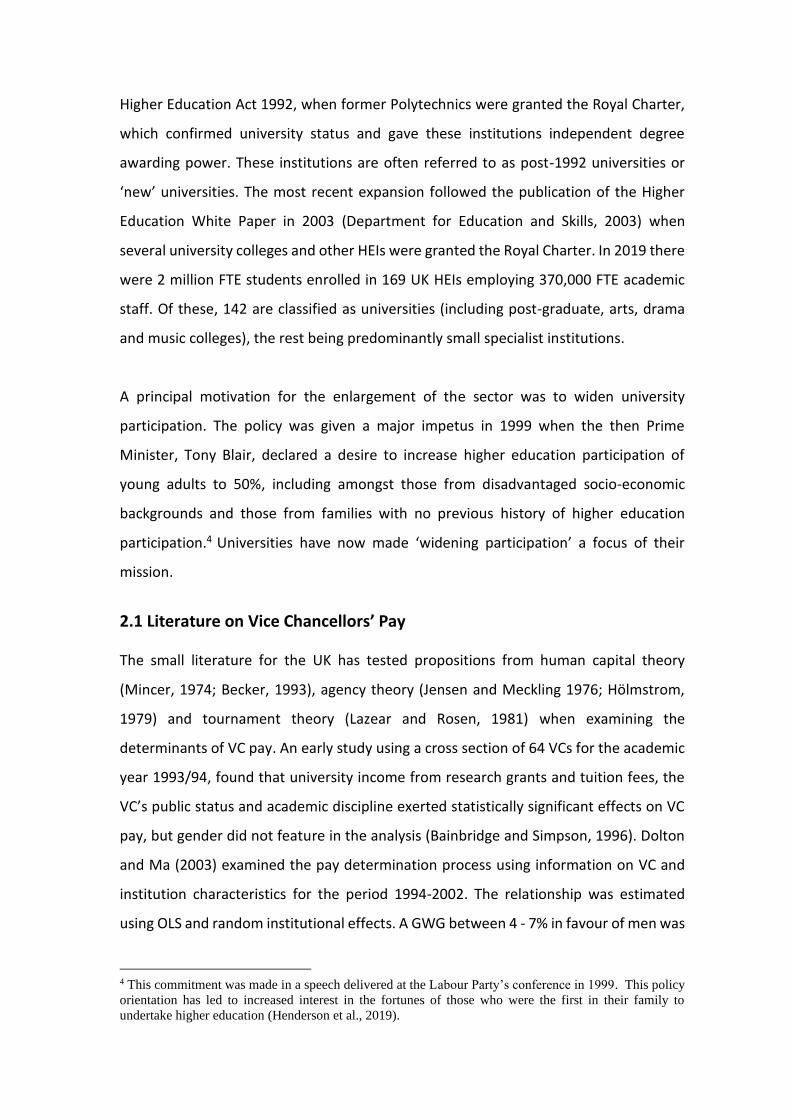
Over the same period what started out as a substantial gender wage penalty for women
has closed. Figure 1 shows real earnings (in 2015 prices) for VCs over the whole period.
The average earnings gap is 5.5 log points. But in 2000 the gap was 19.0 log points, rising
to 20.1 log points in 2001. It falls thereafter such that it tends to be statistically non-
significant in most years from 2011 onwards.
[FIGURE 1]
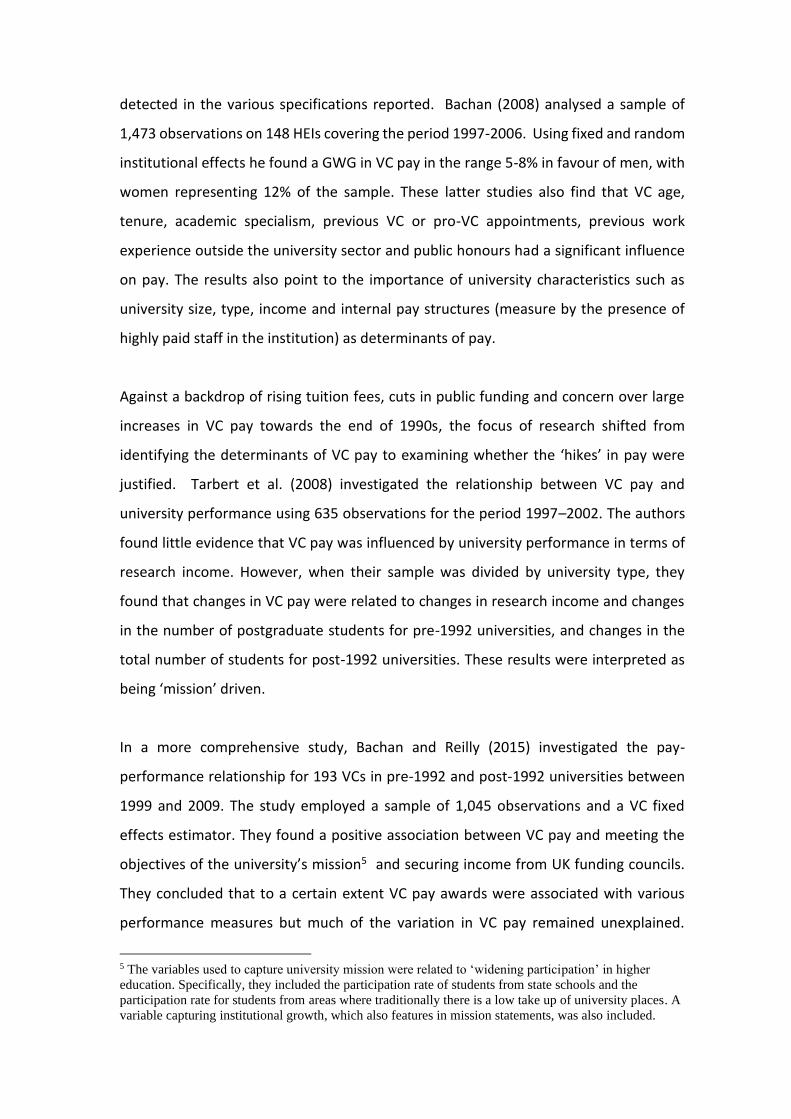
Figure 2 shows the rate of real earnings growth among men and women separately
compared to earnings levels in 2000: earnings growth for men and women track one
another in the first period through to around 2005, after which women’s earnings tend
6 This section relies heavily on the data set we have complied which is described in detail in Section Four.
to grow at a faster rate than men’s. Both men’s and women’s real earnings drop around
the time of the Great Recession and, whilst earnings of both men and women recover
somewhat subsequently, earnings growth is much stronger for women.
[FIGURE 2]
What might account for the decline in the GWG among VCs over the period? We present
evidence in relation to four issues.
First, using standard wage decomposition techniques, are the women entering the
occupation better, when compared to men, in their human capital and other observed
attributes, such that differences in these attributes over time may help explain
convergence in the GWG? A standard assumption might be that, when a group is
underrepresented at the outset, those who are successful in breaking into the
profession are particularly able and that, as the minority group establishes itself, this
differential in ability between majority and minority groups should diminish such that
the two groups look more similar over time.7 In the case of VCs this might imply those
breaking into the profession in the early 2000s were particularly able, and that the
gradual increase in the proportion of women in VC positions might imply a reduction in
their relative ability premium which, other things equal, would increase rather than
compress the GWG. However, this is an empirical question.
As we will show in Section 4.1 the male and female VCs in our sample differ in their
observed traits in a number of respects. Four-fifths (80%) of new appointees were
external appointees from outside the university, whether they were women or men.
However, men and women take quite different routes on entering their VC roles which
may have implications for their earnings and earnings growth. Men are twice as likely
to have been in another VC post or equivalent (13.6% compared to 7.6%), whereas just
over three-quarters of women had been a pro-VC or deputy in the past compared to just
over two-thirds of men (77.8% compared to 68.7%). However, few VCs switch between
7 This pattern is well-established in other professions. For example, Goff et al. (2002) find this in the case
of black-white productivity differentials in professional baseball and basketball.

universities: only 26 men and 3 women move from one university to another as VC over
the course of the 20 years covered in our data. Thus, earnings growth is likely to reflect
current job tenure which, over this period, was longer for men compared with women
(5.74 years compared to 4.96 years).
Second, an alternative to the hypothesis that attributes may have shifted in women’s
favour is the proposition that the returns to earnings-enhancing attributes may have
changed over time in a way that benefits women relative to men. A convergence in the
GWG arising from an improvement in women’s relative returns to given attributes might
be consistent with a reduction in discriminatory practices previously limiting women’s
earnings progression.
Third, perhaps women are entering higher-waged universities across time? It would
appear that, not only are there more women in the profession across time, women have
also broken into the ‘top’ institutions in the sector. For instance, the University of
Oxford had a female VC (Louise Richardson) for the last four years of our data (2016-
2019) after 16 years in which the university had been run by a succession of three male
VCs. Nevertheless, the VC labour market remains segmented along gender lines: 63
universities employed men only in the VC role throughout the period. These universities
were higher paying than their counterparts who had employed both men and women:
mean log earnings were 6.4 log points higher in the universities that never employed
women VCs compared to those that had employed women VCs. Among those
universities employing women VCs, women were in post for an average of 39% of the
time, ranging from as little as 10% in 5 universities to 85% in two universities (Bath and
Napier).
Gender segregation in the VC labour market may affect the GWG and change in the
GWG over time because there are sizeable differences in the earnings universities pay
their VCs. Across the whole period, university mean real pay for VCs was £230,243 in
2015 prices, but the standard deviation in university mean real pay was £60,705, or 26%
of the mean, with a minimum value of £120,710 at Writtle University College and a
maximum of £364,472 at Imperial College London. In a model of log VC real earnings
with no controls, university fixed effects alone account for two-fifths (43%) of the
variance in earnings across VCs. We return to the role of HEIs in helping to explain the
GWG when we decompose the gap into its constituent parts in Section Five.
Finally, do men and women differ in their returns to tenure in the job, or are starter
wages for men and women becoming more equal over time? We are able to address
the question of starter wages due to the substantial turnover in VCs over the course of
twenty years. We can compare starter wages for men and women, and how these differ
over time. We can also establish whether there is a gender differential in the wage
offered to a new starter, relative to the previous incumbent who was of the opposite
sex.
4. Data
Our data comprise information on 346 VCs who led 115 UK universities with degree
awarding powers between 2000 through 2019, giving a sample of 2,300 observations
covering 20 years.8 It was a period of considerable change in the UK higher education
sector, including rising tuition fees, increasing student enrolment, cuts in funding and
the introduction of university performance metrics aimed at making universities more
accountable for student outcomes and the overall management of the institution. Pay
and financial data are expressed in real terms (2015=100). Our sample of VCs excludes
those leading post-graduate institutions, medical schools, art, drama, and music colleges
and small specialist institutions due to their atypical student intake, the nature of the
courses offered and data availability. Annual VC pay data were obtained from the Times
Higher Education annual VC pay surveys (various years) and from the UK’s Office for
Students (2019). Where pay information was unavailable, it was sourced manually from
university annual financial accounts/statements. The pay data include any performance-
related pay and an estimated value of benefits in kind but exclude pension contributions
8 These universities include 94 institutions that received the Royal Charter and independent degree
awarding power prior to 2000. Twenty institutions received the Royal Charter during the period under
study, and one institution was granted ‘university college’ status but has independent degree awarding
powers. All institutions in the dataset are collectively referred to as ‘universities’.
made by the institution. It should be noted that it was not possible to distinguish
between the elements that comprise the final pay for the full sample of VCs.
Data on the personal characteristics of VCs were compiled from Who’s Who (various
years). Information on VC characteristics that were not in these publications were
obtained from alternative biographical sources including official institution documents,
press releases or through personal contact. Institution performance data were obtained
from the Higher Education Statistical Agency (various years). Summary statistics for the
full sample and by gender are presented in Appendix Table A1. Appendix Table A2 gives
the definition of the variables used in our analysis. Appendix Table A3 provides the
names of each of the universities run by our VCs grouped by their affiliation to university
associations.9 Below we discuss the variables used to describe VC personal
characteristics, then those that describe university characteristics, followed by those
used to proxy university performance.
4.1 VC characteristics
Individuals appointed to the office of VC bring a considerable amount of human capital
and managerial experience to the post. We measure VC human capital and relevant
managerial experience by two variables, both expected to be positively related to pay.
The first captures instances when an incumbent VC had previously been VC in another
institution. The second indicates whether the incumbent had previous pro-VC
experience. On average, 12.5% of the sample were former VCs. There were 52 instances
where VCs moved between institutions as VC and as noted earlier more males have
moved in this way than females (46 compared to 6). Of these, 1 female and 16 male VCs
previously held a similar position in an overseas university, 29 moved between
institutions within the sample and six moved from institutions not included in the
dataset. Just over 70% of VCs had previously held pro-VC positions, but more female VCs
have pro-VC experience (77.8% compared to 68.7%). However, female VCs experience
a shorter term in office compared to their male counterparts (5.74 years compared to
9These are the Russell Group, the University Alliance group, the MillionPlus group, the GuildHE and
non-aligned universities (see section 4.2 for details).
4.96 years). It should be borne in mind that the average length of tenure is based on
incomplete spells in office in some cases.
A large proportion of VCs have an academic specialism in the social sciences (45.2%) and
physical (or pure) sciences (33.4%) and fewer have specialised in engineering (11.4%)
and the arts (10%). A continued upward trend in appointing social scientists and a
downward trend in the appointment of physical scientists is revealed by the data, which
is broadly in line with the trends reported by Bargh et al. (2000). We also note significant
differences by gender with more female VCs having an arts or social science background
and more males with an engineering or science background.
A large number of VCs have been bestowed public honours during their time in office.
These award bring a certain amount of esteem to the institutions they run and may also
reflect the VCs social capital. We might therefore expect a positive association between
VC pay on the one hand and the bestowment of a Knighthood on male VCs or a
Damehood on female VCs on the other. Over the period of our data, 11% of VCs had
been granted these honours and although we observe more Dames than Knights (13.3%
compared to 10.9%) this difference is not statistically significant. Similarly, we expect a
fellowship to a Royal Society or Academy to confer a certain amount of academic kudos
on the VC, which may also have a positive association with VC pay. Eight percent of both
female and male VCs have a fellowship to at least one prestigious academic society or
academy.
The literature on CEO remuneration suggests that those externally appointed to senior
positions within organisations are generally of superior quality to internal candidates.
This feature will tend to drive up the pay of externally appointed CEOs, above those of
their internal competitors (Chan, 1996; Murphy and Zabojnik, 2007). Around 80% of all
VCs in our sample were externally appointed. We also speculate that the relationship is
positive if supply of suitable candidates is globally limited.
We separate VC previous work experience into four employment categories that
describe the general nature of work the incumbent had been engaged in prior to being
appointed VC. These categories are: worked for the civil service; worked for the
department for education (or a similar related government department or service);
worked in academia; worked in industry (private sector). The majority (87.3%) have a
recent career history in academia, followed by those who were formerly employed in
the civil service (6.1%), and then by those previously employed in the private sector
(5.3%). A small proportion (1.3%) had been employed by the department of education
(or related service). More female VCs tend to be career academics (92% compared to
86%) and more male VCs are drawn from industry (6% compared to 1%). We expect VC
pay to reflect their career background as well as the managerial skills that these modes
of employment bring to university management. We expect those VCs drawn from the
private sector to command more pay than career academics.
4.2 University characteristics
The finds a positive association between CEO pay and the size of the organisations they
run (Girma et al, 2007; Frydman and Jenter, 2010). Similarly, we would expect VC pay to
have a positive relationship with university size as indicated by the total number of FTE
students enrolled at the institution.10 On average, the universities in our sample enrol
13,695 students but we also note a large variation across institutions ranging from 685
(Writtle University College) to 37,575 (University of Manchester). We also note that, on
average, females tend to run smaller institutions than male VCs based on this measure
(12,237 compared to 14,007).
The VC tends to be the highest remunerated member of staff within a university.
However, in addition to other highly paid academic staff universities also employ highly
paid administrative staff particularly in areas of finance and marketing. We include the
proportion of staff paid in excess of £100,000 p.a. in our estimations to account for this
fact and to test for tournament effects. We anticipate a positive association between VC
pay and the proportion of highly paid staff. On average around 1-2% of all staff are found
to be highly paid.
10 We do not use the number of FTE staff employed by the university, as there is a high correlation
between the size of the student body and the number of staff.
Universities differ markedly in terms of their history, organisational structure, portfolio
of courses offered, the markets they cater and in their mission. The oldest was
established in Oxford around 1169 and the most recent in our dataset, Cardiff
Metropolitan University, received its Royal Charter in 2011. The ‘older’ universities tend
to be more research intensive than their modern counterparts and attract high levels of
international students and academics with international recognition. We expect VC pay
to be positively related to university age, based on when the institution received its
Royal Charter. The average age of universities is around 75 years. Female VCs tend to
lead ‘newer’ universities with an average age of 64 years compared to those run by male
VCs, which have been in existence, on average, for 76 years.
We classify universities according to the university groups to which they are currently
associated.11 These groups are: the Russel Group (research-intensive universities)
comprising universities that were established prior to 1992; the University Alliance
which includes universities with a focus on ‘applied’ research that were established
around 1992; the MillionPlus universities which is a coalition of ‘modern’ universities
that were also established around 1992; and the Guild of Higher Education that includes
universities that were formed in or after 2003. The Russell Group universities comprise
just under one-fifth of the sample and more male VCs tend to lead these institutions
than females (20.5% compared to 9.5%). On the other hand, more women tend to lead
universities aligned to the Guild of Higher Education (20% compared to 7%). However,
a large proportion (45%) of universities are not currently aligned to any of these
groups.12
As noted previously ‘widening participation’ appears regularly in university missions. We
include the percentage of new entrants from comprehensive schools to capture this
feature of a university’s mission and note that a sizeable proportion of students are from
11 We argue that these groups give a more homogenous set of universities and tend to reflect their
international reputation in terms of research and their general mission. 12 Several universities joined the Russell Group during the span of our data and the 1994 university group,
which included other pre-1992 universities that were not part of the Russell Group, was dissolved in
2013. Several post 1992 universities were/are joint members of the University Alliance, the MillionPlus
and the Guild of Higher Education. In these cases, we classify them according to the group they initially
joined. Universities are classified by their affiliation in 2018.
state run schools (89%). We also note that women tend to run universities that cater for
students from state schools compared to their male counterparts.13
4.3 University Performance
As noted earlier, empirical studies have found VC pay is linked to university
performance. We expect VCs to be rewarded for their financial management and
meeting the university mission. We include income from funding councils, student fees,
and research grants and contracts as our measures of financial performance. We note
that male run universities tend to attract more income from these sources than female
led institutions.
5. Results
As we showed in Figure 1, the raw GWG closed over time. We identified a number of
possible reasons for this convergence. First, women’s earnings-enhancing attributes
may have improved relative to men’s over time, or else the attributes of the universities
they work in have changed relative to men in a way that has equalized pay. Second, it
may be that the returns to those attributes changed in favour of women relative to men
over time. Third, women may have been more successful over time in entering HE
institutions paying higher wages, resulting in an improvement in their relative wages.
Fourth, it is conceivable that starter wages for women and men converged over time.
We consider these possible explanations in the following decompositions.
[TABLE 1]
Table 1 decomposes the GWG using a standard Oaxaca-Blinder decomposition.
Following Jann (2008) we compute a two-fold decomposition based on coefficients from
a pooled model over both male and female VCs incorporating a dummy variable
13 We do not use students from low participation neighbourhoods due to recent data being unavailable for
Scottish universities.
identifying female VCs. Column 1 presents the decomposition over the whole period,
while columns 2 and 3 present them for the first and second decades respectively.
The raw gap of 5.5 log points across the period 2000-2019 is wholly accounted for by
the explained portion of the gap, that is, the observed differences in the attributes of
VCs and the universities they led (column 1).14 Differences in VC characteristics
accounted for 1.1 log points of the gap, while the lagged performance of universities
accounts for another 2.0 log points but the biggest contributor was the characteristics
of the universities run by men and women: they accounted for 3.2 log points of the gap
(58% of the overall gap). The year dummies are negative and statistically significant,
indicating that the GWG was converging at a rate that is not wholly captured by the
changes in these observed VC and university traits. None of the gap was associated with
differential returns of men and women to their attributes or the universities employing
them. The unexplained component of the gap, sometimes interpreted as a rough proxy
for potential discrimination, was not statistically significant.
Columns 2 and 3 run the same decomposition, but this time separately for the periods
2000-2009 and 2010-2019. In the earlier period the raw GWG was 12 log points. Once
again, differences in the attributes of male and female VCs and the institutions
employing them appear to account for all of the gap. Differences in the characteristics
of universities run by men and women, together with their performance accounted for
four-fifths of the gap (9.8 log points). The unexplained component of the gap was not
statistically significant.
The GWG is considerably smaller (3.3 log points) in the years after 2009 and is only on
the margins of statistical significance (column 3). The gap is wholly accounted for by
differences in the characteristics of male and female VCs and the institutions they ran.
But the lagged performance of universities is small and statistically non-significant. The
decline in the contribution of lagged university performance is notable: the coefficient
in the second decade is less than one-tenth the size of the coefficient in the first decade.
14 The pooled regression underpinning this decomposition accounts for almost three-quarters of variance
in VC wages (the adjusted r-squared is 0.73).
Once again, gender differences in the returns to those attributes do not contribute to
the size of the GWG.
It appears from the Oaxaca-Blinder decompositions in Table 1 that it is differences in the
observed characteristics of VCs and the institutions employing them that account for
the GWG, and that there is no role for any unexplained component arising from
differential returns for the same sets of observed characteristics. This is the case in the
initial period through to 2009 and the period post-2009.
[TABLE 2]
In Table 2 we use Gelbach’s (2016) decomposition method to shed further light on the
factors underlying the GWG. As in the case of the Oaxaca-Blinder decomposition in
Table 1 we present decompositions for the whole period and separately for the first and
second decades. The Gelbach technique nests the Oaxaca-Blinder decomposition
(Gelbach, 2016), so it is unsurprising that the results in Table 2 panel (a) are nearly
identical to those presented in Table 1.15 However, we use the Gelbach technique to
incorporate university fixed effects to estimate the role of fixed university attributes in
accounting for the GWG. In doing so we are following others who have relied on the
Gelbach procedure to decompose wage gaps with employer fixed effects (Addison et
al., 2018).16
15 Note that there is a switch in the signs attached to sets of covariates between the Oaxaca-Blinder
decomposition in Table 1 and the Gelbach decomposition in Table 2 (a). This is simply a matter of
presentation. The Oaxaca-Blinder decomposition attaches a positive sign to sets of variables that increase
the size of the raw wage gap between women and men. So, a positive (negative) sign means a bigger
(smaller) GWG. In the case of the Gelbach decomposition, the wage gap between men and women is
expressed from the perspective of women as negative. Those factors that account for the difference
between the raw and covariate adjusted gaps are identified as contributors with a negative sign, whilst
those closing the gap are designated positive. 16 There has been some debate regarding the appropriateness of incorporating organization fixed effects
into a Oaxaca-Blinder decomposition (Heitmueller, 2005).
The university fixed effects estimates are presented in Table 2 panel (b). With their
introduction we are capturing the gap in earnings that exists between men and women
within universities.17
The fixed effects estimator relies on wage variance in the subset of institutions which
employed both male and female VCs over the period. The fixed effects themselves are
not jointly statistically significant in accounting for the size of the GWG in either period.
However, in contrast to the estimates that exclude university fixed effects there is a
sizeable and statistically significant wage penalty for women VCs in the period through
to 2009 of 6.2 log points (panel b, column 2) which turns positive but non-significant in
the second decade.18 The implication is that the GWG that existed within HE institutions
employing men and women as VCs early in the Century disappeared in the second
decade.
It is perhaps unsurprising to find that, with the inclusion of university fixed effects,
university performance plays no significant role in the GWG. Nor do time-varying
aspects of institutions. However, there is one interesting difference between the results
in panels (a) and (b): in the absence of university fixed effects demographic differences
between men and women VCs contribute to the GWG in both decades, although the
size of the effect halves from 2.9 to 1.5 log points. However, within universities,
demographic differences only contribute to the size of the gap in the first period and
become statistically non-significant after 2010.
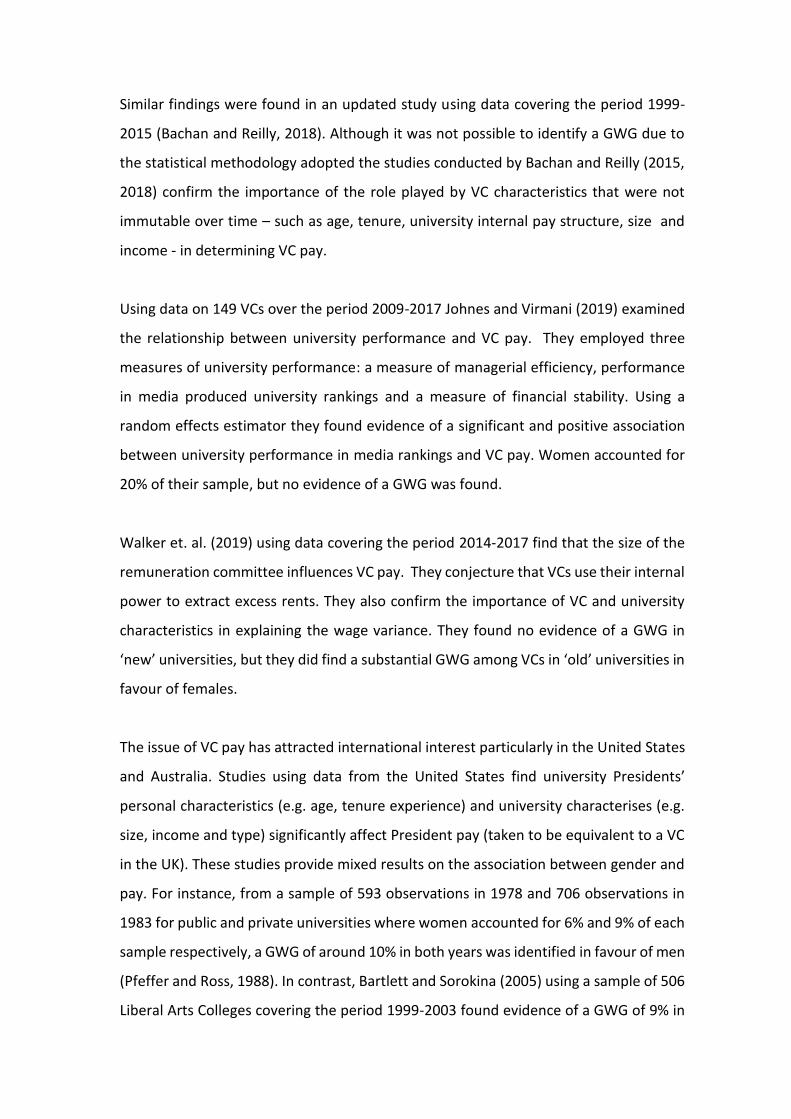
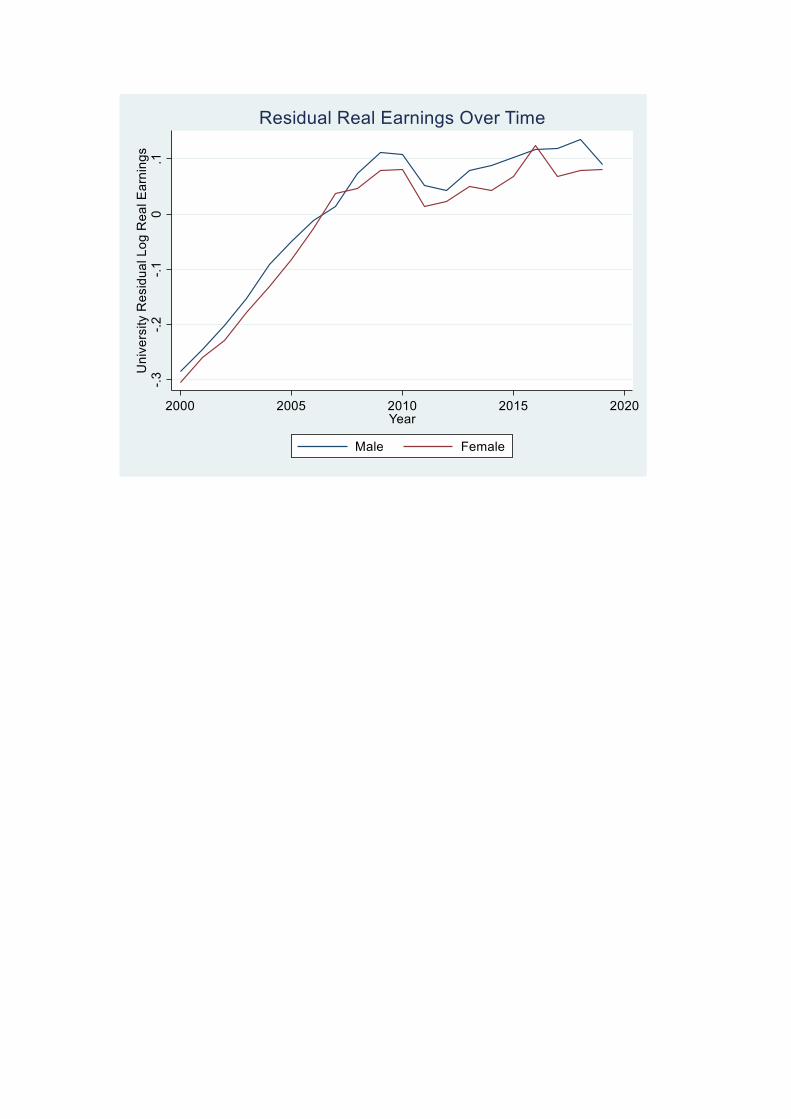
We can estimate the role played by variance between universities in the closing of the
GWG by estimating the change over time in the degree to which women VCs were
employed in higher paying universities. We depict this in Figure 3 which shows the
17 For an earlier study investigating the role of firm fixed effects when decomposing the gender wage gap
see Meng and Meurs (2004). Their approach builds on the decomposition method introduced by Juhn et
al. (1991) whereas the approach here, as per Addison et al. (2018) builds on Gelbach’s (2016)
methodology. 18 The other advantage of comparing OLS and university fixed effects models using the Gelbach
decomposition is that, unlike other decomposition methods, it is not sensitive to the sequence in which
blocks of variables are incorporated. As Gelbach (2016: 510) notes: “the problem [with other
approaches] is that the order in which additional covariates enter the regression can affect the
accounting”. He goes on to show that sequence sensitivity can have a very substantial impact on
estimates using other techniques.
average real earnings paid by universities employing men and women VCs over the two
decades covered in our data. The figure shows trends in residual real earnings for
universities employing men and women. These are computed as the mean real earnings
offered to VCs in each university having stripped out the influence of VC
characteristics.19 Although the red line depicting the mean residual earnings in
universities employing women is a little below the blue line representing mean residual
earnings in universities employing men the gap is very small and statistically non-
significant throughout the period. Thus, although as noted earlier, there is very
substantial variance between universities in what they pay their VCs, these do not
account for the VC GWG and do not account for the closure of that gap in later years.
[INSERT FIGURE 3]
We can account more precisely for changes over time in the GWG, and the role played
by various factors, using the Juhn-Murphy-Pierce (henceforward JMP) procedure (Juhn
et al., 1993).20 This permits for a more formal decomposition in the contribution of each
factor between the first and second decades of the 21st Century. This is presented in
Table 3. The closure in the raw gap from 12 log points in 2000-2009 to 3.3 log points
from 2010 to 2019 is as per the decompositions above. Columns 2 and 3 confirm that
the 8.7 log point closure in the GWG is almost exclusively accounted for by changes in
what JMP term the “predicted gap”21, which is due to changes in men’s and women’s
observed endowments (“quantity” effects) and the returns to those endowments (what
JMP refer to as the “observed prices”) as captured in the coefficients attached to those
attributes. Changes in the residual gap (which might arise from changes in unobserved
prices or unobserved quantities) play no role: these are decomposed into quantity and
price effects at the bottom of the table but, since they are so small, we do not discuss
them further.
[INSERT TABLE 3]
19 The residual earnings are the residuals from a log real earnings equation incorporating workplace fixed
effects and the demographic characteristics of VCs. 20 The STATA procedure is jmpierce2. 21 The predicted gap is the equivalent of the explained gap in Oaxaca-Blinder terminology.
Instead we focus on the sizeable reduction in the predicted wage gap of 8.6 log points.
We decompose the predicted gap into its two parts – that related to changes in the
distribution of observed endowments between men and women (the quantity effect)
and that related to changes in the returns, or prices, attached to those attributes
between men and women (the price effect). The closure in the predicted GWG is largely
accounted for by the former, namely quantity effects. Changes in the endowments
across men and women account for 6.2 of the 8.5 log point closure in the predicted gap
(roughly three-quarters). Remarkably, 5.6 log points of this closure in the predicted gap
arises from quantity effects due to a single variable, namely the tuition fees universities
receive. The implication is that most of the closure in the GWG over the period is due
to the fact that female VCs are increasingly likely to work in universities with substantial
incomes arising from tuition fees. Universities’ financial performance in procuring
higher tuition fees also accounts for the majority of the reduction in the predicted gap
arising from changes in prices (1.2 of the 2.4 log point closure), suggesting women are
seeing increasing wage returns for the tuition fees their universities charge, compared
with men. By contrast, individual VC traits, such as time spent in the job, contribute very
little to changes in the GWG.
[TABLE 4]
Finally, we turn to the issues of ‘starter’ wages and returns to tenure. Starter wages are
the wages men and women receive on entering their VC job. Our data permit us to
investigate this issue because VC turnover is reasonably high: of our 115 HE institutions,
only two stick with the same VC throughout; 70 have two or three VCs; 36 have 4 VCs;
and 4 institutions have 5 or 6 VCs. This turnover means that we observe their first year
in post for 246 of the 349 VCs in our data (192 men and 54 women).
If, as some of the literature on the GWG suggests, women are less adept at bargaining
over wages or are less inclined to ask for a better wage than that which is offered
(Babcock and Laschever, 2003), we might anticipate a GWG in starter wages.
Alternatively, employers may discriminate against women in terms of the starter wages
they offer. Either way, there is clear evidence that female VCs received lower starter
wages than men pre-2010: the female coefficient in a log annual pay model containing
a female dummy and control for year was -.140 (t=2.70). This fell to a statistically non-
significant -.050 (t=1.06) post-2009.
In a small number of cases a university appoints a VC of the opposite sex: in 30 cases a
man replaces a woman, while in 45 cases a woman replaces a man. When universities
appoint a new female VC their wages are 8.2 log points lower than the previous male
incumbent (Table 4, column 1). This is unsurprising if the previous incumbent has built
up earnings through tenure. However, new male VC hires do not face the same penalty:
their earnings are 3.1 log points lower than the female incumbent they were replacing
but this differential is not statistically significant. What is more, there is little difference
over time in this pattern of results (columns 2 and 3).
[INSERT TABLE 4]
Taken together these findings on starter wages suggest that the wage penalty female
VCs faced in the first decade of the 21st Century had dissipated by the second decade,
but that women continued to receive a wage penalty relative to the male VCs they
replaced when universities switched from a male to a female VC, but that male VCs
replacing females faced no such penalty.
We have noted above that average tenure was greater for men than for women. Tenure
is positively associated with annual earnings: for each additional year of tenure VCs
received an additional 0.9 log points in earnings. Among those who had started their job
during the years we observed, returns to tenure were much larger: earnings rose by 6
log points per year on average, suggesting earnings growth is higher earlier on in VC
contracts. However, for a given number of years in post, there was no statistically
significant differential in the returns for men versus women, either among the whole
sample or for new starters.
6. Conclusion
This study uses linked employer-employee data to examine the gender wage gap among
those running universities in the UK, commonly known as Vice Chancellors, over the first
two decades of the 21st Century. It was a period in which women more than doubled
their representation in the occupation, and one in which the substantial wage penalty
initially experienced by women disappeared.
We have shown that, despite some growth in the percentage of VCs who are women, it
remains a male-dominated profession, and one characterised by gender segregation
across institutions, as indicated by the fact that 63 of the 115 universities in our sample
had not employed a female VC in the 20 years we study. This mattered because in the
first decade employer differences, particularly the financial performance of universities,
accounted for the bulk of the GWG. However, the GWG did not converge because
women were increasingly able to enter ‘higher paying’ universities: university fixed
effects did not jointly significant in explaining the GWG and the mean university residual
earnings men and women VCs received were not significantly different throughout the
period.
That gender differences in returns to VC attributes were largely absent over the period
might indicate that discriminatory behaviours against women may not have played an
important role in explaining the GWG. But this would be to ignore the potential role
that discrimination might have played with respect to hiring. Which institution hires you
is rather important for wage formation among VCs because across-institution
differences in VC wages are quite large, and because relatively few VCs appear to switch
between VC jobs across institutions – at least in the period we observe them. This
means that the wage offered for new starters, together with the returns to tenure, are
key determinants in wage growth for VCs. Although we find no gender difference in the
returns to tenure, we find starter wages were lower for women than they were for men
in the first decade, but this starter penalty for women had disappeared in the second
decade, thus contributing to a closure in the GWG. However, women continued to
receive a wage penalty relative to the male VCs they replaced when universities
switched from a male to a female VC, but male VCs replacing females faced no such
penalty, a finding that is consistent with discriminatory hiring practices.
The JMP decomposition of the change in the GWG over time indicated that the
convergence in the GWG was wholly attributable to changes in observed traits of VCs
and their universities. By far the biggest contributor was the increased likelihood of
female VCs working in universities with bigger tuition fee income. This effect is
independent of the number of students at the university because this is already
accounted for in the model. Precisely why this change took place is worthy of further
research.
From a broader labour market perspective, this case study in Vice Chancellor earnings
indicates that gender wage gaps can converge rapidly in high-wage occupations, at least
in circumstances where, by virtue of the average age of those in the occupation, caring
responsibilities for young children are less prevalent.
References
Addison, J. T., Portugal, P. and Vilares, H. (2018) “The Sources of the Union Wage Gap: The Role of Worker, Firm, Match and Job-title Heterogeneity”, CESIFO Working Paper No. 7392
Babcock, L. and Laschever, S. (2003) Women Don’t Ask: Negotiation and the Gender Divide. Princeton, NJ: Princeton University Press.
Bachan, R. (2008), ‘On the determinants of pay of CEOs in UK public sector higher education institutions’, IZA Discussion Paper 3858, IZA, Bonn.
Bachan, R. and B. Reilly (2015), ‘Is UK vice chancellor pay justified by university performance?’, Fiscal Studies, 36(1), 51–73.
Bachan and B. Reilly (2018). “Pay in education: Vice Chancellor and Rector remuneration”, in G. Johnes, J. Johnes, T. Agasisti and L. Lopez-Torres (eds), Handbook of Contemporary Education Economics. Edward Elgar, Cheltenham.
Bainbridge, M. and C. Simpson (1996), ‘Rewards to academia: the remuneration of vice chancellors and principals’, Applied Economics, 28(6), 631–9. Bargh, C. Bocock, J. Scott, P., and Smith, D. (2000). University Leadership. The Role of the Chief Executive. SRHE and Open University Press.
Bartlett, R. and O. Sorokina (2005), ‘Determinants of presidential pay at national liberal arts institutions’, Review of Higher Education, 29(1), 53–68. Becker, G. S. (1993). “Human Capital: A Theoretical and Empirical Analysis, with Special Reference to Education” (3rd Ed). University of Chicago Press Bennedsen, M., Simintzi, E., Tsoutsoura, M. and Wolfenzon, D. (2018) “Do Firms Respond to Gender Pay Gap Transparency?”, NBER Working Paper No. 25435 Bertrand, M. (2018) “Coase Lecture – The Glass Ceiling”, Economica, 85: 205-231 Bertrand, M., Black, S. E., Jensen, S. and Lleras-Muney, A. (2018) “Breaking the Glass Ceiling? The Effect of Board Quotas on Female Labour Market Outcomes in Norway”, The Review of Economic Studies, 86, 1: 191-239 Bertrand, M., Goldin, C. and Katz, L. F. (2010) “Dynamics of the Gender Gap for Young Professionals in the Financial and Corporate Sectors”, American Economic Journal: Applied Economics, 2: 228-255 Blau, F. D. and Kahn, L. M. (2017) “The Gender Wage Gap: Extent, Trends and Explanations”, Journal of Economic Literature, 55, 3: 789-865
Breakwell, G. and Tytherleigh, M. (2008). UK university leaders at the turn of the 21st century: changing patterns in their socio-demographic characteristics. Higher Education, 56(1):109-127 Bryson, A., Joshi, H., Wielgoszewska, B. and Wilkinson, D. (2020) ”A Short History of the Gender Wage Gap in Britain”, Oxford Review of Economic Policy, 36, 4: 836-854 Chan, W. (1996), ‘Internal Recruitment versus Internal Promotion’, Journal of Labor Economics, 14(4), pp555-570.
Cheng, S. (2014), ‘Executive compensation in public higher education: does performance matter?’, Research in Higher Education, 55(6), 581–600.
Clements, K. and I. Izan (2008), ‘The stairway to the top: the remuneration of academic executives’, Australian Journal of Management, 33(1), 1–30.
Department for Education and Skills (2003), ‘The future of higher education’, London: The Stationary Office. Cmd 5735
Dolton, P. and A. Ma (2003), ‘CEO pay in the public sector: the case of vice chancellors in UK universities’, Discussion Papers in Economics, Newcastle University, UK.
Ehrenberg, R., J. Cheslock and J. Epifantseva (2001), ‘Paying our presidents: what do trustees value?’, Review of Higher Education, 25(1), 15–37. Fortin, N., Bell, B. and Böhm, M. (2017) Top earnings inequality and the gender pay gap: Canada, Sweden, and the United Kingdom Labour Economics 47 (2017) 107–123
Frydman, C. and D. Jenter (2010), ‘CEO compensation’, Annual Review of Financial Economics, 2(1), 75–102.
Gelbach, J.B. (2016) ‘When do Covariates Matter? And Which Ones and How Much?’, Journal of Labor Economics, 34, 509 – 543.
Goff, B., McCormick, R. E. and Tollison, R. D. (2002) “Racial Integration as an Innovation: Empirical Evidence from Sports Leagues”, American Economic Review, 92, 1: 16-26
Girma, S., S. Thompson and P. Wright (2007), ‘Corporate governance reforms and executive compensation determination: evidence from the UK’, The Manchester School, 75(1), 65–81. Goldin, C. (2014) “A Grand Gender Convergence: Its Last Chapter”, American Economic Review, 104(4): 1091-1119 Heitmueller, A. (2005) “A note on decompositions in fixed effects models in the presence of time-invariant characteristics”, IZA Discussion Paper No. 1886 Henderson, M., Shure, D. and Adamecz-Volgyi, A. (2019) “’First in Family’ University Graduates in England”, IZA Discussion Paper No. 12588
Higher Education Statistical Agency, (2016). Data and Analysis, accessed 21 July 2020 at www.hesa.ac.uk/data-and-analysis . Hölmstrom, B. (1979) ‘Moral Hazard and Observability’, Bell Journal of Economics, 10(1):74-91. Jann, B. (2008) “A STATA Implementation of the Blinder-Oaxaca Decomposition”, The Stata Journal, 8, 4: 453-479 Jarratt, A. (1985) Report of the steering committee for Efficiency Studies in Universities, London: Committee of Vice Chancellors and Principals http://www.educationengland.org.uk/documents/jarratt1985/index.html Jensen, M., and W. Meckling (1976). Theory of the firm: managerial behavior, agency costs and ownership structure. Journal of Financial Economics, 3(4): 305–360.
Johnes. J., and S. Virmani (2019) “Chief executive pay in UK higher education: the role of university performance. Annals of Operations Research, 288: 547–576
Juhn, C., Murphy, K. M., and Pierce, B. (1991) “Accounting for the slowdown in black-white wage convergence” in Kosters, M. H. (ed.), Workers and their Wages, AEI Press, Washington DC, PP. 107-143 Juhn, C., Murphy, K. M., and Pierce, B. (1993) “Wage Inequality and the Rise in Returns to Skill”, Journal of Political Economy, 101, 3: 410-442 Kunze, A. (2018) “The Gender Wage Gap in Developed Countries”, in S. L. Averett, L. M. Argys and S. D. Hoffman (eds) The Oxford Handbook of Women and the Economy, Oxford University Press Kunze, A. and Miller, A. R. (2017) “Women Helping Women? Evidence from Private Sector Data on Workplace Hierarchies”, The Review of Economics and Statistics, 99, 5: 769-775 Lazear E., and Rosen, S. (1981) ‘Rank-Order Tournaments as Optimal Labor Contracts.’ Journal of Political Economy, 89, 5: 841-864. Manning, A. and Petrongolo, B. (2008) “The Part-time Pay Penalty for Women in Britain”, The Economic Journal, 118: F28-F51. Meng, X. and Meurs, D. (2004) “The gender earnings gap: effects of institutions and firms – a comparative study of French and Australian private firms”, Oxford Economic Papers, 56, 189-208 Mincer, J. (1974), Schooling, Experience and Earnings. New York: National Bureau of Economic Research.
Monks, J. (2007), ‘Public versus private university presidents pay levels and structure’, Economics of Education Review, 26(3), 338–48. Murphy, K., and Zabojnik, J. (2007) ‘Managerial capital and the market for CEOs’, mimeo, University of Southern California. Office for Students (2019). “Senior Staff Pay” https://www.officeforstudents.org.uk/advice-and-guidance/regulation/senior-staff-pay/
Robbins. (1963). Report of the Committee appointed by the Prime Minister under the Chairmanship of Lord Robbins. London: HMSO.
Pfeffer J. and J. Ross (1988), ‘The compensation of college and university presidents’, Research in Higher Education, 29(1), 79–91.
Soh, L. (2007), ‘The market for vice-chancellors’, Australian Journal of Management, 32(1), 29–55.
Tarbert, H., K. Tee and R. Watson (2008), “The legitimacy of pay and performance comparisons: an analysis of UK university chancellors pay awards”, British Journal of Industrial Relations, 46(4): 771–805. Times Higher Education (1999-2017), “Times Higher Education pay survey”, accessed 21 June 2019 https://www.timeshighereducation.com/features/times-higher-education-v-c-pay-survey-2018 Walker, J., P. Greve, G. Wood and P. Miskell (2019) “Because you’re worth it? Determinants of Vice Chancellor pay in the UK”, Industrial Relations Journal, 50 (5–6):450–467
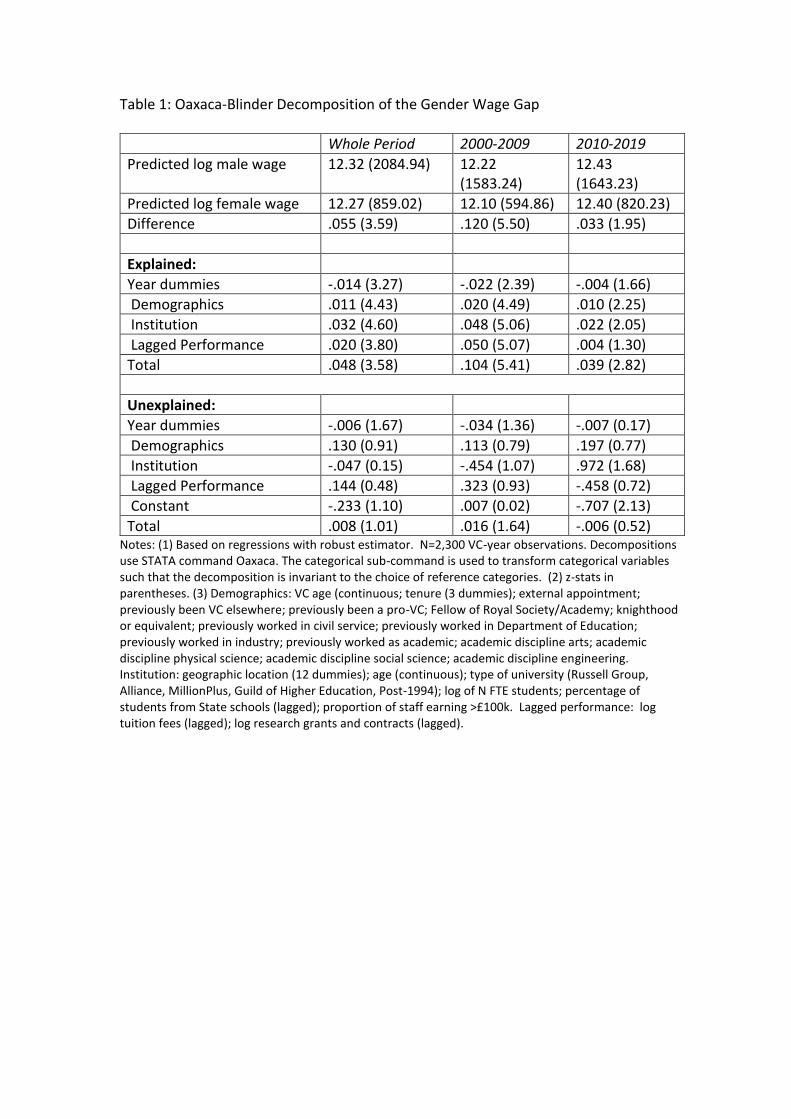
Table 1: Oaxaca-Blinder Decomposition of the Gender Wage Gap
Whole Period 2000-2009 2010-2019
Predicted log male wage 12.32 (2084.94) 12.22 (1583.24)
12.43 (1643.23)
Predicted log female wage 12.27 (859.02) 12.10 (594.86) 12.40 (820.23)
Difference .055 (3.59) .120 (5.50) .033 (1.95)
Explained:
Year dummies -.014 (3.27) -.022 (2.39) -.004 (1.66)
Demographics .011 (4.43) .020 (4.49) .010 (2.25)
Institution .032 (4.60) .048 (5.06) .022 (2.05)
Lagged Performance .020 (3.80) .050 (5.07) .004 (1.30)
Total .048 (3.58) .104 (5.41) .039 (2.82)
Unexplained:
Year dummies -.006 (1.67) -.034 (1.36) -.007 (0.17)
Demographics .130 (0.91) .113 (0.79) .197 (0.77)
Institution -.047 (0.15) -.454 (1.07) .972 (1.68)
Lagged Performance .144 (0.48) .323 (0.93) -.458 (0.72)
Constant -.233 (1.10) .007 (0.02) -.707 (2.13)
Total .008 (1.01) .016 (1.64) -.006 (0.52) Notes: (1) Based on regressions with robust estimator. N=2,300 VC-year observations. Decompositions use STATA command Oaxaca. The categorical sub-command is used to transform categorical variables such that the decomposition is invariant to the choice of reference categories. (2) z-stats in parentheses. (3) Demographics: VC age (continuous; tenure (3 dummies); external appointment; previously been VC elsewhere; previously been a pro-VC; Fellow of Royal Society/Academy; knighthood or equivalent; previously worked in civil service; previously worked in Department of Education; previously worked in industry; previously worked as academic; academic discipline arts; academic discipline physical science; academic discipline social science; academic discipline engineering. Institution: geographic location (12 dummies); age (continuous); type of university (Russell Group, Alliance, MillionPlus, Guild of Higher Education, Post-1994); log of N FTE students; percentage of students from State schools (lagged); proportion of staff earning >£100k. Lagged performance: log tuition fees (lagged); log research grants and contracts (lagged).
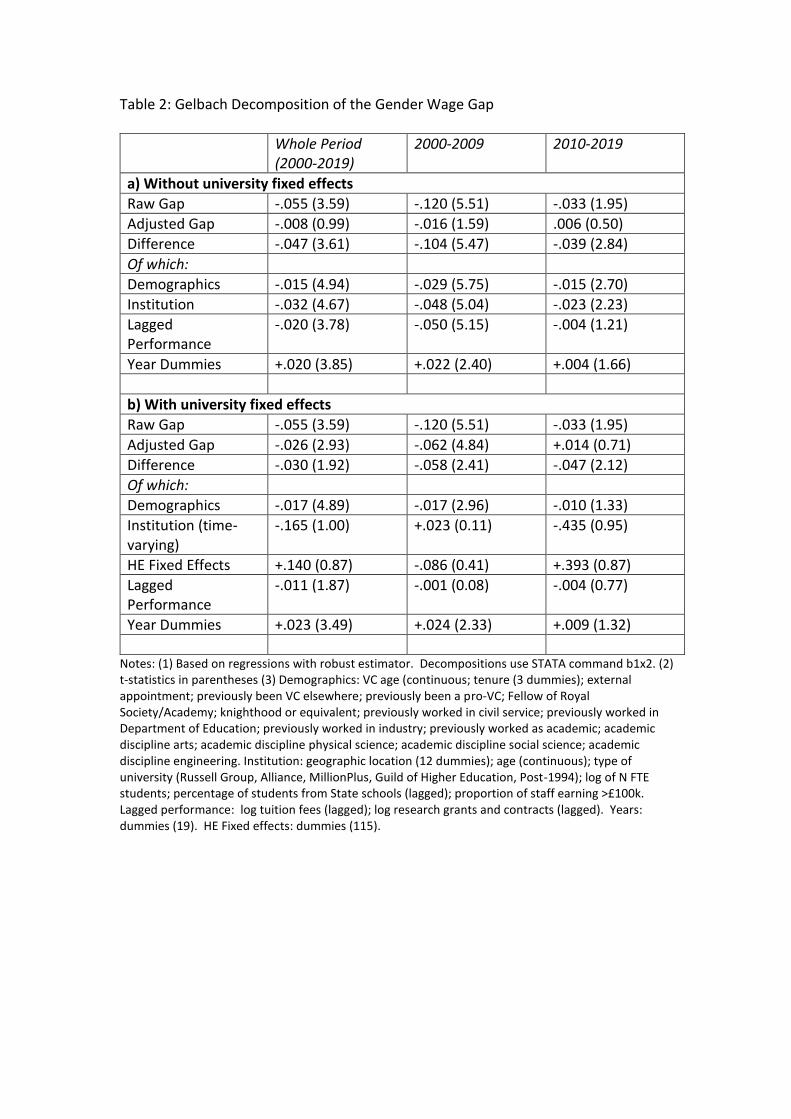
Table 2: Gelbach Decomposition of the Gender Wage Gap
Whole Period (2000-2019)
2000-2009 2010-2019
a) Without university fixed effects
Raw Gap -.055 (3.59) -.120 (5.51) -.033 (1.95)
Adjusted Gap -.008 (0.99) -.016 (1.59) .006 (0.50)
Difference -.047 (3.61) -.104 (5.47) -.039 (2.84)
Of which:
Demographics -.015 (4.94) -.029 (5.75) -.015 (2.70)
Institution -.032 (4.67) -.048 (5.04) -.023 (2.23)
Lagged Performance
-.020 (3.78) -.050 (5.15) -.004 (1.21)
Year Dummies +.020 (3.85) +.022 (2.40) +.004 (1.66)
b) With university fixed effects
Raw Gap -.055 (3.59) -.120 (5.51) -.033 (1.95)
Adjusted Gap -.026 (2.93) -.062 (4.84) +.014 (0.71)
Difference -.030 (1.92) -.058 (2.41) -.047 (2.12)
Of which:
Demographics -.017 (4.89) -.017 (2.96) -.010 (1.33)
Institution (time-varying)
-.165 (1.00) +.023 (0.11) -.435 (0.95)
HE Fixed Effects +.140 (0.87) -.086 (0.41) +.393 (0.87)
Lagged Performance
-.011 (1.87) -.001 (0.08) -.004 (0.77)
Year Dummies +.023 (3.49) +.024 (2.33) +.009 (1.32)
Notes: (1) Based on regressions with robust estimator. Decompositions use STATA command b1x2. (2) t-statistics in parentheses (3) Demographics: VC age (continuous; tenure (3 dummies); external appointment; previously been VC elsewhere; previously been a pro-VC; Fellow of Royal Society/Academy; knighthood or equivalent; previously worked in civil service; previously worked in Department of Education; previously worked in industry; previously worked as academic; academic discipline arts; academic discipline physical science; academic discipline social science; academic discipline engineering. Institution: geographic location (12 dummies); age (continuous); type of university (Russell Group, Alliance, MillionPlus, Guild of Higher Education, Post-1994); log of N FTE students; percentage of students from State schools (lagged); proportion of staff earning >£100k. Lagged performance: log tuition fees (lagged); log research grants and contracts (lagged). Years: dummies (19). HE Fixed effects: dummies (115).
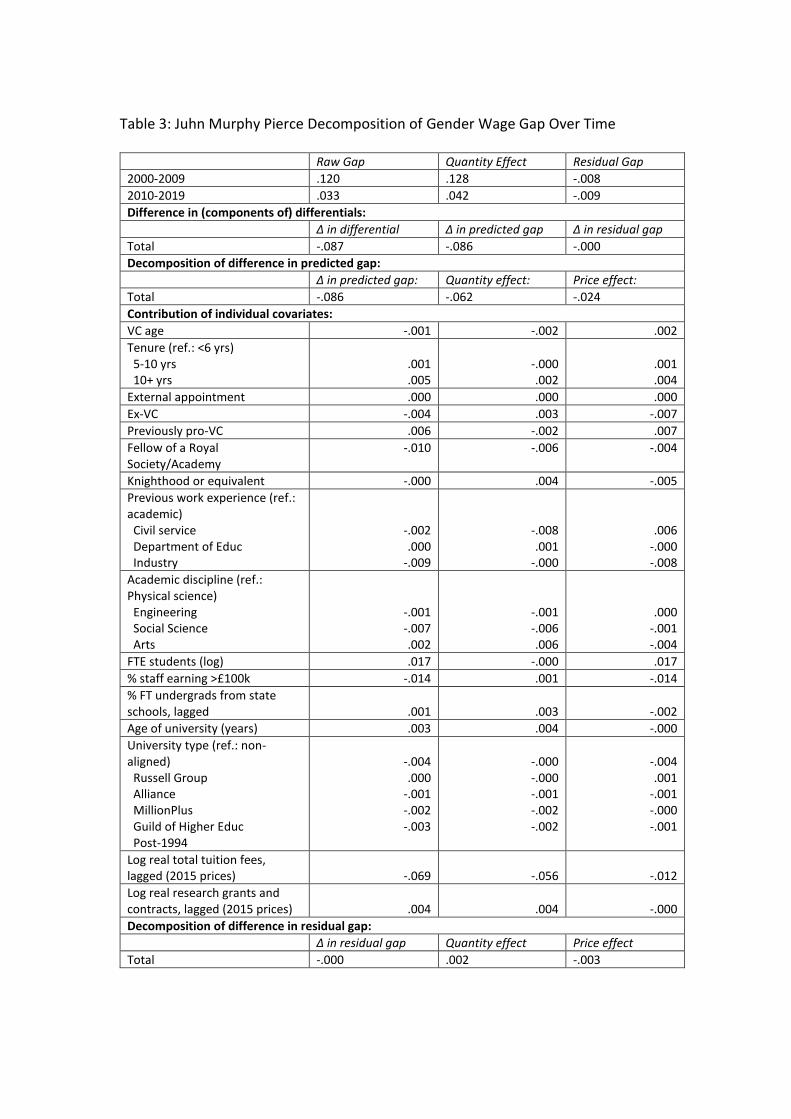
Table 3: Juhn Murphy Pierce Decomposition of Gender Wage Gap Over Time
Raw Gap Quantity Effect Residual Gap
2000-2009 .120 .128 -.008
2010-2019 .033 .042 -.009
Difference in (components of) differentials:
Δ in differential Δ in predicted gap Δ in residual gap
Total -.087 -.086 -.000
Decomposition of difference in predicted gap:
Δ in predicted gap: Quantity effect: Price effect:
Total -.086 -.062 -.024
Contribution of individual covariates:
VC age -.001 -.002 .002
Tenure (ref.: <6 yrs) 5-10 yrs 10+ yrs
.001 .005
-.000 .002
.001 .004
External appointment .000 .000 .000
Ex-VC -.004 .003 -.007
Previously pro-VC .006 -.002 .007
Fellow of a Royal Society/Academy
-.010 -.006 -.004
Knighthood or equivalent -.000 .004 -.005
Previous work experience (ref.: academic) Civil service Department of Educ Industry
-.002 .000
-.009
-.008 .001
-.000
.006 -.000 -.008
Academic discipline (ref.: Physical science) Engineering Social Science Arts
-.001 -.007 .002
-.001 -.006 .006
.000 -.001 -.004
FTE students (log) .017 -.000 .017
% staff earning >£100k -.014 .001 -.014
% FT undergrads from state schools, lagged
.001
.003
-.002
Age of university (years) .003 .004 -.000
University type (ref.: non-aligned) Russell Group Alliance MillionPlus Guild of Higher Educ Post-1994
-.004 .000
-.001 -.002 -.003
-.000 -.000 -.001 -.002 -.002
-.004 .001
-.001 -.000 -.001
Log real total tuition fees, lagged (2015 prices)
-.069
-.056
-.012
Log real research grants and contracts, lagged (2015 prices)
.004
.004
-.000
Decomposition of difference in residual gap:
Δ in residual gap Quantity effect Price effect
Total -.000 .002 -.003
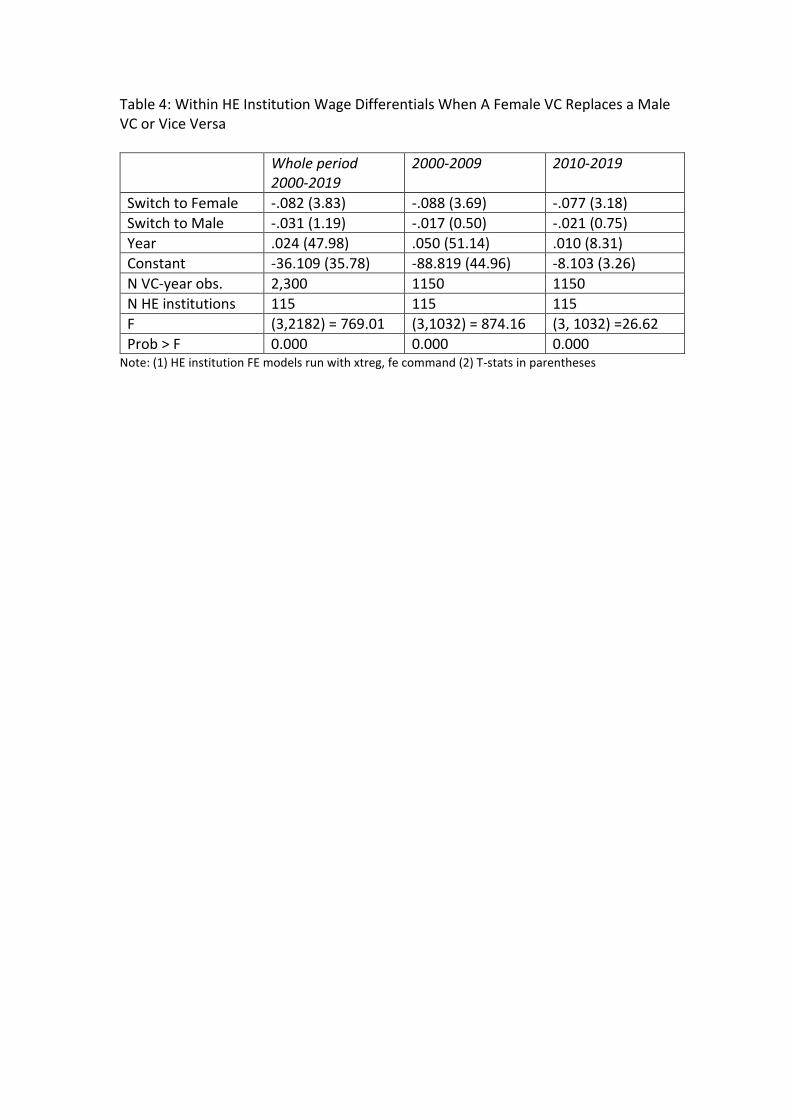
Table 4: Within HE Institution Wage Differentials When A Female VC Replaces a Male VC or Vice Versa
Whole period 2000-2019
2000-2009 2010-2019
Switch to Female -.082 (3.83) -.088 (3.69) -.077 (3.18)
Switch to Male -.031 (1.19) -.017 (0.50) -.021 (0.75)
Year .024 (47.98) .050 (51.14) .010 (8.31)
Constant -36.109 (35.78) -88.819 (44.96) -8.103 (3.26)
N VC-year obs. 2,300 1150 1150
N HE institutions 115 115 115
F (3,2182) = 769.01 (3,1032) = 874.16 (3, 1032) =26.62
Prob > F 0.000 0.000 0.000 Note: (1) HE institution FE models run with xtreg, fe command (2) T-stats in parentheses
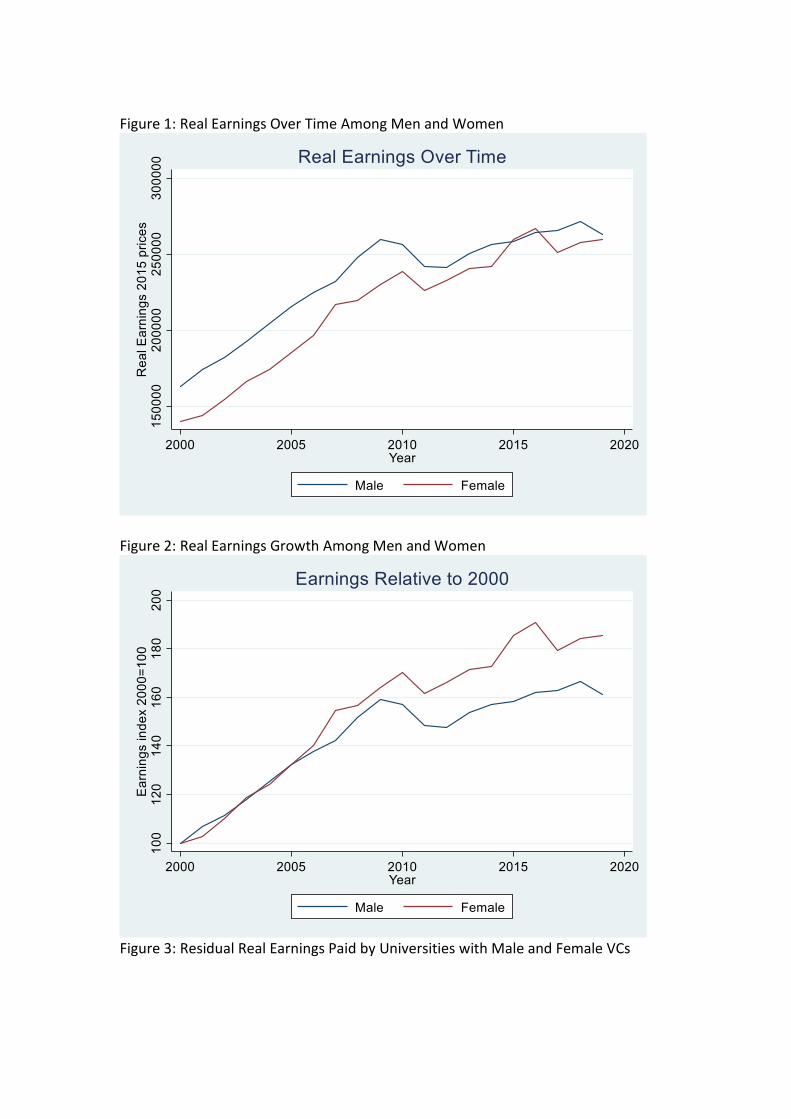
Figure 1: Real Earnings Over Time Among Men and Women
Figure 2: Real Earnings Growth Among Men and Women
Figure 3: Residual Real Earnings Paid by Universities with Male and Female VCs

Appendix Table A1: Summary Statistics a All VCs Male Female t/z b
VC Pay Real Pay (£s, 2015=100) 230,243
(60,705) 232,126 (59,637)
221,455 (64,819)
3.22
(ln) Real Pay (2015=100) 12.313 (0.263)
12.322 (0.257)
12.267 (0.288)
3.86
VC Characteristics
Female 0.176 n/a n/a n/a Age 58.422
(4.530) 58.393
(4.624) 58.557
(4.064) -0.66
Age2 3433.403 (525.605)
3430.842 (535.993)
3445.355 (475.575)
-0.51
Tenure (years) 5.60 (3.99)
5.74 (4.09)
4.96 (3.47)
3.59
Tenure 1-10 years 0.321 0.326 0.298 1.11 Tenure > 10 years 0.112 0.120 0.074 2.67 Externally Appointed 0.803 0.801 0.810 -0.41 Ex Vice Chancellor 0.125 0.136 0.076 3.28 Ex Pro-Vice Chancellor 0.703 0.687 0.778 -3.65 Fellow of a Royal Society/Academy 0.084 0.084 0.084 0.01 Knighthood or equivalent 0.113 0.109 0.133 -1.37 Previous Work Experience
Civil Servant 0.061 0.060 0.064 -0.29 Department for Education 0.013 0.014 0.010 0.70 Industry 0.053 0.062 0.010 4.29 Academic 0.873 0.864 0.916 -2.91 χ2
3 = 16.59 [0.001] c Academic Discipline
Engineering 0.114 0.130 0.037 5.41 Social Science 0.452 0.425 0.581 -5.78 Arts 0.100 0.090 0.148 -3.54 Physical Science 0.334 0.355 0.234 4.73 χ2
3 = 69.56 [0.000] c
University Characteristics
Total Students (FTE) 13,695 (6,676)
140,007 (6,493)
12237 (7,306)
4.87
(ln) Total Students (FTE) 9.371 (0.623)
9.406 (0.014)
9.206 (0.035)
5.92
Prop. of Staff Remunerated> £100k 0.015 (0.020)
0.016 (0.020)
0.013 (0.020)
1.87
University Age 74.306 (144.167)
76.367 (140.713)
64.692 (159.127)
1.48
% Students from State Schools (lagged 1 year) 89.232 (11.055)
88.964 (11.056)
90.485 (10.797)
-3.01
University Group Russell 0.185 0.205 0.095 5.24 Alliance 0.139 0.139 0.140 -0.08 MillionPlus 0.130 0.125 0.155 -1.63 Guild of Higher Education 0.096 0.073 0.201 -8.14 Non-aligned 0.450 0.459 0.409 1.84 χ2
4 = 84.62 [0.000] d
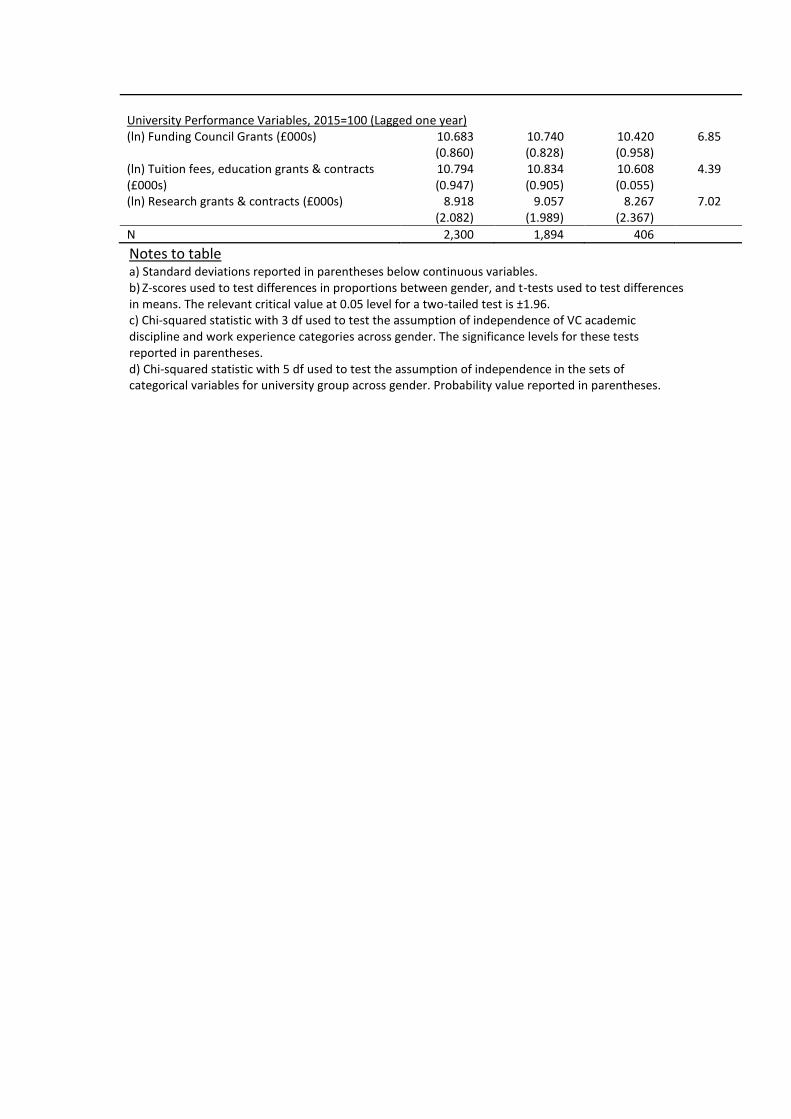
University Performance Variables, 2015=100 (Lagged one year) (ln) Funding Council Grants (£000s) 10.683
(0.860) 10.740
(0.828) 10.420
(0.958) 6.85
(ln) Tuition fees, education grants & contracts (£000s)
10.794 (0.947)
10.834 (0.905)
10.608 (0.055)
4.39
(ln) Research grants & contracts (£000s)
8.918 (2.082)
9.057 (1.989)
8.267 (2.367)
7.02
N 2,300 1,894 406
Notes to table a) Standard deviations reported in parentheses below continuous variables. b) Z-scores used to test differences in proportions between gender, and t-tests used to test differences in means. The relevant critical value at 0.05 level for a two-tailed test is ±1.96. c) Chi-squared statistic with 3 df used to test the assumption of independence of VC academic discipline and work experience categories across gender. The significance levels for these tests reported in parentheses. d) Chi-squared statistic with 5 df used to test the assumption of independence in the sets of categorical variables for university group across gender. Probability value reported in parentheses.
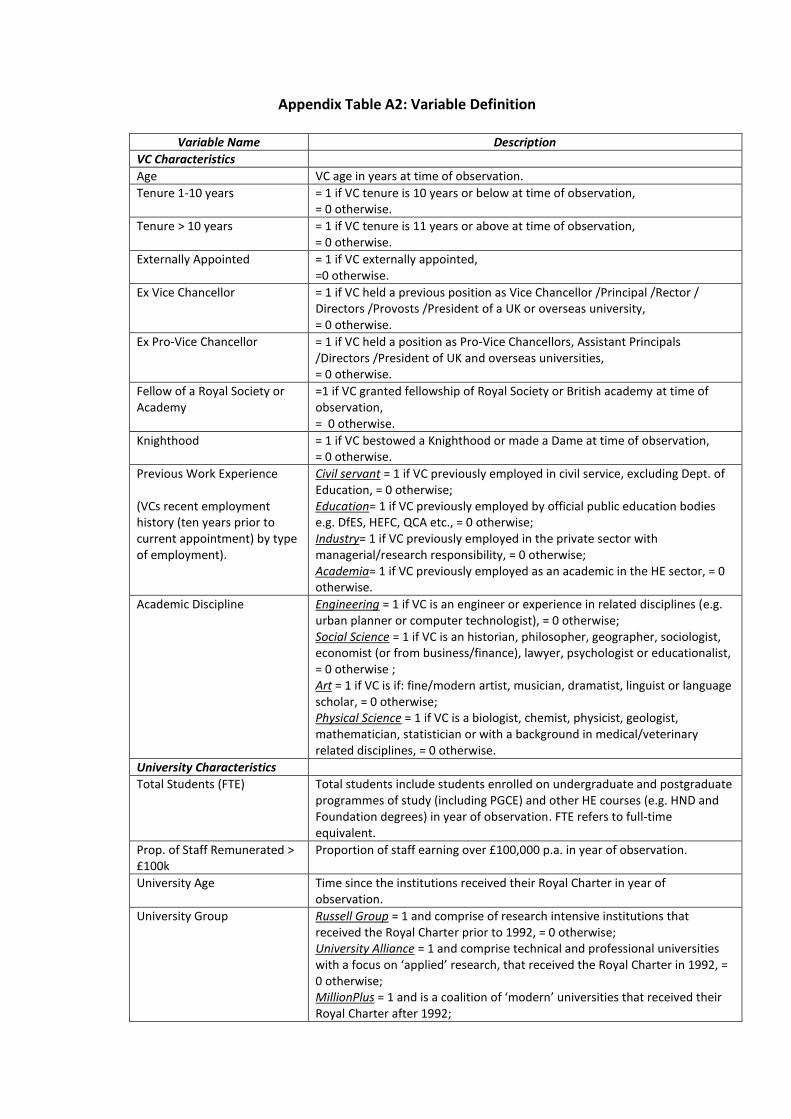
Appendix Table A2: Variable Definition
Variable Name Description
VC Characteristics
Age VC age in years at time of observation.
Tenure 1-10 years = 1 if VC tenure is 10 years or below at time of observation, = 0 otherwise.
Tenure > 10 years = 1 if VC tenure is 11 years or above at time of observation, = 0 otherwise.
Externally Appointed = 1 if VC externally appointed, =0 otherwise.
Ex Vice Chancellor = 1 if VC held a previous position as Vice Chancellor /Principal /Rector / Directors /Provosts /President of a UK or overseas university, = 0 otherwise.
Ex Pro-Vice Chancellor = 1 if VC held a position as Pro-Vice Chancellors, Assistant Principals /Directors /President of UK and overseas universities, = 0 otherwise.
Fellow of a Royal Society or Academy
=1 if VC granted fellowship of Royal Society or British academy at time of observation, = 0 otherwise.
Knighthood = 1 if VC bestowed a Knighthood or made a Dame at time of observation, = 0 otherwise.
Previous Work Experience (VCs recent employment history (ten years prior to current appointment) by type of employment).
Civil servant = 1 if VC previously employed in civil service, excluding Dept. of Education, = 0 otherwise; Education= 1 if VC previously employed by official public education bodies e.g. DfES, HEFC, QCA etc., = 0 otherwise; Industry= 1 if VC previously employed in the private sector with managerial/research responsibility, = 0 otherwise; Academia= 1 if VC previously employed as an academic in the HE sector, = 0 otherwise.
Academic Discipline Engineering = 1 if VC is an engineer or experience in related disciplines (e.g. urban planner or computer technologist), = 0 otherwise; Social Science = 1 if VC is an historian, philosopher, geographer, sociologist, economist (or from business/finance), lawyer, psychologist or educationalist, = 0 otherwise ; Art = 1 if VC is if: fine/modern artist, musician, dramatist, linguist or language scholar, = 0 otherwise; Physical Science = 1 if VC is a biologist, chemist, physicist, geologist, mathematician, statistician or with a background in medical/veterinary related disciplines, = 0 otherwise.
University Characteristics
Total Students (FTE) Total students include students enrolled on undergraduate and postgraduate programmes of study (including PGCE) and other HE courses (e.g. HND and Foundation degrees) in year of observation. FTE refers to full-time equivalent.
Prop. of Staff Remunerated > £100k
Proportion of staff earning over £100,000 p.a. in year of observation.
University Age Time since the institutions received their Royal Charter in year of observation.
University Group Russell Group = 1 and comprise of research intensive institutions that received the Royal Charter prior to 1992, = 0 otherwise; University Alliance = 1 and comprise technical and professional universities with a focus on ‘applied’ research, that received the Royal Charter in 1992, = 0 otherwise; MillionPlus = 1 and is a coalition of ‘modern’ universities that received their Royal Charter after 1992;
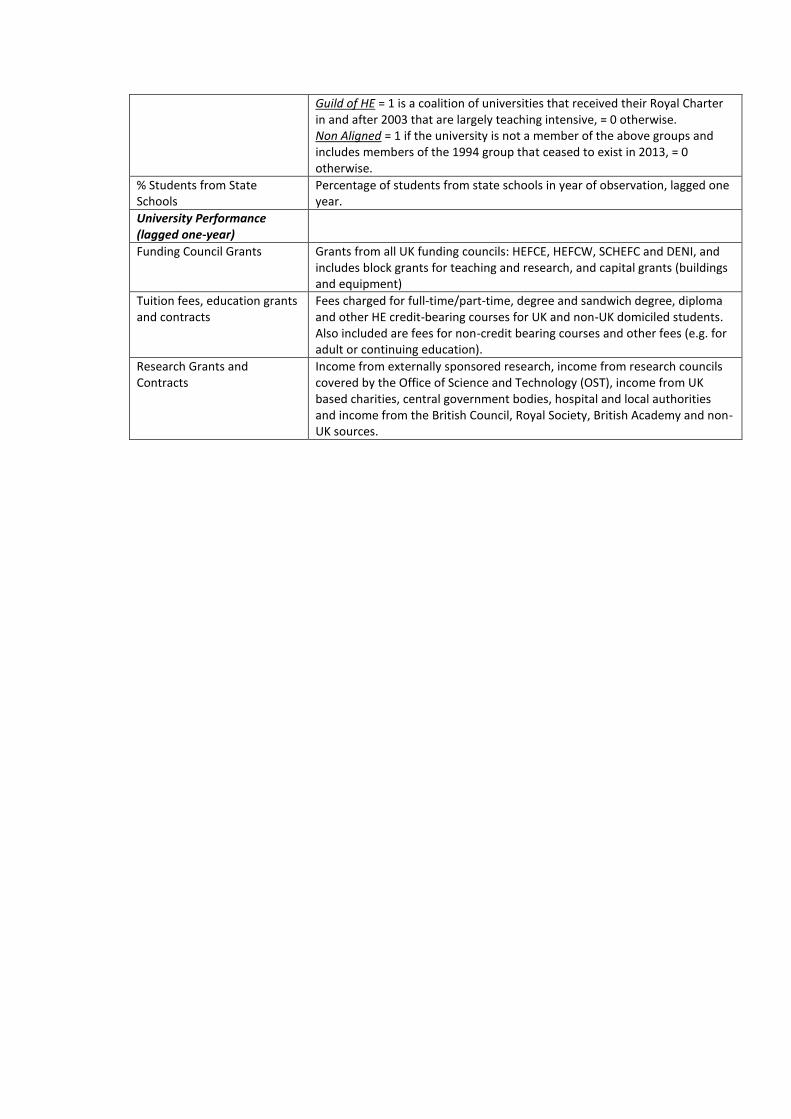
Guild of HE = 1 is a coalition of universities that received their Royal Charter in and after 2003 that are largely teaching intensive, = 0 otherwise. Non Aligned = 1 if the university is not a member of the above groups and includes members of the 1994 group that ceased to exist in 2013, = 0 otherwise.
% Students from State Schools
Percentage of students from state schools in year of observation, lagged one year.
University Performance (lagged one-year)
Funding Council Grants Grants from all UK funding councils: HEFCE, HEFCW, SCHEFC and DENI, and includes block grants for teaching and research, and capital grants (buildings and equipment)
Tuition fees, education grants and contracts
Fees charged for full-time/part-time, degree and sandwich degree, diploma and other HE credit-bearing courses for UK and non-UK domiciled students. Also included are fees for non-credit bearing courses and other fees (e.g. for adult or continuing education).
Research Grants and Contracts
Income from externally sponsored research, income from research councils covered by the Office of Science and Technology (OST), income from UK based charities, central government bodies, hospital and local authorities and income from the British Council, Royal Society, British Academy and non-UK sources.
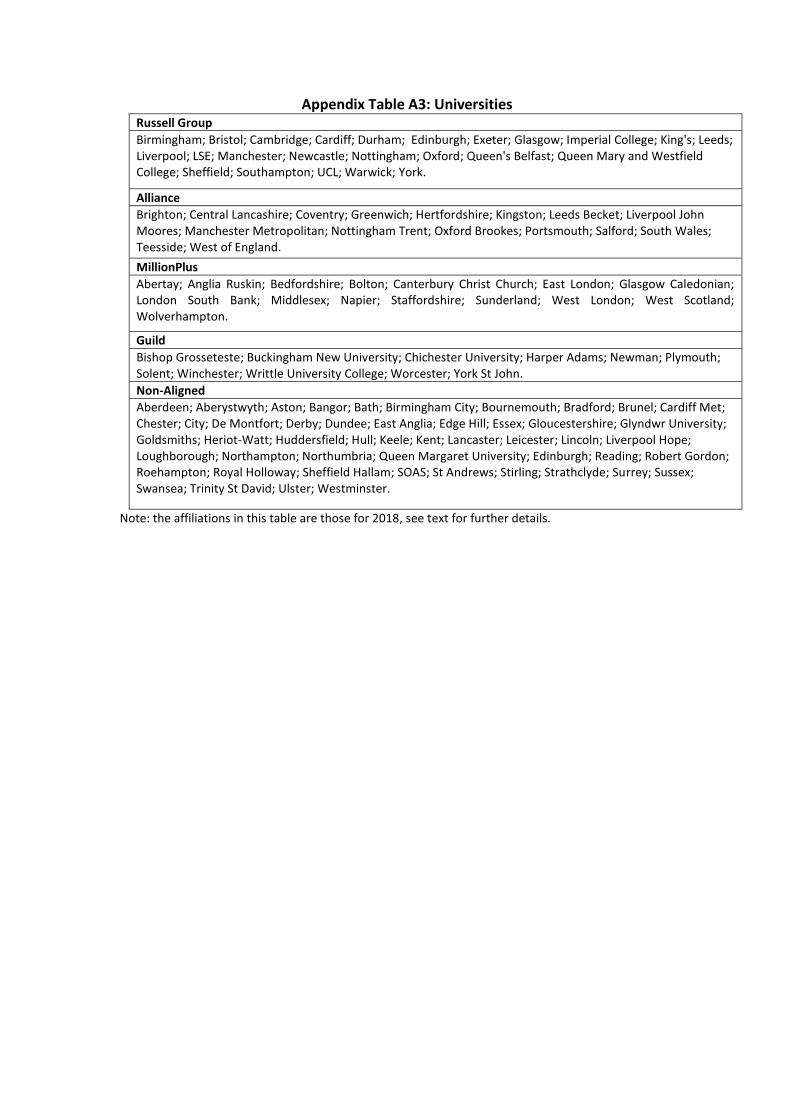
Appendix Table A3: Universities Russell Group
Birmingham; Bristol; Cambridge; Cardiff; Durham; Edinburgh; Exeter; Glasgow; Imperial College; King's; Leeds; Liverpool; LSE; Manchester; Newcastle; Nottingham; Oxford; Queen's Belfast; Queen Mary and Westfield College; Sheffield; Southampton; UCL; Warwick; York.
Alliance
Brighton; Central Lancashire; Coventry; Greenwich; Hertfordshire; Kingston; Leeds Becket; Liverpool John Moores; Manchester Metropolitan; Nottingham Trent; Oxford Brookes; Portsmouth; Salford; South Wales; Teesside; West of England.
MillionPlus
Abertay; Anglia Ruskin; Bedfordshire; Bolton; Canterbury Christ Church; East London; Glasgow Caledonian; London South Bank; Middlesex; Napier; Staffordshire; Sunderland; West London; West Scotland; Wolverhampton.
Guild
Bishop Grosseteste; Buckingham New University; Chichester University; Harper Adams; Newman; Plymouth; Solent; Winchester; Writtle University College; Worcester; York St John.
Non-Aligned
Aberdeen; Aberystwyth; Aston; Bangor; Bath; Birmingham City; Bournemouth; Bradford; Brunel; Cardiff Met; Chester; City; De Montfort; Derby; Dundee; East Anglia; Edge Hill; Essex; Gloucestershire; Glyndwr University; Goldsmiths; Heriot-Watt; Huddersfield; Hull; Keele; Kent; Lancaster; Leicester; Lincoln; Liverpool Hope; Loughborough; Northampton; Northumbria; Queen Margaret University; Edinburgh; Reading; Robert Gordon; Roehampton; Royal Holloway; Sheffield Hallam; SOAS; St Andrews; Stirling; Strathclyde; Surrey; Sussex; Swansea; Trinity St David; Ulster; Westminster.
Note: the affiliations in this table are those for 2018, see text for further details.