the genetic and morphological evolution of fish through...
TRANSCRIPT

Int. J. of Life Sciences, 2017, Vol. 5 (3): 332-344 ISSN: 2320-7817| eISSN: 2320-964X
© 2017 |IJLSCI www.ijlsci.in 332
The Genetic and Morphological Evolution of Fish through the
Protein Cytochrome C Oxidase Subunit One
Sammer Marzouk,
University of Chicago Laboratory Schools, 1362 E 59th St, Chicago, IL 60637,
Email: [email protected]
Manuscript details: ABSTRACT
Received: 12.07.2017
Accepted: 14.08.2017
Published : 19.09.2017
Editor:
Dr. Arvind Chavhan
Cite this article as:
Sammer Marzouk (2017) The
Genetic and Morphological Evolution
of Fish through the Protein
Cytochrome C Oxidase Subunit One;
International J. of Life Sciences, 5 (3):
332-344.
Copyright: © 2017| Author (s), This
is an open access article under the
terms of the Creative Commons
Attribution-Non-Commercial - No
Derivs License, which permits use
and distribution in any medium,
provided the original work is
properly cited, the use is non-
commercial and no modifications or
adaptations are made.
Background: Cytochrome C Oxidase Subunit 1 (COX1) is a protein that
helps to catalyze the reduction of water into oxygen in Eukaryotes. Through
the analyzation of COX1 from online public genetic databases in 16 species
of fish, an evolutionary phylogeny of fish was derived from the data. This
paper considered three hypotheses: Axolotl (Ambystoma mexicanum) and
Tiktaalik (Tiktaalik roseae) share a common ancestor was determined; that
A.gueldenstaedtii and P.spathula both share a common ancestor; and that
P.marinus and S.acanthias are the outliers of the phylogeny. The
evolutionary phylogeny used the percent ID between the two species of fish.
From these differences, analysis is done to the data and the data is used to
make phylogenies based on the morphological and genetic evolution of
these fish.
Results: From the data derived from the phylogenies, the results
demonstrates the claims that Axolotl (Ambystoma mexicanum) and Tiktaalik
(Tiktaalik roseae) share a common ancestor was determined,
A.gueldenstaedtii and P.spathula both share a common ancestor, and
P.marinus and S.acanthias are the outliers of the phylogeny.
Conclusion: The data gathered can be used to connect tetrapods to fish,
and contribute to the theory that tetrapods came from fish. The information
presented in this paper can be used to make a complete phylogeny of all
organisms in the biosphere.
Keywords: Cladogram, Evolutionary Biology, Ichthyology, Phylogeny, and
Evolution.
INTRODUCTION
Of the 30,000 species of fish, the phylogenetic trees of fish have not been
heavily studied on built upon for the reason that their has not been a
reliable connection between fish and tetrapods (Fiz-Palacios et al., 2013).
Charles Darwin first proposed that animals could be categorized by the
morphological traits they possessed, and supported this by categorizing
finches based on their beaks. This type of phylogeny made by data from
morphological traits is the morphological phylogeny. As DNA sequencing
technology because in greater use, a new type of phylogeny from which
RESEARCH ARTICLE

The Genetic and Morphological Evolution of Fish through the Protein Cytochrome C Oxidase
www.ijlsci.in Int. J. of Life Sciences, Vol. 5(3) September 2017 333
protein-sequences were used was also used to
categorize animals. These two types of phylogenies
would show a hypothesis of the evolution of certain
beings. But sometimes there would be differences in
these two types of phylogenies. This demonstrates the
need of how can a cladogram be inferred using genetic
data be reconciled with a cladogram using only
morphological data? From a sample size of 16 species
of fish, a morphological phylogeny was previously
derived (Fig.1). The phylogeny has 21 traits and shows
which traits evolved in which species (Fig.1). From the
morphological phylogeny, it is shown that gills,
spiracles, and a cartilage skeleton are the basic traits
that make this clade of species (Fig.1). Overtime, more
diverse and complex traits divided up the fish into
separate taxa (Fig.1). In the morphological phylogeny
Tiktaalik (Tiktaalik roseae), and Axolotl (Ambystoma
mexicanum) were both in the same clade, which lead to
the hypothesis that if the morphological and protein
phylogenies were compared, then it would determine
that they shared a common ancestor (Fig.1). Also, in
the morphological phylogeny, it is shown that
A.gueldenstaedtii and P.spathula both share a common
ancestor, and P.marinus and S.acanthias are the
outliers of the phylogeny (Fig. 1). In order to get the
most accurate results, this morphological data was
combined with the protein-sequence of Cytochrome C
Oxidase Subunit 1 (COX1) (Table 2). Cytochrome C
Oxidase Subunit 1 (COX1) is one out of the three
mitochondrial DNA subunits, the others being MT-CO2,
MT-CO3 that are part of respiratory complex IV
(Tsukihara et al., 1996). In respiratory complex IV, this
enzyme completes the electron transport system, and
its function of catalyzing the reduction of water into
oxygen (Tsukihara et al., 1996). Most Eukaryotes, and
all vertebrates have this protein (Tsukihara et al.,
1996). The COX1 from the Spiny Dogfish (Squalus
acanthias), Sea Lamprey (Petromyzon marinus),
Saddled Bichir (Polypterus endlicheri), Paddlefish
(Polyodon spathula), Ghost Shark (Callorhynchus milii),
Coelacanth (Latimeria chalumnae), Bowfin (Amia
calva), Pollen`s Cichlid (Paratilapia pollen), Tiktaalik
(Tiktaalik roseae), Ropefish (Erpetoichthys
calabaricus), Great White Shark (Carcharodon
carcharias), Axolotl (Ambystoma mexicanum), Cuvier's
Bichir (Polypterus senegalus), Russian Sturgeon
(Acipenser gueldenstaedtii), Australian Lungfish
(Neoceratodus forsteri), and Goldfish (Carassius
auratus) were sequenced and compared in order to
find the percent ID (Table 1). This percent ID was used
in order to make a phylogeny. The protein-sequenced
Table 1: Sample group of 16 species of fishes
Common Name: Genus Species:
Spiny Dogfish Squalus acanthias
Sea Lamprey Petromyzon marinus
Saddled Bichir Polypterus endlicheri
Paddlefish Polyodon spathula
Ghost Shark Callorhynchus milii
Coelacanth Latimeria chalumnae
Bowfin Amia calva
Pollen`s Cichlid Paratilapia pollen
Tiktaalik Tiktaalik roseae
Ropefish Erpetoichthys calabaricus
Great White Shark Carcharodon carcharias
Axolotl Ambystoma mexicanum
Cuvier's Bichir Polypterus senegalus
Russian Sturgeon Acipenser gueldenstaedtii
Australian Lungfish Neoceratodus forsteri
Goldfish Carassius auratus
phylogeny was compared with the morphological
phylogeny to make a final phylogeny. This paper
describes the morphological and protein similarity
between the 16 species of fish, and describes the use of
building a more extensive phylogenetic tree.
MATERIALS AND METHODS
Morphological Phylogeny
The morphological tree phylogeny was constructed
based off of 21 synapomorphies of a sample group of
16 species of fish (Fig. 1). A species would be
compared with the other species of fish. If the species
had or did not have a specific trait, they would be
placed in a different clade than species that did not did
not have another trait (Fig. 1). The continuation of this
pattern would give a complete morphological
phylogeny (Fig. 1). The morphological phylogeny was
based off of a data matrix which was derived from the
characteristics that the species of fish might or might
not have (Table 3). For every characteristic, if it was
present in that species of fish it had a “Y” otherwise it
had a “N” in it (Table 3).

Sammer Marzouk, 2017
334 Int. J. of Life Sciences, Vol. 5(3) September, 2017
Protein Sequences and Construction of Phylogeny
The protein sequence of the fish was derived from an
online public genomic database (Table 4). The data
was then compared and analyzed by a series of
specialized computer algorithms. These computer
algorithms gave the specific percent identity (specific
as in rounded to the nearest tenth) and the specific
percent similar. These percentages were then used,
and compiled on a genetic chart. From the genetic
chart, the phylogenetic tree was derived (Table 4). In
order to make the phylogeny, the data on the first
species, S.acanthias was compared to the rest of the
fish (Fig. 2). The one with the largest percent identity
was put into a clade with S.acanthias (Fig. 2). After
this, the next species that was closest to S.acanthias
was put in the same clade the two previous fish.
Combination of Morphological and Protein
Phylogeny
In order to combine the types of phylogenies, further
examination on the similarities and differences of the
phylogenies would be conducted (Fig. 3). Similarities
would be kept and considered a constant of both
phylogenies (Fig. 3). Differences in species placement
were decided by comparing the two phylogenies and
deriving a spot for the species based on a specialized
computer algorithm. Any contradictions would be
resolved by analysing the percent similar and
determining which species had the greater percent
similar (Fig. 3). This species would then be placed
accordingly (Fig. 3).
2.4 Data Analysis
All sequenced protein data has been verified by the
proper scientific body. Data analysis was by a
specialized computer algorithm developed by William
Pearson and run on the LALIGN server. All data was
tested for specific outliers and the percent similar
induced function of amino acids. percent identity
included exact amino acid comparisons. Identical and
similar percentages were rounded to the nearest tenth.
RESULTS
From the data, three specific conclusions were drawn.
The first conclusion drawn from the data was that
Axolotl (Ambystoma mexicanum) and Tiktaalik
(Tiktaalik roseae) share a common ancestor (Fig.1,
Fig.2, Fig.3).
Fig. 1 Morphological Phylogeny. The morphological phylogeny is showing the 16-different species of fish,
and their synapomorphic distinctions. From the table, it is shown the morphologically, the Sea Lamprey is
most distinct to pollens Cichlid. Not all possible traits are shown by the phylogeny.

The Genetic and Morphological Evolution of Fish through the Protein Cytochrome C Oxidase
www.ijlsci.in Int. J. of Life Sciences, Vol. 5(3) September 2017 335
Fig. 2 Protein-Derived Phylogeny. This is the phylogeny that was derived using the protein comparisons of
COX 1 from the 16 species of fish. The data demonstrates that the first species, the Sea Lamprey is an outlier
from the rest of the fish.
Fig. 3 Final Phylogeny. This is the final phylogeny that was made by combining the morphological phylogeny and
the protein derived phylogeny. The final phylogeny demonstrates the impformation that Tiktaalik is closely
related to pollens Cichlid.

Sammer Marzouk, 2017
336 Int. J. of Life Sciences, Vol. 5(3) September, 2017
Table 2 : Morphological data was combined with the protein-sequence of Cytochrome C Oxidase Subunit 1 (COX1) from the 16 species of fish
Sea
Do
gfis
h
Sea
Lam
pre
y
Sad
dle
d
Bic
hir
Pad
dle
fish
Gh
ost
Sh
ark
Co
elac
anth
Bo
wfi
n
Po
llen
`s
Cic
hli
d
Tik
taal
ik
Ro
pef
ish
Gre
at
Wh
ite
Sh
ark
Axo
lotl
Cu
vie
r's
Bic
hir
Ru
ssia
n
Stu
rgeo
n
Au
stra
lian
L
un
gfis
h
Go
ldfi
sh
Sea Dogfish
100% 87.3/ 97.9
90.4/ 98
92.4/ 98.4
90.9/ 97.7
89.5/ 97.7
90.7/ 98.3
92.2/ 98.6
91.6/ 98.4
94.2/ 98.5
89.3/ 97.9
90.8/ 98.6
92.4/ 98.6
91.9/ 98.6
93/ 98.6
Sea Lamprey
87.3/ 97.9
100% 87.9/ 96.5
88.9/ 97.5
87.6/ 96.3
89.1/ 97.3
88.3/ 97.3
88.1/ 97.1
87.9/ 96.9
86.3/ 97.
86.2/ 96.5
88.3/ 96.9
89.1/ 97.9
86.9/ 97.7
88.9/ 97.5
Saddled Bichir
90.4/ 98
87.9/ 96.5
100% 92.4/ 98.6
90.6/ 98
91.5/ 98.3
91.7/ 98.6
92.6/ 98.3
98.5/ 99.6
90.4/ 98.2
90.3/ 97.7
98.6/ 99.4
92.6/ 99.2
91.6/ 99
92.2/ 98.8
Paddlefish 92.4/ 98.4
88.9/ 97.5
92.4/ 98.6
100% 90.5/ 98.6
93.8/ 99
95.1/ 99.4
95.3/ 99.6
93.4/ 99
91.2/ 98.1
89.1/ 97.5
90.8/ 98.2
98.5/ 99.8
93.2/ 99.6
95.9/ 99.4
Ghost Shark
90.9/ 97.7
87.6/ 96.3
90.6/ 98
90.5/ 98.6
100% 91/ 98.2
90/ 98.4
91.1/ 98.4
90.6/ 98.2
91.2/ 98.1
89.1/ 97.5
90.8/ 98.2
90.9/ 98.8
91.1/ 98.8
90.1/ 98.3
Coelacanth 89.5/ 97.7
89.1/ 97.3
91.5/ 98.3
93.8/ 99
91/ 98.2
100% 92.2/ 98.8
93.4/ 99
92/ 98.2
89.5/ 97.9
90.8/ 98.6
92/ 98.4
93.8/ 99.2
93.8/ 98.8
92.8/ 98.8
Bowfin 90.7/ 98.3
88.3/ 97.3
91.7/ 98.6
95.1/ 99.4
90/ 98.4
92.2/ 98.8
100% 93.6/ 99.2
93/ 99.2
89.9/ 98.3
91.6/ 98.4
92.4/ 98.8
95.1/ 99.6
92.4/ 99.2
93.4/ 99
Pollen`s Cichlid
92.2/ 98.6
88.1/ 97.1
92.6/ 98.3
95.3/ 99.6
91.1/ 98.4
93.4/ 99
93.6/ 99.2
100% 93.9/ 99
92.2/ 99
93.6/ 98.6
93.8/ 98.8
95.9/ 99.8
94.7/ 99.4
94.9/ 994
Tiktaalik 100%
Ropefish 91.6/ 98.4
87.9/ 96.9
98.5/ 99.6
93.4/ 99
90.6/ 98.2
92/ 98.2
93/ 99.2
93.9/ 99
100% 91/ 98.6
90.8/ 98.2
98.6/ 99.8
95.9/ 99.6
91.5/ 99
92/ 98.8
Great White Shark
94.2/ 98.5
86.3/ 97.1
90.4/ 98.2
91.2/ 99
91.2/ 98.1
89.5/ 97.9
89.9/ 98.3
92.2/ 99
91/ 98.6
100% 89.3/ 97.9
90.6/ 98.8
91.9/ 98.6
92.2/ 99
91.8/ 99
Axolotl 89.3/ 97.9
86.2/ 96.5
90.3/ 97.7
92.4/ 98.9
89.1/ 97.5
90.8/ 98.6
91.6/ 98.4
93.6/ 98.6
90.8/ 98.2
89.3/ 97.9
100% 91.4/ 98.4
92.8/ 99
91.2/ 98.6
91.8/ 99
Cuvier's Bichir
90.8/ 98.6
88.3/ 96.9
98.6/ 99.4
93.2/ 99.2
90.8/ 98.2
92/ 98.4
92.4/ 98.8
93.8/ 98.8
98.6/ 99.8
90.6/ 98.8
91.4/ 98.4
100% 92.8/ 99
93/ 99.6
93/ 99.4
Russian Sturgeon
92.4/ 98.6
89.1/ 97.9
92.6/ 99.2
98.5/ 99.8
90.9/ 98.8
93.8/ 99.2
95.1/ 99.6
95.9/ 99.8
93.6/ 99.6
91.9/ 98.6
92.8/ 99
95.9/ 99.6
100% 94.2/ 99.8
95.9/ 99.6
Australian Lungfish
91.9/ 98.6
86.9/ 97.7
91.6/ 99
93.2/ 99.6
91.1/ 98.8
93.8/ 98.8
92.4/ 99.2
94.7/ 99.4
91.5/ 99
92.2/ 99
91.2/ 98.6
93/ 99.6
94.2/ 99.8
100% 93/ 99.6
Goldfish 93/ 98.6
88.9/ 97.5
92.2/ 98.8
95.9/ 99.4
90.1/ 98.3
92.8/ 98.8
93.4/ 99
94.9/ 994
93.2/ 99.2
92/ 98.8
91.8/ 99
93/ 99.4
95.9/ 99.6
93/ 99.6
100%
T
he G
enetic a
nd
Mo
rph
olo
gica
l Evo
lutio
n o
f Fish
thro
ug
h th
e Pro
tein C
ytoch
rom
e C O
xida
se
ww
w.ijlsci.in
Int. J. o
f Life Scien
ces, Vo
l. 5(3
) Septem
ber 2
01
7 3
36

The Genetic and Morphological Evolution of Fish through the Protein Cytochrome C Oxidase
www.ijlsci.in Int. J. of Life Sciences, Vol. 5(3) September 2017 337
Table 3 : The morphological characteristics that the species of fish might or might not have
Feature
Spin
y
Do
gfis
h
Sea
Lam
pre
y
Sad
dle
d
Bic
hir
Pad
dle
fish
Gh
ost
Sh
ark
Co
elac
anth
Bo
wfi
n
Po
llen
’s
Cic
hli
d
Tik
taal
ik
Ro
pef
ish
gills Y Y Y Y Y Y Y Y Y Y
spiracles Y Y Y Y Y Y Y Y Y Y
Cartilage skeleton Y Y Y Y Y Y Y Y Y Y
jaws Y N Y Y Y Y Y Y Y Y
Paired appendages Y N Y Y Y Y Y Y Y Y
Placoid scales Y N Y Y Y Y Y Y Y Y
Jelly filled swim bladder
N N Y N N Y Y Y Y Y
Scales reduced N N Y N N Y Y Y Y Y
Air filled swim bladder
N N Y N N Y Y Y Y Y
Ossification of skeleton
N N Y N N Y Y Y Y Y
Cycloid skeleton N N Y N N Y Y Y Y Y
Swimbladder used as lung
N N N N N Y N N Y N
Cosmoid scales N N N N N Y N N Y N
Ganoid scales N N Y N N N N N N Y
Lobed fins N N Y N N Y Y Y N Y
Dorsoventral flattening
N N Y N N N N Y N Y
Pectoral girdle extension
N N Y N N N N Y N Y
elasmobranch Y N N N N N N N N N
Tetrapod limbs N N N N N N N N Y N
Pectoral walking N N Y N N N N N N N
Morphologically, A.mexicanum, and T.roseae share the
synapomorphies of tetrapod limbs, lobed fins, cosmoid
scales, an air-filled swim bladder, an ossified skeleton,
cycloid scales, a reduced amount of scales, jaws, paired
appendages, and having a cartilage skeleton (Fig. 1).
Since T.roseae is an extinct species, no protein
sequence of COX1 from T.roseae was available (Fig. 2).
Only the morphological phylogeny could be used to
infer where T.roseae goes on the final phylogeny (Fig.
1). In the final phylogeny, when the data from the
previous phylogenies were combined, it was shown
that A.mexicanum and T.roseae, both from protein
comparisons and morphological traits, shared a
common ancestor (Fig.1, Fig.2, Fig.3).
In the morphological phylogeny, it is shown that
A.gueldenstaedtii and P.spathula are in the same clade
as they both have jelly-filled swim bladders, jaws,
paired appendages, placoid scales, gills, spiracles, and
cartilage skeletons (Fig. 1). And in the protein-derived
phylogeny, it is shown that A.gueldenstaedtii and
P.spathula have a 98.5 percent identity with each
other.(Fig. 2). In the final phylogeny, it was shown that
A.gueldenstaedtii and P.spathula with the 98.5 percent
identity and the similar synapomorphies are related
and have once shared a common ancestor (Table 2).
The third conclusion derived from the data is that
P.marinus and S.acanthias are the outliers of the
phylogeny (Fig.1). In the morphological phylogeny,
P.marinus and S.acanthias were shown to share many
similar synapomorphies (Fig. 1). These include gills,
spiracles, and cartilage skeletons (Fig. 1). But in the
protein-derived phylogeny, it was demonstrated that
the COX1 comparison between the two species of fish
yield an 87.3 percent identity (Table 2). This is a high
Sammer Marzouk, 2017
338 Int. J. of Life Sciences, Vol. 5(3) September, 2017
average, but compared to the other relationships, such
as S.acanthias and A.gueldenstaedtii sharing a 90.4
percent identity, and P.marinus and P.pollen, who
morphologically are different, only sharing three
synapomorphies by having a 90.8 percent identity
(Fig.1, Fig.5). In the final phylogeny, it was decided
that S.acanthias and A.gueldenstaedtii would be the
outliers of the group, because the protein-derived data
was more accurately studied, and the synapomorphies
could be modified in a way to change the position of
any of the two fish (Fig. 3). These three conclusions
were the three main results. Another finding revealed
that all of the 16 fish species are all related (Table 2).
Of the 15 COX1 protein sequences that were available,
all of them had an percent identity greater than 88%
(Table 2). Morphologically, the species of fish are
shown to all have similar traits, except P.marinus,
which is shown to be the outlier of the group (Table 2).
Tis information correlates to the protein-derived
phylogeny in which P.marinus is also the outlier of the
clade, and also in the final phylogeny in which
P.marinus is the outlier of the clade (Fig.1, Fig.2, Fig.3).
S.acanthias is also shown to be constant in its position
in all three phylogenies. In the morphological, protein-
derived, and final phylogenies, S.acanthias was shown
to always be in the same clade as C.carcharias (Fig.1,
Fig.2, Fig.3). Every species on the morphological and
protein-derived phylogeny were in the same position
in the final phylogeny except P.senegalus, P. Endlicheri
and A.calva (Fig.1, Fig.2, Fig.3). In protein-derived
phylogeny, it was demonstrated that P. Endlicheri was
similar to P.senegalus while in the morphological
phylogeny, it was demonstrated that C.milii and A.calva
were more related P.senegalus then P. Endlicheri was
(Fig.1, Fig.2, Fig.3).
DISCUSSION
In an effort to build a phylogeny that demonstrates a
link between fish and tetrapods, COX1 from 16
different species was sequenced and made into a
protein-derived phylogeny (Fig. 3). This phylogeny
was combined with a morphological phylogeny with
21 synapomorphies of the 16 species of fish to make a
final phylogeny (Fig. 1). From this final phylogeny,
three main conclusion were derived: A.mexicanum and
T.roseae share a common ancestor; A.gueldenstaedtii
and P.spathula both share a common ancestor; and
P.marinus and S.acanthias are the outliers of the
phylogeny. The first conclusion which was Axolotl
(Ambystoma mexicanum) and Tiktaalik (Tiktaalik
roseae) share a common ancestor was derived from
the morphological phylogeny (Fig. 1). In the
morphological phylogeny, both A.mexicanum and
T.roseae formed a clade, and shared 15
synapomorphies (Fig. 1). In the protein-derived
phylogeny, there was no evidence of a relationship
between A.mexicanum and T.roseae as T.roseae is
extinct (Fig. 2). A.mexicanum and T.roseae have been
shown to share many synapomorphies (Ericsson et al.,
2012). A.mexicanum and T.roseae both share a specific
organization of neck muscles, which goes around their
gills and allows them to move the head (Ericsson et
al., 2012). A.mexicanum and T.roseae also both share
appendicular skeleton which connect to their neck
muscles (Ericsson et al., 2012). A.mexicanum and
T.roseae have both been shown to be closely related as
they have been put on the same clade on
morphological phylogenies (Shubin et al., 2014).
A.mexicanum and T.roseae share a unique pelvic girdle
and fin that allows for movement, and it is
demonstrated that T.rosales pelvic girdle was a
transitional phase for A.mexicanums pelvic girdle
(Shubin et al., 2014). The second conclusion was that
A.gueldenstaedtii and P.spathula both share a common
ancestor, which was derived from the morphological
and protein-based phylogeny (Fig.1, Fig. 2). In the
morphological phylogeny, A.gueldenstaedtii and
P.spathula were in the same clade and shared 8
synapomorphies (Fig. 1). In the protein-derived
phylogeny, A.gueldenstaedtii and P.spathula shared a
98.5 percent identity (Table 2). Morphologically, it is
supported that A.gueldenstaedtii and P.spathula are
related as they both have eggs with funnels and clear
groves (Ludwig, 2008). Also, A.gueldenstaedtii and
P.spathula share the same sized micropylar opening
(Ludwig, A, 2008). Genetically the data is supported as
A.gueldenstaedtii and P.spathula have similar
heteroplasmic movements in the mtDNA control
region (Wang et al., 2010). This allows both species to
have lengths of central units 78-83 bp (Wang et al.,
2010). The conclusion that A.gueldenstaedtii and
P.spathula are related shown through the fact that
A.gueldenstaedtii and P.spathula are in the same
Kingdom, Phylum, Superclass, Class, and order (Carroll
R, 1998). This demonstrates a support for the claim
that A.gueldenstaedtii and P.spathula are closely
related (Carroll, 1998). The third conclusion was that
P.marinus and S.acanthias are the outliers of the
phylogeny, which was derived from the morphological
and protein-derived phylogeny (Fig. 2, Fig. 3). In the

The Genetic and Morphological Evolution of Fish through the Protein Cytochrome C Oxidase
www.ijlsci.in Int. J. of Life Sciences, Vol. 5(3) September 2017 339
morphological phylogeny, P.marinus and S.acanthias
share three synapomorphies, and were in different
clades (Fig. 1). In the protein-derived phylogeny,
P.marinus and S.acanthias share an 87.3 percent
identity (Fig. 2). This is the lowest percent identity of
the 15 species of fish that had a COX1 protein
sequence available (Table 2). It is supported that
P.marinus and S.acanthias are morphologically
different, as P.marinus and S.acanthias have different
secretory granule compositions (Wilson et al., 2002).
P.marinus and S.acanthias also have a different type of
microfilament network (Wilson et al., 2002).
Genetically, the claim that P.marinus and S.acanthias
are outliers of the fish phylogeny is supported. It has
been shown that P.marinus and S.acanthias have
different gas transfer rates due to the difference in
respiratory system IV (Randall, 1995). And it has been
demonstrated that P.marinus and S.acanthias are both
in genetically separate groups, which share a 0.400
similarly plasma level rate (Steve et al., 1998).
P.marinus and S.acanthias are also shown to be put
into separate clades (Grim et al., 2011). P.marinus and
S.acanthias are demonstrated to be not very related, as
they are in different classes, subclasses, orders,
families and genuses (Grim et al., 2011). This finding
that P.marinus and S.acanthias shown to be a support
for the idea that P.marinus and S.acanthias are not very
related (Grimm et al., 2011).
Table 4: The protein sequence of the fish was derived from an online public genomic database
Spiny Dogfish:
>sp|Q9ZZ52|COX1_SQUAC Cytochrome c oxidase subunit 1 OS=Squalus acanthias GN=MT-CO1 PE=3 SV=1
MAINRWFFSTNHKDIGTLYLIFGAWAGMVGTALSLLIRAELSQPGTLLGDDQIYNVIVTA
HAFVMIFFMVMPVMIGGFGNWLVPLMIGAPDMAFPRMNNMSFWLLPPSLLLLLASAGVEA
GAGTGWTVYPPLAGNMAHAGASVDLAIFSLHLAGISSILASINFITTIINMKPPAISQYQ
TPLFVWSILVTTILLLLSLPVLAAAITMLLTDRNLNTTFFDPAGGGDPILYQHLFWFFGH
PEVYILILPGFGMISHVVAYYSGKKEPFGYMGMVWAMMAIGLLGFIVWAHHMFTVGMDVD
TRAYFTSATMIIAIPTGVKVFSWLATLHGGSIKWETPLLWALGFIFLFTVGGLTGIVLAN
SSLDIVLHDTYYVVAHFHYVLSMGAVFAIMAGFIHWFPLFSGYTLHSTWTKTQFLVMFIG
VNLTFFPQHFLGLAGMPRRYSDYPDAYALWNTVSSIGSLISLVAVIMFLFIIWEAFAPSG
KVLSVELPHTNVEWLHGCPPPYHTYEEPAFVQVQRTYF
Sea Lamprey
>sp|Q35536|COX1_PETMA Cytochrome c oxidase subunit 1 OS=Petromyzon marinus GN=MT-CO1 PE=3 SV=1
MTHIRWLFSTNHKDIGTLYLIFGAWAGMVGTALSILIRAELSQPGTLLGDDQIFNVIVTA
HAFVMIFFMVMPIMIGGFGNWLVPLMLGAPDMAFPRMNNMSFWLLPPSLLLLLASAGVEA
GAGTGWTVYPPLAGNLAHTGASVDLTIFSLHLAGVSSILGAVNFITTIFNMKPPTMTQYQ
TPLFVWSVLITAVLLLLSLPVLAAAITMLLTDRNLNTSFFDPAGGGDPILYQHLFWFFGH
PEVYILILPGFGIISHVVAYYAGKKEPFGYMGMVWAMMAIGLLGFIVWAHHMFTVGMDVD
TRAYFTSATMIIAIPTGVKVFSWLATLHGGKIVWHTPMLWALGFIFLFTVGGLTGIVLSN
SSLDIILHDTYYVVAHFHYVLSMGAVFAIMAGFVHWFPLFTGYTLNETWAKAHFIIMFAG
VNLTFFPQHFLGLAGMPRRYSDYPDAYTTWNIISSIGSTVSLIAVMLFMFILWEAFSAKR
KAIATDLLNTNLEWLHGCPPPYHTYEEPAFVQTNFKK
Saddled Bichir:
>tr|F2W4F6|F2W4F6_9ACTI Cytochrome c oxidase subunit 1 OS=Polypterus endlicherii congicus GN=COX1 PE=3
SV=1
MTITRWLFSTNHKDIGTLYLIFGAWAGMVGTALSLLIRAELGQPGALMGDDQIYNVIVTA
HAFVMIFFMVMPIMIGGFGNWLVPLMIGAPDMAFPRMNNMSFWLLPPSLLLLLTSSAVEA
GVGTGWTVYPPLAGNLAHAGASVDLAIFSLHLAGVSSILGAINFITTIINMKSPSTSQYQ
TPLFVWSVLVTAILLLLSLPVLAAGITMLLTDRNLNTTFFDPAGGGDPILYQHLFWFFGH
PEVYILILPGFGMISHIVAYYSGKNEPFGYMGMVWAMMAIGLLGFIVWAHHMFTVGMDVD
TRAYFTSATMIIAIPTGVKVFSWLATLHGGAIKWETPMLWALGFIFLFTVGGLTGIILAN
SSLDIMLHDTYYVVAHFHYVLSMGAVFAIMGGFVHWFPLFSGYTLHPTWTKIHFGIMFIG

Sammer Marzouk, 2017
340 Int. J. of Life Sciences, Vol. 5(3) September, 2017
VNLTFFPQHFLGLAGMPRRYSDYPDAYTLWNSLSSIGSMISLTAVIMFLFILWEAFAAKR
EVQMVNLTYTNVEWLHGCPPPYHTYEEPAFVQSPQARE
Paddlefish:
>tr|Q8HMQ8|Q8HMQ8_POLSP Cytochrome c oxidase subunit 1 OS=Polyodon spathula GN=COI PE=3 SV=1
MAITRWFFSTNHKDIGTLYLVFGAWAGMVGTALSLLIRAELSQPGALLGDDQIYNVIVTA
HAFVMIFFMVMPIMIGGFGNWLVPLMIGAPDMAFPRMNNMSFWLLPPSFLLLLASSGVEA
GAGTGWTVYPPLAGNLAHAGASVDLTIFSLHLAGVSSILGAINFITTIINMKPPAVFQYQ
TPLFVWSVLVTAVLLLLSLPVLAAGITMLLTDRNLNTTFFDPAGGGDPILYQHLFWFFGH
PEVYILILPGFGMISHIVAYYAGKKEPFGYMGMVWAMMAIGLLGFIVWAHHMFTVGMDVD
TRAYFTSATMIIAIPTGVKVFSWLATLHGGSIKWDTPLLWALGFIFLFTVGGLTGIVLAN
SSLDIVLHDTYYVVAHFHYVLSMGAVFAIMGAFVHWFPLFTGYTLHSTWSKIHFAVMFVG
VNLTFFPQHFLGLAGMPRRYSDYPDAYALWNTVSSVGSLISLIAVIMFLFILWEAFAAKR
EVLSVELTATNVEWLHGCPPPYHTYEEPAFVQVQSTN
Ghost Shark:
>tr|D7RWS9|D7RWS9_CALMI Cytochrome c oxidase subunit 1 OS=Callorhinchus milii GN=COX1 PE=3 SV=1
MTINRWLFSTNHKDIGTLYLLFGAWAGMVGTALSLLIRAELSQPGALMGDDQIYNVIVTA
HAFVMIFFMVMPIMIGGFGNWLIPLMIGAPDMAFPRMNNMSFWLLPPSFLLLLASAGVEA
GAGTGWTVYPPLAGNLAHAGASVDLTIFSLHLAGISSILASINFITTIINMKPPSITQYQ
TPLFVWSILITTILLLLSLPVLAAGITMLLTDRNLNTTFFDPAGGGDPILYQHLFWFFGH
PEVYILILPGFGMISHVVTYYSGKKEPFGYMGMVWAMMAIGLLGFIVWAHHMFTVGMDVD
TRAYFTSATMIIAIPTGVKVFSWLATLHGGNIKWDTPMLWALGFIFLFTVGGLTGIVLAN
SSLDIVLHDTYYVVAHFHYVLSMGAVFAIMAGLVHWFPLFTGYTLHETWTKIHFGLMFIG
VNLTFFPQHFLGLAGMPRRYSDYPDAYTLWNSVSSIGSLMSLLAVILFLFILWEAFASKR
TLSHVMMSSTNNEWLHGCPPPHHTFEEPAFVQIQVNKKG
Coelacanth:
>sp|O03167|COX1_LATCH Cytochrome c oxidase subunit 1 OS=Latimeria chalumnae GN=MT-CO1 PE=3 SV=1
MMITRWLFSTNHKDIGTLYMIFGAWAGMVGTALSLLIRAELSQPGALLGDDQIYNVVVTA
HAFVMIFFMVMPIMIGGFGNWLIPLMIGAPDMAFPRMNNMSFWLLPPSLLLLLASSGVEA
GAGTGWTVYPPLAGNLAHAGASVDLTIFSLHLAGVSSILGAINFITTVINMKPPTMTQYQ
TPLFIWSVLVTAVLLLLSLPVLAAGITMLLTDRNLNTTFFDPAGGGDPILYQHLFWFFGH
PEVYILILPGFGMISHIVAYYSGKKEPFGYMGMVWAMMAIGLLGFIVWAHHMFTVGMDVD
TRAYFTSATMIIAIPTGVKVFSWLATLHGGVTKWDTPLLWALGFIFLFTVGGLTGIVLAN
SSLDIILHDTYYVVAHFHYVLSMGAVFAIMGGLVHWFPLMTGYTLHNTWTKIHFGVMFTG
VNLTFFPQHFLGLAGMPRRYSDYPDAYTLWNTVSSIGSLISLIAVIMFMFILWEAFSAKR
EVLIVEMTTTNVEWLHGCPPPHHTYEEPAFVQAPR

The Genetic and Morphological Evolution of Fish through the Protein Cytochrome C Oxidase
www.ijlsci.in Int. J. of Life Sciences, Vol. 5(3) September 2017 341
Bowfin:
>tr|Q8HQL9|Q8HQL9_AMICA Cytochrome c oxidase subunit 1 OS=Amia calva GN=COI PE=3 SV=1
MTITRWFFSTNHKDIGTLYLVFGAWAGMVGTALSLLIRAELSQPGALLGDDQIYNVIVTA
HAFVMIFFMVMPVMIGGFGNWLVPLMIGAPDMAFPRMNNMSFWLLPPSFLLLLASSGVEA
GAGTGWTVYPPLASNLAHAGASVDLTIFSLHLAGVSSILGAINFITTIINMKPPAASQYQ
TPLFVWSVLITAVLLLLSLPVLAAGITMLLTDRNLNTTFFDPAGGGDPILYQHLFWFFGH
PEVYILILPGFGMVSHIVAYYAGKKEPFGYMGMVWAMMAIGLLGFIVWAHHMFTVGMDVD
TRAYFTSATMVIAIPTGVKVFSWLATLHGGAIKWETPLLWALGFIFLFTVGGLTGIVLAN
SSLDIVLHDTYYVVAHFHYVLSMGAVFAIMGGFVHWFPLFSGYTLHPTWSKIHFGVMFVG
VNLTFFPQHFLGLAGMPRRYSDYPDAYTLWNTVSSIGSLVSLIAVVMFLFMLWEAFAAKR
EVLAVEYAATNVEWLHGCPPPYHTYEEPAYVQAHRA
Pollen`s Cichlid:
>tr|B5DCF6|B5DCF6_9CICH Cytochrome c oxidase subunit 1 OS=Paratilapia polleni GN=CO1 PE=3 SV=1
MAITRWFFSTNHKDIGTLYLVFGAWAGMVGTALSLLIRAELSQPGSLLGDDQIYNVIVTA
HAFVMIFFMVMPIMIGGFGNWLIPLMIGAPDMAFPRMNNMSFWLLPPSFLLLLASSGVEA
GAGTGWTVYPPLAGNLAHAGPSVDLTIFSLHLAGVSSILGAINFITTIINMKPPAISQYQ
TPLFVWSVLITAVLLLLSLPVLAAGITMLLTDRNLNTTFFDPAGGGDPILYQHLFWFFGH
PEVYILILPGFGMISHIVAYYSGKKEPFGYMGMVWAMMAIGLLGFIVWAHHMFTVGMDVD
TRAYFTSATMIIAIPTGVKVFSWLATLHGGAIKWDTPLLWALGFIFLFTVGGLTGIVLAN
SSLDIMLHDTYYVVAHFHYVLSMGAVFAIVGGFVHWFPLFSGYTLHSTWTKIHFGVMFIG
VNLTFFPQHFLGLAGMPRRYSDYPDAYTLWNTVSSIGSMISLVAVIMFLFIIWEAFAAKR
EVLSAELTTTNAEWLHGCPPPYHTFEEPAFVQVQQA
Ropefish:
>tr|Q8HMU1|Q8HMU1_ERPCA Cytochrome c oxidase subunit 1 OS=Erpetoichthys calabaricus GN=COI PE=3 SV=1
MTITRWLFSTNHKDIGTLYLIFGAWAGMVGTALSLLIRAELGQPGALMGDDQIYNVIVTA
HAFVMIFFMVMPIMIGGFGNWLVPLMIGAPDMAFPRMNNMSFWLLPPSFLLLLTSSAVEA
GVGTGWTVYPPLAGNLAHAGASVDLAIFSLHLAGVSSILGAINFITTIINMKPPATSQYQ
TPLFVWSVLVTAVLLLLSLPVLAAGITMLLTDRNLNTTFFDPAGGGDPILYQHLFWFFGH
PEVYILILPGFGMISHIVAYYSGKNEPFGYMGMVWAMMAIGLLGFIVWAHHMFTVGMDVD
TRAYFTSATMIIAIPTGVKVFSWLATLHGGAIKWETPMLWALGFIFLFTVGGLTGIILAN
SSLDIMLHDTYYVVAHFHYVLSMGAVFAIMGGFVHWFPLFSGYTLHPTWTKIHFGVMFIG
VNLTFFPQHFLGLAGMPRRYSDYPDAYTLWNSLSSIGSMISLTAVIMFLFILWEAFAAKR
EVQTVNLTYTNVEWLHGCPPPYHTYEEPAFVQSPNSRE
Great White Shark:
>tr|I1U3D7|I1U3D7_CARCH Cytochrome c oxidase subunit 1 OS=Carcharodon carcharias PE=3 SV=1
MAINRWLFSTNHKDIGTLYLIFGAWAGMVGTALSLLIRAELGQPGSLLGDDQIYNVIVTA
HAFVMIFFMVMPIMIGGFGNWLVPLMIGAPDMAFPRMNNMSFWLLPPSFLLLLASAGVEA
GAGTGWTVYPPLASNLAHAGPSVDLAIFSLHLAGISSILASINFITTIINMKPPAISQYQ
TPLFVWSILVTTILLLPALPVLAAGITMLLTDRNLNTTFFDPAGGGDPILYQHLFWFFGH
PEVYILILPGFGMISHVVAYYSGKKEPFGYMGMVWAMMAIGLLGFIVWAHHMFTVGMDVD
TRAYFTSATMIIAIPTGVKVFSWLATLHGGTIKWDTPLLWALGFIFLFTVGGLTGIVLAN
SSLDIVLHDTYYVVAHFHYVLSMGAVFAIMAGFIHWFPLMSGFTLHQTWTKIQFTVMFIG
VNLTFFPQHFLGLAGMPRRYSDYPDAYTLWNAISSIGSLISLVAVIMLLFIIWEAFASKR
EVLSIELPHTNVEWLHGCPPPYHTYEEPAFVQIQRPSF

Sammer Marzouk, 2017
342 Int. J. of Life Sciences, Vol. 5(3) September, 2017
Axolotl:
>tr|Q70EE6|Q70EE6_AMBME Cytochrome c oxidase subunit 1 OS=Ambystoma mexicanum GN=COI PE=3 SV=1
MMITRWLFSTNHKDIGTLYLVFGAWAGMVGTALSLLIRAELSQPGALLGDDQIYNVIVTA
HAFVMIFFMVMPVMIGGFGNWLVPLMIGAPDMAFPRMNNMSFWLLPPSFLLLLASSGVEA
GAGTGWTVYPPLAGNLAHAGASVDLTIFSLHLAGVSSILGAINFITTSINMKPASMSQYQ
TPLFVWSVLITAVLLLLSLPVLAAGITMLLTDRNLNTTFFDPAGGGDPVLYQHLFWFFGH
PEVYILILPGFGMISHIVTYYSAKKEPFGYMGMVWAMMSIGLLGFIVWAHHMFTVDLNVD
TRAYFTSATMIIAIPTGVKVFSWLATMHGGAIKWDAAMLWALGFIFLFTVGGLTGIVLAN
SSLDIVLHDTYYVVAHFHYVLSMGAVFAIMGGFVHWFPLFSGYTLHSTWSKIHFGVMFIG
VNLTFFPQHFLGLAGMPRRYSDYPDAYTLWNTVSSIGSLISLVAVIMMMFIIWEAFASKR
EVLSTELTSTNIEWLHNCPPPYHTFEEPSFVQSRI
Cuvier's Bichir:
>tr|Q8HMS1|Q8HMS1_POLSE Cytochrome c oxidase subunit 1 OS=Polypterus senegalus senegalus GN=COI PE=3
SV=1
MTITRWLFSTNHKDIGTLYLIFGAWAGMVGTALSLLIRAELGQPGALMGDDQIYNVIVTA
HAFVMIFFMVMPIMIGGFGNWLVPLMIGAPDMAFPRMNNMSFWLLPPSLLLLLTSSAVEA
GVGTGWTVYPPLAGNLAHAGASVDLAIFSLHLAGVSSILGAINFITTIINMKPPSTSQYQ
TPLFVWSVLITAVLLLLSLPVLAAGITMLLTDRNLNTTFFDPAGGGDPILYQHLFWFFGH
PEVYILILPGFGMISHIVAYYSGKNEPFGYMGMVWAMMAIGLLGFIVWAHHMFTVGMDVD
TRAYFTSATMIIAIPTGVKVFSWLATLHGGAIKWETPMLWALGFIFLFTVGGLTGIILAN
SSLDIMLHDTYYVVAHFHYVLSMGAVFAIMGGFVHWFPLFSGYTLHSTWTKIHFGVMFIG
VNLTFFPQHFLGLAGMPRRYSDYPDAYTLWNSLSSIGSMISLTAVIMFLFILWEAFAAKR
EVQTVELTYTNVEWLHGCPPPYHTYEEPAFVQSPQARE
Russian Sturgeon:
>tr|C1J916|C1J916_ACIGU Cytochrome c oxidase subunit 1 OS=Acipenser gueldenstaedtii GN=cox1 PE=3 SV=1
MAITRWFFSTNHKDIGTLYLVFGAWAGMVGTALSLLIRAELSQPGALLGDDQIYNVIVTA
HAFVMIFFMVMPIMIGGFGNWLVPLMIGAPDMAFPRMNNMSFWLLPPSFLLLLASSGVEA
GAGTGWTVYPPLAGNLAHAGASVDLTIFSLHLAGVSSILGAINFITTIINMKPPAVSQYQ
TPLFVWSVLITAVLLLLSLPVLAAGITMLLTDRNLNTTFFDPAGGGDPILYQHLFWFFGH
PEVYILILPGFGMISHIVAYYAGKKEPFGYMGMVWAMMAIGLLGFIVWAHHMFTVGMDVD
TRAYFTSATMIIAIPTGVKVFSWLATLHGGSIKWDTPLLWALGFIFLFTVGGLTGIVLAN
SSLDIVLHDTYYVVAHFHYVLSMGAVFAIMGAFVHWFPLFTGYTLHGTWSKIHFAVMFVG
VNLTFFPQHFLGLAGMPRRYSDYPDAYALWNTVSSIGSLISLVAVIMFLFILWEAFAAKR
EVMSVELTTTNVEWLHGCPPPYHTYEEPAFVQVQSTS
Australian Lungfish:
>tr|Q94XJ5|Q94XJ5_NEOFS Cytochrome c oxidase subunit 1 OS=Neoceratodus forsteri GN=COX1 PE=3 SV=1
MTITRWFFSTNHKDIGTLYMIFGAWAGMVGTALSLLIRAELSQPGALLGDDQIYNVLVTA
HAFVMIFFMVMPIMIGGFGNWLIPLMIGAPDMAFPRMNNMSFWLLPPSFLLLLASSGVEA
GAGTGWTVYPPLAGNLAHAGASVDLTIFSLHLAGVSSILGSINFITTIINMKPPAISQYQ
TPLFIWSVMITTILLLLSLPVLAAGITMLLTDRNLNTTFFDPAGGGDPILYQHLFWFFGH
PEVYILILPGYGMISHIVAYYSGKKEPFGYMGMVWAMMAIGLLGFIVWAHHMFTVGMDVD
TRAYFTSATMIIAIPTGVKVFSWLATLHGGSIKWETPLLWALGFIFLFTVGGLTGIVLAN
SSLDIVLHDTYYVVAHFHYVLSMGAVFAIMGGFVHWFPLMTGYTLHNTWTKIHFGVMFIG
VNLTFFPQHFLGLAGMPRRYSDYPDAYTLWNTVSSIGSLISLVAVIMLLFIIWEAFAAKR
EVMSIELSPTNVEWLHGCPPPHHTFEEPAFVQVQTSQR
The Genetic and Morphological Evolution of Fish through the Protein Cytochrome C Oxidase
www.ijlsci.in Int. J. of Life Sciences, Vol. 5(3) September 2017 343
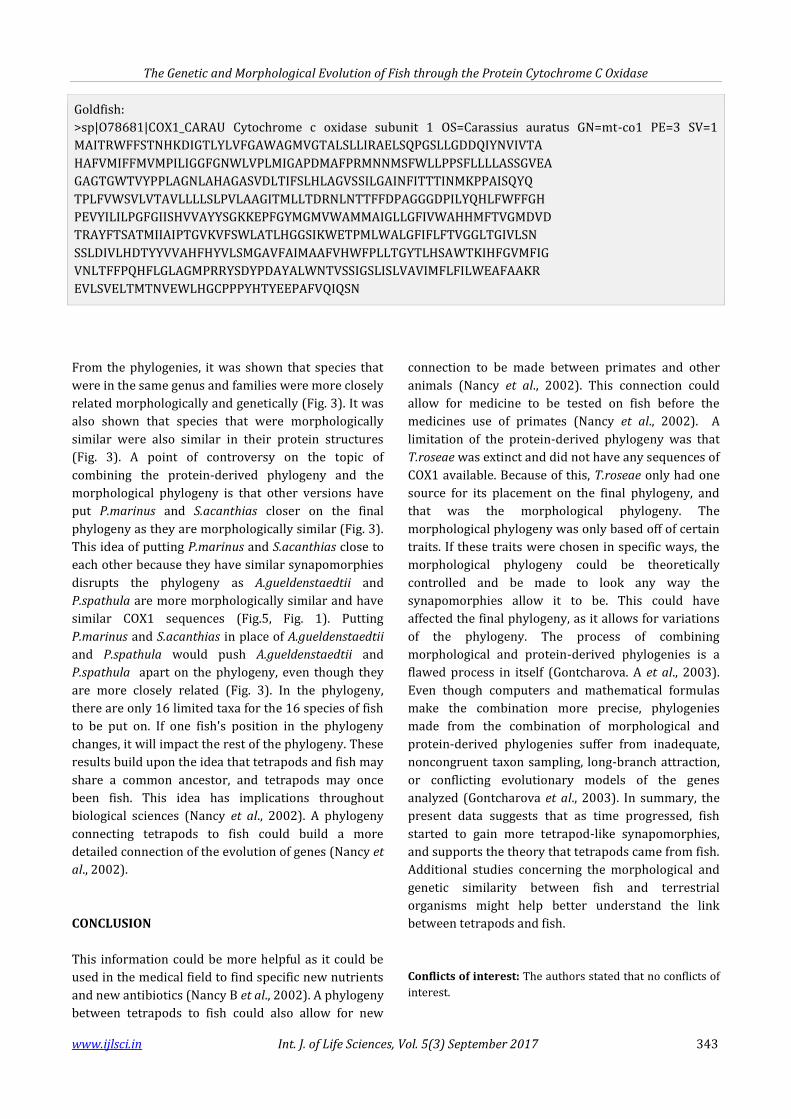
Goldfish:
>sp|O78681|COX1_CARAU Cytochrome c oxidase subunit 1 OS=Carassius auratus GN=mt-co1 PE=3 SV=1
MAITRWFFSTNHKDIGTLYLVFGAWAGMVGTALSLLIRAELSQPGSLLGDDQIYNVIVTA
HAFVMIFFMVMPILIGGFGNWLVPLMIGAPDMAFPRMNNMSFWLLPPSFLLLLASSGVEA
GAGTGWTVYPPLAGNLAHAGASVDLTIFSLHLAGVSSILGAINFITTTINMKPPAISQYQ
TPLFVWSVLVTAVLLLLSLPVLAAGITMLLTDRNLNTTFFDPAGGGDPILYQHLFWFFGH
PEVYILILPGFGIISHVVAYYSGKKEPFGYMGMVWAMMAIGLLGFIVWAHHMFTVGMDVD
TRAYFTSATMIIAIPTGVKVFSWLATLHGGSIKWETPMLWALGFIFLFTVGGLTGIVLSN
SSLDIVLHDTYYVVAHFHYVLSMGAVFAIMAAFVHWFPLLTGYTLHSAWTKIHFGVMFIG
VNLTFFPQHFLGLAGMPRRYSDYPDAYALWNTVSSIGSLISLVAVIMFLFILWEAFAAKR
EVLSVELTMTNVEWLHGCPPPYHTYEEPAFVQIQSN
From the phylogenies, it was shown that species that
were in the same genus and families were more closely
related morphologically and genetically (Fig. 3). It was
also shown that species that were morphologically
similar were also similar in their protein structures
(Fig. 3). A point of controversy on the topic of
combining the protein-derived phylogeny and the
morphological phylogeny is that other versions have
put P.marinus and S.acanthias closer on the final
phylogeny as they are morphologically similar (Fig. 3).
This idea of putting P.marinus and S.acanthias close to
each other because they have similar synapomorphies
disrupts the phylogeny as A.gueldenstaedtii and
P.spathula are more morphologically similar and have
similar COX1 sequences (Fig.5, Fig. 1). Putting
P.marinus and S.acanthias in place of A.gueldenstaedtii
and P.spathula would push A.gueldenstaedtii and
P.spathula apart on the phylogeny, even though they
are more closely related (Fig. 3). In the phylogeny,
there are only 16 limited taxa for the 16 species of fish
to be put on. If one fish's position in the phylogeny
changes, it will impact the rest of the phylogeny. These
results build upon the idea that tetrapods and fish may
share a common ancestor, and tetrapods may once
been fish. This idea has implications throughout
biological sciences (Nancy et al., 2002). A phylogeny
connecting tetrapods to fish could build a more
detailed connection of the evolution of genes (Nancy et
al., 2002).
CONCLUSION
This information could be more helpful as it could be
used in the medical field to find specific new nutrients
and new antibiotics (Nancy B et al., 2002). A phylogeny
between tetrapods to fish could also allow for new
connection to be made between primates and other
animals (Nancy et al., 2002). This connection could
allow for medicine to be tested on fish before the
medicines use of primates (Nancy et al., 2002). A
limitation of the protein-derived phylogeny was that
T.roseae was extinct and did not have any sequences of
COX1 available. Because of this, T.roseae only had one
source for its placement on the final phylogeny, and
that was the morphological phylogeny. The
morphological phylogeny was only based off of certain
traits. If these traits were chosen in specific ways, the
morphological phylogeny could be theoretically
controlled and be made to look any way the
synapomorphies allow it to be. This could have
affected the final phylogeny, as it allows for variations
of the phylogeny. The process of combining
morphological and protein-derived phylogenies is a
flawed process in itself (Gontcharova. A et al., 2003).
Even though computers and mathematical formulas
make the combination more precise, phylogenies
made from the combination of morphological and
protein-derived phylogenies suffer from inadequate,
noncongruent taxon sampling, long-branch attraction,
or conflicting evolutionary models of the genes
analyzed (Gontcharova et al., 2003). In summary, the
present data suggests that as time progressed, fish
started to gain more tetrapod-like synapomorphies,
and supports the theory that tetrapods came from fish.
Additional studies concerning the morphological and
genetic similarity between fish and terrestrial
organisms might help better understand the link
between tetrapods and fish.
Conflicts of interest: The authors stated that no conflicts of
interest.

Sammer Marzouk, 2017
344 Int. J. of Life Sciences, Vol. 5(3) September, 2017
REFERENCES
Burnett, Nancy, & Bradford, Matsen. in The Shape of
Life (ed. Burnett, S.) 211-215 (Life, 2002).
Ericsson R, Robert K & Zerina J (2012) Evolution and
Development of the Vertebrate Neck. J. Anatomy.
222, 67-78.
Fiz-Palacios O & Virginia V (2013) From Messinian
Crisis to Mediterranean Climate: A Temporal Gap
of Diversification Recovered from Multiple Plant
Phylogenies. Perspectives in Plant Ecology,
Evolution and Systematics. 15, 130-37.
Gontcharov A (2003) Are Combined Analyses Better
Than Single Gene Phylogenies? A Case Study Using
SSU RDNA and RbcL Sequence Comparisons in the
Zygnematophyceae (Streptophyta). Molecular
Biology and Evolution. 21, 612-24.
Grim JM, Hyndman KA, Kriska T, Girotti AW and
Crockett EL (2011) Relationship between
Oxidizable Fatty Acid Content and Level of
Antioxidant Glutathione Peroxidases in Marine
Fish. J.Experimental Biology. 214, 3751-759.
Ludwig A (2008) Identification of Acipenseriformes
Species in Trade. J.Appl Ichthyol. 24, 2-19 .
Shubin NH, Daeschler EB and Jenkins FA (2014) Pelvic
Girdle and Fin of Tiktaalik Roseae. Proceedings of
the National Academy of Sciences. 111, 893-99.
Tsukihara T, Aoyama H, Yamashita E, Tomizaki T,
Yamaguchi H, Shinzawa-Itoh K, Nakashima R,
Yaono R, Yoshikawa S (1996) The whole structure
of the 13-subunit oxidized cytochrome c oxidase at
2.8 A. Science. 272, 1136-44.
Wang W, Hua Z, Hong X, Zhao H, and Yin D (2011)
Heteroplasmy in MtDNA Control Region and
Phylogenetics of Five Sturgeons. Zoological
Research. 30, 487-96.
Wilson Jonathan M & Pierre, Laurent (2002) Fish Gill
Morphology: Inside out. J. Exp. Zool. Journal. 293,
192-213.
.
© 2017| Published by IJLSCI