the genetic linkage map of the medicinal mushroom agaricus ... · pdf fileagaricus. genus...
TRANSCRIPT

The genetic linkage map of the medicinal mushroom 1
Agaricus subrufescens reveals highly conserved 2
macrosynteny with the congeneric species Agaricus 3
bisporus 4
5
Marie Foulongne-Oriol1*, Manuela Rocha de Brito
1,2, Delphine Cabannes
1, Aurélien 6
Clément1, Cathy Spataro
1, Magalie Moinard
1, Eustáquio Souza Dias
2, Philippe Callac
1, Jean-7
Michel Savoie1 8
9
1 INRA, UR1264 MycSA, Mycologie et Sécurité des Aliments, Villenave d’Ornon, France 10
2 UFLA, Departamento de Biologia, Universidade Federal de Lavras, C.P. 3037, 37200-000, 11
Lavras, MG, Brazil 12
13
14
*Corresponding author. 15
Mailing address: INRA, UR1264 Mycologie et Sécurité des Aliments, bâtiment Qualis, 71 16
avenue Edouard Bourlaux, CS 20032 F-33882 Villenave d’Ornon cedex, France 17
Phone: +33 (0)5 57 12 26 35 18
Fax: +33 (0)5 57 12 25 00 19
E-mail: [email protected] 20
running title : Macrosynteny between A. subrufescens and A. bisporus 21
22
G3: Genes|Genomes|Genetics Early Online, published on February 26, 2016 as doi:10.1534/g3.115.025718
© The Author(s) 2013. Published by the Genetics Society of America.

ABSTRACT 23
Comparative linkage mapping can rapidly facilitate the transfer of genetic information 24
from model species to orphan ones. If such a macrosynteny analysis approach has been 25
extensively used in plant species, few example are available in fungi and even less in 26
mushroom crop species. Among them, the Agaricus genus comprises the most cultivable or 27
potentially cultivable species. Agaricus bisporus, the button mushroom, is the model for 28
edible and cultivable mushroom. We developed the first genetic linkage map for the 29
basidiomycete Agaricus subrufescens, an emerging mushroom crop known for its therapeutic 30
properties and potential medicinal applications. The map includes 202 markers distributed 31
over 16 linkage groups and covers a total length of 1701 cM, with an average marker spacing 32
of 8.2 cM. Using 96 homologous loci, we also demonstrated the high level of macrosynteny 33
with the genome of A. bisporus. The 13 main linkage groups of A. subrufescens were syntenic 34
to the 13 A. bisporus chromosomes. A disrupted synteny was observed for the 3 remaining A. 35
subrufescens linkage groups. Electronic mapping of a collection of A. subrufescens expressed 36
sequence tags on A. bisporus genome showed that the homologous loci were evenly spread, 37
with the exception of a few local hot or cold spots of homology. Our results were discussed in 38
the light of Agaricus species evolution process. The map provides a framework for future 39
genetic or genomic studies of the medicinal mushroom Agaricus subrufescens. 40
41
KEYWORDS: comparative mapping; macrosynteny; almond mushroom, button mushroom, 42
chromosome evolution 43
44
45

INTRODUCTION 46
The genus Agaricus includes several important cultivated mushroom crop species. 47
Among those, Agaricus bisporus (Lange) Imbach, the button mushroom, is the most widely 48
produced and consumed throughout the world. Given its agronomical importance, A. bisporus 49
has been extensively studied at the genetic, molecular and physiological levels (Savoie et al., 50
2013). Genome sequence, molecular markers, linkage maps, QTLs for various agronomical 51
traits and breeding methods are available (Callac et al., 2006; Foulongne-Oriol et al., 2010, 52
2012a,b; Gao et al., 2013, 2015; Morin et al., 2012), making A. bisporus the model organism 53
for edible and cultivable basidiomycetes. 54
Lately, another Agaricus species, Agaricus subrufescens Peck, received growing 55
attention for its notable therapeutic properties. It is known to produce various bioactive 56
compounds that have potential medicinal applications (Firenzuoli et al., 2008; 57
Wisitrassameewong et al., 2012). Moreover, A. subrufescens can convert lignocellulosic 58
residues into highly nutritious food, and this way contributing to valorization of wastes. This 59
basidiomycete, also known as the almond mushroom due to its particular flavor, became in a 60
few years one of the most important culinary-medicinal cultivable mushrooms with 61
potentially high added-value products and extended agronomical valorization (Largeteau et 62
al., 2011; Llarena-Hernandez et al., 2013; Okuda et al., 2012). Today, few commercial 63
cultivars are available, all of them showing high genetic homogeneity (Colauto et al., 2002; 64
Fukuda et al., 2003; Kerrigan, 2005; Tomizawa et al., 2007). Breeding work on this species is 65
in its infancy (Kerrigan and Wach, 2008; Llarena-Hernandez et al., 2013) due to several 66
bottlenecks, including a lack of knowledge on its ecology, reproductive biology, biodiversity 67
and genetics (Largeteau et al. 2011). Recent developments of molecular markers and available 68
expressed sequence tag (EST) resources have enriched our toolbox for studying the biology of 69
this mushroom (Foulongne-Oriol et al., 2012c, 2014). The clarification of its amphithallic life 70
cycle and of the interfertility between field specimens from different continents (Rocha de 71
Brito et al., 2016; Thongklang et al., 2014a) provide sound basis to exploit genetic diversity 72
and conduct controlled mating of selected genotypes. 73
The development of an attractive panel of cultivars of A. subrufescens is challenging 74
and is a long-term process. As cultivable species, the traits of interest for selection are related 75
to yield, quality, or disease control. Considering its medicinal properties, enrichment in 76
bioactive compounds could also represent a target for selection. Most of those traits are under 77
complex inheritance, making breeding much more arduous. Unraveling their genetic control, 78
in terms of gene numbers, effect and genome position is essential. Thus, as a prerequisite to 79
develop such quantitative genetic approaches, the primary aim of this work was to develop a 80
genetic linkage map of A. subrufescens. Markers with known homologs in A. bisporus 81
(Foulongne-Oriol et al., 2014) used for the construction of the A. subrufescens map provide 82
ground to explore the synteny between the two species. The conservation of chromosome-83
scale gene linkage relationships (macrosynteny), including or not the preserved order of the 84
loci (collinearity) was assessed by a comparative mapping approach. Identifying 85
commonalities and differences between the two Agaricus genome species will provide bases 86
to investigate evolutionary mechanisms and possible genomic divergence that have 87
contributed to speciation process (Duran et al., 2009; Guyot et al., 2012). Besides 88
phylogenetic considerations, comparative mapping enables the transfer of information 89
between related species (Dirlewanger et al., 2004; Khazaei et al., 2014) and knowledge from 90
the model species A. bisporus can benefit to the orphan one A. subrufescens. 91
In the present study, we constructed the first genetic linkage map of A. subrufescens. By 92
comparing the mapping position of A. subrufescens sequence tagged site markers with that of 93
their homologs on the A. bisporus genome, we describe the macrosyntenic relationship 94
between the two congeneric species. We interpret our results in the light of species evolution 95

process. Further possible applied outcomes for A. subrufescens breeding purposes are also 96
discussed. 97
MATERIALS AND METHODS 98
Mapping population 99
The parental hybrid strain CA487-100 × CA454-3 was previously obtained by crossing the 100
two homokaryons CA487-100 and CA454-3 which are single spore isolates (SSIs) of the 101
French and Brazilian strains CA487 and CA454 (a subculture of WC837), respectively 102
(Llarena-Hernandez et al., 2013; Thongklang et al., 2014a). Single spores isolates were 103
obtained from spore print of the hybrid strain following the methodology described in 104
Thongklang et al. (2014a). For each SSI, the level of ploidy (n+n vs. n) was determined with a 105
multilocus genotype test based on 21 genomic microsatellite markers (hereinafter referred to 106
as SubSSR for A. Subrufescens Simple Sequence Repeats) (Foulongne-Oriol et al., 2012c) 107
which showed polymorphism between the two parental homokaryons: SSIs that did not 108
exhibit heteromorphic profile at any loci were considered homokaryotic (Thongklang et al., 109
2014a). Among the 380 SSIs tested, 79 were found homokaryotic and were thus selected for 110
further mapping purpose. The three parental strains (CA487-100, CA454-3, the hybrid 111
CA487-100 × CA454-3) and the haploid progeny of 79 homokaryons (referred hereafter as 112
Ei), are maintained in the “Collection du Germplasm des Agarics à Bordeaux” (CGAB), 113
INRA-Bordeaux (http://www6.bordeaux-aquitaine.inra.fr/mycsa_eng/Biological-resources-114
of-value/The-Agaricus-culture-collection-CGAB). 115
116

Genotyping 117
Total DNAs were extracted from freeze-dried mycelium following the protocol described 118
in Zhao et al. (2011). DNA concentration was adjusted to 25 ng/µl and the samples were 119
stored at -20°C. 120
The genotyping of genomic SubSSR markers (Foulongne-Oriol et al., 2012c) resulted from 121
the homokaryon selection test described above. In addition to this first set of 21 microsatellite 122
markers, EST-SSRs (hereinafter referred to as ES-SSR) were also used for mapping 123
(Foulongne-Oriol et al., 2014). Amplification conditions, electrophoretic separation and 124
visualisation were performed according to Foulongne-Oriol et al. (2012c). All microsatellite 125
primers used for mapping are listed in File S1, Table A. 126
Sequence-tagged site (STS) markers were developed on the basis of sequences available 127
from the literature (Foulongne-Oriol et al., 2012c, 2014; Matsumoto-Akanuma et al., 2006; 128
Thongklang et al., 2014a). The cleaved amplified polymorphic sequence (CAPS) approach 129
was used to reveal polymorphism in STS. PCR primer pairs were designed to amplify 130
products between 300 and 500 pb using Primer 3 software with default parameters (Rozen 131
and Skaletsky, 2000). Amplifications, digestion, electrophoretic separation and visualization 132
were performed according to Foulongne-Oriol et al. (2010). For each STS marker (hereinafter 133
referred to as PRS), primers and corresponding restriction enzymes are described in File S1, 134
Table A. 135
Amplified fragment length polymorphism (AFLP) markers were genotyped using the same 136
settings as described by Foulongne-Oriol et al. (2010). Total DNA was digested with the 137
EcoRI and MseI endonucleases. EcoRI and MseI primers with, for both, two selective 138
nucleotides, were used for amplification through seven pair combinations (File S1, Table B). 139
The amplified fragments were separated and visualized on an ABI3130 sequencer (Applied 140
Biosystems). Electropherograms were analysed with GENEMAPPERTM
V4.0 software. For 141
each primer pair, the reference panel used for allele calling in the progeny was based on the 142
AFLP patterns of the three parental strains (presence/absence in one of the two homokaryons, 143
presence in the hybrid). 144
The allelic segregation at the mating-type locus (MAT) was determined by pairing each 145
homokaryon Ei h with the two homokaryons CA454-3 (MAT-2) and CA487-100 (MAT-4). 146
The MAT allele of each Ei was deduced from unambiguous compatible reaction with one 147
tester or the other. Mating tests were performed as described in Thongklang et al. (2014a) 148
with two replicates per confrontation. Thus, the allele at the MAT locus could be determined 149
for 74 Ei (93.6%). 150
Linkage map construction 151
Genotypic data were independently scored by two experimenters to minimize scoring 152
errors. Locus segregation was tested for deviation from expected Mendelian ratios 1:1 with a 153
² test. Linkage and mapping analysis was performed using MAPMAKER/EXP V3.0b software 154
(Lander et al., 1987). The recombination frequency was converted into Kosambi centimorgan 155
(cM) unit. In a first round of mapping, markers having more than 30% of missing data and/or 156
markers with skewed segregation ration (p<0.05) were omitted to limit spurious linkage. 157
AFLP markers were kept out of this first step and those with unbalanced allelic segregation 158
were definitely removed from the genotyping data set. A minimum LOD score of 4.0 and 159
maximum distance of 30 cM were set as thresholds for linkage groups determination with the 160
‘GROUP’ command. For each group, the most likely marker order was established using the 161
‘ORDER’ command. Marker orders were confirmed with the ‘RIPPLE’ command. A framework 162
map was thus established. In a second step, markers excluded from the first round of mapping 163
were tested for linkage using the ‘GROUP’ and ‘LINKS ANY’ commands. The ‘ASSIGN’ command 164
(LOD>6) allowed the assignation of these markers to linkage group defined in the first step. 165
For each linkage group, additional markers were sequentially placed using the ‘TRY’ 166
commands. Markers that were difficult to place with several likely positions were dropped. 167
Subsequent orders were again tested with the ‘RIPPLE’ command. 168
MAPCHART software (Voorrips, 2002) was used for graphical representation of the linkage 169
map. Linkage groups (LG) were numbered in descending order based on their length in cM. 170
The occurrence of crossovers for each linkage group and each individual was analysed 171
using Graphical Genotyping (GGT 2.0) (van Berloo, 2008). 172
Estimated genome length Le was determined from the linkage data according to Hulbert et 173
al. (1988) modified by Chakravarti et al. (1991) (Method 3). Map coverage was calculated 174
using the formula m
eLcP )/21(1 , where P is the proportion of the genome within 2c cM 175
of a marker, m is the number of informative markers on the map and Le is the estimated 176
genome length (Beckmann and Soller, 1983). 177
Assessment of A. subrufescens-A. bisporus macrosynteny 178
All the sequence-based markers used for the presented linkage map construction were used 179
to infer syntenic relationships between A. subrufescens and A. bisporus chromosomes. 180
In a previous study, A. subrufescens EST sequences were aligned on the genome sequence 181
of A. bisporus (Foulongne-Oriol et al., 2014). As a brief reminder, the 10 114 A. subrufescens 182
sequences were mapped to A. bisporus scaffolds (H97 sequence V2.0, http://genome.jgi-183
psf.org/Agabi_varbisH97_2/Agabi_varbisH97_2.home.html, Morin et al., 2012) using BLAT algorithm 184
(Kent, 2002). A score of 60% which corresponds to the product of the first quartile value for 185
alignments coverage (75%) and identity (80%) was used as threshold to filter out unreliable 186
results. Putative A. bisporus genes homologous to A. subrufescens EST were searched for by 187
comparing best hit mapping coordinates to A. bisporus gene model (GM) coordinates. Thus, 188
6752 A. subrufescens sequences mapped on A. bisporus genome among which 6570 189
overlapped with 3620 A. bisporus GM (34.93% of all GM) (Foulongne-Oriol et al., 2014). To 190

go further in the present study, A. bisporus homologs distribution along the genome was 191
examined per scaffold, and on each scaffold, per window of 50 kb. 192
For the others markers, significant homology with A. bisporus gene was inferred by blastn 193
search similarity (e-value< 1×10e-10
). 194
The syntenic relationships established between A. subrufescens linkage map and A. 195
bisporus chromosome sequences were visualized using CIRCOS (Krzywinski et al., 2009). The 196
level of collinearity between genetic and physical orders was assessed by comparing, between 197
map and genome, the coordinate and orientation of each homologous pairs intervals. 198
Data availability 199
Strains are available upon request. Information about markers used or specifically developed 200
for this project can be found in Supplemental File S1 (Table A and Table B). The genotype 201
dataset used to build the genetic map is available as Supplementary Information (Table S1). 202
The A. subrufescens EST sequences are accessioned in Genbank with the reference 203
GBEJ00000000.1. Coordinate’s data resulting from the alignment of these A. subrufescens 204
EST sequences on the A. bisporus genome are available in Foulongne-Oriol et al. 2014 or 205
upon request. 206
RESULTS 207
Genotyping, segregation and linkage analysis, map construction 208
In addition to the 21 SubSSR markers used for homokaryon selection, 18 ES-SSR found 209
polymorphic between the two parental strains were used for mapping. Ninety-four 210
polymorphic CAPS markers were developed from available A. subrufescens sequences. The 211
AFLP technique was used in order to increase mapping coverage. A total of 90 polymorphic 212
and reliable AFLP markers were identified using seven primer pairs. 213
A set of 224 markers (90 AFLPs, 39 SSRs; 94 CAPSs, the MAT locus) was analysed for 214
mapping purpose. Twenty-eight markers (12.5 %) showed segregation ratio that deviated 215
from the expected 1:1 ratio (p < 0.05). The total number of genotyped individuals per locus 216
varied from 45 to 79, with an average of 72. Nearly 97% of the scored markers showed less 217
than 20% of missing data. 218
The first round of mapping included 106 markers representing the most confident and 219
informative set of genotyped loci (only unbiased codominant markers with less than one third 220
of missing data). With our mapping condition (LOD >4, dmax < 30 cM), a preliminary 221
framework map was established with 97 markers distributed over 18 linkage groups. The next 222
rounds of mapping consisted in placing the remaining markers. The addition of markers 223
allowed the merging of four groups into two larger ones. For the other groups, the sequential 224
mapping procedure led to an increase of marker density and length. Twenty-two markers (14 225
AFLPs, 2 SSRs, 6 CAPSs) were discarded from the current mapping dataset due to 226
inconsistent localisation or substantial increases of map length. 227
Map features 228
The final A. subrufescens linkage map includes 202 markers (76 AFLPs, 37 SSRs, 88 229
CAPS, the MAT locus, segregating data available in Table S1) distributed over 16 linkage 230
groups and covers a total length of 1701 cM with an average distance between adjacent 231
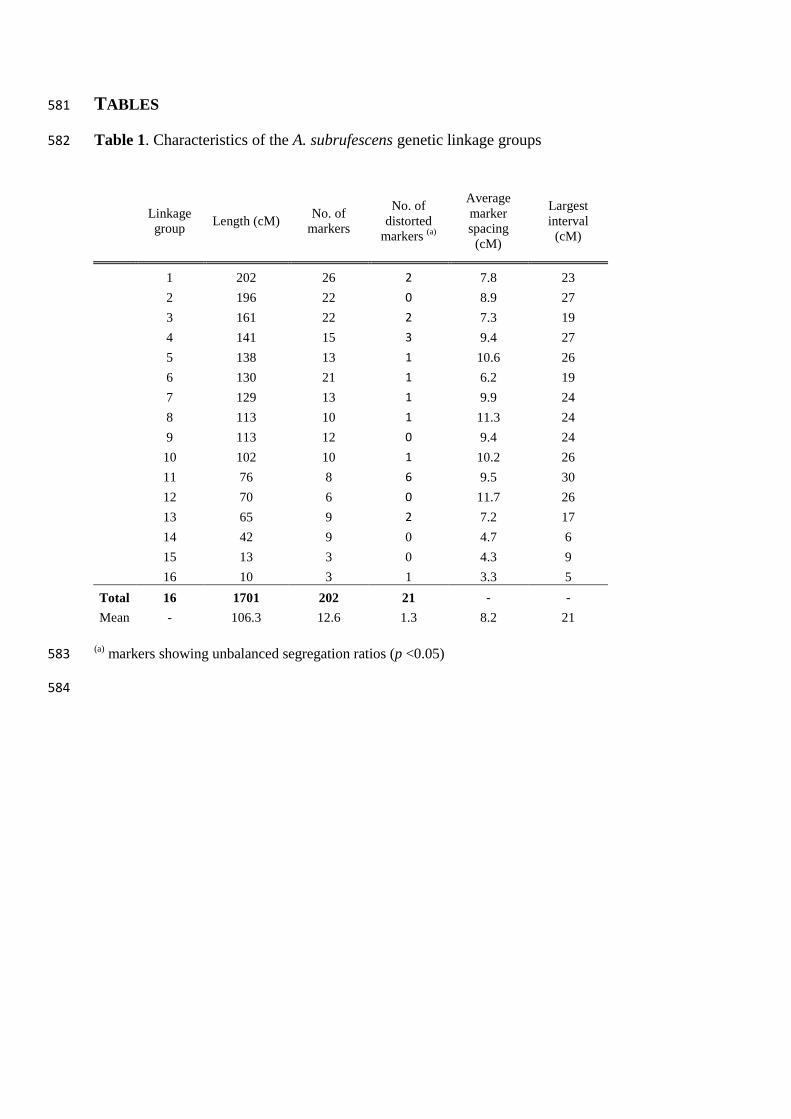
markers of 8.2 cM (Table 1, Fig. 1). According to their number of constituent markers and 232
their relative length, 14 major LGs (from 1 to 14) built with more than 6 markers (length > 40 233
cM) and 2 minors ones (15, 16) based on only 3 linked markers (length < 15 cM) can be 234
distinguished (Table 1). Most of the intervals between two adjacent markers (89.7%) are less 235
than 20 cM (60.3% in less than 10 cM), and the largest interval is of 30 cM (between ES47 236
and PRS234 on LG11). Considering the major LGs, the mean crossover frequency per LG per 237
individual varies from 0.39 (LG 14) to 2.06 (LG 1), with an average of 1.13, and was highly 238
correlated with the number of markers (r=0.90, p=8.6x10⁻⁶
). Of the 202 markers used for map 239
construction, 21 (10.4%) show significant segregation deviation from the expected 1:1 ratio 240
(p<0.05) (Table S1). One third concerns isolated markers suggesting that the observed bias 241
could be due to possible genotyping scoring errors. The other markers showing skewed 242
segregation are not found randomly distributed but tend to cluster on distal position of linkage 243
groups (Fig. 1). The genetic segments formed by successive biased markers represent less 244
than 4.3% of the linkage map. Linkage group 11 alone exhibits a large proportion of markers 245
with unbalanced segregation (6/8). Of the 21 mapped markers with skewed segregation, 19 246
have an excess of CA487-100 parental strain alleles. The only two markers showing a bias 247
towards an excess of CA454-3 allele are PRS217 (LG10) and ES31 (LG7). 248
The estimated genome length Le was 2458 cM, expanding the observed map length of 249
44.5%. According to this estimate, the proportion of the genome within 20 cM of a marker is 250
79 %. To reach 95% of saturation with the same mapping precision, the number of markers 251
should be increased 2.3-fold. 252
Synteny with A. bisporus genome 253
Among the 125 A. subrufescens (As) sequence-based markers, 96 showed similarities to 254
the A. bisporus genes (Ab) (Table 2). The map location of these markers and the physical 255
position of their corresponding homologs in the genome of A. bisporus were compared. In 256
most cases (98%), the markers genetically linked in A. subrufescens are physically related in 257
A. bisporus (Table 2, Fig. 2, File S1, Fig. A) and bound syntenic blocks. Two exceptions are 258
observed for PRS267 and PRS011. These two markers, mapped on As-LG3 and As-LG5 259
respectively, have their homologs (Ab genes ID 1982365 and 195996) physically assigned to 260
the Ab-chromXI instead of Ab-chromIII and Ab-chromVIII as expected regarding the other 261
adjacent mapped loci. The marker PRS011 derives from an As-EST sequence that shows 262
strong homology with a gene encoding for a Cytochrome P450 monooxygenase. Therefore, 263
the development of locus-specific marker from sequence belonging to such a multigenic 264
family could be quite hazardous. This suspicion was confirmed by the results of electronic 265
mapping since several hits on various scaffolds were returned. Among them, an equally likely 266
hit (e-value < 1×10e-17
) was found on scaffold 8 (Ab-chromVIII) consistently with the genetic 267
location. For PRS267, a unique homolog (gene ID 212249) was found on Ab-chromIX. 268
However, this gene is annotated as encoding for a hypothetical protein containing an 269
abhydrolase_3 domain. In the genome of A. bisporus (Morin et al. 2012), 6 other genes with 270
the same functional domain encode putatively proteins of the alpha/beta hydrolase 271
superfamily, but none of them is located on Ab-chromIII. A local chromosomal 272
rearrangement could not be excluded to explain PRS267 position. The other As-markers 273
without Ab-homologs are evenly spread over the As linkage groups. 274
The alignment of As marker- Ab homolog pairs along linkage groups and scaffolds reveals 275
an extensive macrosyntenic relationship (Table 2, Fig. 2, File S1, Fig. A), together with a 276
strong colinearity. Between one (As-LG14/Ab-chromVI) and 11 (As-LG6/Ab-chromI) pairs 277
of As-marker/Ab-homologs per linkage group, with an average of 6, allowed the analysis of 278
synteny. Indeed, nearly 80% of the A. subrufescens linkage map can be related to the genome 279
of A. bisporus. In most cases, synteny blocks span whole As- linkage groups and enables the 280
inference of homologous chromosomes between A. subrufescens and A. bisporus. The main 281
As linkage groups are found syntenic to the 13 Ab chromosomes. The As-LG14 and the As-282
LG3 are both found syntenic with the Ab-chromIII. The As-LG14 is anchored on the distal 283
part of the chromosome (Fig.2, File S1, Fig. A). The same pattern of synteny is also observed 284
between As-LG5/As-LG16 and Ab-chromVIII, the corresponding Ab-homologs of As-LG16 285
markers being located on one end of the chromosome. For these two cases of synteny 286
discrepancies, the linkage groups under consideration are found linked at mapping thresholds 287
less stringent (LOD >3, dmax < 35cM). Regarding the synteny between As-LG11 and As LG15 288
with Ab-chromIX, the Ab-homologs of the markers mapped to LG15 were found flanked on 289
each side by Ab-homologs of As-LG11 markers (Fig.2). A most permissive mapping 290
procedure did not allow a genetic linkage to be surmised between these linkage groups. The 291
collinearity is mostly respected with the genetic order of the mapped markers that is 292
consistent with the physical order of their homologs (Fig.2, File S1, Fig. A). Indeed, 77.3% 293
of the markers pairs intervals were found collinear with their homologous ones. Some local 294
inversions are observed on LG1, LG2, LG3, LG4 or LG12. The pattern observed on LG8 295
suggests an inversion of the genetic interval comprising between SubSSR76 and PRS075. 296
Several breakdown of collinearity were observed on LG11. 297
Alignment of the A. subrufescens EST sequences on A. bisporus genome showed that hits 298
to homolog loci were found on all the main scaffolds (Table 3). The average distance between 299
any two electronically mapped sequences based on their A. bisporus homologs locations is 7.2 300
kb. The number of GM overlapped by A. subrufescens sequences per chromosome is found 301
highly correlated with the total number of GM per chromosome (r = 0.97, p = 5.35×10e-13
). 302
Taken as a whole, the distribution per 50 Kb of overlapped GM along the chromosomes is 303
consistent with the GM distribution within the same interval. For illustration, the distribution 304
of overlapped GM on chromosome I (scaffold 1) follows the distribution of the GM (Fig. 3A) 305
with the lowest density of overlapped GM observed between 2.9 Mb and 3.2 Mb which 306
corresponded to the lowest density in GM due to the presence of repeated elements. However, 307
unexpected pattern of homologs distribution have been observed for some chromosomes (V, 308
VI, VIII, IX, XI) (² test, p < 0.01), with hot spots (higher number of homologs than 309
expected) and/or cold spots (lower number than expected) of homology. These distinct 310
regions are found randomly distributed on the linkage group, as illustrated for chromosome 311
VI on Fig. 3B. Beyond cold spots of homology related to repeats region (around 0.22 Mb and 312
around 1.52 Mb), other genomic segments exhibit either fewer ([1075 Kb-1125 Kb]) or more 313
([1175 Kb-1225 Kb]) homologs. 314

DISCUSSION 315
The construction of genetic linkage maps in cultivable mushrooms has been mostly 316
restricted to economically important agaricomycete species such as A. bisporus (Foulongne-317
Oriol et al., 2010, 2011), Pleurotus spp. (Larraya et al., 2000; Okuda et al., 2012), Lentinula 318
edodes (Gong et al., 2014; Kwan and Xu, 2002). In this study, we present the first genetic 319
linkage map for the medicinal mushroom A. subrufrescens using sequence tag site and AFLP 320
markers. The availability of such a molecular tool constitutes a milestone for further genetic 321
studies in the species. The near complete map presented is a solid backbone of the A. 322
subrufescens genome and makes possible the initiation of QTL analyses. The dissection of 323
complex inherited traits of economic importance, such as yield components, can be done 324
(Foulongne-Oriol, 2012). In the particular case of this medicinal mushroom, the identification 325
of QTLs controlling bioactive compounds production can contribute to unravel their 326
biosynthetic pathways, as well as their biological functions in the mushroom. This approach 327
was successfully undertaken to identify the genetic bases of biotechnological added-value 328
metabolites variations in yeast (Breunig et al., 2014) or in P. ostreatus (Santoyo et al., 2008). 329
Other further applications such as fine mapping or map-based cloning can be considered. In 330
this way, the use of non-anonymous markers would facilitate subsequent resolution of 331
mapped genomic regions to candidate genes. The availability of A. subrufescens EST catalogs 332
as a source of molecular markers will greatly enhance the development of targeted loci related 333
to specific pathway or traits of interest. Our results confirm also that the recombination events 334
occur normally in A. subrufescens, as already suggested (Thongklang et al. 2014a, Rocha da 335
Brito et al., 2016). Such recombination ability is of particular interest for mushroom breeding 336
purposes since it will facilitate the creation of favorable allelic combinations in breeding 337
schemes. 338

Syntenic relationship has been widely studied in plant and animal species but such 339
comparison has been hardly done so far in fungi until recently. The availability of complete 340
fungal genomes sequences has made the analysis of synteny between genomes possible 341
through comparative genomics studies (Thon et al. 2006, Hane et al. 2011, Ohm et al. 2012). 342
In our case, the lack of reference genome sequence for A. subrufescens did not allow such an 343
approach. Therefore, we have seen in the construction of the A. subrufescens linkage map the 344
opportunity to explore the syntenic relationship with the species A. bisporus thanks to a set of 345
96 homologous loci. By this way, we demonstrate the extensive conservation of synteny and 346
gene order between A. bisporus and A. subrufescens suggesting that the genome structures of 347
these two species have not drastically diverged. Such comparative mapping strategy has been 348
rarely used in fungi between congeneric species. For example, De Vos et al. (2014) 349
demonstrated the genome-wide macrosynteny, with a few chromosome rearrangements, 350
among Gibberella fujikoroi species complex. The present study is the first devoted to synteny 351
analysis between mushroom species. For each As linkage groups, the homology with Ab 352
chromosome could be inferred but the one-to-one correspondence was not fully established. 353
The 13 main As linkage groups were found syntenic to the 13 Ab chromosomes, but the 354
situation was not clear for the 3 remaining As linkage groups with an observed disrupted 355
synteny relationship. In this case, increasing maker density by an additional mapping effort 356
could answer the question whether there was a linkage gap between two parts of a unique 357
chromosome or there were several segregating chromosomes. The haploid number of 358
chromosomes in A. subrufescens remains unknown to date but our results suggest that this 359
number is greater than or equal to thirteen. The two Agaricus sections Arvenses and Bivelares 360
to which belong A. subrufescens and A. bisporus respectively, have diverged from their 361
common ancestor approximately 30 MYA ago according to Lebel and Syme (2012). 362
Chromosome rearrangements are likely to occur during speciation processes and represent an 363

important factor of fungal genome evolution (Giraud et al., 2008). In A. bisporus, the location 364
of a unique putative centromere per chromosome (Foulongne-Oriol et al., 2010), and the 365
absence of interstitial trace of remnant of telomere (Foulongne-Oriol et al., 2013) suggest that 366
the 13 chromosomes of the species did not resulted from fusion. Thus, if the ancestral 367
chromosome number is thirteen, a possible fission of chromosomes could explain the 368
macrosyntenic pattern observed between A. subrufescens and A. bisporus. Cytological 369
chromosome counts and electrophoretic karyotyping would ascertain the haploid number of 370
chromosomes in A. subrufescens. In the light of our results, the overall gene collinearity 371
between the two species was evidenced but local structural changes could not be completely 372
excluded. Possible rearrangement has been already suggested in a previous mapping study 373
based on another progeny analysis to explain the loss of synteny for the rDNA (ITS) locus 374
chromosome assignment between the two species (Rocha de Brito et al., 2016). 375
To go further, the high level of synteny between Ab-chromosome I and As-LG6 deserves 376
particular attention. The A. bisporus chromosome I carries the Mating type (MAT) locus, 377
located in the pericentromeric region and governing the sexual compatibility (Xu et al., 1993). 378
Thongklang et al. (2014a) showed that A. subrufescens, like A. bisporus var. bisporus, has a 379
unifactorial system of sexual incompatibility with a MAT locus. In the present study, we 380
localized the As-MAT locus on As-LG6 homologous to Ab-chromosome I. This result 381
suggests a possible functional conservation of the locus. A deeper analysis of the 382
microsynteny, at the sequence level could confirm such observation. The tight genetic linkage 383
between the As-MAT locus and the marker PRS091, derived from the putative A. subrufescens 384
mip gene (Thongklang et al., 2014a) known to flank the mating type locus (James et al., 2004) 385
is a first evidence. 386
Beyond evolutive considerations, consequences of the observed conserved macrosynteny 387
between these two agronomic mushroom species can be discussed in the light of applied 388

issues. The analogy between A. bisporus and A. subrufescens can be drawn. The cultivation 389
process of A. subrufescens has been mainly modeled on the methods used to grow A. 390
bisporus. Both are secondary decomposers and can be cultivated on similar substrates but A. 391
subrusfescens requires higher temperature condition for fruiting. Others agronomic parallels 392
between the two cultivated species can be pointed out: similar yield components, common 393
biotic disorders, comparable post-harvest issue (Largeteau et al., 2011; Llarena-Hernandez et 394
al., 2013, 2014). The high level of synteny demonstrated between the two species render the 395
possible transfer of the knowledge gained on A. bisporus to A. subrufescens conceivable. We 396
may therefore expect that QTL controlling traits such as yield would be found conserved 397
between the two species. Such comparative QTL mapping studies have been done 398
successfully in various plants (Chagné et al., 2003; Li et al., 2013) and our results provide the 399
first evidences that this approach could also be applied to fungal species. Since we have 400
demonstrated that A. subrufescens EST with known A. bisporus homologs are well distributed 401
on A. bisporus genome, these sequences provides sound basis to perform further synteny-402
based genomic studies. Besides the application in genetic and breeding, comparative QTL 403
mapping could be seen as a tool to predict regions of homology and could provide 404
information on functional synteny. 405
To conclude, we have constructed the first genetic linkage map of A. subrufescens, 406
providing a framework for the future genetic studies of this medicinal species. This map, 407
based on sequence-tagged site markers, will be very useful for prospective A. subrufescens 408
genome sequencing project. We have proved, through a comparative mapping approach with 409
A. bisporus genome, a high degree of synteny conservation between the two species. Since 410
Agaricus is potentially the most cultivable mushroom genus, our results are also promising for 411
other species such as A. bitorquis, A. arvensis, or A. flocculosipes (Thawthong et al., 2014; 412
Thongklang et al., 2014b). In addition, we have also demonstrated that the A. subrufescens 413

EST sequences provide a potential source of syntenic markers that could be custom-made to 414
target specific genomic regions. Beyond macrosynteny, we may imagine a potential 415
transferability of the genetic information between the two species. We have found first 416
evidences of possible functional conservations between the two species with the location of 417
the mating-type locus on homolog chromosomes. The present work provides landmarks to go 418
further in the evolutionary story of these two species and their process of speciation. 419
ACKNOWLEDGMENTS 420
Manuela Brito gratefully acknowledges the Brazilian agencies “Coordenação de 421
Aperfeiçoamento de Pessoal de Nivel Superior” (CAPES) and “Programa de Doutorado 422
Sanduiche no Exterior” (PDSE-CAPES) for financial support. This work was supported by a 423
research project funded by a bilateral cooperation between Mexico (project 115790 424
CONACYT) and France (ANR-09-BLAN-0391-01). The authors acknowledge the technical 425
assistance provided by Ombeline Hueber. 426
427

LITERATURE CITED 428
Beckmann, J.S., Soller, M., 1983. Restriction fragment length polymorphisms in genetic 429 improvement: methodologies, mapping and costs. Theor Appl Genet 67, 35-43. 430
Breunig, J.S., Hackett, S.R., Rabinowitz, J.D., Kruglyak, L., 2014. Genetic basis of metabolome 431 variation in yeast. PLoS Genet 10, e1004142. 432
Callac, P., Spataro, C., Caille, A., Imbernon, M., 2006. Evidence for outcrossing via the Buller 433 phenomenon in a substrate simultaneously inoculated with spores and mycelium of Agaricus 434 bisporus. Appl Environ Microbiol 72, 2366-2372. 435
Chagné, D., Brown, G., Lalanne, C., Madur, D., Pot, D. et al. 2003. Comparative genome and QTL 436 mapping between maritime and loblolly pines. Molecular breeding 12, 185-195. 437
Chakravarti, A., Lasher, L.K., Reefer, J.E., 1991. A maximum likelihood method for estimating 438 genome length using genetic linkage data. Genetics 128, 175-182. 439
Colauto, N.B., Dias, E.S., Gimenes, M.A., da Eira, A.F., 2002. Genetic characterization of isolates of 440 the basidiomycete Agaricus blazei by RAPD. Braz J Microbiol 33, 131-133. 441
Dirlewanger, E., Graziano, E., Joobeur, T., Garriga-Caldere, F., Cosson, P. et al., 2004. Comparative 442 mapping and marker-assisted selection in Rosaceae fruit crops. Proc Natl Acad Sci U S A 101, 9891-443 9896. 444
De Vos, L., Steenkamp E.T., Martin S.H., Santana Q.C., Fourie G. et al., 2014 Genome-wide 445 macrosynteny among Fusarium species in the Gibberella fujikuroi complex revealed by amplified 446 fragment length polymorphisms. PLoS One 9 (12):e114682. 447
Duran, C., Edwards, D., Batley, J., 2009. Genetic maps and the use of synteny. Methods Mol Biol 513, 448 41-55. 449
Firenzuoli, F., Gori, L., Lombardo, G., 2008. The medicinal mushroom Agaricus blazei Murrill: 450 Review of literature and pharmaco-toxicological problems. Evid Based Complement Alternat Med 5, 451 3-15. 452
Foulongne-Oriol, M., Spataro, C., Cathalot, V., Monllor, S., Savoie, J.M., 2010. An expanded genetic 453 linkage map of an intervarietal Agaricus bisporus var. bisporus x A. bisporus var. burnettii hybrid 454 based on AFLP, SSR and CAPS markers sheds light on the recombination behaviour of the species. 455 Fungal Genet Biol 47, 226-236. 456
Foulongne-Oriol, M., Dufourcq, R., Spataro, C., Devesse, C., Broly et al., 2011. Comparative linkage 457 mapping in the white button mushroom Agaricus bisporus provides foundation for breeding 458 management. Curr Genet 57, 39-50. 459
Foulongne-Oriol, M., 2012. Genetic linkage mapping in fungi: current state, applications, and future 460 trends. Appl Microbiol Biotechnol 95, 891-904. 461
Foulongne-Oriol, M., Rodier, A., Rousseau, T., Savoie, J.M., 2012a. Quantitative trait locus mapping 462 of yield-related components and oligogenic control of the cap color of the button mushroom, 463 Agaricus bisporus. Appl Environ Microbiol 78, 2422-2434. 464
Foulongne-Oriol, M., Rodier, A., Savoie, J.M., 2012b. Relationship between yield components and 465 partial resistance to Lecanicillium fungicola in Agaricus bisporus assessed by QTL mapping. Appl 466 Environ Microbiol 78, 2435-2442. 467
Foulongne-Oriol, M., Spataro, C., Moinard, M., Cabannes, D., Callac et al., 2012c. Development of 468 polymorphic microsatellite markers issued from pyrosequencing technology for the medicinal 469 mushroom Agaricus subrufescens. FEMS Microbiol Lett 334, 119-126. 470
Foulongne-Oriol, M., Murat, C., Castanera, R., Ramirez, L., Sonnenberg, A.S., 2013. Genome-wide 471 survey of repetitive DNA elements in the button mushroom Agaricus bisporus. Fungal Genet Biol 472 55, 6-21. 473
Foulongne-Oriol, M., Lapalu, N., Férandon, C., Spataro, C., Ferrer et al., 2014. The first set of 474 expressed sequence tags (EST) from the medicinal mushroom Agaricus subrufescens delivers 475 resource for gene discovery and marker development. Appl Microbiol Biotechnol 98, 7879-7892. 476
Fukuda, M., Ohno, S., LKato, L., 2003. Genetic variation in cultivated strains of Agaricus blazei. 477 Mycoscience 44, 431-436. 478
Gao, W., Baars, J.J., Dolstra, O., Visser, R.G., Sonnenberg, A.S., 2013. Genetic variation and 479 combining ability analysis of bruising sensitivity in Agaricus bisporus. PloS one 8, e76826. 480

Gao, W., Weijn, A., Baars, J.J., Mes, J.J., Visser, R.G. et al., 2015. Quantitative trait locus mapping 481 for bruising sensitivity and cap color of Agaricus bisporus (button mushrooms). Fungal Genet Biol 482 77, 69-81. 483
Giraud, T., Refregier, G., Le Gac, M., de Vienne, D.M., Hood, M.E., 2008. Speciation in fungi. 484 Fungal Genet Biol 45, 791-802. 485
Gong, W.B., Liu, W., Lu, Y.Y., Bian, Y.B., Zhou et al., 2014. Constructing a new integrated genetic 486 linkage map and mapping quantitative trait loci for vegetative mycelium growth rate in Lentinula 487 edodes. Fungal Biol 118, 295-308. 488
Guyot, R., Lefebvre-Pautigny, F., Tranchant-Dubreuil, C., Rigoreau, M., Hamon et al., 2012. 489 Ancestral synteny shared between distantly-related plant species from the asterid (Coffea canephora 490 and Solanum Sp.) and rosid (Vitis vinifera) clades. BMC Genomics 13, 103. 491
Hane, J.K., Rouxel T., Howlett B.J., Kema G.H., Goodwin S.B. et al., 2011 A novel mode of 492 chromosomal evolution peculiar to filamentous Ascomycete fungi. Genome Biol 12 (5):R45. 493
Hulbert, S.H., Ilott, T.W., Legg, E.J., Lincoln, S.E., Lander, E.S. et al., 1988. Genetic analysis of the 494 fungus, Bremia lactucae, using restriction fragment length polymorphisms. Genetics 120, 947-958. 495
James, T.Y., Kues, U., Rehner, S.A., Vilgalys, R., 2004. Evolution of the gene encoding mitochondrial 496 intermediate peptidase and its cosegregation with the A mating-type locus of mushroom fungi. 497 Fungal Genet Biol 41, 381-390. 498
Kent, W.J., 2002. BLAT--the BLAST-like alignment tool. Genome Res 12, 656-664. 499 Kerrigan, R.W., 2005. Agaricus subrufescens, a cultivated edible and medicinal mushroom, and its 500
synonyms. Mycologia 97, 12-24. 501 Kerrigan, R.W., Wach, M.P., 2008. Agaricus subrufescens mushroom plant named ‘H1X1’. Google 502
Patents, http://www.google.com/patents/USPP19313. 503 Khazaei, H., O'Sullivan, D.M., Sillanpaa, M.J., Stoddard, F.L., 2014. Use of synteny to identify 504
candidate genes underlying QTL controlling stomatal traits in faba bean (Vicia faba L.). Theor Appl 505 Genet 127, 2371-2385. 506
Krzywinski, M., Schein, J., Birol, I., Connors, J., Gascoyne, R. et al., 2009. Circos: an information 507 aesthetic for comparative genomics. Genome Res 19, 1639-1645. 508
Kwan, H.S., Xu, H.L., 2002. Construction of a genetic linkage map of shiitake mushroom Lentinula 509 edodes strain L-54. J Biochem Mol Biol 35, 465-471. 510
Lander, E.S., Green, P., Abrahamson, J., Barlow, A., Daly, M.J. et al., 1987. MAPMAKER: an 511 interactive computer package for constructing primary genetic linkage maps of experimental and 512 natural populations. Genomics 1, 174-181. 513
Largeteau, M., Llarena-Hernandez, R.C., Regnault-Roger, C., Savoie, J.M., 2011. The medicinal 514 Agaricus mushroom cultivated in Brazil: biology, cultivation and non-medicinal valorisation. Appl 515 Microbiol Biotechnol 92, 897-907. 516
Larraya, L.M., Perez, G., Ritter, E., Pisabarro, A.G., Ramirez, L., 2000. Genetic linkage map of the 517 edible basidiomycete Pleurotus ostreatus. Appl Environ Microbiol 66, 5290-5300. 518
Lebel, T., Syme, A., 2012. Sequestrate species of Agaricus and Macrolepiota from Australia: new 519 species and combinations and their position in a calibrated phylogeny. Mycologia 104, 496-520. 520
Li, X., Ramchiary, N., Dhandapani, V., Choi, S.R., Hur, Y. et al., 2013. Quantitative trait loci 521 mapping in Brassica rapa revealed the structural and functional conservation of genetic loci 522 governing morphological and yield component traits in the A, B, and C subgenomes of Brassica 523 species. DNA research 20, 1-16. 524
Llarena-Hernandez, C.R., Largeteau, M.L., Ferrer, N., Regnault-Roger, C., Savoie, J.M., 2014. 525 Optimization of the cultivation conditions for mushroom production with European wild strains of 526 Agaricus subrufescens and Brazilian cultivars. J Sci Food Agric 94, 77-84. 527
Llarena-Hernandez, R.C., Largeteau, M.L., Farnet, A.M., Foulongne-Oriol, M., Ferrer, N. et al., 2013. 528 Potential of European wild strains of Agaricus subrufescens for productivity and quality on wheat 529 straw based compost. World J Microbiol Biotechnol 29, 1243-1253. 530
Matsumoto-Akanuma, A., Yamagishi, A., Ohno, N., 2006. Cloning and characterization of 531 polyphenoloxidase DNA from Agaricus brasiliensis S. Wasser et al. (Agaricomycetideae). Int J Med 532 Mushrooms 8, 67-76. 533

Morin, E., Kohler, A., Baker, A.R., Foulongne-Oriol, M., Lombard, V. et al., 2012. Genome sequence 534 of the button mushroom Agaricus bisporus reveals mechanisms governing adaptation to a humic-rich 535 ecological niche. Proc Natl Acad Sci U S A 109, 17501-17506. 536
Ohm, R.A., Feau N., Henrissat B., Schoch C.L., Horwitz B.A. et al., 2012 Diverse lifestyles and 537 strategies of plant pathogenesis encoded in the genomes of eighteen Dothideomycetes fungi. PLoS 538 Pathog 8 (12):e1003037. 539
Okuda, Y., Ueda, J., Obatake, Y., Murakami, S., Fukumasa, Y. et al., 2012. Construction of a genetic 540 linkage map based on amplified fragment length polymorphism markers and development of 541 sequence-tagged site markers for marker-assisted selection of the sporeless trait in the oyster 542 mushroom (Pleurotus eryngii). Appl Environ Microbiol 78, 1496-1504. 543
Rocha de Brito, M., Foulongne-Oriol, M., Moinard, M., Dias, E.S., Savoie, J.M. et al., 2016. Spore 544 behaviors reveal a category of mating-competent but infertile heterokaryons in the offspring of the 545 medicinal fungus Agaricus subrufescens. Appl Microbiol Biotechnol 100, 781-796 546
Rozen, S., Skaletsky, H., 2000. Primer3 on the WWW for general users and for biologist 547 programmers. Methods Mol Biol 132, 365-386. 548
Santoyo, F., Gonzalez, A., Terron, M., Ramirez, L., Pisabarro, A.G., 2008. Quantitative linkage 549 mapping of lignin-degrading enzymatic activities in Pleurotus ostreatus. Enzyme and Microbial 550 Technology 43, 137-143. 551
Savoie, J.M., Foulongne-Oriol, M., Barroso, G., Callac, P., 2013. Genetics and genomics of cultivated 552 mushrooms, application to breeding of Agarics, in: Kempken, F. (Ed.), The Mycota XI: Agricultural 553 Applications, 2nd edition. Springer-Verlag Berlin Heidelberg. 554
Thawthong, A., Karunarathna, S.C., Thongklang, N., Chukeatirote, E., Kakumyan, P. et al., 2014. 555 Discovering and domesticating wild tropical cultivatable mushrooms. Chiang Mai J. Sci. 41, 731-556 764. 557
Thon, M.R., Pan H., Diener S., Papalas J., Taro A. et al., 2006 The role of transposable element 558 clusters in genome evolution and loss of synteny in the rice blast fungus Magnaporthe oryzae. 559 Genome Biol 7 (2):R16. 560
Thongklang, N., Hoang, E., Rodriguez-Estrada, A., Sysouphantong, P., Moinard, M. et al., 2014a. 561 Evidence for broad geographical hybridization potential among Agaricus subrufescens isolates from 562 Brazil, France and Thailand. Fungal Biology 118, 1013-1023. 563
Thongklang, N., Sysouphantong, P., Callac, P., Hyde, K., 2014b. First cultivation of Agaricus 564 flocculosipes and a novel Thai strain of A. subrufescens. Mycosphere 5, 814-820. 565
Tomizawa, M.M., Dias, E.S., de Assis, L.J., Gomide, P.H.O., dos Santos, J.B., 2007. Genetic 566 variability of mushroom isolates Agaricus blazei using markers rapd. Cienc Agrotec 31, 1242-1249. 567
van Berloo, R., 2008. GGT 2.0: Versatile Software for visualization and analysis of genetic data. J 568 Hered 99, 232-236. 569
Voorrips, R.E., 2002. MapChart: software for the graphical presentation of linkage maps and QTLs. J 570 Hered 93, 77-78. 571
Wisitrassameewong, K., Karunarathna, S.C., Thongklang, N., Zhao, R., Callac, P. et al., 2012. 572 Agaricus subrufescens: A review. Saudi J Biol Sci 19, 131-146. 573
Xu, J., Kerrigan, R.W., Horgen, P.A., Anderson, J.B., 1993. Localization of the Mating type gene in 574 Agaricus bisporus. Appl Environ Microbiol 59, 3044-3049. 575
Zhao, R.L., Karunarathna, S., Raspé, O., Parra, L.A., Guinberteau, J. et al., 2011. Major clades in 576 tropical Agaricus. Fungal Diversity 51, 279-296. 577
578
579
580
TABLES 581
Table 1. Characteristics of the A. subrufescens genetic linkage groups 582
Linkage
group Length (cM)
No. of
markers
No. of
distorted
markers (a)
Average
marker
spacing
(cM)
Largest
interval
(cM)
1 202 26 2 7.8 23
2 196 22 0 8.9 27
3 161 22 2 7.3 19
4 141 15 3 9.4 27
5 138 13 1 10.6 26
6 130 21 1 6.2 19
7 129 13 1 9.9 24
8 113 10 1 11.3 24
9 113 12 0 9.4 24
10 102 10 1 10.2 26
11 76 8 6 9.5 30
12 70 6 0 11.7 26
13 65 9 2 7.2 17
14 42 9 0 4.7 6
15 13 3 0 4.3 9
16 10 3 1 3.3 5
Total 16 1701 202 21 - -
Mean - 106.3 12.6 1.3 8.2 21
(a) markers showing unbalanced segregation ratios (p <0.05) 583
584
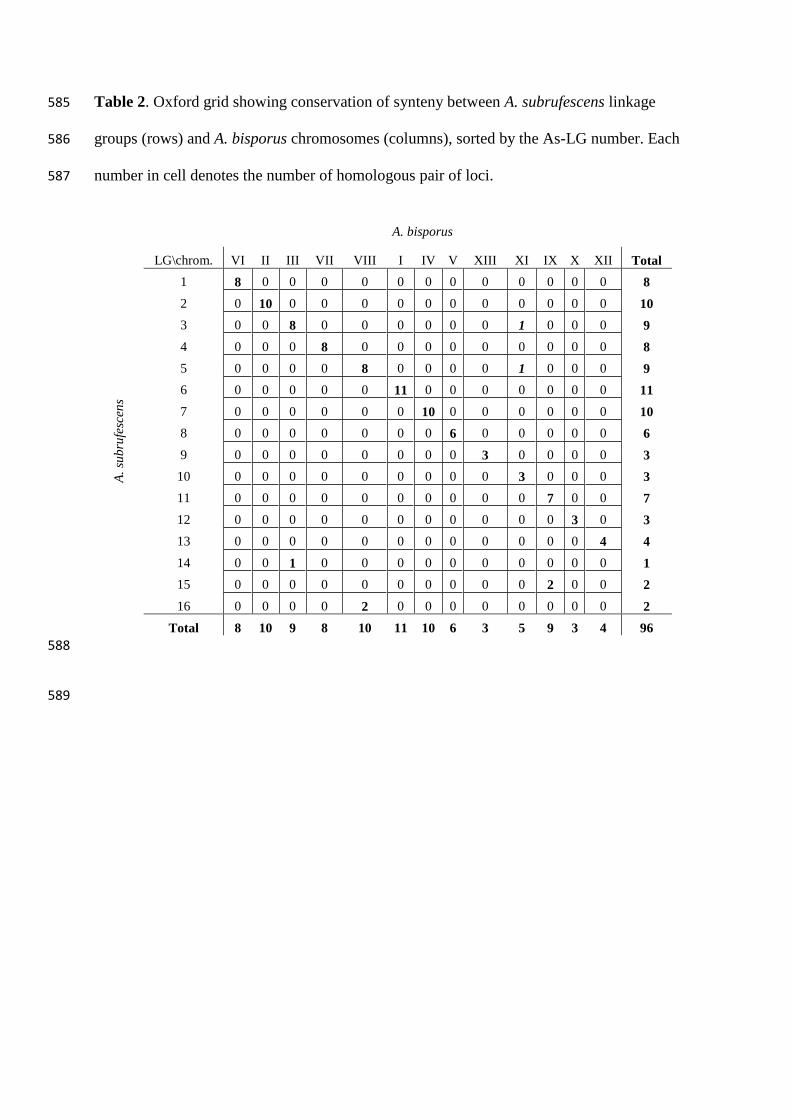
Table 2. Oxford grid showing conservation of synteny between A. subrufescens linkage 585
groups (rows) and A. bisporus chromosomes (columns), sorted by the As-LG number. Each 586
number in cell denotes the number of homologous pair of loci. 587
A. bisporus
LG\chrom. VI II III VII VIII I IV V XIII XI IX X XII Total
A.
sub
rufe
scen
s
1 8 0 0 0 0 0 0 0 0 0 0 0 0 8
2 0 10 0 0 0 0 0 0 0 0 0 0 0 10
3 0 0 8 0 0 0 0 0 0 1 0 0 0 9
4 0 0 0 8 0 0 0 0 0 0 0 0 0 8
5 0 0 0 0 8 0 0 0 0 1 0 0 0 9
6 0 0 0 0 0 11 0 0 0 0 0 0 0 11
7 0 0 0 0 0 0 10 0 0 0 0 0 0 10
8 0 0 0 0 0 0 0 6 0 0 0 0 0 6
9 0 0 0 0 0 0 0 0 3 0 0 0 0 3
10 0 0 0 0 0 0 0 0 0 3 0 0 0 3
11 0 0 0 0 0 0 0 0 0 0 7 0 0 7
12 0 0 0 0 0 0 0 0 0 0 0 3 0 3
13 0 0 0 0 0 0 0 0 0 0 0 0 4 4
14 0 0 1 0 0 0 0 0 0 0 0 0 0 1
15 0 0 0 0 0 0 0 0 0 0 2 0 0 2
16 0 0 0 0 2 0 0 0 0 0 0 0 0 2
Total 8 10 9 8 10 11 10 6 3 5 9 3 4 96
588
589

Table 3. Results of A. subrufescens EST sequence similarity searches against A. bisporus 590
gene models 591
A. bisporus
chromosome
Scaffold on A.
bisporus genome
V2.0
Nb of A.
subrufescens
mapped
sequences
Nb of A. subrufescens
sequences
overlapping A.
bisporus GM
Nb of A.
bisporus GM
overlapped
% of A. bisporus
GM overlapped
I scaffold 01 1065 1038 540 43.34
III scaffold 02 842 828 449 40.20
V scaffold 03 495 477 280 31.96
II, IV scaffold 04 638 621 340 37.74
II scaffold 05 659 638 364 41.65
VI scaffold 06 558 540 285 36.26
VII scaffold 07 485 476 259 36.79
VIII scaffold 08 258 251 145 23.81
X scaffold 09 289 270 153 26.33
IX scaffold 10 313 308 172 32.09
XIII scaffold 11 229 228 127 30.98
XII scaffold 12 191 184 106 30.11
XI scaffold 13 170 162 93 27.43
IV scaffold 14 220 217 121 38.91
XI scaffold 15 105 104 57 27.27
II scaffold 16 97 95 48 25.40
XII scaffold 17 67 63 44 25.43
IV scaffold 18 33 33 22 28.21
VII scaffold 19 34 33 13 21.31
ND scaffolds 22, 29 4 4 2 17.15
Total 6752 6570 3620 -
mean 337.60 328.50 181.00 31.12
592
593
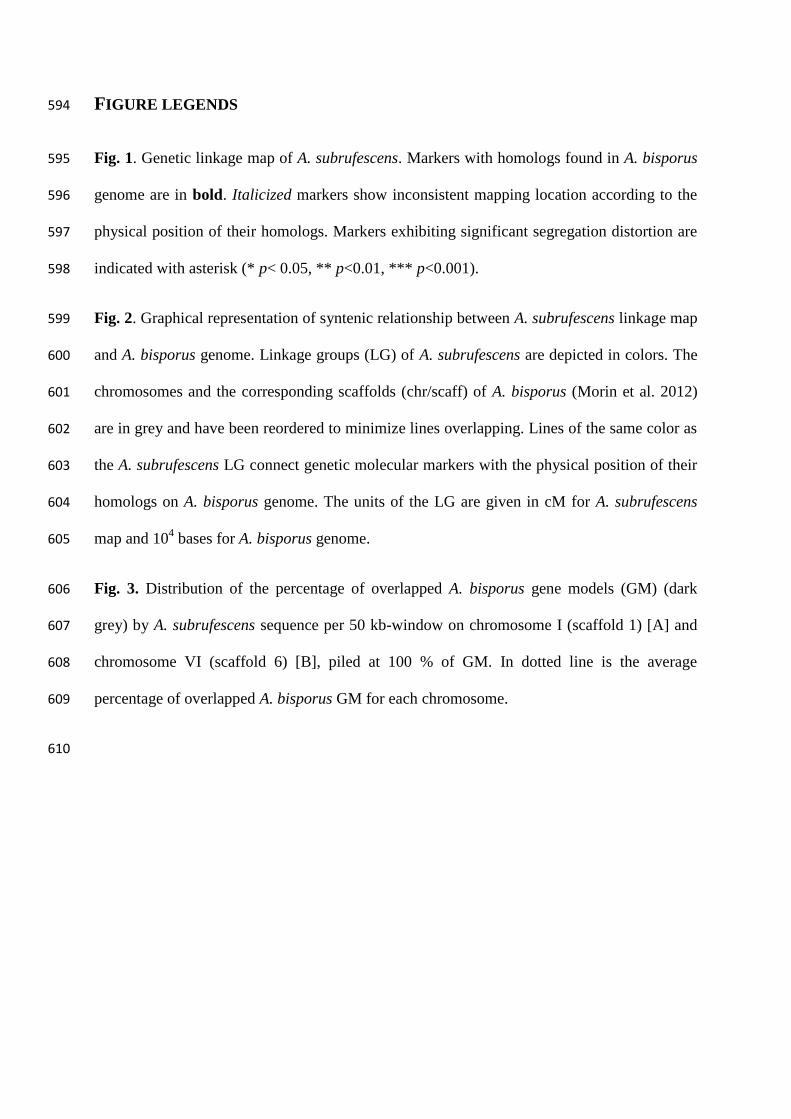
FIGURE LEGENDS 594
Fig. 1. Genetic linkage map of A. subrufescens. Markers with homologs found in A. bisporus 595
genome are in bold. Italicized markers show inconsistent mapping location according to the 596
physical position of their homologs. Markers exhibiting significant segregation distortion are 597
indicated with asterisk (* p< 0.05, ** p<0.01, *** p<0.001). 598
Fig. 2. Graphical representation of syntenic relationship between A. subrufescens linkage map 599
and A. bisporus genome. Linkage groups (LG) of A. subrufescens are depicted in colors. The 600
chromosomes and the corresponding scaffolds (chr/scaff) of A. bisporus (Morin et al. 2012) 601
are in grey and have been reordered to minimize lines overlapping. Lines of the same color as 602
the A. subrufescens LG connect genetic molecular markers with the physical position of their 603
homologs on A. bisporus genome. The units of the LG are given in cM for A. subrufescens 604
map and 104 bases for A. bisporus genome.605
Fig. 3. Distribution of the percentage of overlapped A. bisporus gene models (GM) (dark 606
grey) by A. subrufescens sequence per 50 kb-window on chromosome I (scaffold 1) [A] and 607
chromosome VI (scaffold 6) [B], piled at 100 % of GM. In dotted line is the average 608
percentage of overlapped A. bisporus GM for each chromosome. 609
610

Figure 1
Figure 2

Figure 3