the geographic distribution of human y chromosome variation
TRANSCRIPT

Copyright 0 1997 by the Genetics Society of America
The Geographic Distribution of Human Y Chromosome Variation
M. F. Hammer,* A. B. Spurdle? T. Karafet,* M. R. Banner,* E. T. Wood,* A. Novelletto,’ P. Malaspina,: R. J. Mitchell,§ S . Horai,** T. Jenkinst and S. L. Zeguratt
*Laboratory of Molecular Systematics and Evolution and ttDepartment of Anthropology, University of Arizona, Tucson, Arizona 85721, tDepartment of Human Genetics, South Afiican Institute for Medical Research and the University of Witwatersrand,
Johannesburg 2000, South Africa, ‘Departimento di Biologia, Universita degli Studi “Tor Vergata”, Rome 001 73, Italy, §Department of Genetics and Human Variation, La Trobe University, Melbourne, Victoria 3038, Australia, and
**Department of Human Genetics, National Institute of Genetics, Mishima 41 1, Japan Manuscript received July 7, 1996
Accepted for publication November 27, 1996
ABSTRACT We examined variation on the nonrecombining portion of the human Y chromosome to investigate
human evolution during the last 200,000 years. The Y-specific polymorphic sites included the Y Alu insertional polymorphism or “YAP” element (DYS287), the poly(A) tail associated with theYAF’ element, three point mutations in close association with the YAP insertion site, an A-G polymorphic transition (DYS271), and a tetranucleotide microsatellite (DYSl9). Global variation at the five bi-allelic sites (DYS271, DYS287, and the three point mutations) gave rise to five “YAP haplotypes” in 60 populations from Africa, Europe, Asia, Australasia, and the New World ( n = 1500). Combining the multi-allelic variation at the microsatellite loci (poly(A) tail and DYS19) with the YAP haplotypes resulted in a total of 27 “combination haplotypes”. All five of the YAP haplotypes and 21 of the 27 combination haplotypes were found in African populations, which had greater haplotype diversity than did populations from other geographical locations. Only subsets of the five YAP haplotypes were found outside of Africa. Patterns of observed variation were compatible with a variety of hypotheses, including multiple human migrations and range expansions.
G ENETIC data have played a key role in current debates about the origin of modern humans. In
particular, human mitochondrial DNA data (CANN et al. 1987; VIGILANT et al. 1991; STONEKING 1993; PENNY et al. 1995) have been interpreted to support “Recent Out of Africa” models (MINUGH-PURVIS 1995) rather than the “Multiregional Evolution” model (FRAYER et al. 1993). The realization that mtDNA represents a sin- gle locus has led to the suggestion that accurate infer- ences about human population history require the ex- amination of many loci (STONEKING 1993; SZATHMARY 1993; TEMPLETON 1993). Indeed, extensive batteries of multilocus data have been used to portray population affinities within Homo sapiens (BATZER et al. 1994; BOW- COCK et al. 1994; MOUNTAIN and CAVALLI-SFORZA 1994). However, as TEMPLETON (1993, 1996) has pointed out, there have been no critical tests of the two major com- peting human origin(s) models. Moreover, there are inherent advantages in studying genetic systems without recombination. For instance, they provide opportuni- ties to (1) determine character state polarity, (2) con- struct trees showing the phylogenetic history of individ- ual haplotypes, and (3) estimate the time frame for the branching events in the trees.
Over the last decade attention has turned to the
Corresponding author: Michael Hammer, Department EEB, Biosci- ences West, University of Arizona, Tucson, AZ 85721. E-mail: [email protected]
Genetics 145: 787-805 (March, 1997)
largest nonrecombining region in the human genome, the male-specific portion of the Y chromosome. Al- though the first Y-linked restriction fragment length polymorphisms were identified in 1985 (CASANOVA et al. 1985; LUCOTTE and NGO 1985), the paucity of known variation on the Y chromosome throughout the late 1980’s limited the role of this chromosome in testing hypotheses about the origin and migration patterns of human populations. However, recent methodological advances in the detection of both single nucleotide site and microsatellite variation on the Y chromosome (HAMMER 1995;JOBLING and TYLER-SMITH 1995; WHIT- FIELD et al. 1995; UNDERHILL et al. 1996) have facilitated studies encompassing such diverse topics as paternal migration at the continental level (TORRONI et al. 1994a; HAMMER and HORAI 1995; KARAFET et al. 1997; UN- DERHILL et al. 1996), the demographic histories of single populations and the genetic affinities of closely related groups (ROEWER et al. 1996), the number of male founders in isolated populations (NYSTUEN et al. 1995), levels of population admixture (HAMMER and HORAI 1995; KARAFET et al. 1997), and male and female repro- ductive patterns (LUCOTTE et al. 1994; SALEM et al. 1996).
Although our paper is not concerned with testing hypotheses associated with Recent Out of Africa models or Multiregional Evolution, it does address possible early and subsequent human migrations from both global and regional perspectives. Mitochondrial DNA

788 M. I?. Hammer et al.
TABLE 1
YAP haplotype and DYSl9 allele frequencies in 60 populations (n = 1500)
YAP haplotype ~~~
DYSl9 allele
n 1 2 3 4 5 Z A B c D E Population
Khoisan (KHO) Sekele Tsumkwe Nama
Pygmies (PYG) Mbuti Biaka
Gambians" Nigerians"
Bagandans Kenyans" Ethiopians"
Nguni" Zulu Ndebele Xhosa Swazi
Sotho Tswana Pedi
Tsonga Venda
West Bantus (WBA) Herero/Himba"
West Africans (WAF)
East Africans ( E A F )
East Bantus (EBA)
Sotho/Tswana"
Herero Himba
Ambo
Dama Lemba
North Africans (NAF) Egyptians"
West Asians (WAS) Saudi Arabians" United Arab Emirates" Omanis" Iranians"
Japanese"
Enigmatic Southern Africans (ESA)
East Asians ( U S )
Aomoris Shizuokans Okinawans
Tibetans" Koreans" Taiwanese" South Chinese"
South Asians (SAS) Indians" Southeast Asians"
Vietnamese Philippinos Malaysians Laotians Indonesians Cambodians
34 31 13
32 51 62
24 0 12 32 42 0 3 3 8 0 15 15
9 15 16 27 0 23
12 15 3 19 8 23
37 19 15
12 16 31
14 14
50 42
0 14 0 36 0 0 0 58
7 29 0 0
21 21 0 21
7 36
14 43
48 8
15 0
0 17 10 58 0 13 0 87
0 8 0 0
14 29 13 63
29 13
19 13
29 18 3
10 6 67
0 10 0 80 0 11 0 83 0 0 33 0
0 0 0 0 0 0
13 38 17 44 33 33
28 33 33
21 6 0
41 28 7 4 2 37 15 13 9 6 2
22 21 14 25 50 30 47 15 22 50 50
0 15 2 61 0 18 4 57 0 0 0 86 0 25 0 50 0 0 0 5 0 0 5 5 60 0 7 13 33 0 8 0 77 0 0 0 78 0 0 17 33 0 0 0 50
0 0 0 0 0 0 0 0 0 0 0 5 0 13 0 0 0 0 0 17 0 0
17 49 22 39 0 71 25 50 0 100 8 59 14 60 8 61 0 56 0 66 0 50
29 32 29 25 0 19 13 23 22 17 50
5 7 0 0 0 9 0 8 22
0 0
29 27 2 26
28 26 50 4
0 0 0 72 0 0 0 74 0 0 0 50 0 8 8 80
0 0 0 0 0 0 0 8
14 38 15 34 50 50 12 53
34 36 0 15
14 15 0 12
22 34
21 67
5 9 5 60 0 3 6 24
0 5 0 6
36 40 61 24
5 9
14 0
93 51 0 1 46 2 1 19 45 21 12 2
22 20 11 5
91 90 100 80
0 0 5 5 0 0 5 5 0 0 0 0 0 0 0 20
0 5 0 5 0 0 0 0
55 23 65 15 36 64 20 80
18 15 0 0
0 42 0 0 0 39 0 0 0 33 0 0 0 55 0 0 0 47 0 0 0 0 0 0 0 1 0 0 0 0 0 0
0 8 0 7 0 8 0 7 0 0 0 0 1 4 0 4
3 49 7 55 2 57 2 36 23 67 26 22 28 38 10 52
25 24 21 32 10 41 25 25
15 7 12 23 0 11 4 8
132 26 61 45 30 27 76 48
58 61 67 45 53 100 99 100
39 47 13 10 10 7 4 3
100 100 100 100 100 100 100 100
0 0 0 0 0 0 0 0 0 0 0 0 0 0 0 0 0 0 0 0 0 0 0 0 0 0 0 0 0 0 0 0
0 0 0 2 0 8 0 0 0 0 0 0 0 0 0 0
23 51 7 55 8 46 10 60 0 70 0 43 0 50 33 67
21 23 23 10 10 57 50 0
5 13 15 20 20 0 0 0 -

Global Human Y Haplotype Variation
TABLE 1
Continued
789
YAP haplotype DYSl9 allele
Population
South Europeans (SEU) Greeks"
Mainland Greeks" Island Greeks'' Cretans
General Italians" Sardinians Calabrians Venetians Puglians Sicilians
Germans" British" South African Europeans"
Australian Aboriginal People"
Italians"
North Europeans (NEU)
Australasians (AUS)
Great Sandy Desert Western Australians"
Northern Australians" Papua New Guineans
Native Americans (NAM) Navajos
n 1
83 75 42 62 17 82 24 92 208 86 52 83 55 93 29 90 27 89 21 81 24 79
30 93 43 98 20 95
43 98 36 100 7 86 19 100 48 100
47 100
2 3 4 5 Z A B C D E
0 0 0 0 0 0 0 0 0 1 0 0 0 0 0 0 0 0 0 0 0 4
0 0 0 0 0 0
0 0 0 0 0 0 0 0 0 0
0 0
25 0 38 0 18 0 8 0 13 0 17 0 7 0 10 0 11 0 19 0 17 0
7 0 2 0 5 0
2 0 0 0 14 0 0 0 0 0
0 0
0 0 0 0 0 0 0 0 0 0 0
0 0 0
0 0 0 0 0
0
22 31 12 12 14 19 7 7 11 24 21
7 12 5
0 0 0 0 0
57
37 27 38 17 35 41 38 33 37 31 46 23 25 33 45 41 41 26 38 29 25 42
50 30 63 23 60 15
23 35 17 36 57 29 32 26 33 46
32 11
13 12 12 17 10 6 15 4 19 9 4
10 2 15
33 36 14 11 15
0
1 2 0 0 8 6 20 3 3 0 8
3 0 5
9 11 0 32 6
0
Frequencies were rounded off to the nearest percent. As a result some haplotype rows do not sum to 100%. Composite samples.
has been used to trace maternally based genetic trails from Asia both to the Pacific (MELTON et al. 1995) and to the Americas (MERRIWETHER et al. 1995). Likewise, Ychromosome (paternal) genetic trails have been used to test hypotheses about the peopling of Japan (HAM- MER and HORAI 1995) and to formulate theories about the peopling of the Americas (WET et al. 1997; UN- DERHILL et al. 1996). Unfortunately, there has been only one published study that qualifies as a global survey of human Y chromosome haplotype variation, JOBLING
and TYLER-SMITH'S (1995) excellent review paper, which also presents new compound haplotype data.
HAMMER (1995) performed a sequencing survey of 16 geographically diverse humans for a 2.6-kb region (referred to as the "YAP" region) on the long arm of the human Y chromosome and constructed a tree with five Y chromosome haplotypes. The mean time to the common Y chromosome ancestor was estimated to be - 188 kya (thousand years ago) with a 95% confidence interval from 51 to 411 kya. Other estimates of the age of our common Y chromosome ancestor concur in sug- gesting that analyses of Y-linked variation will eventually be useful for testing hypotheses about human evolution during the last 200,000 years (Fu and LI 1996; WEISS and VON HAESELER 1996). The present study surveys the aforementioned five YAP haplotypes in a large worldwide sample. In addition, variation at the DYS271
A-G transition (SEIELSTAD et al. 1994) and the DYS19 microsatellite (ROEWER et al. 1992) loci was investigated. The combination of data from these loci with the YAP haplotypes resulted in a total of 27 "combination" h a p lotypes and formed the basis for our exploration of global Y chromosome variation.
MATERIALS AND METHODS
Sample composition: We analyzed a total of 1500 males from 60 populations. These populations were categorized into 15 major groups based on geographic, linguistic, and ethno- historical criteria (Table 1). A total of 78 samples came from Khoisan-speakers originating from southern Africa (SPURDLE andJENKINs 1992). This grouping was composed of the Khoi (13 Nama from Namibia) and the !Kung San (34 Sekele and 31 Tsumkwe from Namibia). We studied 28 Pygmies (Bow- COCK et al. 1994) including 14 Mbuti Pygmies from Zaire and 14 Biaka Pygmies from the Central African Republic. Biaka Pygmies speak languages belonging to the Niger Kordofanian family, whereas, Mbuti Pygmies speak central Sudanic lan- guages belonging to the Nilo-Saharan language family (CA- VALLI-SFORZA et UL. 1994). The West African sample consisted of 48 diverse Gambians (14 Wolof, 13 Mandinka, seven Serere, four Manjago, three Jola, two Fula and five other) (SOODYALL et al. 1996), and eight Nigerians (WAINSCOAT et al. 1986). The East African sample consisted of 29 Bagandans from Uganda, 18 Kenyans (WAINSCOAT et al. 1986; MATHIAS et al. 1994), and three Ethiopians. The 141 samples from South African Bantu- speaking groups represented different chiefdoms, each speak- ing a different Bantu language (SPURDLE andJENKlNs 1992).
790 M. F. Hammer e/ nl.
The southeastern antl so~~thwestern Bantu-spcakel-s are postw I;~rctl t o havr followed dilTerent migratol-\’ paths from west- ccntl-;d Africa, a general sorlthbound course (southeastern B;ultu) antl a southwsterly route ;Icross central Africa toward the wstern parts o f the continent (southwestern Bantu) (SI~IXDI.I;. and JETKISS 1992). Eighty-six southeastcrn Bantu speakers (referred t o as “East Rantus”) were grouped into 41 Nguni (28 Zulu , sewn Nclcl~ele, four Xlnosa, and two Swzi), 37 Sotho/Tswana (1.5 Sotho, I3 Tswana, and nine I’cdi), six Tsonga, and t w o I‘cnda. The .5.5 southwestern Bantu speakcrs (rcferretl to as “West Rantus”) included 27 from the I-lercro, 26 from the Ambo, and two from the Himha chicldoms. Two cnignlatic southern African groups were in- clutletl i n this study. The 34 I.cmha are eastern Bantu speakers (\'entia) w i t h a possible Semitic origin (S1v’RI)I.E andJENKINS 199(i), and the 22 Dama are from a Khoi-speaking group, who are biologically more closely related t o non-Khoisan African groups (SIY’RIM.I< antl JI<SKISS 1992). The North African g r o ~ p illclutlrd 93 Epptians (31 from the Dakhalia region northcast of Cairo antl 62 with paternal birthplaces both n o l - t h ;lnd south ol‘ Cairo) ( C n l l s I < 1 . 1 . r P/ nl. 1995).
The M’czst Asian composite group included 22 Saudi Ara- bian, 20 United Arab Emirates, 1 1 Omani, and five Iranian samples ((:1\11s1<1,1.1 r / rrl. 199.5). Atlditional Asian samples were grouped into East Asians antl South Asians based on rthnohistorical critrria ( ~ : . \ \ , , \ t . I . l - S ~ o ~ ~ ~ \ e/ nl. 1994). The East Asian grol~p inclrltled lJ‘2Japanesc (45 Okinawans, 61 Shizuo- kans. and 26 .4omoris) (HA\I\IER and HoK;\I 1995), 27 Kore- ans, 30 Tibetans, 76 Taiwanesc (mainly Hakkas and immi- grants from southern China). and 48 southern mainland Chinese (MIr.Ios r / crl. 199.5). The South Asian group in- clutlccl 39 Indians [ 19 from Andra Pradesh and 20 from South Africa who originated mainly from the Gujerat and Bengali
Asians ( I3 \‘ietnannese, I O Philippinos, I O Malaysians, seven Laotians, four Indonesians, and three Cambodians).
Populations slun.everl from southern Europe included 83 Greeks (24 from Crete and 59 Greek-horn males presently residing i n Australia, including 1 7 from various Greek Islands, 19 from Maceclonia, nine from Peloponissos, and 14 from other mainland locations (MIT(:III:I.I. e/ nl. 1993; CIMINELLI et nl. l99.5), antl 208 Italians (55 from Sardinia, 29 from Cala- bria, 27 from Veneto, 24 from Sicily, 21 from Puglia, and 52 from other continental Italian locations) (PERSI(:I~IETTI et nl. 1992; kllx:l11~.1.1. r / crl. 1993; C1\11sE1.1,1 e/ nl. 1995). The 40 Italian and 59 Greek samples collected i n Melbourne, Austra- lia came from wlunteers who filled out a qtmtionnaire in their own 1;unguage verifying their place of birth. The north- ern European samplc consisted of 30 Germans, 43 English- born ma1c.s ( 1 9 of whom are presently residing in Australia) (I’ERs1(:~IrtTI e/ crl. 1992; C:111151<1.1.1 P/ nl. 1995), and 20 South African Ewopcans (Sl>lw)I .E and JESKINS 1992).
The Austml;1sian sample incldctl 43 Australian Aboriginal Pcoplr (36 from thc northern edge of the Great Sandy Desert and s r w n lionl the west coast ofAustralia) (PERNA e/ nl. 1992), 1 9 intligctnous northern Australians, and 48 Papria New Chin- cans ( 1 % from the coxt antl 30 from the highlands) (STONE-
and 14’11.~0s 1989). A single sample of47 Navajos from Norrhern Arizona m t l New Mexico represented Native Ameri-
DNA extraction: DNA samplrs provided by other investiga- tors were a s follows: seven Nigerians and three Kenyans by I. S. M’..\ISS(:O;Y~; 14 Riaka Pygmies, 14 Mhuti Pygmies, three Ethiopians, and three Cambodians by K. KIDI), J . k n n , and J . ROGF.RS; 29 Baganchns by I,. I , O ~ ; I E ; 21 Egyptians by Y. GAD; 30 Germans b y G. R,\PIY)I.I>; 27 South Chinese, 43 Australian Aboriginal Pcople, antl 48 Papua New Guineans by M. S r m E - KIS(;; and 48 G;unbians b y A. V. S. HIt.1.. Blood samples from Taiwan w ~ e provitled b y I.. I,. HSIEII. ”hole blood DNA was
pro\inces (Sl~t’R1)l.E : I d JESKINS 19<)6)] and 47 Southeast
c;\ns.
DYSl9 DYS271 DYS287 P E-== I M I I Im
Segment 1 Segment 2 PNl poly(A) PN2 PN3
Segment 3
* polymorphic nucleotide + PCR oligonucleotide If poly(A) length varlatlon
- hybridization probe - 0.5 kb
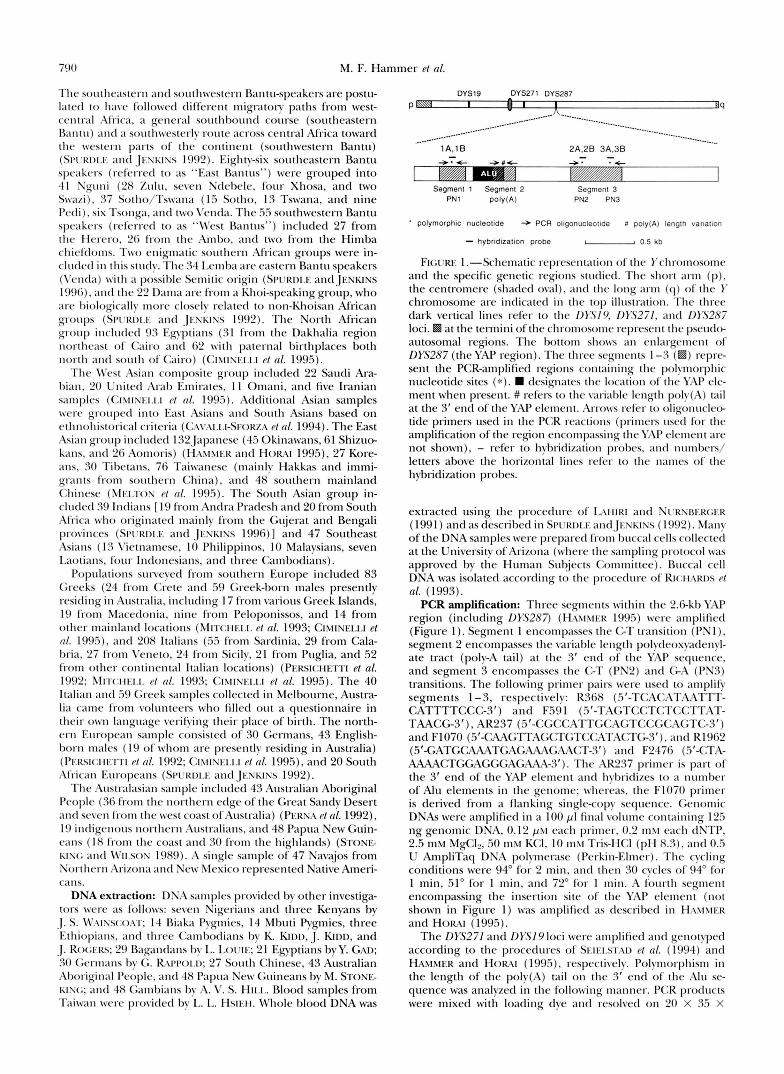
FIGURE l.”Schematic represent;ltion of the Ychromosomr and the specific genetic regions studied. The short a r m (p), the centromere (shaded o\.nI), antl the long arm (q) o f the Y chromosome are indicated i n the top illustration. The three dark vertical lines refer to the fIKY19, fIYY27/, antl fIKYZR7 loci. W at the termini of the clnromosome represent the pseudo- autosomal regions. The bottom shows an enlargement of DYS287 (the YAP region). The three segments 1-3 (El) repre- sent the PCR-amplified regions containing the polymolphic nucleotide sites (*). W designates the location of the YAP ele- ment when present. ## refers to the variable length poly(;\) tail at the 3’ end of the YAP clement. Arrows reler t o oligonucleo- tide primers used i n the PCR reactions (primers usrtl for t h r amplification of the region encompassing the YAP element ;we not shown), - refer to hybridization pl-ohes, and nulnhers/ letters above the horizontal lines rcxfer to the II;IIIICS of the hybridization probes.
extracted using the procedure of h I I R I and NL’RSRI:.RGI<R (1991) and as described i n SPCRI)I.I:. andJI:.xKIss ( 1 992). Many of the DNA samples were prepared from buccal cells collected at the University of Arizona (where the sampling protocol was approved by the Human Subjects Committee). Buccal cell DNA was isolated according t o the procedure of Rlc:IrmI)s e/
PCR amplification: Three segments within the 2.Gkb YAP region (including D}~Y287) (HASI\II:.R 199.5) were amplified (Figure I ) . Segment 1 encompasses the GT transition ( P N l ) , segment 2 encompasses the variable length polytleoxvadenyl- ate tract (poly-A tail) at the 3’ end of the YAP sequence, and segment 3 encompasses the G T (PN2) and <;-A (PN3) transitions. The following primer pairs were used to amplify segments 1-3, respectively: R368 (T,’-TCA<;XTArITTT- CATTTTCCC-3‘) and F.59 1 (.5’-TAGTCCTCT<:<:TTAT-
and F1070 ( 5 ” c ~ G r r A ~ ; C T G T C ; ~ ~ T A ~ T G S ’ ) . and R1962 (5’-GATGCAAATGAGAAAGUCT-3’) and F2476 (5’-CTA- AAAACTGGAGGGAGAAA-3’). Thc AR237 primer is part of the 3‘ end of the YAP element and hybridizes to a number of N u element5 in the genome; whereas, the F1070 primer is derived from a flanking singlecopy sequence. Genomic DNAs were amplified in a 100 pl final volume containing 12.5 ng genomic DNA, 0.12 p\t each primer, 0.2 m\I each dNTP, 2..5 mM MgCI.,, 50 mb1 KCI, I O m\t Tris-HCI (pH 8.3) , and 0.5 U AmpliTaq DNA polymerase (Perkin-Elmer). The cycling conditions were 94” for 2 min, antl then 30 cycles o f 94” for 1 min, 51” for 1 min, and 72” for I min. A fourth segment encompassing the insertion site of the YAP element (not shown in Figure 1) was amplified as tlescribed i n HMNER and HORN (1995).
The DY.7271 and DYSf 9 loci were amplified and genotyped according to the procedures of SF.II<IS~;\I> e/ crl. (1994) and HAMMER and HORN (199.5), respectively, Polymorphism in the length of the poly(A) tail on the 3’ end of the A111 se- quence was analyzed in the following manner. PCR products were mixed with loading dye and resolved on 20 X 3.5 X
nl. ( 1993).
TAACG-Sf), AR237 (5’-CCCCATTG<;AGTC(:(;CA(;TC-S‘)

Global Human Y Haplotype Variation 79 1
0.15 cm 6% polyacrylamide/O.l5% bisacrylamide gels in TBE buffer (50 mM Tris-borate/EDTA pH 8.3) for 8 hr at 300 V. Following electrophoresis, the gel was stained with ethidium bromide and the fragments were visualized by UV light.
Site-specific oligonucleotide ( S S O ) hybridization: SSO probes were designed according to the methods described by IKUTA et al. (1987). Figure 1 shows the location of the hybridization probes to detect the polymorphic base substitu- tions in segments 1 and 3. The sequences of these probes are as follows: Probe lA, 5’-GAGAGCCTTTTGTCT3’; probe lB, 5’-TTAAGACAAAAAGCTCTCG3’; probe 2A, 5’- AAACTAATGCCTTCTCCTC-3’; probe 2B, 5”GGAGGA- GAAAGCATTAGTT-3’; probe 3A, 5”GCTTGAAGGGGAGG TAAAT-3’; and probe 3B, 5’-AATTTACCTCCCCCTCAAG3’. The probes were labeled with [yP2P]-ATP (Amersham) to a specific activity of at least lo8 cpm/pg DNA. Approximately 200 ng (5 pl) of each amplified DNA was added to denatur- ation buffer (0.4 NaOH, 25 mM EDTA) and dotted on a nylon membrane (Amersham). The DNA was fixed to the membrane by UV irradiation with a Stratalinker UV cross- linker (Stratagene). Membranes were prehybridized in hy- bridization solution ( 5 X SSPE, 5X Denhardt’s, 0.5% SDS) for 30 min at 53”. Labeled SSO probes were then added directly to the hybridization solution to a concentration of 2 pmol/ ml, and hybridization was carried out for 2 hr at 53”. Mem- branes were rinsed in wash solution (2X SSPE, 0.1% SDS) at room temperature, washed at 53 for 30 min, and exposed to film for 2-48 hr.
Data analysis: For each individual, the combination of se- quence variants (both point and length mutations) observed across the three YAP segments and the DYS271 and DYS19 loci is referred to as a Y chromosome haplotype. An unbiased estimate of haplotype diversity ( h ) equivalent to heterozygos- ity in each population was calculated using Equation 8.5 of NEI (1987). The variance of h was determined as described in NEI (1978). The diversity values can theoretically range from 0 to 1, with 0 representing the minimum value (ie., a single haplotype fixed in a population) and 1 representing the maximum possible genetic variability (ie., an equal fre- quency of an infinitely large number of haplotypes). The same measure was used to estimate diversity carried by each of the five YAP haplotypes. Fst analyses were performed using the computer program Antana (HARPENDING and ROGERS 1984) for the YAP data. For the microsatellite locus, MICHALAK~S and EXCOFFIER’S (1996) PHIst with AMOVA procedure was adopted. These PHIst values are related to SLATKIN’S (1995) Rst (GOLDSTEIN rt al. 1995). Associations between YAP haplo- types and alleles at the DYSlY locus were investigated using the linkage disequilibrium (0) method of WEIR (1990). Nor- malized disequilibrium values (D’) between -1 and +1 were determined by dividing D by the appropriate denominator given on p. 97 in WEIR (1990).
The PHYLIP Package (FELSENSTEIN 1993) was used to com- pute genetic distances for use in distance matrix programs and for constructing maximum likelihood phylogeny esti- mates based on Y chromosome haplotype frequencies. Ge- netic distances were generated using two different methods: CAVAI.I.I-SFORZA’S chord distance (4D) (CAVALLISFORZA and BODMER 1971) and REYNOLDS et aL’s (1983) genetic distance (Fst). These methods assume that there is no new mutation and that all gene frequency changes are due to genetic drift. Constant and equal population sizes are not assumed. The neighbor-joining (NJ) (SAITOU and NEI 1987) and the Un- weighted Pair Group Method Using Arithmetic Averages (UPGMA) (SOKAI. and MICHENER 1958) options of the pro- gram NEIGHBOR and the Fitch and Margoliash (FM) option (FITCH and MARGOIJASH 1967) of the program FITCH were used to construct branching diagrams from matrices of pair- wise distances. The NJ and FM programs fit a tree that has
unconstrained branch lengths and assume both additivity and independent errors. The UPGMA option constructs a tree by successive agglomerative mergers using an average-linkage method and assumes that an “evolutionary clock” is valid. Accordingly, the true branch lengths from the root of the tree to each tip are the same and the expected amount of evolution in any lineage is proportional to elapsed time. The CONTML program was used to estimate phylogenies based on restricted maximum likelihood using Y chromosome hap- lotype frequencies (FEISENSTEIN 1981). This program takes haplotype frequencies as input and performs a square-root transformation on the data. Then the Brownian motion model is used on the resulting coordinates. It assumes that each locus evolves independently via genetic drift. The CON- SENSE program was used to read the trees produced from the CONTML, NEIGHBOR, and FITCH programs and compute majority-rule consensus trees.
RESULTS
Variation at four polymorphic sites within the YAP region (DYS287): The frequency of Y chromosomes with the YAP element (YAP’) varied greatly among geo- graphical regions. Consistent with previous surveys (HAMMER 1994; SEIELSTAD et al. 1994; SPURDLE et al. 1994), YAP+ chromosomes were found at high frequen- cies in samples throughout the African continent (mean frequency = 61.7%): East Africans (88.0%), West Africans (87.5%), South African Bantu-speakers (76.6%), Pygmies (53 .5%) , and North Africans (49.5%). The Khoisan sample had the lowest frequency of YAP’ chromosomes (26.9%) of all the African sam- ples. Although YAP’ chromosomes were not found in the South Asian or New World samples, they were found at extremely low frequencies in the Australasian sample (1.0%), at low frequencies in the West Asian (8.6%) and European (13.8%) samples, and at moderate fre- quencies in the East Asian sample (22.3%).
Direct DNA sequencing of the YAP element in a small sample of YAP+ chromosomes demonstrated that the number of adenine residues at the 3’ end of the Alu sequence (poly(A) tail) is variable (HAMMER 1995). Three poly(A) tail length alleles were identified at this mononucleotide microsatellite site: long (L: 46 bp), short (S: 26 bp), andvery short (VS: 19 bp). Oligonucle- otide primers were designed to amplify an -220-bp DNA fragment encompassing the poly(A) tail of the YAP element (Figure 1, segment 2). After PCR amplifi- cation of this segment from all 437 YAP’ chromosomes in this survey, we observed the three known length al- leles (Figure 2A) as well as a new poly(A) allele interme- diate in size (36 bp) between the L and S alleles. We refer to this as the medium (M) allele (not shown in Figure 2A). The L allele was associated with 88.496, 9.9%, a n d 2.2% of the East Asian, African, and Euro- pean YAP’ chromosomes, respectively. The S allele (ab- sent in East Asia) was associated with 97.8% and 90.1% of the European and African YAP’ chromosomes, re- spectively. The VS and M alleles were identified only in association with East Asian YAP’ chromosomes (7.1 % and 4.5%, respectively).
792 M. F. Hammer et nl.
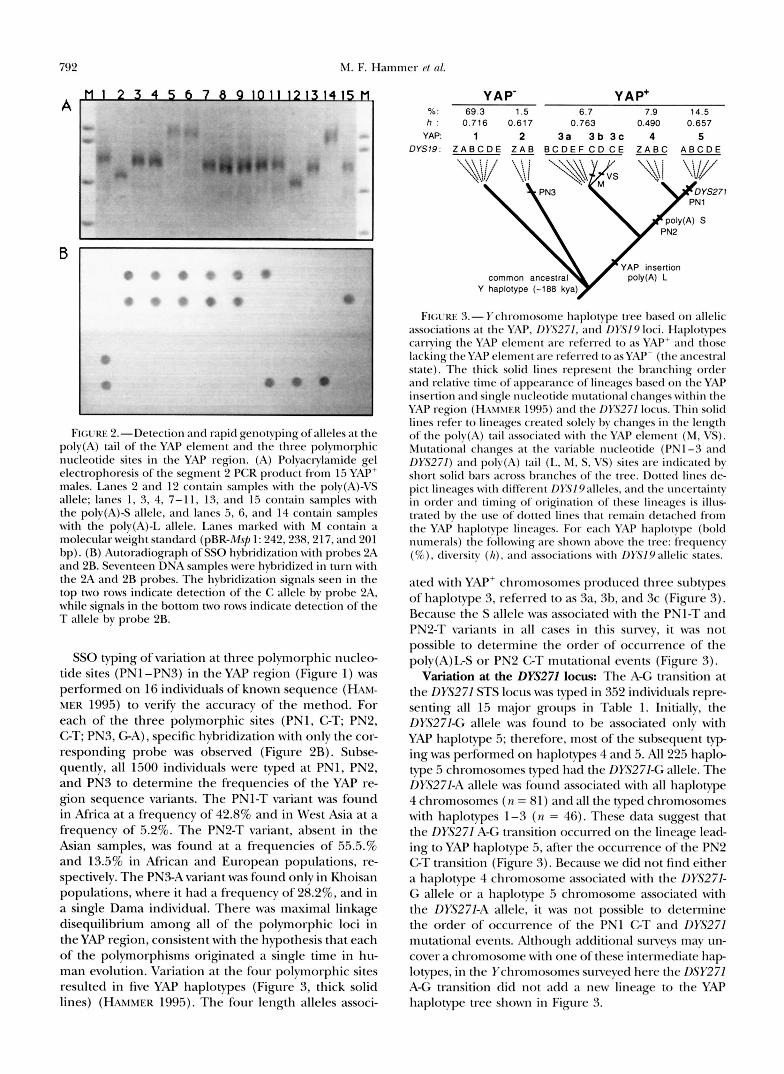
FIGL~RE Z.-Detection and rapid genotvping of alleles at the poly(A) tail of the YAP element and the three polvmorphic nucleotide sites in the YAP region. (A) Polyactylamide gel electrophoresis of the segment 2 PCR product from 1.5 YAP' males. Lanes 2 and 12 contain samples with the polv(A)-VS allele; lanes 1, 3, 4, 7-11, 13, and 15 contain samples with the polv(A)-S allele, and lanes 5 , 6, and 14 contain samples with the polv(A)-L allele. Lanes marked with M contain a molecular weight standard (pBR-Msj, 1: 242,238,217, and 201 bp). (B) Autoradiograph of SSO hybridization wi th probes 2A and 2B. Seventeen DNA samples were hybridized in turn with the 2A and 2B probes. The hybridization signals seen in the top two rows indicate detection of the C allele bv probe 2A, while signals in the bottom two rows indicate detection of the T allele bv probe 2B.
SSO typing of variation at three polymorphic nucleo- tide sites (PNl -PNS) in the YAP region (Figure 1) was performed on 16 individuals of known sequence (HXM- MER 1995) to verify the accuracy of the method. For each of the three polymorphic sites (PNl, GT; PN2, GT; PN3, GA), specific hybridization with only the cor- responding probe was observed (Figure 2B). Subse- quently, all 1500 individuals were typed at PNl, PN2, and PN3 to determine the frequencies of the YAP re- gion sequence variants. The PNl-T variant was found in Africa at a frequency of 42.8% and in West Asia at a frequency of 5.2%. The PN2-T variant, absent in the Asian samples, was found at a frequencies of 55.5.% and 13.5% in African and European populations, re- spectively. The PN3-A variant was found only in Khoisan populations, where it had a frequency of 28.2%, and in a single Dama individual. There was maximal linkage disequilibrium among all of the polymorphic loci in the YAP region, consistent with the hypothesis that each of the polymorphisms originated a single time in hu- man evolution. Variation at the four polymorphic sites resulted in five YAP haplotypes (Figure 3, thick solid lines) (HAMMER 1995). The four length alleles associ-
YAP- YAP+ %: 69.3 1.5 6.7 7.9 h : 0.716 0.617 0.763 0.490 0.657
14.5
YAP: 1 2 3a 3 b 3 c 4 5 DYS19: Z A B C D E B C D E F C D C E Z A B C A B C D E
Y haplotype (-188 kya) 7 FIGURE 3.- Ychromosome haplotype tree based on allelic
associations at the YAP, DYS271, and DYS19 loci. Haplotypes carrying the YAP element are referred to as YAP' and those lacking theYAP element are referred to asYAP- (the ancestral state). The thick solid lines represent the branching order and relative time of appcarancc of lineages based on the YAP insertion and single nucleotide mutational changeswithin the YAP region (HM!NI:.R 199.5) and the DYS271 locr~s. Thin solid lines refer to lineages created solely by changes i n the length s f the poly(A) tail associated with the YAP element (M, VS). Mutational changes at the variable nucleotide (PNI-3 and DYS.271) and poly(A) tail (L, M, S, VS) sites are indicated by short solid bars across branches of the tree. Dotted lines de- pict lineages with different DY.Sl9alleles, and the uncertainty in order and timing of origination of these lineages is illus- trated by the use of dotted lines that remain detached from the YAP haplotype lineages. For each YAP haplotype (bold numerals) the following are shown above the tree: frequency ( 7 6 ) . diversity ( I I ) , and associations with DYS19allelic states.
ated with YAP' chromosomes produced three subtypes of haplotype 3, referred to as 3a, 3b, and 3c (Figure 3). Because the S allele was associated with the PNI-T and PN2-T variant.. in all cases in this survey, it was not possible to determine the order of occurrence of the poly(A)L-S or PN2 G T mutational evens (Figure 3).
Variation at the Dl3271 locus: The A-G transition at the DYS271 STS locus was typed in 352 individuals repre- senting all 15 major groups i n Table 1. Initially, the DYS27I-G allele was found to be associated only with YAP haplotype 5; therefore, most of the subsequent typ ing was performed on haplotypes 4 and 5. A l l 225 haplo- type 5 chromosomes typed had the DYS271-G allele. The DY.5271-A allele was found associated with all haplotype 4 chromosomes ( n = 81) and all the typed chromosomes with haplotypes 1-3 ( n = 46). These data suggest that the DYS271 A-G transition occurred on the lineage lead- ing to YAP haplotype 5, after the occurrence of the PN2 G T transition (Figure 3). Because we did not find either a haplotype 4 chromosome associated with the DY.5271- G allele or a haplotype 5 chromosome associated with the DyS271-A allele, it was not possible to determine the order of occurrence of the PNl G T and DYS271 mutational events. Although additional survevs may un- cover a chromosome with one of these intermediate h a p lotypes, in the Ychromosomes surveyed here the DSY271 A-G transition did not add a new lineage to the YAP haplotype tree shown in Figure 3.

Global Human Y Haplotype Variation 793
Variation at the DYS19microsatellite locus: Polymor- phism at the DYSl9 locus on the short arm of the Y chromosome is due to differences in the number of GATA tandem repeats (ROEWER et al. 1992). Primers designed to unique sequences flanking the repeated region amplify fragments ranging in size from 178 to 206 bp in four-nucleotide increments reflecting eight to 15 copies of the GATA motif (ROEWER et al. 1992; CIMINELLI et al. 1995; SANTOS et al. 1996). In previous surveys five alleles (A-E) corresponding to the 186- to 202-bp fragments were found to be common in human populations (ROEWER et al. 1992; SANTOS et al. 1993; GOMOLKA et al. 1994; MULLER et al. 1994). Recently, three rare allele classes have been identified: the 178- bp (178-bp allele) ( CIMINELLI et al. 1995), the 182-bp (Z allele) (SANTOS et al. 1996), and the 206-bp (F allele) (HAMMER and HOW 1995).
In this survey, we found alleles Z-F at the following worldwide frequencies: 0.7%, 10.076, 27.1%, 35.5%, 18.l%, 8.4%, and O . l % , respectively. Although allele profiles for most samples studied were unimodal, the highest frequency allele vaned among groups. Similar to previous studies (GOMOLKA et al. 1994; MULLER et al. 1994; SANTOS et al. 1996), the B allele was found to be the most frequent variant in northern Europe (58.1%) (Table 1). The B allele was also the modal allele in the South European sample (mean frequency = 36.8%); however, when the Italian and Greek samples were bro- ken down into subpopulations there was a great deal of variation among these lower-level units. Some of this intruregional variation has been attributed to isolation and genetic drift (CIMINELLI et al. 1995). In contrast, the C allele was the modal allele in all East and South Asian samples (mean frequencies = 46.3% and 53.5%, respectively) except for the Koreans and Laotians where the D allele was more common. The C allele did, how- ever, predominate in a larger sample of Koreans not reported in this paper (n = 247, C = 38.9%, WOOK KIM, personal communication). This predominance of the C allele is similar to the majority of the results from other surveys of Asian populations (GOMOLKA et al. 1994; MULLER et al. 1994; HAMMER and HOW 1995). The C allele was also the modal allele in the Australasian sample (38.2%) and in mostAfrican populations (Table 1). The absence of the A allele in the Australasian sam- ple distinguished it from the East and South Asian sam- ples. Consistent with previous studies of Native Ameri- can populations (PENA et al. 1995; SANTOS et al. 1996; UNDERHILL et al. 1996), the A allele was found to pre- dominate in the Navajo sample. YAP haplotype frequencies: The frequencies of the
five YAP haplotypes in all 60 populations examined in this study are given in Table 1 and are shown for 24 selected groups in Figure 4 (color). Haplotype 1 (filled- white in the pie chart of Figure 4) was found in all populations and was the most frequent worldwide (mean frequency = 69.2%). Other than a single West- ern Australian with haplotype 4 (not shown in Figure
FIGURE 4.-Geographical distribution of Y chromosome haplotype frequencies. Nine of the 15 major groups in Table 1 are shown by large circles. The 15 smaller circles are compo- nent populations of the other six major groups. The frequen- cies of the five YAP haplotypes are shown as colored pie charts (see left insert at bottom of figure for color codes). The pro- portions of the different DYS19 alleles associated with each YAP haplotype are indicated by solid lines within the colored portions of the pie chart (see right insert for orientation of DYSl9 alleles within each YAP haplotype). When six DYSlB alleles are present, the order of appearance is as shown in the insert; however, when fewer alleles are present, consult Figure 5A for their identity and order. Three-letter codes not defined in Table 1 include: Dam, Dama; Lem, Lemba; Jap, Japanese; Tib, Tibetans; Kor, Koreans; Tai, Taiwanese; Sch, South Chinese; Ind, Indians; Sea, Southeast Asians; Png, Pa- pua New Guineans; Aap, Australian Aboriginal People; Bri, British; Ger, Germans; Ita, Italians; Gre, Greeks.
4, see below), haplotype 1 was the only YAP haplotype found in the New World, South Asian, and Australasian samples. Furthermore, within East Asia it was the only haplotype found in the Korean, South Chinese, and Taiwanese samples (except for a single Taiwanese indi- vidual with haplotype 3). Haplotype 2 (filled-green in Figure 4) was limited to the Khoisan-speaking popula- tions and varied in frequency from 4.5% in the Dama to 41.9% in the Tsumkwe San. Except for the Khoisan, haplotype 3 (filled-red in Figure 4) was found in all African samples (mean African frequency = 6.1%) at frequencies ranging from 3.6% (West Bantus) to 16.1% (West Africans). Haplotype 3 was not found in the Euro- pean samples (except in a single Sicilian not apparent in Figure 4 due to its low frequency) but was the only YAPf haplotype in the East Asian samples (mean fre- quency = 22.4%). Within East Asia haplotype 3 was found at high frequencies only in the Japanese and Tibetan samples, and in a single Taiwanese male (Table 1). Haplotype 4 (filled-blue in Figure 4) was widespread in Africa (except in the Pygmy samples) and ranged in frequency from 2.0% in East Africa to 46.2% in North Africa (mean African frequency = 12.7%). This haplo- type had a distribution pattern opposite to that of h a p

794 M. F. Hammer et al.
lotype 3 outside of Africa: it was present as the major YAP’ haplotype in Europe (13.5%) and was absent in the Asian samples. Haplotype 4 was also present in a single aboriginal male from Western Australia; however, this occurrence is likely due to European paternal ad- mixture. Haplotype 5 (filled-yellow in Figure 4) was limited almost entirely to sub-Saharan Africa where it was the most frequent YAP haplotype (mean frequency = 52.1 %) . The frequency of haplotype 5 ranged from 17.9% in the Khoisan sample to 76.4% in the West Bantu sample. This haplotype was also found at low frequencies in the West Asian (5.2%) and the North African (2.2%) samples.
YAP/DYS19 combination haplotype frequencies: The association of the fiveYAP haplotypes (including poly(A) tail subtypes) with alleles at DYS19 produced 27 Y-chro- mosome combination haplotypes (Figure 3). Histogram representations of the 27 combination haplotype fre- quencies are given for the 15 major groups in Figure 5A. YAP- haplotypes lC, lB, and 1D were the most common worldwide with frequencies of 25.9%,22.9%, and 11.6%, respectively. The most common YAP+ haplotypes in this survey were haplotypes 5C (6.5%), 4A (5.2%), and 5D (5.0%). All other haplotypes were relatively rare with frequencies under 5%. There was a nearly continuous series of DYSl9 allele sizes associated with each YAP h a p lotype (Figure 3, dotted lines), while DYSl9alleles C and D, and C and E were associated with haplotypes 3b and 3c, respectively (Figure 3, thin solid lines). Alleles at the variable nucleotide and the poly(A) tail sites appear to have originated a single time on the haplotype tree in Figure 3 (short solid bars). However, several alleles at the DYSl9locus probably originated independently multiple times. For example, the Z allele, associated with haplo- types 1, 2, and 4, probably arose from the A allele on at least three occasions. A minimum of 21 changes in allele size of one repeat unit (15 parallel changes) are required to account for the distribution of DYSl9 alleles on the haplotype tree. This is consistent with the (single) step wise-mutation model and high rate of evolution of short tandem repeats (WEBER and WONG 1993).
Despite the convergent pattern of evolution at the DYSl9locus, there were several examples of strong asso- ciations between YAP haplotypes and DYSl9 alleles. In sub-Saharan Africa, haplotype 1 was negatively associ- ated with DYSl9alleles Z and A (D‘ = -0.63 and -0.79, respectively), haplotype 2 was positively associated with DYSlPZ (D’ = 0.88), and haplotype 4 was positively associated with DYSl9A (D’ = 0.71). Haplotype 3aB was widely distributed in Africa (Pygmies, West Africans, East Bantus, West Bantus, Dama, and Lemba) (Figure 5A). Haplotype 3a was associated with other DYSl9 al- leles only in West Africa (C and D) and East Africa (C) . In contrast, haplotype 3 in East Asia was never found with the DYS19 B allele, and haplotype 1 was strongly associated with alleles A and B (D’ = 1.0). In Europe there were strong associations between haplotype 1 and
alleles C (D’ = 0.930), D (D‘ = 1 .O) , and E (D‘ = 1 .O) , as well as between haplotype 4 and allele A (D’ = 0.82).
Two African groups, the Dama and Lemba, were termed “enigmatic” because of unclear origins and possible extensive admixture. Their combination haplo- type distributions (Figure 5A) were indicative of pater- nal admixture. The Khoi-speaking Dama shared haplo- type 2 with the Khoisan and haplotype 3 with non- Khoisan African groups. Moreover, their overall profiles for haplotypes 1 and 5 were more similar to those of the non-Khoisan populations substantiating other bio- logical evidence for the kinship of the Dama with these non-Khoisan groups (SPURDLE and JENKINS 1992). The Venda-speaking Lemba exhibited an extremely high frequency of haplotype 1B (58.8%), which was also found at high frequencies in West Asia (48.3%) and North Africa (22.6%), but was absent in other East Bantu speakers. This pattern may reflect the retention of Semitic Ychromosome haplotypes by this East Bantu- speaking population characterized by its rudimentary Semitic culture (SPURDLE and JENKINS 1992, 1996). Haplotype 5 in the Lemba, however, clearly had a sub- Saharan African origin supporting the hypothesis of a significant male contribution from neighboring South African Bantu-speaking populations.
DYS19 diversity: The regional differences in patterns of variation at the DYSl9 locus were reflected in differ- ent diversity values ( h -+ standard error) among the 15 major groups (data not shown). Low diversity values were found in the North European sample due to the overwhelming prevalence of the B allele (0.600 ? 0.005). Other diversity values were 0.620 % 0.005,0.644 ? 0.004, 0.695 f 0.001, 0.715 -+ 0.003, 0.718 2 0.002, and 0.736 2 0.001 for the West Asian, South Asian, East Asian, North African, Australasian, and South Euro- pean samples, respectively. The lowest diversity values in this survey were found in the Navajo sample (0.569 f 0.007) and in the enigmatic southern African group, the Lemba (0.569 -+ 0.013).
This study represents the first large-scale survey of variation at the DYS19 locus in African populations. The DYS19 allelic diversity was greater in sub-Saharan African populations (0.763 t 0.001) than in Austral- asian (0.718 ? 0.002), European (0.712 ? 0.001), or Asian (0.695 5 0.001) populations (Bonferroni Test, P < 0.001). Within Africa, diversity values were 0.631 5 0.005, 0.708 ? 0.006, 0.719 ? 0.005, and 0.769 2 0.004 in the East Bantu, West Bantu, East African, and West African samples, respectively.
The most unusual profiles were seen in the Khoisan and Pygmy populations where there were roughly bi- modal distributions of alleles of widely different sizes. This pattern of widespread allelic variation was re- flected in higher diversity values than those seen in the rest of the world (0.820 -+ 0.002 and 0.823 5 0.006, respectively, Bonferroni Test, P < 0.001). The Khoisan were found to have a relatively high frequency of the unusual Z allele. This allele, not observed in worldwide

Global Human Y Haplotype Variation 795
A H a p l o t y p e I Hap.l Haplo type 3 Haplo type 5
Japanese
4
4 0 7 T i b e t a n s
30-
20"
10"
0
W e s t A f r i c a n s m Koreans
4
30-
20- E a s t A f r i c a n s
a 30"
East Bantus
40- W e s t B a n t u s
20.-
o . : : : : : : - : : : : : : : : : = : : : : , ,
Dama
" + : . ; : : : : : : : : . I : : :
Lernba
I . . . . .
n D 60, X W e s t A s i a n s
I
E a s t A s i a n s
.I
S o u t h A s i a n s
I
South Europeans
I , , ; : : : : : , N o r t h E u r o p e a n s
-. . , . . . I . ,
N a t i v e A m e r i c a n s
I YAP I 2 4 5 3a 3b 3c - "- ~
DVS19 2 A B C D E Z A U B C D E C D C E A U C A B C D E
FIGURE 5.-Histogram representations of YAP/DYSI9 com- bination haplotype frequencies. (A) Twenty-five combination haplotype frequencies for the 15 major groups (the two re- maining combination haplotypes are not shown: haplotype 3aF found in a single Japanese male and haplotype 42 found in a single Egyptian male. (B) Combination haplotype fre- quencies for the five component populations of East Asia.
populations studied previously, was recently reported in a single !Kung cell line (SANTOS et al. 1996). We identified the Z allele in eight out of 78 (10.3%) Khoi-
T a i w a n e s e
, South Ch inese
I YAP I 2 4 5 3a 3b 3c - "- -
D V S l 9 2 A U C D E 2 A B U C D E C D C E A U C A B C D E
FIGURE 5. - Continued
san surveyed, as well as in single Pygmy, Egyptian, and Taiwanese males. YAP haplotype diversity: The numbers of the five
YAP haplotypes found in each major population group ranged from one in South Asia and North America to four in all African populations except the Pygmies (Ta- ble l and Figure 4 color). Only one population, the possibly admixed enigmatic Dama, was found to con- tain all five YAP haplotypes. Most non-African popula- tions had just two haplotypes (East Asians, North Europeans, and Australasians), although the South Eu- ropean and West Asian populations had low frequen- cies of a third haplotype. These patterns of variation in YAP haplotype number and frequency were reflected in significantly greater haplotype diversity in sub-Saharan Africa (0.630 ? 0.001) compared with Asia (0.283 f 0.001) and Europe (0.239 f 0.001) (data not shown; Bonferroni Test, P < 0.001).
YAP/DYS19 combination haplotype diversity: In Fig- ure 4 the proportions of the different DYS19 alleles associated with each YAP haplotype are indicated by solid lines within the colored portions of the pie chart. When considering the 27 combination haplotypes, the number found in each major group ranged from three in the Native American sample to 14 in the East Asian sample (Figure 5A). When the populations making up the East Asian sample were examined separately, the maximum number of haplotypes ranged from four in the Koreans to 13 in the Japanese (Figure 5B). In Africa the number ranged from nine in the Bantu-speaking populations to 11 in the Pygmy, Khoisan, and North African populations. Nine combination haplotypes were found in South Europe, seven in West Asia, six in North Europe, and five in South Asia and Australasia.
Haplotype diversities determined on the basis of the number and relative abundance of each of the 27 com- bination haplotypes are shown in Figure 6A for the individual populations while those for the major group- ings are shown in Figure 6B. For the total sample of
796 M. F. Hammer P t 01.
0.400 i
Africans WAS EAS SAS SEU NEU AUS NAN
B
- 0.900 -.- """"""""""""-"""""" t . I
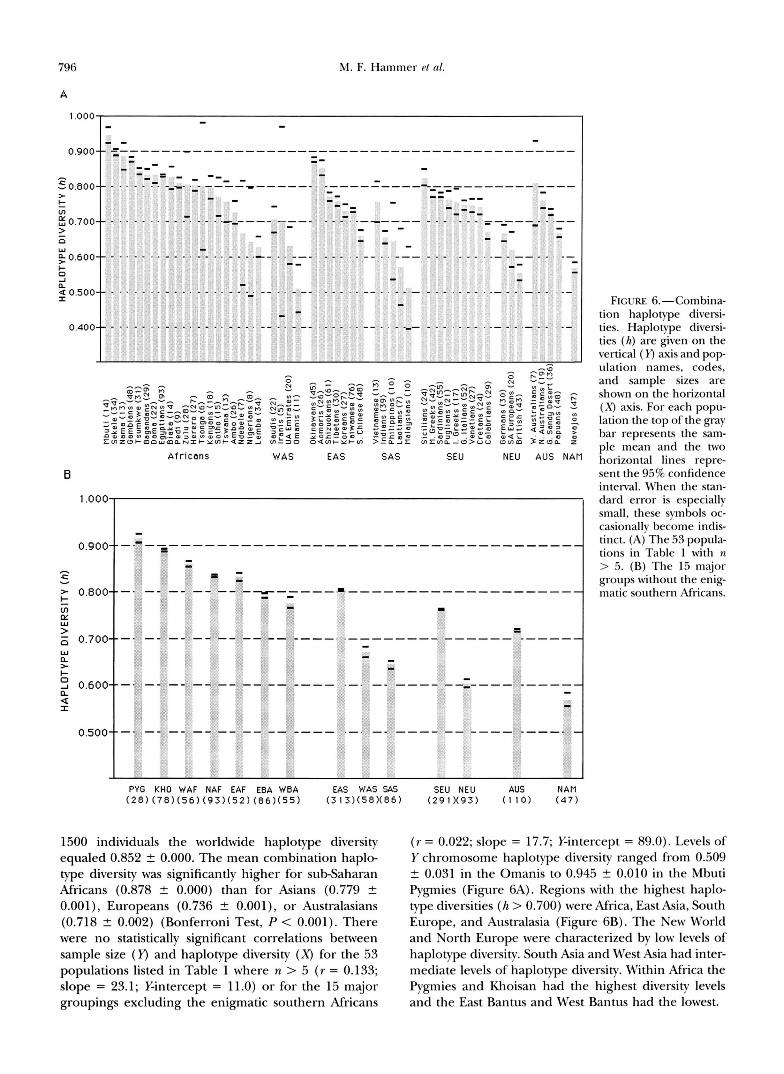
FIGURE 6.-Combina- tion haplotype diversi- ties. Haplotype diversi- ties ( h ) are given on the vertical ( Y) axis and p o p ulation names, codes, and sample sizes are shown on the horizontal ( X ) axis. For each popu- lation the top of the gray bar represents the sam- ple mean and the two horizontal lines repre- sent the 95% confidence interval. When the stan- dard error is especially small, these symbols oc- casionally become indis- tinct. (A) The 53 popula- tions in Table 1 with n > 5. (B) The 15 major groups without the enig- matic southern Africans.
1500 individuals the worldwide haplotype diversity equaled 0.852 2 0.000, The mean combination haplo- type diversity was significantly higher for subSaharan Africans (0.878 2 0.000) than for Asians (0.779 2 0.001), Europeans (0.736 t 0.001), or Australasians (0.718 2 0.002) (Bonferroni Test, P < 0.001). There were no statistically significant correlations between sample size (Y) and haplotype diversity (X) for the 53 populations listed in Table 1 where n > 5 ( r = 0.133; slope = 23.1; Y-intercept = 11.0) or for the 15 major groupings excluding the enigmatic southern Africans
( r = 0.022; slope = 17.7; %intercept = 89.0). Levels of Y chromosome haplotype diversity ranged from 0.509 t 0.031 in the Omanis to 0.945 2 0.010 in the Mbuti Pygmies (Figure 6A). Regions with the highest haplo- type diversities ( h > 0.700) were Africa, East Asia, South Europe, and Australasia (Figure 6B). The New World and North Europe were characterized by low levels of haplotype diversity. South Asia and West Asia had inter- mediate levels of haplotype diversity. Within Africa the Pygmies and Khoisan had the highest diversity levels and the East Bantus and West Bantus had the lowest.

797 Global Human Y Haplotype Variation
TABLE 2
Diversity of five YAP haplotypes in six geographic regions
YAP haplotype
1 2 3 4 5
SAF 0.730 ? 0.002 0.617 ? 0.013 0.493 ? 0.017 0.416 ? 0.019 0.656 ? 0.001
NAF 0.667 ? 0.005 - - 0.614 ? 0.006
AS1 0.639 ? 0.001 - 0.715 ? 0.004 - -
EUR 0.662 ? 0.001 - - 0.275 ? 0.011 -
AUS 0.718 ? 0.002 - - - -
NAM 0.569 ? 0.007 - - - -
(122) (23) (29) (22) (213)
(47) (43)
(382) (70)
(331) (52)
(109)
(47)
-
B
Values are h ? SE, with sample size in parentheses. SAF, sub-Saharan Africa; NAF, North Africa; M I , Asia; EUR, Europe; AUS,
“ Haplotype not present. Australasia; NAM, North America.
Diversity values not indicated when haplotype is present in fewer than three individuals.
The high levels of haplotype diversity in East Asia were mainly due to the high haplotype diversity of the Japanese (0.835 ? 0.002). This diversity value is equiva- lent to the North African and East African values. It is interesting that the island of Okinawa had one of the highest haplotype diversities in the world (0.876 5 0.003), lower only than the values for the Mbuti Pygmies and Sekele San (t-tests, P < 0.0001). The haplotype diversity of the East Asian sample excluding the Japa- nese was 0.752 ? 0.001. This value lies between those from South Europe and Australasia.
Regional variation in diversity by YAP haplotype: The genetic diversity carried by each of the five YAP haplotypes was determined based on the number and relative abundance of DYSl9alleles associated with each haplotype in six global regions (Table 2). Haplotype 1 diversity was greatest in sub-Saharan Africa followed by Australasia, Asia, North Africa, Europe, and North America (all painvise comparisons were statistically sig- nificant at the 0.001 level except the North Africa/ Europe comparison where P > 0.05). Sub-Saharan Afri- can populations were characterized by widely divergent diversity levels (data not shown). These values ranged from 0.083 ? 0.015 in the East Bantus (the lowest of all the 15 major groups in Table 1) to 0.772 t 0.032 in the West Bantus and 0.833 5 0.020 in the Pygmies (the two highest values of the 15 major groups). Al- though haplotype 3 diversity was greater in Asians than in sub-Saharan Africans (Bonferroni Test, P < 0.001) (Table 2), the East Asian (0.715 5 0.004) and West African (0.722 ? 0.032) diversity values did not differ significantly from each other (Bonferroni Test, P > 0.05). Haplotype 4, present in three of the six geo- graphic regions, reached its highest diversity value in North Africa. Although haplotype 2 was confined to the Khoisan, its diversity value was relatively high. Likewise,
haplotype 5 had a relatively high diversity value but was more widespread within sub-Saharan Africa and only occurred at low frequencies in North Africa and West Asia.
Fst and PHIst analyses: The overall worldwide Fst value based on the 15 major groups in Table 1 (exclud- ing the enigmatic southern Africans) was 0.302 for the YAP data. This Fst estimate is concordant with expecta- tions based on the fourfold lower effective population size of the Ychromosome relative to autosomes ( H A ” MER 1995). Worldwide Fst values for a variety of autoso- mal genetic data sources as well as for craniometric data sets cluster around 0.1 (RELETHFORD 1995). In contrast, the worldwide PHIst value for the DYS19 data was only 0.163. This lower than expected figure may be ex- plained by higher mutation and convergence rates for the DYSl9 locus relative to the YAP nucleotide substitu- tional sites. CIMINELLI et al. (1995) found similar results in “Caucasoid” populations and concluded that con- vergent evolution of DYS19 alleles in different popula- tions may result in the underestimation of the among- group variance for microsatellite loci.
Population trees: Maximum likelihood, neighbor- joining, Fitch-Margoliash, and UPGMA methods were employed to analyze the frequencies of the 27 YAP/ DYS19 combination haplotypes. Neighbor-joining (NJ), Fitch-Margoliash (FM) , and UPGMA analyses were based on genetic distances generated from both the Chord (a) and REYNOLDS et aL’s (Fst) equations. For heuristic purposes, a majority-rule consensus tree based on the seven possible combinations of tree-building and dis- tance measures (ML, NJ/@, NJ/Fst, FM/4D, FM/Fst, UPGMA/4n, and UPGMA/Fst) is shown in Figure 7. All seven methods consistently grouped the North African/ non-African populations into a single cluster ( l ) , and all sub-Saharan African populations (except the Khoisan)
798 M. F. Hammer et al.
I
- 7 E A S
5 S A S
A U S
3
4
6 NEU
7 4 W A S
S E U
4 - A U S
6 NEU
7 4 W A S
I L S E U
b
3 E A F - 6 W B A
7 W A F
6 . IJ E B A
5 I PYG
KHO -
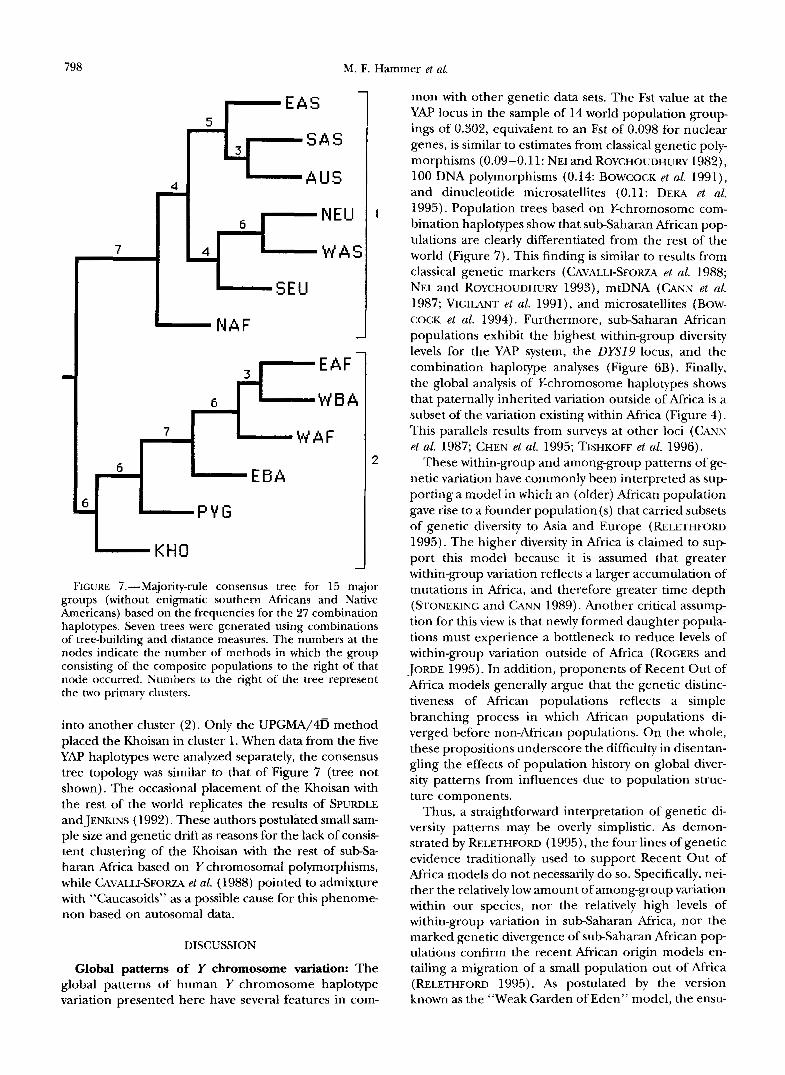
FIGURE 7.-Majority-rule consensus tree for 15 major groups (without enigmatic southern Africans and Native Americans) based on the frequencies for the 27 combination haplotypes. Seven trees were generated using combinations of tree-building and distance measures. The numbers at the nodes indicate the number of methods in which the group consisting of the composite populations to the right of that node occurred. Numbers to the right of the tree represent the two primary clusters.
into another cluster (2). Only the UPGMA/4D method placed the Khoisan in cluster 1. When data from the five YAP haplotypes were analyzed separately, the consensus tree topology was similar to that of Figure 7 (tree not shown). The occasional placement of the Khoisan with the rest of the world replicates the results of SPURDLE andJENKINs (1992). These authors postulated small sam- ple size and genetic drift as reasons for the lack of consis- tent clustering of the Khoisan with the rest of subsa- haran Africa based on Y chromosomai polymorphisms, while CAVALI.I-SFORZA et al. (1988) pointed to admixture with “Caucasoids” as a possible cause for this phenome- non based on autosomal data.
DISCUSSION
Global patterns of Y chromosome variation: The global patterns of human Y chromosome haplotype variation presented here have several features in com-
mon with other genetic data sets. The Fst value at the YAP locus in the sample of 14 world population group ings of 0.302, equivalent to an Fst of 0.098 for nuclear genes, is similar to estimates from classical genetic poly- morphisms (0.09-0.11: NEI and ROYCHOUDHURY 1982), 100 DNA polymorphisms (0.14: BOWCOCK et al. 1991), and dinucleotide microsatellites (0.11: DEKA et al. 1995). Population trees based on Y-chromosome com- bination haplotypes show that sub-Saharan African pop- ulations are clearly differentiated from the rest of the world (Figure 7). This finding is similar to results from classical genetic markers (CAVALLI-SFORZA et al. 1988; NEI and ROYCHOUDHURY 1993), mtDNA (CANN et al. 1987; VIGILANT et al. 1991), and microsatellites (BOW- COCK et al. 1994). Furthermore, sub-Saharan African populations exhibit the highest within-group diversity levels for the YAP system, the DYS19 locus, and the combination haplotype analyses (Figure 6B). Finally, the global analysis of Y-chromosome haplotypes shows that paternally inherited variation outside of Africa is a subset of the variation existing within Africa (Figure 4). This parallels results from surveys at other loci (CANN et al. 1987; CHEN et al. 1995; TISHKOFF et al. 1996).
These within-group and among-group patterns of ge- netic variation have commonly been interpreted as s u p porting a model in which an (older) African population gave rise to a founder population(s) that carried subsets of genetic diversity to Asia and Europe (RELETHFORD
1995). The higher diversity in Africa is claimed to s u p port this model because it is assumed that greater within-group variation reflects a larger accumulation of mutations in Africa, and therefore greater time depth (STONEKING and CANN 1989). Another critical assump- tion for this view is that newly formed daughter popula- tions must experience a bottleneck to reduce levels of within-group variation outside of Africa (ROGERS and JORDE 1995). In addition, proponents of Recent Out of Africa models generally argue that the genetic distinc- tiveness of African populations reflects a simple branching process in which African populations di- verged before non-African populations. On the whole, these propositions underscore the difficulty in disentan- gling the effects of population history on global diver- sity patterns from influences due to population struc- ture components.
Thus, a straightforward interpretation of genetic di- versity patterns may be overly simplistic. As demon- strated by RELETHFORD (1995), the four lines of genetic evidence traditionally used to support Recent Out of Africa models do not necessarily do so. Specifically, nei- ther the relatively low amount of among-group variation within our species, nor the relatively high levels of within-group variation in sub-Saharan Africa, nor the marked genetic divergence of sub-Saharan African p o p ulations confirm the recent African origin models en- tailing a migration of a small population out of Africa (RELETHFORD 1995). As postulated by the version known as the “Weak Garden of Eden” model, the ensu-
Global Human Y Haplotype Variation 799
ing expansions in effective population size may have occurred much later than this origin (HARPENDING et al. 1993). Also, the recent age of our common mito- chondrial DNA and Y chromosome ancestors may indi- cate a small effective population size throughout the Late Middle Pleistocene, rather than the time of origin of anatomically modern humans. Even within the con- text of a recent African origin model, a single emigra- tion from a homogeneous African source population is seen as being too simplistic. For example, as discussed by LAHR and FOLEY (1995), human behavioral, linguis- tic, morphological, and genetic diversity patterns can also be interpreted in terms of multiple dispersals from a variable population in Africa. These multiple dispers- als probably originated from different parts of Africa at different times and left Africa through at least two independent routes.
Numerous explanations are possible for our global Y-chromosome haplotype patterns, some of which are not mutually exclusive (TAKAHATA 1994). In addition to the recent African origin model with synchronic or delayed population size expansion and the multiple Af- rican dispersal hypothesis mentioned above, other models deserve serious consideration. For instance, sce- narios based on the following evolutionary processes are all quite plausible: (1) restricted, recurrent gene flow via isolation by distance, (2) long-distance coloniza- tion followed by long-range gene flow, or (3) one or more migrations followed by extensive genetic drift due to founder effects and small population sizes leading to random haplotype extinctions. Although we cannot yet exclude any of these hypotheses based on rigorous inferential statistical tests, we propose that a multiple migration explanation appears to be eminently compat- ible with our data.
In the aggregate, the above models and scenarios employ a continuum for the amounts of gene flow and genetic drift responsible for global diversity patterns. Our picture of global Y-chromosome variation may re- sult from multiple evolutionary processes including both short range (1) and long range (2) migration, as well as genetic drift and extinction (3) . The difficulty in distinguishing these evolutionary processes and their effects is underscored by clear-cut examples in which genetic drift can obscure population history (RELETH- FORD 1996) or where branching and migration models can produce the same pattern of genetic distances (RE- LETHFORD 1995). The potentially complicating phe- nomenon of recurrent mutation involving single nucle- otide and Alu insertion polymorphisms is less likely to be involved; nevertheless, it cannot be ignored.
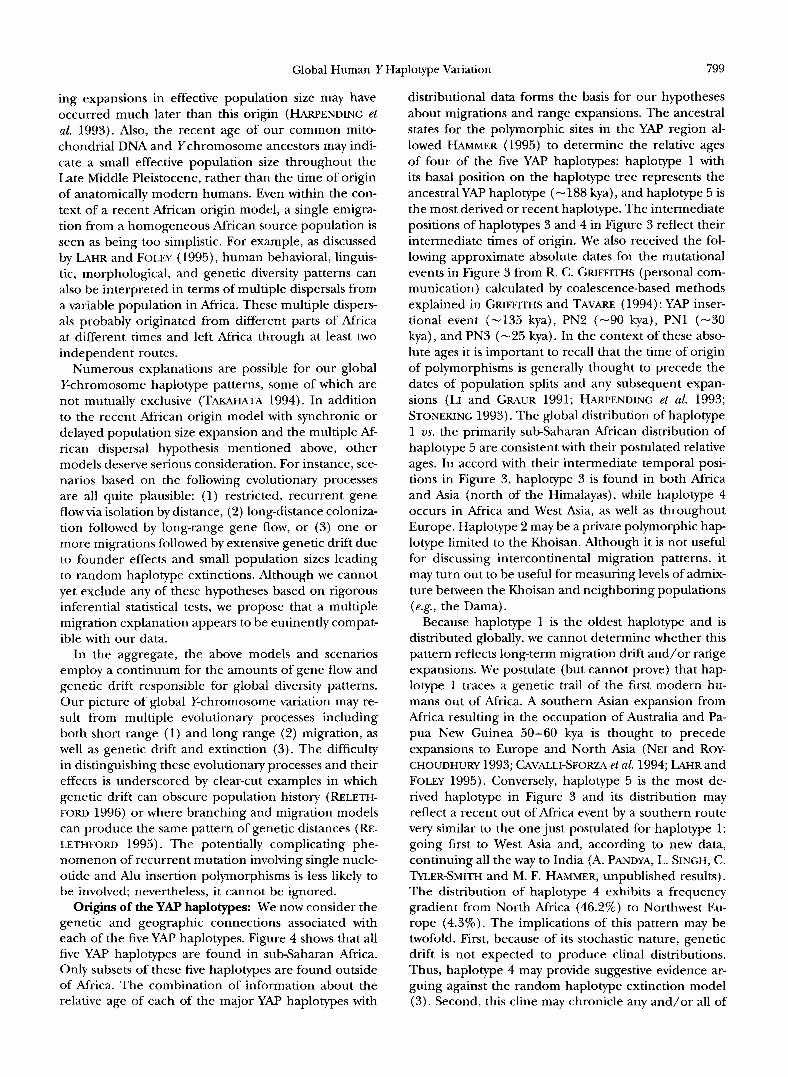
Origins of the YAP haplotypes: We now consider the genetic and geographic connections associated with each of the five YAP haplotypes. Figure 4 shows that all five YAP haplotypes are found in sub-Saharan Africa. Only subsets of these five haplotypes are found outside of Africa. The combination of information about the relative age of each of the major YAP haplotypes with
distributional data forms the basis for our hypotheses about migrations and range expansions. The ancestral states for the polymorphic sites in the YAP region al- lowed HAMMER (1995) to determine the relative ages of four of the five YAP haplotypes: haplotype 1 with its basal position on the haplotype tree represents the ancestral YAP haplotype (- 188 kya), and haplotype 5 is the most derived or recent haplotype. The intermediate positions of haplotypes 3 and 4 in Figure 3 reflect their intermediate times of origin. We also received the fol- lowing approximate absolute dates for the mutational events in Figure 3 from R. C. GRIFFITHS (personal com- munication) calculated by coalescence-based methods explained in GRIFFITHS and TAVARE (1994): YAP inser- tional event (-135 kya), PN2 (-90 kya), PNl (-30 kya) , and PN3 (-25 kya). In the context of these abso- lute ages it is important to recall that the time of origin of polymorphisms is generally thought to precede the dates of population splits and any subsequent expan- sions (LI and GRAUR 1991; HARPENDING et al. 1993; STONEKING 1993). The global distribution of haplotype 1 us. the primarily sub-Saharan African distribution of haplotype 5 are consistent with their postulated relative ages. In accord with their intermediate temporal posi- tions in Figure 3, haplotype 3 is found in both Africa and Asia (north of the Himalayas), while haplotype 4 occurs in Africa and West Asia, as welt as throughout Europe. Haplotype 2 may be a private polymorphic hap- lotype limited to the Khoisan. Although it is not useful for discussing intercontinental migration patterns, it may turn out to be useful for measuring levels of admix- ture between the Khoisan and neighboring populations (e.g., the Dama) .
Because haplotype 1 is the oldest haplotype and is distributed globally, we cannot determine whether this pattern reflects long-term migration drift and/or range expansions. We postulate (but cannot prove) that hap- lotype 1 traces a genetic trail of the first modern hu- mans out of Africa. A southern Asian expansion from Africa resulting in the occupation of Australia and Pa- pua New Guinea 50-60 kya is thought to precede expansions to Europe and North Asia (NEI and ROY- CHOUDHURY 1993; CAVALLI-SFORZA et al. 1994; LAHR and FOLEY 1995). Conversely, haplotype 5 is the most de- rived haplotype in Figure 3 and its distribution may reflect a recent out of Africa event by a southern route very similar to the one just postulated for haplotype 1: going first to West Asia and, according to new data, continuing all the way to India (A. PANDYA, L. SINGH, C. TYLER-SMITH and M. F. HAMMER, unpublished results). The distribution of haplotype 4 exhibits a frequency gradient from North Africa (46.2%) to Northwest Eu- rope (4.3%). The implications of this pattern may be twofold. First, because of its stochastic nature, genetic drift is not expected to produce clinal distributions. Thus, haplotype 4 may provide suggestive evidence ar- guing against the random haplotype extinction model (3). Second, this cline may chronicle any and/or all of

800 M. F. Hammer et al.
the following population movements to and through Europe: (1) the Levantine expansion of anatomically modern humans (ie., -40 kya) involving the eventual demise of the Neanderthals (STRINGER and GAMBLE 1993), (2) the slightly later pre-agricultural migration ( i .e . , -25 kya) detected by mtDNA data (RICHARDS et n1. 1996), or ( 3 ) the even more recent Neolithic expansion (ie., - 10 kya) associated with the spread of agriculture as postulated by AMMERMAN and CAVAILI-SFORZA’S (1984) demic diffusion model.
In each of the preceding cases, an argument could be made for migrations that originated within Africa at different times and places, and that exited Africa via the two routes proposed by LAHR and FOLEY (1995): a southern route through the horn of Africa to West Asia, South Asia, and eventually to Australasia, and a north- erly route through North Africa, the Levant, and even- tually to Europe. The diversity of each YAP haplotype may also be used to bolster hypotheses regarding the origins and ages of the migrational events discussed above. Haplotype 1 diversity was greatest in sub-Saharan Africa, which can provisionally be interpreted to sup- port an African origin model (Table 2). Australasia ex- hibits the second highest level of haplotype 1 diversity; thus, an argument can be made that Australasia repre- sents the terminus of an early out of Africa migration. Haplotype 2 was confined to the Khoisan and its high diversity value may reflect either great antiquity in Af- rica, a wider geographic distribution (CAVALLI-SFORZA et nl. 1994), and/or a larger effective population size for the ancestral Khoisan. Haplotype 4 reached its highest diversity level in North Africa. Although haplotype 5 occurred at low frequencies in West Asia and North Africa, it attained higher frequencies, greater diversity, and was more widespread in sub-Saharan Africa. Al- though the present distributions of haplotypes 2,4, and 5 are compatible with African origin models, the haplo- type 3 data are indicative of a possible Asian origin (see below) while the global occurrence of haplotype 1 is consistent with any Old World geographic origin. African us. Asian origin of YAP haplotype 3: As in
the cases of haplotypes 4 and 5 , the world distribution of haplotype 3 (ie., widespread in Africa and present in localized regions outside of Africa) can be interpre- ted to fit a sub-Saharan African origin model. However, unlike the cases of haplotypes 4 and 5, the diversity data in Table 2 lead to more complicated scenarios. The statistically significant higher level of diversity associ- ated with haplotype 3 in Asia compared with sub-Sa- haran Africa (Bonferroni Test, P < 0.001) may be inter- preted in favor of an Asian origin of haplotype 3. Because haplotypes 4 and 5 are derived from haplotype 3 and account for the majority (55.8%) of Y chromo- somes in Africa, this hypothesis implies that a major component of African diversity is derived from Asia and contradicts the African origin hypothesis. Also, the fre- quency of haplotype 3 in East Asia (22.4%) is three times higher than its average frequency (7.1%) in sub-
Saharan Africa. One of the consequences of a putative Asian origin for haplotype 3 is that all YAP+ chromo- somes (Figure 3, see YAP insertion leading to haplo- types 3-5) also must have an Asian origin contra HAM- MER (1994). New data from a different locus on the Y chromosome in which the Asian form of haplotype 3 is shown to be ancestral to the African form of haplotype 3 also support this Asian origin hypothesis (T. ALTHEIDE
and M. F. HAMMER, unpublished data). An alternative to an Asian origin of haplotype 3 is an
African origin hypothesis coupled with a subsequent reduction in the diversity associated with haplotype 3 in Africa. This hypothesis is supported by the finding of equivalent levels of haplotype 3 diversity in West Af- rica and East Asia, and much lower levels of diversity associated with haplotype 3 in other surveyed regions of sub-Saharan Africa (Figure 5A). The pattern of higher diversity in West Africa compared with the Bantu-speak- ing populations in southern and eastern Africa (Figure 6B) may be due to founder effects associated with the Bantu expansion (CAVALLI-SFORZA et ul. 1994). The lack of close clustering of the East and West Bantus as well as the inconsistent placement of the West Bantus in Figure 7 could also be due to the effects of genetic drift.
YAP haplotype 3 and East Asian population affini- ties: We initially grouped the Japanese, Tibetans, Tai- wanese, Koreans, and South Chinese into a single major East Asian group based on geographic and ethnohistor- ical criteria. The Y chromosome data presented here provide evidence for significant differences among pop- ulations within this grouping. For example, the highest world frequencies of YAP haplotype 3 are found in Ja- pan (41.7%) and Tibet (46.7%); whereas, the frequency of this haplotype is <2% in all other East Asian popula- tions (Table 1). Also, when the frequencies of the com- bination haplotypes are viewed separately for these five populations (Figure 5B), it can be seen that the Japa- nese and Tibetans share several haplotypes that are not present in the other groups (except for a single Taiwan- ese with haplotype 3aC). The distinctiveness of the Japa- nese and Tibetans with respect to the other East Asian groups is also apparent in dendrograms based on the 27 combination haplotypes (data not shown). The simi- larity between the Tibetan and Japanese populations makes sense in the context of other studies showing a northern Asian (ie., Mongolian) origin for Tibetans (NEI and ROYCHOLJDHURY 1993; TORRONI el ul. 199413).
CAVAILI-SFORZA et nl. (1994) suggest that populations between the Yangtse and Yellow Rivers in China form the dividing line between Northeast Asians and South- east Asians. The Koreans (who are situated north of the Yangtse River) are generally considered to be a North Asian group (NEI and ROYCHOUDHURY 1993; CAVAILI- SFORZA et nl. 1994). This would lead us to expect that the Koreans would be more similar to the Japanese and Tibetans than to the South Chinese and Taiwanese in Y chromosome haplotype frequencies. Also, the Yayoi

Global Human Y Haplotype Variation 801
migration entered Japan through the Korean peninsula 2300 years ago (HAMMER and HOW 1995). However, both the haplotype 3 and combination haplotype data place the Koreans with the South Chinese and Taiwan- ese. One explanation for this unexpected affinity is that a recent range expansion from South China has re- sulted in the replacement of haplotype 3 by haplotype 1 in Korea.
Global patterns of Y chromosome diversity: The highest values for Y chromosome combination haplo- type diversity are generally found in sub-Saharan Africa (Figure 6B). This pattern is similar to results from other kinds of genetic data as mentioned above and can be attributed to great population antiquity and/or large effective population size in subSaharan Africa. Exten- sive admixture can also lead to high diversity levels as in the case of the North African sample that comes from a fairly wide area around Cairo. Urban popula- tions from North African countries are thought to be admixed with contributions from Berbers and Bedou- ins, as well as from Mediterranean and sub-Saharan African populations (CAVALLI-SFORZA et al. 1994). High levels of diversity outside of Africa are concentrated in East Asia, South Europe, and Australasia. Although a claim can be made that the Australasian diversity levels reflect remnants of an old population system, the South Europe diversity levels are more likely a product of ex- tensive admixture as exemplified by the Sicilians who have the highest diversity value of all European popula- tions (Figure 6A).
The case of East Asia is even more complex. For instance, the high Japanese diversity levels may be due to a combination of an ancient population (Jomon) subjected to recent admixture (Yayoi) as discussed in HAMMER and H o w (1995). This mixing effect is fur- ther illustrated by the finding of higher diversity levels in the extreme southern and northern regions of the Japanese archipelago, where remnants of the ancient Jomon gene pool are thought to survive. Because diver- sity levels may not have reached equilibrium in popula- tions that have undergone large expansions in size within the last 10,000 years, some rather large popula- tions may exhibit lower than expected within-group variation (ROGERS and JORDE 1995). Thus, the unex- pectedly low diversity level seen in the South Chinese sample may be a product of a homogenizing influence associated with the agriculturally based Holocene popu- lation expansions originating in Southeast Asia (CA- VALLI-SFORZA et al. 1994). This trend toward lower diver- sity also includes Southeast Asia and India.
The lowest diversity value for any major region in the Old World is found in North Europe (Figure 6B), and within that region, the British sample surprisingly has the third lowest diversity value of the 53 populations in Figure 6A. Both the low diversity values and the clinal distribution of haplotype 4 are concordant with A ” E R - MAN and CAVALLI-SFORZA’S (1984) demic diffusion model involving the relatively recent Neolithic expan-
sion associated with the spread of agriculture across Europe toward the British Isles. Other examples of ex- tremely low diversity in Figure 6A probably have differ- ent explanations [ie., the Omanis and Malaysians are characterized by especially small sample sizes of 11 and 10, respectively, while suspected recent founder events/ population fissions could explain the Navajo (GREEN- BERG et al. 1986) and Lemba values]. Lemba males are thought to have a Semitic origin (SPURDLE andJENWNs 1996) while mtDNA analyses point to African ancestry for Lemba females (SOODYALL et al. 1996). Overall, our data imply a small founding population of males from the Middle East consistent with SPURDLE and JENKINS’ (1996) conclusions.
Figure 6, A and B, are based upon combination hap- lotypes; however, the components of these combination haplotypes differ in their tempo and mode of evolution. The YAP sites represent rare single mutational events and fit the infinite sites model (LI 1977). In contrast, the DYS19 microsatellite system fits the stepwise muta- tion model, evolves rapidly, and is subject to widespread convergence leading to homoplasy (SHRIVER et al. 1993; ESTOUP et al. 1995; GOLDSTEIN et al. 1995). The legti- macy of combining these two different types of genetic data is open to question. As a result we undertook diver- sity analyses of each system separately (data not shown). As in the combination haplotype analysis, subSaharan Africa had the highest diversity levels in both the YAP and DYS19 individual analyses. Then the YAP diversity values (Y) were plotted against DYS19 diversity values (X) for 14 major groups in Table 1 (the enigmatic southern Africans were omitted). A statistically signifi- cant correlation ( T = 0.697, P < 0.01) was obtained between these two sets of diversity values. Interestingly, the three most obvious outliers were the Australasians, South Europeans, and East Bantus. The first two groups are characterized by high DYSl9 diversity values with respect to YAP values and it is this microsatellite diver- sity that causes their relatively high combination haplo- type diversity values in Figure 6B. On the other hand, the East Bantus exhibit relatively low DYS19 diversity resulting in a lower combination value. A different situa- tion obtains for the low West Bantu combination value that reflects concordantly low YAP and DYSl9 values. In fact, the two Bantu groups exhibit the lowest levels of Y-chromosome diversity within Africa consistent with the hypothesis of a comparatively recent expansion of Bantu-speaking populations (EXCOFFIER et al. 1987; CA- VALLI-SFORZA et al. 1994). Also, because these results conflict with those derived from mtDNA and autosomal data from some of the same populations, SPURDLE and JENKINS (1993) hypothesized that Y-specific diversity val- ues may have been reduced due to the widespread prac- tice of polygamy in some African populations (HAMMER and ZEGURA 1996).
Theoretical considerations: At this juncture one should recall RELETHFORD’S (1995) important caveat that among-group patterns of variation, rather than re-
802 M. F. Hammer et al.
flecting the branching history and age of human popula- tions, can be explained by alternative demographic pa- rameters, especially effective population size. Because of the effects of differing population sizes on the magni- tude of genetic drift, often one cannot distinguish be- tween patterns that reflect population structure and those contingent on population history (RELETHFORD
1996; RELETHFORD and HARPENDING 1994), nor are in- terpretations of within-group patterns of genetic diversity straightforward. For example, the finding of greater within-group variation in subSaharan Africa has been used to claim that subSaharan African populations are older (CANN et al. 1987; VIGILANT et al. 1991; TISHKOFF et al. 1996). As pointed out by several authors, divergence time is not the only factor that can affect within-group variation (EXCOFFIER and LANGANEY 1989; HARPENDING
et al. 1993; STONEKING 1993; TEMPLETON 1993; RELETH-
FORD and HARPENDING 1994; MARTINSON et al. 1995; RE- LETHFORD 1995; ROGERS and JORDE 1995; AOKI and SHIDA 1996). Demographic considerations that influ- ence levels of within-population variation include popu- lation bottlenecks and size expansions, migration pat- terns and reticulation, and degree of population subdivision. Other factors that could specifically influ- ence Y-chromosome variation include selective sweeps and genetic hitchhiking (MAYNARD-SMITH 1990), back- ground selection (CHARLESWORTH et al. 1993), and high variance in male reproductive success ( L U C O ~ E et al. 1994; PENA et al. 1995). An additional complication is the admonition that one cannot use standard measures of within-group population variation ( ie . , diversity val- ues) to test geographic origin hypotheses because the effects of mutation rates, inbreeding effective population size, and population age are all conflated with past and present gene flow in the diversity values, themselves (TEMPLETON 1993). The difficulty in empirical studies is determining which combination of the above factors is responsible for differences in the levels of within- and among-group variation. This dilemma can sometimes be addressed by supplemental demographic and ethnohis- torical data (BLETHFORD 1996), as well by innovative population genetic analyses such as those used for the comparison of mtDNA mismatch and intermatch distri- butions that often demonstrate a temporal lag between population origin and expansion/bottleneck (WEND- ING et al. 1993; ROGERS and JORDE 1995).
Methodological considerations: The most promising analytical technique for trying to resolve some of these theoretical issues is that of TEMPLETON (1993). His method that attempts to disentangle the effects of popu- lation structure and population history on genetic varia- tion is based on a nested cladistic analysis of the geo- graphic distribution of mtDNA haplotype data. The null hypothesis is that there is no geographic association of clades. This hypothesis is tested using a random permu- tation procedure. If the null hypothesis is rejected, TEMPLETON (1993) seeks to clarify the causes for these nonrandom associations between haplotypes and geog-
raphy. His two principal explanatory categories are pop- ulation structure and population history. In this con- text, population structure includes restricted, recurrent gene flow via isolation by distance, while range expan- sions reflect population history. The first human data set analyzed using TEMPLETON’S (1993) approach was EXCOFFIER’S (1990) mtDNA data from 12 Old World populations ( n = 1218). This analysis did not lead to a dichotomous separation between explanations derived from population history us. population structure con- siderations. Within higher-order clades, restricted and recurrent gene flow was the principal explanation for the data patterns. At the lowest level in the hierarchy, the data led to the detection of two regional (but no global) range expansions. One of these expansion events involved Arabs and sub-Saharan Africans, while the other involved an expansion across Europe. As TEM- PLETON (1993) pointed out, the current distribution of mtDNA variation that he analyzed was influenced both by restricted gene flow and by population expansion. The critical point is his explicit statement that his analy- sis does not treat population expansion or restricted gene flow as mutually exclusive alternatives. Indeed, TEMPLETON et al. (1995) recently found evidence for restricted gene flow via isolation by distance as well as for range expansions in mtDNA data from the tiger salamander, Ambystoma tignnum. From these examples, it is clear that even portions of the same data set can show the differential import of factors associated with population history and population structure.
The graphical display of the geographic distribution of our Y chromosome data in Figure 4 is similar to methods used in intraspecific phylogeography (AVISE 1994) and especially in contemporary human mtDNA research (MELTON et al. 1995). TEMPLETON et al. (1995, p. 779) provide a cogent caveat about such displays when they state: “Such pictorial representations are an excellent exploratory tool for formulating hypotheses, but are inappropriate inference tools.” Our paper is about hypothesis compatibility sensu STONEKING (1994) rather than about hypothesis testing sensu TEMPLETON (1994). We employed exploratory graphical analyses to generate hypotheses to explain the geographic distribu- tion of our Y chromosome data. TEMPLETON (1993) was fortunate to have 76 human mtDNA haplotypes distributed over 18 geographic locations, while TEM- PLETON et al. (1995) used 23 mtDNA haplotypes distrib- uted over 53 geographic regions in the salamander analysis. We, however, only have five human Ychromo- some haplotypes distributed over 60 geographic loca- tions. It is doubtful that this represents enough genetic variation to carry out a nested cladistic haplotype test (A. R. TEMPLETON, personal communication).
Conclusions: An important feature of our results is the number of polymorphisms that appear to have origi- nated in Africa (ie., PN1, PN2, PN3, DYS271 A-G, and the poly(A) S allele). This may reflect a greater African population size and/or an African ascertainment bias

Global Human Y Haplotype Variation 803
in the polymorphic sites surveyed. On the other hand, the YAP element insertion and the poly(A) M and VS alleles may have originated in Asia. Overall, our combi- nation haplotype data are compatible with either an African origin, an extremely heterogeneous source pop- ulation in Africa, the aforementioned larger effective African population size, and/or various gene flow and genetic drift-based scenarios. Our contribution differs from previous genetic studies that have supported a model based on a single migration out of Africa (CANN et al. 1987; VIGILANT et al. 1991; TISHKOFF et al. 1996). For instance, in our opinion the TISHKOFF et al. (1996) microsatellite data may have traced a more recent mi- gration as exemplified by haplotypes 4 and 5 in our Y chromosome tree (Figure 3 ) . Separate analyses of the patterns of genetic variation associated with each of the five YAP haplotypes point to the conjecture that our data contain evidence consistent with multiple dispers- als, some emanating from Africa and one perhaps com- ing from Asia. It is also possible that our microsatellite data reflect comparatively recent demographic parame- ters and microevolutionary events, while the rest of our data reflect much earlier population dynamics.
Although we have treated our polymorphic sites as different loci, in actuality the nonrecombining portion of the human Y chromosome represents a single locus. The same stricture holds for mtDNA. Although more information can be potentially obtained from multilo- cus data, different questions can be addressed utilizing single locus haploid systems. Differences between ma- ternal and paternal histories may be more informative for disentangling multiple migration events that have left palimpsest-like genetic and morphological patterns. In addition, the ability to construct haplotype trees with determinable ancestral and derived states and to esti- mate a time frame for the branching events in the trees provides a heuristic framework for the future testing of hypotheses about modern human origins. Additional Y chromosome data from a greater number of polymor- phic sites and human populations will be necessary to perform model-based tests of these hypotheses (TEM- PLETON 1993, 1996, personal communication).
We thank JOHN CONAWAY, JAMES TUGGLE, JARED RAGWD, JENNIFER
VUTURO-BRADY, AI-WEI Ho, and CHARLES HOEFFER for excellent tech- nical assistance. Special thanks go to one of the anonymous reviewers for his/her comments that were both very thoughtful and helpful. Also, we thank LESLIE LOUIE and CHRIS TYI~ER-SMITH for contributing DNA samples. This work was supported by National Science Founda- tion grant OPP-9423429 and National Institutes of Health grant GM- 53566 to M.F.H.
LITERATURE CITED
AMMERMAN, A. J., and L. L. CAVAI.I.I-SFORZA, 1984 Neolithic Transition and the Genetics ofPopulations in Europe. Princeton University Press, Princeton.
ACXI, K., and M. SHIDA, 1996 A Monte Carlo simulation study of coalescence times in a successive colonization model with migra- tion, pp. 66-71 in Prehistoric Mongoloid Dispersals, edited by T. AKAZAWA and E. J. E. SZATHMARY. Oxford University Press, Ox- ford.
AVISE, J. C., 1994 Molecular Markers, Natural History and Evolution. Chapman & Hall, New York.
BATZER, M. A,, M. STONEKING, M. ALEGRIA-HARTMAN, H. BAZAN, D. H. KAss et al., 1994 African origin of human-specific polymorphic Alu insertions. Proc. Natl. Acad. Sci. USA 91: 12288-12292.
BOWCOCK, A. M., J. R. BDD, J. L. MOUNTAIN, J. M. HERBERT, L. WO- TENUTO et al., 1991 Drift, admixture, and selection in human evolution: a study with DNA polymorphisms. Proc. Natl. Acad. Sci. USA 88: 839-843.
BOWCOCK, A. M., A. RUIZ-LINARES, J. TOMFOHRDE, E. MINCH, J. R. BDD et al,, 1994 High resolution of human evolutionary trees with polymorphic microsatellites. Nature 368: 455-457.
CANN, R. L., M. STONEIUNG and A. C. WILSON, 1987 Mitochondrial DNA and human evolution. Nature 325: 31-36.
CASANOVA M., P. LEROY, C. BOUCEKKINE, J. WEISSENBACH, C. BISHOP et aL, 1985 A human Y-linked DNA polymorphism and its po- tential for estimating genetic and evolutionary distance. Science 230: 1403-1406.
CAVAIL-SFORZA, L. L., and W. F. BODMER, 1971 The Genetics of Hu- man Populations. W. H. Freeman, San Francisco.
CAVAILI-SFORZA, L. L., A. PIAZZA, P. MENOZZI and J. MOUNTAIN, 1988 Reconstruction of human evolution: bringing together genetic, archaeological, and linguistic data. Proc. Natl. Acad. Sci. USA 85: 6002-6006.
CAVALI.I-SFORZA, L. L., P. MENOZZI and A. PIAZZA, 1994 The History and Geography of Human Genes. Princeton University Press, Princeton.
CHAFU~ESWORTH, B., M. T. MORGAN and D. C~RLESWORTH, 1993 The effect of deleterious mutations on neutral molecular varia- tion. Genetics 134: 1289-1303.
CHEN, Y.-S., A. TORRONI, L. EXCOFFIER, A. S. SANTACHIARA-BENERE- C E ~ I and D. C. WALLACE, 1995 Analysis of mtDNA variation in African populations reveals the most ancient of all human continent-specific haplogroups. Am. J. Hum. Genet. 57: 133- 149.
CIMINELLI, B., F. POMPEI, P. MALASPINA, M. F. H ~ V M E R , F. PERSI- CHETTI et al., 1995 Recurrent simple tandem repeat mutations during human Y chromosome radiation in Caucasian subpopula- tions. J. Mol. Evol. 41: 966-976.
DEKA, R., L. JIN, M. D. SHRIVER, L. M. Yu, S. DECROO et al., 1995 Population genetics of dinucleotide (dCdA),,-(dGdT),, polymor- phisms in world populations. Am. J. Hum. Genet. 56: 461-474.
ESTOUP, A,, L. GARNERY, M. SOIJGNAC and J.-M. CORNUET, 1995 Microsatellite variation in Honey Bee (A@ Mellifkra L.) popula- tions: hierarchical genetic structure and test of the infinite allele and stepwise mutation models. Genetics 140: 679-695.
EXCOFFIER, L., 1990 Evolution of human mitochondrial DNA evi- dence for departure from a pure neutral model of populations at equilibrium. J. Mol. Evol. 30: 125-139.
EXCOFFIER, L., and A. LANGANEY, 1989 Origin and differentiation of human mitochondrial DNA. Am. J. Hum. Genet. 4 4 73-85.
EXCOFFIER, L., B. PEI.I.EGRINI, A. SANCHEZ-MUAS, C . SIMON and A. L+NGANEY, 1987 Genetics and history of sub-Saharan Africa. Yrbk. Phys. Anthropol. 30: 151-194.
FELSENSTEIN, J., 1981 Evolutionary trees from DNA sequences: a maximum likelihood approach. J. Mol. Evol. 17: 368-376.
FELSENSTEIN, J., 1993 PHYLIP: Phylogeny Inference Package, Ver- sion 3 . 5 ~ . Joseph Felsenstein and the University of Washington, Seattle.
FITCH, W. M., and E. MARGOLIASH, 1967 Construction of phyloge- netic trees. Science 155: 279-284.
FRAYER, D. W., M. H. WOI.POFF, A. G. THORNE, F. H. SMITH and G. G. POPE, 1993 Theories of modern human origins: the paleonto- logical test. Am. Anthropol. 95: 14-50.
Fu, Y.-X., and W.-H. LI, 1996 Estimating the age of the common ancestor of men from the ZJY intron. Science 272: 1356-1357.
GOLDSTEIN, D. B., A. R. LINARES, L. L. CAVAIL-SFORZA and M. W. FELDMAN, 1995 An evaluation of genetic distances for use with microsatellite loci. Genetics 139: 463-471.
GOMOLKA, M., J. HUNDRIESER, P. NURNBERG, L. ROEWER, J. T. EPPLEN et al., 1994 Selected di- and tetranucleotide microsatellites from chromosomes 7, 12, 14, and Y in various Eurasian populations. Hum. Genet. 93: 592-596.
GREENBERG, J. H., C. G. TURNER and S. L. ZEGURA, 1986 The settle- ment of the Americas: a comparison of the linguistic, dental, and genetic evidence. Current Anthropol. 27: 477-497.

804 M. F. Hammer et al.
GRIFFITHS, R. C., and S. TAVARE, 1994 Ancestral inference in popula- tion genetics. Statistical Sci. 9 307-319.
WMER, M. F., 1994 A recent insertion of an N u element on the Y chromosome is a useful marker for human population studies. Mol. Biol. Evol. 11: 749-761.
HAMMER, M. F., 1995 A recent common ancestry for humanY chro- mosomes. Nature 378: 37G378.
HAMMER, M. F., and S. HORAI, 1995 Y chromosomal DNA variation and the peopling of Japan. Am. J. Hum. Genet. 56: 951-962.
HAMMER, M. F., and S. L. ZEGURA, 1997 The role of the Y chromo- some in human evolutionary studies. Evol. Anthropol. ( i n press).
HARPENDING, H., and A. ROGERS, 1984 Antana: A Package for Multi- variate Data Analysis. Harpending & Rogers, Bosque Farms.
HARPENDING, H. C., S. T. SHERRY, A. R. ROGERS and M. STONEKING, 1993 The genetic structure of ancient human populations. Curr. Anthropol. 3 4 483-496.
IKUTA, S., K. TAKAGI, R. B. WAI.IACE and K. ITAKURA, 1987 Dissocia- tion kinetics of 19 base paired oligonucleotide-DNA duplexes containing different single mismatched base pairs. Nucleic Acids Res. 15: 797-811.
JOBI.ING, M. A,, and C. TYLER-SMITH, 1995 Fathers and sons: the Y chromosome and human evolution. Trends Genet. 11: 449-456.
W E T , T., S. L. ZEGURA, J. VUTURO-BRADY, 0. POSUKH, L. OSIPOVA et al., 1997 Y chromosome markers and trans-Bering Strait dis- persals. Am. J. Phys. Anthropol. ( i n press).
LAHIRI, D. K., and J. I. NURNBERGER, 1991 A rapid nonenzymatic method for the preparation of HMW DNA from blood for RFLP studies. Nucleic Acids Res. 19: 5444.
LAHR, M. M., and R. FOLEY, 1995 Multiple dispersals and modern human origins. Evol. Anthropol. 3: 48-60.
LI, W.-H., 1977 Distribution of nucleotide differences between two randomly chosen cistrons in a finite population. Genetics 85: 331-337.
LI, W.-i., and D. GRAUR, 1991 Fundamtals of Molecular Evolution. Sinauer Associates, Inc., Sunderland, MA.
LUCOTTE, G., and N.Y. NGO, 1985 p49f, a highly polymorphic probe, that detects Taql RFLPs on the human Y chromosome. Nucleic Acids Res. 13: 82-85.
LUCDTTE, G., N. GERARD, R. KRISHNAMOORTHY, F. DAVID, A. AOUIZER- ATE et al., 1994 Reduced variability in Y-chromosome-specific haplotypes for some Central African populations. Hum. Biol. 66: 519-526.
MARTINSON, J. J., L. EXCOFFIER, C. SWNBURN, A. J. BOYCE, R. M. HAR- DING et al., 1995 High diversity ofa-globin haplotypes in a Sene- galese population, including many previously unreported vari- ants. Am. J. Hum. Genet. 57: 1186-1198.
MATHIAS, N., M. BAYES and C. ' I~ER-SMMITH, 1994 Highly informa- tive compound haplotypes for the human Y chromosome. Hum. Mol. Genet. 3: 115-123.
MAYNARD-SMITH, J., 1990 The Y of human relationships. Nature 344: 591-592.
MELTON, T., R. PETERSON, A. J. REDD, N. SAHA, A. S. M. SOFRO et al., 1995 Polynesian genetic affinities with southeast Asian popula- tions as identified by mtDNA analysis. Am. J. Hum. Genet. 57: 403-414.
bution of the four founding lineage haplotypes in Native Ameri- cans suggests a single wave of migration for the New World. Am. J. Phys. Anthropol. 98: 411-430.
MICHAIAKIS, Y., and L. EXCOFFIER, 1996 A generic estimation of population subdivision using distances between alleles with spe- cial references for microsatellite loci. Genetics 142 1061-1064.
MINUGH-PURVIS, N., 1995 The modern human origins controversy: 1984-1994. Evol. Anthropol. 4 140-147.
MITCHFLI., R. J., L. EARL and J. W. WILLIAMS, 1993 Two Y-chromo- some-specific restriction fragment length polymorphisms ( D Y S l l and DYZ8) in Italian and Greek migrants to Australia. Hum. Biol.
MOUNTAIN, J. L., and L. L. CAVALLI-SFORZA, 1994 Inference of hu- man evolution through cladistic analysis of nuclear DNA restric- tion polymorphisms. Proc. Natl. Acad. Sci. USA 91: 6515-6519.
MULLER, S., M. GOMOLKA and H. WALTER, 1994 The Y-specific SSLP of the locus DYSlY in four different European samples. Hum. Hered. 44: 298-300.
NEI, M., 1978 Estimation of average heterozygosity and genetic dis- tance from small number of individuals. Genetics 89: 583-590.
MERRIWETHER, D. A,, F. ROTHHAMMERand R. E. FERRELL, 1995 Distri-
65: 387-399.
NEI, M., 1987 Molecular Euolutionaq Genetics. Columbia University Press, New York.
NEI, M., and A. K. ROYCHOUDHURY, 1982 Genetic relationships and evolution of human races. Evol. Biol. 14: 1-59.
NEI, M., and A. K. ROYCHOUDHURY, 1993 Evolutionary relationships of human populations on a global scale. Mol. Biol. Evol. 1 0 927- 943.
NYSTUEN, A., T. BUSINGA, R. CARMI, G. M. D m and V. C. SHEFFIEID, 1995 Identification of polymorphic markers for the Y chromo- some and the use of these markers to determine the number of male founders in isolated populations. Am. J. Hum. Genet. 57 (Suppl.): A26.
PENA, S. D. J., F. R. SANTOS, N. 0. BIANCHI, C. M. BRAVI, F. R. CARNESE et al., 1995 A major founder Y-chromosome haplotype in Amer- indians. Nature Genet. 11: 15-16.
PENNY, D., M. STEEI., P. J. WADDEIJ. and M. D. HENDY, 1995 Im- proved analyses of human mitochondrial DNA sequences sup- port a recent African origin for Homo sapias. Mol. Biol. Evol. 12: 863-882.
PERNA, N. T., M. A. BARER, P. L. DEININGER and M. STONEKING, 1992 Alu insertion polymorphism: a new type of marker for human population studies. Hum. Biol. 6 4 641 -648.
PERSICHETTI, F., P. BLASI, M. HAMMER, P. MAL~SPINA, C. IODICE et al., 1992 Disequilibrium of multiple markers on the human Y chromosome. Ann. Hum. Genet. 56: 303-310.
RELETHFORD, J. H., 1995 Genetics and modern human origins. Evol. Anthropol. 4 53-63.
RELETHFORII, J. H., 1996 Genetic drift can obscure population his- tory: problem and solution. Hum. Biol. 68: 29-44.
REI.ETHFORD, J. H., and H. C. HARPENDING, 1994 Craniometric vari- ation, genetic theory, and modern human origins. Am. J. Phys. Anthropol. 95: 249-270.
RELETHFORD, J. H., and H. C. HARPENDING, 1995 Ancient differ- ences in population size can mimic a recent African origin of modern humans. Curr. Anthropol. 36: 667-674.
RE.YNOI.DS, J., B. S. WEIR and C. C. COCKERHAM, 1983 Estimation of coancestry coefficient: Basis for short-term genetic distance. Genetics 105: 767-779.
RICHARDS, B., J. SKOLETSKY, A. P. SHUBER, R. BALFOUR, R. C. STERN P t nl., 1993 Multiplex PCR amplification from the GTR gene using DNA prepared from buccal brushes/swabs. Hum. Mol. Genet. 2: 159-163.
RICHARIIS, M., H. CoR'rE-Rw., P. FORSTER, V. MACAUIAY, H. WILKIN- SON-HERBOTS et al., 1996 Paleolithic and Neolithic lineages in the European mitochondrial gene pool. Am.J. Hum. Genet. 59: 185-203.
ROEWER, i., J. ARNEMANN, N. K SPURR, K.-H. GRZESCHIK and J. T. EPPIXN, 1992 Simple repeat sequences on the human Y chrw mosome are equally polymorphic as their autosomal counter- parts. Hum. Genet. 89: 389-394.
ROEWER, L., M. KAYSER, P. DIELTJES, M. NAGY, E. BAKKER et al., 1996 Analysis of molecular variance (AMOVA) of Y-chromosome-spe- cific microsatellites in two closely related human populations. Hum. Mol. Genet. 5: 1029-1033.
ROGERS, A. R., and 1.. B. JORDE, 1995 Genetic evidence on modern human origins. Hum. Biol. 67: 1-36.
SAITOU, N., and M. NPI, 1987 The neighborjoining method: a new method for reconstructing phylogenetic trees. Mol. Biol. Evol.
SALEM, A.-H., F. M. BADR, M. F. GABALIAH and S. PAABO, 1996 The genetics of traditional living: Y chromosomal and mitochondrial lineages in the Sinai Peninsula. Am. J. Hum. Genet. 59 741- 743.
SANTOS, F. R., S. D. J. PENA and J. T. EPPLEN, 1993 Genetic and pop- ulation study of a Y-linked tetranucleotide repeat DNA polymor- phism with a simple non-isotopic technique. Hum. Genet. 90:
SANTOS, F. R., T. GERELSAIKHAN, B. MUNKHTUIA, T. OYUNSUREN, J. E. EPPLEN et al., 1996 Geographic differences in the allele fre- quencies of the human Y-linked tetranucleotide polymorphism DYSIY. Hum. Genet. 97: 309-313.
SEIEISTAD, M. T., J. M. HEBERT, A. A. LIN, P. A. UNDERHII.~., M. IBRAHIM et al., 1994 Construction of human Y-chromosomal haplotypes using a new polymorphic A to G transition. Hum. Mol. Genet. 3: 2159-2161.
SHRIVF,R, M. D., i. JIN, R. CHAKRABORT( and E. BOERWINKLE, 1993
4: 406-425.
655-656.

Global Human Y Haplotype Variation 805
VNTR allele frequency distributions under the stepwise mutation model: a computer simulation approach. Genetics 134 983-993.
SIATKIN, M., 1995 A measure of population subdivision based on microsatellite allele frequencies. Genetics 139: 457-462.
Sow. , R. R., and C. D. MKHENER, 1958 A statistical method for evaluating systematic relationships. Univ. Kansas Sci. Bull. 28: 1409-1438.
S o o ~ u i u . ~ , H., L. VIGILANT,A. V. HILI., M. STONEKING and T.JENKINS, 1996 mtDNA control-region sequence variation suggests multi- ple independent origins of an “Asian-specific” 9-bp deletion in sub-Saharan Africans. Am. J. Hum. Genet. 5 8 595-608.
SPURI>I.E, A. B., and T. JENKINS, 1992 Y chromosome probe p49a detects complex Puu I1 haplotypes and many new Taq I haplo- types in southern African populations. Am. J . Hum. Genet. 50: 107-125.
SPl‘ml.E, A. B., and T. JENKINS, 1993 Complex polymorphisms are revealed by Y chromosome probe 49a with BglII, Hind 111, PstI and B t I . Ann. Hum. Genet. 57: 41-53.
SPI!RDI.L, A. B., and T. JLNKINS, 1996 The origins of the Lemba “Black Jews’’ of southern Africa: evidence from pZ2f2 and other Y chromosome markers. Am. J. Hum. Genet. 59: 1126-1133.
SPURJX.~, A,, M. F. HAMMER and T. JENKINS, 1994 The Y Alu poly- morphism in Southern African populations, and its relationship to other Y-specific polymorphisms. Am. J. Hum. Genet. 5 4 319- 330.
STONF.KINC, M., 1993 DNA and recent human evolution. Evol. An- thropol. 2: 60-73.
STONEKING, M., 1994 In defense of “Eve”-a response to Tem- pleton’s critique. Am. Anthropol. 96: 131-141.
STONEKING, M., and R. L. CANN, 1989 African origin of human mito- chondrial DNA, pp. 17-30 in The Human Revolution: Behavioural and Biological Pmpectiues on the O r i p s of M o d a Humans, edited by P. MEI.IARS and C. STRIKER. Princeton University Press, Princeton.
STONF.KINU(;, M., and A. C. WILSON, 1989 Mitochondrial DNA, pp. 215-245 in The Colonization of the Pacijic: A Genetic Trail, edited by A. V. S. H11.1. and S. W. SERJWNTSON. Oxford University Press, New York.
STRINGER, C., and C. GAMBI.E, 1993 In Search of thr Neanderthals: Solving the Puzzle of Human Origins. Thames and Hudson, Inc., New York.
SZATMMAKY, E. J. E., 1993 Genetics of aboriginal North Americans. Evol. Anthropol. 1: 202-220.
TAKAHATA, N., 1994 Repeated failures that led to the eventual suc-
TEMPLETON, A. R., 1993 The “Eve” hypothesis: a genetic critique and reanalysis. A m . Anthropol. 9 5 51-72.
TEMPI.ETON, A. R., 1994 “Eve”: hypothesis compatibility us. hypoth- esis testing. Am. Anthropol. 9 6 141-147.
TEMPLKTON, A. R., 1996 Gene lineages and human evolution. Sci- ence 272: 1363.
TEMPI.ETON, A. R., E. ROUTMAN and C. A. PHII.IIPS, 1995 Separating population structure from population history: a cladistic analysis of the geographical distribution of mitochondrial haplotypes in the tiger salamander, Ambystoma tigrinurn. Genetics 140: 762- 782.
TISHKOFF, S. A., E. DIETZSCH, W. SPEED, A.J. PAKSSIIS, J. R. KIDD et al., 1996 Global patterns of linkage disequilibrium at the CD4 locus and modern human origins. Science 271: 1380-1387.
TORRONI, A.,Y.-S. CHEN, 0. SEMINO, A. s. S A N T . . \ ( : H I ~ - B E N E ( : E R ~ ; ~ l , C. R. SCOTI et al., 1994a mtDNA and Y-chromosome polymor- phisms in four Native American populations from southern Mex- ico. Am. J. Hum. Genet. 54: 303-318.
TORRONI, A,, J. MIILER, L. G. MOORE:, S. Z.AMVI)IO, J. ZHUANG rt nl., 1994b Mitochondrial DNA analysis in Tibet: implications for the origin of the Tibetan population and its adaptation to high altitude. Am. J. Phys. Anthropol. 9 3 189-199.
UNDERHILL, P. A,, L. JIN, R. ZEMANS, P. J. OEFNEK and L. L. CAVAILI- SFORZA, 1996 A pre-Columbian Y chromosome-specific transi-
Natl. Acad. Sci. USA 93: 196-200. tion and its implications for human evolutionaly histoly. Proc.
VIGIIANT, L., M. STONEKING, H. HARPENDINC., K HAWKES and A. C. WILSON, 1991 African populations and the evolution of human mitochondrial DNA. Science 253: 1503-1507.
WAINSCOAT, J. S., A. V. S. HILI., A. L. BOYGE, J. FLINT, M. HERNANDEZ et al., 1986 Evolutionary relationships of human populations from an analysis of nuclear DNA polymorphisms. Nature 319:
WEISS, G., and A. VON HAESELER, 1996 Estimating the age of the common ancestor of men from the 7!Y intron. Science 272: 1359-1360.
WEBER, J. L., and C. WONC, 1993 Mutation in human short tandem repeats. Hum. Mol. Genet. 2: 1123-1128.
WEIR, B. S., 1990 Genetic Data Ana@. Sinauer Associates, Inc., Sun- derland, MA.
cess in human evolution. Mol. Biol. Evol. 11: 803-805.
491 -493.
Communicating editor: A. G. CIARK