the geography of venture capital: looking at the demand side€¦ · first, as the number of vc...
TRANSCRIPT

The geography of Venture Capital: looking at the demand
side
Massimo G. Colombo∗ Diego D’Adda† Anita Quas‡
April 15th, 2016
Abstract
In this paper we analyze how the location of European high-tech entrepreneurial ven-
tures affects their propensity to seek external equity. We analyze a sample of 524 ventures
located in seven European countries and observed in the period 1984-2009. We find that
companies located in proximity to regions where the venture capital (VC) market is more
developed are more likely to search for external equity, while the concentration of the local
VC market plays a negligible role. An abundant supply of VC has a positive stimulating
effect of large economic magnitude on the demand for external equity. However, this effect
rapidly decreases with distance and vanishes at around 250 km. It also vanishes when
crossing national borders. Our results suggest that overcoming the national fragmentation
of the European VC market may stimulate entrepreneurial ventures demand for external
equity, and is a key priority for European policy makers.
Keywords: high-tech entrepreneurial ventures, venture capital, demand for external
equity, geographic distance
Preliminary draft
Please do not quote or cite without permission from the authors
∗Politecnico di Milano, [email protected].†Universita Politecnica delle Marche, [email protected]‡EMLYON Business School, [email protected]
1
1 Introduction
In the early stages of their life, high-tech entrepreneurial ventures face huge difficulties in col-
lecting the outside capital they need to develop their businesses. The information asymmetries
associated with the highly technical content of their investment projects, the low value and the
intangible nature of (most of) their assets which cannot be pledged as collateral and the lack of
a track record discourage traditional investors such as banks to lend capital to these companies
(Berger and Udell, 1990; Carpenter and Petersen, 2002; Denis, 2004).
Venture Capital (VC) represents an appealing source of external equity capital for high-tech
entrepreneurial ventures (Gompers et al., 2001). VC investors provide long-term equity finance
and business skills to high growth-potential companies. Thanks to their superior screening
capabilities and the use of monitoring and staging mechanisms (Kaplan and Stromberg, 2001),
VC investors address information asymmetries more effectively than traditional financial inter-
mediaries.
However, only a tiny number of companies successfully access the VC market. In 2014, 3,200
European and 3,700 US-based companies received VC (source: Invest Europe’s and NVCA’s
yearbooks 2015). Moreover, the geographical distribution of VC investments is not even, with
most investments concentrated in selected regions like Silicon Valley, the Boston and New
York metropolitan areas in the US (e.g., Florida and King, 2016) and the London and Paris
metropolitan areas in Europe. VC investors are spatially concentrated in financial centers and
high-tech regions and their investments exhibit a local bias, i.e. they are very likely to invest
nearby (Chen et al., 2010; Cumming and Dai, 2010; Sorenson and Stuart, 2001; Harrison et al.,
2010; Lindgaard Christensen, 2007). This investment behavior is the result of both the location
of their networks of informants and the need for spatial proximity to monitor investee companies
(Cumming and Dai, 2010).
While most of the literature on the “geography of VC” focuses on the supply side of the
market, a handful of studies have suggested that the uneven distribution of VC investments
may also be a reflection of demand-side factors, as companies in peripheral regions are less likely
to seek VC (Bertoni et al., 2015b; Mason and Harrison, 2002). However, this nascent literature
does not provide a comprehensive understanding of the role of local VC markets – i.e., their
size and structure – in making companies more (or less) prone to look for VC, nor it assesses
the barriers represented by geographic distance, within and across national boundaries. These
issues are especially important for European firms. On the one hand, the European VC market
still appears to be fragmented at the national level (e.g., Bertoni et al., 2015a) offering an
ideal test-bed to assess the role of national borders on the demand for external equity, an issue
which is clearly highly relevant for European policy makers1. On the other hand, contrary to
1Since well before the Lisbon Agenda (e.g., European Commission, 1998), European policymakers have beentrying to create an EU-wide VC market for high-potential entrepreneurial ventures. More recently, the EuropeanCommission has adopted several acts (most notably the Small Business Act and the Single Market Act), with theaim of promoting cross-border VC investments. These acts have established new rules to ensure that VC fundslocated in any member state can be freely invested throughout the EU (the so-called pan-European passportfor VC investors).
2

the evidence on the U.S. VC market (e.g., Sørensen, 2007; Chemmanur et al., 2011), previous
studies have failed to detect a positive “selection effect” in the European VC market (e.g.,
Croce et al., 2013), with VC investors failing to “pick winners” (i.e. investing in ventures with
superior business opportunities). A better understanding of the demand side of the European
VC market will help in clarifying the source of these anomalies. In this paper, we aim at filling
this gap by studying how the demand side of the European VC market is affected by the size,
structure and geography of the supply side of the market.
Proximity to an abundant supply of VC should positively influence companies’ propensity
to look for external equity. First, as the number of VC investors looking for potential targets
increases, companies have greater chances of obtaining VC and need to exert less effort to
find suitable VC investors (Bertoni et al., 2015b). Therefore, (expected) search costs are lower
for companies that are located near well developed VC markets. Second, these companies
become more easily aware of the potential benefits of VC financing, because of word of mouth
among them (Martin et al., 2005). They can also more easily access information about the
VC seeking process, including how to write a business plan or prepare an effective “elevator
pitch” to prospective VC investors. Therefore, the costs of getting “investment ready” are
lower. (Mason and Harrison, 2004). Third, bigger VC markets are more likely to be “thick”,
i.e. characterized by a sufficiently high number of buyers (i.e., VC investors) and sellers (i.e.,
companies actively seeking VC). A high number of VC investors translates also into a greater
heterogeneity in investors’ characteristics and in a higher probability to find a suitable match
for entrepreneurs (Gans and Stern, 2010). Fourth, geographical distance amplifies information
asymmetries for VC investors, who typically rely on local informational networks to screen
business proposals (Cumming and Dai, 2010; Sorenson and Stuart, 2001). Moreover, distant
investments bring about more uncertainty for VC investors, because these latter may not be
familiar with the institutional characteristics in which the company is embedded. Research
shows that information asymmetries and uncertainty are critically associated with the costs of
obtaining financing for entrepreneurial ventures, as VC demand a higher premium (Carpentier
and Suret, 2006). Lastly, distance also increases the monitoring costs for VC investors, which
in turn may negatively affect the extent to which VC are able to add value to their ventures
(Bernstein et al., 2015).
The structure of the VC market (i.e. the level of competition) should also have an impact on
companies’ propensity to seek external equity. In more competitive VC markets, VC investors
are forced to offer better conditions to ventures’ entrepreneurs in order to secure promising
investment opportunities. In fact, Gompers and Lerner find that pre-money valuations are
higher in more competitive VC markets. Rational entrepreneurs whose companies are located
in an area where there is a highly competitive VC market will be more likely to look for external
equity as they expect to incur lower dilution costs.
Above, we argued that proximity to a large (and competitive) VC market encourages en-
trepreneurs to look for external equity. Long distance from prospective VC investors is not
the only geographical factor discouraging companies from seeking external financing: national
3

barriers may also play a strong negative role. Cross-border investments entail additional un-
certainty in terms of regulations, tax policies, and cultural norms, and greater due diligence
costs for VC investors (Cumming and Macintosh, 2003; Wright et al., 2005). This in turn
increases the search costs that entrepreneurs incur while looking for VC abroad and reduces
the likelihood of their search being successful.
In this paper we analyze how the location of European high-tech entrepreneurial ventures
affects their propensity to seek external equity. We expect companies located in regions where
the VC market is more developed and more competitive to be more likely to search for external
equity(Carpentier and Suret, 2006). Moreover, we investigate how companies’ propensity to
look for external equity is influenced by the availability of VC outside of their regions or
even their countries. We expect the geographic distance from large VC markets to discourage
companies in their search for external equity. We also expect the size of foreign VC markets to
have more limited influence on entrepreneurs’ inclination to seek external equity compared to
national markets .
Our empirical investigation is based on a sample of 524 high-tech entrepreneurial located in
seven European countries – Belgium, Finland, France, Germany, Italy, Spain and the United
Kingdom. For these companies we know whether and when they looked for external equity in
the first 15 years of their existence. These companies answered to a survey administered in 2010
regarding their equity financing seeking history. Sample companies were extracted from the
VICO database, created as a part of a research project funded by the European Commission
within the 7th Framework Program (see www.vicoproject.org). The VICO database compre-
hends information on VC-backed and non VC-backed young high-tech companies located in
Europe. It is particularly appropriate for our analysis because it includes companies located
in different European countries and follows their development over time. The international
dimension of the VICO database allows us to study VC markets with heterogeneous levels
of development, as measured by the ratio of national VC investments to GDP (OECD, 2013;
Bertoni et al., 2015b) and to assess the impact of national borders on companies’ demand for
external equity. Moreover, the geographical distribution of VC within each of the seven national
markets is also heterogeneous. Martin et al. (2005), for instance, show that the UK presents
one main hub of VC activity (the London metropolitan area), while in Germany the industry
is more evenly spread across six centers. The panel dimension of the VICO database is also
interesting for our purposes. Our dataset includes observations between 1984 and 2009, giving
us the opportunity to observe the development of the different VC markets over 25 years. We
complemented company-level information from the VICO database with VC market-level data
on the size, structure and geographical distribution of the VC markets over time. These latter
information were extracted from Thomson One.
Results support the view that location is a key driver of companies’ propensity to look for
external equity. The availability of an abundant supply of VC in the regions where companies
are located plays a major positive role, while the concentration of the local VC market does not
significantly influence companies’ propensity to look for external equity. As we expected, the
4

positive impact on demand of the size of the VC market rapidly declines with an increase of its
geographical distance from companies’ location, vanishing at a distance greater than 250 km. In
addition, we find that the availability of VC outside national borders does not affect companies’
propensity to look for external equity, independently of geographic distance. This evidence is
in line with the view that national borders represent a crucial barrier for entrepreneurs seeking
external equity.
The paper proceeds as follows. In section 2, we present the data used in this paper. In
section 3, we describe the econometric model. Results are presented in section 4. In section 5,
we conclude the paper with a summary of our main results, a discussion of the contribution
of the paper to the VC literature, indications on limitations and directions for future research,
and managerial and policy implications.
2 Data
2.1 Sample
We analyze a sample composed of 524 European high-tech entrepreneurial ventures that replied
to an on-line survey we administered in 2010. The sample is extracted from the VICO database2,
which includes detailed information for a large sample of high-tech entrepreneurial companies
operating in seven European countries: Belgium, Finland, France, Germany, Italy, Spain and
the United Kingdom. All companies included in the sample are founded after 1984, are in-
dependent at foundation (i.e., not controlled by other business organizations), and operate in
the following high-tech manufacturing and services industries: nanotechnology, biotechnology,
pharmaceuticals, computers, electronic components, telecommunications equipment, precision,
optical and medical instruments, robotics, aerospace, software, telecommunications services,
internet and multimedia services, web publishing, renewable energies, R&D and engineering
services. The VICO dataset includes two strata of companies: a sample of 759 VC-backed
companies and a control group of 7,611 non-VC-backed companies that are potential investee
(Bertoni and Martı Pellon, 2011: p. 5). Companies (both VC-backed and non-VC-backed) in
the VICO dataset are observed from the foundation date up to 2010 (or to the time they ceased
operations or were acquired). VC-backed companies received equity (or equity-like) financing
in the early stages of their life in the years from 1994 to 2004, and were less than ten years old
at the time of the first VC investment. As is common in the VC literature, the VICO dataset
does not include leverage buy-outs (LBOs), real estate, distressed debt funds and other private
equity investments. Data related to VC-backed firms were collected via random extraction
from commercial databases (i.e., Thomson One, VC-PRO, and Zephyr) and country-specific
proprietary datasets, including the yearbooks of the Belgium Venture Capital Association and
2The VICO dataset was built thanks to the joint effort of nine universities across Europe with the supportof the 7th European Framework Program. For more details on the procedures used in the data-gathering processand on all of the variables included in the dataset, see Bertoni and Martı Pellon (2011). For more informationon the VICO project, please visit the dedicated website www.vicoproject.org.
5
the Finnish Venture Capital Association, the ZEW Foundation Panel (Germany), the Research
on Entrepreneurship in Advanced Technologies (RITA) directory and Private Equity Monitor
(Italy), the Webriesgo Database (Spain), and the Library House, which is now called Venture
Source (the UK). Moreover, the data were cross-checked with those available from public sources
(e.g., websites and annual reports of VC investors, press releases and press clippings, and initial
public offering prospectuses). A central data collection unit ensured that the information was
consistent across countries. This data collection process ensures that the VICO dataset offers
a more accurate coverage of VC investments in European countries than the one provided by
available commercial databases. The non-VC-backed firms were included in the VICO dataset
following the same criteria (country, age, independence, industry, and legal status) used for the
inclusion of the VC-backed firms and were randomly extracted (conditional on these criteria)
from all available vintage years of Bureau van Dijk’s Amadeus database. Also in this case,
other sources were used to improve the coverage of the dataset, such as industry associations
and Chambers of Commerce directories, commercial firm directories, Zephyr, Creditreform, the
ZEW Foundation Panel, and the RITA directory.
In February 2010, an online survey was administered to VICO companies in order to col-
lect information on the demand for VC. The survey was sent to 730 VC-backed and 4704 non
VC-backed companies for which we had an email address. Respondents had to ask “Yes” or
“No” to the question “Has your company ever sought equity financing from sources other than
founders, their family members and friends?”. For companies that answered “Yes”, we also
asked when they actually sought. The possible non-exclusive answers were: “before or at the
time of foundation; in the first 2 years after foundation; between the 2nd and the 5th year from
foundation; between the 5th and the 10th year from foundation; after the 10th year from founda-
tion.”.3 We sent reminders between February and April 2010. In order to increase the response
rate of VC-backed companies (who arguably were more likely to seek VC) we complemented
the online survey with phone interviews. Eventually, we received 284 answers from VC-backed
companies (response rate of 38.9%) and 536 answers from control group companies (response
rate of 11.4%). In this paper we use the questionnaires of 524 companies (175 VC-backed and
349 control group) for which we have a full set of information.
2.2 Sample descriptive statistics
Out of 524 sample high-tech entrepreneurial ventures, 248 (47.3%) actively sought equity fi-
nancing in their life. Table 1 provides a cross tabulation of the frequencies of companies that
looked for external equity and those that eventually closed a deal and received VC. The two
groups of companies are closely related. In our sample, the vast majority of VC-backed compa-
nies did actively seek equity capital (84.6%) while 15.4% obtained VC without looking actively
3In order to reduce retrospective bias and to increase response rates, we decided not to inquire aboutcompanies’ seeking behavior on a year by year basis. That option would have meant to administer a muchlonger survey, with a much higher level of detail, and it would have led to less complete and reliable answers.Instead, we collected information on companies’ seeking history in 5 periods of their early life, relatively easyto identify and remember.
6

for external equity. Moreover, 28.7% of companies that never closed a deal looked for external
equity, while the remaining 71.4% never did.
[Insert Table 1 around here]
Table 2 provides a breakdown of seeking and non-seeking companies by industry, country and
foundation year in our sample. Companies in Biotech & Pharmaceutical and in Telecommuni-
cations are more likely to look for equity capital with respect to companies operating in other
sectors. For what concerns the country distribution, companies located in Belgium, UK and
France are characterized by above average probability of seeking external equity. Finally, rel-
atively younger companies (especially those born between 1997 and 2000) in our sample have
higher seeking rates. χ2 tests prove that differences between seeking and non seeking companies
are significant by country and foundation year classes and almost significant by industry.
[Insert Table 2 around here]
In Figure 1 we show the age at which our sample companies looked for external equity.
Entrepreneurial ventures may have looked for capital in more than one period in their lives,
however most of them sought between the 3rd and the 5th year after foundation, while few of
them did it after the 10th year.
[Insert Figure 1 around here]
2.3 The geographical distrubution of VC investments in Europe
We retrieved information about the geographical distribution of VC investments in Europe from
Thomson One database. On the 26th of February 2016, we downloaded from Thomson One
the full list of VC investments carried out between 1980 and 2010 by European VC investors
(44,126 investments in total ). Figure 2a shows the evolution of the total number of investment
rounds and of first investment rounds made by European investors between 1990 and 2010
(the number of investment rounds before 1990 is very close to 0). The number of investments
increased steeply since the 90s, spiking in year 2000 (around 2500 investments) and falling in
2002 (to around 1000 investments) as a result of the dot-com bubble. Interestingly, another
jump is evident in 2003-2004 and is constituted largely by follow-up rounds (as shown by the
difference between the curves of total rounds and first rounds).
In Figure 2b we show the number of active investors per year. We consider an investor to
be active if it has made at least one investment in the focal year. The graph shows again a
peak of active investors (close to 800) in 2000, and a following shake-out, although this latter
seems to be relatively small when compared to the figure about investments. The number of
investors active in first rounds is (quite constantly from 2002) nearly half of the total number
of active investors.
[Insert Figure 2 around here]
7

For each investment, Thomson One records information about the address at which the head-
quarters of both the VC investor and the target company are located, which we used to identify
the geographical regions. In particular, we defined geographical regions based on the Nomen-
clature of Territorial Units for Statistics (NUTS) created by the European Commission. The
NUTS classification is a single, coherent system for dividing the European Union’s territory
in order to produce regional statistics for the community. The NUTS classification is based
on three hierarchical levels: NUTS1 (major socio-economic regions), NUTS2 (basic regions
used by the European Commission for the application of regional policies) and NUTS3 (small
regions for specific diagnoses). Eurostat set up the NUTS classification at the beginning of
the 1970s, and it has updated the classification several times since then, according to changes
in the regional breakdown of a country. In this paper, we use the NUTS 2010 classification,
introduced on 7 February 2011 (Commission Regulation (EU) No 31/2011) at the NUTS2 level.
The European Union’s territory is subdivided in 270 NUTS2 regions. On average, a NUTS2
region has an area of 16,310 km2, equivalent to a radius of 40.67 km (Eurostat, 2011).
In order to attribute a NUTS2 regions to each VC investor and target company, we first
translated the textual information on their ZIP code, city and country provided by Thomson
One into numerical information on the latitude and longitude coordinates. This process, called
geocoding, was automated using Google Maps Geocoding API and the R command “geocode”.
We then used geographical data on the administrative boundaries of each NUTS, retrieved from
Eurostat’s website, to link each pair of coordinates with a NUTS2 (2010) identifier.
Figures 3 and 4 show the number of investments by location (at the NUTS2 level) of investors
and of invested companies cumulated over the period 1980-2010, respectively. Interestingly, we
find extremely similar representation of regions in the ranking. The Inner London and the
Ile de France (Paris) regions stand out quite sharply: the former ranks first in the number of
investors while the latter ranks first in the number of invested companies.
Figure 5 presents further evidence about the co-location of investors and invested companies
in Europe. In the figure, we plot the percentage of investments with at least one investor located
in the same country and NUTS2 region where the invested company resides. In the 1990, at
least one of the investors was located in the same NUTS2 region of the portfolio company in
18.8% of the investments, and in the same country in 70.8% of cases. The tendency to co-
locate increased in time. In 2010, the percentages of investments in which one of the investors
is located in the same location of the portfolio company are 44.3% at NUTS2 level and 89.8%
at country level. This trend may be a result of several factors. First, as the number of VC
investors has increased in time, more VC hubs have emerged and the average distance from the
portfolio companies has decreased. Second, VC investors often use syndication with a partner
located close to the target company to access distant investment opportunities (Tykvova and
Schertler, 2011). As the tendency of VC investors to syndicate also increased over time, this
practice has become more and more common4. Third, VC investors types with a strong local
focus (such as governmental and bank-affiliated VC, see Bertoni et al., 2015a) have also become
4According to our elaboration of Thomson One data, the average number of investors in a single deal wentfrom 1.1 in the 90s to 1.5 in 2010.
8

more widespread over time.
[Insert Figures 3 , 4 and 5 around here]
3 Econometric model
In this section we study the effect of location on the demand for external equity by high-tech
entrepreneurial ventures. Our dependent variable measures whether sample entrepreneurial
ventures looked for external equity in a particular year or not. To build the variable, we
combined the answers that our 524 sample companies gave to the survey questions on whether
and when they ever sought equity financing from sources other than founders, their family
members and friends. We constructed a time-varying variable that takes value of 1 in all years
t in which a company i looked for external equity, and 0 otherwise. The variable seekingi,t
is defined from one year before foundation to the 15th year after foundation5. For VC-backed
companies, we exclude from the sample all years after the actual receipt of the first VC round,
since we are not interested in companies that seek follow-up financing rounds. Our observation
period goes from 1984 (one year before the foundation of our youngest sample company) to
2009 (one year before the survey was administered). In figure 6 we plot the sum of seekingi,t by
year. Most companies sought external equity in year 2000, an evidence that is pretty consistent
with figures about total investments around the bubble period (Figure 2a).
[Insert Figure 6 around here]
Our aim is to investigate the effects of proximity to an abundant supply of VC on en-
trepreneurs’ inclination to look for external equity (i.e. the demand side of the VC market).
However, we cannot directly observe the actual supply of VC (i.e. the amount of money that
European VC investors are willing / have at disposal to invest in new firms). Therefore, we
used the number of VC investments that actually took place and the amount of VC invested
as proxies for the supply of VC financing. Note that this is also what companies can actually
observe. Thus, they take their decision whether or not to seek external equity based on the
same information reflected in our measures.
Our main independent variables originates from the data extracted from Thomson One. To
measure the local availability of VC, we construct a variable counting the number of new invest-
ments made by investors whose headquarters were located in each European region (NUTS2)6.
We consider an investment to be new when the investor entered in a company for the first
time. Our aim is to capture the availability of investors willing to enter in a venture that is
new for them. In order to have more stability in time, for each region we summed the number
investments in the last 3 consecutive years. The variable availability locali,t is the logarithm
5We decided to limit our analysis to companies younger than 15 years because of our focus on VC financingin an early stage of entrepreneurial ventures’ life.
6Please note that, since the investments were assigned to a region on the basis of the investor location, asingle round of investment can be counted more than once according to the number of syndicating investors.
9

of this number and represents the availability of VC in the region in which the company i is
located in the 3 years before t7.
We measure the level of competition in the local VC market with a classical C4 index8. More
precisely, the variable concentration locali,t represents the percentage of new investments made
by the top 4 investors in the region of company i in the last 3 years.
In order to assess the effect of geographical distance between companies’ location and
prospective VC investors on the demand for external equity, we built a distance-weighted index
of the availability of VC outside the region where the focal company is located. Instead of
considering all the 270 NUTS2 regions in Europe, we consider only the ones that ranked among
the top 50 in terms of number of VC investments in a particular year. We call these 50 regions
“VC hubs”. We only consider the 50 VC hubs because they are likely to be the main drivers
of companies decision to seek external equity. Investments in those 50 hubs represent 87.2%
of the total number of investments. The additional advantage is that the computation burden
is reduced. Our measure of the distance-weighted (non-local) availability of VC is defined as
follows:
availability fari,t = log∑
l∈Lt,l 6=ki(distance−αi,l,t ∗ availability locali,t)
where Lt is the group comprising the 50 VC hubs, l denotes each of those hubs, distancei,l,t is
the distance (in 10km) between company i and the centroid of the hub l (excluding the region
where the company is located -ki-, if it is a hub) and α is a decay factor for distance.
We also “split” the previous variable in order to disentangle the effect of the availability
within national borders (availability nationali,t) and outside of the country availability abroadi,t.
Both measures are distance-weighted indexes of availability of investments analogous to availability fari,t.
They are defined as follows:
availability nationali,t = log∑
l∈Ci,t,l 6=ki(distance−αi,l,t ∗ availability locali,t)
availability abroadi,t = log∑
l∈Ci,t,l 6=ki(distance−αi,l,t ∗ availability locali,t)
where Ci,t is the group of VC hubs within the country where the company i resides and Ci,t is
the group of cross-border VC hubs (Ci,t ∪ Ci,t = L).
We set α to the value that maximizes the log-likelihood function of our econometric model
(for a similar approach see Bonaccorsi et al., 2014). A detailed description of the proce-
dure we used to estimate decay parameter values is given in the Appendix A. According
to this procedure, the optimal decay parameter values are 0.4 for availability fari,t, 1 for
availability nationali,t and 0.3 for availability abroadi,t. Calibrated parameters higher than 0
suggest that distance from VC hubs matters for companies tendency to look for external equity.
7As robustness checks, we performed similar analyses using in alternative the new investments made in thelast 5 years or in the last year only. We also repeated the analysis considering, instead of new investments, allinvestment rounds and first investment rounds only. In all cases, we obtained similar results, which are availablefrom the authors upon request.
8We alternatively use a Herfindahl-Hirschman index, obtaining similar results
10

Moreover, the high parameter for availability nationali,t indicates that importance of VC avail-
ability decays faster with distance within national borders than across borders. Henceforth, for
sake of simplicity we omit the index i, t that we used to better explain our variables.9
The econometric model also includes a set of industry, country and year dummies and a
continuous variable measuring the age of the company.
For a subset of companies, we also have information about the human capital of the founding
team, the internal availability/composition of capital and the innovativeness of the venture, all
of which have been identified by previous literature as important drivers of companies’ tendency
to seek external finance (Eckhardt et al., 2006; Cosh et al., 2009; Mina et al., 2013). Our
sample companies were inquired about the human capital of founders in the survey administered
in 2010. In particular, we asked whether “among the founders of the company there were
individuals who, before the foundation of the company: i) had previous managerial experience,
ii) had founded one or more firms, iii) had obtained an MBA or a master in Economics and
iv) had obtained a PhD in technical or scientific disciplines”. We code the answers to these
questions in 4 dummy variables: manager, serial, MBA and PHD science. We measure the
availability of capital by the variables cashflow/sales, equal to the ratio between cash flow
and sales, and debt/totalassets, equal to the ratio between total debt and total assets. Both
of these variables are lagged by 1 year and winsorized at the 1% level to reduce the impact of
outliers. The accounting data necessary to compute these ratios is available in the VICO dataset
and was originally retrieved from Bureau Van Dijk’s Amadeus dataset. We proxy companies’
innovativeness by the variable patentstock, equal to the cumulative number of patents granted
to each company, depreciated over time (with a 0.15 knolwedge depreciation rate, as is usual
in the patent literature, see e.g. Hall et al., 2005). All these variables are inserted in the
model specification as controls. We also control for two variables measured at NUTS2 level
in each year: the logarithm of the GDP per capita (local GDP percapita) and the logarithm
of the number of patents granted (local patents), both of which were retrieved from Eurostat.
A summary of all variables used in our analysis is provided by table 3, while table 4 shows
summary statistics and the correlation matrix.
[Insert Tables 3 and 4 around here]
4 Results
The econometric model is estimated using a panel random effects specification, which esti-
mates the linear probability of looking for external equity for company i in year t. The results
of the econometric estimates are reported in Table 5. The different columns represent differ-
ent model’s specifications. Every model includes as regressor company age and three sets of
dummies capturing industry, country and year effects. In columns 1, we include the main in-
dependent variables: the local VC availability, the level of competition in the local VC market
and the non-local VC availability. In column 2 we substitute the non-local VC availability with
9Please note that in all models all variables were lagged 1 year in order to reduce concerns about endogeneity.
11

two components: the national VC availability and the VC availability abroad. All the non-local
variables are distance-weighted using the optimal decay parameter values for distance, as de-
scribed in detail in Appendix A. In columns 3 and 4, we include additional control variables in
order to account for company-specific and region-specific effects. The number of observations
when we consider these additional controls decreases to 421 companies, because of missing
values.
The local VC availability has a positive effect on companies’ propensity to look for ex-
ternal equity, as shown by the positive and significant coefficient (at least at 10% level) of
availability local. On the contrary, entrepreneurial ventures’ propensity to seek external eq-
uity seems not to be significantly affected by the level of competition in the local VC market.
The variable concentration local though negative, is never significant in all our models. The
distance weighted non-local availability availability far has a positive coefficient (in columns
1 and 3), significant at the 1% level, indicating that companies’ propensity to look for exter-
nal equity is positively influenced by proximity to large VC markets outside of their regions.
However, this effect is driven by the national VC market. In fact, columns 2 and 4 of table 5
show that availability national has a positive and significant (at the 1% level) effect on the
companies’ propensity to look for external equity, while availability abroad is non-significant
at standard significance levels.
[Insert Table 5 around here]
It is important to investigate the economic magnitude of the effects illustrated above, and
how rapidly the magnitude decreases with geographic distance. For this purpose, let us consider
Figure 7. The figure shows the magnitude of the effects of local and national VC availabilities,
estimated using the model specification presented in column 4. The graph shows the effects of
an increment in the number of investments in a given region on the probability that a company
actively seeks external equity financing if it is located in the same region (effect of the local
availability) or in a different region of the same country, as a function of the distance from that
region (effect of the national availability).
We consider an increment of 22 investments, equal to a change from the 25th (1) to the 75th
(23) percentile of the number of new investments in the last 3 years over all NUTS2 region. For
sake of example, this hypothetical shock would correspond to a move from Alsace to Karlsruhe
region in 2002. The effect of the shock in local availability leads to an increase in the likelihood
of a focal company looking for external equity in a given year equal to 4.7%, computed as 0.019
(i.e. the coefficient of availability local in column 6 of table 5) multiplied by the shock in the
local availability (log(23+1)-log(1+1)). In other terms, in 2002 companies located in Karlsruhe
had a probability to look for external equity 4.7 percentage points higher than those located
in Alsace, only because of location effects. Since the unconditioned probability of looking for
equity financing in our sample is equal to 18.3% (see Table 4), this difference is sizable and
represents an increase of around one fourth. The effect of the shock in the availability of VC in
the region where a company is located is always greater than that of a similar shock in another
region. The shock in the size of the VC market considered above (+22 investments) leads to
12
a 3.5% increase of the probability that a company located at 100 km from this market looks
for external equity. The increase is 1.93%, 1.06% and 0.06% for companies located 250 km,
500 km and 1000 km away from the focal market, respectively. In other words, in our example
companies located 250 km away from Karlsruhe area are ceteris paribus only 1.93 percentage
points more likely to search than companies located 250 km away from Alsace region, and so
on.
[Insert Figure 7 around here]
Let us turn our attention to control variables. Companies’ age does not seem to have an
influence on the probability to look for external equity, once we add to the model specification
firm- and region-specific controls. The estimates in columns 3 and 4 of table 5 support the
view that the human capital of the founders positively affect companies’ propensity to look for
external sources of finance (Eckhardt et al., 2006). In fact, our measures of founders’ previous
managerial experience, MBA and PhD, have a positive and significant (at the 10% level) effect
on the dependent variable. Companies with more cash flow are significantly (at the 1% level) less
likely to look for external equity. This result is in line with the pecking order theory, according
to which companies prefer to finance new projects with internal cash flows with respect to
relatively more costly external capital (Cosh et al., 2009; Myers and Majluf, 1984). Debt on
total assets exerts a positive effect (significant at the 10% level) on companies propensity to
look for external capital, in line with to prior studies (Cosh et al., 2009; Mina et al., 2013). The
same holds true for companies with a greater patent stock (significant at the 5% level), possibly
because these firms can use their IPR as collateral. The positive and significant (at the 1%
level) coefficient of regional GDP per capita indicates that companies located in more developed
regions are more inclined to look for external equity. The opposite applies to companies located
in regions where more patents are filed, as indicated by the negative and significant (at the 1%
level) coefficient of the logarithm of patents in the region. This effect may be due to the fact
that more innovative regions have in place more comprehensive support systems for high-tech
entrepreneurial ventures, partially compensating for the need for external equity.
4.1 Robustness checks
We performed several robustness checks. First of all, we are concerned about the presence in our
sample of companies that did not look for external equity simply because they were extremely
unlikely to receive it, irrespectively of their location. However, detecting ex-ante whether a
company is a candidate to receive VC is not an easy job. In order to overcome this issue, we
exploit the information about the actual receipt of VC financing. In particular, we build a
sample composed of VC-backed companies and non-VC-backed twins with the rationale that
the companies included in this sample have similar probability of receiving VC, thus making
the sample more homogeneous. This is in line with the suggestion by Ho et al. (2007) to use
matching as a pre-processing technique so that the potential for confounding bias is significantly
reduced compared to the parametric analysis based on raw data. We computed the probability
13
that a company is actually financed by VC, i.e. the propensity score, using all company-year
observations for non-VC backed companies and the company-year observations in the year when
VC-backed companies actually receives the first financing round. In particular, we estimate a
probit model with age, industry and year dummy variables (whose values are non-missing for
all company-year observations) and predict the estimated probability of receiving VC. Then,
we performed a 1 to 2 matching, in other words we associated to each VC-backed company
two non VC-backed companies having a similar probability (i.e. within a caliper) of obtaining
VC. This was done without replacement, i.e. a non VC-backed company was not eligible to
be matched more than once. We decided to adopt a 1 to 2 matching in order not to reduce
too much the number of observations while effectively reduce uncontrolled heterogeneity in
our sample and consequently the potential confounding bias. We restrict the matched sample
imposing the company-year observations to be in the common support, in other words we
dropped observations whose estimated propensity score is higher than the maximum or lower
than the minimum propensity score of VC-backed companies. We obtained that an observation
referred to a VC-backed company in the year when it received VC (e.g. company x1 year t1)
was matched with an observation referred to a non VC-backed company in certain year (e.g.
company x0 year t0) by minimizing the distance in terms of propensity score. Then, for company
x1 and x0, we keep in the “matched sample” all company-year observations until year t1 and t0
respectively. We then checked that our matched sample have acceptable balancing properties,
e.g. by graphing the pre- and post-matching propensity scores distribution. The results of the
models estimated using the “matched sample” are reported in table 6. The results relating
to the effects of proximity to an abundant supply of VC are very similar to those illustrated
above. Note that in these estimates the concentration of the local VC market has a (weakly)
significant negative effect on the probability to seek external equity.
[Insert Table 6 around here]
Second, we are also concerned about potential reverse causality. A company actively seeking
external equity may decide to locate in a place with high (local) availability of VC, in other
words companies’ localization choice may be endogenous. We cannot directly rule out reverse
causality. The best we can do is to assess its alleged effect on our estimates. One can assume
that companies that did not look for external equity at the time of foundation or before are
unlikely to have selected their location according to the local availability of VC.10 Therefore,
we decided to estimate the model excluding companies that indicated in the questionnaire that
they were looking for external equity at foundation or before. The results are reported in table
7. While the coefficient of availability local is smaller and less significant, the remaining results
are unchanged. Therefore, it is unlikely that our results are driven by reverse causality.
10In accordance with this assumption, we find a positive and significant correlation (controlling for country,industry and year dummies and age in a cross-sectional probit model) between the fact that a company looksfor external equity at foundation or before and its location in one of the 50 VC hubs. Conversely, we do notfind a significant correlation (same specification as before) between the fact that a company looks for externalequity in other period of its life except at foundation or before and its location in one of the 50 VC hubs.This empirical evidence suggests that only companies seeking external equity at foundation or before may havedecided where to locate according to the availability of VC across regions.
14

[Insert Table 7 around here]
Third, we decided to further validate the robustness of our results by changing the specifi-
cation of the model, i.e. using different key independent variables as proxies of the “spatial”
availability of VC. In particular, we build variables indicating the availability of VC within a
certain radius: for example availability d0 − d1 km is computed as the log of the number of
new investments made by investors located at a distance between d0 and d1 kilometers from
the focal company. We decided to use 0, 50, 250, 1000 and 5000 kilometers as threshold in
order to balance the need for a sufficiently fine-grained measure of distance and the risk of
collinearity between those variables. We also checked for the sensitivity of our results to the
chosen thresholds (for the sake of synthesis, these additional estimates are not reported in
the paper and are available from the authors upon request). Moreover, we differentiated be-
tween the “radius” availability inside the same country where the focal company is located,
availability national d0 − d1 km, and the availability abroad, availability abroad d0 − d1 km.
The results of the models with this “radius” specification are reported in table 8. In line with
the evidence illustrated earlier, they indicate that companies are more inclined to look for ex-
ternal equity if they are located nearby a large VC market (i.e. at less than 250 km). However,
the effect of demand of the availability of an abundant supply of VC vanishes across national
borders, independently of geographical distance11.
[Insert Table 8 around here]
5 Discussion and conclusion
The aim of this paper was to assess how the geographic distribution of the supply of VC
affects entrepreneurs’ propensity to look for external equity (i.e. the demand side of the VC
market). For this purpose, we have examined the search for external equity by a sample of
524 European high-tech entrepreneurial ventures observed over 25 years. Our results indicate
that the location of high-tech entrepreneurial ventures deeply affects their propensity to look
for external equity. Companies located in proximity of a VC hub, where there is abundant
supply of VC, are considerably more likely to look for external equity. However, the positive
influence of a large VC market rapidly decreases with greater geographical distance and becomes
negligible at a distance higher than 250 km. The same applies when crossing national borders:
companies’ propensity to seek external equity is not influenced by VC hubs located beyond
national borders, independently of distance.
These results contribute to the literature on VC in several ways. In recent years, considerable
attention has been devoted to the study of the “geography of VC”, i.e. the study of how VC
investments are spatially distributed. The uneven distribution of VC investments is typically
11We further checked the robustness of our results by repeating the “radius” model estimation using thematched sample and on the sample obtained by excluding firms seeking external capital at foundation orbefore. Results of these estimates (available from the authors) confirm that the positive effects on demand ofan abundant supply of VC are very localized, and vanish across borders.
15

attributed to supply-side factors, such as the strong geographic concentration of VC investors
and their preference to invest locally (Chen et al., 2010; Lindgaard Christensen, 2007; Mason
and Harrison, 2002). The handful of studies that focus on demand-side factors suggest that
companies located outside of VC hubs self-select out of the VC market (Bertoni et al., 2015b;
Mason and Harrison, 2002). We add to this literature by showing that a large supply of
VC stimulates the demand for external equity by companies located within a radius of 250
km. These results confirm that geographical distance between entrepreneurial ventures and
prospective investors is a source of considerable costs for entrepreneurs, thereby reducing their
inclination to seek external equity. In addition, we show that lack of competition in the local
market does not discourage entrepreneurs from looking for external equity. Second, we add to
the literature on cross-border VC investments. This literature focuses on the potential benefits
for entrepreneurial ventures of partnering up with international VC investors, as these latter
may offer access to their local market and better exit opportunities (Makela and Maula, 2005;
Bertoni and Groh, 2014). However, international investments also bring about substantial costs,
associated for example to differences in regulations and culture (Cumming and Macintosh, 2003;
Wright et al., 2005). The evidence that companies’ propensity to look for external equity is not
affected by the availability of VC beyond their national borders indicates that, in the eyes of
entrepreneurs, the expected costs of cross-border VC are often not compensated by the expected
benefits.
We also contribute to the literature on the search for external finance of entrepreneurial
ventures. So far, very few studies have analyzed the decision made by entrepreneurial ventures
to look for external equity financing (Cosh et al., 2009; Eckhardt et al., 2006; Mina et al., 2013).
To the best of our knowledge, Bertoni et al. (2015b) were the only to consider how the local
supply of VC affects the demand. Based on data on Italian ventures, they find that when the
local VC market is thin, only a small fraction of companies is willing to incur the entry cost
required to be in the VC market. We extend this work to an international setting, which allows
us to assess the role of national borders, and provide an in-depth analysis of the influence on
the demand for external equity exerted by geographical distance between entrepreneurs and
prospective investors, located both within and across national borders.
As any study, this work has some limitations which opens up new directions for future re-
search. First, in this paper we consider the stimulating effect on the demand for external equity
generated by proximity to a large supply of VC. However, in addition to size, other charac-
teristics of the VC supply may influence entrepreneurs’ propensity to look for external equity.
In particular, VC markets may differ depending on the investment experience of investors,
and their ownership and governance (e.g. private versus governmental VC, independent versus
captive VC, etc.). As the objectives and competencies of different investors clearly differ, the
expected benefits and costs for entrepreneurs of seeking VC may also differ. For example, we
expect that an abundant supply of governmental or bank-affiliated VC, which generally invest
locally, will not stimulate demand at distance, while the opposite holds true for VC markets
populated by corporate VC investors, which tend to invest on a global scale. Second, following
16

a consolidated tradition in the Industrial Organization literature, we have inversely proxied
the level of competition in local VC markets with concentration indexes. In so doing, we have
neglected syndication, which may clearly influence competition. Third, while in this paper
we focus on the geographical distance between entrepreneurial ventures and prospective VC
investors, we have not considered the impact of other types of distance, such as cultural or in-
stitutional distance (Nahata et al., 2015). These factors may clearly influence the costs incurred
by entrepreneurs in searching for VC and their expectations relating to the likelihood of success
of their search. Fourth, while this study considers a 25 years period, we have assumed the effect
of geographical distance on the demand for external equity to be stable over time. Indeed, the
fast development of ICT and of the transportation system, especially on international scale,
may have led to a reduction of the importance of physical proximity between prospective in-
vestors and entrepreneurs in inducing these latter to search for external equity. More generally,
it would be interesting to assess how the regional endowment of physical transportation in-
frastructure (i.e. proximity to a hub airport) and advanced telecommunications infrastructure
moderates the effect of geographical distance on entrepreneurs’ demand for external equity.
In spite of the above limitations, our study provides novel results which have important
policy implications. Our results clearly highlight the role of geographical distance in discour-
aging entrepreneurs’ search for external equity. This evidence brings to the fore the issue of
how promising ventures located in peripheral areas (i.e. areas that are far from VC hubs) can
be helped to get in touch with prospective VC investors. Moreover, the result that the demand
for external equity is not influenced by VC hubs located beyond national borders, in spite of
the unique benefits entrepreneurial ventures can reap from foreign VC investors, further docu-
ments the national fragmentation of the European VC market and its detrimental effects. In
recent years the European Commission has made several steps to overcome national barriers
to cross-border VC flows, most notably with the introduction of the VC passport (European
Parliament, 2013). A replication of our analysis in some years from now would be extremely
useful to asses the effectiveness of this move for the creation of a unified European VC market.
17

Tables & figures
Table 1: Number of sample companies seeking external equity and closing a deal with a VCinvestor
Closed a deal
Sought equity financing Never closed Deal closed Total
No. Col%
Row%
No. Col%
Row%
No. Col%
Row%
Non seeking 249 71.35 90.22 27 15.43 9.78 276 52.67 100.00Seeking 100 28.65 40.32 148 84.57 59.68 248 47.33 100.00Total 349 100.00 66.60 175 100.00 33.40 524 100.00 100.00
Pearson chi2(1) = 146.1973 Pr = 0.000
18
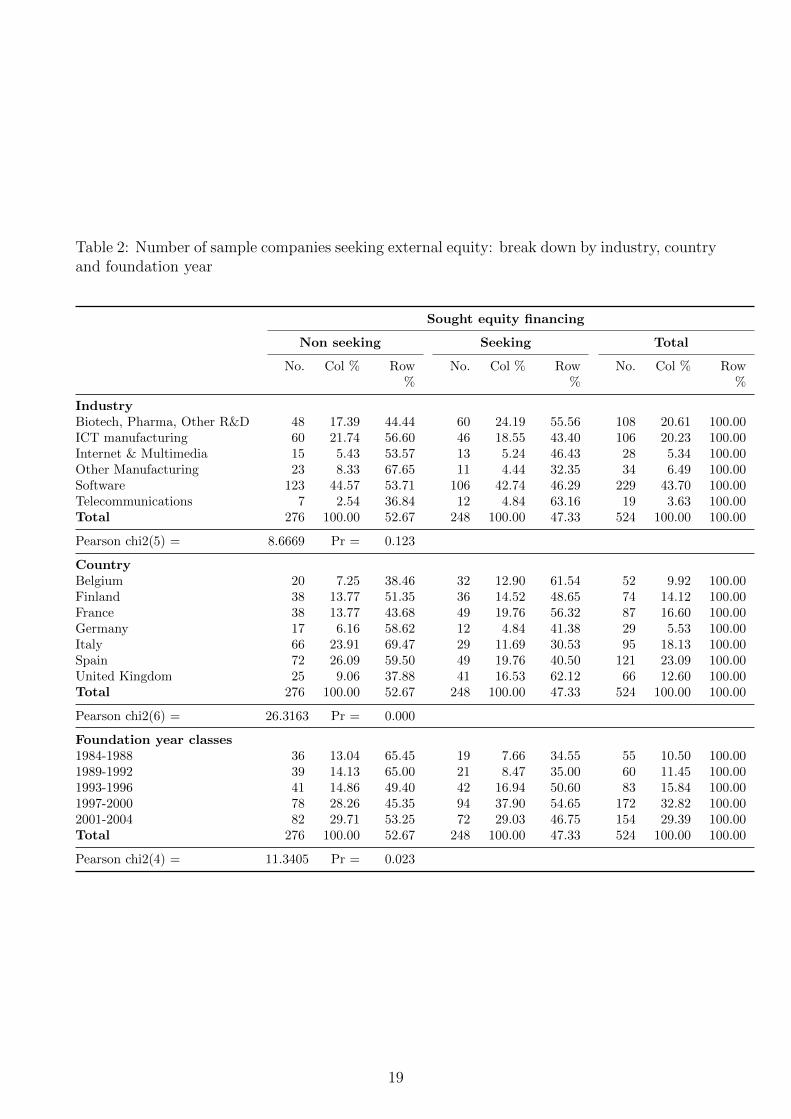
Table 2: Number of sample companies seeking external equity: break down by industry, countryand foundation year
Sought equity financing
Non seeking Seeking Total
No. Col % Row%
No. Col % Row%
No. Col % Row%
IndustryBiotech, Pharma, Other R&D 48 17.39 44.44 60 24.19 55.56 108 20.61 100.00ICT manufacturing 60 21.74 56.60 46 18.55 43.40 106 20.23 100.00Internet & Multimedia 15 5.43 53.57 13 5.24 46.43 28 5.34 100.00Other Manufacturing 23 8.33 67.65 11 4.44 32.35 34 6.49 100.00Software 123 44.57 53.71 106 42.74 46.29 229 43.70 100.00Telecommunications 7 2.54 36.84 12 4.84 63.16 19 3.63 100.00Total 276 100.00 52.67 248 100.00 47.33 524 100.00 100.00
Pearson chi2(5) = 8.6669 Pr = 0.123
CountryBelgium 20 7.25 38.46 32 12.90 61.54 52 9.92 100.00Finland 38 13.77 51.35 36 14.52 48.65 74 14.12 100.00France 38 13.77 43.68 49 19.76 56.32 87 16.60 100.00Germany 17 6.16 58.62 12 4.84 41.38 29 5.53 100.00Italy 66 23.91 69.47 29 11.69 30.53 95 18.13 100.00Spain 72 26.09 59.50 49 19.76 40.50 121 23.09 100.00United Kingdom 25 9.06 37.88 41 16.53 62.12 66 12.60 100.00Total 276 100.00 52.67 248 100.00 47.33 524 100.00 100.00
Pearson chi2(6) = 26.3163 Pr = 0.000
Foundation year classes1984-1988 36 13.04 65.45 19 7.66 34.55 55 10.50 100.001989-1992 39 14.13 65.00 21 8.47 35.00 60 11.45 100.001993-1996 41 14.86 49.40 42 16.94 50.60 83 15.84 100.001997-2000 78 28.26 45.35 94 37.90 54.65 172 32.82 100.002001-2004 82 29.71 53.25 72 29.03 46.75 154 29.39 100.00Total 276 100.00 52.67 248 100.00 47.33 524 100.00 100.00
Pearson chi2(4) = 11.3405 Pr = 0.023
19

Table 3: Variables description
Variable Description Data source(s)
1 seekingi,t Dummy equal to 1 in the year when the company look for outside equity fi-nancing. In order to build this variable we combined the questions Has yourcompany ever sought equity financing from sources other than founders,their family members and friends? and the closed question about whenthey seek.
VICO survey
2 availability locali,t (Logarithm of the sum) of the number of investments made by each investorlocated (headquarters) in the region of company i in the time period (t−2)to t. Please note that we consider only the “new” investments by aninvestor, i.e. when an investor finances a firm for the first time.
Thomson One
3 concentration locali,t Concentration of investments made by investors located (headquarter) inthe region of company i in the time period (t − 2) up to t. Classical C4measure, computed as the percentage of investments made by the top 4investors in the time period (t− 2) to t.
Thomson One
4 availability fari,t A distance-weighted index of availability of investments outside the regionwhere the company i is located. Formula:log
∑l∈Lt,l 6=ki
(distance−αi,l,t ∗ availability locali,t)
where Lt is the group comprising the 50 VC hubs, l denotes each of thosehubs, distancei,l,t is the distance (in 10km) between company i and thecentroid of the hub l (excluding the region where the company is located-ki-, if it is a hub) and α is a decay factor for distance.
Thomson One andGoogleMaps
5 availability nationali,t A distance-weighted index of availability of investments outside the regionwhere the company i is located but in the same country. Formula:log
∑l∈Ci,t,l 6=ki
(distance−αi,l,t ∗ availability locali,t)
Ci,t is the group of VC hubs of the country where the company resides, ldenotes each of those hubs, distancei,l,t is the distance (in 10km) betweencompany i and the centroid of the hub l (excluding the region where thecompany is located -ki-, if it is a hub) and α is a decay factor for distance.
Thomson One andGoogleMaps
6 availability abroadi,t A distance-weighted index of availability of investments outside the countrywhere the company i is located. Formula:log
∑l∈Ci,t,l 6=ki
(distance−αi,l,t ∗ availability locali,t)
Ci,t is the group of VC hubs outside of the country where the companyresides, l denotes each of those hubs, distancei,l,t is the distance (in 10km)between company i and the centroid of the hub l and α is a decay factorfor distance.
Thomson One andGoogleMaps
7 manager Dummy equal to 1 if among the group of founders of the company therewere one or more individuals who had previous managerial experience (be-fore the foundation of the company)
VICO survey
8 serial Dummy equal to 1 if among the group of founders of the company therewere one or more individuals who had founded one or more firms (beforethe foundation of the company), i.e. serial entrepreneur(s)
VICO survey
9 MBA Dummy equal to 1 if among the group of founders of the company therewere one or more individuals who had obtained an MBA or a master inEconomics (before the foundation of the company)
VICO survey
10 PhD science Dummy equal to 1 if among the group of founders of the company therewere one or more individuals who had obtained a PhD in technical orscientific disciplines (before the foundation of the company)
VICO survey
11 cashflow/sales Ratio between cash flow and sales, computed in the year t− 1 VICO dataset12 debt/totalassets Ratio between total debt and total assets, computed in the year t− 1 VICO dataset13 patentstock Depreciated number of granted patents for firms in manufacturing sector VICO dataset14 local GDP percapita logarithm of the GDP per capita at the local (NUTS2) level in the year
t− 1Eurostat
15 local patents logarithm of the number of patents at the local (NUTS2) level in the yeart− 1
Eurostat
20

Tab
le4:
Var
iable
sdes
crip
tive
stat
isti
csan
dco
rrel
atio
nm
atri
x
Var
iab
leM
ean
S.D
.M
inM
ax(1
)(2
)(3
)(4
)(5
)(6
)(7
)(8
)(9
)(1
0)(1
1)(1
2)(1
3)(1
4)(1
5)(1
6)
(1)
seek
ing
0.18
30.
387
0.00
01.
000
1.00
0(2
)av
aila
bil
ity
loca
l2.
181
1.94
30.
000
7.22
60.
078
1.00
0(3
)co
nce
ntr
atio
nlo
cal
0.58
10.
427
0.00
01.
000
0.06
40.
373
1.00
0(4
)av
aila
bil
ity
far
(α=
0.4)
1.95
30.
951
0.35
23.
763
0.08
50.
531
0.36
11.
000
(5)
avai
lab
ilit
yn
atio
nal
(α=
1)0.
931
0.92
40.
000
5.06
50.
109
0.11
70.
338
0.65
31.
000
(6)
avai
lab
ilit
yab
road
(α=
0.3)
2.24
41.
023
0.20
03.
685
0.07
00.
563
0.34
80.
982
0.53
71.
000
(7)
age
5.61
04.
237
-1.0
0015
.000
-0.0
490.
195
0.11
70.
256
0.11
90.
271
1.00
0(8
)m
anag
er0.
641
0.48
00.
000
1.00
00.
110
0.04
2-0
.010
0.00
30.
014
-0.0
06-0
.009
1.00
0(9
)se
rial
0.42
50.
494
0.00
01.
000
0.03
6-0
.029
-0.0
240.
054
0.05
40.
040
-0.0
270.
366
1.00
0(1
0)M
BA
0.16
00.
366
0.00
01.
000
0.08
1-0
.001
0.02
00.
033
0.04
10.
034
-0.0
530.
158
0.06
91.
000
(11)
Ph
Dsc
ien
ce0.
195
0.39
60.
000
1.00
00.
057
0.10
10.
068
0.17
10.
197
0.13
1-0
.143
-0.1
07-0
.012
0.15
21.
000
(12)
cash
flow
/sa
les
0.01
70.
264
-1.3
920.
991
-0.1
470.
000
-0.0
150.
003
-0.0
230.
012
0.10
7-0
.091
-0.0
830.
008
-0.0
691.
000
(13)
deb
t/
tota
las
sets
0.08
40.
215
0.00
02.
833
0.07
60.
129
0.11
60.
207
0.13
00.
215
0.12
70.
003
0.00
5-0
.002
0.00
0-0
.070
1.00
0(1
4)p
aten
tst
ock
0.03
50.
225
0.00
07.
214
0.11
20.
035
0.04
40.
069
0.12
40.
041
0.00
50.
062
0.07
70.
029
0.11
3-0
.093
0.00
81.
000
(15)
loca
lG
DP
per
cap
ita
25.0
629.
825
8.00
098
.400
0.12
00.
716
0.15
60.
460
0.27
40.
464
0.15
10.
063
-0.0
340.
014
0.11
70.
007
0.09
40.
037
1.00
0(1
6)lo
cal
pat
ents
5.42
41.
256
0.51
38.
114
0.03
30.
632
0.23
60.
319
0.14
00.
313
0.10
60.
035
-0.0
670.
062
0.13
4-0
.027
0.03
50.
061
0.55
31.
000
21

Table 5: Seeking external equity: a panel random effect model
(1) (2) (3) (4)
availability local 0.011∗∗ 0.014∗∗ 0.016∗∗ 0.019∗∗
(0.005) (0.006) (0.008) (0.008)concentration local -0.013 -0.017 -0.003 -0.007
(0.014) (0.014) (0.017) (0.018)availability far (α=0.4) 0.480∗∗∗ 0.519∗∗∗
(0.086) (0.098)availability national (α=1) 0.053∗∗∗ 0.053∗∗∗
(0.013) (0.015)availability abroad (α=0.3) 0.089 0.028
(0.094) (0.109)manager 0.061∗ 0.064∗∗
(0.033) (0.032)serial -0.031 -0.030
(0.031) (0.030)MBA 0.069∗ 0.070∗
(0.037) (0.037)PhD science 0.067∗ 0.064∗
(0.039) (0.038)cash flow / sales -0.113∗∗∗ -0.115∗∗∗
(0.022) (0.022)debt / total assets 0.053∗ 0.052∗
(0.029) (0.029)patent stock 0.071∗∗ 0.076∗∗
(0.030) (0.030)local GDP percapita 0.008∗∗∗ 0.007∗∗∗
(0.002) (0.002)local patents -0.058∗∗∗ -0.047∗∗∗
(0.014) (0.014)age -0.005∗ -0.004∗ -0.003 -0.003
(0.003) (0.003) (0.003) (0.003)Country dummies Yes Yes Yes YesIndustry dummies Yes Yes Yes YesYear dummies Yes Yes Yes Yes
N Obs. 5009 5009 3933 3933N groups 524 524 421 421pseudo-R2 0.065 0.060 0.095 0.089
Legend: The table reports coefficients and standard errors (in brackets) of panel random effects models whosedependent variable is seeking. Significance levels: * p < 0.10;** p < 0.05;*** p < 0.01.
22

Table 6: Seeking external equity: a panel random effect model on the matched sample
(1) (2)
availability local 0.017∗ 0.021∗∗
(0.009) (0.010)concentration local -0.040∗ -0.045∗
(0.024) (0.025)availability far (α=0.4) 0.237∗∗∗
(0.066)availability national (α=1) 0.048∗∗
(0.024)availability abroad (α=0.3) 0.148
(0.168)age 0.008∗∗ 0.008∗∗
(0.004) (0.004)Country dummies Yes YesIndustry dummies Yes YesYear dummies Yes Yes
N Obs. 2059 2059N groups 464 464pseudo-R2 0.110 0.106
Legend: The table reports coefficients and standard errors (in brackets) of panel random effects models whosedependent variable is seeking. Significance levels: * p < 0.10;** p < 0.05;*** p < 0.01.
23

Table 7: Seeking external equity: a panel random effect model excluding companies seeking atfoundation or before
(1) (2)
availability local 0.006 0.009∗
(0.005) (0.005)concentration local -0.006 -0.009
(0.013) (0.014)availability far (α=0.4) 0.402∗∗∗
(0.082)availability national (α=1) 0.053∗∗∗
(0.013)availability abroad (α=0.3) -0.147
(0.091)age 0.004∗ 0.005∗∗
(0.002) (0.002)Country dummies Yes YesIndustry dummies Yes YesYear dummies Yes Yes
N Obs. 4603 4603N groups 438 438pseudo-R2 0.095 0.091
Legend: The table reports coefficients and standard errors (in brackets) of panel random effects models whosedependent variable is seeking. Significance levels: * p < 0.10;** p < 0.05;*** p < 0.01.
24
Table 8: Seeking external equity: a panel random effect model with “radius” specification
(1) (2) (3) (4)
availability 0-50 km 0.013∗∗ 0.015∗∗
(0.005) (0.007)availability 50-250 km 0.017∗∗∗ 0.016∗∗
(0.006) (0.007)availability 250-1000 km 0.015 0.010
(0.014) (0.017)availability 1000-5000 km -0.001 -0.003
(0.028) (0.034)availability national 0-50 km 0.014∗∗∗ 0.016∗∗
(0.005) (0.007)availability national 50-250 km 0.015∗∗ 0.014∗
(0.006) (0.007)availability national 250-1000 km 0.002 0.007
(0.006) (0.008)availability national 1000-5000 km 0.018 0.042
(0.036) (0.064)availability abroad 0-50 km -0.009 -0.000
(0.029) (0.032)availability abroad 50-250 km 0.005 0.006
(0.006) (0.007)availability abroad 250-1000 km 0.016 0.014
(0.011) (0.014)availability abroad 1000-5000 km -0.004 -0.003
(0.027) (0.033)manager 0.065∗∗ 0.064∗∗
(0.029) (0.029)serial -0.027 -0.028
(0.028) (0.028)MBA 0.071∗∗ 0.069∗∗
(0.034) (0.034)PhD science 0.056 0.058
(0.035) (0.035)cash flow / sales -0.120∗∗∗ -0.121∗∗∗
(0.022) (0.022)debt / total assets 0.057∗∗ 0.058∗∗
(0.029) (0.029)patent stock (manufacturing) 0.082∗∗∗ 0.082∗∗∗
(0.030) (0.030)local GDP percapita 0.007∗∗∗ 0.006∗∗∗
(0.002) (0.002)local patents -0.046∗∗∗ -0.045∗∗∗
(0.013) (0.013)age -0.004∗ -0.003 -0.004∗ -0.003
(0.002) (0.003) (0.002) (0.003)Country dummies Yes Yes Yes YesIndustry dummies Yes Yes Yes YesYear dummies Yes Yes Yes Yes
N Obs. 5009 3933 5009 3933N groups 524 421 524 421pseudo-R2
Legend: The table reports coefficients and standard errors (in brackets) of panel random effects models whosedependent variable is seeking. Significance levels: * p < 0.10;** p < 0.05;*** p < 0.01.
25

Figure 1: Percentage of sample companies seeking external equity by age classes
86
108
121
106
47
050
100
150
<=0 yo 1-2 yo 3-5 yo 6-10 yo >10 yo
Figure 2: Total number of investments made by European investors and total number of activeEuropean investors
050
010
0015
0020
0025
00
1990 1995 2000 2005 2010year
Number of investmentsNumber of first round investments
(a) Total number of investments
020
040
060
080
0
1990 1995 2000 2005 2010year
Number of active investorsNumber of investors active in first round investments
(b) Total number of European investors
Source: own elaboration based on Thomson One data
26

Figure 3: Total number of new investments by investor location (1980-2010)
01,
000
2,00
03,
000
4,00
0
Inne
r Lon
don
Île d
e Fr
ance
Obe
rbay
ern
Hel
sink
i-Uus
imaa
Noo
rd-H
olla
nd
Hov
edst
aden
Sto
ckho
lm
Rhô
ne-A
lpes
Sou
ther
n an
d E
aste
rn
Dar
mst
adt
Köl
n
Sm
ålan
d m
ed ö
arna
Com
unid
ad d
e M
adrid
Wie
n
Ber
lin
Lom
bard
ia
Eas
t Ang
lia
Eas
tern
Sco
tland
Rég
ion
de B
ruxe
lles-
Cap
itale
/Bru
ssel
s H
oofd
sted
elijk
Gew
est
Väs
tsve
rige
Düs
seld
orf
Pro
v. A
ntw
erpe
n
Nor
te
Glo
uces
ters
hire
, Wilt
shire
and
Bris
tol/B
ath
area
Maz
owie
ckie
Pro
v. V
laam
s-B
raba
nt
Sou
th W
este
rn S
cotla
nd
Utre
cht
Nie
derb
ayer
n
Ham
burg
Stu
ttgar
t
Köz
ép-M
agya
rors
zág
Source: own elaboration based on Thomson One data. Please note that each investment is counted more thanonce when it is syndicated, i.e. an investment made by 3 investors is counted as one for each NUTS2 region
where the investors are located.
Figure 4: Total number of investments by invested company location (1980-2010)
050
01,
000
1,50
0
Île d
e Fr
ance
Inne
r Lon
don
Sto
ckho
lm
Obe
rbay
ern
Hel
sink
i-Uus
imaa
Rhô
ne-A
lpes
Hov
edst
aden
Ber
lin
Ber
kshi
re, B
ucki
ngha
msh
ire a
nd O
xfor
dshi
re
Sou
ther
n an
d E
aste
rn
Eas
t Ang
lia
Com
unid
ad d
e M
adrid
Köl
n
Väs
tsve
rige
Sur
rey,
Eas
t and
Wes
t Sus
sex
Noo
rd-H
olla
nd
Pro
venc
e-A
lpes
-Côt
e d'
Azu
r
Lom
bard
ia
Eas
tern
Sco
tland
Ham
burg
Poh
jois
- ja
Itä-S
uom
i
Läns
i-Suo
mi
Cat
aluñ
a
Dar
mst
adt
Pay
s de
la L
oire
Glo
uces
ters
hire
, Wilt
shire
and
Bris
tol/B
ath
area
Syd
sver
ige
Ete
lä-S
uom
i
Source: own elaboration based on Thomson One data
27

Figure 5: Percentage of investments with at least one investor located in the same country andNUTS2 region where the company resides (1990-2010)
020
4060
8010
0
1990 1995 2000 2005 2010year
Same country Same NUTS1 region
Source: own elaboration based on Thomson One data
Figure 6: Number of sample companies seeking external equity by year
020
4060
8010
0nu
mbe
r of f
irms
1980 1990 2000 2010year
28

Figure 7: The estimated effects of VC availability and distance on companies propensity tosearch external equity
.01
.02
.03
.04
.05
100 200 300 400 500 600distance
local availabilitynon-local national availability
Legend : The figure shows the change in a company’s propensity to seek external equity for a change in thenumber of new investments in a NUTS2 region from 1 to 23, respectively equal to the 25th and the 75th
percentiles of the distribution. The local availability line shows the effect on companies in the same NUTS2region, while the non-local national availability line shows the effect on companies outside that NUTS2 regionbut in the same country. We do not plot the effect of a shock in the availability abroad because its coefficientis not significant. The vertical dotted lines represent the 25th, 50th ans 75th percentile of the distribution of
the distance from the 50 VC hubs.
29

A Appendix: calibration of the distance decay parame-
ter
In order to set the distance decay parameter α for each type of availability of VC not lo-
cated in the same region of the company (i.e. non-local, non-local national, non-local interna-
tional), we evaluated the value that maximizes the log-likelihood function of the econometric
model in table 5 columns 3 and 4. We tested increasing values of α in increments of 0.1.
For non-local availability (availability far) we performed a likelihood ratio test LR = -2[log-
likelihood(unrestricted model) - log-likelihood(restricted model)], where the unrestricted model
corresponds to the model in column 3 but without the non-local availability variable as regres-
sor. More specifically, depending on the value of the decay parameter we maximize the χ2(1)
value related to the LR test (figure 8a). Analogously, for what concern the calibration of the
non-local availability in the same country (availability national) and the non-local availability
abroad (availability abroad), we perform a “joint” maximization of the LR test (i.e. of the
corresponding χ2(2)) making the two parameters alpha1 and alpha2 respectively (figure 8b).
Figure 8: The estimated effects of distance and number of investments
1015
2025
30_c
hi2
0 .2 .4 .6 .8 1_alpha
(a) (b)
Figure 8 shows that the values that maximize the LR test are 0.4, 1, and 0.3 for availability far,
availability national, and availability abroad, respectively. Accordingly, these values are used
as the decay parameters in evaluating the effect of non-local availability of VC on the proba-
bility to seek external equity finance. It is worth noting that we can reject the null hypothesis
that non-local availability is zero (at the 1% significance level, please note that χ2(1) is greater
than 6.64 in figure 8a for α = 0.4) and the null hypothesis that non-local availability in the
country and abroad are jointly equal to zero (at the 1% significance level, please note that χ2(2)
is greater than 9.21 in figure 8b for α1 = 1 and α2 = 0.3).
30

References
A. N. Berger and G. F. Udell. Collateral, loan quality and bank risk. Journal of Monetary
Economics, 25(1):21–42, jan 1990. ISSN 03043932. doi: 10.1016/0304-3932(90)90042-3. URL
http://www.sciencedirect.com/science/article/pii/0304393290900423.
S. Bernstein, X. Giroud, and R. Townsend. The Impact of Venture Capital Monitoring. The
Journal of Finance, page In press, oct 2015. ISSN 1540-6261. doi: 10.1111/jofi.12370. URL
http://dx.doi.org/10.1111/jofi.12370.
F. Bertoni and A. P. Groh. Cross-Border Investments and Venture Capital Exits in Europe.
Corporate Governance: An International Review, 22(2):84–99, mar 2014. ISSN 09648410.
doi: 10.1111/corg.12056. URL http://doi.wiley.com/10.1111/corg.12056.
F. Bertoni and J. Martı Pellon. Financing Entrepreneurial Ventures in Europe: The Vico
Dataset. aug 2011. URL http://papers.ssrn.com/abstract=1904297.
F. Bertoni, M. G. Colombo, and A. Quas. The patterns of venture capital investment in
Europe. Small Business Economics, 45(3):543–560, 2015a. ISSN 0921-898X. doi: 10.1007/
s11187-015-9662-0. URL http://link.springer.com/10.1007/s11187-015-9662-0.
F. Bertoni, D. D’Adda, and L. Grilli. Cherry-picking or frog-kissing? A theoretical analysis of
how investors select entrepreneurial ventures in thin venture capital markets. Small Business
Economics, 2015b. ISSN 0921-898X. doi: 10.1007/s11187-015-9690-9. URL http://link.
springer.com/10.1007/s11187-015-9690-9.
A. Bonaccorsi, M. G. Colombo, M. Guerini, and C. Rossi-Lamastra. The impact of local and
external university knowledge on the creation of knowledge-intensive firms: Evidence from
the Italian case. Small Business Economics, 43(2):261–287, 2014. ISSN 15730913. doi:
10.1007/s11187-013-9536-2.
R. E. Carpenter and B. C. Petersen. Capital Market Imperfections, High-Tech Investment, and
New Equity Financing. the Economic Journal, 112(477):F54–F72, feb 2002. ISSN 00130133.
doi: 10.1111/1468-0297.00683. URL http://doi.wiley.com/10.1111/1468-0297.00683.
C. Carpentier and J.-M. Suret. Some evidence of the external financing costs of new
technology-based firms in Canada. Venture Capital, 8(3):227–252, jul 2006. ISSN 1369-
1066. doi: 10.1080/13691060600748421. URL http://www.tandfonline.com/doi/abs/10.
1080/13691060600748421.
T. J. Chemmanur, K. Krishnan, and D. Nandy. How does Venture Capital Financing Improve
Efficiency in Private Firms? A Look Beneath the Surface. Review of Financial Studies, 24
(12), aug 2011. doi: 10.2139/ssrn.1025322. URL http://papers.ssrn.com/sol3/papers.
cfm?abstract_id=1025322http://papers.ssrn.com/abstract=1025322.
31

H. Chen, P. A. Gompers, A. Kovner, and J. Lerner. Buy local? The geography of ven-
ture capital. Journal of Urban Economics, 67(1):90–102, jan 2010. ISSN 00941190.
doi: 10.1016/j.jue.2009.09.013. URL http://linkinghub.elsevier.com/retrieve/pii/
S0094119009000801.
A. Cosh, D. J. Cumming, and A. Hughes. Outside Entrepreneurial Capital. Economic Journal,
119(1):494–533, 2009. ISSN 00130133. doi: 10.1111/j.1468-0297.2009.02270.x.
A. Croce, J. Martı, and S. Murtinu. The Impact of Venture Capital on the Productivity Growth
of European Entrepreneurial Firms: ’Screening’ or ’Value Added’ Effect? Journal of Business
Venturing, 28(4):489–510, 2013. doi: 10.1016/j.jbusvent.2012.06.001.
D. J. Cumming and N. Dai. Local bias in venture capital investments. Journal of Empirical
Finance, 17(3):362–380, jun 2010. ISSN 09275398. doi: 10.1016/j.jempfin.2009.11.001. URL
http://dx.doi.org/10.1016/j.jempfin.2009.11.001.
D. J. Cumming and J. G. Macintosh. A cross-country comparison of full and partial venture
capital exits. Journal of Banking & Finance, 27:511–548, 2003. doi: 10.1016/S0378-4266(02)
00389-8.
D. J. Denis. Entrepreneurial finance: an overview of the issues and evidence. Journal of
Corporate Finance, 10(2):301 – 326, 2004. doi: 10.1016/S0929-1199(03)00059-2.
J. T. Eckhardt, F. Delmar, and S. Shane. Multistage Selection and the Financing of New
Ventures. Management Science, 52(2):220–232, 2006. doi: 10.1287/mnsc.1050.0478.
European Commission. Fostering Entrepreneurship in Europe: priorities for the future. Tech-
nical Report 98, European commission, Brussels, 1998.
European Parliament. Regulation (EU) No 345/2013 of the European Parliament and
of the Council of 17 April 2013 on European Venture Capital Funds. Technical re-
port, 2013. URL http://eur-lex.europa.eu/legal-content/EN/TXT/PDF/?uri=CELEX:
32013R0345&from=EN.
Eurostat. Regions in the European Union: Nomenclature of territorial units for statistics -
NUTS 2010/EU-27, 2011 edition. 2011. URL http://ec.europa.eu/eurostat/documents/
3859598/5916917/KS-RA-11-011-EN.PDF.
R. Florida and K. M. King. Spiky venture capital: the geohrapgy of venture capital invest-
ment by metro and ZIP code. page 30, 2016. URL http://martinprosperity.org/media/
Startup-US-2016_Spiky-Venture-Capital_Revised.pdf.
J. S. Gans and S. Stern. Is there a market for ideas? Industrial and Corporate Change,
19(3):805–837, apr 2010. ISSN 0960-6491. doi: 10.1093/icc/dtq023. URL http://icc.
oxfordjournals.org/content/early/2010/04/11/icc.dtq023.short.
32

P. A. Gompers and J. Lerner. Money chasing deals? The impact of fund inflows on private
equity valuation. Journal of Financial Economics, (2):281–325, feb . ISSN 0304405X. doi:
10.1016/S0304-405X(99)00052-5.
P. A. Gompers, D. Z. Levin, and J. Lerner. The Venture Capital Revolution. Journal of
Economic Perspectives, 15(2):145–168, may 2001. ISSN 0895-3309. doi: 10.1257/jep.15.2.145.
URL http://www.jstor.org/stable/2696596.
B. H. Hall, A. Jaffe, and M. Trajtenberg. Market Value and Patent Citations. The RAND
Journal of Economics, 36(1):16–38, 2005. URL http://www.jstor.org/stable/1593752.
R. T. Harrison, C. M. Mason, and P. Robson. Determinants of long-distance investing by
business angels in the UK. Entrepreneurship & Regional Development, 22(2):113–137, mar
2010. ISSN 0898-5626. doi: 10.1080/08985620802545928. URL http://www.tandfonline.
com/doi/abs/10.1080/08985620802545928.
D. E. Ho, K. Imai, G. King, and E. A. Stuart. Matching as nonparametric preprocessing for
reducing model dependence in parametric causal inference. Political Analysis, 15(3):199–236,
2007. ISSN 10471987. doi: 10.1093/pan/mpl013.
S. N. N. Kaplan and P. Stromberg. Venture Capitalists As Principals: Contracting, Screening,
and Monitoring. American Economic Review, 91(2):426–430, apr 2001. doi: 10.3386/w8202.
URL http://ideas.repec.org/p/nbr/nberwo/8202.html.
J. Lindgaard Christensen. The Development of Geographical Specialization of Ven-
ture Capital. European Planning Studies, 15(6):817–833, jul 2007. ISSN 0965-4313.
doi: 10.1080/09654310701232137. URL http://www.tandfonline.com/doi/abs/10.1080/
09654310701232137.
M. M. Makela and M. V. J. Maula. Cross-border venture capital and new venture interna-
tionalization: An isomorphism perspective. Venture Capital, 7(3):227–257, jul 2005. ISSN
1369-1066. doi: 10.1080/13691060500258877. URL http://www.tandfonline.com/doi/
abs/10.1080/13691060500258877.
R. Martin, C. Berndt, B. Klagge, and P. Sunley. Spatial Proximity Effects and Regional Equity
Gaps in the Venture Capital Market: Evidence from Germany and the United Kingdom.
Environment and Planning A, 37(7):1207–1231, jul 2005. ISSN 0308-518X. doi: 10.1068/
a3714. URL http://epn.sagepub.com/content/37/7/1207.abstract.
C. M. Mason and R. T. Harrison. The geography of venture capital investments in the UK.
Transactions of the Institute of British Geographers, 27(4):427–451, dec 2002. ISSN 0020-
2754. doi: 10.1111/1475-5661.00064. URL http://doi.wiley.com/10.1111/1475-5661.
00064http://www.blackwell-synergy.com/links/doi/10.1111/1475-5661.00064.
33

C. M. Mason and R. T. Harrison. Improving access to early stage venture capital in regional
economies: A new approach to investment readiness. Local Economy, 19(2):159–173, aug
2004. ISSN 0269-0942. doi: 10.1080/0269094042000203090. URL http://lec.sagepub.
com/lookup/doi/10.1080/0269094042000203090.
A. Mina, H. Lahr, and A. Hughesy. The demand and supply of external finance for innovative
firms. Industrial and Corporate Change, 22(4):869–901, 2013. ISSN 09606491. doi: 10.1093/
icc/dtt020.
S. C. Myers and N. S. Majluf. Corporate financing and investment decisions when firms have
information that investors do not have. Journal of Financial Economics, 13(2):187–221, 1984.
ISSN 0304405X. doi: 10.1016/0304-405X(84)90023-0. URL http://ideas.repec.org/a/
eee/jfinec/v13y1984i2p187-221.html.
R. Nahata, S. Hazarika, and K. Tandon. Success in Global Venture Capital Investing: Do
Institutional and Cultural Differences Matter? Journal of Financial and Quantitative Anal-
ysis, 49(04):1039–1070, jan 2015. ISSN 0022-1090. doi: 10.1017/S0022109014000568. URL
http://journals.cambridge.org/abstract_S0022109014000568.
OECD. Entrepreneurship at a glance 2013. OECD annual report. Technical report, OECD,
2013.
M. Sørensen. How Smart Is Smart Money? A Two-Sided Matching Model of Venture
Capital. The Journal of Finance, 62(6):2725–2762, nov 2007. ISSN 00221082. doi:
10.1111/j.1540-6261.2007.01291.x. URL http://doi.wiley.com/10.1111/j.1540-6261.
2007.01291.x.
O. Sorenson and T. E. Stuart. Syndication Networks and the Spatial Distribution of Ven-
ture Capital Investments. The American Journal of Sociology, 106(6):1546–1588, may 2001.
ISSN 0002-9602. doi: 10.1086/321301. URL http://www.jstor.org/stable/10http:
//www.jstor.org/stable/10.1086/321301.
T. Tykvova and A. Schertler. Cross-border venture capital flows and local ties: Evidence from
developed countries. The Quarterly Review of Economics and Finance, 51(1):36–48, feb
2011. ISSN 10629769. doi: 10.1016/j.qref.2010.09.005. URL http://www.sciencedirect.
com/science/article/pii/S1062976910000682.
M. Wright, S. Pruthi, and A. Lockett. International venture capital research: From cross-
country comparisons to crossing borders. International Journal of Management Reviews, 7
(3):135–165, sep 2005. ISSN 1460-8545. doi: 10.1111/j.1468-2370.2005.00113.x. URL http:
//doi.wiley.com/10.1111/j.1468-2370.2005.00113.x.
34