the geometric properties of an expandable whirling … copy: return to afwl (wllt-2) kirtland afb, n...
TRANSCRIPT

LOAN COPY: RETURN TO AFWL (WLlt-2)
KIRTLAND AFB, N MEX
THE GEOMETRIC PROPERTIES OF A N EXPANDABLE WHIRLING-MEMBRANE SOLAR-ENERGY CONCENTRATOR
by John M . Jerke und Atwood R. Heuth, Jr.
Ldnglley Reseurch Center Lungley Stution, Humpton, Vu.
N A T I O N A L AERONAUTICS A N D SPACE A D M I N I S T R A T I O N W A S H I N G T O N , D. C. MAY 1968
https://ntrs.nasa.gov/search.jsp?R=19680012789 2018-05-12T07:35:59+00:00Z
TECH LiBRARY KAFB, NM
THE GEOMETRIC P R O P E R T I E S
OF AN EXPANDABLE WHIRLING-MEMBRANE
SOLAR- ENERGY CONCENTRATOR
By John M. J e r k e and Atwood R. Heath, Jr.
Langley R e s e a r c h C e n t e r
Langley Station, Hampton, Va.
NATIONAL AERONAUTICS AND SPACE ADMINISTRATION
For sale by the Clearinghouse for Federal Scientific and Technical Information Springfield, Virginia 22151 - CFSTI price $3.00
I I

THE GEOMETRIC PROPERTIES
O F AN EXPANDABLE WHIRLING-MEMBRANE
SOLAR-ENERGY CONCENTRATOR
By John M. Je rke and Atwood R. Heath, Jr. Langley Research Center
SUMMARY
The whirling-membrane concept of solar -concentrator fabrication has been proposed for use with spacecraft-power -conversion devices because of its compact-packaging potential. Three membranes of 0.01-millimeter-thick aluminized plastic were constructed and attached to metal hubs for which the ratios of the hub radius to the membrane radius were 0.20, 0.35, and 0.50. The resulting models that had design focal lengths of 132.1 centimeters and design diameters of 3.05 meters were rotated at 71 radians per second in a vacuum chamber at pressures below 133 newtons per meter2. The accuracy with which each membrane achieved the design paraboloidal shape w a s measured by an optical-ray-trace technique.
The membrane with the metal hub of largest diameter gave the best concentration of energy. For this model, the focal length was 130.5 centimeters or 1 percent l e s s than the design value. ratio of 23.
A geometric efficiency of 1.00 w a s obtained at a concentration Membrane surface mean e r r o r s varied from -0.6' to 0.4' in the radial
direction and were essentially zero in the circumferential direction. The random e r r o r had a standard deviation of 0.5' in the radial direction over most of the membrane and 0.25' in the circumferential direction. Location of supporting cables relative to the metal hub w a s found to be an important factor in the design of a whirling-membrane concentrator.
INTRODUCTION
Solar -energy concentrators used in conjunction with electrical-conversion systems have been proposed as auxiliary-power units for spacecraft. The choice of basic materials and type of construction used in fabricating the concentrator a r e dependent upon the method of conversion of solar energy to electrical power, the required power output, and the payload-packaging constraints. As a result various types of concentrators, such as one-piece nickel and inflatable plastic mir rors , have been fabricated, and quantitative data are available on their performance. (See ref. 1.)

One concept that has been proposed for large-diameter concentrators with potentially superior packaging properties is the whirling-membrane concentrator. (See ref. 2.) In this concept, a thin aluminized plastic membrane, which has been preformed to an approximately paraboloidal shape and attached to a metal hub, is rotated about its optical axis (axis of symmetry) to maintain the desired paraboloidal shape. The centrifugal loading plus an axial component of loading applied at the r i m by a conical membrane stretch the approximate paraboloid into the desired paraboloid. An analytical study of the problems pertaining to the spinning membrane has been made in reference 2, and methods a r e given for obtaining static s t r e s ses and deflections that can be used in the design of a membrane.
A s no experimental data existed on this concept, the main objective of the present investigation was to measure the accuracy with which a whirling-membrane concentrator assumes the design shape while being rotated. Another important objective was to provide a means for preventing the formation of circumferential wrinkles near the periphery of the membrane. This wrinkling problem (discussed in ref. 2) occurs when the meridional s t r e s ses in the membrane near the r im a r e much smaller than the circumferential s t resses . One suggested solution is to increase the diameter of the metal hub relative to the concentrator diameter, so that the ratio of meridional s t r e s s to circumferential s t r e s s near the r im becomes larger. Consequently, three 3.05-meter-diameter whirling-membrane models with metal hubs of different diameters were investigated. An opticalray-t race device utilizing a light source and solar cells was used to determine the geometr ic accuracies of the concentrator models.
An appendix by Atwood R. Heath, Jr., and Victor R. Bond discusses the effective reflectance of aluminized plastic membranes under biaxial tensile loading.
SYMBOLS
The units used for the physical quantities defined in this paper a r e given in the International System of Units (SI). Factors relating this system to U.S. Customary Units are given in reference 3.
C concentration ratio, ratio of projected area of membrane paraboloid to a circular a r e a in the focal plane centered on the optical axis
i,j,k orthogonal coordinate system with origin at 0", defining membrane-surfaceslope e r r o r s where k is the normal to the design paraboloid surface, and j is in a plane containing the optical axis and a membrane radius through 0" (see figs. 7 and 13)
2

'h
XL
Z C
AZ = Ze
6,
OC
O r
plane polar coordinates with origin at 0' in solar-cell survey plane (see fig. 7)
design radius of membrane paraboloid
rectangular Cartesian coordinates with origin at 0 defining membrane paraboloid (see fig. 7)
metal-hub radius of concentrator
light-source position, distance along x-axis from optical axis to center of light source (see fig. 7)
cable-hub position, distance along optical axis from design paraboloid vertex to intersection of the extension of the cables with the optical axis (see fig. 1)
z-ordinate of the design membrane
z-ordinate of the membrane as determined from experiments
solar -cell-bar position, distance along optical axis from design paraboloid vertex to survey plane containing solar cells (see fig. 7)
Zd
circumferential-slope e r ro r , projection of angle between the actual membrane surface normal and the design paraboloid normal in the ik plane (see fig. 13)
radial-slope e r ro r , projection of angle between the actual membrane surface normal and the design paraboloid normal in the jk plane (see fig. 13)
geometric efficiency, ratio of energy entering a given-size focal-plane aperture to the total energy that is specularly reflected from the concentrator
standard deviation of circumferential-slope e r r o r s from the mean e r r o r s
standard deviation of radial-slope e r r o r s from the mean e r r o r s
3
I

MODELS AND APPARATUS
Models
Configurations. - A sketch of the whirling-membrane solar concentrator is shown in figure 1. The concentrator consisted of an aluminized plastic paraboloid, metal hub, shaft, cables, and cable hub. The design paraboloid diameter was 3.05 meters, the design r i m angle was 60°, and the design focal length was 132.1 centimeters. The membrane was constructed of 0.0 1-millimeter -thick aluminized polyethylene terephthalate plastic and was formed of 45 triangular gores assembled on a convex mold. The gores were attached to each other at a butt joint which was covered with an aluminized plastic strip sealed with thermosetting resin. In figure 2 the ordinates of the paraboloid as constructed on the mold a r e labeled "initial.tf
Cable-, ,P last ic t a b
z 4
1 p l a s t i c
l o i d
D e s i g n p a r a b o l o i d 1 rhv e r t e x
+. -. 3.05 m- . .
Figure 1.- Sketch of whir l ing-membrane solar concentrator w i th design dimensions.
4

----
- Design31.0 .6
Figure 2.- Radial cross section of membrane showing in i t ia l and design configurations.
Three models with ratios of metal-hub radius to concentrator radius of 0.20, 0.35, and 0.50 were built, and a membrane was fabricated for each. The convex mold also served as a jig for attaching each membrane to its respective hub in the assembly process. Each model had seventy-two 0.8-millimeter -diameter steel cables which were attached from the cable hub mounted on the shaft to the plastic tabs at the membrane rim. The vertical location of the cable hub on the shaft was adjusted manually. All model configurations with pertinent dimensions are given in table I. The three models with metal hub radii of 0.20R, 0.35R7 and 0.50R are designated "configurations I, 11, and 111," respectively. For each of these three models, the cable hub was located 40.8 centimeters above the design paraboloid vertex. Configuration I11 was modified by moving the cable hub to four additional locations, 43.3, 45.8, 48.3, and 50.8 centimeters above the vertex. These four configurations are 111-A, 111-B, 111-C, and 111-D, respectively.
TABLE I. - MODELS AND TEST PARAMETERS
Models Test parameters
II
Metal-hub Cable -hub Light-source location, I1 Solar-cell bar positions
Configuration radius, location, XL, cm Axial position, kngular position,rh IR =c, cm I zs, cm e, deg
0.20 40.8 52.1 86.6 109.7 128.6 141.7 129.5 132.1 .35 40.8 68.3 93.9 113.7 130.5 141.9 129.5 132.1
111 129.5 132.1 111-A [:::: _--- 132.1 IOo to 315'
132.1111-B ] .50 45.8 86.3 104.9 120.4 134.1 144.3 __-- 132.1IJl- C
III-D 129.5 132.1
%I 45' increments.
5

Design considerations. - The equations for the design of a whirling-membrane concentrator (called the paraboloid with a conical covering) are given in reference 2. These equations were used t o calculate the membrane deflections under operating conditions and the resulting, or "design," ordinates are given in figure 2. These equations are not strictly applicable when steel cables are used to replace the conical covering because these cables cannot support circumferential stresses. The cables have been used, however, because they are considered to be more resistant to the space environment than a transparent plastic covering. The cables provide at the membrane r i m an axial component of loading that is required to give the membrane the desired paraboloidal shape. As previously noted, the cables cannot support circumferential s t r e s ses so the equations of reference 2 cannot be used to calculate cable shape. The assumption was made that the cables would be perpendicular to the r i m plane at the cable-rim juncture. This assumption with the required axial loading, cable mass, and membrane rotational speed gave a cable shape and thus a cable-hub location on the shaft. The cable hub was made adjustable so that it could be moved vertically on the shaft in the event that the calculated cable shapes were incorrect. Cable lengths were not adjustable so that relocation of the cable hub from the design position resulted in incorrect cable lengths. It should also be noted that blockage of the solar r ays by the cables and plastic tabs is about 7.5 percent of the concentrator projected area, which compares favorably with the 8 to 10 percent transmission loss that would be incurred by a plastic covering.
Important factors in the design of the whirling membrane are the membrane stresses. The maximum stress should be well below the material yield s t r e s s because of possible failure due to stress concentrations in the neighborhood of the tab-paraboloid junctures. The circumferential and meridional s t r e s ses were calculated by means of the equations of reference 2 for a rotational speed of 71 radians per second. The circumferential s t ress , which is the maximum stress occurring in the membrane, is shown in figu re 3(a). All three models have a maximum s t r e s s a t the r im of approximately 16 mega-newtons per meter2, which is well below the material yield s t r e s s of approximately 100 meganewtons per meter 2. (Note: 1 meganewton per meter2 = 145 pounds per inch2.)
Another important design problem is the prevention of membrane wrinkles. The wrinkles would have a degrading effect on the concentration of incident energy of the paraboloid by causing a dispersion of the reflected light. Wrinkling can be caused by
6

c
W
20 , , I l k 10
Meta l -hub ratio, rh / R -
__ 0.20
18 - _ _ _ - 0.35 0.50
I I I
16 \ I
V I 1 VI
a,L VI14 -m
\\ \._ -
l=
L12 W L
E \ 3"L ._ . I10 V. \ VI \ VI \
\W L \
8 -VI \
-m c .-0 m6 .-L W
B . O '
4 ,/ \ /
2 /
/ . o o
0 . 4 . 6 8 1. 0 2 -X -X
R R
(a) Circumferential stress. (b) Stress ratio.
Figure 3.- Variat ion of c i rcumferent ia l stress and stress rat io in the 3.05-meter-diameter whir l ing-membrane concentrator at a rotat ional speed of 71 radians per second.
7
I
two general processes. First, wrinkling may result from handling, which includes fabrication and packaging. Second, as discussed in reference 2, large-scale wrinkles with crests and troughs parallel to the circumferential stress may form if a suitably large ratio of meridional to circumferential stress is not maintained. This latter wrinkling is called circumferential wrinkling.
Wrinkling due to fabrication occurs if proper care is not taken in assembling the aluminized plastic membrane. A preliminary investigation on various thicknesses of the aluminized plastic was made to determine what s t r e s s levels are required to remove this type of wrinkle. The results are given in the appendix, where it is shown that carefully handled samples of the 0.01-millimeter-thick plastic used in the present models were essentially unwrinkled. However, the data of the appendix show that for badly wrinkled samples, such as might occur in packaging, a certain level of s t r e s s is required to remove the wrinkles. The present models were carefully handled during fabrication and were not packaged; consequently, they were considered to be essentially unwrinkled.
The calculations of reference 2 indicate, however, that circumferential wrinkles may be a problem because of the low s t r e s s ratios near the r i m of the paraboloid when a metal hub of a small radius relative to the membrane radius is used. This effect can be seen in figure 3(b) where the calculated ratios of the meridional to circumferential stress in the membrane is shown as a function of membrane radius.
One solution for increasing the s t r e s s ratio, suggested in reference 2 and shown in figure 3(b), is to increase the metal-hub radius. Three flat metal hubs with radii of 0.20R,0.35R, and 0.50R were selected for testing. Samples of the plastic to be used in the present models were subjected to a range of biaxial-stress ratios, including those expected to be experienced by the whirling-membrane models; the results are described in the appendix. These data and the data of figures 3(a) and (b) show that only the model with the 0.50R metal hub should be relatively unaffected by wrinkling. However, for the purpose of taking advantage of the potential for being compactly packaged for launching into space, the smallest possible metal hub is desirable. Therefore the two models with the smaller metal hubs were fabricated to determine the magnitude of the wrinkling and the loss in energy concentration that would actually occur. In a practical model, the flat hub would be replaced by a one-piece paraboloidal mirror . Such a paraboloid would serve the same structural purpose as the flat hub and, by having the same focal length as the membrane, could provide the concentration of additional energy.
Apparatus
The apparatus f o r testing the concentrators is shown schematically in figure 4, and a photograph of the test arrangement is shown as figure 5. A steel A-frame provided a support for the concentrator and associated optical-ray trace-measuring equipment.
8
IIII I 1111111 I

Overhead track
u
Figure 4.- Schematic of test apparatus.
L-64-3674.1 Figure 5.- Whirling-membrane-concentrator test apparatus, with a model installed, in the vacuum
sphere preparatory to spin-up.
9
lamp, metal tube, and lens that gave a 7.6-centimeter-diameter light beam with a collimation angle of 0.025O. The light source was positioned along the radial overhead t rack by means of a remotely controlled electric motor. In this way, different areas of the membrane could be surveyed. The position of the light source was determined from a calibrated selsyn motor-counter system. An additional silicon solar cell was located in the light-source tube to monitor the light irradiance continuously. (Irradiance is defined as the radiant energy incident on a surface per unit area and per unit time.) The 10 solar cells, which were each 0.5 by 0.25 centimeter, were located 2.5 centimeters on centers along the solar-cell bar. The solar-cell bar was designed to survey a volume in the region of the focus and had three modes of operation as follows: (1)rotation about the concentrator optical axis, (2) longitudinal translation perpendicular to the concentrator optical axis, and (3) vertical translation along the concentrator optical axis. The f i rs t two modes were controlled by remotely operated electrical motors, and position was determined from calibrated selsyn-motor counter systems. The third mode however was manually set. All solar cells, including that in the light source, had heaters and thermocouples as well as necessary associated equipment to maintain a constant temperature and thus a constant cell sensitivity.
Multipoint self -balancing potentiometers were used to record the output from the thermocouples and the solar cells on the bar, and a continuous-trace self-balancing potentiometer w a s used to record the monitor-cell output.
Two high-intensity stroboscopic lights located on the upper t rack of the A-frame were used for visual examination of the concentrator surface. Motion-picture cameras with a film speed of 64 f rames per second, located above and to the side of the concentrator, recorded motions of the membrane during operation.
TESTS
All tes ts were made in an 18-meter-diameter vacuum sphere at pressures below 133 newtons per meter2 to prevent flutter of the concentrator membrane. (Note: 1newton per meter2 = 145 X pound per inch2 = 7.5 X millimeter of mercury.) All models were tested at the design rotational speed of 71 radians per second. A photograph of the 0.35R metal-hub model in operation is shown as figure 6.
Table I gives the light source and solar-cell-bar locations in addition to the various model configurations. Figure 7 shows the Cartesian coordinate system used to locate the light source and solar-cell bar with respect to the design paraboloid vertex. Also shown in figure 7 is a plane polar-coordinate system used to locate the solar cells with respect to the optical axis. Configurations I and 11, the models with the 0.20R and 0.35R metal hubs, respectively, were tested with the cable hub only at the design location
10

L-64-3677 Figure 6.- Whirling-membrane concentrator operating at the design rotational speed of
71 radians per second. 0.35R hub model.
[Optical axis)
Light Typical source
Plane of solar cell bar
i
Detail in plane of solar-cell bar
lbotfom view)
\\ J\Membrane paraboloid
Figure 7.- Coordinate systems relating the locafion of the whirling membrane, light source, and solar cells.
11

zc = 40.8 centimeters. (See fig. 1.) Configuration 111, the model with the 0.50R metal hub, was tested with the cable hub at the design location and then with the cable hub raised in 2.5-centimeter increments up to a maximum of 10 centimeters above the design value. The light-source locations were determined by first dividing the projected area of each membrane into five annuli of equal area. The light was then positioned at the midradial point of each annulus. The axial position of the solar-cell bar was varied about the design focal plane, zs = 132.1 centimeters, as shown in table I. The angular positions were set by rotating the bar about the optical axis through a range of Oo to 3150 in 45O increments. The axis of rotation coincided with the optical o r spin axis that passed through a point on the bar 3.8 centimeters from the center of an end solar cell. (See detail of fig. 7.) This axis of rotation was chosen to give a relatively wide coverage of the irradiance distributions and still have two cells give check readings when the bar was rotated to the supplementary angular position.
A typical test consisted of first setting the zs-coordinate of the solar-cell bar, then evacuating the vacuum sphere to the desired pressure. The membrane was brought up to design rotational speed and the light source was then set a t one of the predetermined radial locations, XL. The solar-cell bar was rotated through eight angular locations (0-coordinates) and data were taken at each location. The light source was moved to the next radial location and the angular survey made. These las t two steps were repeated until all values for the light source and the solar-cell-bar angular position, shown in table I, were complete.
REDUCTION AND ACCURACY OF DATA
The basic data measured during the investigation were solar-cell voltages. It should be noted here that the readout equipment measured only average voltage. The instantaneous voltage, which would detect such things as blockage due to passage of a cable and local oscillations in the membrane, was not measured. The voltage readings from each solar cell on the bar were divided by the monitor cell voltage, recorded over the same time interval, to eliminate the effect of change in the test light-source i r radiance. Because all cells had different sensitivities to the irradiance, calibration factors obtained from laboratory tests were applied to the voltage ratios to put the data on a common basis. No corrections for temperature were made to the data as all cells were maintained a t a temperature of 305O + loK. The corrected voltage ratio, defined as irradiance ratio, represents the factor by which the irradiance of the incident energy has been modified by concentrator geometry and specular reflectance of the aluminized plastic. Note that the magnitude of the irradiance ratio will also vary directly with the diameter of the light beam used. However, this ratio provides a convenient means of analyzing
12

.. . . .
the data inasmuch as the magnitude does not influence such membrane properties as shape, geometric efficiency, and focal length.
Several sources of e r r o r in the magnitude and the location of the irradiance-ratio data existed in the test arrangement. The first and possibly largest e r r o r was associated with the solar -cell sensitivity calibration. Twenty sensitivity calibrations were made on each cell at irradiance ratios near 0.70 and the resulting data varied by 110 percent about the average values which were used in the reduction of data. The alinement of the light source parallel to the optical axis of the concentrator could be made within only *0.lo, which represents a focal-plane image displacement that varies from 0.5 centimeter for the innermost light-source position to 1.1 centimeters for the outermost position. The locations of the solar cells on the ba r were determined to be within 0.4 millimeter of the nominal 2.5-centimeter intervals. The axis of rotation of the bar was within 0.8 millimeter of the axis of rotation of the concentrator, and the angular position of the bar was determined to be within +2O of the desired position. The misalinement of the light source and the displacements of the solar cells from their nominal positions are not readily transferable to a percentage e r r o r in irradiance ratio; however, the irradiance-ratio e r r o r involved is considered to have a minor effect on the overall accuracy of the data.
RESULTS AND DISCUSSION
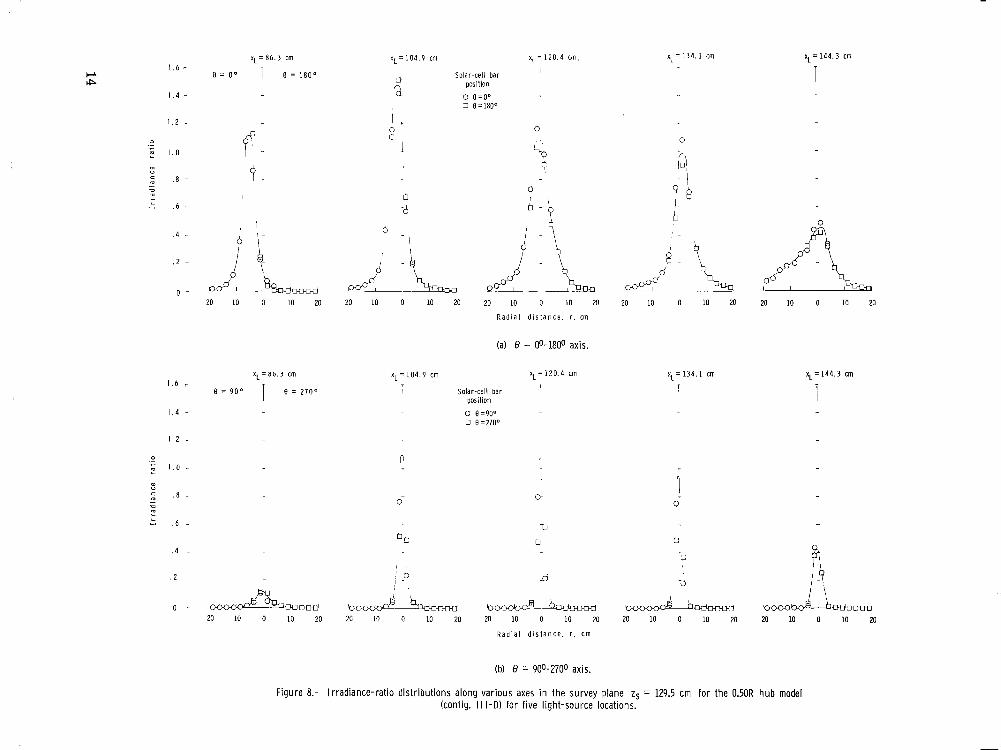
A thorough exploration of the irradiance-ratio distributions in and near the design focal plane was made in order to determine such factors as level of irradiance ratio, and image location, size, and shape. Configuration III-D was chosen for complete analysis because a preliminary analysis of data obtained on all models showed that it gave the best concentration of energy. An example of the measured irradiance-ratio distributions for this configuration is shown in figure 8 where irradiance ratio is plotted as a function of radial distance from the optical axis. This configuration utilized the 0.50R metal hub, and the cable hub was located in the highest position on the shaft (50.8 centimeters above the concentrator design vertex). The survey plane w a s located 129.5 centimeters above the design vertex; the light source was positioned at the five different radial stations in turn and distributions at each of the solar-cell-bar angular locations are shown. Curves have been estimated for the data by drawing a smooth curve through the points and averaging repeat points where available. The further condition w a s imposed that at a given value of XL the curves obtained fo r the different values of 8 should have the same value of irradiance ratio on the optical axis (r = 0). From these and similar data, it is possible to estimate the actual focal length, geometric efficiency, and geometry of the concentrator as discussed in the following sections.
13
x L = 8 6 . 3 cm xL= 104.9 cm xL = 1 2 0 . 4 cm x L = 1 3 4 . 1 cm xL= 144.3 cm 1.6 -
B = O D B = 1 8 0 " 1
Solar-cell bar I T B
position 1.4 - 0 B = O O
3 0=1800
1 . 2 8' I
0-0
Q b.! Ib
' ' -20..,k,....
10 20 20 10 0 10 20 20 10 0 10 20 20 10 0 10 20 20 10 0 10 20
R a d i a l d i s t a n c e , r , cm
(a) 0 = @-180° axis,
x L = 8 0 . j cm xi = 1 0 4 . 9 cm x L = 1 2 0 . 4 cm xL = 134 .1 cm x L = 1 4 4 . 3 cm
. 2
0 ' 10 0
T1.6 B = 9 0 0 B = 270° solar-cel l bar
position
T T 1.4 - 0 B=9Oo
0 B=27O0
1 . 2 -
.--0 fi m 1.0 -
0 0. 0
L
. 6 ~
g c n 5 . 4 -
I:
1 - .8. 2
0
.
-A b 0
!i d d -d Jl\ Ld L o d A * m dh
20 10 0 10 20 20 10 0 10 20 20 10 0 10 20 20 10 0 10 20 20 10 0 10 20
R a d i a l d i s t a n c e . r , c m
(b) 0 = 9Oo-27O0 axis.
Figure 8.- Irradiance-rat io distr ibutions along various axes i n the survey plane zs = 129.5 cm for the 0.50R hub model (config. I I I -D) for f ive light-source locations.

0
xL = 86.3 cm 1 . 6
0 = 4 5 0 0 = 2 2 5 O
1.4 .
x L = 1 0 4 . 5 cm xL=1Z0.4 cm xL = 134 .1 cm xL = 144.3 cm
Solar-cell bar position
c' 0 = 4 5 O 3 0 = 2 2 5 O
1 . 2
a .-0 ;;; 1.0 -L
0
L
. 4 '73 w
R a d i a l d i s t a n c e , r . cm
(c) 0 = 45O-2250 axis.
x L = 8 6 . 3 cm 1 . 6
x L = 1 0 4 . 9 cm xL=120.4 cm x L = 1 3 4 . 1 un + = 144 .3 cm
Solar-cell bar position
2 0 = 1 3 5 O U b'=315O
0 = 1 3 5 O 0 = 3 1 5 "
1.4
1.2
-;1.0 -L
i
c 0 ~ -...-
I
0. 4 - .C
R a d i a l distance. r . c m
(d) 8 = 135O-315O axis.
Figure 8.- Concluded,

Concentrator Focal Length
In order t o determine concentrator focal length from irradiance-ratio distributions, only the data along the 8 = 0'-180' axis a r e used. The data of figure 8 for the 8 = Oo-180° axis provide an indication of the focal lengths of each of the membrane annuli surveyed for configuration III-D. A consideration of the properties of a parabolic membrane indicates that if the survey plane had been placed inside the focus, all the peaks would have fallen on the 8 = 0' side of the optical axis. If the survey plane were placed outside of the focus, all peaks would have fallen on the 8 = 180° side of the optical axis. The focal length for each annulus may be determined from the displacement of the peak of the irradiance-ratio distribution from the optical axis (r = 0) and the survey-plane distance from the concentrator vertex. It should be noted that this focal length is a mean value since laboratory tes ts of the light source showed that the width of the irradiance-ratio distributions would have been l e s s than 0.2 centimeter for a perfect paraboloid. As each distribution is approximately 20 centimeters o r greater in width, it may be assumed that variations in focal length existed over each annulus. However, for purposes of analysis, the mean focal length is considered to be representative of each annulus. The displacements of the irradiance-ratio distribution peaks on both sides of the optical axis show that the membrance is an approximate parabola if only the mean focal lengths a r e considered.
Because the membrane is approximately parabolic, irradiance-ratio distributions that a r e representative of the whole membrane a r e required to obtain the focal length of the entire concentrator. Therefore, the irradiance-ratio distributions for the five annuli of figure 8 have been averaged and the average of these distributions is shown in figure 9. Also shown a r e average distributions obtained at survey-plane locations of zs = 132.1 and 127.0 centimeters. The focal length for the entire concentrator is defined as the survey-plane distance from the vertex at which the peak of the average irradiance-ratio distribution falls on the optical axis. The irradiance-ratio data along the 8 = Oo-180° axis of figure 9 show that the peak should fall on the optical axis between zs = 129.5 and 132.1 centimeters. Interpolation gives a value for focal length of 130.5 centimeters, which is about 1 percent l e s s than the design focal length of 132.1 centimeters.
Concentrator Geometric Efficiency
The main purpose of a solar concentrator is to concentrate solar rays into a small image in the focal plane; therefore, the geometric efficiency, a measure of the concentrating ability, is of interest. Geometric efficiency is defined as the ratio of the energy falling within a circle centered about the focus in the focal plane to the energy specularly reflected from the concentrator. Therefore, the geometric efficiency is a function of
16
I

m
c
L
w
c
L
L
only the concentrator geometry and is not affected by such fact o r s as specular reflectance and incident-irradiance level.
Although irradiance -ratio distributions were not obtained at the best focal length, the survey plane at zs = 129.5 centimeters is sufficiently close that the data of figure 9 may be used to give a good indication of geometric efficiency. It should be noted at this point that the complete concentrator should be illuminated to obtain the exact irradiance-ratio distributions, and hence, the exact geometric efficiency. However, a good approximation to the irradianc e -ratio distribution for complete illumination was made. The data of figure 9 were converted to the form of a contour map of the average irradiance ratios in the survey plane and a r e shown in figure 10. Measurements were not made over a sufficiently wide area in the survey plane to obtain the complete profile so the location of the zero average-irradianceratio contour has been estimated. This contour plot is the average irradiance-ratio distribution in the survey plane that resu l t s from illumination along the x-axis. (See fig. 7.) If the light source were moved so that illumination took place along the
1 . 0 E = O O E = 180" E = 9 0 °
Survey plane, z s . cm
.~ 132.1 . 8 _ _ _ _ - 129.5
127.0
.--0
L
0) . 6 m.0 m L
._
z . 4 L> U
. 2
0
1 . 0 e = 4 5 0 e = 2 2 5 0I
. 8
0._ m L
. 6 m .n m L
.
:. 4 w
Q
. 2
0 20
R a d i a l d i s t a n c e , r . c m R a d i a l d i s t a n c e , r . c m
Figure 9.- Average irradiance-rat io distr ibutions along var ious axes i n three survey planes for the 0.50R hub model (config. I l l - D L
17
I

e = 9 0 0
u 1 1 - . I L ... . ~~ J 0 5 10 15 20 25 30
R a d i a l d i s t a n c e , r . c m
Figure 10.- Contours of constant average irradiance ratios in the survey plane zs = 129.5 cm of 0.50R hub model (config. I l l - D ) .
18

y-axis, it is assumed that the resulting average irradiance-ratio distribution would have the same shape and magnitude as the contour plot of figure 10 because the membrane is a surface of revolution. However, the data would be rotated 90' to the data shown in figure 10; that is, the major axis of the contour would fall along the 9Oo-27O0 axis. Therefore, t o obtain the average irradiance ratio, at any specific point in the survey plane, that results f rom illumination of the entire concentrator, it is necessary only to calculate the line integral of the function shown in figure 10 about a circle of radius r. This procedure has been followed at several radii and the resul ts are shown in figure 11.
In figure 11, the average irradiance-ratio distribution, as calculated for a completely illuminated whirling-membrane concentrator, is shown as a function of radial distance from t h e optical axis in the survey plane at zs = 129.5 centimeters. The maximum diameter of the distribution is about 50 centimeters, which is much greater than the maximum image diameter of 0.2 centimeter that would be obtained from a perfect paraboloid having the same diameter and focal length and utilizing the test light source. Therefore, as previously noted, it may be concluded that surface e r r o r s were present in the whirling membrane. It should be noted that the diameter of the image o r width of the irradiance-ratio curve is a function of light-source collimation angle as well as geometric accuracy of the concentrator. Lf the whirling membrane were illuminated by a light source having an angle of collimation larger than the test source, e.g., the sun, the effect would be to increase the diameter or width of the irradiance-ratio distribution. A focal-plane distribution for a perfect paraboloid illuminated by the sun is shown by the dashed lines in figure 11. The peak
Model I l l um ina t ionmagnitude of this curve has been - W h i r l i n q membrane Test liaht source
assigned the same value as that of (config. 111-D)
the whirling-membrane data, for Perfect paraboloid Sun 0
. Y
convenience. Figure 11 shows, that the image diameter for a perfect paraboloid is 3 centimeters; therefore, the image diameter of the whirling membrane would be increased from 50 centimeters to 53 centimeters for solar
illumination. The two curves of figure 11
were used to determine the geometric efficiencies of the whirling membrane and the perfect paraboloid. The results are shown in
0 I._ m
. 6 -G) Ll c m ._ Q2 . 4 -L ._ pl -m L . 2 -a, 5 a
n - 1 I ~.
30 20 10 0 10 20 30 R a d i a l d i s t a n c e , r . c m
Figure 11.- Variat ion of average irradiance rat io in the survey plane zs = 129.5 cm f o r completely i l luminated concentrators.
19

Model I l l um ina t ion
- W h i r l i n g membrane Test l ight source (config. I I I - D )
_ - - Perfect paraboloid S u n
\ \
\ \ \ \ \ \ \ \ \ \ i \ \
\
\ \
\ \ \ \ \
0 t I I I I I I l l I I I I I I l l I 1 . l I I I I I I I I I 1 1 1 1
'\. I
.. I
.. I .
1 I 1 1 1
10 102 l o 3 10' lo6
C o n c e n t r a t i o n r a t i o , C
Figure 12.- Concentrator efficiency over a range of concentrat ion ratios.
figure 12 where geometric efficiency is presented as a function of concentration ratio, also known as area ratio. A geometric efficiency of 1.00 for the whirling membrane, illuminated by the test light source, occurs at a concentration ratio of about 25. Had the membrane been illuminated by the sun, the value of 1.00 would have occurred at a concentration ratio of about 23. Hence, fo r all practical purposes, the efficiencies shown for the whirling membrane, at least for low concentration ratios, are approximately those which would have been obtained with the sun as an illumination source. The perfect paraboloid illuminated by the sun maintains a geometric efficiency of 1.00 up to a concentration ratio of 10 000. At this ratio, the diameter of the circular area in the focal plane becomes smaller than the diameter of the solar image and results in reduced efficiencies for increasing concentration ratio. Although the whirling membrane would not be suitable, in its present form, for systems requiring highly accurate paraboloids, it does give good geometric efficiencies (greater than 0.90) at concentration ratios below 100.
Concentrator Geometry
One common method of characterizing the quality of a solar concentrator is to measure the e r r o r distribution of the reflective surface. The irradiance-ratio distributions, of which the data of figure 8 are typical, provide a basis for this analysis. The
20

--
e r r o r consists of a combination of displacement in the z-direction of the actual surface from the design paraboloid surface and an angle between the actual surface normal and the normal to the design paraboloid. The local coordinate system for the surface normals is shown in figure 7; the radial and circumferential projections of the slope e r r o r 6, and 6,, respectively, are shown in figure 13. The slope e r r o r s in this figure are only approximations since the displacement Az has been omitted in the sketch. However, the effect of this approximation has been evaluated and has been found to be a maximum of 0.03' which has a negligible effect on the e r r o r distribution.
An examination of figure 8(a) indicates that two types of e r r o r s a r e present in the surface.
Design paraboloid surface normal
hlembrane C u r f a c e normal
i / Figure 13.- Coordinate system defining membrane
surface slope errors.
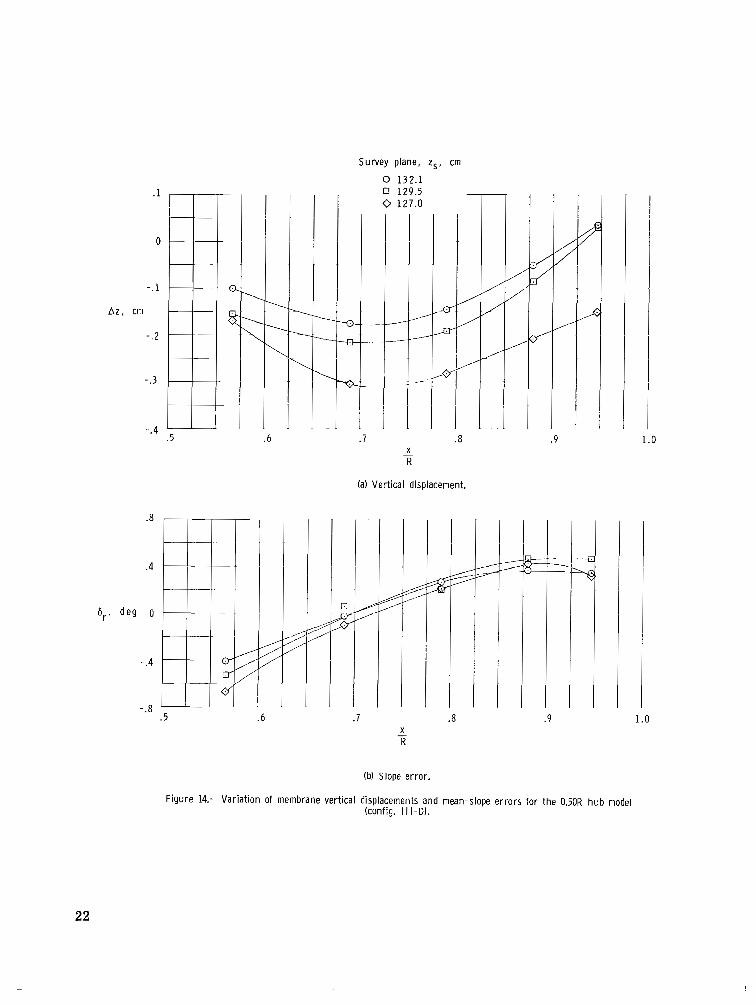
First, mean e r r o r s were apparent as evidenced by the displacement, about the optical axis, of the peaks of irradiance ratio along the 0 = 0'-180' axis. These displacements, along with such other dimensions as survey-plane distance from the vertex and radial location of the light source, were used in an iterative procedure to determine the membrane general shape. The displacements Az from the ordinates of the design parabola are shown in figure 14(a); and the radial-slope e r r o r 6, is shown in figure 14(b). The resul ts were calculated from data obtained at survey-plane distances of zs = 132.1 centimeters and 127.0 centimeters as well as from the zs = 129.5 Centimeters data of figu re 8(a). Although the displacements calculated at the three survey-plane locations do not agree in magnitude, the trends a r e similar. In general, the displacenients show that the membrane sagged below the design ordinates. The reason for this sagging is not known, but one contributing factor may have been the short cables used for this configuration (III-D). Cable lengths were set for a cable-hub design height of zc = 40.8 centimeters (configuration 111) in the first tests, but subsequent experimentation indicated that a setting of zc = 50.8 centimeters (configuration III-D) resulted in a more efficient concentrator. The cables were not lengthened when the cable hub was moved to 50.8 centimeters so that a decrease of about 0.4 centimeter occurred in the membrane diameter. This decrease in diameter could modify the membrane-stress distributions and resulting displacements. The membrane slope e r r o r s that result from the displacements are shown in figure 14(b). Over the surveyed area of the membrane, the mean slope e r r o r s varied from about -0.6O to 0.4'.
2 1
i
--
Survey plane, zs, cm
0 132 .1 .1 0 129.5
0 127.0
-.l
A z , cm
0
1 .
I/-L
I
//
I1
-.2 .-_\
\
- .3 \ I ~
- .4 I .6 .7 .8 .9 1.3
X-R
a) Vert ical displacement.
.8
i .4
7
6,, d e g o I'/ T I
I 9 /
-.4 5
-.8 .5 .6 .8 .9 1.0
(b) Slope error
Figure 14.- Variat ion of membrane vert ical displacements and mean-slope errors for the 0.50R hub model (config. I I I-D).
22

a,
c
>
c
Second, the data of figure 8(a) show that random e r r o r s in addition to the mean e r r o r s were also present. The existence of random e r r o r s may be deduced from the fact that had the paraboloid been perfect, the distribution of figure 8(a) would have been only 0.2 centimeter in width. The irradiance-ratio distributions a r e actually 20 centimeters or more in width and thus indicate the presence of membrane imperfections. The shapes of the distributions, which are similar t o probability curves, indicate the imperfections were approximately random. The standard deviation in the radial direction O r has been calculated from the data of figure 8(a), and the results a r e shown in figure 15. The standard deviation e r r o r is roughly 0.5' out to x/R = 0.90 where a sharp increase to 0.8O at about x/R = 0.95 is noted. These e r r o r s could be caused by circumferential wrinkles, which were discussed previously herein and in reference 2, o r they could be due to local oscillations in the membrane or a combination of both factors. That there is a large increase in e r r o r near the r im tends to support the wrinkle theory since design calculations showed that s t r e s s ratios in this region were marginal for the prevention of wrinkles. Local oscillations in the membrane that would have been detectable if values of irradiance ratio had been measured over a small time interval compared to the interval of the oscillations were not observed because the instrumentation measured average values only. However, scrutiny of the membrane under the stroboscopic lights revealed the presence of both factors, but a quantitative assessment of each could not be made.
1.0 I I I I I
- Survey plane, , cm
0 132.1 .8 0 129 .5
0 7.3 nD
0' .6 & +.-0
-.. - 3m._ m
.4 E s m c lA
.2
0 i1.0 .5 .6 .7 .8 .9
Figure 15.- 'Variat ion of standard deviation of radial-slope e r ro r for the 0.50R hub model (config. I I I-D).
23
For a complete characterization of the membrane geometry, the circumferential e r ro r s , which cause a displacement of the distribution on the 8 = 9Oo-27O0 axis, must also be considered. The data of figure 8(b) show that little or no displacement of the peaks of the distribution occurred and indicate that there were no mean e r r o r s in the circumferential direction and that the membrane on an average was a surface of revolution. However, random e r r o r s are apparent because the distributions of figure 8(b) are similar in shape to those measured in the membrane radial direction, figure 8(a). A standard deviation e r r o r oc = 0.25' was calculated for a membrane radius of 120.4 centimeters, the only radius at which the peak irradiance-ratio value fell on the optical axis. This circumferential e r r o r was only half the standard deviation e r r o r measured at the same radius in the radial direction.
Three possible explanations for the presence of the random circumferential e r r o r s exist. First, they may be caused by the previously discussed local oscillations in the membrane. Second, the cables may have restrained the membrane at the points of attachment thus allowing the membrane to take the shape of a parachute. Third, the flat membrane gores were strained to conform to the convex mold during fabrication. If these strains were relieved when the membrane was removed from the mold, the shape between gore seams would be similar to an umbrella. Observation of the membrane under the stroboscopic lights did not reveal the source of the e r r o r s as they were relatively small compared to the e r r o r s in the radial direction.
Effect of Metal-Hub Size
One objective of the present investigation w a s to determine the effect of metal-hub radius on the circumferential wrinkling of the whirling membrane. A s noted in reference 2, the use of hubs of larger radius (with respect to membrane radius) should result in a more favorable ratio of meridional to circumferential s t r e s ses and hence l e s s wrinkling and a more accurate concentrator. The effect of hub size is shown in the radial distributions of irradiance ratio along the 0 = 0'-180' axis in figure 16. The average irradiance rat ios for the three different hub radii, 0.20R, 0.35R, and 0.50R, are given as a function of radial distance from the optical axis in the survey plane, zs = 132.1 centimeters, which corresponds to the design focal length. A more severe wrinkling would be evidenced by a lower peak value of average irradiance ratio and a broader distribution. On this basis, the 0.35R and 0.50R hub models are less affected by wrinkling than the 0.20R hub model. This conclusion tends to confirm the analysis of reference 2. However, it should be noted that the data of figure 16 appear to be influenced by factors other than metal-hub size. Figure 17 shows that configuration III-D, for which the cable hub was raised to 50.8 Centimeters, had a peak irradiance ratio of 0.76 or about 4 t imes the peak value for configuration 111. An examination of the individual irradiance

m
I
m
ratio plots from which distributions of figure 17 were compiled was made. This examination showed that the increase in peak values resulted from the removal of small random e r r o r s such as wrinkles from the membrane rather than from a reduction in the mean e r ro r s . It appears that the data of figure 16 are also affected by the presence in the membrane of wrinkles that are caused by factors other than the effect of hub size. Therefore, the differences in the irradiance-ratio distributions of figure 16 are only an indication of the circumferential wrinkling due to the effect of hub size.
Modifications to the Design Configurations
As shown in figure 16, peak average irradiance ratios of only about 0.16 o r less were measured on configurations I, 11, and 111with the test light-source. illumination. Calculations show that approximately the same values of peak average irradiance ratios would have been obtained had the sun been used as the source of illumination. As these values are low when compared with a value of about 15 that would be obtained from a perfect paraboloid illuminated by the sun, an attempt w a s made to improve the membrane shape by modification of the test parameters.
The only successful modification was the relocation of the cable hub t o a higher position on the rotating shaft. This modification was made only to the 0.50R hub model. The results are shown in figure 17 where irradiance ratio is given as a function of radial distance from the optical axis in the survey plane located at the design distance of 132.1 centimeters. The cable hub was moved up in increments of 2.5 centimeters, and a definite increase in peak irradiance ratio resulted from each move. The peak irradiance ratio was increased by a factor of
.16 e = 0 0
.12 Config. 111. rh = 0.50 R
0 ._ c
L
a," c m ._ Q m . 0 8 L ._ a, m Config. I , L
aJ rh = 0.20R > <
. 0 4
0 I I I
15 10 5 0 5 10 15
R a d i a l d i s t a n c e , r. c m
Figure 16.- Average i r radiance-rat io distr ibut ions of the th ree h u b models along the 0 = 00-180° axis in the design focal plane, zs = 132.1 cm.
25

m
m
m
. 8 e = 0 0 e = 1 8 0 0
7 Cable-hub Config location,
I I
zc, cm
~~ 40.8 111 _ _ _ - - - 43.3 111-A
45.8 111-B I 48.3 111-c
.6 I 50.8 111-D I
.-0 e
L
u c m._ n m . 4 L ._
plol L
m > U
. 2
0 I .. 1 I 20 10 0 10 20
R a d i a l d i s t a n c e , r , cm
Figure 17.- Average irradiance-rat io distr ibutions along the B = Oo-1800 axis i n the design focal plane, zs = 132.1 cm, for the 0.50R h u b model.
26
over 4 by moving the cable hub from the design position zc = 40.8 centimeters to the highest position zc = 50.8 centimeters. The increase in peak irradiance ratio w a s apparently due to the suppression of circumferential wr ink le s that had formed because the cables, with the hub in the lowest position, were providing insufficient support to the membrane rim. Motion pictures of the membrane showed that movement of the cable hub from the lowest to the highest position resulted in raising the r im by about 2 centimeters. The pictures also showed that reflections from the membrane were blurred with the hub in the lowest position (as would occur i f wrinkles were present), but became sharper as the hub was raised. As previously noted, in the design of the cables it w a s assumed that at the cable-rim juncture, the cables were perpendicular to the r im plane. It is obvious from the test resul ts that this assumption was incorrect, and the location of the cable hub relative to the metal hub is an important factor i n the design of a whirling membrane concentrator.
Configurations I, 11, and III were each investigated at rotational speeds above the design value of 71 radians per second with little or no improvement in concentrating ability.
CONCLUSIONS
The whirling-membrane solar -concentrator concept has been investigated by the measurement of the accuracy with which a 3.05-meter-diameter paraboloid focuses incident energy. Three membrane paraboloids constructed of 0.01-millimeter -thick aluininized plastic were rotated at 71 radians per second in a vacuum chamber at pressures of less than 133 newtons per meter2. The three membranes were attached to metal hubs having ratios of hub radius to membrane radius of 0.20, 0.35, and 0.50. The test results indicate the following:
1. The membrane with the 0.50 metal-hub radius and with the cable hub in the highes t position gave the best concentration of energy. The following properties of the whirling membrane were determined from the data:
(a) The focal length was 130.5 centimeters which is about 1 percent less than the design focal length of 132.1 centimeters.
(b) A geometric efficiency of 1.00 was determined for a concentration ratio of 23, and efficiencies greater than 0.90 were obtained at concentration ratios up to 100.
(c) In the radial direction, membrane surface mean e r r o r varied from -0.6' to 0.4' while the standard deviation of the random e r r o r was roughly 0.5' over most of the meinbrane with a sharp increase to 0.8' near the rim.
27

(d) In the circumferential direction, little or no mean e r r o r was noted, but a standard deviation of the random e r r o r of 0.25O was determined at a concentrator radius of 120.4 centimeters.
2. Increased efficiency w a s indicated for models with the larger hubs; however, conclusive evidence was obscured by the presence of other factors.
3. The peak value of the irradiance-ratio distribution in the focal plane w a s increased by a factor of over 4 when the cable hub was moved to a position 10 centimeters above the design value. Thus, the cable-hub location relative to the metal hub is an important factor in the design of a whirling-membrane solar concentrator.
Langley Research Center, National Aeronautics and Space Administration,
Langley Station, Hampton, Va., November 16, 1967, 120-33-06-03-23.
28

APPENDIX
EFFECTIVE REFLECTANCE OF ALUMINIZED PLASTIC MEMBRANES
UNDER BIAXIAL TENSILE LOADING
By Atwood R. Heath, Jr., and Victor R. Bond Langley Research Center
The results presented in reference 2 indicated that when wide thin sheets of material are subject t o pure tension in one direction, large-scale wrinkles tend to form with crests and troughs parallel to the applied force. Reference 2 indicated that the circumferential stresses near the r i m of a paraboloidal whirling membrane can be very large compared to the meridional s t r e s ses thus resulting in a condition conducive to the formation of circumferential wr inkles . Other types of wrinkles that are of interest relative to the successful operation of a whirling-membrane solar concentrator are randomly oriented wrinkles caused by handling during fabrication and packaging. Therefore, to provide design information, an investigation has been made to determine the effect of equal and nonequal biaxial tensile s t r e s ses on the effective reflectance of aluminized polyethylene terephthalate.
Although reflectance is usually considered to be a property of the reflecting niaterial, the te rm "effective reflectance" is used herein to indicate a relative measure of the magnitude of the wrinkles. For example, if a reflecting optical flat were illuminated by a collimated light beam of uniform irradiance, the irradiance of the reflected beam would be the product of the incident-beam irradiance and the specular reflectance. If a reflector had a wavy surface such as a wrinkled surface in a reflective membrane, the reflected light would be dispersed so that the irradiance of the reflected beam would be less than the product of the incident-beam irradiance and the specular reflectance. The larger the amplitude of the wrinkles, the greater would be the dispersion of light; hence a lower effective reflectance would result. The effective reflectance will also vary with distance from the reflective surface to the detector; therefore, the data obtained from this investigation will show trends only and should not be used as absolute values.
Figure 18 shows the test arrangement with a specimen in place. The specimens were 28-centimeter -square sheets of 0.005-millimeter- and 0.01-millimeter -thick polyethylene terephthalate with grommets located every 2.5 centimeters around the perimeter. Loads were applied t o the specimens along two perpendicular axes through the whiffletrees, as shown in figure 18. A zirconium arc lamp supplied the light which was nearly collimated and gave a 6.4-centimeter-diameter beam. The irradiance of the reflected light was measured by a photometer which was sensitive to radiation in the
29

APPENDIX
wavelength range f rom 200 to 680 nanometers. At each loading condition, a front-surface vacuum-deposited-diu" flat glass mi r ro r was placed just in front of the specimen and a reading of the light irradiance reflected f rom the m i r r o r was read on the photometer. The mi r ro r was then removed and a reading was made of the light reflected from the specimen. The effective reflectance was then determined as the ratio of the light reflected by the specimen to the light reflected by the front-surface mir ror .
Tests were first made with equal loads applied to the two axes and the results a r e shown in figures 19 and 20, where effective reflectance is presented as a function of membrane stress. The s t r e s s varied from about 1to 58 meganewtons per meter2 for the 0.005-millimeter-thick plastic and from about 0.5 to 43 meganewtons per meter2 for the 0.01-millimeter-thick plastic. The specimens as received from the fabrication shop had some wrinkles as the result of the handling during the installation of the grommets but were free of scratches and fingerprints in the center where reflectance was measured. The effective reflectance of the 0.005-millimeter -thick sample increased with increasing stress, thus indicating the presence of wrinkles that were being removed by the applied loads. This sample wrinkled easily during handling especially while being attached to the whiffletrees and placed in the testing frame. The 0.01-millimeter-thick sample was more resistant to wrinkling during handling as evidenced by no change in the effective reflectance from an increase in s t ress . (See fig. 20.) Both specimens were then crushed so that wrinkles showed over the entire surface when the specimens were laid on a flat surface. Care was taken to prevent fingerprints on the surfaces and also to insure that no sharp c reases were made. However, the crushing procedure was probably more drastic than a folding procedure, that would be used in packaging a solar concentrator. For both specimens, the reflectance was very low at the lowest stress levels, but increased rapidly with increased stress.
30
P-61-3289 Figure E--Testing frame, with specimen installed, used in deter
mining the effective reflectance of aluminized plastic under biaxial tensile loads.

c
m
c
aJ
APPENDIX
1. 0
.8
8 m c g .6-L
E > ._I u2 . 4 L Y
. 2
0
Figure 19.
1. 0
. 8
a, “ m
Z . 6 a,-L
? > ._c
Lk? . 4 L w
. 2
0
Figure 20.
c 4
Specimen condition
- c As received ( 1 Crushed
10 20 30 40 50 60 70
Stress, MN/ m2
Variat ion of effective reflectance of 0.005-mm-thick aluminized plastic under equal biaxial stresses.
,
Specimen condition
- J As received .I Crushed
1 1 - 1 I 10 2 0 30 4 0 5 0 6 0 7 0
Stress, MN/ m2
Variat ion of effective reflectance of 0.01-mm-thick a lumin ized plastic under equal biaxial stresses.
31
I

" W
c
L
APPENDIX
Specimens were then subjected to unequal applied loads along the two axes and the effective reflectance as a function of the ratio of minimum s t r e s s to maximum s t r e s s is presented fo r several values of maximum stress. Figure 21 shows the effective reflectance of a 0.005-millimeter -thick plastic membrane as received from the fabrication shop. The effective reflectance remained relatively constant over the stress-ratio range from 0.1 to 1.0. However, below a stress ratio of 0.1, the effective reflectance dropped rapidly. This drop is attributed to large wrinkles that were observed extending in a direction parallel to the maximum load, thus dispersing the reflected light. The specimen was then crushed and retested, and the results a r e shown in figure 22. A large spread in effective reflectance for the four s t r e s s levels, especially at s t ress ratios near 0.1 is shown. This specimen was retested after remaining under a s t ress of 7 meganewtons per meter2 along each axis for several days. The results a r e shown in figure 23 where the difference in effective reflectance for the four s t r e s s levels is shown to be much less than w a s noted in figure 22. Therefore, it appears that the wrinkles put in the plastic by crushing are removed to some extent when a relatively small s t r e s s is applied for some time. The same specimen w a s tested with the maximum load applied along the axis at 90' to that applied in figure 23 to determine if the plastic had any directional characteristics. No appreciable difference in the data of the two tes ts w a s observed.
1 . 0
8 1 -A
W"c m . 6 -L
W .-; -W
. 4
I 0 15.4 0 29 .2
mc 0 44.0 w
I A 57.6 3 . 2
0 -I
.5 .6 .7 .8
II
.9 I .o M i n i m u m stress / Maximum stress
Figure 21.- Effective reflectance of 0.005-mm-thick a lumin ized plastic under unequal biaxial stresses; specimen as received f rom fabrication.
32

V W
W
W
W
APPENDIX
1. G
. a -I V -.
3 W"c
. 6 -c Maximum stress, M N / m2 L
.-> . 4
0 15.4 0 29 .2
W2z 0 44.0w
A
. 2
.9 0 .I .a
57.6
E0
Min imum stress / Maximum stvess
Figure 22.- Effective reflectance of 0.005-mm-thick aluminized plastic under unequal biaxial stresses; specimen crushed.
1. 0
. 8 a
W
5 . 6" - -a, Maximum stress, M N / m2
> 0 15.4 ._ . 4 0 2 9 . 2-W c 0 44.0 w
A 51.6
. 2
0 .3 .4 .5 .6 .7 .a .9 0 M i n i m u m stress / Maximum stress
F igure 23.- Effective reflectance of 0.005-mm-thick aluminized plastic under unequal biaxial stresses; crushed specimen after remain ing under a stress of 6.9 MN/m2 for several days.
33
I

a,
a,
a,
APPENDIX
1 . 0
A. ?- bI
a- z 0 . a
a, "c
5 . 6 - -a, Maximum stress, M N / in2 L
> 0 7 . 7 ._ t; .4 0 1 4 . 8-I 0 2 1 . 9 w
A 2 9 . 1
.2
0 . I .4 .5 -6 .7 .8 .9 I.o M i n i m u m stress / Maximum Stress
Figure 24.- Effective reflectance of 0.01-mm-thick a lumin ized plastic under unequal biaxial stresses; specimen as received f rom fabrication.
I . 0
.8 / e -
5 - 1: a,
/
c5 . 6
0 2-a, Maximum stress. M N / m -
2 > 0 7.7 ._ t; .4 0 14.8 c-w 0 21.9
A 2 9 . 1
. 2 i iI 1
0 .I .2 .3 .4 ..5 .6 .a .9 I .o Min imum stress / Maximum stress
Figure 25.- Effective reflectance of 0.01-mm-thick aluminized plastic under unequal biaxial stresses; specimen crushed.
34
I

APPENDM
A specimen of 0.01-millimeter-thick plastic, as received from the shop, w a s also tested with unequal loads and the results are shown in figure 24. The results a r e similar to those obtained on the 0.005-millimeter-thick specimen shown in figure 21. Figure 25 shows data on the crushed specimen. For the same values of maximum stress , the crushed specimen has appreciably lower effective reflectance than the as-received specimen of figure 24.
35

REFERENCES
1. Heath, Atwood R., Jr.: Status of Solar Energy Collector Technology. Power Systems for Space Flight, Morr is A. Zipkin and Russell N. Edwards, eds., Academic P res s , 1963, pp. 655-668.
2. Simmonds, J ames G.: The General Equations of Equilibrium of Rotationally Symmetric Membranes and Some Static Solutions for Uniform Centrifugal Loading. NASA TN D-816, 1961.
3. Mechtly, E. A.: The International System of Units - Physical Constants and Conver
sion Factors. NASA SP-7012, 1964.
36 NASA-Langley. 1968 -3 L-4614

AERONAUTICSNATIONAL AND SPACE ADMINISTRATION POSTAGE AND FEES PAID D. C. 20546 NATIONAL AERONAUTICS AN1WASHINGTON,
SPACE ADMINISTRATIONFIRST CLASS MAILOFFICIAL BUSINESS
POSTMASTER:
‘ T h e aeronautical and space activities of the United Stntes shall be condzuted so as t o contribute . . . t o the expansion of human knowledge of phenomena in the atiiiosphere and space. T h e Administration shall provide f o r the widest practicable and appropriate disseiiiination of inforiiiation concerning its activities and the ~esul t sthereof.’’
-NATIONAL AERONAUTICSAND SPACE ACT OF 1958
If Undeliverable (Section 158 Posral Manual) Do Not Returr
NASA SCIENTIFIC AND TECHNICAL PUBLICATIONS
TECHNICAL REPORTS: Scientific and technical information considered important, complete, and a lasting contribution to existing knowledge.
TECHNICAL NOTES: Information less broad in scope but nevertheless of importance as a contribution to existing knowledge.
TECHNICAL MEMORANDUMS: Information receiving limited distribution because of preliminary data, security classification, or other reasons.
CONTRACTOR REPORTS: Scientific and technical information generated under a NASA contract or grant and considered an important contribution to existing knowledge.
TECHNICAL TRANSLATIONS: Information published in a foreign language considered to merit NASA distribution in English.
SPECIAL PUBLICATIONS: Information derived from or of value to NASA activities. Publications include conference proceedings, monographs, data compilations, handbooks, sourcebooks, and special bibliographies.
TECHNOLOGY UTILIZATION PUBLICATIONS: Information on technology used by NASA that may be of particular interest in commercial and other non-aerospace applications. Publications include Tech Briefs, Technology Utilization Reports and Notes, and Technology Surveys.
Details on the availability of these publications may be obtained from:
SCIENTIFIC A N D TECHNICAL INFORMATION DIVISION
NATIONAL AERONAUTICS AND SPACE ADMINISTRATION Washington, D.C. 20546