the ghana chamber of mines
TRANSCRIPT
THE GHANA CHAMBER OF MINES
2019
MINING INDUSTRY
STATISTICS AND DATA
THE GHANA CHAMBER OF MINES 2019 Industry Statistics & Data
GHANA CHAMBER OF MINES’ 2019 FACTOID Page 1
TABLE OF CONTENTS
1.1 Brief History ..................................................................................................................................................................................... 5
1.2 Vision ................................................................................................................................................................................................ 5
1.3 Mission Statement ............................................................................................................................................................................ 5
1.4 Core Values: ...................................................................................................................................................................................... 6
1.5 Objectives of the Chamber ................................................................................................................................................................ 6
2.0 OVERVIEW OF THE GLOBAL GOLD INDUSTRY IN 2019 ...................................................................................................... 6
2.1: MINING IN GHANA ..................................................................................................................................................................... 7
2.2 HIGHLIGHTS OF PERFORMANCE OF THE MINING INDUSTRY IN 2019 ........................................................................ 8
3.0 GHANA IN THE GLOBAL MINING ARENA ............................................................................................................................. 9
3.1 GLOBAL GOLD PRODUCTION .................................................................................................................................................. 9
3.2 GOLD PRICE ................................................................................................................................................................................. 12
3.3 NATURAL DIAMOND: ESTIMATED WORLD PRODUCTION, BY COUNTRY AND TYPE .......................................... 13
3.4 MANGANESE ORE: WORLD PRODUCTION, BY COUNTRY ............................................................................................. 15
3.5 BAUXITE: WORLD PRODUCTION, BY COUNTRY .............................................................................................................. 17
4.0 CONTRIBUTION OF MINING TO THE ECONOMY OF GHANA ........................................................................................ 19
4.1 GROSS DOMESTIC PRODUCT (GDP) ..................................................................................................................................... 19
4.2 SECTORAL CONTRIBUTIONS TO GRA DIRECT DOMESTIC REVENUE ........................................................................ 21
4.3 SECTORAL CONTRIBUTIONS TO GRA CORPORATE TAX COLLECTION ..................................................................... 23
4.4 SECTORAL CONTRIBUTION TO GRA PAYE COLLECTION .............................................................................................. 25
4.5 MINING SECTOR CONTRIBUTION TO TOTAL ROYALTIES ............................................................................................. 27
THE GHANA CHAMBER OF MINES 2019 Industry Statistics & Data
GHANA CHAMBER OF MINES’ 2019 FACTOID Page 2
4.6 INVESTMENTS INFLOW INTO THE MINING SECTOR ...................................................................................................... 28
4.7 CAPEX ........................................................................................................................................................................................... 30
4.8 SHARE OF MINING IN GROSS MERCHANDISE EXPORT ................................................................................................. 30
4.9 MINING SECTOR CONTRIBUTIONS ...................................................................................................................................... 33
4.10 SOCIAL SECURITY CONTRIBUTIONS ................................................................................................................................. 35
5.0 MAJOR MINERALS PRODUCTION IN GHANA ..................................................................................................................... 35
5.1 PRODUCTION TREND FOR GOLD (Only Producing Member Companies of the Chamber) ................................................. 35
5.2 PRODUCTION TREND FOR DIAMOND ................................................................................................................................ 36
5.3 EXPORT TREND FOR BAUXITE .............................................................................................................................................. 37
5.4 EXPORT TREND FOR MANGANESE ...................................................................................................................................... 38
6.0 MAJOR MINERAL REVENUE IN GHANA ............................................................................................................................... 39
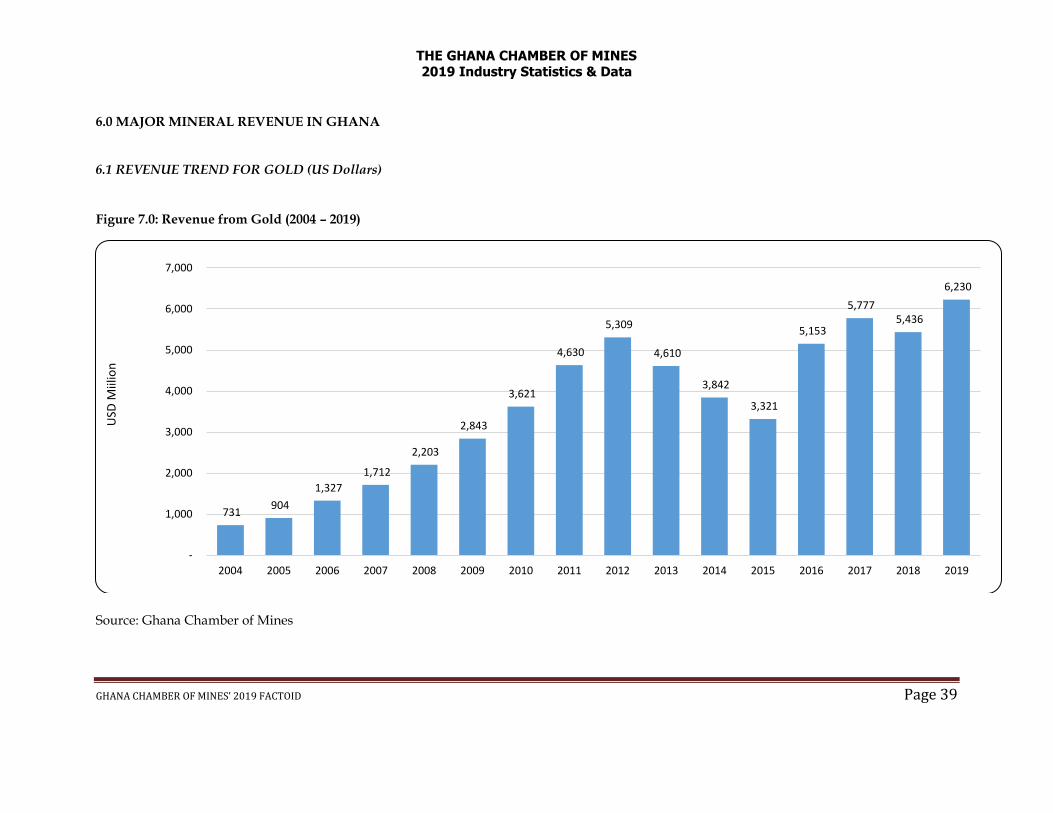
6.1 REVENUE TREND FOR GOLD (US Dollars) ........................................................................................................................... 39
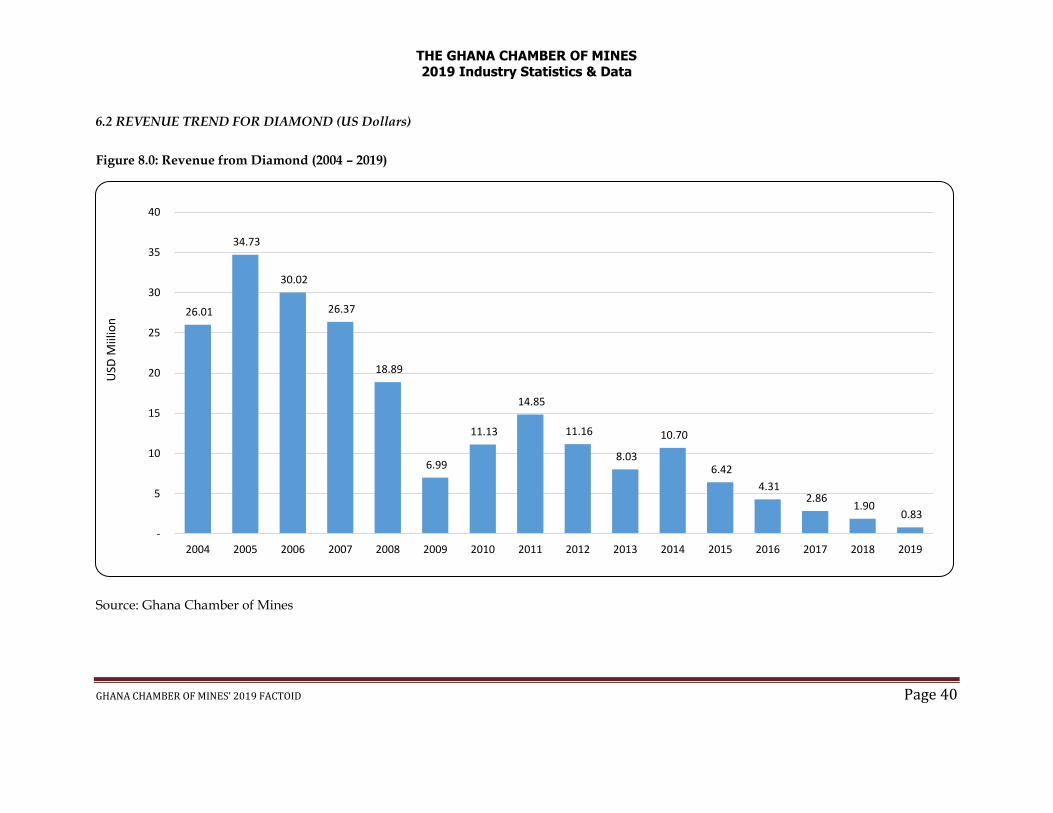
6.2 REVENUE TREND FOR DIAMOND (US Dollars) .................................................................................................................. 40
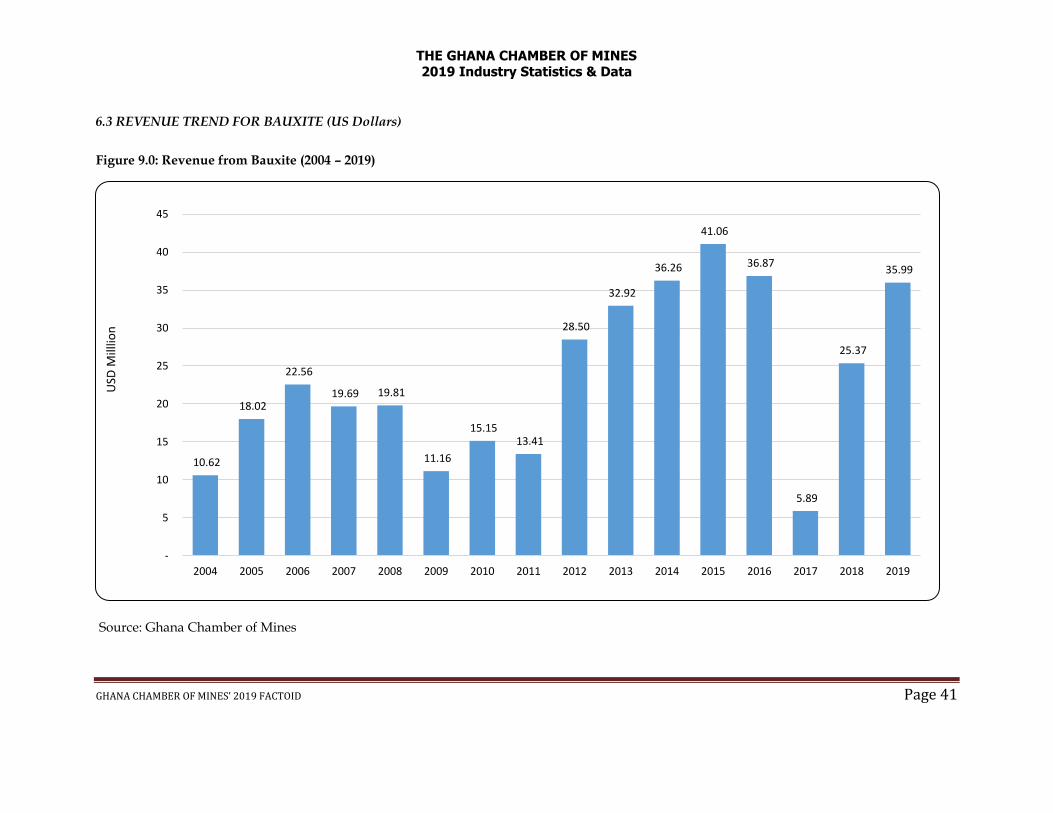
6.3 REVENUE TREND FOR BAUXITE (US Dollars) ..................................................................................................................... 41
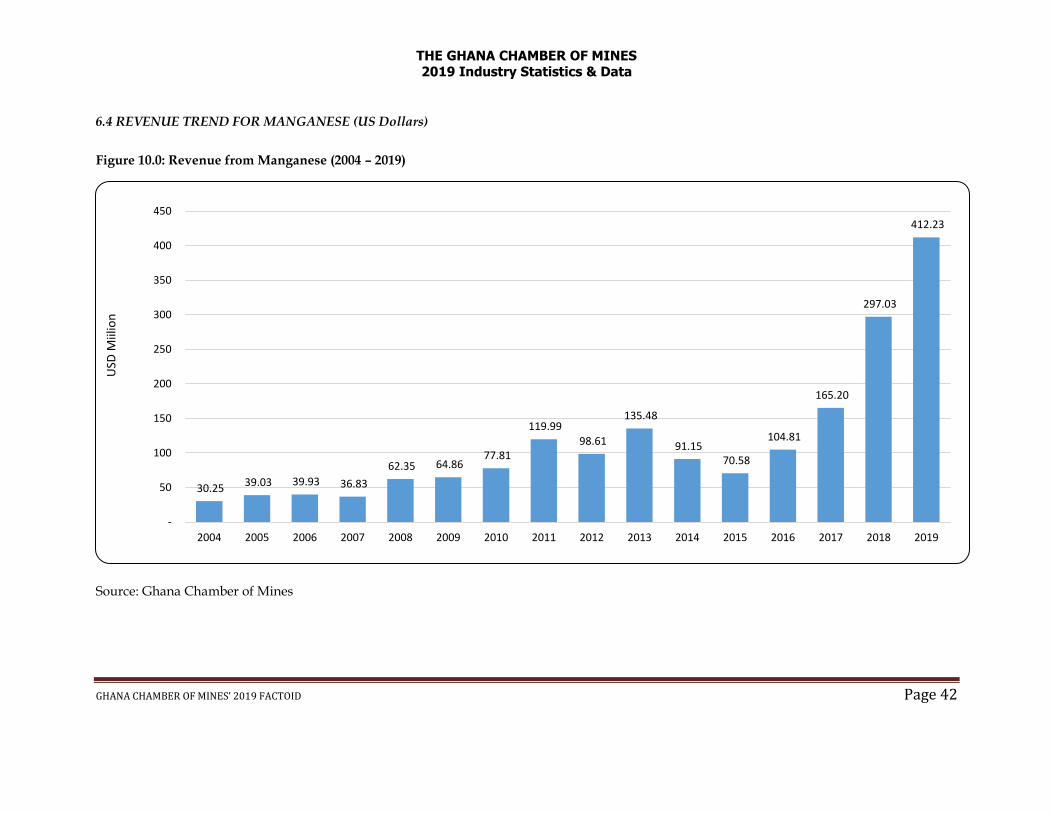
6.4 REVENUE TREND FOR MANGANESE (US Dollars) ............................................................................................................. 42
7.0 LABOUR IN THE MINING SECTOR ........................................................................................................................................... 43
7.1 Employment .................................................................................................................................................................................... 43
8.0 SOCIO – ECONOMIC CONTRIBUTION .................................................................................................................................... 44
8.1 Socio-Economic Contributions ....................................................................................................................................................... 44
8.2 Property Rates ................................................................................................................................................................................ 45
9.0 ENERGY ............................................................................................................................................................................................ 46
THE GHANA CHAMBER OF MINES 2019 Industry Statistics & Data
GHANA CHAMBER OF MINES’ 2019 FACTOID Page 3
9.1 Electric Power ................................................................................................................................................................................. 46
9.2 Diesel............................................................................................................................................................................................... 46
APPENDIX A .......................................................................................................................................................................................... 47
A1: MAJOR MINERALS PRODUCTION IN GHANA (1990-2019) .............................................................................................. 47
A2: MAJOR MINERALS’ REVENUES IN GHANA (2004-2019) .................................................................................................. 48
LIST OF TABLES
Table 1.0: Global Gold Production (Mine Production) ....................................................................................................................... 9
Table 2.0: Global Diamond Production 1, 2, 3 ....................................................................................................................................... 13
Table 3.0: Global Manganese Production 1, 2 ...................................................................................................................................... 15
Table 4.0: Global Bauxite Production .................................................................................................................................................. 17
Table 5.0: Growth Rates of GDP by Sector at 2013 Constant Prices (2014-2019) .......................................................................... 19
Table 6.0: Contributions to GRA Direct Domestic Revenue by Sector (2015 – 2019) ................................................................... 21
Table 7.0: Contributions to GRA Corporate Tax Collection by Sector (2015 – 2019) ................................................................... 23
Table 8.0: Contribution to GRA PAYE Collection by Sector (2009 -2019) ..................................................................................... 25
Table 9.0: Mining Sector Contribution to Total Royalties (1993 – 2019) ........................................................................................ 27
Table 10.0: Total Investments Inflow into The Mining Sector (2000—2019) ................................................................................. 28
THE GHANA CHAMBER OF MINES 2019 Industry Statistics & Data
GHANA CHAMBER OF MINES’ 2019 FACTOID Page 4
Table 11.0: Mining Sector Contributions (1990 – 2019) ..................................................................................................................... 33
Table 12.0: Socio-Economic Contributions of Producing Member Companies of the Chamber ............................................... 44
LIST OF FIGURES
Figure 2.0: Trend of Total Investment inflow into the Mining Industry (2000-2019) .................................................................. 30
Figure 3.0: Share of Mineral Receipts in Total Exports (2005 – 2019) ............................................................................................. 32
Figure 4.0: Production Trend for Gold (1990 – 2019) ........................................................................................................................ 35
Figure 5.0: Production Trend for Diamond (1990 – 2019) ................................................................................................................ 36
Figure 6.0: Export Trend for Bauxite (1990 – 2019) ........................................................................................................................... 37
Figure 7.0: Export Trend for Manganese (1990 – 2019) .................................................................................................................... 38
Figure 8.0: Revenue from Gold (2004 – 2019) .................................................................................................................................... 39
Figure 9.0: Revenue from Diamond (2004 – 2019) ............................................................................................................................. 40
Figure 10.0: Revenue from Bauxite (2004 – 2019) .............................................................................................................................. 41
Figure 11.0: Revenue from Manganese (2004 – 2019) ....................................................................................................................... 42
Figure 12.0: Employment by Producing Member Companies ........................................................................................................ 43
Figure 13.0: Property Rate Payments to MMDAs (2003-2019) ........................................................................................................ 45

THE GHANA CHAMBER OF MINES 2019 Industry Statistics & Data
GHANA CHAMBER OF MINES’ 2019 FACTOID Page 5
1.0 THE GHANA CHAMBER OF MINES
Est. 1928
1.1 Brief History
The first offices of the West Africa Chamber of Mines, which gave birth to the Ghana Chamber of Mines, were set up in 1903 with the principal objective of advancing and protecting the mining interests of the shareholders. The Chamber was composed of directors of the mining companies in London who among other functions, had power to promote or oppose any legislative measures or petition government and administrative bodies in the colony on many matters, which directly affected mining interests. On 6th June 1928, the Gold Coast Chamber of Mines was incorporated as a private company and operated at Tarkwa in the Western Region. On Ghana’s attainment of independence on 6th March 1957, the name of the Chamber was altered to the Ghana Chamber of Mines. By a special resolution on 6th May 1960, the form of the objects of the Chamber was also altered and on 14th February 1964, the Chamber was converted under the Companies Code 1963 (Act 179) into a company limited by guarantee. In 1967, the registered offices of the Chamber moved to the national capital, Accra. The Chamber has since remained a voluntary private sector employers’ association representing companies and organizations engaged in the minerals and mining industry in Ghana. Programmes and activities of the Chamber are funded entirely by its member companies, which are largely responsible for producing over 60 per cent of Ghana’s gold.
1.2 Vision
To be a respected, effective and unified voice for the mining industry.
1.3 Mission Statement
To represent the mining industry in Ghana using the resources and capabilities of its members to deliver services that address members, government and community needs in order to enhance sustainable development.

THE GHANA CHAMBER OF MINES 2019 Industry Statistics & Data
GHANA CHAMBER OF MINES’ 2019 FACTOID Page 6
1.4 Core Values:
The principles that will guide decision making which the members of the Chamber will not compromise whilst achieving the mission and pursuing the vision are:
❖ Honesty ❖ Transparency ❖ Good Governance ❖ Good Corporate Citizenship ❖ Commitment ❖ Unity
1.5 Objectives of the Chamber
The objectives of the Chamber taking into consideration the strategic challenges for achieving its vision are to: ➢ Promote and protect the interests of the Mining Industry ➢ Promote and protect the image of the mining industry ➢ Establish and maintain effective membership governance ➢ Provide thought leadership for the solution of national issues related to mining
2.0 OVERVIEW OF THE GLOBAL GOLD INDUSTRY IN 2019 Generally, the price outturn of gold in 2019 mirrored the pulse of the global economy and geopolitical developments as well as the underlying supply and demand conditions. In the first half of the year, the stable growth of the global economy partly drowned the uncertainties emanating from the drawn-out procedural requirements related to the United Kingdom’s withdrawal from the European Union as well as the trade tensions between the United States and China. Consequently, the traded price of the yellow metal was largely bearish as it oscillated between a band of US$ 1,269 per ounce and US$ 1,439 per ounce. Contrastingly, the other half of the year was characterized by heightened geopolitical tensions and sluggish economic growth. These developments, which reinforced the allure of gold as a safe haven asset, led to a sustained surge in its price. Within this period, the lowest and highest price of gold on the London Metals Exchange (LME) were US$ 1,317 per ounce and US$ 1,546 per ounce respectively. With regards to global supply of gold, the significant expansion in recycled and net producer hedged gold outperformed the marginal decline in mine production to elevate total supply of gold by 2 per cent to 4,776 tonnes in 2019 from 4,673 tonnes in 2018. The volume of recycled gold, which tends to respond positively to upward movements in gold price, increased by 11 per cent from 1,176 tonnes in 2018 to 1,304 tonnes in 2019. Furthermore, net producer hedging also responded to the increase in price of gold with an expansion, from -12.5 tonnes in 2018 to 8.3 tonnes in
THE GHANA CHAMBER OF MINES 2019 Industry Statistics & Data
GHANA CHAMBER OF MINES’ 2019 FACTOID Page 7
2019. Meanwhile, unfavourable developments in China, Indonesia, South Africa and Mexico blighted the appreciable growth in mine production in the other major gold mining jurisdictions such as West Africa which was the primary engine of growth in 2019. The contraction in output of the aforementioned countries plunged global mine production downwards to 3,463 tonnes in 2019 from 3,509 tonnes in 2018, a dip of 1 per cent. The price outturn of gold in 2019 had a mixed and disproportionate impact on the traditional classes of demand for gold. The application of gold in the fabrication of jewellery and technology as well as demand by central banks and other financial institutions, which tend to be inversely related to price, declined as the yellow metal became less affordable. In contrast, investment demand for gold, which varies indirectly with interest rates on the equity market, increased as investors took advantage of the price-driven profit opportunities in the bullion market. The expansion in investment demand was insufficient to offset the contraction in the other types of demand, leading to a year-on-year decline in aggregate demand for gold. Data from the World Gold Council suggests that global demand for gold decreased by a percentage to 4,335 tonnes in 2019 from 4,401 tonnes in 2018. The demand for gold for fabrication of jewellery declined from 2,240 tonnes in 2018 to 2,107 tonnes in 2019 on the back of the twin problem of gold price induced decline in real income and slowdown in local economies. Investment demand for gold, which comprises purchases of gold bars, gold coins, medals and exchange traded funds (ETFs), respond differently to the hike in price of the yellow metals. The demand for gold bars and coins declined to a ten-year low of 870 tonnes in 2019 from 1,093 tonnes in 2018. On the other hand, demand for ETFs, which tend to correlate positively with the price of gold, increased by 426 per cent, from 76 tonnes in 2018 to 401 tonnes in 2019. The significant growth in demand for ETFs displaced the decline in demand for gold bars and coins to increase total investment demand for gold from 1,169 tonnes in 2018 to 1,271 tonnes in 2019. Furthermore, the demand for gold as a reserve currency by central banks and other financial institutions reduced marginally from 656 tonnes in 2018 to 650 tonnes in 2019 as a result of the slowdown in purchases by China and Russia which counterbalanced the increase in demand by other countries such as Poland and Turkey. Meanwhile, the relatively high prices of gold and weak global economic growth, shrank the demand for gold in technological applications from 334 tonnes in 2018 to 326 tonnes in 2019.
2.1: MINING IN GHANA
Ghana’s geological landscape teems with a variety of minerals with the commercially exploited ones being gold, diamond, manganese and
bauxite. In 2019, gold accounted for 93.28 per cent of gross mineral revenue while the respective share of manganese, bauxite and diamond were 6.17 per cent, 0.54 per cent and 0.01 per cent. The main methods of mining in the country are underground and open pit mining. Alluvial mining is also popular in the small-scale sector. Following a period of general economic decline, Ghana’s mining industry recovered on the back of market-based adjustment policies recommended by the International Monetary Fund and World Bank. The Structural Adjustment Programme (SAP) amongst others abolished restrictions in foreign
THE GHANA CHAMBER OF MINES 2019 Industry Statistics & Data
GHANA CHAMBER OF MINES’ 2019 FACTOID Page 8
exchange transactions and imports. As well, the SAP diluted the dominance of the state in general economic activities. On account of these reforms, the investor community renewed its interest in the economy, particularly, in the mining sector. The mining sector therefore became the pith of government’s effort to revive the ailing economy through the attraction of foreign direct investments (FDI) with its proven associated benefits such as generation of badly needed foreign exchange, employment creation and transfer of technology and knowledge.
2.2 HIGHLIGHTS OF PERFORMANCE OF THE MINING INDUSTRY IN 2019
The production, purchases and shipment outturns of Ghana’s main minerals were mixed in 2019. The production of gold attributable to the large-scale sector expanded by 6 per cent from 2.808 million ounces in 2018 to 2.989 million ounces in 2019. On the other hand, the quantum of gold assayed by the Precious Minerals Marketing Company (PMMC) on behalf of Licensed Gold Exporting Companies (LGECs), which is used as a proxy for production by small-scale mines, dwindled by 20 per cent from 1.984 million ounces in 2018 to 1.588 million ounces in 2019. In view of the contrasting performance of the large and small-scale sectors, Ghana’s total gold production declined from 4.792 million ounces in 2018 to 4.577 million ounces in 2019. In spite of the fall in output, the outturn in 2019 was the third highest level of production in more than three decades. The shipment of manganese by the Ghana Manganese Company, increased by 18 per cent from 4.551 million tonnes in 2018 to 5.383 million tonnes in 2019. In the same vein, shipments of bauxite by Ghana Bauxite Company improved by 10 per cent from 1.011 million tonnes in 2018 to 1.116 million tonnes in 2019. On the downside, purchases of diamond by PMMC fell by 41 per cent from 0.057 million carats in 2018 to 0.033 million carats in 2019. Data from the Ghana Revenue Authority (GRA) shows that total direct domestic fiscal receipts attributable to the mining and quarrying sector improved from GH₵ 2.36 billion in 2018 to GH₵ 4.02 billion in 2019. The 70 per cent increase in fiscal payments by firms in the sector was occasioned by the simultaneous increase in production and price, particularly, gold. Specifically, corporate tax receipts from the minerals sector increased by 89 per cent to GH₵ 2.27 billion in 2019 from GH₵ 1.20 billion in 2018. The sector’s corporate tax payments were equivalent to 19.01 per cent of aggregate corporate tax fiscal receipts collected by the GRA. Moreover, income tax (PAYE) receipts of mining sector employees rose from GH₵ 457.16 million in 2018 to GH₵ 736.26 in 2019, which represents a growth rate of 61.1 per cent. Likewise, mineral royalty payment and residual taxes, which is officially classified as self-employed, also expanded by 42.7 per cent and 277.8 per cent respectively. While mineral royalty receipts, which was 99.4 per cent of total non-oil royalty payments, increased from GH₵ 705.26 million in 2018 to GH₵ 1.01 billion in 2019, the residual taxes surged from GH₵ 0.18 million to GH₵ 0.67 million in the same period. In view of the significant growth in fiscal payments, the share of the mining and quarrying sector in total direct domestic receipts mobilized by the GRA improved from 14.2 per cent in 2018 to 18.3 per cent. The sector’s total fiscal contribution in 2019 was the second highest after the financial and insurance and translates into 7.7 per cent of domestic revenue. In the previous year, the mining and quarrying sector was the largest contributor to direct domestic receipts and accounted for 5 per cent of domestic fiscal revenue. In terms of total government revenue, the mining and quarrying sector’s contributions increased from 4.9 per cent in 2018 to 7.6 per cent in 2019.
THE GHANA CHAMBER OF MINES 2019 Industry Statistics & Data
GHANA CHAMBER OF MINES’ 2019 FACTOID Page 9
Moreover, data from the Bank of Ghana, indicates that proceeds from the export of minerals rose from US$ 5.760 billion in 2018 to US$ 6.678 billion in 2019. The 16 per cent expansion in mineral revenue was occasioned by improvements in receipts from gold, manganese and bauxite, which outweighed the decline in proceeds from the export of diamond. The upturn in mineral receipts expanded the sector’s share in gross merchandize export receipts from 39 per cent in 2018 to 43 per cent in 2019, consolidating its status as the foremost source of foreign exchange from export earnings. This compares favourably with the outturns of 29 per cent and 15 per cent for crude oil and cocoa respectively in 2019. In respect of repatriation of mineral export receipt, the producing member companies of the Ghana Chamber of Mines returned US$ 3.3 billion out of their realized mineral export revenue of US$ 4.5 billion in 2019. The entire US$ 3.3 billion, which translates into 73 per cent of export proceeds of the producing member companies, was ploughed back into the country through the various commercial banks, to deepen their intermediation functions as well as reinforce their foreign exchange reserves to meet the import demands of the country.
3.0 GHANA IN THE GLOBAL MINING ARENA
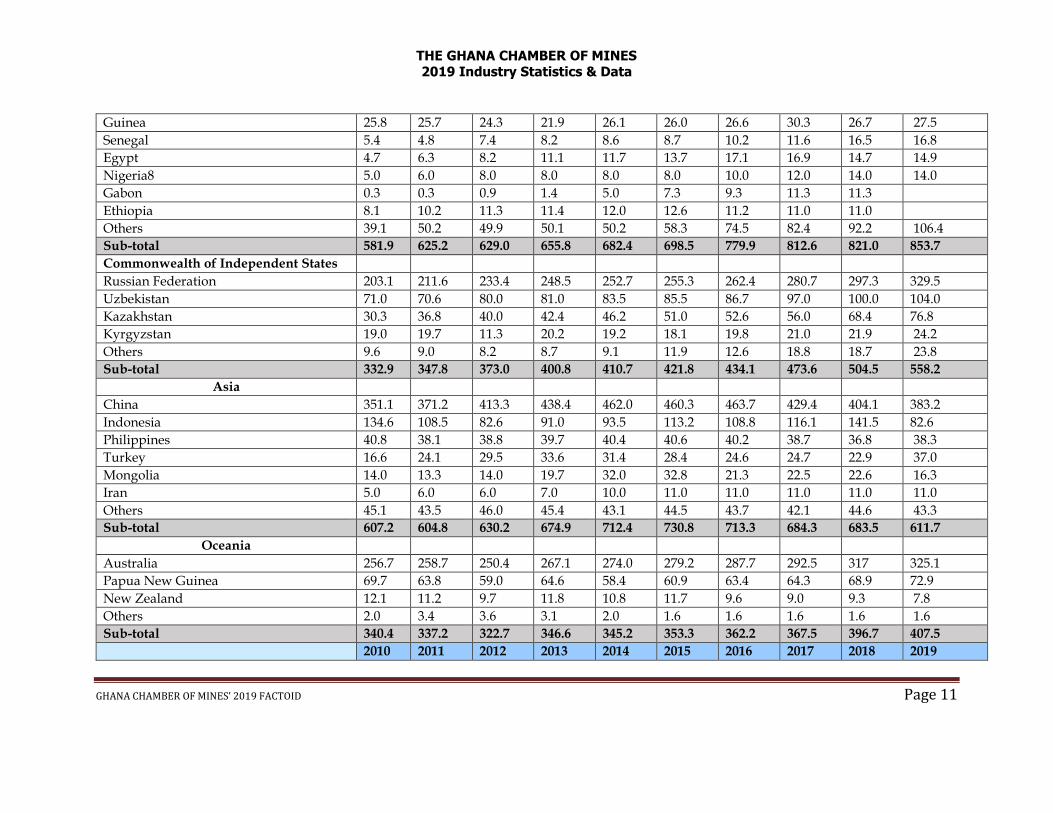
3.1 GLOBAL GOLD PRODUCTION
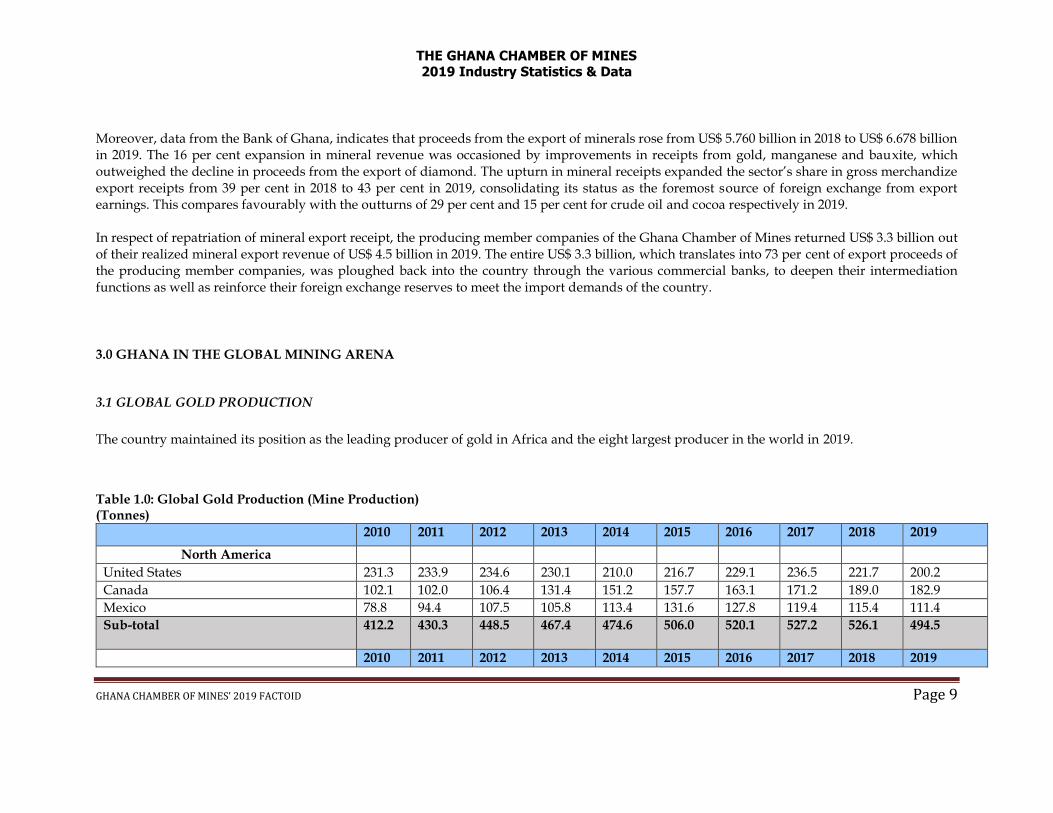
The country maintained its position as the leading producer of gold in Africa and the eight largest producer in the world in 2019.
Table 1.0: Global Gold Production (Mine Production) (Tonnes)
2010 2011 2012 2013 2014 2015 2016 2017 2018 2019
North America
United States 231.3 233.9 234.6 230.1 210.0 216.7 229.1 236.5 221.7 200.2
Canada 102.1 102.0 106.4 131.4 151.2 157.7 163.1 171.2 189.0 182.9
Mexico 78.8 94.4 107.5 105.8 113.4 131.6 127.8 119.4 115.4 111.4
Sub-total 412.2 430.3 448.5 467.4 474.6 506.0 520.1 527.2 526.1 494.5
2010 2011 2012 2013 2014 2015 2016 2017 2018 2019

THE GHANA CHAMBER OF MINES 2019 Industry Statistics & Data
GHANA CHAMBER OF MINES’ 2019 FACTOID Page 10
Central & South America
Peru 184.8 183.8 189.8 182.4 171.1 170.5 166.0 166.6 157.6 143.3
Brazil 71.5 77.7 80.2 89.3 90.4 95.4 95.9 95.8 96.7 106.9
Argentina 63.9 59.0 54.2 51.1 59.7 63.9 58.7 62.9 59.3 53.1
Colombia 43.6 45.9 56.2 45.7 47.0 49.2 51.8 44.1 43.0 46.3
Chile 39.5 45.1 49.9 51.3 46.0 42.5 40.7 35.8 36.5 37.8
Suriname 20.4 20.1 20.0 18.5 18.4 17.4 21.2 34.1 34.3 32.8
Dominican Republic 0.1 0.5 4.2 26.6 36.1 31.1 38.0 35.3 31.6 31.8
Guyana 11.9 13.9 15.6 18.4 17.3 18.2 24.2 24.5 25.0 25.5
Bolivia 4.1 3.6 3.8 3.9 8.4 10.3 14.4 28.6 31.3 44.2
Venezuela 24.9 25.5 21.0 22.8 22.7 22.6 23.0 23.0 26.0 27.8
Ecuador 15.2 15.6 16.0 15.9 15.3 14.2 12.2 11.5 11.5 11.0
Others 22.3 26.5 22.1 22.9 21.6 20.3 18.1 14.2 13.6 16.2
Sub-total 502.3 517.5 533.0 548.7 554.1 555.6 564.1 566.0 558.0 287.0
Europe
Finland 5.8 6.6 9.1 8.5 7.6 8.2 8.6 8.8 8.3 7.7
Sweden 6.2 5.9 6.1 6.4 6.5 6.3 6.5 7.8 7.9 8.1
Bulgaria 2.5 3.4 4.3 4.5 5.5 5.4 5.7 6.6 6.8
Others 2.2 2.1 3.5 4.4 3.9 3.6 2.8 3.6 4.9 15.7
Sub-total 16.7 18.0 22.9 23.9 23.5 23.5 23.6 26.9 27.9 31.4
Africa
Ghana 94.3 96.8 106.0 105.8 106.3 95.4 131.5 130.2 130.5 130.0
South Africa 210.0 205.3 179.8 179.5 168.6 162.0 162.6 154.0 129.8 118.2
Sudan 29.3 32.6 33.9 57.6 60.9 67.8 77.5 88.0 76.6 76.6
Mali 42.7 42.6 47.6 47.4 47.4 49.4 50.1 50.4 61.2 71.1
Burkina Faso 26.9 36.7 34.9 38.6 42.2 41.6 44.9 52.6 62.0 62.0
Tanzania 47.5 54.4 56.3 52.0 51.8 53.2 55.3 54.6 47.8 48.0
DR Congo 18.0 21.0 24.8 25.3 35.9 39.7 35.7 36.6 44.8 45.6
Zimbabwe 17.1 19.0 22.7 23.0 24.3 26.5 30.8 33.3 42.2 38.7
Ivory Coast 7.8 13.2 13.0 14.5 23.4 28.2 32.6 36.7 40.9 41.9
2010 2011 2012 2013 2014 2015 2016 2017 2018 2019
THE GHANA CHAMBER OF MINES 2019 Industry Statistics & Data
GHANA CHAMBER OF MINES’ 2019 FACTOID Page 11
Guinea 25.8 25.7 24.3 21.9 26.1 26.0 26.6 30.3 26.7 27.5
Senegal 5.4 4.8 7.4 8.2 8.6 8.7 10.2 11.6 16.5 16.8
Egypt 4.7 6.3 8.2 11.1 11.7 13.7 17.1 16.9 14.7 14.9
Nigeria8 5.0 6.0 8.0 8.0 8.0 8.0 10.0 12.0 14.0 14.0
Gabon 0.3 0.3 0.9 1.4 5.0 7.3 9.3 11.3 11.3
Ethiopia 8.1 10.2 11.3 11.4 12.0 12.6 11.2 11.0 11.0
Others 39.1 50.2 49.9 50.1 50.2 58.3 74.5 82.4 92.2 106.4
Sub-total 581.9 625.2 629.0 655.8 682.4 698.5 779.9 812.6 821.0 853.7
Commonwealth of Independent States
Russian Federation 203.1 211.6 233.4 248.5 252.7 255.3 262.4 280.7 297.3 329.5
Uzbekistan 71.0 70.6 80.0 81.0 83.5 85.5 86.7 97.0 100.0 104.0
Kazakhstan 30.3 36.8 40.0 42.4 46.2 51.0 52.6 56.0 68.4 76.8
Kyrgyzstan 19.0 19.7 11.3 20.2 19.2 18.1 19.8 21.0 21.9 24.2
Others 9.6 9.0 8.2 8.7 9.1 11.9 12.6 18.8 18.7 23.8
Sub-total 332.9 347.8 373.0 400.8 410.7 421.8 434.1 473.6 504.5 558.2
Asia
China 351.1 371.2 413.3 438.4 462.0 460.3 463.7 429.4 404.1 383.2
Indonesia 134.6 108.5 82.6 91.0 93.5 113.2 108.8 116.1 141.5 82.6
Philippines 40.8 38.1 38.8 39.7 40.4 40.6 40.2 38.7 36.8 38.3
Turkey 16.6 24.1 29.5 33.6 31.4 28.4 24.6 24.7 22.9 37.0
Mongolia 14.0 13.3 14.0 19.7 32.0 32.8 21.3 22.5 22.6 16.3
Iran 5.0 6.0 6.0 7.0 10.0 11.0 11.0 11.0 11.0 11.0
Others 45.1 43.5 46.0 45.4 43.1 44.5 43.7 42.1 44.6 43.3
Sub-total 607.2 604.8 630.2 674.9 712.4 730.8 713.3 684.3 683.5 611.7
Oceania
Australia 256.7 258.7 250.4 267.1 274.0 279.2 287.7 292.5 317 325.1
Papua New Guinea 69.7 63.8 59.0 64.6 58.4 60.9 63.4 64.3 68.9 72.9
New Zealand 12.1 11.2 9.7 11.8 10.8 11.7 9.6 9.0 9.3 7.8
Others 2.0 3.4 3.6 3.1 2.0 1.6 1.6 1.6 1.6 1.6
Sub-total 340.4 337.2 322.7 346.6 345.2 353.3 362.2 367.5 396.7 407.5
2010 2011 2012 2013 2014 2015 2016 2017 2018 2019
THE GHANA CHAMBER OF MINES 2019 Industry Statistics & Data
GHANA CHAMBER OF MINES’ 2019 FACTOID Page 12
Global Total 2,793.6 2,880.8 2,959.1 3,118.1 3,202.9 3,289.5 3,397.3 3,493.6 3,561.3 3,533.7
Source: 2010-2019 - World Gold Council and Metal Focus (2020)
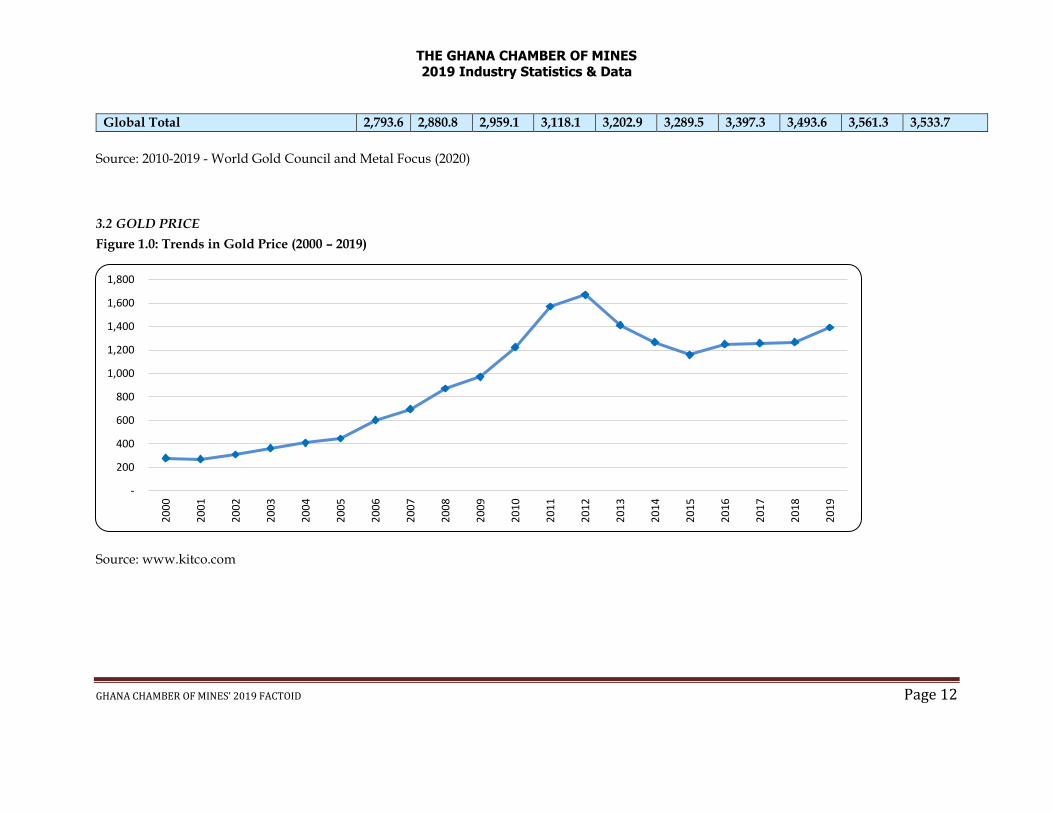
3.2 GOLD PRICE
Figure 1.0: Trends in Gold Price (2000 – 2019)
Source: www.kitco.com
-
200
400
600
800
1,000
1,200
1,400
1,600
1,800
20
00
20
01
20
02
20
03
20
04
20
05
20
06
20
07
20
08
20
09
20
10
20
11
20
12
20
13
20
14
20
15
20
16
20
17
20
18
20
19
THE GHANA CHAMBER OF MINES 2019 Industry Statistics & Data
GHANA CHAMBER OF MINES’ 2019 FACTOID Page 13
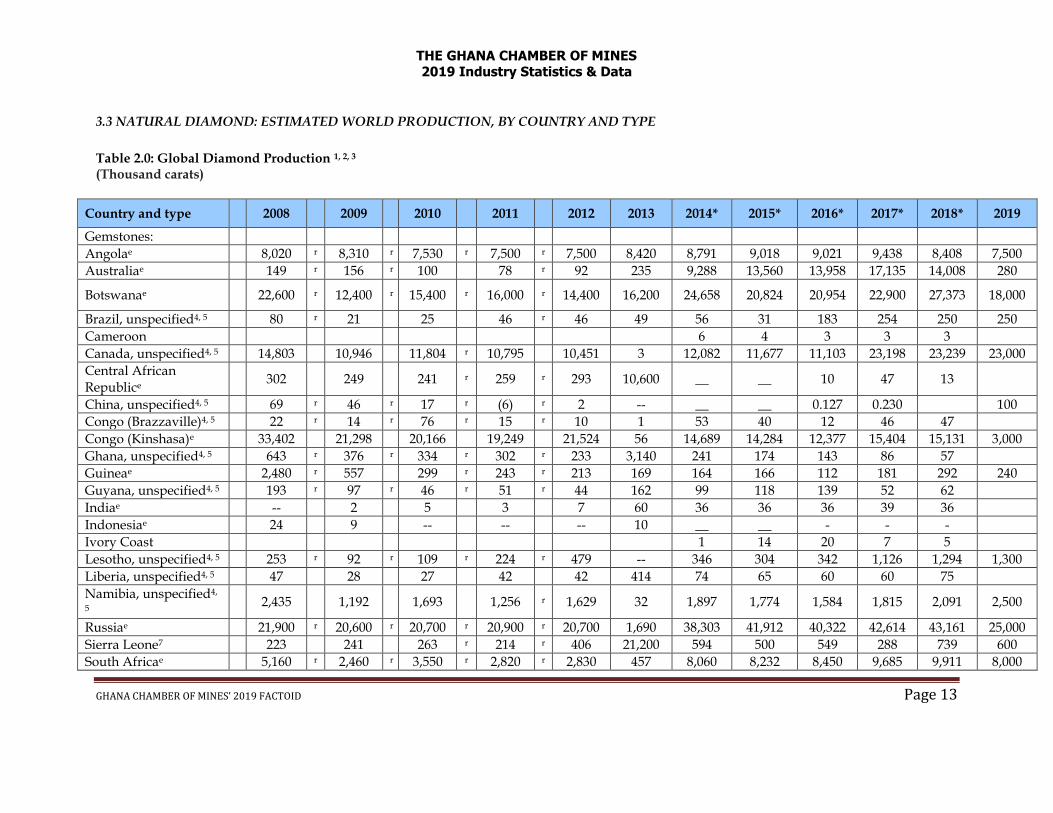
• 3.3 NATURAL DIAMOND: ESTIMATED WORLD PRODUCTION, BY COUNTRY AND TYPE
Table 2.0: Global Diamond Production 1, 2, 3 (Thousand carats)
Country and type 2008 2009 2010 2011 2012 2013 2014* 2015* 2016* 2017* 2018* 2019
Gemstones:
Angolae 8,020 r 8,310 r 7,530 r 7,500 r 7,500 8,420 8,791 9,018 9,021 9,438 8,408 7,500
Australiae 149 r 156 r 100 78 r 92 235 9,288 13,560 13,958 17,135 14,008 280
Botswanae 22,600 r 12,400 r 15,400 r 16,000 r 14,400 16,200 24,658 20,824 20,954 22,900 27,373 18,000
Brazil, unspecified4, 5 80 r 21 25 46 r 46 49 56 31 183 254 250 250
Cameroon 6 4 3 3 3
Canada, unspecified4, 5 14,803 10,946 11,804 r 10,795 10,451 3 12,082 11,677 11,103 23,198 23,239 23,000
Central African Republice
302 249 241 r 259 r 293 10,600 __ __ 10 47 13
China, unspecified4, 5 69 r 46 r 17 r (6) r 2 -- __ __ 0.127 0.230 100
Congo (Brazzaville)4, 5 22 r 14 r 76 r 15 r 10 1 53 40 12 46 47
Congo (Kinshasa)e 33,402 21,298 20,166 19,249 21,524 56 14,689 14,284 12,377 15,404 15,131 3,000
Ghana, unspecified4, 5 643 r 376 r 334 r 302 r 233 3,140 241 174 143 86 57
Guineae 2,480 r 557 299 r 243 r 213 169 164 166 112 181 292 240
Guyana, unspecified4, 5 193 r 97 r 46 r 51 r 44 162 99 118 139 52 62
Indiae -- 2 5 3 7 60 36 36 36 39 36
Indonesiae 24 9 -- -- -- 10 __ __ - - -
Ivory Coast 1 14 20 7 5
Lesotho, unspecified4, 5 253 r 92 r 109 r 224 r 479 -- 346 304 342 1,126 1,294 1,300
Liberia, unspecified4, 5 47 28 27 42 42 414 74 65 60 60 75
Namibia, unspecified4,
5 2,435 1,192 1,693 1,256 r 1,629 32 1,897 1,774 1,584 1,815 2,091 2,500
Russiae 21,900 r 20,600 r 20,700 r 20,900 r 20,700 1,690 38,303 41,912 40,322 42,614 43,161 25,000
Sierra Leone7 223 241 263 r 214 r 406 21,200 594 500 549 288 739 600
South Africae 5,160 r 2,460 r 3,550 r 2,820 r 2,830 457 8,060 8,232 8,450 9,685 9,911 8,000
THE GHANA CHAMBER OF MINES 2019 Industry Statistics & Data
GHANA CHAMBER OF MINES’ 2019 FACTOID Page 14
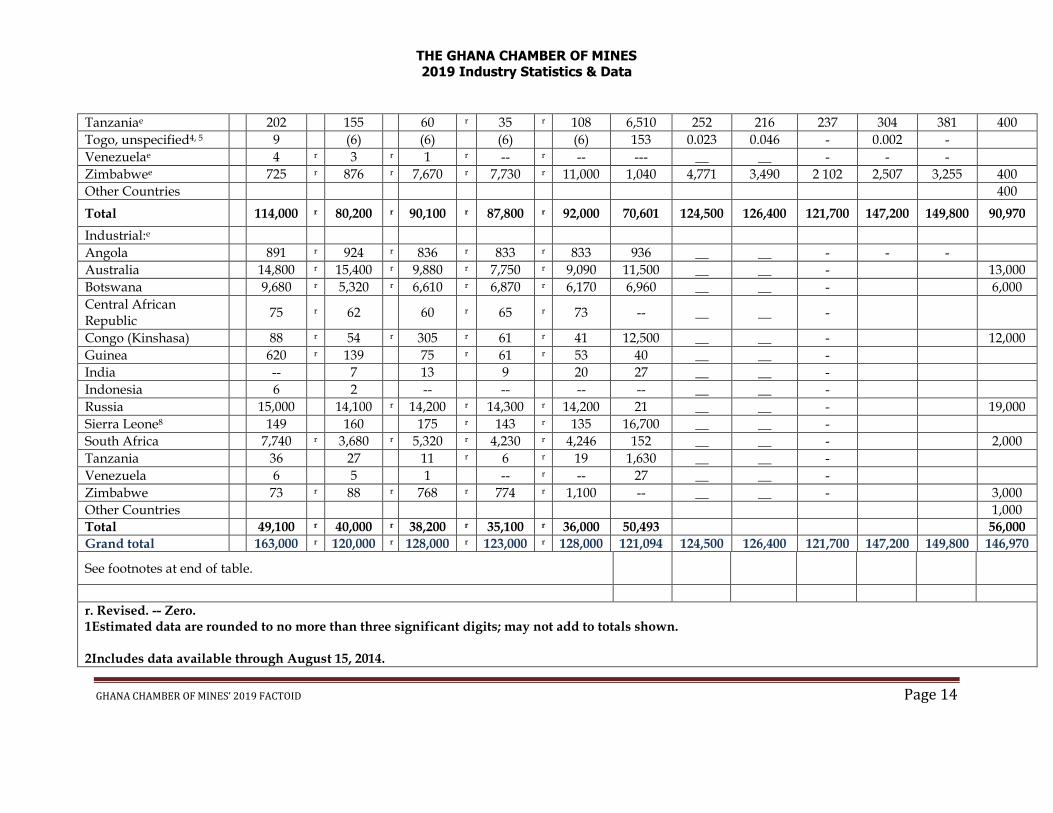
Tanzaniae 202 155 60 r 35 r 108 6,510 252 216 237 304 381 400
Togo, unspecified4, 5 9 (6) (6) (6) (6) 153 0.023 0.046 - 0.002 -
Venezuelae 4 r 3 r 1 r -- r -- --- __ __ - - -
Zimbabwee 725 r 876 r 7,670 r 7,730 r 11,000 1,040 4,771 3,490 2 102 2,507 3,255 400
Other Countries 400
Total 114,000 r 80,200 r 90,100 r 87,800 r 92,000 70,601 124,500 126,400 121,700 147,200 149,800 90,970
Industrial:e
Angola 891 r 924 r 836 r 833 r 833 936 __ __ - - -
Australia 14,800 r 15,400 r 9,880 r 7,750 r 9,090 11,500 __ __ - 13,000
Botswana 9,680 r 5,320 r 6,610 r 6,870 r 6,170 6,960 __ __ - 6,000
Central African Republic
75 r 62 60 r 65 r 73 -- __ __ -
Congo (Kinshasa) 88 r 54 r 305 r 61 r 41 12,500 __ __ - 12,000
Guinea 620 r 139 75 r 61 r 53 40 __ __ -
India -- 7 13 9 20 27 __ __ -
Indonesia 6 2 -- -- -- -- __ __ -
Russia 15,000 14,100 r 14,200 r 14,300 r 14,200 21 __ __ - 19,000
Sierra Leone8 149 160 175 r 143 r 135 16,700 __ __ -
South Africa 7,740 r 3,680 r 5,320 r 4,230 r 4,246 152 __ __ - 2,000
Tanzania 36 27 11 r 6 r 19 1,630 __ __ -
Venezuela 6 5 1 -- r -- 27 __ __ -
Zimbabwe 73 r 88 r 768 r 774 r 1,100 -- __ __ - 3,000
Other Countries 1,000
Total 49,100 r 40,000 r 38,200 r 35,100 r 36,000 50,493 56,000
Grand total 163,000 r 120,000 r 128,000 r 123,000 r 128,000 121,094 124,500 126,400 121,700 147,200 149,800 146,970
See footnotes at end of table.
r. Revised. -- Zero. 1Estimated data are rounded to no more than three significant digits; may not add to totals shown. 2Includes data available through August 15, 2014.

THE GHANA CHAMBER OF MINES 2019 Industry Statistics & Data
GHANA CHAMBER OF MINES’ 2019 FACTOID Page 15
3In addition to countries listed, Belarus, Germany, Ireland, Nigeria, the Republic of Korea, and Sweden produced natural diamond, but information is inadequate to formulate reliable estimates of output levels. 4About 90% gem quality and 10% industrial quality. 5About 2% gem quality and 98% industrial quality. 6About 70% gem and near gem quality and 30% industrial quality. 7Figures represent officially reported diamond output plus official Brazilian estimates of output by non-reporting miners.
Source: 2008 – 2013 & 2019 - U.S. Geological Survey 2014 - 2018: British Geological Survey (2020)
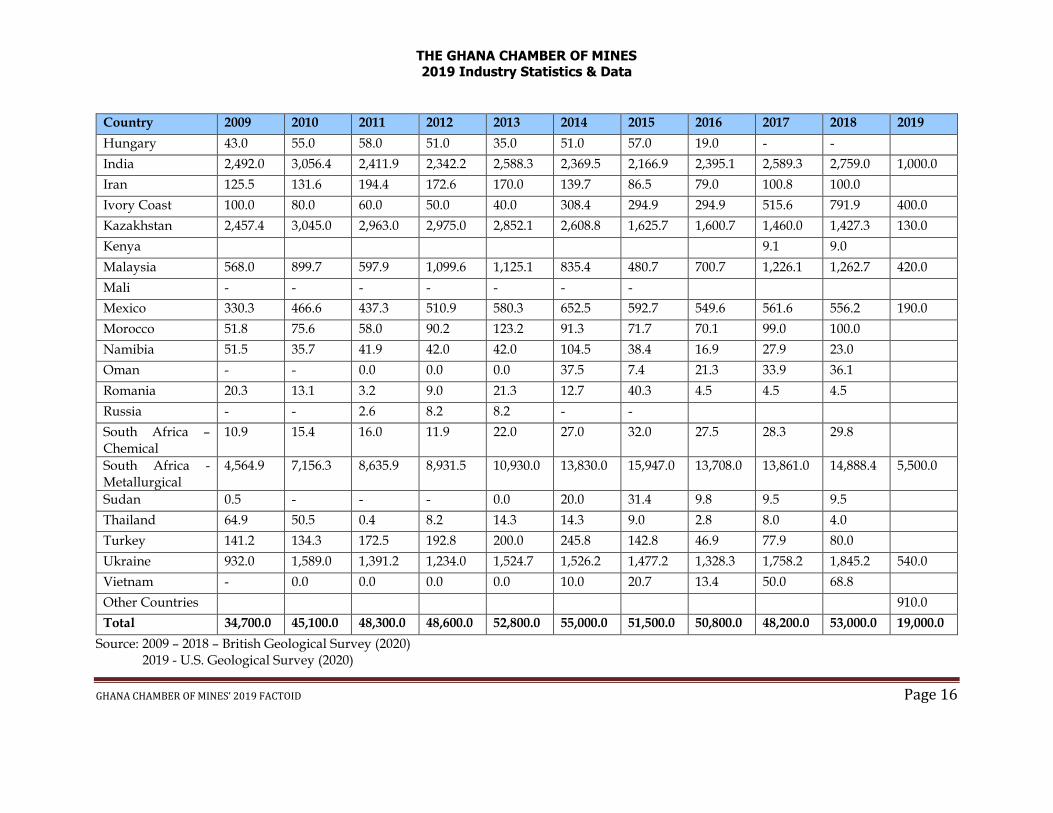
3.4 MANGANESE ORE: WORLD PRODUCTION, BY COUNTRY
Table 3.0: Global Manganese Production 1, 2 (Thousand Metric Tonnes)
Country 2009 2010 2011 2012 2013 2014 2015 2016 2017 2018 2019
Australia 4,445.0 6,474.0 6,960.8 7,179.0 7,448.0 7,587.2 6,281.4 5,327.5 6,172.3 7,210.9 3,200.0
Brazil 2,320.0 3,125.0 3,483.0 3,571.0 2,502.3 2,723.0 2,816.6 2,880.7 3,273.0 3,200.0 1,200.0
Bulgaria 28.3 106.0 85.6 39.1 103.6 93.7 46.5 41.7 2.0 -
Burkina Faso - 57.4 49.7 - - - 1.6
Burma 607.0 754.0 586.0 286.0 394.0 242.0 70.0 293.0 310.0 310.0 210.0
Chile 1.6 - - - - - -
China 12,000.0 13,000.0 14,000.0 14,500.0 15,500.0 15,500.0 13,000.0 15,528.0 8,500.0 9,000.0 1,300.0
Egypt 12.5 6.5 37.2 62.4 65.0 22.3
Gabon 1,992.1 3,200.6 3,831.2 3,363.2 4,091.4 4,081.0 4,184.0 3,413.0 4,163.0 4,330.0 2,400.0
Georgia 370.0 370.0 370.0 370.0 370.0 370.0 370.0 370.0 370.0 370.0 200.0
Ghana 1,012.9 1,194.1 1,827.7 1,490.6 2,003.2 1,531.4 1,562.8 2,018.3 3,003.6 4,551.8 1,400.0
THE GHANA CHAMBER OF MINES 2019 Industry Statistics & Data
GHANA CHAMBER OF MINES’ 2019 FACTOID Page 16
Country 2009 2010 2011 2012 2013 2014 2015 2016 2017 2018 2019
Hungary 43.0 55.0 58.0 51.0 35.0 51.0 57.0 19.0 - -
India 2,492.0 3,056.4 2,411.9 2,342.2 2,588.3 2,369.5 2,166.9 2,395.1 2,589.3 2,759.0 1,000.0
Iran 125.5 131.6 194.4 172.6 170.0 139.7 86.5 79.0 100.8 100.0
Ivory Coast 100.0 80.0 60.0 50.0 40.0 308.4 294.9 294.9 515.6 791.9 400.0
Kazakhstan 2,457.4 3,045.0 2,963.0 2,975.0 2,852.1 2,608.8 1,625.7 1,600.7 1,460.0 1,427.3 130.0
Kenya 9.1 9.0
Malaysia 568.0 899.7 597.9 1,099.6 1,125.1 835.4 480.7 700.7 1,226.1 1,262.7 420.0
Mali - - - - - - -
Mexico 330.3 466.6 437.3 510.9 580.3 652.5 592.7 549.6 561.6 556.2 190.0
Morocco 51.8 75.6 58.0 90.2 123.2 91.3 71.7 70.1 99.0 100.0
Namibia 51.5 35.7 41.9 42.0 42.0 104.5 38.4 16.9 27.9 23.0
Oman - - 0.0 0.0 0.0 37.5 7.4 21.3 33.9 36.1
Romania 20.3 13.1 3.2 9.0 21.3 12.7 40.3 4.5 4.5 4.5
Russia - - 2.6 8.2 8.2 - -
South Africa – Chemical
10.9 15.4 16.0 11.9 22.0 27.0 32.0 27.5 28.3 29.8
South Africa - Metallurgical
4,564.9 7,156.3 8,635.9 8,931.5 10,930.0 13,830.0 15,947.0 13,708.0 13,861.0 14,888.4 5,500.0
Sudan 0.5 - - - 0.0 20.0 31.4 9.8 9.5 9.5
Thailand 64.9 50.5 0.4 8.2 14.3 14.3 9.0 2.8 8.0 4.0
Turkey 141.2 134.3 172.5 192.8 200.0 245.8 142.8 46.9 77.9 80.0
Ukraine 932.0 1,589.0 1,391.2 1,234.0 1,524.7 1,526.2 1,477.2 1,328.3 1,758.2 1,845.2 540.0
Vietnam - 0.0 0.0 0.0 0.0 10.0 20.7 13.4 50.0 68.8
Other Countries 910.0
Total 34,700.0 45,100.0 48,300.0 48,600.0 52,800.0 55,000.0 51,500.0 50,800.0 48,200.0 53,000.0 19,000.0
Source: 2009 – 2018 – British Geological Survey (2020) 2019 - U.S. Geological Survey (2020)
THE GHANA CHAMBER OF MINES 2019 Industry Statistics & Data
GHANA CHAMBER OF MINES’ 2019 FACTOID Page 17
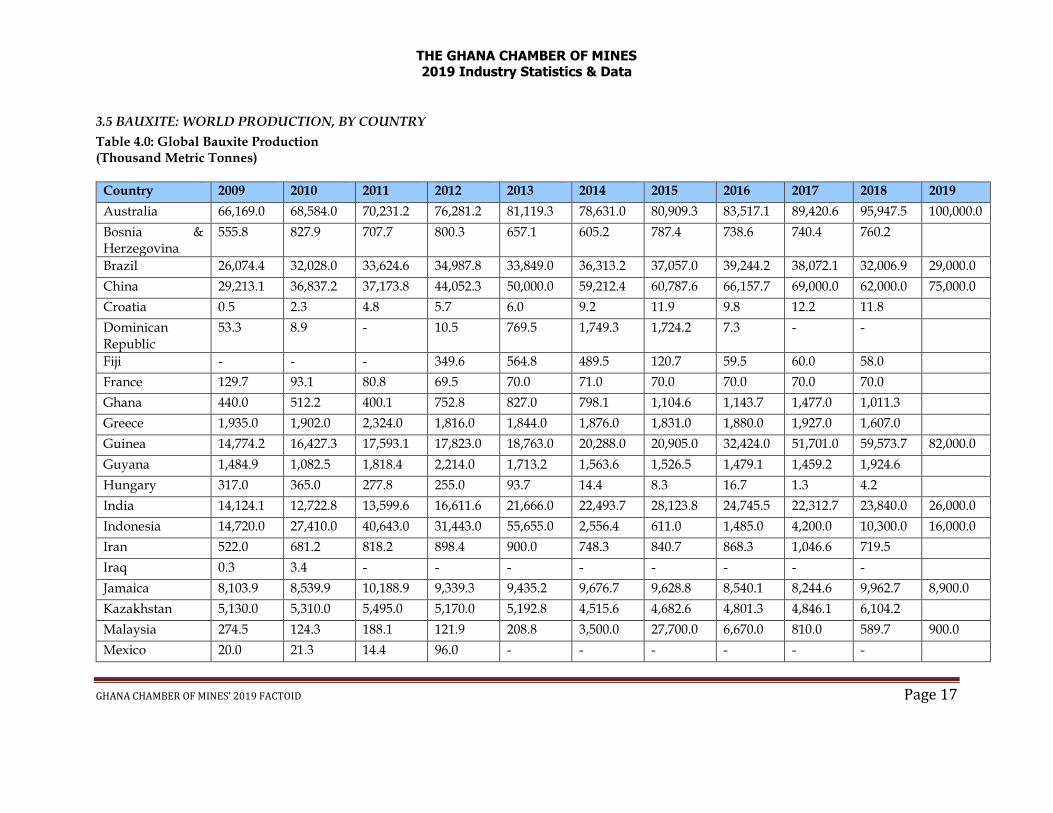
3.5 BAUXITE: WORLD PRODUCTION, BY COUNTRY
Table 4.0: Global Bauxite Production (Thousand Metric Tonnes)
Country 2009 2010 2011 2012 2013 2014 2015 2016 2017 2018 2019
Australia 66,169.0 68,584.0 70,231.2 76,281.2 81,119.3 78,631.0 80,909.3 83,517.1 89,420.6 95,947.5 100,000.0
Bosnia & Herzegovina
555.8 827.9 707.7 800.3 657.1 605.2 787.4 738.6 740.4 760.2
Brazil 26,074.4 32,028.0 33,624.6 34,987.8 33,849.0 36,313.2 37,057.0 39,244.2 38,072.1 32,006.9 29,000.0
China 29,213.1 36,837.2 37,173.8 44,052.3 50,000.0 59,212.4 60,787.6 66,157.7 69,000.0 62,000.0 75,000.0
Croatia 0.5 2.3 4.8 5.7 6.0 9.2 11.9 9.8 12.2 11.8
Dominican Republic
53.3 8.9 - 10.5 769.5 1,749.3 1,724.2 7.3 - -
Fiji - - - 349.6 564.8 489.5 120.7 59.5 60.0 58.0
France 129.7 93.1 80.8 69.5 70.0 71.0 70.0 70.0 70.0 70.0
Ghana 440.0 512.2 400.1 752.8 827.0 798.1 1,104.6 1,143.7 1,477.0 1,011.3
Greece 1,935.0 1,902.0 2,324.0 1,816.0 1,844.0 1,876.0 1,831.0 1,880.0 1,927.0 1,607.0
Guinea 14,774.2 16,427.3 17,593.1 17,823.0 18,763.0 20,288.0 20,905.0 32,424.0 51,701.0 59,573.7 82,000.0
Guyana 1,484.9 1,082.5 1,818.4 2,214.0 1,713.2 1,563.6 1,526.5 1,479.1 1,459.2 1,924.6
Hungary 317.0 365.0 277.8 255.0 93.7 14.4 8.3 16.7 1.3 4.2
India 14,124.1 12,722.8 13,599.6 16,611.6 21,666.0 22,493.7 28,123.8 24,745.5 22,312.7 23,840.0 26,000.0
Indonesia 14,720.0 27,410.0 40,643.0 31,443.0 55,655.0 2,556.4 611.0 1,485.0 4,200.0 10,300.0 16,000.0
Iran 522.0 681.2 818.2 898.4 900.0 748.3 840.7 868.3 1,046.6 719.5
Iraq 0.3 3.4 - - - - - - - -
Jamaica 8,103.9 8,539.9 10,188.9 9,339.3 9,435.2 9,676.7 9,628.8 8,540.1 8,244.6 9,962.7 8,900.0
Kazakhstan 5,130.0 5,310.0 5,495.0 5,170.0 5,192.8 4,515.6 4,682.6 4,801.3 4,846.1 6,104.2
Malaysia 274.5 124.3 188.1 121.9 208.8 3,500.0 27,700.0 6,670.0 810.0 589.7 900.0
Mexico 20.0 21.3 14.4 96.0 - - - - - -
THE GHANA CHAMBER OF MINES 2019 Industry Statistics & Data
GHANA CHAMBER OF MINES’ 2019 FACTOID Page 18
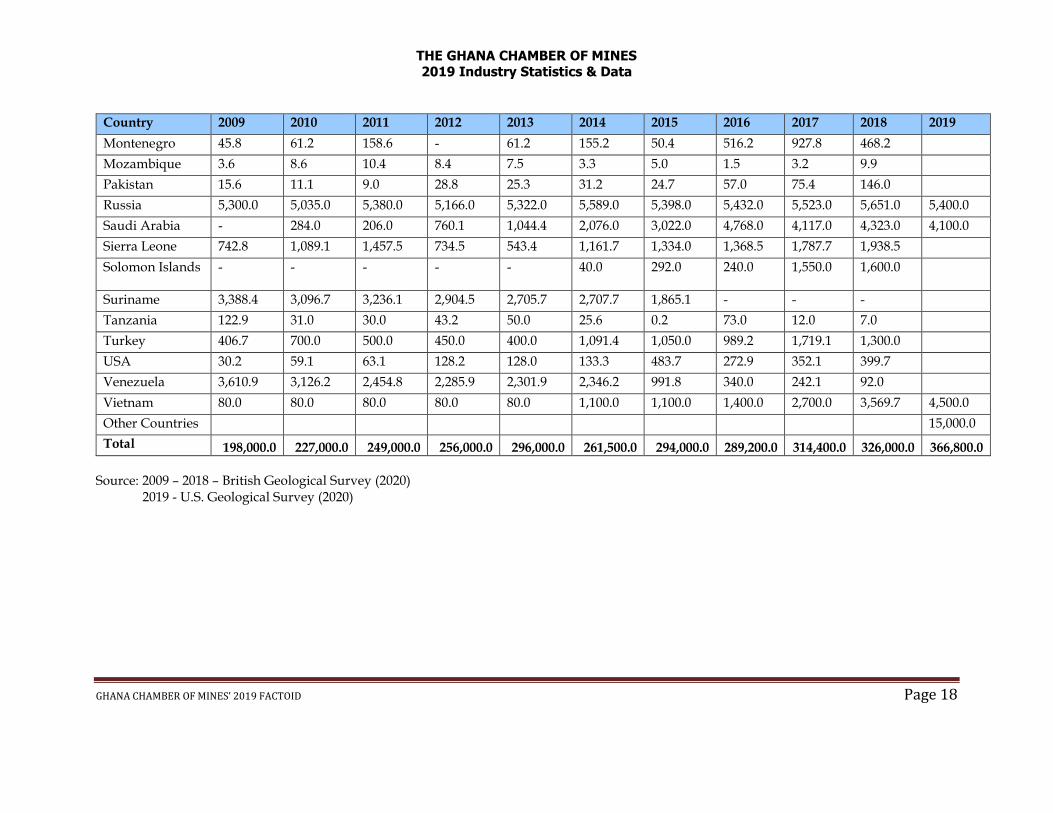
Country 2009 2010 2011 2012 2013 2014 2015 2016 2017 2018 2019
Montenegro 45.8 61.2 158.6 - 61.2 155.2 50.4 516.2 927.8 468.2
Mozambique 3.6 8.6 10.4 8.4 7.5 3.3 5.0 1.5 3.2 9.9
Pakistan 15.6 11.1 9.0 28.8 25.3 31.2 24.7 57.0 75.4 146.0
Russia 5,300.0 5,035.0 5,380.0 5,166.0 5,322.0 5,589.0 5,398.0 5,432.0 5,523.0 5,651.0 5,400.0
Saudi Arabia - 284.0 206.0 760.1 1,044.4 2,076.0 3,022.0 4,768.0 4,117.0 4,323.0 4,100.0
Sierra Leone 742.8 1,089.1 1,457.5 734.5 543.4 1,161.7 1,334.0 1,368.5 1,787.7 1,938.5
Solomon Islands - - - - - 40.0 292.0 240.0 1,550.0 1,600.0
Suriname 3,388.4 3,096.7 3,236.1 2,904.5 2,705.7 2,707.7 1,865.1 - - -
Tanzania 122.9 31.0 30.0 43.2 50.0 25.6 0.2 73.0 12.0 7.0
Turkey 406.7 700.0 500.0 450.0 400.0 1,091.4 1,050.0 989.2 1,719.1 1,300.0
USA 30.2 59.1 63.1 128.2 128.0 133.3 483.7 272.9 352.1 399.7
Venezuela 3,610.9 3,126.2 2,454.8 2,285.9 2,301.9 2,346.2 991.8 340.0 242.1 92.0
Vietnam 80.0 80.0 80.0 80.0 80.0 1,100.0 1,100.0 1,400.0 2,700.0 3,569.7 4,500.0
Other Countries 15,000.0
Total 198,000.0 227,000.0 249,000.0 256,000.0 296,000.0 261,500.0 294,000.0 289,200.0 314,400.0 326,000.0 366,800.0
Source: 2009 – 2018 – British Geological Survey (2020) 2019 - U.S. Geological Survey (2020)
THE GHANA CHAMBER OF MINES 2019 Industry Statistics & Data
GHANA CHAMBER OF MINES’ 2019 FACTOID Page 19
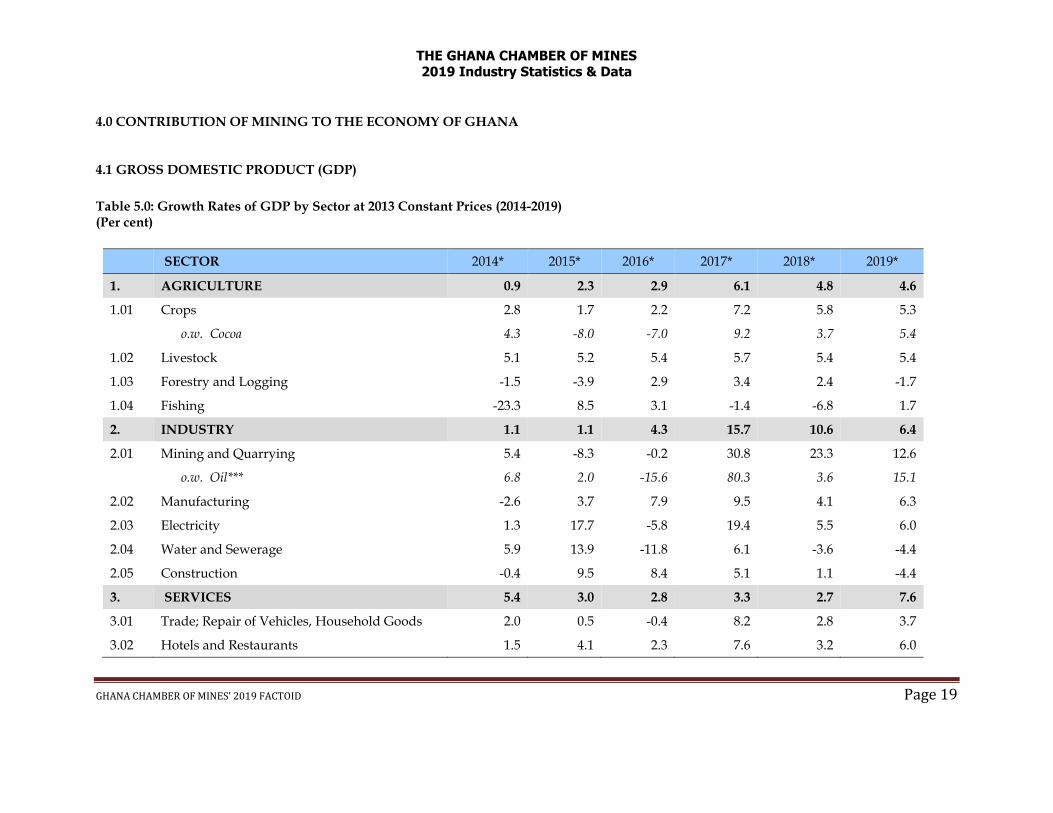
4.0 CONTRIBUTION OF MINING TO THE ECONOMY OF GHANA
4.1 GROSS DOMESTIC PRODUCT (GDP)
Table 5.0: Growth Rates of GDP by Sector at 2013 Constant Prices (2014-2019) (Per cent)
SECTOR 2014* 2015* 2016* 2017* 2018* 2019*
1. AGRICULTURE 0.9 2.3 2.9 6.1 4.8 4.6
1.01 Crops 2.8 1.7 2.2 7.2 5.8 5.3
o.w. Cocoa 4.3 -8.0 -7.0 9.2 3.7 5.4
1.02 Livestock 5.1 5.2 5.4 5.7 5.4 5.4
1.03 Forestry and Logging -1.5 -3.9 2.9 3.4 2.4 -1.7
1.04 Fishing -23.3 8.5 3.1 -1.4 -6.8 1.7
2. INDUSTRY 1.1 1.1 4.3 15.7 10.6 6.4
2.01 Mining and Quarrying 5.4 -8.3 -0.2 30.8 23.3 12.6
o.w. Oil*** 6.8 2.0 -15.6 80.3 3.6 15.1
2.02 Manufacturing -2.6 3.7 7.9 9.5 4.1 6.3
2.03 Electricity 1.3 17.7 -5.8 19.4 5.5 6.0
2.04 Water and Sewerage 5.9 13.9 -11.8 6.1 -3.6 -4.4
2.05 Construction -0.4 9.5 8.4 5.1 1.1 -4.4
3. SERVICES 5.4 3.0 2.8 3.3 2.7 7.6
3.01 Trade; Repair of Vehicles, Household Goods 2.0 0.5 -0.4 8.2 2.8 3.7
3.02 Hotels and Restaurants 1.5 4.1 2.3 7.6 3.2 6.0

THE GHANA CHAMBER OF MINES 2019 Industry Statistics & Data
GHANA CHAMBER OF MINES’ 2019 FACTOID Page 20
SECTOR 2014* 2015* 2016* 2017* 2018* 2019*
3.03 Transport and Storage 5.8 2.6 1.1 8.9 1.1 4.3
3.04 Information and communication 29.7 11.9 5.6 4.2 13.1 46.5
3.05 Financial and Insurance Activities 21.4 12.9 8.0 -17.7 -8.2 1.6
3.06 Real Estate -0.3 3.1 3.2 3.8 -6.5 19.9
3.07 Professional, Administrative & Support Service activities
6.8 1.4 -4.2 2.9 0.3 5.1
3.08 Public Administration & Defence; Social Security
-3.5 -2.6 8.9 4.2 4.3 3.7
3.09 Education -0.3 -0.5 2.3 6.3 3.9 9.4
3.10 Health and Social Work 2.7 -4.4 4.0 14.1 22.6 10.4
3.11 Other Service Activities 1.4 2.7 -0.1 5.3 3.1 2.6
4. GROSS DOMESTIC PRODUCT at basic prices
2.9 2.2 3.4 8.4 6.2 6.5
Net indirect Taxes 3.5 2.6 4.8 4.6 7.5 6.1
5. GROSS DOMESTIC PRODUCT in purchasers' value
2.9 2.2 3.4 8.1 6.3 6.5
ow informal GDP at purchasers' value 2.7 2.8 2.7 6.1 2.6 5.9
*provisional *** Oil means Oil and Gas
Source: Ghana Statistical Service
THE GHANA CHAMBER OF MINES 2019 Industry Statistics & Data
GHANA CHAMBER OF MINES’ 2019 FACTOID Page 21
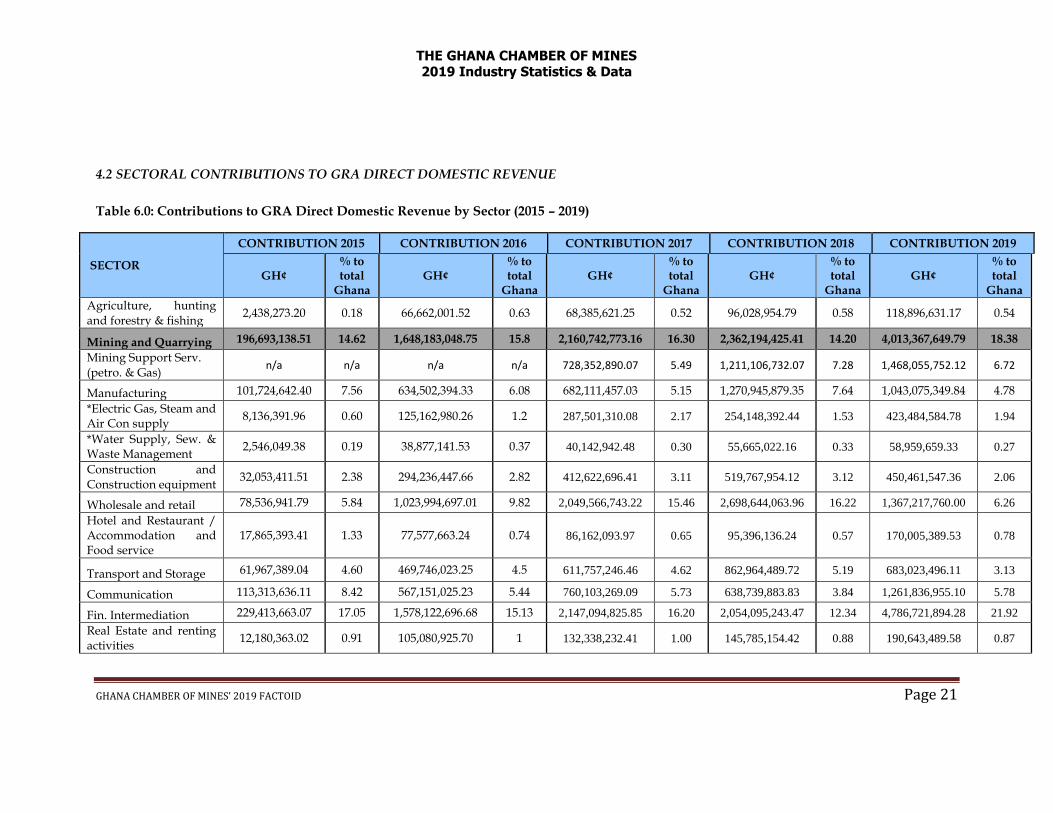
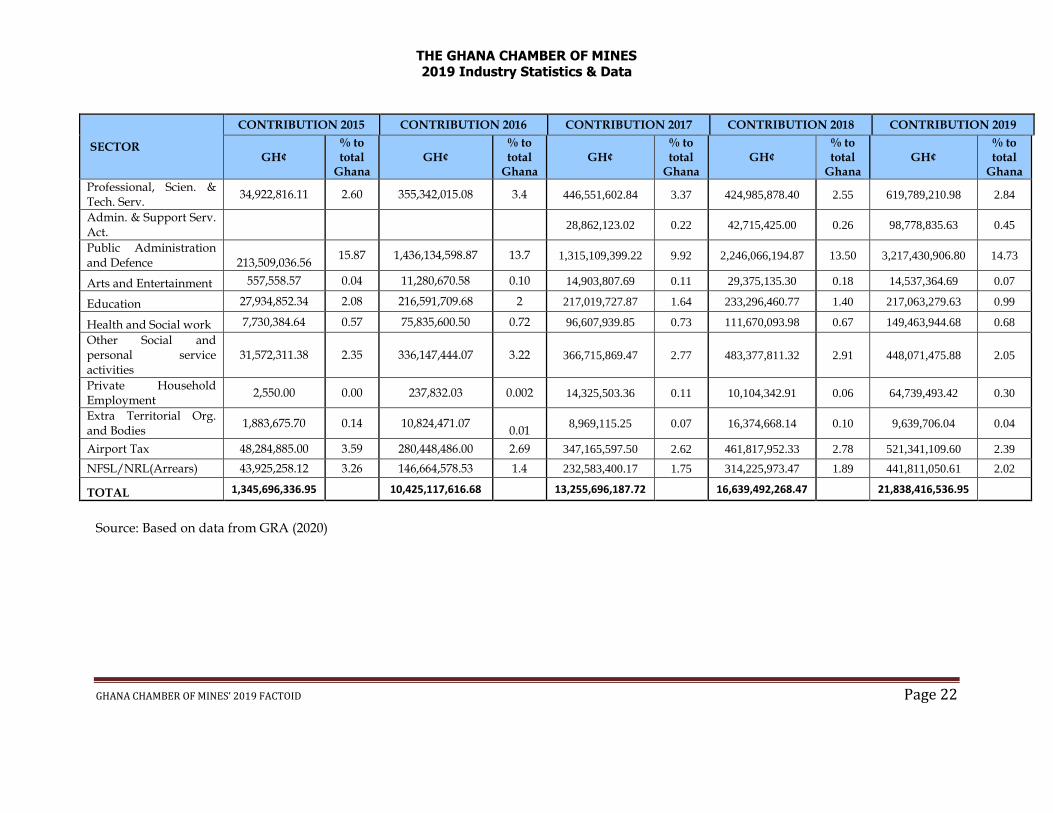
4.2 SECTORAL CONTRIBUTIONS TO GRA DIRECT DOMESTIC REVENUE
Table 6.0: Contributions to GRA Direct Domestic Revenue by Sector (2015 – 2019)
SECTOR
CONTRIBUTION 2015 CONTRIBUTION 2016 CONTRIBUTION 2017 CONTRIBUTION 2018 CONTRIBUTION 2019
GH¢ % to total
Ghana GH¢
% to total
Ghana GH¢
% to total
Ghana GH¢
% to total
Ghana GH¢
% to total
Ghana
Agriculture, hunting and forestry & fishing
2,438,273.20 0.18 66,662,001.52 0.63 68,385,621.25 0.52 96,028,954.79 0.58 118,896,631.17 0.54
Mining and Quarrying 196,693,138.51 14.62 1,648,183,048.75 15.8 2,160,742,773.16 16.30 2,362,194,425.41 14.20 4,013,367,649.79 18.38
Mining Support Serv. (petro. & Gas)
n/a n/a n/a n/a 728,352,890.07 5.49 1,211,106,732.07 7.28 1,468,055,752.12 6.72
Manufacturing 101,724,642.40 7.56 634,502,394.33 6.08 682,111,457.03 5.15 1,270,945,879.35 7.64 1,043,075,349.84 4.78
*Electric Gas, Steam and Air Con supply
8,136,391.96 0.60 125,162,980.26 1.2 287,501,310.08 2.17 254,148,392.44 1.53 423,484,584.78 1.94
*Water Supply, Sew. & Waste Management
2,546,049.38 0.19 38,877,141.53 0.37 40,142,942.48 0.30 55,665,022.16 0.33 58,959,659.33 0.27
Construction and Construction equipment
32,053,411.51 2.38 294,236,447.66 2.82 412,622,696.41 3.11 519,767,954.12 3.12 450,461,547.36 2.06
Wholesale and retail 78,536,941.79 5.84 1,023,994,697.01 9.82 2,049,566,743.22 15.46 2,698,644,063.96 16.22 1,367,217,760.00 6.26
Hotel and Restaurant / Accommodation and Food service
17,865,393.41 1.33 77,577,663.24 0.74 86,162,093.97 0.65 95,396,136.24 0.57 170,005,389.53 0.78
Transport and Storage 61,967,389.04 4.60 469,746,023.25 4.5 611,757,246.46 4.62 862,964,489.72 5.19 683,023,496.11 3.13
Communication 113,313,636.11 8.42 567,151,025.23 5.44 760,103,269.09 5.73 638,739,883.83 3.84 1,261,836,955.10 5.78
Fin. Intermediation 229,413,663.07 17.05 1,578,122,696.68 15.13 2,147,094,825.85 16.20 2,054,095,243.47 12.34 4,786,721,894.28 21.92
Real Estate and renting activities
12,180,363.02 0.91 105,080,925.70 1 132,338,232.41 1.00 145,785,154.42 0.88 190,643,489.58 0.87
THE GHANA CHAMBER OF MINES 2019 Industry Statistics & Data
GHANA CHAMBER OF MINES’ 2019 FACTOID Page 22
SECTOR
CONTRIBUTION 2015 CONTRIBUTION 2016 CONTRIBUTION 2017 CONTRIBUTION 2018 CONTRIBUTION 2019
GH¢ % to total
Ghana GH¢
% to total
Ghana GH¢
% to total
Ghana GH¢
% to total
Ghana GH¢
% to total
Ghana
Professional, Scien. & Tech. Serv.
34,922,816.11 2.60 355,342,015.08 3.4 446,551,602.84 3.37 424,985,878.40 2.55 619,789,210.98 2.84
Admin. & Support Serv. Act.
28,862,123.02 0.22 42,715,425.00 0.26 98,778,835.63 0.45
Public Administration and Defence
213,509,036.56
15.87 1,436,134,598.87 13.7 1,315,109,399.22 9.92 2,246,066,194.87 13.50 3,217,430,906.80 14.73
Arts and Entertainment 557,558.57 0.04 11,280,670.58 0.10 14,903,807.69 0.11 29,375,135.30 0.18 14,537,364.69 0.07
Education 27,934,852.34 2.08 216,591,709.68 2 217,019,727.87 1.64 233,296,460.77 1.40 217,063,279.63 0.99
Health and Social work 7,730,384.64 0.57 75,835,600.50 0.72 96,607,939.85 0.73 111,670,093.98 0.67 149,463,944.68 0.68
Other Social and personal service activities
31,572,311.38 2.35 336,147,444.07 3.22 366,715,869.47 2.77 483,377,811.32 2.91 448,071,475.88 2.05
Private Household Employment
2,550.00 0.00 237,832.03 0.002 14,325,503.36 0.11 10,104,342.91 0.06 64,739,493.42 0.30
Extra Territorial Org. and Bodies
1,883,675.70 0.14 10,824,471.07
0.01 8,969,115.25 0.07 16,374,668.14 0.10 9,639,706.04 0.04
Airport Tax 48,284,885.00 3.59 280,448,486.00 2.69 347,165,597.50 2.62 461,817,952.33 2.78 521,341,109.60 2.39
NFSL/NRL(Arrears) 43,925,258.12 3.26 146,664,578.53 1.4 232,583,400.17 1.75 314,225,973.47 1.89 441,811,050.61 2.02
TOTAL 1,345,696,336.95 10,425,117,616.68 13,255,696,187.72 16,639,492,268.47 21,838,416,536.95
Source: Based on data from GRA (2020)
THE GHANA CHAMBER OF MINES 2019 Industry Statistics & Data
GHANA CHAMBER OF MINES’ 2019 FACTOID Page 23
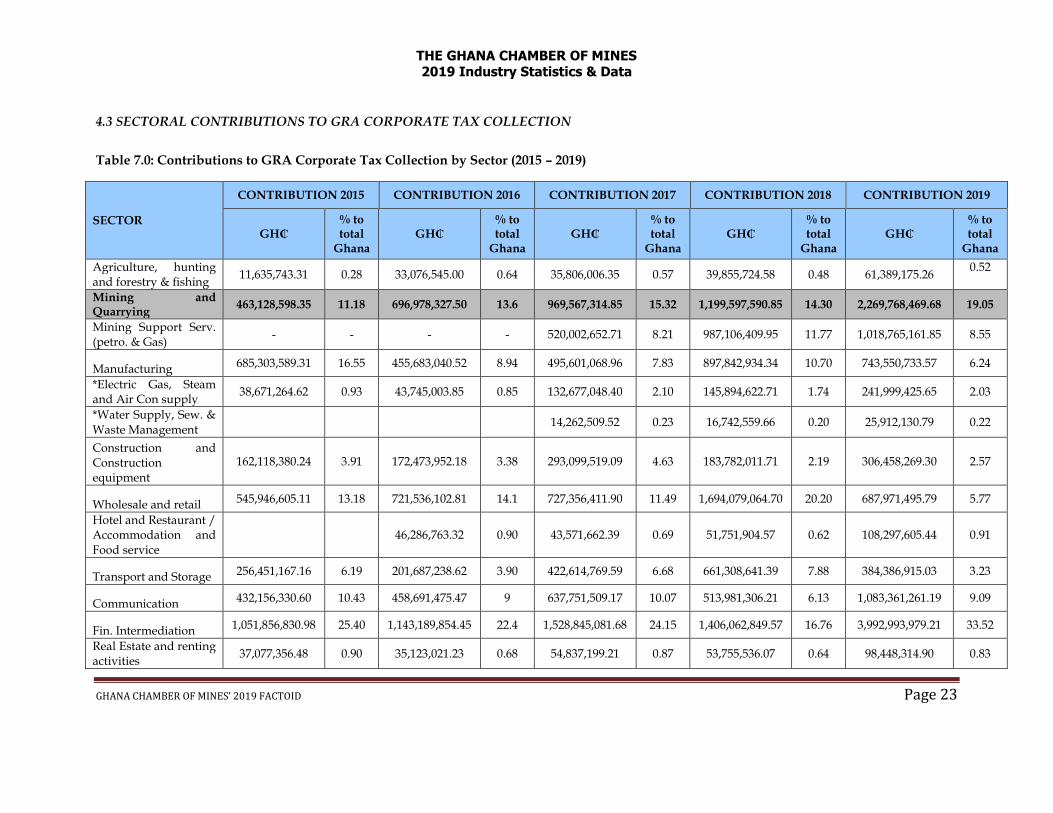
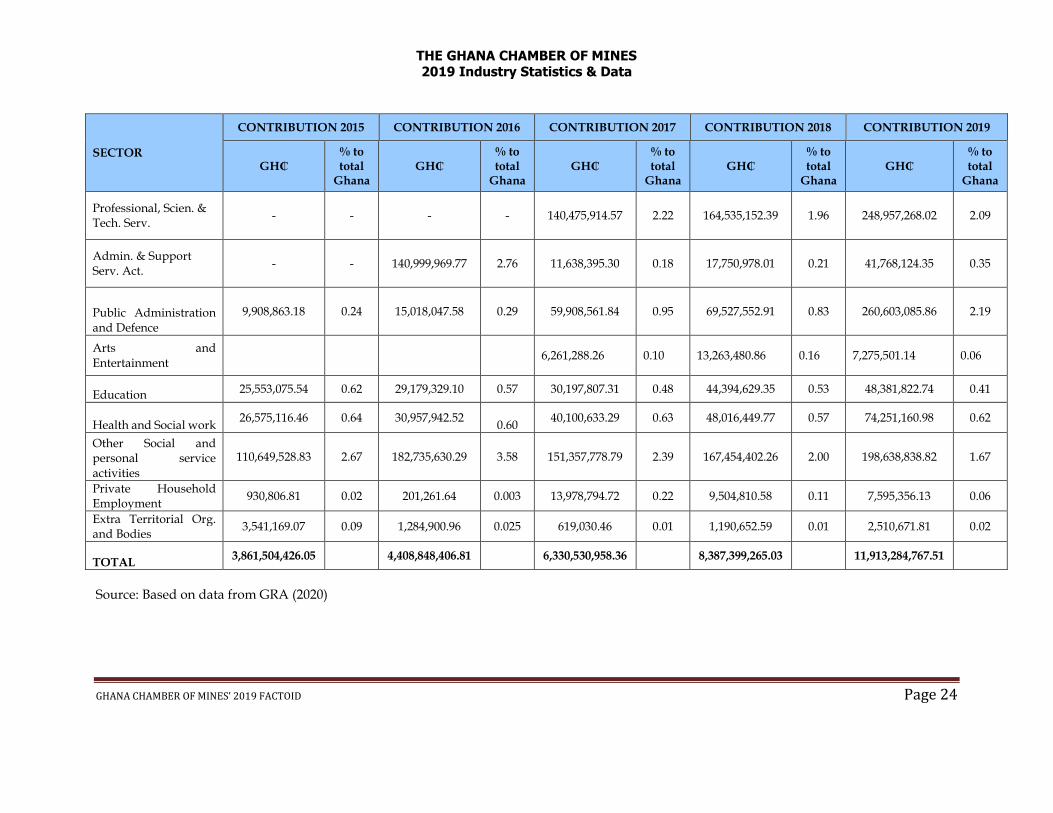
4.3 SECTORAL CONTRIBUTIONS TO GRA CORPORATE TAX COLLECTION
Table 7.0: Contributions to GRA Corporate Tax Collection by Sector (2015 – 2019)
SECTOR
CONTRIBUTION 2015 CONTRIBUTION 2016 CONTRIBUTION 2017 CONTRIBUTION 2018 CONTRIBUTION 2019
GH₵ % to total
Ghana GH₵
% to total
Ghana GH₵
% to total
Ghana GH₵
% to total
Ghana GH₵
% to total
Ghana
Agriculture, hunting and forestry & fishing
11,635,743.31 0.28 33,076,545.00 0.64 35,806,006.35 0.57 39,855,724.58 0.48 61,389,175.26 0.52
Mining and Quarrying
463,128,598.35 11.18 696,978,327.50 13.6 969,567,314.85 15.32 1,199,597,590.85 14.30 2,269,768,469.68 19.05
Mining Support Serv. (petro. & Gas)
- - - - 520,002,652.71 8.21 987,106,409.95 11.77 1,018,765,161.85 8.55
Manufacturing 685,303,589.31 16.55 455,683,040.52 8.94 495,601,068.96 7.83 897,842,934.34 10.70 743,550,733.57 6.24
*Electric Gas, Steam and Air Con supply
38,671,264.62 0.93 43,745,003.85 0.85 132,677,048.40 2.10 145,894,622.71 1.74 241,999,425.65 2.03
*Water Supply, Sew. & Waste Management
14,262,509.52 0.23 16,742,559.66 0.20 25,912,130.79 0.22
Construction and Construction equipment
162,118,380.24 3.91 172,473,952.18 3.38 293,099,519.09 4.63 183,782,011.71 2.19 306,458,269.30 2.57
Wholesale and retail 545,946,605.11 13.18 721,536,102.81 14.1 727,356,411.90 11.49 1,694,079,064.70 20.20 687,971,495.79 5.77
Hotel and Restaurant / Accommodation and Food service
46,286,763.32 0.90 43,571,662.39 0.69 51,751,904.57 0.62 108,297,605.44 0.91
Transport and Storage 256,451,167.16 6.19 201,687,238.62 3.90 422,614,769.59 6.68 661,308,641.39 7.88 384,386,915.03 3.23
Communication 432,156,330.60 10.43 458,691,475.47 9 637,751,509.17 10.07 513,981,306.21 6.13 1,083,361,261.19 9.09
Fin. Intermediation 1,051,856,830.98 25.40 1,143,189,854.45 22.4 1,528,845,081.68 24.15 1,406,062,849.57 16.76 3,992,993,979.21 33.52
Real Estate and renting activities
37,077,356.48 0.90 35,123,021.23 0.68 54,837,199.21 0.87 53,755,536.07 0.64 98,448,314.90 0.83
THE GHANA CHAMBER OF MINES 2019 Industry Statistics & Data
GHANA CHAMBER OF MINES’ 2019 FACTOID Page 24
SECTOR
CONTRIBUTION 2015 CONTRIBUTION 2016 CONTRIBUTION 2017 CONTRIBUTION 2018 CONTRIBUTION 2019
GH₵ % to total
Ghana GH₵
% to total
Ghana GH₵
% to total
Ghana GH₵
% to total
Ghana GH₵
% to total
Ghana
Professional, Scien. & Tech. Serv.
- - - - 140,475,914.57 2.22 164,535,152.39 1.96 248,957,268.02 2.09
Admin. & Support Serv. Act.
- - 140,999,969.77 2.76 11,638,395.30 0.18 17,750,978.01 0.21 41,768,124.35 0.35
Public Administration and Defence
9,908,863.18 0.24 15,018,047.58 0.29 59,908,561.84 0.95 69,527,552.91 0.83 260,603,085.86 2.19
Arts and Entertainment
6,261,288.26 0.10 13,263,480.86 0.16 7,275,501.14 0.06
Education 25,553,075.54 0.62 29,179,329.10 0.57 30,197,807.31 0.48 44,394,629.35 0.53 48,381,822.74 0.41
Health and Social work 26,575,116.46 0.64 30,957,942.52
0.60
40,100,633.29 0.63 48,016,449.77 0.57 74,251,160.98 0.62
Other Social and personal service activities
110,649,528.83 2.67 182,735,630.29 3.58 151,357,778.79 2.39 167,454,402.26 2.00 198,638,838.82 1.67
Private Household Employment
930,806.81 0.02 201,261.64 0.003 13,978,794.72 0.22 9,504,810.58 0.11 7,595,356.13 0.06
Extra Territorial Org. and Bodies
3,541,169.07 0.09 1,284,900.96 0.025 619,030.46 0.01 1,190,652.59 0.01 2,510,671.81 0.02
TOTAL 3,861,504,426.05 4,408,848,406.81 6,330,530,958.36 8,387,399,265.03 11,913,284,767.51
Source: Based on data from GRA (2020)

THE GHANA CHAMBER OF MINES 2019 Industry Statistics & Data
GHANA CHAMBER OF MINES’ 2019 FACTOID Page 25
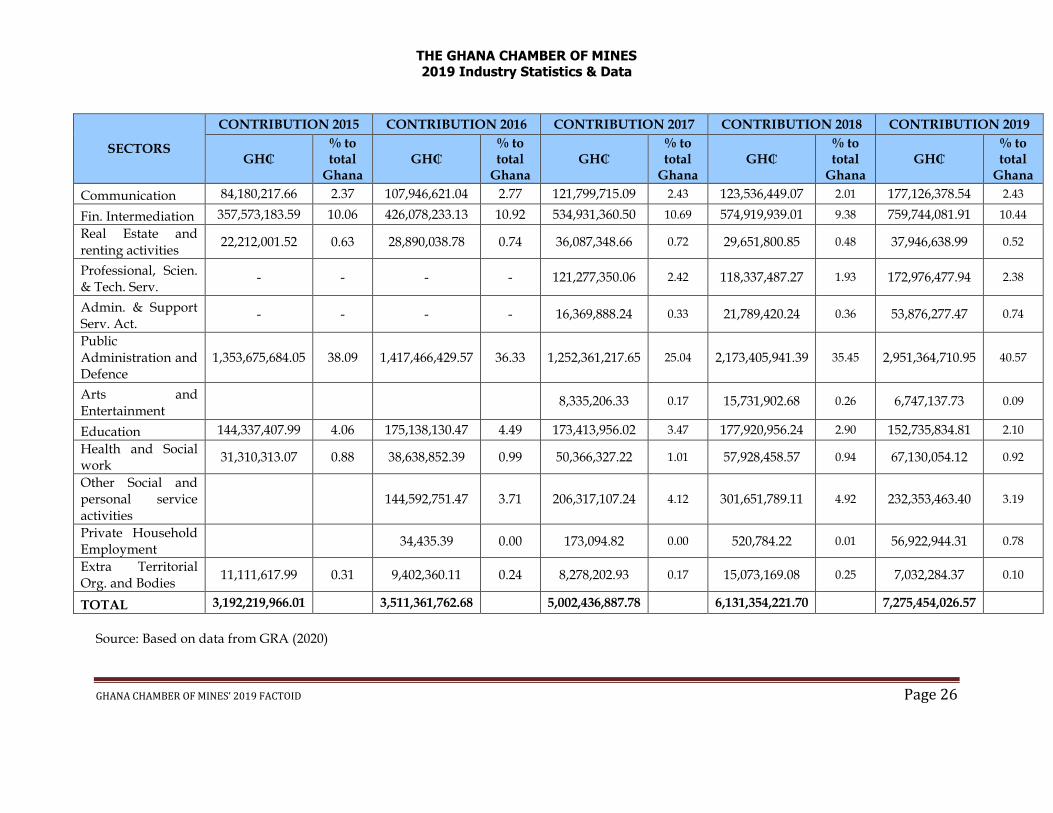
4.4 SECTORAL CONTRIBUTION TO GRA PAYE COLLECTION
Table 8.0: Contribution to GRA PAYE Collection by Sector (2019 -2019)
SECTORS
CONTRIBUTION 2015 CONTRIBUTION 2016 CONTRIBUTION 2017 CONTRIBUTION 2018 CONTRIBUTION 2019
GH₵ % to total
Ghana GH₵
% to total
Ghana GH₵
% to total
Ghana GH₵
% to total
Ghana GH₵
% to total
Ghana
Agriculture, hunting and forestry & fishing
122,592,697.20 3.45 31,520,667.22 0.81 29,796,506.05 0.60 54,340,284.72 0.89 56,083,552.83 0.77
Mining and Quarrying
404,743,477.20 11.39 399,925,811.85 10.25 487,988,013.45 9.76 457,156,176.86 7.46 736,256,367.48 10.12
Mining Support Serv. (petro. & Gas)
- - - - 208,085,748.64 4.16 223,490,788.57 3.65 449,006,848.45 6.17
Manufacturing 270,223,909.35 7.60 174,846,314.26 4.48 182,237,147.36 3.64 366,760,788.70 5.98 291,980,438.69 4.01
*Electric Gas, Steam and Air Con supply
76,069,727.10 2.14 80,628,239.38 2.07 154,271,130.59 3.08 107,865,775.94 1.76 180,605,755.01 2.48
*Water Supply, Sew. & Waste Management
25,489,436.68 0.51 37,622,869.16 0.61 31,833,377.13 0.44
Construction and Construction equipment
76,771,025.59 2.16 103,228,323.51 2.65 106,001,350.43 2.12 317,121,308.76 5.17 124,367,925.43 1.71
Wholesale and retail
136,993,182.60 3.85 218,889,371.09 5.61 1,081,058,865.49 21.61 742,162,740.97 12.10 403,562,709.14 5.55
Hotel and Restaurant / Accommodation and Food service
- - 26,951,888.42 0.69 36,943,064.84 0.74 37,877,517.06 0.62 53,001,106.42 0.73
Transport and Storage
100,425,521.10 2.83 127,183,294.60 3.26 160,854,849.49 3.22 176,487,873.23 2.88 272,799,661.45 3.75
THE GHANA CHAMBER OF MINES 2019 Industry Statistics & Data
GHANA CHAMBER OF MINES’ 2019 FACTOID Page 26
SECTORS
CONTRIBUTION 2015 CONTRIBUTION 2016 CONTRIBUTION 2017 CONTRIBUTION 2018 CONTRIBUTION 2019
GH₵ % to total
Ghana GH₵
% to total
Ghana GH₵
% to total
Ghana GH₵
% to total
Ghana GH₵
% to total
Ghana
Communication 84,180,217.66 2.37 107,946,621.04 2.77 121,799,715.09 2.43 123,536,449.07 2.01 177,126,378.54 2.43
Fin. Intermediation 357,573,183.59 10.06 426,078,233.13 10.92 534,931,360.50 10.69 574,919,939.01 9.38 759,744,081.91 10.44
Real Estate and renting activities
22,212,001.52 0.63 28,890,038.78 0.74 36,087,348.66 0.72 29,651,800.85 0.48 37,946,638.99 0.52
Professional, Scien. & Tech. Serv.
- - - - 121,277,350.06 2.42 118,337,487.27 1.93 172,976,477.94 2.38
Admin. & Support Serv. Act.
- - - - 16,369,888.24 0.33 21,789,420.24 0.36 53,876,277.47 0.74
Public Administration and Defence
1,353,675,684.05 38.09 1,417,466,429.57 36.33 1,252,361,217.65 25.04 2,173,405,941.39 35.45 2,951,364,710.95 40.57
Arts and Entertainment
8,335,206.33 0.17 15,731,902.68 0.26 6,747,137.73 0.09
Education 144,337,407.99 4.06 175,138,130.47 4.49 173,413,956.02 3.47 177,920,956.24 2.90 152,735,834.81 2.10
Health and Social work
31,310,313.07 0.88 38,638,852.39 0.99 50,366,327.22 1.01 57,928,458.57 0.94 67,130,054.12 0.92
Other Social and personal service activities
144,592,751.47 3.71 206,317,107.24 4.12 301,651,789.11 4.92 232,353,463.40 3.19
Private Household Employment
34,435.39 0.00 173,094.82 0.00 520,784.22 0.01 56,922,944.31 0.78
Extra Territorial Org. and Bodies
11,111,617.99 0.31 9,402,360.11 0.24 8,278,202.93 0.17 15,073,169.08 0.25 7,032,284.37 0.10
TOTAL 3,192,219,966.01 3,511,361,762.68 5,002,436,887.78 6,131,354,221.70 7,275,454,026.57
Source: Based on data from GRA (2020)
THE GHANA CHAMBER OF MINES 2019 Industry Statistics & Data
GHANA CHAMBER OF MINES’ 2019 FACTOID Page 27
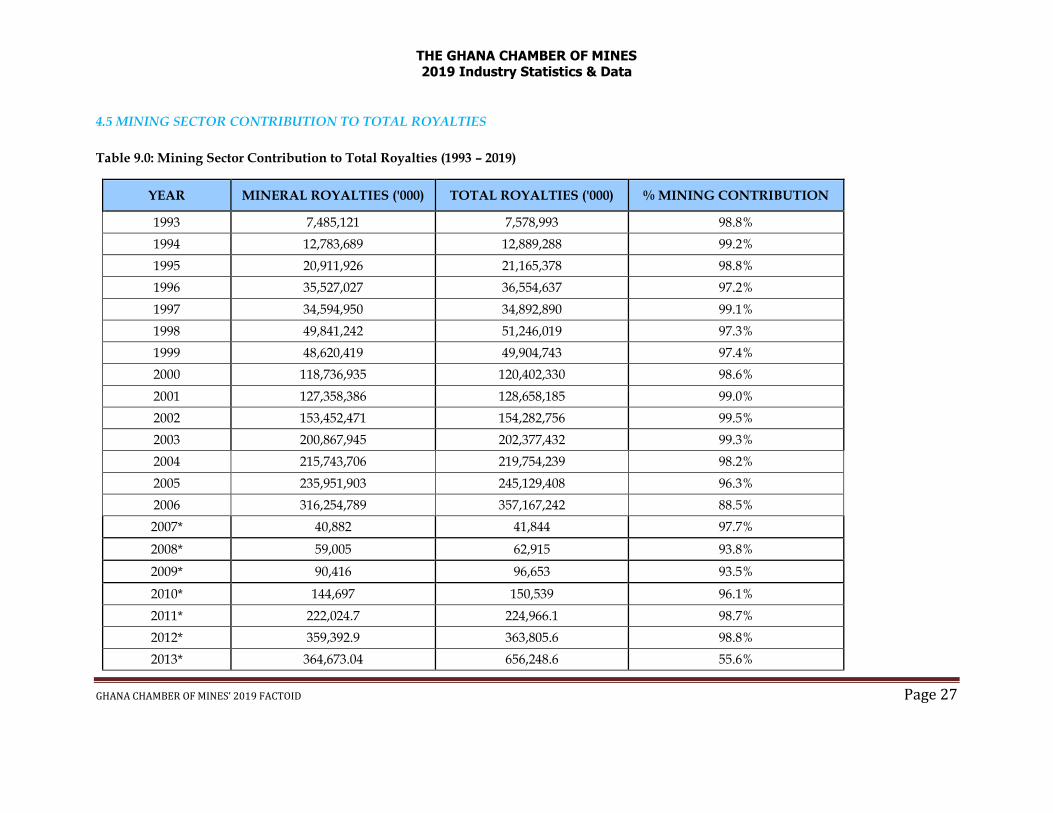
4.5 MINING SECTOR CONTRIBUTION TO TOTAL ROYALTIES
Table 9.0: Mining Sector Contribution to Total Royalties (1993 – 2019)
YEAR MINERAL ROYALTIES ('000) TOTAL ROYALTIES ('000) % MINING CONTRIBUTION
1993 7,485,121 7,578,993 98.8%
1994 12,783,689 12,889,288 99.2%
1995 20,911,926 21,165,378 98.8%
1996 35,527,027 36,554,637 97.2%
1997 34,594,950 34,892,890 99.1%
1998 49,841,242 51,246,019 97.3%
1999 48,620,419 49,904,743 97.4%
2000 118,736,935 120,402,330 98.6%
2001 127,358,386 128,658,185 99.0%
2002 153,452,471 154,282,756 99.5%
2003 200,867,945 202,377,432 99.3%
2004 215,743,706 219,754,239 98.2%
2005 235,951,903 245,129,408 96.3%
2006 316,254,789 357,167,242 88.5%
2007* 40,882 41,844 97.7%
2008* 59,005 62,915 93.8%
2009* 90,416 96,653 93.5%
2010* 144,697 150,539 96.1%
2011* 222,024.7 224,966.1 98.7%
2012* 359,392.9 363,805.6 98.8%
2013* 364,673.04 656,248.6 55.6%
THE GHANA CHAMBER OF MINES 2019 Industry Statistics & Data
GHANA CHAMBER OF MINES’ 2019 FACTOID Page 28
YEAR MINERAL ROYALTIES ('000) TOTAL ROYALTIES ('000) % MINING CONTRIBUTION
2014* 470,356.95 1,061,350.97 44.3%
2015* 485,632.66 1,128,321.10 43.0%
2016* 550,738.65 - -
2017* 702,407.28 - -
2018* 705,262.16 - -
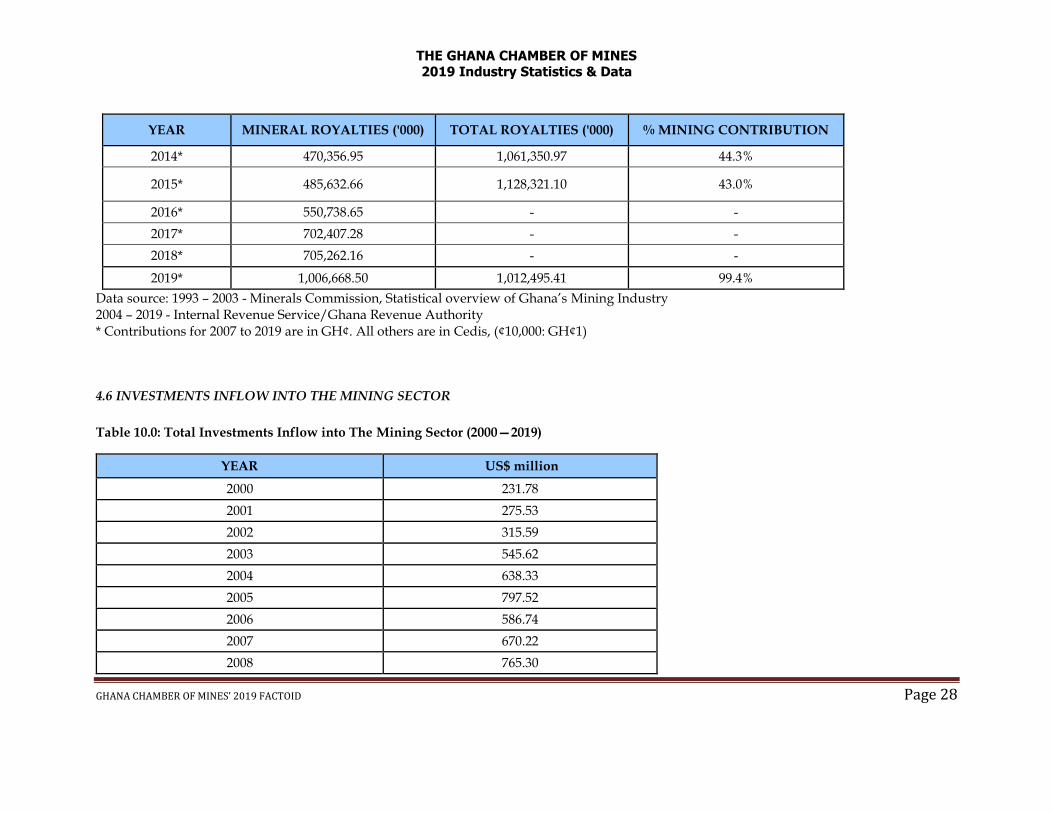
2019* 1,006,668.50 1,012,495.41 99.4%
Data source: 1993 – 2003 - Minerals Commission, Statistical overview of Ghana’s Mining Industry 2004 – 2019 - Internal Revenue Service/Ghana Revenue Authority * Contributions for 2007 to 2019 are in GH¢. All others are in Cedis, (¢10,000: GH¢1)
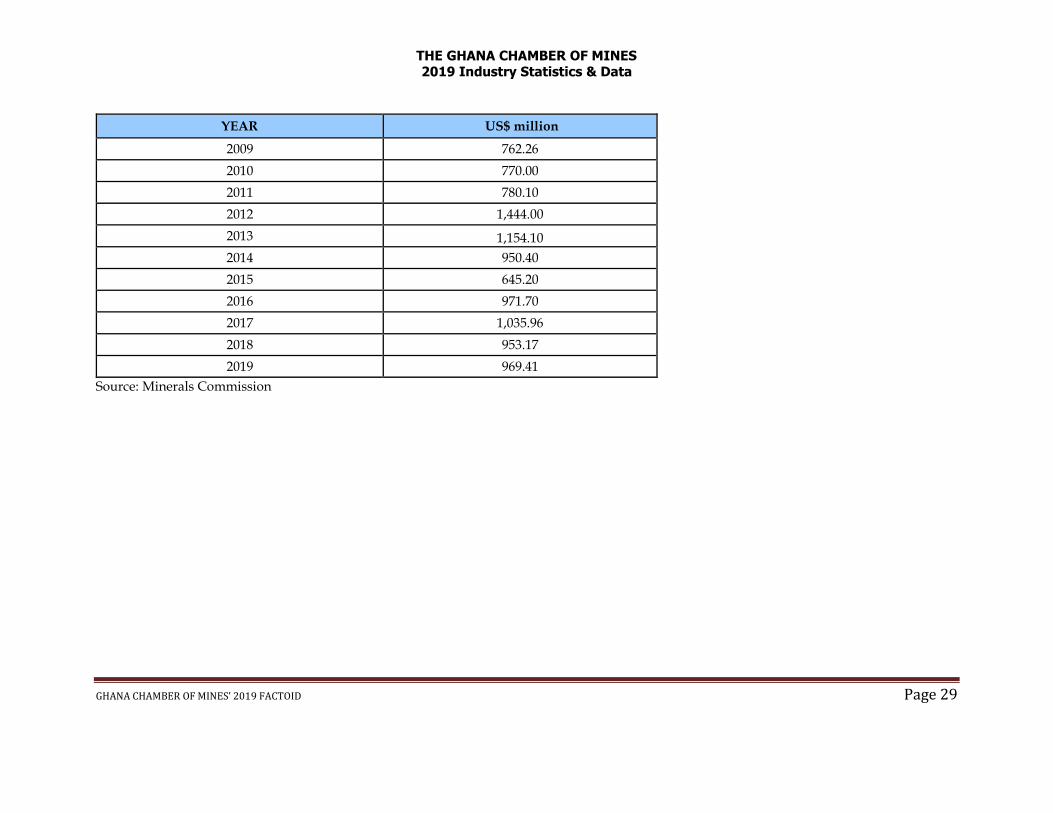
4.6 INVESTMENTS INFLOW INTO THE MINING SECTOR
Table 10.0: Total Investments Inflow into The Mining Sector (2000—2019)
YEAR US$ million
2000 231.78
2001 275.53
2002 315.59
2003 545.62
2004 638.33
2005 797.52
2006 586.74
2007 670.22
2008 765.30
THE GHANA CHAMBER OF MINES 2019 Industry Statistics & Data
GHANA CHAMBER OF MINES’ 2019 FACTOID Page 29
YEAR US$ million
2009 762.26
2010 770.00
2011 780.10
2012 1,444.00
2013 1,154.10
2014 950.40
2015 645.20
2016 971.70
2017 1,035.96
2018 953.17
2019 969.41
Source: Minerals Commission
THE GHANA CHAMBER OF MINES 2019 Industry Statistics & Data
GHANA CHAMBER OF MINES’ 2019 FACTOID Page 30
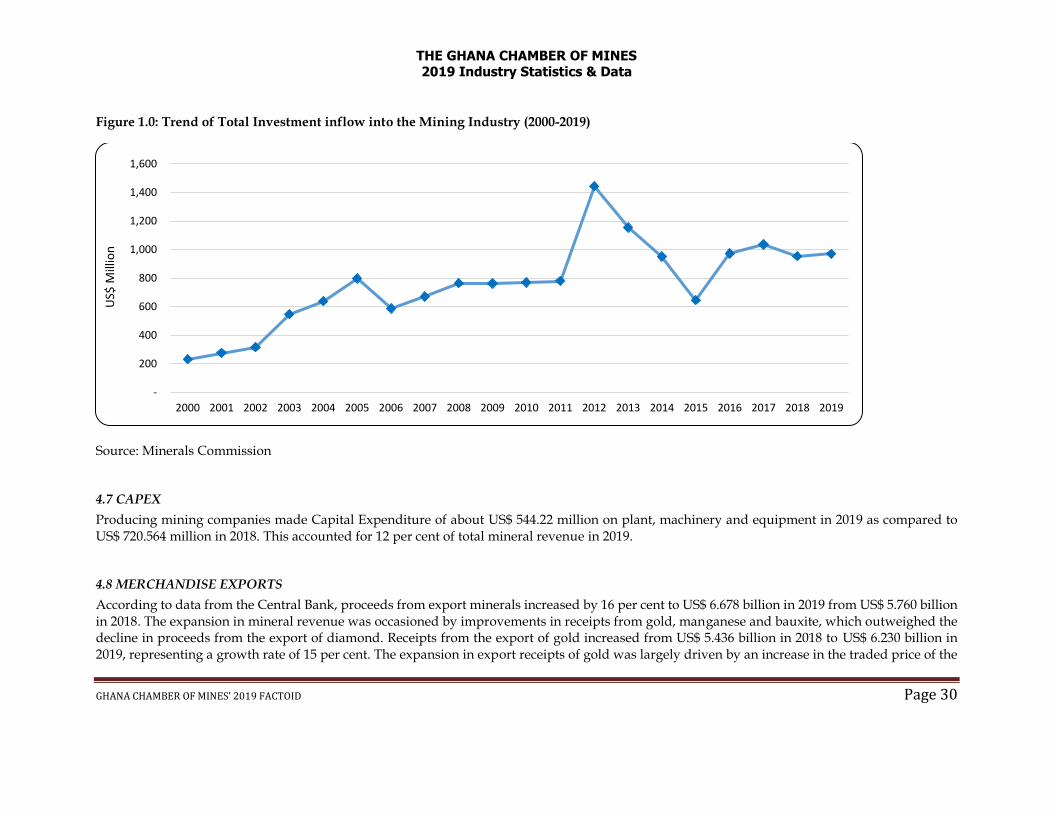
Figure 1.0: Trend of Total Investment inflow into the Mining Industry (2000-2019)
Source: Minerals Commission
4.7 CAPEX
Producing mining companies made Capital Expenditure of about US$ 544.22 million on plant, machinery and equipment in 2019 as compared to US$ 720.564 million in 2018. This accounted for 12 per cent of total mineral revenue in 2019.
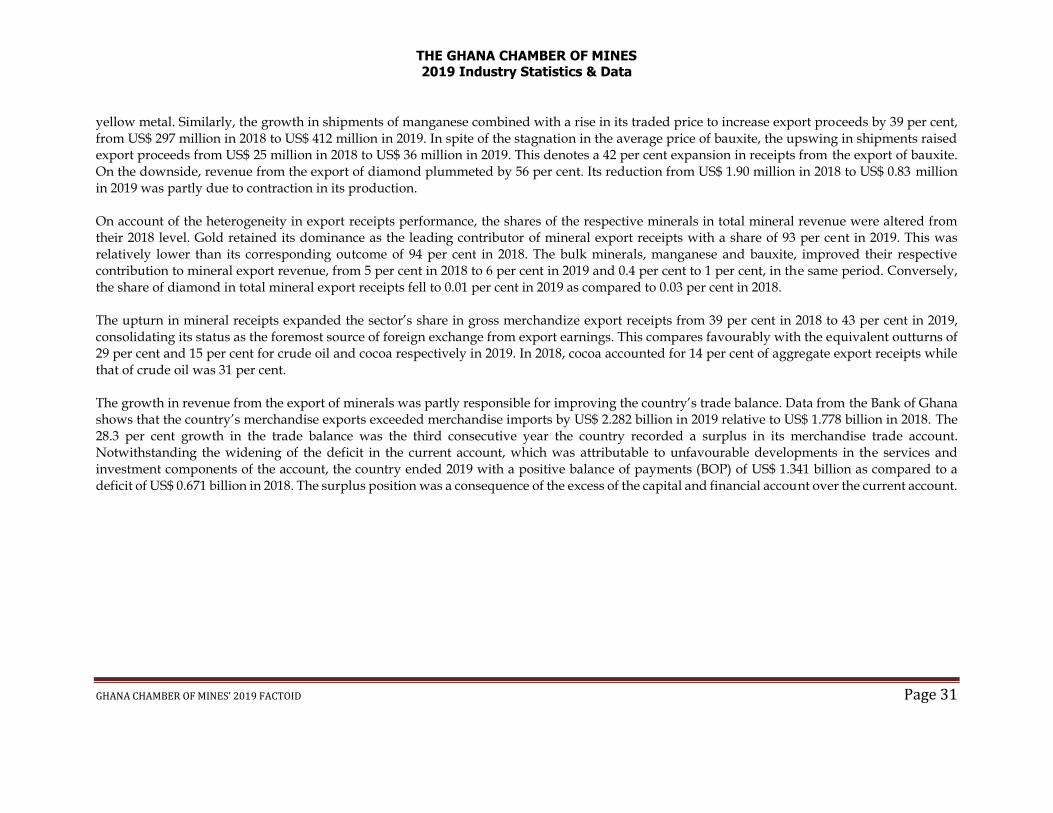
4.8 MERCHANDISE EXPORTS
According to data from the Central Bank, proceeds from export minerals increased by 16 per cent to US$ 6.678 billion in 2019 from US$ 5.760 billion in 2018. The expansion in mineral revenue was occasioned by improvements in receipts from gold, manganese and bauxite, which outweighed the decline in proceeds from the export of diamond. Receipts from the export of gold increased from US$ 5.436 billion in 2018 to US$ 6.230 billion in 2019, representing a growth rate of 15 per cent. The expansion in export receipts of gold was largely driven by an increase in the traded price of the
-
200
400
600
800
1,000
1,200
1,400
1,600
2000 2001 2002 2003 2004 2005 2006 2007 2008 2009 2010 2011 2012 2013 2014 2015 2016 2017 2018 2019
US$
Mill
ion
THE GHANA CHAMBER OF MINES 2019 Industry Statistics & Data
GHANA CHAMBER OF MINES’ 2019 FACTOID Page 31
yellow metal. Similarly, the growth in shipments of manganese combined with a rise in its traded price to increase export proceeds by 39 per cent, from US$ 297 million in 2018 to US$ 412 million in 2019. In spite of the stagnation in the average price of bauxite, the upswing in shipments raised export proceeds from US$ 25 million in 2018 to US$ 36 million in 2019. This denotes a 42 per cent expansion in receipts from the export of bauxite. On the downside, revenue from the export of diamond plummeted by 56 per cent. Its reduction from US$ 1.90 million in 2018 to US$ 0.83 million in 2019 was partly due to contraction in its production. On account of the heterogeneity in export receipts performance, the shares of the respective minerals in total mineral revenue were altered from their 2018 level. Gold retained its dominance as the leading contributor of mineral export receipts with a share of 93 per cent in 2019. This was relatively lower than its corresponding outcome of 94 per cent in 2018. The bulk minerals, manganese and bauxite, improved their respective contribution to mineral export revenue, from 5 per cent in 2018 to 6 per cent in 2019 and 0.4 per cent to 1 per cent, in the same period. Conversely, the share of diamond in total mineral export receipts fell to 0.01 per cent in 2019 as compared to 0.03 per cent in 2018. The upturn in mineral receipts expanded the sector’s share in gross merchandize export receipts from 39 per cent in 2018 to 43 per cent in 2019, consolidating its status as the foremost source of foreign exchange from export earnings. This compares favourably with the equivalent outturns of 29 per cent and 15 per cent for crude oil and cocoa respectively in 2019. In 2018, cocoa accounted for 14 per cent of aggregate export receipts while that of crude oil was 31 per cent. The growth in revenue from the export of minerals was partly responsible for improving the country’s trade balance. Data from the Bank of Ghana shows that the country’s merchandise exports exceeded merchandise imports by US$ 2.282 billion in 2019 relative to US$ 1.778 billion in 2018. The 28.3 per cent growth in the trade balance was the third consecutive year the country recorded a surplus in its merchandise trade account. Notwithstanding the widening of the deficit in the current account, which was attributable to unfavourable developments in the services and investment components of the account, the country ended 2019 with a positive balance of payments (BOP) of US$ 1.341 billion as compared to a deficit of US$ 0.671 billion in 2018. The surplus position was a consequence of the excess of the capital and financial account over the current account.
THE GHANA CHAMBER OF MINES 2019 Industry Statistics & Data
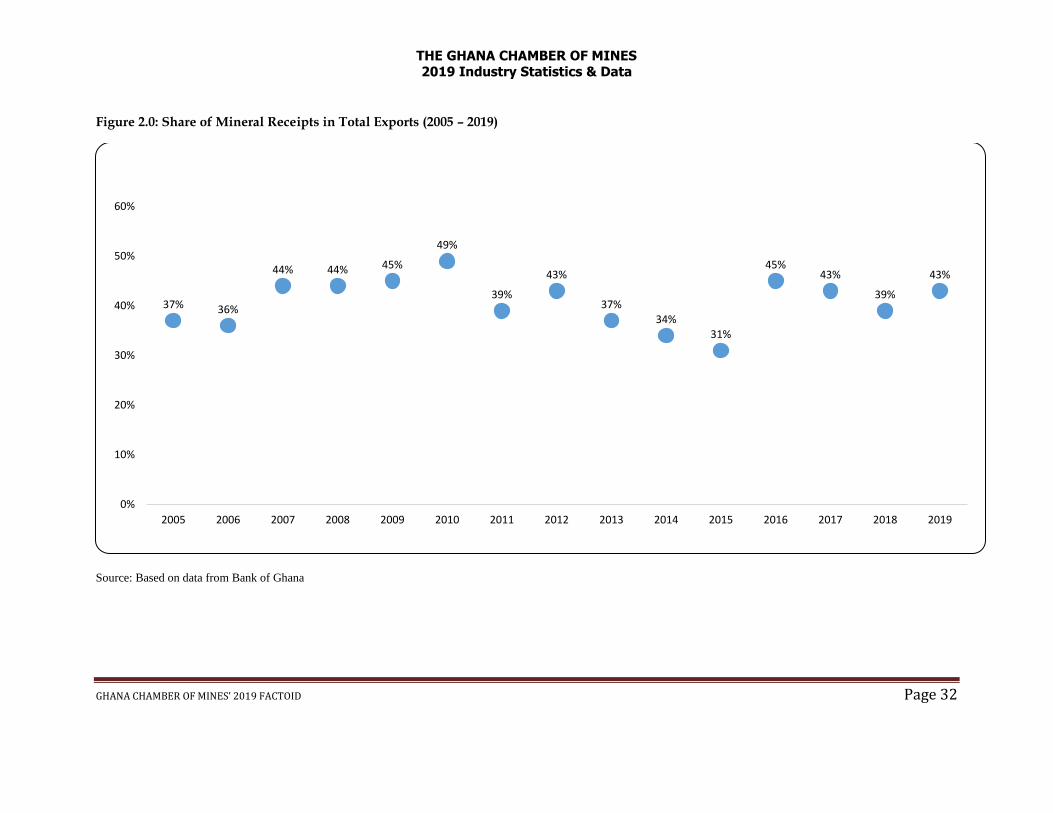
GHANA CHAMBER OF MINES’ 2019 FACTOID Page 32
Figure 2.0: Share of Mineral Receipts in Total Exports (2005 – 2019)
Source: Based on data from Bank of Ghana
37% 36%
44% 44% 45%
49%
39%
43%
37%34%
31%
45%43%
39%
43%
0%
10%
20%
30%
40%
50%
60%
2005 2006 2007 2008 2009 2010 2011 2012 2013 2014 2015 2016 2017 2018 2019

THE GHANA CHAMBER OF MINES 2019 Industry Statistics & Data
GHANA CHAMBER OF MINES’ 2019 FACTOID Page 33
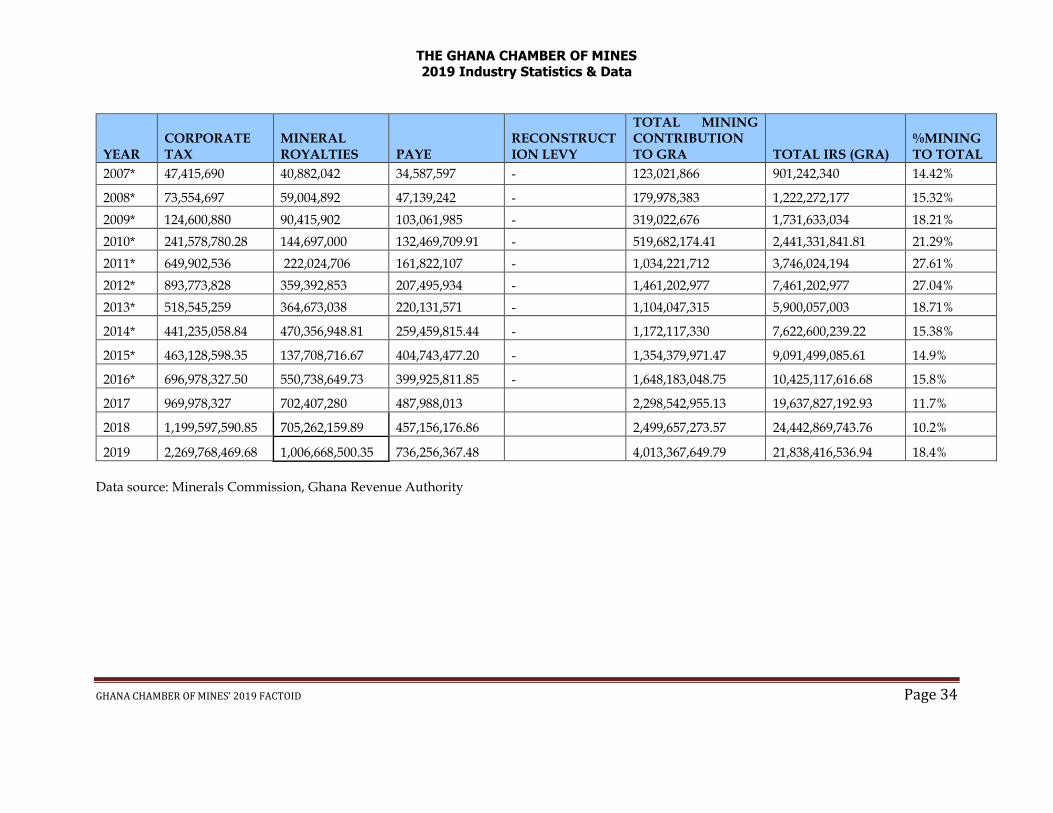
4.9 MINING SECTOR CONTRIBUTIONS
Table 11.0: Mining Sector Contributions (1990 – 2019)
YEAR CORPORATE TAX
MINERAL ROYALTIES PAYE
RECONSTRUCTION LEVY
TOTAL MINING CONTRIBUTION TO GRA TOTAL IRS (GRA)
%MINING TO TOTAL
1990 2,825,941,158 1,893,436,000 4,719,377,158 52,818,068,300 8.94%
1991 821,844,979 3,021,277,000 3,843,121,979 61,485,625,496 6.25%
1992 455,051,883 4,545,804,000 5,000,855,883 74,931,531,366 6.67%
1993 4,393,447,293 7,485,121,000 2,649,306,000 14,527,874,293 113,236,997,000 12.83%
1994 7,214,082,000 12,783,689,000 4,810,802,000 24,808,573,000 166,595,941,000 14.89%
1995 20,392,973,000 20,911,926,000 7,951,763,000 49,256,662,000 275,513,201,000 17.88%
1996 9,160,528,000 35,527,027,000 16,834,543,000 61,522,098,000 424,491,908,000 14.49%
1997 9,868,796,000 34,594,950,000 25,022,023,000 69,485,769,000 605,782,577,000 11.47%
1998 14,450,773,000 49,841,242,000 31,016,506,000 95,308,521,000 785,436,693,000 12.13%
1999 31,117,108,000 48,620,419,161 27,839,260,000 107,576,787,161 901,663,758,000 11.93%
2000 15,789,167,000 118,736,935,173 59,243,800,000 193,769,902,173 1,409,445,273,000 13.75%
2001 24,812,893,000 127,358,386,430 76,111,678,000 4,251,467,579 232,534,425,009 1,950,162,751,000 11.92%
2002 23,501,158,000 153,452,471,032 101,457,668,000 26,474,633,878 304,885,930,910 2,757,747,781,032 11.06%
2003 68,137,702,000 194,387,579,429 141,049,450,000 16,785,882,702 420,360,614,131 3,824,078,389,429 10.99%
2004 100,331,114,000 215,743,706,000 134,357,711,000 36,346,622,100 486,779,183,100 5,333,114,704,000 9.13%
2005 269,889,639,000 235,951,903,000 194,058,939,000 22,957,004,700 722,857,485,700 6,446,385,048,000 11.21%
2006 404,361,775,000 316,254,789,000 216,525,776,000 11,085,262,400 748,227,602,400 7,333,916,866,000 10.20%
THE GHANA CHAMBER OF MINES 2019 Industry Statistics & Data
GHANA CHAMBER OF MINES’ 2019 FACTOID Page 34
Data source: Minerals Commission, Ghana Revenue Authority
YEAR CORPORATE TAX
MINERAL ROYALTIES PAYE
RECONSTRUCTION LEVY
TOTAL MINING CONTRIBUTION TO GRA TOTAL IRS (GRA)
%MINING TO TOTAL
2007* 47,415,690 40,882,042 34,587,597 - 123,021,866 901,242,340 14.42%
2008* 73,554,697 59,004,892 47,139,242 - 179,978,383 1,222,272,177 15.32%
2009* 124,600,880 90,415,902 103,061,985 - 319,022,676 1,731,633,034 18.21%
2010* 241,578,780.28 144,697,000 132,469,709.91 - 519,682,174.41 2,441,331,841.81 21.29%
2011* 649,902,536 222,024,706 161,822,107 - 1,034,221,712 3,746,024,194 27.61%
2012* 893,773,828 359,392,853 207,495,934 - 1,461,202,977 7,461,202,977 27.04%
2013* 518,545,259 364,673,038 220,131,571 - 1,104,047,315 5,900,057,003 18.71%
2014* 441,235,058.84 470,356,948.81 259,459,815.44 - 1,172,117,330 7,622,600,239.22 15.38%
2015* 463,128,598.35 137,708,716.67 404,743,477.20 - 1,354,379,971.47 9,091,499,085.61 14.9%
2016* 696,978,327.50 550,738,649.73 399,925,811.85 - 1,648,183,048.75 10,425,117,616.68 15.8%
2017 969,978,327 702,407,280 487,988,013 2,298,542,955.13 19,637,827,192.93 11.7%
2018 1,199,597,590.85 705,262,159.89 457,156,176.86 2,499,657,273.57 24,442,869,743.76 10.2%
2019 2,269,768,469.68 1,006,668,500.35 736,256,367.48 4,013,367,649.79 21,838,416,536.94 18.4%
THE GHANA CHAMBER OF MINES 2019 Industry Statistics & Data
GHANA CHAMBER OF MINES’ 2019 FACTOID Page 35
4.10 SOCIAL SECURITY CONTRIBUTIONS
Producing mining companies of the Ghana Chamber of Mines paid an amount of GH¢ 102,899,622.86 as social security contributions on behalf of their employees in 2019. These are long-term funds, which assist the country’s capital formation efforts. Indeed, the mining industry contributes to capital formation multipliers, which arise from mining companies’ influence in attracting foreign capital into the country as well as domestic capital mobilization for mining related investments.
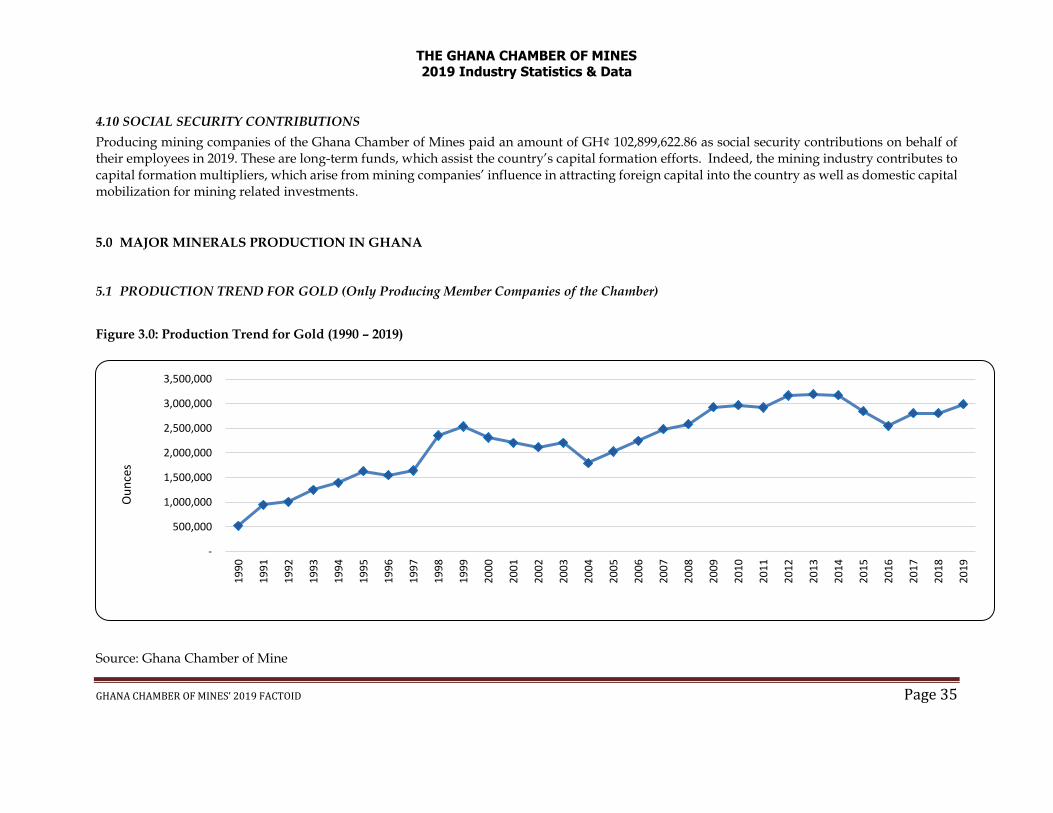
5.0 MAJOR MINERALS PRODUCTION IN GHANA
5.1 PRODUCTION TREND FOR GOLD (Only Producing Member Companies of the Chamber)
Figure 3.0: Production Trend for Gold (1990 – 2019)
Source: Ghana Chamber of Mine
-
500,000
1,000,000
1,500,000
2,000,000
2,500,000
3,000,000
3,500,000
19
90
19
91
19
92
19
93
19
94
19
95
19
96
19
97
19
98
19
99
20
00
20
01
20
02
20
03
20
04
20
05
20
06
20
07
20
08
20
09
20
10
20
11
20
12
20
13
20
14
20
15
20
16
20
17
20
18
20
19
Ou
nce
s
THE GHANA CHAMBER OF MINES 2019 Industry Statistics & Data
GHANA CHAMBER OF MINES’ 2019 FACTOID Page 36
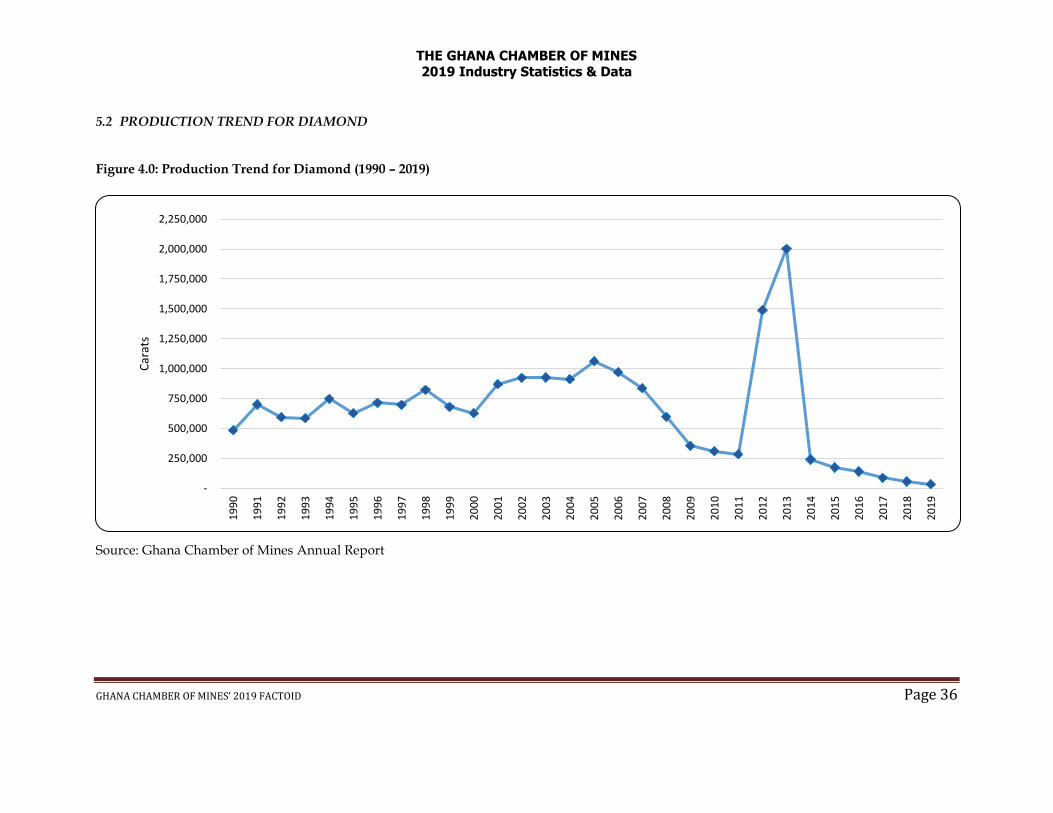
5.2 PRODUCTION TREND FOR DIAMOND
Figure 4.0: Production Trend for Diamond (1990 – 2019)
Source: Ghana Chamber of Mines Annual Report
-
250,000
500,000
750,000
1,000,000
1,250,000
1,500,000
1,750,000
2,000,000
2,250,0001
99
0
19
91
19
92
19
93
19
94
19
95
19
96
19
97
19
98
19
99
20
00
20
01
20
02
20
03
20
04
20
05
20
06
20
07
20
08
20
09
20
10
20
11
20
12
20
13
20
14
20
15
20
16
20
17
20
18
20
19
Car
ats
THE GHANA CHAMBER OF MINES 2019 Industry Statistics & Data
GHANA CHAMBER OF MINES’ 2019 FACTOID Page 37
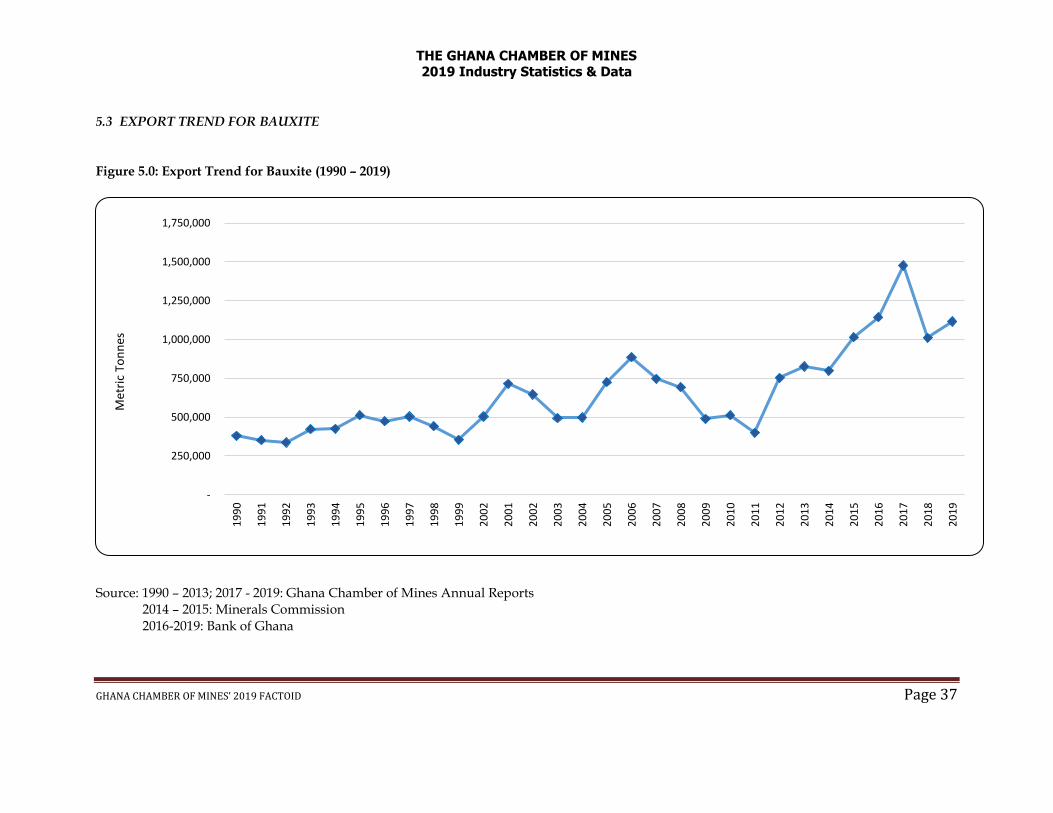
5.3 EXPORT TREND FOR BAUXITE
Figure 5.0: Export Trend for Bauxite (1990 – 2019)
Source: 1990 – 2013; 2017 - 2019: Ghana Chamber of Mines Annual Reports 2014 – 2015: Minerals Commission 2016-2019: Bank of Ghana
-
250,000
500,000
750,000
1,000,000
1,250,000
1,500,000
1,750,0001
99
0
19
91
19
92
19
93
19
94
19
95
19
96
19
97
19
98
19
99
20
02
20
01
20
02
20
03
20
04
20
05
20
06
20
07
20
08
20
09
20
10
20
11
20
12
20
13
20
14
20
15
20
16
20
17
20
18
20
19
Met
ric
Ton
nes
THE GHANA CHAMBER OF MINES 2019 Industry Statistics & Data
GHANA CHAMBER OF MINES’ 2019 FACTOID Page 38
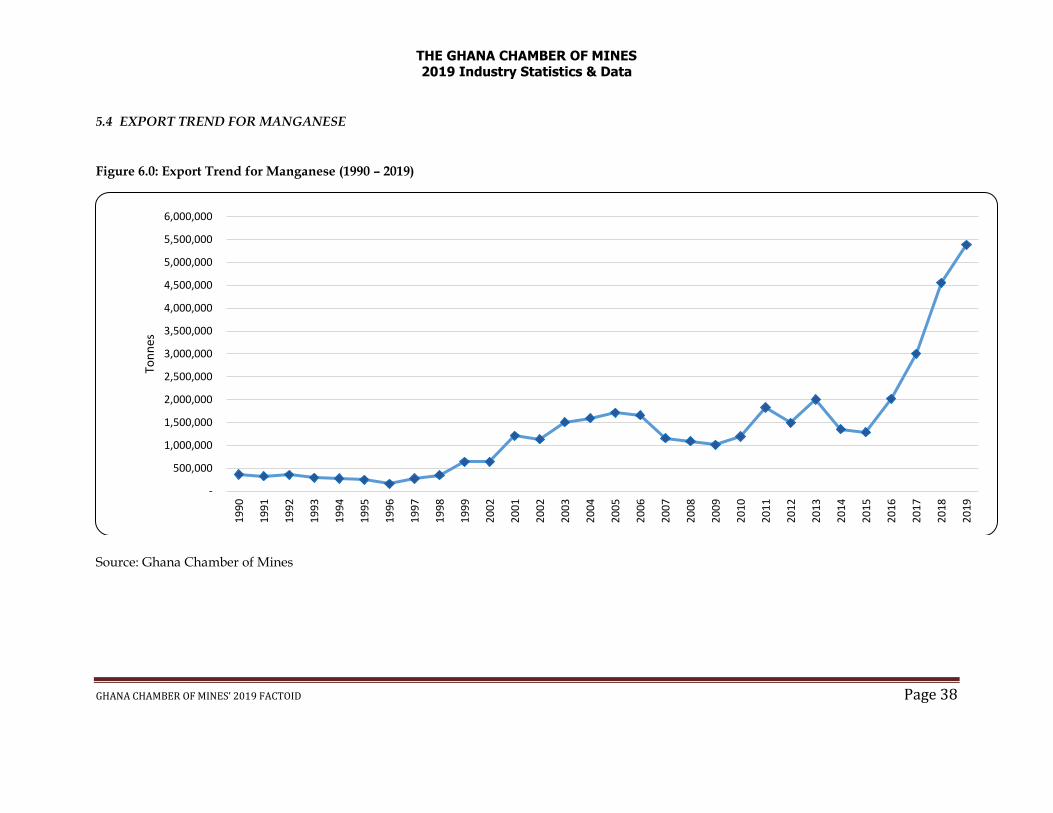
5.4 EXPORT TREND FOR MANGANESE
Figure 6.0: Export Trend for Manganese (1990 – 2019)
Source: Ghana Chamber of Mines
-
500,000
1,000,000
1,500,000
2,000,000
2,500,000
3,000,000
3,500,000
4,000,000
4,500,000
5,000,000
5,500,000
6,000,000
19
90
19
91
19
92
19
93
19
94
19
95
19
96
19
97
19
98
19
99
20
02
20
01
20
02
20
03
20
04
20
05
20
06
20
07
20
08
20
09
20
10
20
11
20
12
20
13
20
14
20
15
20
16
20
17
20
18
20
19
Ton
nes
THE GHANA CHAMBER OF MINES 2019 Industry Statistics & Data
GHANA CHAMBER OF MINES’ 2019 FACTOID Page 39
6.0 MAJOR MINERAL REVENUE IN GHANA
6.1 REVENUE TREND FOR GOLD (US Dollars)
Figure 7.0: Revenue from Gold (2004 – 2019)
Source: Ghana Chamber of Mines
731 904
1,327
1,712
2,203
2,843
3,621
4,630
5,309
4,610
3,842
3,321
5,153
5,777 5,436
6,230
-
1,000
2,000
3,000
4,000
5,000
6,000
7,000
2004 2005 2006 2007 2008 2009 2010 2011 2012 2013 2014 2015 2016 2017 2018 2019
USD
Miil
ion
THE GHANA CHAMBER OF MINES 2019 Industry Statistics & Data
GHANA CHAMBER OF MINES’ 2019 FACTOID Page 40
6.2 REVENUE TREND FOR DIAMOND (US Dollars)
Figure 8.0: Revenue from Diamond (2004 – 2019)
Source: Ghana Chamber of Mines
26.01
34.73
30.02
26.37
18.89
6.99
11.13
14.85
11.16
8.03
10.70
6.42
4.31 2.86
1.90 0.83
-
5
10
15
20
25
30
35
40
2004 2005 2006 2007 2008 2009 2010 2011 2012 2013 2014 2015 2016 2017 2018 2019
USD
Miil
ion
THE GHANA CHAMBER OF MINES 2019 Industry Statistics & Data
GHANA CHAMBER OF MINES’ 2019 FACTOID Page 41
6.3 REVENUE TREND FOR BAUXITE (US Dollars)
Figure 9.0: Revenue from Bauxite (2004 – 2019)
Source: Ghana Chamber of Mines
10.62
18.02
22.56
19.69 19.81
11.16
15.15 13.41
28.50
32.92
36.26
41.06
36.87
5.89
25.37
35.99
-
5
10
15
20
25
30
35
40
45
2004 2005 2006 2007 2008 2009 2010 2011 2012 2013 2014 2015 2016 2017 2018 2019
USD
Mill
lion
THE GHANA CHAMBER OF MINES 2019 Industry Statistics & Data
GHANA CHAMBER OF MINES’ 2019 FACTOID Page 42
6.4 REVENUE TREND FOR MANGANESE (US Dollars)
Figure 10.0: Revenue from Manganese (2004 – 2019)
Source: Ghana Chamber of Mines
30.25 39.03 39.93 36.83
62.35 64.86 77.81
119.99 98.61
135.48
91.15 70.58
104.81
165.20
297.03
412.23
-
50
100
150
200
250
300
350
400
450
2004 2005 2006 2007 2008 2009 2010 2011 2012 2013 2014 2015 2016 2017 2018 2019
USD
Miil
ion
THE GHANA CHAMBER OF MINES 2019 Industry Statistics & Data
GHANA CHAMBER OF MINES’ 2019 FACTOID Page 43
7.0 LABOUR IN THE MINING SECTOR
7.1 Employment
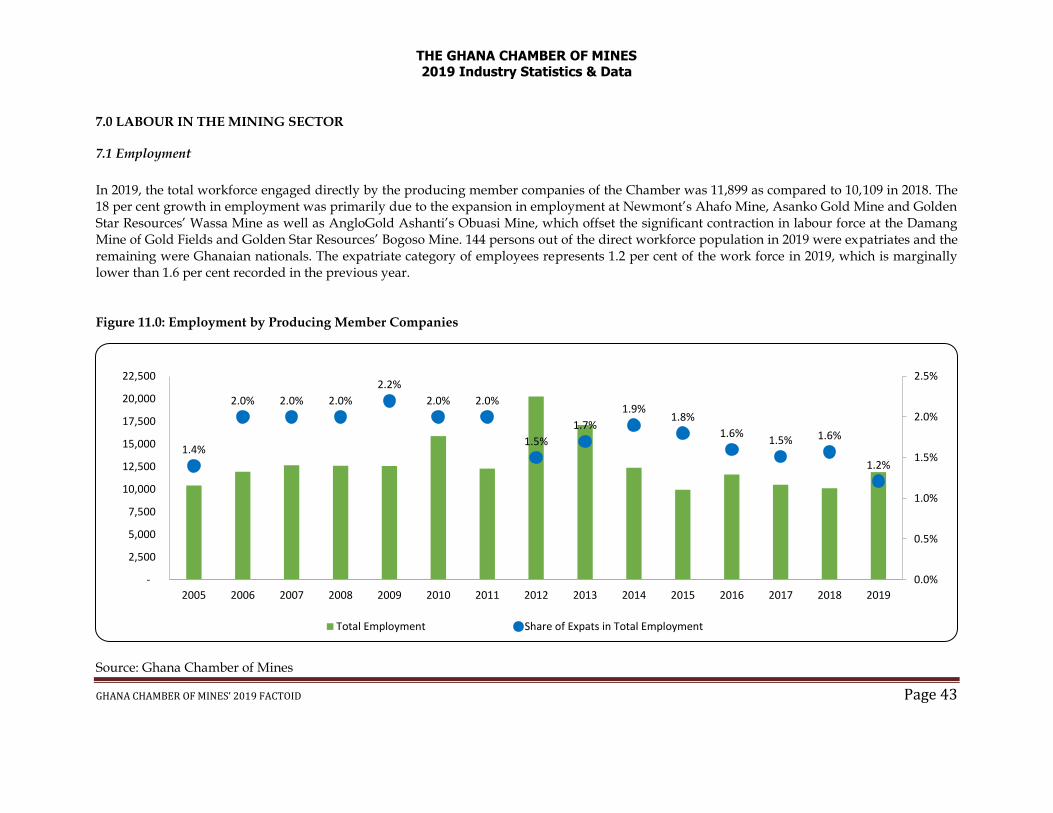
In 2019, the total workforce engaged directly by the producing member companies of the Chamber was 11,899 as compared to 10,109 in 2018. The 18 per cent growth in employment was primarily due to the expansion in employment at Newmont’s Ahafo Mine, Asanko Gold Mine and Golden Star Resources’ Wassa Mine as well as AngloGold Ashanti’s Obuasi Mine, which offset the significant contraction in labour force at the Damang Mine of Gold Fields and Golden Star Resources’ Bogoso Mine. 144 persons out of the direct workforce population in 2019 were expatriates and the remaining were Ghanaian nationals. The expatriate category of employees represents 1.2 per cent of the work force in 2019, which is marginally lower than 1.6 per cent recorded in the previous year. Figure 11.0: Employment by Producing Member Companies
Source: Ghana Chamber of Mines
1.4%
2.0% 2.0% 2.0%
2.2%
2.0% 2.0%
1.5%
1.7%
1.9%1.8%
1.6%1.5% 1.6%
1.2%
0.0%
0.5%
1.0%
1.5%
2.0%
2.5%
-
2,500
5,000
7,500
10,000
12,500
15,000
17,500
20,000
22,500
2005 2006 2007 2008 2009 2010 2011 2012 2013 2014 2015 2016 2017 2018 2019
Total Employment Share of Expats in Total Employment
THE GHANA CHAMBER OF MINES 2019 Industry Statistics & Data
GHANA CHAMBER OF MINES’ 2019 FACTOID Page 44
8.0 SOCIO – ECONOMIC CONTRIBUTION
8.1 Socio-Economic Contributions
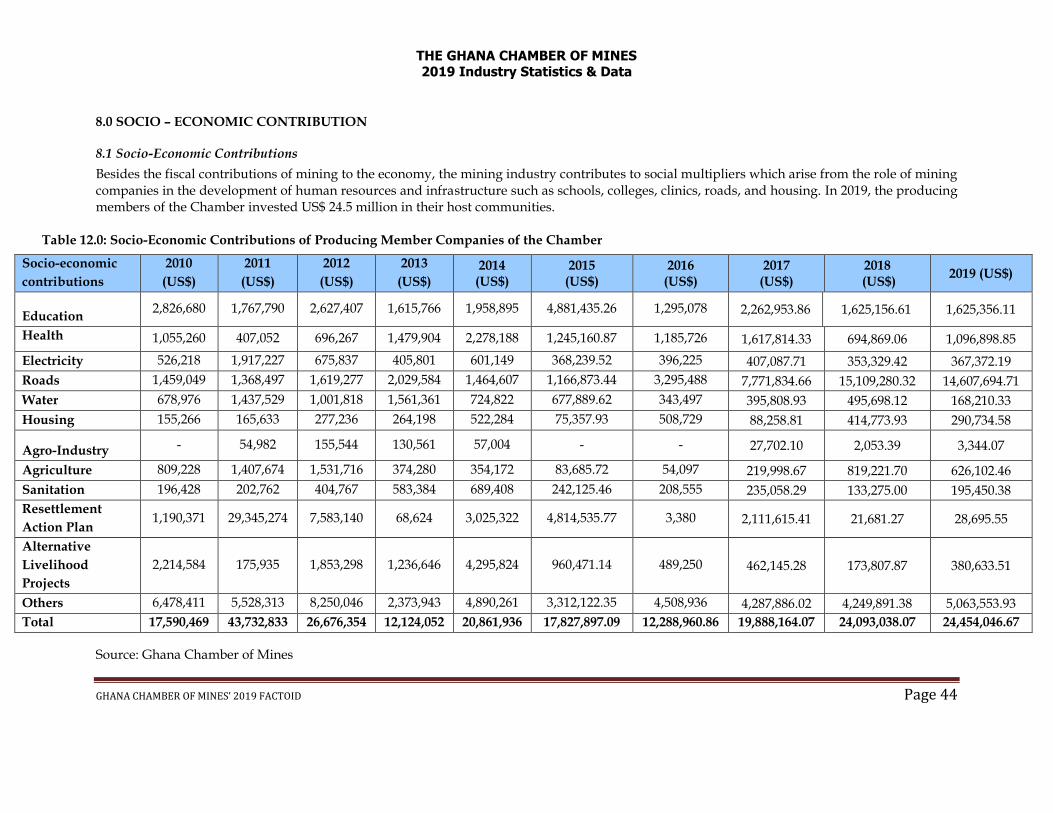
Besides the fiscal contributions of mining to the economy, the mining industry contributes to social multipliers which arise from the role of mining companies in the development of human resources and infrastructure such as schools, colleges, clinics, roads, and housing. In 2019, the producing members of the Chamber invested US$ 24.5 million in their host communities.
Table 12.0: Socio-Economic Contributions of Producing Member Companies of the Chamber
Source: Ghana Chamber of Mines
Socio-economic
contributions
2010
(US$)
2011
(US$)
2012
(US$)
2013
(US$) 2014
(US$) 2015
(US$) 2016
(US$) 2017
(US$) 2018
(US$) 2019 (US$)
Education 2,826,680 1,767,790 2,627,407 1,615,766 1,958,895 4,881,435.26 1,295,078 2,262,953.86 1,625,156.61 1,625,356.11
Health 1,055,260 407,052 696,267 1,479,904 2,278,188 1,245,160.87 1,185,726 1,617,814.33 694,869.06 1,096,898.85
Electricity 526,218 1,917,227 675,837 405,801 601,149 368,239.52 396,225 407,087.71 353,329.42 367,372.19
Roads 1,459,049 1,368,497 1,619,277 2,029,584 1,464,607 1,166,873.44 3,295,488 7,771,834.66 15,109,280.32 14,607,694.71
Water 678,976 1,437,529 1,001,818 1,561,361 724,822 677,889.62 343,497 395,808.93 495,698.12 168,210.33
Housing 155,266 165,633 277,236 264,198 522,284 75,357.93 508,729 88,258.81 414,773.93 290,734.58
Agro-Industry - 54,982 155,544 130,561 57,004 - - 27,702.10 2,053.39 3,344.07
Agriculture 809,228 1,407,674 1,531,716 374,280 354,172 83,685.72 54,097 219,998.67 819,221.70 626,102.46
Sanitation 196,428 202,762 404,767 583,384 689,408 242,125.46 208,555 235,058.29 133,275.00 195,450.38
Resettlement
Action Plan 1,190,371 29,345,274 7,583,140 68,624 3,025,322 4,814,535.77 3,380 2,111,615.41 21,681.27 28,695.55
Alternative
Livelihood
Projects
2,214,584 175,935 1,853,298 1,236,646 4,295,824 960,471.14 489,250 462,145.28 173,807.87 380,633.51
Others 6,478,411 5,528,313 8,250,046 2,373,943 4,890,261 3,312,122.35 4,508,936 4,287,886.02 4,249,891.38 5,063,553.93
Total 17,590,469 43,732,833 26,676,354 12,124,052 20,861,936 17,827,897.09 12,288,960.86 19,888,164.07 24,093,038.07 24,454,046.67
THE GHANA CHAMBER OF MINES 2019 Industry Statistics & Data
GHANA CHAMBER OF MINES’ 2019 FACTOID Page 45
8.2 Property Rates
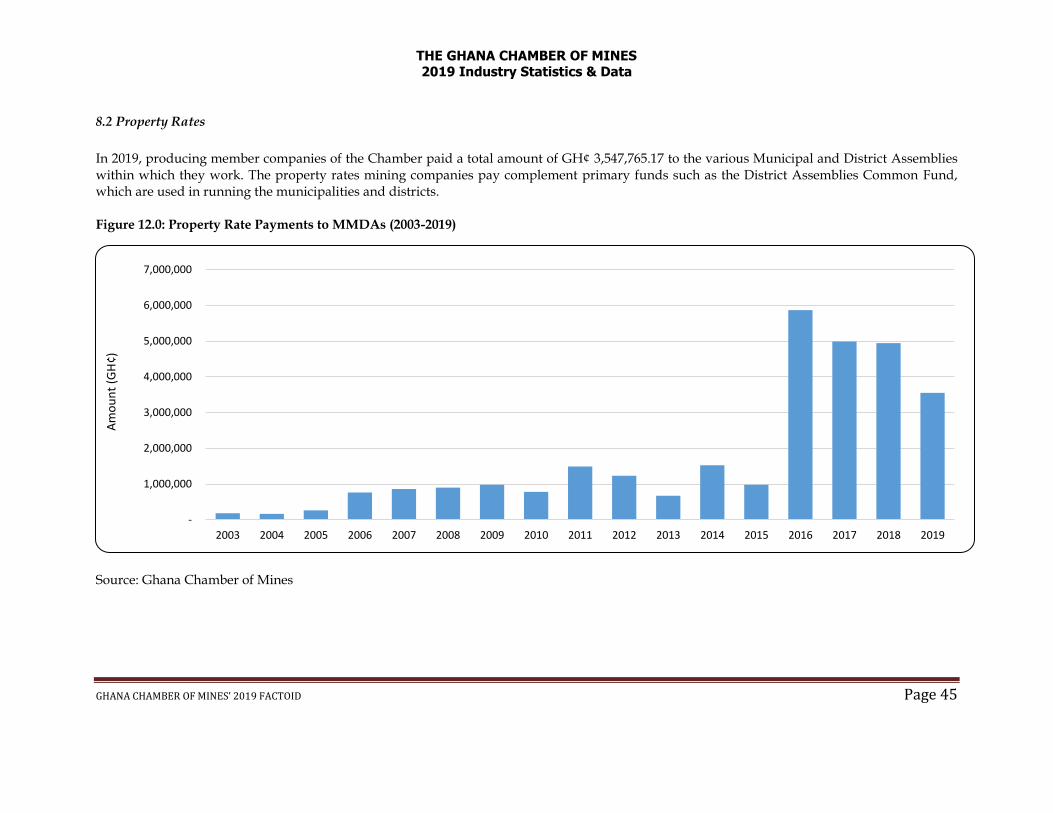
In 2019, producing member companies of the Chamber paid a total amount of GH¢ 3,547,765.17 to the various Municipal and District Assemblies within which they work. The property rates mining companies pay complement primary funds such as the District Assemblies Common Fund, which are used in running the municipalities and districts. Figure 12.0: Property Rate Payments to MMDAs (2003-2019)
Source: Ghana Chamber of Mines
-
1,000,000
2,000,000
3,000,000
4,000,000
5,000,000
6,000,000
7,000,000
2003 2004 2005 2006 2007 2008 2009 2010 2011 2012 2013 2014 2015 2016 2017 2018 2019
Am
ou
nt
(GH
¢)
THE GHANA CHAMBER OF MINES 2019 Industry Statistics & Data
GHANA CHAMBER OF MINES’ 2019 FACTOID Page 46
9.0 ENERGY
The mining industry’s usage of energy demonstrates its significant forward and backward linkages in the local economy.
9.1 Electric Power
In 2019, the mining industry in Ghana consumed 1,647,796,288 KWh of electric power and paid a total amount equivalent to about USD 316.350
million to VRA, GRIDCO and ECG, while in 2018, 1,334,482,124 KWh was used by the industry. The latter translates into a nominal value of USD
246.999 million. The expenditure on electric power translates into 6.9 per cent of the producing member companies’ mineral receipts in 2019 as
compared to 6.4 per cent in 2018.
9.2 Diesel
In 2019, the mining industry consumed 335,970,347 litres of diesel compared to the 334,997,438 litres it used in 2018. Correspondingly, the companies paid an amount of USD 342.052 million in 2019 and USD 320.599 million in 2018 for diesel consumption. This favourably translates into 7.5 per cent share of the producing member companies’ mineral receipts in 2019 as compared to 8.3 per cent in 2018.
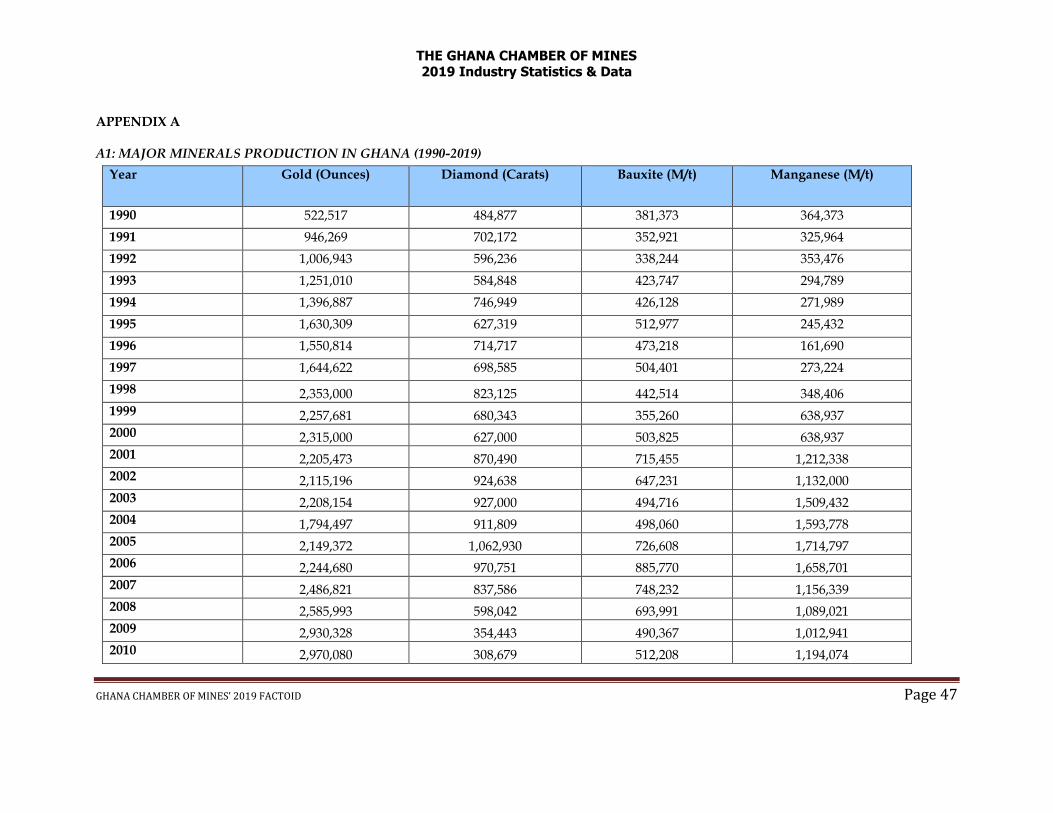
THE GHANA CHAMBER OF MINES 2019 Industry Statistics & Data
GHANA CHAMBER OF MINES’ 2019 FACTOID Page 47
APPENDIX A
A1: MAJOR MINERALS PRODUCTION IN GHANA (1990-2019)
Year Gold (Ounces) Diamond (Carats) Bauxite (M/t) Manganese (M/t)
1990 522,517 484,877 381,373 364,373
1991 946,269 702,172 352,921 325,964
1992 1,006,943 596,236 338,244 353,476
1993 1,251,010 584,848 423,747 294,789
1994 1,396,887 746,949 426,128 271,989
1995 1,630,309 627,319 512,977 245,432
1996 1,550,814 714,717 473,218 161,690
1997 1,644,622 698,585 504,401 273,224
1998 2,353,000 823,125 442,514 348,406
1999 2,257,681 680,343 355,260 638,937
2000 2,315,000 627,000 503,825 638,937
2001 2,205,473 870,490 715,455 1,212,338
2002 2,115,196 924,638 647,231 1,132,000
2003 2,208,154 927,000 494,716 1,509,432
2004 1,794,497 911,809 498,060 1,593,778
2005 2,149,372 1,062,930 726,608 1,714,797
2006 2,244,680 970,751 885,770 1,658,701
2007 2,486,821 837,586 748,232 1,156,339
2008 2,585,993 598,042 693,991 1,089,021
2009 2,930,328 354,443 490,367 1,012,941
2010 2,970,080 308,679 512,208 1,194,074
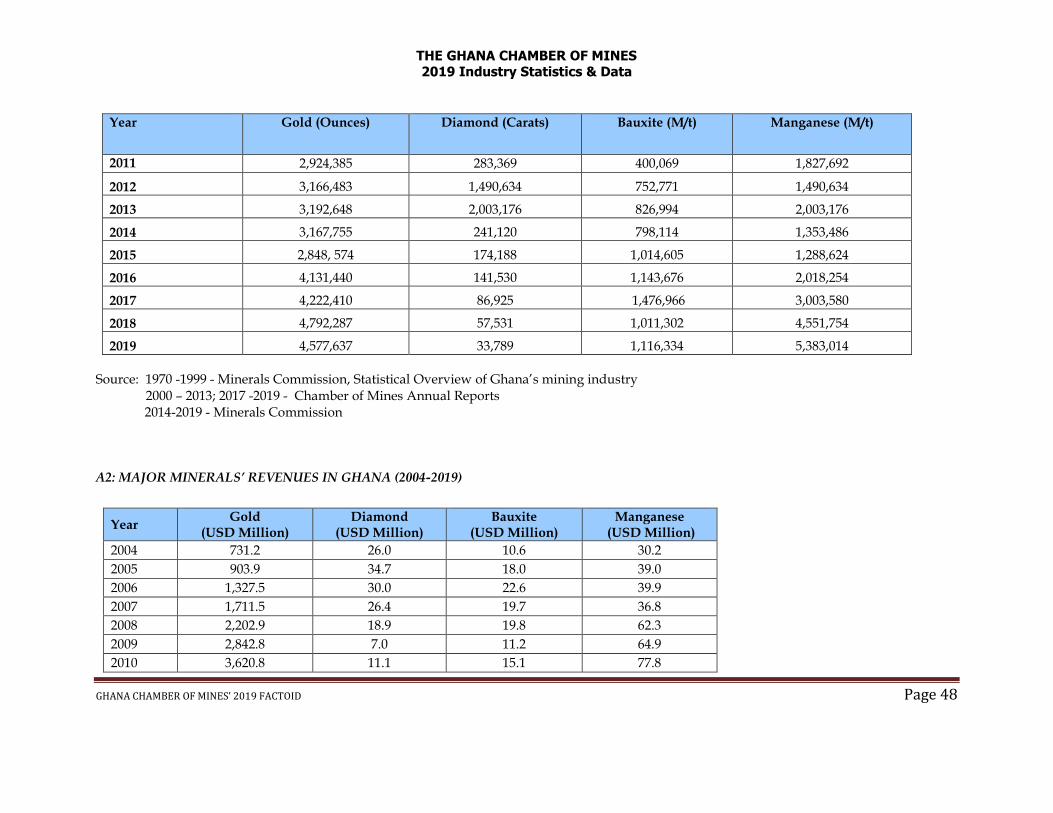
THE GHANA CHAMBER OF MINES 2019 Industry Statistics & Data
GHANA CHAMBER OF MINES’ 2019 FACTOID Page 48
Year Gold (Ounces) Diamond (Carats) Bauxite (M/t) Manganese (M/t)
2011 2,924,385 283,369 400,069 1,827,692
2012 3,166,483 1,490,634 752,771 1,490,634
2013 3,192,648 2,003,176 826,994 2,003,176
2014 3,167,755 241,120 798,114 1,353,486
2015 2,848, 574 174,188 1,014,605 1,288,624
2016 4,131,440 141,530 1,143,676 2,018,254
2017 4,222,410 86,925 1,476,966 3,003,580
2018 4,792,287 57,531 1,011,302 4,551,754
2019 4,577,637 33,789 1,116,334 5,383,014
Source: 1970 -1999 - Minerals Commission, Statistical Overview of Ghana’s mining industry 2000 – 2013; 2017 -2019 - Chamber of Mines Annual Reports 2014-2019 - Minerals Commission
A2: MAJOR MINERALS’ REVENUES IN GHANA (2004-2019)
Year Gold
(USD Million) Diamond
(USD Million) Bauxite
(USD Million) Manganese
(USD Million)
2004 731.2 26.0 10.6 30.2
2005 903.9 34.7 18.0 39.0
2006 1,327.5 30.0 22.6 39.9
2007 1,711.5 26.4 19.7 36.8
2008 2,202.9 18.9 19.8 62.3
2009 2,842.8 7.0 11.2 64.9
2010 3,620.8 11.1 15.1 77.8
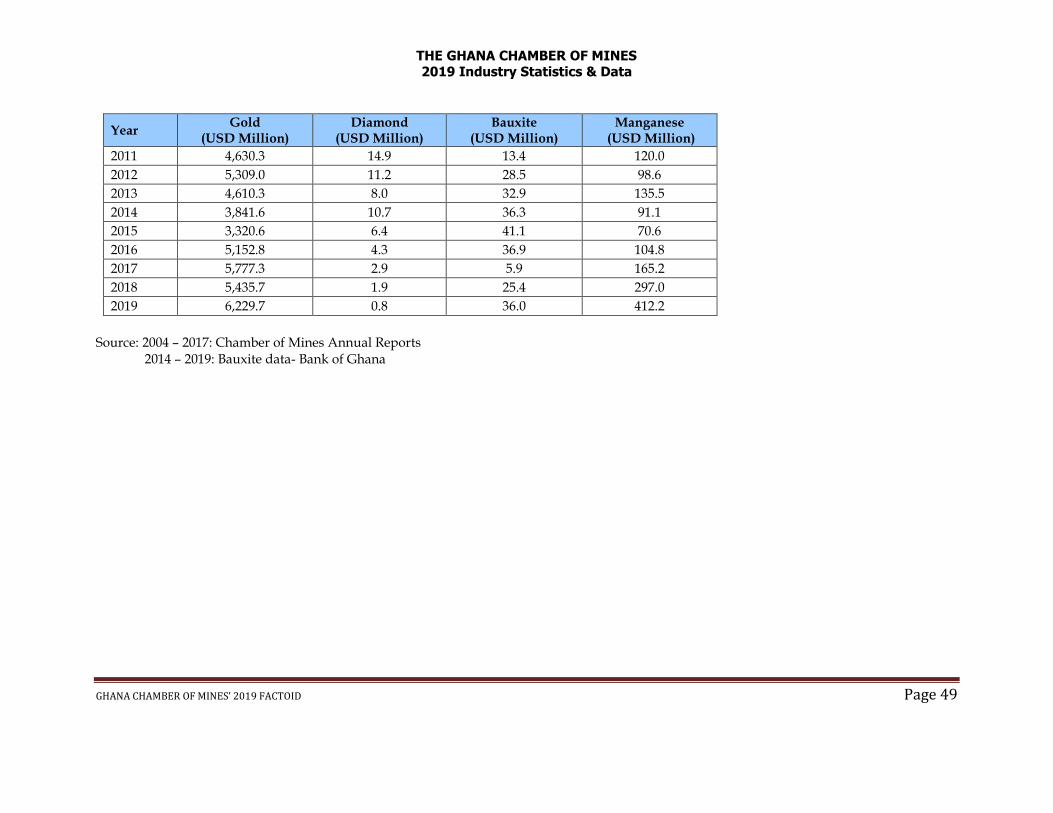
THE GHANA CHAMBER OF MINES 2019 Industry Statistics & Data
GHANA CHAMBER OF MINES’ 2019 FACTOID Page 49
Year Gold
(USD Million) Diamond
(USD Million) Bauxite
(USD Million) Manganese
(USD Million)
2011 4,630.3 14.9 13.4 120.0
2012 5,309.0 11.2 28.5 98.6
2013 4,610.3 8.0 32.9 135.5
2014 3,841.6 10.7 36.3 91.1
2015 3,320.6 6.4 41.1 70.6
2016 5,152.8 4.3 36.9 104.8
2017 5,777.3 2.9 5.9 165.2
2018 5,435.7 1.9 25.4 297.0
2019 6,229.7 0.8 36.0 412.2
Source: 2004 – 2017: Chamber of Mines Annual Reports 2014 – 2019: Bauxite data- Bank of Ghana