the global agglomeration of multinational firms files/10-043_4b3a99bf-8548-4001... · the global...
TRANSCRIPT

Copyright © 2009, 2010, 2012, 2014 by Laura Alfaro and Maggie Xiaoyang Chen
Working papers are in draft form. This working paper is distributed for purposes of comment and discussion only. It may not be reproduced without permission of the copyright holder. Copies of working papers are available from the author.
The Global Agglomeration of Multinational Firms Laura Alfaro Maggie Xiaoyang Chen
Working Paper
10-043 April 22, 2014

The Global Agglomeration of Multinational Firms�
Laura Alfaroy
Harvard Business School and NBERMaggie Xiaoyang Chenz
George Washington University
April 2014
Abstract
The explosion of multinational activities in recent decades is rapidly transform-ing the global landscape of industrial production. But are the emerging clusters ofmultinational production the rule or the exception? What drives the o¤shore ag-glomeration of multinational �rms in comparison to the agglomeration of domestic�rms? Using a unique worldwide plant-level dataset that reports detailed location,ownership, and operation information for plants in over 100 countries, we construct aspatially continuous index of pairwise-industry agglomeration and investigate the pat-terns and determinants underlying the global economic geography of multinational�rms. Our analysis presents new stylized facts that suggest the emerging o¤shoreclusters of multinationals are not a simple re�ection of domestic industrial clusters.Agglomeration economies including capital-good market externality and technologydi¤usion play a more important role in the o¤shore agglomeration of multinationalsthan the agglomeration of domestic �rms. These �ndings remain robust when weaddress potential reverse causality by exploring the regional pattern and process ofagglomeration.
JEL codes: F2, D2, R1Key words: multinational �rm, agglomeration, location fundamentals, agglomer-
ation economies�We thank Jim Anderson, Bruce Blonigen, James Harrigan, Keith Head, Tarun Khanna, Jim Markusen, Keith
Maskus, Mike Moore, Henry Overman, John Ries, Roberto Samaneigo, Stephen Yeaple, Tony Yezer, and seminarand conference participants at Harvard Business School, University of Virginia Darden School of Business, GeorgeWashington University, the AEA meeting, the ETSG meeting, the EIIT meeting, and the LACEA Trade, Inte-gration and Growth Meeting for helpful suggestions, William Kerr for discussions on the agglomeration indicesand kindly providing us the patent concordance data, Bill Simpson for advice on computing the indices, FranciscoPino and Hillary White for reserch assistance, Dennis Jacques for help with the D&B dataset, and HBS and GWfor �nancial support.
yEmail: [email protected]; Phone: 617-495-7981; Harvard Business School, Morgan 293, Boston, MA 02163.zEmail: [email protected]; Phone: 202-994-0192; Department of Economics, George Washington University, 2115
G ST, NW, #367, Washington, DC 20052.
1 Introduction
An exponential increase in �ows of goods, capital, and ideas is one of the most prominent
economic trends in recent decades. A key driver of this phenomenon is cross-border production,
investment, and innovation led by multinational corporations (MNCs). Multinational a¢ liate
sales as a share of world GDP have more than doubled in the past two decades.1 This explosion of
MNC activity is rapidly transforming the global landscape of industrial production, precipitating
the emergence of new industrial clusters around the world. Firms that agglomerated in, for
example, Silicon Valley and Detroit now have subsidiary plants clustering in Bangalore and
Slovakia (termed, respectively, the Silicon Valley of India and the Detroit of the East).
Are the new MNC clusters the rule or the exception? What drives the current o¤shore
agglomeration of MNCs? Are they a simple re�ection of the domestic industrial clusters? Eco-
nomic historians and regional and urban economists have long recognized the agglomeration of
economic activity as one of the most salient features of economic development. An extensive
body of research in regional economics and, more recently, in the New Economic Geography
(NEG) literature examines the distribution of population and production across space and the
economic characteristics and e¤ects of spatial concentrations. However, relatively few studies
have investigated the emerging spatial concentrations of multinational production (MP) around
the world and their driving forces in comparison to their domestic counterparts.2
Our goal in this paper is to examine the patterns and causes of the global agglomeration of
multinational production� both o¤shore and at headquarters� in comparison to the agglomera-
tion of domestic �rms. In contrast to domestic production, which emphasizes domestic geography
and natural advantage, multinational production stresses foreign market access and international
comparative advantage. Moreover, as highlighted in a growing literature led by Helpman, Melitz,
and Yeaple (2004) and Antras and Helpman (2004, 2008), the economic attributes and organi-
zations of multinationals are, by selection, distinctively di¤erent from those of domestic �rms.
The greater revenue and productivity, vertical integration, and higher capital- and knowledge-
intensity all suggest that MNC o¤shore subsidiaries are likely to have agglomeration motives
di¤erent from those of domestic �rms.
We �rst quantify the global agglomeration of multinational and domestic �rms to establish
new stylized facts on how �rms with di¤erent organizational forms might agglomerate di¤erently.
We construct an index of industry agglomeration following an empirical methodology introduced
by Duranton and Overman (2005) (henceforth, DO). This index gives information on the extent
of localization by industry and the spatial scales at which it takes space. It �rst assesses the
distribution of distances between establishments in each industry pair (including both within-
and between-industry pairs) and then compares the distribution with the counterfactual distri-
1Source: UNCTAD, World Investment Report (2009).2See Ottaviano and Puga (1998), Head and Mayer (2004), Ottaviano and Thisse (2004), Rosenthal and Strange
(2004), Duranton and Puga (2004), Puga (2010), and Redding (2010, 2011) for excellent reviews of these literatures.Section 2 discusses studies in regional and international economics that are closely related to this paper.
1

butions of hypothetical industries. Industry pairs that exhibit greater geographic densities than
the counterfactuals are considered to exhibit signi�cant agglomeration. In contrast to traditional
indices, which tend to de�ne agglomeration as the amount of activity taking place in a partic-
ular geographic unit, this spatially continuous index separates agglomeration from the general
geographic concentration and is unbiased with respect to the scale of geographic units and the
level of spatial aggregation.
We quantify the global agglomeration of both multinational and domestic �rms using World-
Base, a worldwide plant-level dataset that provides detailed location, ownership, and activity
information for establishments in more than 100 countries. The dataset�s detailed location and
operation information for over 43 million plants, including multinational and domestic, o¤shore
and headquarters establishments, makes it possible to compare the agglomeration of di¤erent
types of establishment. We use the plant-level physical location information in our data to obtain
latitude and longitude codes for each establishment and compute not only the distance but also
the trade cost that accounts for other forms of trade barriers between each pair of establishments.
We then construct the index of agglomeration based on the distance and the trade cost between
establishments.
Our analysis presents a rich array of new stylized facts that shed light on the global agglom-
eration of multinational and domestic �rms. We show that MNCs follow distinctively di¤erent
agglomeration patterns o¤shore than their domestic counterparts:
� Across di¤erent types of plant, multinational headquarters are, on average, most agglom-erative, followed by domestic plants and multinational foreign subsidiaries.
� The agglomeration of multinational foreign subsidiaries exhibits a low correlation with theagglomeration of domestic plants.
� Multinational foreign subsidiaries are more agglomerative than domestic plants in capital-,skilled-labor-, and R&D-intensive industries.
These observations indicate that the emerging o¤shore clusters of MNCs are not merely
a projection of the domestic clusters and the driving agglomeration forces are likely to vary
systematically from those of domestic plants and MNC headquarters.
In the second part of the paper, we further explore these �ndings and examine the relative
importance of two distinct categories of economic factor in the agglomeration patterns of multi-
national versus domestic �rms: (i) the location fundamentals (also referred to as "�rst nature")
of multinational production and (ii) agglomeration economies (also known as "second nature").
The location fundamentals of MP, as stressed in the international trade literature, consist primar-
ily of foreign market access (multinationals choose to produce in large foreign markets to avoid
trade costs) and comparative advantage (multinationals produce in countries with desired factor
2

abundance and low factor prices).3 In contrast, agglomeration economies, the study of which
dates from Marshall (1890), stress the bene�ts for �rms of geographic proximity, including lower
transport costs between input suppliers and �nal good producers, labor and capital-good market
externalities, and technology di¤usion. While existing studies have o¤ered evidence of agglomer-
ation economies in domestic economic geography, little is yet known about how they in�uence the
global economic geography of multinationals di¤erently from the economic geography of domestic
�rms, given the multinationals�organization structure and capital- and knowledge-intensity.
Identifying the e¤ects of MP location fundamentals and agglomeration economies, however,
is a key challenge in the empirical analysis of economic geography. Disentangling their e¤ects
is complicated by the di¢ culty of measuring them quantitatively. Moreover, their common
propensity to lead MNCs to locate next to each other makes it di¢ cult to separate their relative
e¤ects.
To overcome the above challenges, our empirical analysis proceeds in the following steps.
First, while we take into account both within- and between-industry agglomeration in the descrip-
tive analysis, we focus our econometric analysis on between-industry agglomeration, also called
"coagglomeration."4 As noted by Ellison, Glaeser, and Kerr (2010) (henceforth, EGK), compared
to �rms in the same industries, �rms from di¤erent industry pairs often exhibit greater variation
in their relatedness in production, factor markets, and technology space, thereby displaying dif-
ferent agglomeration incentives.5 Exploring the between-industry agglomeration of MNCs and
how it relates to pairwise industries�variation in agglomeration incentives thus makes it possible
to separate the e¤ects of location fundamentals and the various agglomeration economies.
Second, we construct an expected index of agglomeration to capture the e¤ect of location
fundamentals. This index re�ects the geographic distribution of MNC plants predicted exclu-
sively by country- and region-level location fundamentals of multinational production, including,
for example, market size, trade costs, comparative advantage, infrastructure, corporate taxes.
Third, controlling for the agglomeration predicted by location fundamentals and all industry-
speci�c factors, we examine the degree to which proxies of agglomeration forces� including
between-industry input-output linkages, similarities in labor demand and capital-good demand,
and technology linkages� explain the variations in the agglomeration index for multinational
3While comparative advantage is de�ned here in the context of neoclassical trade theory, other country factorssuch as institutional characteristics and physical locations can also play a role in �rms� location decisions andare sometimes considered as part of comparative advantage (see, for example, Nunn, 2007; Limao and Venables,2002). As described in Section 5.1, our empirical speci�cation controls for all host-country-industry-speci�c factorsand for regional characteristics such as education attainment, infrastructure, and tax rates when constructing thelocation fundamentals of multinational production.
4We use the term "agglomeration" broadly to refer to both within- and between-industry agglomeration (thelatter sometimes referred to as "coagglomeration"). The broad usage of the term "agglomeration" is fairly commonin the literature.
5While location fundamentals and all agglomeration economies tend to predict spatial concentration among�rms in the same industry, their predictions of which industry pairs should agglomerate vary signi�cantly. Forexample, �rms in the automobile industry may agglomerate because of both location fundamentals and any ofthe agglomeration economies, but �rms in the automobile and steel industries are likely to agglomerate mainlybecause of their production linkages.
3
�rms and domestic �rms. To mitigate concerns about reverse causality, we construct the prox-
ies of agglomeration forces using lagged disaggregated U.S. industry account data, as it is not
very likely that the production, factor, and technology linkages of U.S. industries are a result
of worldwide MNC agglomeration patterns. We also include a vector of industry dummies to
control for all industry-speci�c agglomeration motives.
Our empirical analysis shows that the location fundamentals of multinational production,
although important, are not the only driving force in the patterns of MNC o¤shore agglom-
eration. Agglomeration economies� especially capital-good market externality and technology
di¤usion� are crucial determinants of MNCs�overseas location decisions. Further, as suggested
by the stylized patterns we �rst document, the relative importance of location fundamentals and
agglomeration economies varies signi�cantly between MNC o¤shore subsidiaries and domestic
plants and between MNC o¤shore subsidiaries and MNC headquarters.
� Capital-good market externality and technology di¤usion exert a stronger e¤ect on theagglomeration of MNCs�foreign subsidiaries than on domestic plants in the same industry
pairs.
� Location fundamentals (including market size and comparative advantage) and labor mar-ket externality have a stronger e¤ect on the agglomeration patterns of domestic plants.
� Location fundamentals and capital-good market externality exert a stronger e¤ect on theo¤shore agglomeration of MNCs, while technology di¤usion and labor market externality
are the leading forces behind the agglomeration of MNC headquarters. Vertical production
linkages, in contrast, matter for MNC o¤shore clustering only.
These �ndings are largely consistent with the characteristics of multinational �rms. Relative
to their domestic counterparts in the same industry, MNC o¤shore subsidiaries are, on average,
more capital and knowledge intensive. As a result, they have stronger motives than domestic
plants to agglomerate with each other when their industries exhibit potential for capital-good
market externality and technology di¤usion. Moreover, the increasing segmentation of activi-
ties within the boundary of multinational �rms motivates MNC foreign subsidiaries and MNC
headquarters to follow di¤erent agglomeration patterns. In particular, the market-seeking and
input-sourcing focuses of o¤shore production motivates MNC foreign subsidiaries to place greater
emphasis on location fundamentals, input-output linkages, and capital-good market externalities,
while the emphasis of headquarters on knowledge-intensive activities such as R&D, management,
and services leads MNC headquarters to agglomerate for technology di¤usion and labor market
externality.
To alleviate concerns of endogenous agglomeration economy measures, we also examine re-
gional agglomeration patterns from which the United States is excluded and �nd the results to
be robust. If U.S. domestic industry-pair relationships could be a¤ected by the agglomeration of
4
MNCs in the U.S., then one would expect that the former would not be a¤ected by the agglom-
eration of MNCs located in other regions like Europe. We also investigate not just the pattern,
but also the process of agglomeration. Exploring the dynamics in MNCs�o¤shore agglomeration
sheds light on the formation of MNC clusters and mitigates the possibility of reverse causa-
tion between our measures of location fundamentals and agglomeration economies and MNCs�
agglomeration patterns.
Finally, we examine micro agglomeration patterns by constructing and exploring plant-level
agglomeration indices. Speci�cally, we examine how a given plant�s characteristics� such as size,
age, foreign ownership, and the number of products� and its industry�s characteristics� such as
capital intensity, skilled-labor intensity, and R&D intensity� might jointly explain the extent of
agglomeration centered around the plant. We �nd that the degree of agglomeration varies sharply
across plants in the same industry. Multinational plants attract signi�cantly more agglomeration
than domestic plants in capital-, skilled-labor-, and R&D-intensive industries. The results are
consistent with the industry-level agglomeration patterns we document and suggest that multi-
national �rms enjoy greater bene�ts from agglomeration than their domestic counterparts do for
capital- and knowledge-intensive activities.
The rest of the paper is organized as follows. Section 2 reviews the related literature. Section
3 discusses the methodology and the data with which we quantify the agglomeration of multina-
tional and domestic �rms. Section 4 describes the agglomeration patterns observed worldwide
and presents the emerging stylized facts. Section 5 describes the methodology we use to measure
location fundamentals and agglomeration economies. Section 6 reports the econometric analysis
on the determinants of MNC agglomeration in comparison with the agglomeration of non-MNC
plants. Section 7 presents analyses of agglomeration patterns in Europe and the agglomera-
tion process of MNCs to address endogeneity concerns as well as plant-level results. Section 8
concludes.
2 Related Literature
Our paper builds on the extensive theoretical and empirical literature in international trade that
examines MNCs�decision to invest abroad. Two main motives of foreign investment have been
stressed. First, �rms produce overseas to avoid trade costs. This strategy, referred to as the
market-access (or tari¤ jumping) motive, leads �rms to deploy the same production processes
across countries (see, for example, Markusen and Venables, 2000). Second, �rms locate di¤erent
stages of production in countries where the intensively-used factor is abundant. This strategy
is referred to as the comparative-advantage motive (see, for example, Helpman, 1984). These
two motives, leading to horizontal and vertical FDI respectively, have been synchronized in the
knowledge-capital model developed by Markusen and Venables (1998) and Markusen (2002) and
5
examined in a number of empirical studies.6
In this paper, we investigate the extent to which the location fundamentals of multinational
production explain the clustering of MNC o¤shore activities. However, we go beyond the em-
phasis on location fundamentals and introduce a separate category of factors� agglomeration
economies. An overview of the vast regional and urban economics literature evaluating the
importance of Marshallian agglomeration forces in domestic economic geography is beyond the
scope of our paper. We focus below on the empirical studies most closely related to our analysis.7
As noted earlier, a central issue in agglomeration studies is the measurement of agglom-
eration. Ellison and Glaeser�s (1997) in�uential paper introduces a "dartboard" approach to
construct an index of spatial concentration. The authors note that even in an industry with no
tendency for clustering, random locations may not generate regular location patterns due to the
fact that number of plants is never arbitrarily large. Their index thus compares the observed
distribution of economic activity in an industry to a null hypothesis of random location and
controls for the e¤ect of industrial concentration, an issue that has been noted to a¤ect the ac-
curacy of previous indices. Using Ellison and Glaeser�s (1997) index to evaluate the importance
of agglomeration forces in explaining the localization of U.S. industries, Rosenthal and Strange
(2001) �nd that both labor-market pooling and input-output linkages have a positive impact on
agglomeration. Overman and Puga (2009), also using Ellison and Glaeser�s (1997) index, exam-
ine the role of labor-market pooling and input sharing in determining the spatial concentration
of UK manufacturing establishments. They �nd that sectors whose establishments experience
more idiosyncratic employment volatility and use localized intermediate inputs are more spatially
concentrated.
The study by DO advances the literature by developing a spatially continuous concentration
index that is independent of the level of geographic disaggregation (see Section 3.1 for a detailed
description). Applying this index, EGK employ an innovative empirical approach that exploits
the coagglomeration of U.S. industries to disentangle the e¤ects of Marshallian agglomeration
economies. Like Rosenthal and Strange (2001), they �nd a particularly important role for input-
output relationships.
Exploring the role of agglomeration economies in MNCs�location patterns also relates our
paper to a literature in international trade. Several studies (see, for example, Head, Ries, and
Swenson, 1995; Head and Mayer, 2004a; Bobonis and Shatz, 2007; Debaere, Lee and Paik,
2010) have examined the role of distance and production linkages in individual multinationals�
6The work by Carr, Markusen, and Maskus (2001), Yeaple (2003a), and Alfaro and Charlton (2009), forexample, o¤ers empirical support for both types of motives.
7Another important strand of empirical literature concerns one of the key theoretical predictions of New Eco-nomic Geography models: factor prices should vary systematically across locations with respect to market access.See, for example, Redding and Venables (2004) and Hanson (2005) for related empirical evidence. Among thelatest contributors to this literature are Ahlfeldt et al. (2012), who introduce a structural estimation approachincorporating both location fundamentals and agglomeration economies. The authors combine a quantitativemodel of city structure with the natural experiment of Berlin�s division and reuni�cation and �nd that the modelaccounts for the observed changes in factor prices and employment.
6

location decisions. The results of these studies, which suggest that MNCs with vertical linkages
tend to agglomerate within a host country/region, shed light on the role of vertical production
relationship in the economic geography of multinational production.
Our analysis, assessing the patterns and causes of global agglomeration with particular em-
phasis on MNCs, contributes to the literature in several ways. First, instead of examining
domestic agglomeration patterns in an individual country, our analysis o¤ers a perspective on
the structure of industrial agglomeration at both the world and the region level.
Second, we investigate how the agglomeration of the most mobile and distinctive group of
�rms� the multinationals� compare to the agglomeration of domestic �rms. We re-consider
de�nitions of location fundamentals in the context of MNCs and develop a new quantitative
measure to capture the role of location fundamentals in MNCs�spatial concentrations. We also
construct agglomeration indices based on estimates of trade costs between each pair of establish-
ments to account for trade barriers other than distance. Further, we evaluate how agglomeration
economies, particularly the value of external scale economies in capital goods and knowledge,
a¤ect MNCs relative to domestic �rms, given MNCs�vertically-integrated organizational form
and large investment in capital goods and technologies.
Third, we address the potential endogeneity of location fundamentals and agglomeration
economies by exploring regional and dynamic patterns of MNCs.
Fourth, we perform an analysis of plant-level agglomeration to examine the role of plant and
industry characteristics in micro agglomeration patterns.
3 Quantifying Agglomeration: Methodology and Data
In this section, we describe the empirical methodology and data we use to quantify the global
agglomeration of multinational and domestic �rms. As noted in Head and Mayer (2004b), mea-
surement of agglomeration is a central challenge in the economic geography literature. There
has been a continuous e¤ort to designing an index that accurately re�ects the agglomeration
of economic activities. One of the latest advances in this literature is Duranton and Overman
(2005), DO, who construct an index to measure the signi�cance of agglomeration in the U. K.
DO�s index has been adapted by other studies such as EGK�s measurement of the agglomeration
of U.S. pairwise industries. We extend this index to assess and compare the degree of agglom-
eration of multinational v.s. domestic �rms worldwide. In contrast to the original index�s focus
on distance as the main form of trade cost, we construct the index based on both distance and
a generalized measure of trade costs.
3.1 Econometric Methodology
The empirical procedure to construct the agglomeration index has three steps. In the �rst
step, we estimate an actual geographic density function for each pair of industries (including
7
within-industry pairs) based on the distance and the trade costs between establishments. In
the second step, we obtain counterfactual density functions based on manufacturing plants as
a whole to control for factors that a¤ect all manufacturing plants and to compute the global
con�dence bands at each threshold distance and trade cost. In the last step, we construct
the agglomeration index to measure the extent to which establishments in an industry pair
agglomerate at a threshold relative to the counterfactuals and the statistical signi�cance thereof.
To compare global agglomeration patterns of MNC foreign subsidiaries, MNC headquarters, and
domestic plants, we repeat the procedure for each type of establishment.
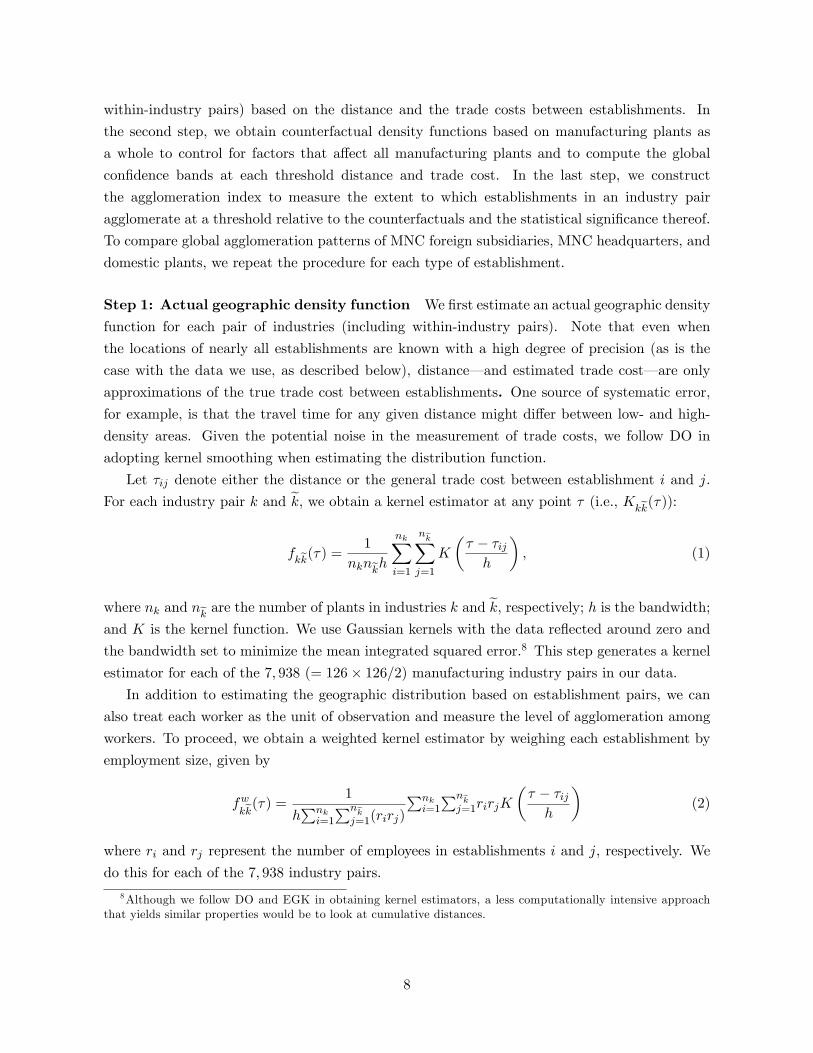
Step 1: Actual geographic density function We �rst estimate an actual geographic density
function for each pair of industries (including within-industry pairs). Note that even when
the locations of nearly all establishments are known with a high degree of precision (as is the
case with the data we use, as described below), distance� and estimated trade cost� are only
approximations of the true trade cost between establishments. One source of systematic error,for example, is that the travel time for any given distance might di¤er between low- and high-
density areas. Given the potential noise in the measurement of trade costs, we follow DO in
adopting kernel smoothing when estimating the distribution function.
Let �ij denote either the distance or the general trade cost between establishment i and j.
For each industry pair k and ek, we obtain a kernel estimator at any point � (i.e., Kkek(�)):
fkek(�) = 1
nknekhnkXi=1
nekXj=1
K
�� � �ijh
�; (1)
where nk and nek are the number of plants in industries k and ek, respectively; h is the bandwidth;and K is the kernel function. We use Gaussian kernels with the data re�ected around zero and
the bandwidth set to minimize the mean integrated squared error.8 This step generates a kernel
estimator for each of the 7; 938 (= 126� 126=2) manufacturing industry pairs in our data.In addition to estimating the geographic distribution based on establishment pairs, we can
also treat each worker as the unit of observation and measure the level of agglomeration among
workers. To proceed, we obtain a weighted kernel estimator by weighing each establishment by
employment size, given by
fwkek(�) = 1
hPnki=1
Pnekj=1(rirj)
Pnki=1
Pnekj=1rirjK
�� � �ijh
�(2)
where ri and rj represent the number of employees in establishments i and j, respectively. We
do this for each of the 7; 938 industry pairs.
8Although we follow DO and EGK in obtaining kernel estimators, a less computationally intensive approachthat yields similar properties would be to look at cumulative distances.
8

Step 2: Counterfactuals and global con�dence bands To obtain counterfactual estima-
tors, we estimate the geographic distribution of the manufacturing multinationals as a whole in
order to control for factors that a¤ect all manufacturing multinational plants. We proceed by
drawing, for each of the 7,938 industry pairs, 1,000 random samples, each of which includes two
counterfactual industries. In measuring the agglomeration patterns of MNCs, the random sam-
ples are drawn from the entire set of MNC establishment locations in manufacturing industries.9
Note that to control for the potential e¤ect of industry concentration, it is important that the
counterfactual industry in each sample has the same number of observations as the actual data.
We then calculate the bilateral distance between each pair of establishments and obtain a kernel
estimator, unweighted or weighted by employment, for each of the 7,938,000 samples. This gives
1; 000 kernel estimators for each of the 7; 938 industry pairs.
We compare the actual and counterfactual kernel estimators at various distance (and cor-
responding trade cost) thresholds, including 200, 400, 800, and 1,600 kilometers (thresholds
previously considered by DO and EGK).10 We compute the 95% global con�dence band for each
threshold distance. Following DO, we choose identical local con�dence intervals at all levels of
distance such that the global con�dence level is 5%. We use fkek(�) to denote the upper global
con�dence band of industry pair k and ek. When fkek(�) > f
kek(�) for at least one � 2 [0; T ],the industry pair is considered to agglomerate at T and to exhibit greater agglomeration than
counterfactuals. Graphically, it is detected when the kernel estimates of the industry pair lie
above its upper global con�dence band.
Step 3: Agglomeration index We now construct the agglomeration index. Following EGK,
for each industry pair k and ek, we obtainagglomeration
kek(T ) �XT
�=0max
�fkek(�)� fkek(�); 0� (3)
or employment-weighted
agglomerationwkek(T ) �
XT
�=0max
�fwkek(�)� fwkek(�); 0
�: (4)
The index measures the extent to which establishments in industries k and ek agglomerate atthreshold T and the statistical signi�cance thereof. When the index is positive, the level of
agglomeration between industries k and ek is signi�cantly greater than that of counterfactuals.DO�s index addresses three key issues that arise with traditional measures of agglomera-
tion, most of which have tended to equalize agglomeration with activities located in the same9An alternative approach would be to use all existing establishment locations, including domestic and MNC,
as the counterfactuals. This would help to control for the e¤ect of general location factors instead of those thata¤ect primarily the location decisions of MNCs. In Section 6.2, we perform an analysis in that direction byusing domestic establishments as the benchmark and comparing the agglomeration patterns of MNC and domesticplants.10We also considered lower distance thresholds, such as 20, 50, and 100 km in Section 7.1.
9
administrative or geographic region (measured by number of �rms or volume of production in
the region). First, the traditional measures can be strongly driven by industrial concentration.
Industries with a small number of establishments may appear agglomerative when they are not.
Second, the measures often cannot separate the geographic concentration of manufacturing in-
dustry due to location attractiveness from agglomeration. Third, previous measures, by equating
agglomeration with activities in the same region, can omit agglomerating activities separated by
administrative or geographic borders, while overestimating the degree of agglomeration within
the same administrative or geographic units. The accuracy of these measures is thus dependent
on the scale of geographic units. Ellison and Glaeser (1997) develop an index that solves the
�rst two problems. DO address the remaining issue of the dependence of existing measures on
the level of geographic disaggregation by developing a "continuous-space concentration index."
DO�s index thus exhibits �ve important properties essential to agglomeration measures. First,
it is comparable across industries and captures cross-industry variation in the level of agglomer-
ation. Second, it controls for industrial concentration within each industry. Third, its construc-
tion is based on a counterfactual approach and controls for the e¤ect of location factors� such
as market size, natural resources, and policies� that apply to all manufacturing plants. Fourth,
by taking into account spatial continuity, the index is unbiased with respect to the scale and
aggregation of geographic units. Fifth, the index o¤ers an indication of the statistical signi�cance
of agglomeration.
However, the construction of this index poses two constraints. First, the index requires
detailed physical location information for each establishment. As described next, the WorldBase
dataset, supplemented by a geocoding software, satis�es this requirement. Second, the simulation
approach adopted in the empirical procedure is extremely computationally intensive, especially
for large datasets and analysis of pairwise-industry agglomeration. Constructing the index for
di¤erent types of establishment further increases the computational burden.
3.2 Data: The WorldBase Database
Our empirical analysis uses a unique worldwide establishment dataset, WorldBase, that covers
more than 43 million public and private establishments in more than 100 countries and territories.
WorldBase is compiled by Dun & Bradstreet (D&B), a leading source of commercial credit and
marketing information since 1845. D&B� presently operating in over a dozen countries either
directly or through a¢ liates, agents, and associated business partners� compiles data from a
wide range of sources including public registries, partner �rms, telephone directory records, and
websites.11 All information collected by D&B is veri�ed centrally via a variety of manual and
automated checks.12
11For more information, see: http://www.dnb.com/us/about/db_database/dnbinfoquality.html. The datasetused in this paper was acquired from D&B with disclosure restrictions.12Early uses of D&B data include, for example, Lipsey�s (1978) comparisons of the D&B data with existing
sources with regard to the reliability of U.S. data. More recently, Harrison, Love, and McMillian (2004) use D&B�scross-country foreign ownership information. Other research that has used D&B data includes Rosenthal and
10

Cross-Country Coverage and Geocode Information D&B�s WorldBase is, in our view,
an ideal data source for the research question proposed in this study. It o¤ers several advan-
tages over alternative data sources. First, its broad cross-country coverage enables us to examine
agglomeration on a global and continuous scale. Examining the global patterns of agglomera-
tion allows us to o¤er a systematic perspective that takes into account nations at various stages
of development. Viewing agglomeration on a continuous scale is important in light of the in-
creasing geographic agglomeration occurring across regional and country borders. Examples of
cross-border clusters include the metalworking and electrical-engineering cluster involving Ger-
many and German-speaking Switzerland; an electric-machinery cluster involving Switzerland and
Italy; a biotech cluster spreading across Germany, Switzerland, and France; an automobile indus-
try cluster that crosses the border of Germany and Slovakia; the Ontario-Canada-Michigan-US
(Windsor-Detroit) auto cluster; and the Texas-Northeastern-Mexico cluster. Table A.1 shows
that more than 20 percent of pairs of multinational plants that are within 200 km of each other
are in di¤erent countries. The percentage rises to 40 percent at 400 km. This is not surpris-
ing given countries� growing participation in regional trading blocs and the rapid declines in
cross-border trade costs.
Second, the database reports detailed information for multinational and non-multinational,
o¤shore and headquarters establishments. This makes it possible to compare agglomeration
patterns across di¤erent types of establishment and to investigate how the economic geography
of production evolves with forms of �rm organization.
Third, the WorldBase database reports the physical address and postal code of each plant,
whereas most existing datasets report business registration addresses. The physical location
information enables us to obtain precise latitude and longitude information for each plant in the
data and compute the distance as well as trade cost between each establishment pair. Existing
studies have tended to use distance between administrative units, such as state distances, as a
proxy for distance of establishments. In doing so, establishments proximate in actual distance but
separated by administrative boundaries (for example, San Diego and Phoenix) can be considered
dispersed. Conversely, establishments far apart but still in the same administrative unit (for
example, San Diego and San Francisco) can be counted as agglomeration.
We obtain latitude and longitude codes for each establishment using a geocoding software
(GPS Visualizer). This software uses Yahoo�s and Google�s Geocoding API services, well known
as the industry standard for transportation data. It provides more accurate geocode information
than most alternative sources. The geocodes are obtained in batches and veri�ed for precision.
We apply the Haversine formula to the geocode data to compute the great-circle distance be-
tween each pair of establishments. To account for other forms of trade barriers, such as border,
language, and tari¤s, we further obtain in Section 6.4 an estimated measure of trade cost between
Strange�s (2003) analysis of micro-level agglomeration in the United States; Acemoglu, Johnson, and Mitton�s(2009) cross-country study of concentration and vertical integration; and Alfaro and Charlton�s (2009) analysis ofvertical and horizontal activities of multinationals.
11

each pair of plants based on conventional gravity-equation estimations. The distance and the
trade cost information are then both used to construct an index of agglomeration following the
empirical methodology described in Section 3.1.
MNC and Domestic Establishment Data Our empirical analysis is based on MNC o¤shore
subsidiaries, MNC headquarters, and domestic plants in 2005.13 WorldBase reports, for each
establishment in the dataset, detailed information on location, ownership, and activities. Four
categories of information are used in this paper: (i) industry information including the four-
digit SIC code of the primary industry in which each establishment operates; (ii) ownership
information including headquarters, domestic parent, global parent, status (for example, joint
venture and partnership), and position in the hierarchy (for example, branch, division, and
headquarters); (iii) detailed location information for both establishment and headquarters; and
(iv) operational information including sales, employment, and year started.
An establishment is deemed an MNC foreign subsidiary if it satis�es two criteria: (i) it
reports to a global parent �rm, and (ii) the headquarters or the global parent �rm is located in
a di¤erent country. The parent is de�ned as an entity that has legal and �nancial responsibility
for another establishment.14 We drop establishments with zero or missing employment values
and industries with fewer than 10 observations.15
Our �nal sample includes 32,427 MNC o¤shore manufacturing plants. Top industries include
Electronic Components and Accessories (367), Miscellaneous Plastics Products (308), Motor
Vehicles and Motor Vehicle Equipment (371), General Industrial Machinery and Equipment
(356), Laboratory Apparatus and Analytical, Optical, Measuring, and Controlling Instruments
(382), Drugs (283), Metalworking Machinery and Equipment (354), Construction, Mining, and
Materials Handling (353), and Special Industry Machinery except Metalworking (355). Top host
countries include China, the United States, the United Kingdom, Canada, France, Poland, the
Czech Republic, and Mexico.
To examine the coverage of our MNC establishment data, we compared U.S. owned sub-
sidiaries in the WorldBase database with the U.S. Bureau of Economic Analysis�(BEA) Direct
Investment Abroad Benchmark Survey, a legally mandated con�dential survey conducted every
�ve years that covers virtually the entire population of U.S. MNCs. The comparison revealed
similar accounts of establishments and activities between the two databases. We also compared
WorldBase with UNCTAD�s Multinational Corporation Database. These two databases di¤er in
13 In Section 6, when comparing the agglomeration patterns of MNC and non-MNC plants, we expand theanalysis to include domestic �rms.14There are, of course, establishments that belong to the same multinational family. Although separately
examining the interaction of these establishments is beyond the focus of this paper, we expect the Marshallianforces to have a similar e¤ect here. For example, subsidiaries with an input-output linkage should have incentivesto locate near one another independent of ownership. See Yeaple (2003b) for theoretical work in this area and Chen(2011) for supportive empirical evidence. One can use a similar methodology (estimating geographic distributionsof establishments that belong to the same �rm and comparing them with distributions of counterfactuals) to studyintra-�rm interaction (see Duranton and Overman, 2008).15Requiring positive employment helps to exclude establishments registered exclusively for tax purposes.
12
that the former reports at the plant level and the latter at the �rm level. For the U.S. and other
major FDI source countries, the two databases report similar numbers of �rms, but WorldBase
contains more plants. See Alfaro and Charlton (2009) for detailed discussion of the WorldBase
data and comparisons with other data sources.
Measuring the agglomeration of all domestic manufacturing plants worldwide is infeasible
given the size of the WorldBase dataset and the computational intensity of the procedure. Con-
sequently, we adopt a random sampling strategy to keep the analysis feasible. For each SIC
3-digit industry with more than 1,000 observations, we obtain a random sample of 1,000 plants.
For industries with fewer than 1,000 observations, we include all domestic plants. This yields a
�nal sample of 127,897 domestically owned plants.
4 The Global Agglomeration of MNCs and Domestic Plants:
Stylized Facts
In this section, we examine various properties of the agglomeration indices for MNCs and domes-
tic plants� including all within- and between-industry pairs� and present a number of stylized
facts that emerge from the agglomeration patterns.
First, in Table 1 which shows descriptive statistics of the agglomeration indices for MNC
foreign subsidiaries, domestic plants, MNC subsidiary workers, and MNC headquarters, we note
that multinational headquarters exhibit, on average, the highest agglomeration index. At 200 km,
the average value of the agglomeration index, re�ecting the average degree of pairwise-industry
agglomeration (relative to the global con�dence band), is 0.140 percent for MNC headquarters,
0.102 percent for domestic plants, and 0.099 percent for MNC foreign subsidiaries.16
[Table 1 about here]
In contrast, MNC subsidiaries, measured in terms of either individual subsidiaries or workers,
have the lowest agglomeration index among the di¤erent types of plant; the average value at the
200 km level is close to 0.1 percent, with the maximum value reaching 3.06 percent. At the more
aggregate 400 km level, the average value increases to 0.22 percent, with the maximum reach-
ing 6.63 percent. Industry pairs that exhibit some of the highest o¤shore agglomeration index
values, reported in Table A.3, include Footwear except Rubber (314) and Boot and Shoe Cut
Stock and Findings (313); Knitting Mills (225) and Footwear except Rubber (314); Dolls, Toys,
16The average values all rise substantially� to 0.48 percent for MNC headquarters, 0.35 percent for domesticplants, and 0.33 percent for MNC foreign subsidiaries� when we censor the data on only those industry pairswith signi�cant positive agglomeration indices. Note, further, that as noted by DO, the absolute scale of theagglomeration index is driven by the geographic scope of the dataset and the empirical methodology and hasrelatively little meaning. Because we take into account the distance of all establishment pairs worldwide (themaximum distance being around 20,000 km), kernel estimates at each distance level will be low. Adoption ofthe Monte Carlo approach also means that the indices are constructed based on di¤erences from the 95% globalcon�dence bands and a positive value represents statistically signi�cant evidence of agglomeration.
13

Games (394) and Sporting and Athletic and Footwear except Rubber (314); Miscellaneous Pub-
lishing (274) and Paperboard Mills (263); and Miscellaneous Publishing (274) and Miscellaneous
Transportation Equipment (379).
The di¤erences in agglomeration intensity across di¤erent types of plant, summarized as our
�rst stylized fact, are consistent with the knowledge capital theory of multinational �rms (see
Markusen, 2002), which predicts that MNC headquarters should concentrate in skilled-labor-
abundant countries and subsidiaries should be dispersedly distributed across host regions based
on markets and comparative advantages. Our �nding also lends empirical support to theoretical
predictions in urban economics which suggest greater clustering of headquarters relative to that
of manufacturing plants (see, for example, Duranton and Puga, 2005).
Stylized Fact 1: Across di¤erent types of plant, multinational headquarters are, on average,most agglomerative, followed by domestic plants and multinational foreign subsidiaries.
In Table A.2, we present descriptive statistics for within- and between-industry agglomeration
indices, respectively. We �nd that (i) stylized fact 1 holds for both within- and between-industry
pairs; and (ii) �rms in the same industry are more agglomerative than �rms from di¤erent
industries. The latter observation is consistent with the expectation noted in both EGK and
our paper that location fundamentals and various agglomeration economies all motivate �rms
in the same industry to agglomerate with each other whereas �rms from di¤erent industry pairs
exhibit greater variation in their relatedness in production, factor markets, and technology space,
thereby displaying weaker average agglomeration incentives.
Next, we examine in Table 2 the correlations of agglomeration indices across di¤erent types of
plant. Comparing the index of MNC agglomeration with that of domestic plants, we �nd that the
correlation of the MNC-foreign-subsidiary and the domestic-plant agglomeration indices is 0.2
at 200 km, suggesting that multinational and non-multinational plants exhibit sharply di¤erent
spatial patterns. Speci�cally, the index is higher for domestic plants in about half of industry
pairs at 200 km. The agglomeration patterns of MNC headquarters and foreign subsidiaries are
correlated with a higher coe¢ cient of 0.41 at 200 km, implying that while, for some industry pairs,
the clusters of MNC subsidiaries resemble those of headquarters, for other industry pairs, the two
types of establishment exhibit distinctly di¤erent agglomeration patterns. These observations,
summarized in stylized fact 2, indicate that the emerging o¤shore clusters of MNCs are not merely
a projection of the domestic clusters. The driving forces of MNCs�o¤shore agglomeration are
likely to vary from those of domestic plants and MNC headquarters, as we explore in Section
6.17
[Table 2 about here]
17Similarly, the correlations do not change signi�cantly when we drop within-industry agglomeration indices(which consist of 126 observations).
14

Stylized Fact 2: The agglomeration of multinational foreign subsidiaries exhibits a low corre-lation with the agglomeration of domestic plants.
Now we explore whether di¤erences in multinational and domestic plants� agglomeration
patterns exhibits any relationship with industry characteristics such as capital intensity, skilled-
labor intensity and R&D intensity.18
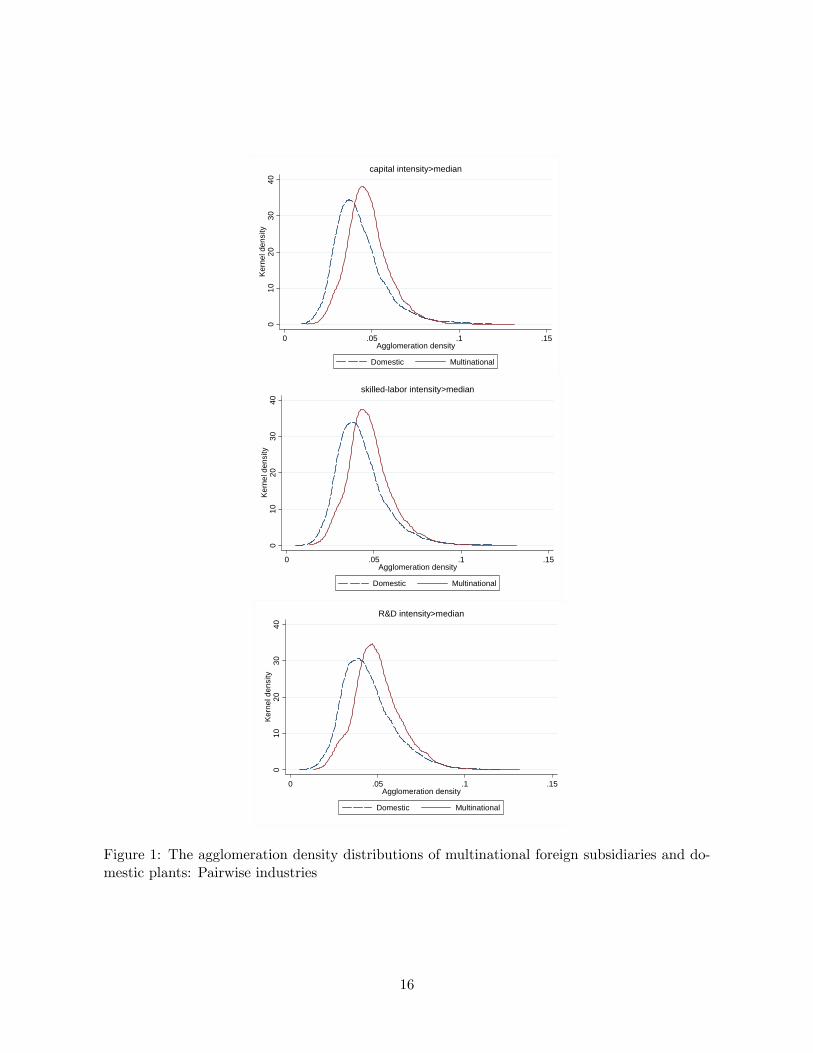
In Figure 1, we plot the distributions of pairwise-industry agglomeration densities for multi-
national foreign subsidiaries and domestic plants, respectively. We �nd that for industries with
greater than median levels of capital intensity, the distribution shifts rightward for multinational
foreign subsidiaries compared to domestic plants. This pattern is similarly observed for industries
with greater than median levels of skilled-labor intensity and R&D intensity: in skilled-labor and
R&D intensive industries, the distribution of multinational foreign subsidiaries�agglomeration
densities dominates the distribution of domestic plants.19
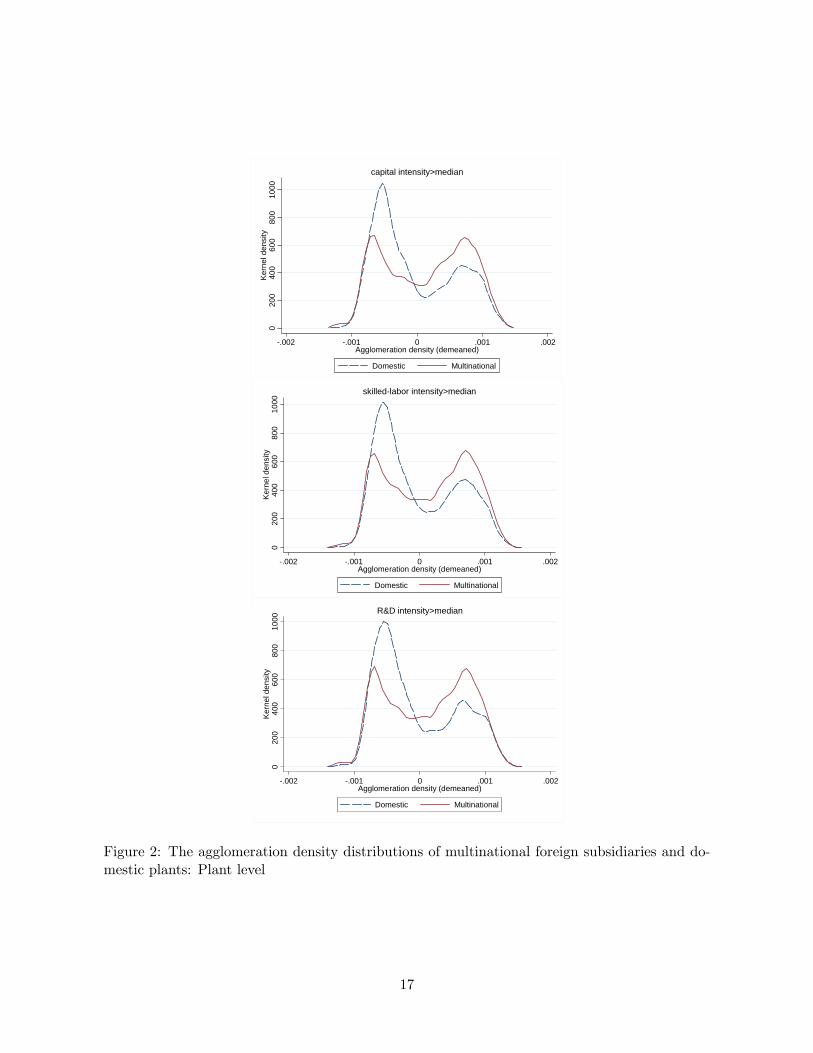
We also plot the distribution of agglomeration densities at the plant level, for multinational
foreign subsidiaries and domestic plants, respectively. We compute a agglomeration density
for each plant� following the methodology in Section 3.1� to measure the degree to which a
plant is proximate to other plants (from both the same and other industries). The plant-level
densities are then demeaned by industry averages to ensure within-industry comparisons. Similar
to industry-level patterns, we show in Figure 2 that multinational foreign subsidiaries exhibit
greater agglomeration than their domestic peers in capital-, skilled-labor-, and R&D-intensive
industries.
These �ndings, summarized as our stylized fact 3, suggest that in industries with high capi-
tal, skilled-labor, and R&D requirements, MNCs� which tend to be more productive and more
capital- and knowledge-intensive than domestic �rms in the same industry� are more likely to
provide as well as derive bene�ts of capital market externality and technology di¤usion� than
their domestic peers� and thus are more likely to cluster with each other o¤shore.
Stylized Fact 3: Multinational foreign subsidiaries are more agglomerative than domestic plantsin capital-, skilled-labor-, and R&D-intensive industries.
5 Measuring MP Location Fundamentals and Agglomeration
Economies
After presenting stylized facts of the agglomeration indices, we now turn to economic factors that
could systematically account for the observed agglomeration patterns of MNCs. Incorporating
18We use the NBER-CES Manufacturing Industry Database to construct each industry�s capital and skilled-labor intensities, which are de�ned as, respectively, the ratio of investment and of non-production workers�payrollto value added. Each industry�s R&D intensity is measured using the median �rm�s ratio of R&D expenditurerelative to value added based on the COMPUTSTAT database.19The pattern, again, does not change when within-industry agglomeration indices are excluded.
15
010
2030
40Ke
rnel
den
sity
0 .05 .1 .15Agglomeration density
Domestic Multinational
capital intensity>median
010
2030
40Ke
rnel
den
sity
0 .05 .1 .15Agglomeration density
Domestic Multinational
skilled-labor intensity>median
010
2030
40Ke
rnel
den
sity
0 .05 .1 .15Agglomeration density
Domestic Multinational
R&D intensity>median
Figure 1: The agglomeration density distributions of multinational foreign subsidiaries and do-mestic plants: Pairwise industries
16
020
040
060
080
010
00Ke
rnel
den
sity
-.002 -.001 0 .001 .002Agglomeration density (demeaned)
Domestic Multinational
capital intensity>median
020
040
060
080
010
00Ke
rnel
den
sity
-.002 -.001 0 .001 .002Agglomeration density (demeaned)
Domestic Multinational
skilled-labor intensity>median
020
040
060
080
010
00Ke
rnel
den
sity
-.002 -.001 0 .001 .002Agglomeration density (demeaned)
Domestic Multinational
R&D intensity>median
Figure 2: The agglomeration density distributions of multinational foreign subsidiaries and do-mestic plants: Plant level
17
multinational �rm theories with the literature of economic geography, the location decisions
of multinational �rms can be viewed as a function of two categories of factors. One consists of
location fundamentals of MP� such as market access and comparative advantage� that motivate
MNCs to invest in a given country; the other consists of agglomeration forces including (i) vertical
production linkages, (ii) externality in labor markets, (iii) externality in capital-good markets,
and (iv) technology di¤usion. We describe below how each of these factors is measured in the
empirical analysis.
5.1 MP Location Fundamentals
We construct a measure of MP location fundamentals by incorporating an empirical approach
from the multinational �rm literature with the agglomeration index methodology and invoking
a two-step procedure.
Step 1: Estimating MNC activity predicted by location fundamentals In the �rst
step, we seek to obtain estimates of multinational activity predicted by location fundamentals
including market size, trade cost, comparative advantage, natural advantage and etc. To obtain
such estimates, we consider two alternative speci�cations.
In the �rst speci�cation, we estimate a conventional empirical equation following Carr,
Markusen and Maskus (2001), Yeaple (2003a), and Alfaro and Charlton (2009). Using a con-
ventional empirical speci�cation enables us to assess how MP location fundamentals commonly
stressed by previous studies a¤ect MNCs�agglomeration patterns. Speci�cally, we consider the
following speci�cation:
yceck = 0 + 1marketsize_sizecec + 2distancecec + 3skill_diffcec+ 4skill_diffcec � skillintensityk + 5tariffceck + 6tariffecck ++�ck + �0eck + "ceck (5)
where yceck denotes either the number or the total employment of subsidiaries in country ec andindustry k owned by MNCs in country c, marketsize_avecec is the average market size proxiedby the average GDP of the home and host countries,20 distancecec is the distance, skill_diffcecrepresents the di¤erence in skill endowment, measured by average years of schooling, between
the home and the host countries (i.e., skillec � skillc), skillintensityk is the skilled-labor inten-sity proxied by share of non-production workers in total payroll for each industry, tariffceck andtariffecck are the levels of tari¤ set by the host country ec on the home country c and vice versa inindustry k, and "ceck are the residuals. In addition to the above variables, host-country character-istics such as institutional and physical infrastructure could also a¤ect multinationals�location
decisions.21 We therefore include vectors of country-industry dummies, �ck and �0eck, to con-20 In addition to GDP, we consider market potential which is the sum of domestic and distance-weighted export
market sizes of the home and host countries.21As noted by Helpman (2006), �rms�sorting patterns and organization choices are dependent on the charac-
18

trol for all country-industry speci�c factors such as institutional quality, physical infrastructure,
domestic industry size, and economic policies.22
We obtain GDP data from the World Bank�s WDI database, distance from the CEPII Gravity
dataset, education information from Barro and Lee (2000), and tari¤ data from the TRAINS
database. All host-country characteristics are lagged by 5 years to mitigate reverse causality.
We estimate Equation (5) using Poisson quasi-MLE (QMLE).23 If market access is a signi�cant
motive in MNCs� investment decisions, we expect the e¤ects of host-country market size and
trade cost (measured by distance and tari¤) to be positive; that is, 1 > 0, 2 > 0, and 5 > 0.
If comparative advantage is a signi�cant motive, we expect the e¤ect of trade cost to be negative
and the e¤ect of di¤erence in skilled labor endowment to be negative for unskilled-labor intensive
industries; that is, 2 < 0, 4 > 0, 5 < 0, and 6 < 0. Our estimates are largely in line with
the literature (see, for example, Yeaple, 2003a; Alfaro and Charlton, 2009). Consistent with
the market access motive, MNCs are found to be more likely to invest in countries with a
larger market size ( 1 > 0). Consistent with the comparative advantage motive, we found that
(i) MNCs are more likely to invest in unskilled-labor abundant countries ( 3 < 0), especially
in unskilled-labor intensive industries ( 4 > 0), and (ii) trade cost exerts a negative e¤ect on
MNCs�investment decisions ( 2 < 0 and 5 < 0).24
Based on the estimates of Equation (5), we obtain and sum, for each host country ec andindustry k, the values of yceck predicted by market access and comparative advantage factors.To construct predicted MNC activities at a more disaggregated location level, we use the actual
share of multinationals in each city to capture cross-city variations in attractiveness (for example,
port access and favorable industrial policies). Multiplying the actual share by byeck gives bysk foreach city s and industry k.
In an alternative speci�cation, we directly estimate MNC activity at a disaggregated region
level. To proceed, we re-consider Equation (5) to examine MNC activity at the region, rather
than the country, level and include a series of regional characteristics, such as market size, natural
and comparative advantages, and infrastructure, as additional regressors to capture the e¤ect of
regional location fundamentals. The main advantage of this speci�cation is that we can examine
the role of regional characteristics in MNCs�location decisions, instead of relying on the role of
teristics of the �rms and on the contractual environment (see, for example, Antras, 2003; Grossman and Helpman,2002). Empirical evidence also suggests that institutional development (such as the rule of law and intellectualproperty rights) exerts a positive e¤ect on the receipt of foreign investment (see Bénassy-Quéré, Coupet, andMayer, 2007; Alfaro, Kalemli-Ozcan, and Volosovych, 2008, among others).22Note that the e¤ect of agglomeration forces such as the size of upstream and downstream industries is controlled
for in equation (5) by country-industry dummies.23Santos Silva and Tenreyro (2006) point out that Poisson QMLE can be more attractive than least-square
estimators when the variance of the error term is a function of the covariates, in which case the conditionalexpectation of the logged error term in the log-form estimation equation will not be zero. Head and Ries (2008)further show that estimates produced with this method are smaller than the least-square estimates and remarkablyrobust to the treatment of zeros and missing values. Following Helpman et al. (2008), we also considered a two-step Heckman selection procedure in which we estimated, respectively, the decision to trade and volume of trade;the results were similar.24Results are suppressed because of space considerations but are available upon request.
19
country characteristics alone and then using a region�s share of MNCs as a proxy for regional
attractiveness.
The disadvantage of this speci�cation, however, is the di¢ culty to obtain disaggregated
regional data for a wide sample of countries. We searched extensively for regional economic data
across countries and, in the end, compiled a detailed database of regional characteristics from a
number of national sources. For most countries, we were constrained to obtaining information at
primarily the state or province level. Speci�cally, for countries including, for example, the U.S.,
Australia, Brazil, Canada, China, Japan, Mexico, and South Korea, we used state/province data.
For Europe, the data was compiled from the Eurostat Regional Database at the NUTS 2 level of
disaggregation, both to compare with other countries and for availability reasons. Because of data
availability constraints, the regional characteristics systematically available across countries and
included in our �nal sample are income, schooling (percentage of labor with tertiary education),
infrastructure (roadways, ports, and airports), and taxes, all measured in 2004 or the closest
year available (to mitigate causality concerns).25
Based on this database, we estimate the following equation:
ycecsk = 0 + 1marketsize_sizecec + 2distancecec + 3skill_diffcecs+ 4skill_diffcecs � skillintensityk + 5tariffceck + 6tariffecck (6)
+ 7taxecs + 8roadwayecs + 9portecs + 10airportecs + �ck + �0eck + "ceck:where ycecsk now denotes either the number or the total employment of subsidiaries in countryec�s region s and industry k owned by MNCs in country c, skill_diffcecs represents the di¤er-ence in skill endowment� measured by percentage of labor with tertiary education� between the
home country and the host region (i.e., skillecs� skillc), taxecs is the region�s corporate tax level,roadwayecs is the length of roadway in each region s, and portecs and airportecs are, respectively,binary indicators of ports and airports in the region. Again, we estimate the equation using
Poisson quasi-MLE (QMLE) and �nd estimated parameters to be largely similar to the results
from the �rst speci�cation. In addition, we �nd regional skill level and infrastructure character-
istics to matter signi�cantly in multinationals� location decisions. Based on the estimates, we
then obtain and sum, for each host country c, region s, and industry k, values of bycecsk predicted25The U.S. data was collected at the state level. Population and education attainment data were collected from
the U.S. Census; GDP and income/compensation statistics were collected from the Bureau of Economic Analysis;roadway statistics were from the Federal Highway Administration; employment data was collected from the Bureauof Labor Statistics. Australian data was compiled from the Australian Bureau of Statistics (ABS) at the statelevel. Canadian data was obtained from Statistics Canada at the provincial level. Chinese statistics were takenfrom the Population Census and the CEIC Data at the provincial level. Brazilan data was obtained from theInstituto Brasileiro de Geogra�a e Estatistica (IBGE) at the state level. Mexican data was collected from theInstituto Nacional de Estadistica y Geogra�a (INEGI) at the state level. South Korean data was collected fromthe Korean Statistical Information Service (KOSIS), at the provincial level. Japanese statistics were collected fromthe Statistics Bureau of Japan at the prefecture level. The remaining data is at the national level, collected fromsources including the World Bank. All port data was from World Port Source, and tax rates were compiled fromErnst and Young, Deloitte, KPMG, and the World Bank�s Doing Business report.
20

by the market access, comparative advantage, and infrastructure variables.
Step 2: Constructing the expected geographic density In the second stage, we repeat
Step 1 of DO�s procedure to obtain a geographic distribution function for each pair of industries
k and ek. We use the predicted levels of MNC activity (either the predicted number or total
employment of MNCs) in each region and industry (i.e., bysk and byesek) obtained from Step 1 as
the weight when estimating the kernel function. This generates, for each pair of industries,
an expected geographic density function based exclusively on the estimated e¤ects of location
characteristics. In Section 6, we compare the role of these characteristics to the roles of of
agglomeration forces in determining the spatial patterns of multinational �rms.
5.2 Agglomeration Economies
In addition to the location fundamentals of MP, agglomeration economies, too, can a¤ect multi-
nationals�location choices. The advantage of proximity can di¤er dramatically between multina-
tional and domestic �rms and between MNC foreign subsidiaries and domestic headquarters. For
instance, multinationals often incur substantial trade costs in sourcing intermediate inputs and
reaching downstream buyers. They also face signi�cant market entry costs when relocating to a
foreign country because of factors such as limited supplies of capital goods. Further, given their
technology intensity, MNCs can �nd the technology di¤usion from closely linked industries par-
ticularly attractive. We discuss below the role of each agglomeration economy in multinational
�rms�location choices and the proxies used to represent each force.
Vertical production linkages Marshall (1890) argued that transportation costs induce plants
to locate close to inputs and customers and determine the optimal trading distance between sup-
pliers and buyers. This can be especially true for MNCs, given their large volumes of sales and
intermediate inputs.26 Compared to domestic �rms, multinationals are often the leading corpo-
rations in each industry. Because they tend to be the largest customers of upstream industries
as well as the largest suppliers of downstream industries, the input-output relationship between
MNCs (for example, Dell and Intel; Ford and Delphi) can be far stronger than that between
average domestic �rms.27
To determine the importance of customer and supplier relationships in multinationals�ag-
glomeration decisions, we construct a variable, IOlinkagekek, to measure the extent of the input-
output relationship between each pair of industries. We use the 2002 Benchmark Input-Output
Data (speci�cally, the Detailed-Level Make, Use and Direct Requirement Tables) published by
the Bureau of Economic Analysis, and de�ne IOlinkagekek as the share of industry k�s inputs
26For FDI theoretical literature in this area, see, for example, Krugman (1991), Venables (1996), and Markusenand Venables (2000).27Head, Ries, and Swenson (1995) note, for example, that the dependence of Japanese manufacturers on the
"just-in-time" inventory system exerts a particularly strong incentive for vertically linked Japanese �rms to ag-glomerate abroad.
21

that come directly from industry ek and vice versa. These shares are calculated relative to allinput-output �ows including those to non-manufacturing industries and �nal consumers. As sup-
plier �ows are not symmetrical, we take either the maximum or the mean of the input and output
relationships for each pair of industries, which, as shown in Table A.5, are highly correlated. We
used the mean values in our analysis, but obtained similar results when we used the maximum
measure.
Externality in labor markets Agglomeration can also yield bene�ts through external scale
economies in labor markets. Because �rms�proximity to one another shields workers from the
vicissitudes of �rm-speci�c shocks, workers in locations in which other �rms stand ready to hire
them are often willing to accept lower wages.28 Externalities can also occur as workers move from
one job to another. This is especially true between MNCs which are characterized by similar skill
requirements and large expenditures on worker training. MNCs can have a particularly strong
incentive to lure workers from one another because the workers tend to receive certain types of
training (business practices, business culture, and so on) that are well suited for working in most
multinational �rms.29
To examine labor market pooling forces, we follow EGK in measuring each industry pair�s
similarity in occupational labor requirements. We use the Bureau of Labor Statistics� (BLS)
2006 National Industry-Occupation Employment Matrix (NIOEM), which reports industry-level
employment across detailed occupations (such as Assemblers and Fabricators; Metal Workers
and Plastic Workers; Textile, Apparel, and Furnishings Workers; Business Operations Specialists;
Financial Specialists; Computer Support Specialists; and Electrical and Electronics Engineers).
We convert occupational employment counts into occupational percentages for each industry,
map the BLS industries to the SIC3 framework, and measure each industry pair�s labor similarity,
laborkek, using the correlation in occupational percentages.
Externality in capital-good markets External scale economies can also arise in capital-
good markets. This force has particular relevance to multinational �rms given their large involve-
ment in capital-intensive activities. Geographically concentrated industries o¤er better support
to providers of capital goods (such as producers of specialized components and providers of ma-
chinery maintenance) and reduce their risk of investment (due, for example, to the existence
of resale markets).30 Local expansion of capital-intensive activities can consequently lead to
expansion of the supply of capital goods, thereby reducing the cost of capital goods.
28This argument has been formally considered in Marshall (1890), Krugman (1991), and Helsley and Strange(1990). Rotemberg and Saloner (2000), for a related motivation, argue that workers can bene�t because multiple�rms o¤er protection against ex-post appropriation of investments in human capital.29The �ow of workers can also lead to technology di¤usion, another Marshallian force discussed below.30Agglomeration can also create costs, for example, by increasing labor and land prices. Like bene�ts, these costs
can be greater for industries with similar labor and capital-good demand, in which case the estimated parametersof the variables would represent the net e¤ect of similar factor demand structures on agglomeration decisions.
22
To evaluate the role of capital-good market externalities, we construct a new measure of
industries�similarity in capital-good demand� in a spirit similar to the measure of industries�
similarity in labor demand� using capital �ow data from the Bureau of Economic Analysis
(BEA). The capital �ow table (CFT), a supplement to the 1997 benchmark input-output (I-
O) accounts, shows detailed purchases of capital goods (such as motors and generators, textile
machinery, mining machinery and equipment, wood containers and pallets, computer storage
devices, and wireless communications equipment) by using industry. We compute� for each
using industry� the share of investment in each capital good and then measure each industry
pair�s similarity in capital-good investment, denoted by capitalgoodkek, using the industry pair�s
correlation in investment shares.31
Technology di¤usion A fourth motive relates to the di¤usion of technologies. Technology
can di¤use from one �rm to another through movement of workers, interaction between those
who perform similar jobs, or direct interaction between �rms through technology sourcing. This
has been noted by Navaretti and Venables (2006), who predict that MNCs may bene�t from
setting up a¢ liates in proximity to other MNCs with advanced technology. The a¢ liates can
bene�t from technology spillovers, which can then be transferred to other parts of the company.
To capture this agglomeration force, we construct a proxy of technology di¤usion frequently
considered in the knowledge spillover literature (see, for example, Ja¤e et al., 2000; EGK),
using patent citation �ow data taken from the NBER Patent Database. The data, compiled
by Hall et al. (2001), includes detailed records for all patents granted by the United States
Patent and Trademark O¢ ce (USPTO) from January 1975 to December 1999. Each patent
record provides information about the invention (such as technology classi�cation and citations
of prior art) and about the inventors submitting the application (such as name and city). We
construct the technology di¤usion variable, that is, technologykek, by measuring the extent to
which technologies in industry k cite technologies in industry ek, and vice versa.32 In practice,there is little directional di¤erence in technology
kek due to the extensive number of citationswithin a single technology �eld. We obtain both maximum and mean for each set of pairwise
industries. We used the mean values in our analysis, but obtained similar results when using the
maximum measure.
Constructing the proxies of agglomeration economies using the U.S. industry-level account
data is motivated by three considerations. First, compared to �rm-level input-output, factor
demand, or technological information (which is typically unavailable), industry-level production,
factor and technology linkages re�ect standardized production technologies and are relatively
31Note that this measure captures a di¤erent dimension of industry-pair relatedness than vertical productionlinkages. Unlike vertical production linkages, industry-pair correlations in capital-good demand re�ect industrypairs�similarity in capital-good demand and, thus, scope for externality in capital-good markets.32The concordance between the USPTO classi�cation scheme and SIC3 industries is adopted in the construction
of the variable.
23
stable over time, limiting the potential for the measures to endogenously respond to MNC ag-
glomeration. Second, using the U.S. as the reference country while our analysis covers multi-
national activity around the world further mitigates the possibility of endogenous production,
factor, and technology linkage measures, even though the assumption that the U.S. production
structure carries over to other countries could potentially bias our empirical analysis against
�nding a signi�cant relationship. Third, the U.S. industry accounts are more disaggregated than
those of most other countries, enabling us to dissect linkages between disaggregated product
categories.
Table A.4 reports the summary statistics of industry-level control variables. Table A.5
presents the correlation matrix. As shown, the proxies of agglomeration economies have very
low correlations. For example, the correlation between industry-pair production linkage and
similarity in capital-good demand is about 0.19 and the correlation between production linkage
and technology di¤usion is 0.29. This suggests that industry pairs exhibit signi�cant variation
in their relatedness in inputs, labor, capital-goods and technology. Industry pairs with strong
input-output linkages often have weak linkages in capital goods and technology. This provides
us a key source of variation for disentangling the e¤ects of agglomeration economies.
6 Assessing the Roles of MP Location Fundamentals and Ag-
glomeration Economies
We now examine the roles of location fundamentals and agglomeration economies in explaining
the pairwise-industry agglomeration of MNCs and how the e¤ects might di¤er across multina-
tional foreign subsidiaries, domestic plants, and multinational headquarters.
Formally, we estimate the following empirical speci�cation:
agglomerationkek(T ) = �K + �1fundamentalskek (7)
+ �2IOlinkagekek + �3laborkek + �4capitalgoodkek + �5technologykek + "ij ;where agglomeration
kek(T ) is the agglomeration index of industry pairs k and ek at threshold dis-tance T (relative to the counterfactuals) and the right-hand side includes (i) the agglomeration
patterns predicted by MP location fundamentals (fundamentalskek) based on the two speci�ca-
tions considered in Section 5.1, and (ii) proxies for agglomeration forces described in Section 5.2
consisting of input-output linkages (IOlinkagekek), labor- and capital-good market similarities
(laborkek and capitalgoodkek), and technology di¤usion (technologykek).
Note that since our proxies of agglomeration forces are constructed based on the di¤erent
degrees of relatedness (such as labor- and capital-good-demand correlations) between each pair
of industries, they exhibit little or no variation for within-industry pairs (for example, laborkek
and capitalgoodkek� labor- and capital-good-demand correlations� would equal 1 for all k = ek).
As a result, estimating Equation (7) for within-industry pairs (which would yield a sample of
24

126 observations) is not meaningful and we thus exclude those pairs in the econometric analysis
after accounting for their patterns in earlier sections.33
In addition to the location fundamentals and the agglomeration economies considered above,
other industry-speci�c factors such as climate requirement could also a¤ect multinational ag-
glomeration. We control for these factors with an industry �xed e¤ect. Speci�cally, we include
�K , a vector of industry dummies that takes the value of 1 if either industry k or ek correspondsto a given industry and 0 otherwise. These industry dummies control for all industry-speci�c
factors and agglomeration patterns.
6.1 MNC O¤shore Agglomeration
We consider �rst the agglomeration of MNC foreign subsidiaries. Table 3 reports the regression
results based on the �rst speci�cation of location fundamentals. Agglomeration forces including
vertical production linkages, capital-good market correlation, and technology di¤usion all play a
signi�cant role and display the expected signs.34 For example, at 200 km a 100-percentage-point
increase in the level of technology di¤usion� that is, the percentage of patent citations between
two industries� leads to a 0.6-percentage-point increase in the agglomeration index between
industries. This is equivalent to increasing the average (0.2) by a factor of 3. The location
fundamental variable is signi�cant at 1600 km, in�uencing the spatial patterns of MNCs at a
relatively aggregate geographic level.
[Table 3 about here]
The lower panel of Table 3 reports the normalized beta coe¢ cients.35 Comparing the stan-
dardized coe¢ cients of agglomeration forces, we �nd the e¤ects of technology di¤usion and
capital-good market correlation to outweigh that of vertical production linkages, which suggests
that, given the technology- and capital-intensive characteristics of multinational �rms, it is im-
portant to take into account not only vertical production linkages but also technology di¤usion
and capital-good market externality in explaining MNCs�o¤shore agglomeration. The parameter
of labor-market correlation is insigni�cant in the multivariate regressions.36
33 In a robustness check, we included both within-industry and between-industry pairs in regressions and foundthe main results to be qualitatively similar to those reported in this section. This suggests that variations betweenindustry pairs are a key source of variation for disentangling the roles of location fundamentals and variousagglomeration forces.34 In univariate regression results for each of our main variables, all the agglomeration variables were highly
signi�cant across the di¤erent distance threshold levels. The estimated e¤ects also exhibited the expected signs.Across agglomeration forces, capital-good market correlation had the greatest impact across all distance thresholds,followed by labor-demand correlation, technology di¤usion, and production linkages. Tables showing univariateresults are suppressed from the paper due to space considerations but available upon request.35Standardized coe¢ cients enable us to compare the changes in the outcomes associated with the metric-free
changes in each covariate.36Excluding the capital-good market correlation variable, we found the technology di¤usion and production
linkage variables to remain positive and signi�cant and the labor correlation coe¢ cient to remain insigni�cant.This result suggests that the capital-good variable is capturing agglomeration incentives not represented by theother variables.
25
Comparing the estimates across distance thresholds, we �nd that at more aggregate ge-
ographic levels, the impact of technology di¤usion diminishes and the e¤ect of capital-good
market externalities rises while the role of vertical production linkages remains mostly constant.
The stronger e¤ect of technology di¤usion at shorter distance levels suggests that, compared
to the other agglomeration economies, bene�ts from technology di¤usion tend to be localized
geographically. We also considered excluding the location fundamental variable and found that
the coe¢ cients and statistical signi�cance of the agglomeration forces remain largely unchanged.
Estimation results based on the second, regional speci�cation of location fundamentals are
reported in Table 4. The estimated parameters of agglomeration economies remain largely sim-
ilar to those in Table 3. The location fundamental variable, obtained from the regional-level
speci�cation, now exerts a signi�cant e¤ect on the agglomeration of multinational foreign sub-
sidiaries at both 400 and 800 km. Comparing the relative importance of location fundamentals
and agglomeration economies, we �nd that the e¤ect of location fundamentals is outweighed by
the cumulative e¤ect of agglomeration forces. At 400 km, a one-standard-deviation increase in
location fundamentals leads to a 0.025-standard-deviation increase in the level of agglomeration,
while the cumulative e¤ect of agglomeration forces is 0.076 standard deviations.37
[Table 4 about here]
Thus far, we have examined MNC o¤shore agglomeration using the subsidiary as the unit
of observation. We now take into account the di¤erent employment sizes of multinational sub-
sidiaries, which essentially treats the worker as the unit of observation and measures the level
of agglomeration among workers. This exercise, by di¤erentiating the agglomeration incentives
between individual establishments and workers, has implications for policy making targeted at
in�uencing the geographic distribution of workers.
Tables 5 and 6 report the estimates based on the two speci�cations of location fundamen-
tals. Note that in contrast to Tables 3 and 4, in which labor market correlation does not exert
a signi�cant e¤ect, multinational subsidiaries in industries with greater potential labor market
externality exhibit signi�cantly more employment agglomeration. Technology di¤usion, another
force of agglomeration that involves close labor interaction and mobility, also plays a signi�cant
role in explaining the agglomeration of MNC subsidiary workers between industries. In fact, tech-
nology spillover appears to be the strongest agglomeration factor at most distance thresholds.
Further, at more aggregate geographic levels, the e¤ects of labor market externality and tech-
nology di¤usion diminish, while capital-good market externality exerts a signi�cant and positive
e¤ect.
[Tables 5 and 6 about here]37Comparing Tables 3 and 4, we also note that the normalized parameter of the location fundamental variable
is signi�cantly lower when the variable is constructed based on the regional estimation speci�cation. One possibleexplanation is that measure 1, constructed based on country-level location characteristics and actual regional shareof multinational activity, represents an upper bound of location fundamentals whereas measure 2, estimated basedon observable country and regional characteristics, serves as a lower bound.
26
6.2 Comparing the Agglomeration of MNC O¤shore and Domestic Plants
Having established the agglomeration patterns of MNC foreign subsidiaries, we now investi-
gate how the role of agglomeration forces varies systematically between multinational and non-
multinational plants. Speci�cally, we evaluate how the roles of location fundamentals and agglom-
eration economies a¤ect MNCs relative to domestic plants by estimating the following equation:
agglomerationmkek(T )� agglomerationdkek(T )
= (�m1 � �d1)fundamentalskek + (�m2 � �d2)IOlinkagekek + (�m3 � �d3)laborkek+ (�m4 � �d4)capitalgoodkek + (�m5 � �d5)technologykek + "ij ; (8)
where agglomerationmkek(T )�agglomerationdkek(T ) represents the di¤erence between the MNC and
domestic pairwise-industry agglomeration indices, and the coe¢ cient vector �m � �d representsthe di¤erence in the e¤ects of the covariates on multinational foreign subsidiaries and domestic
plants.
[Tables 7 and 8 about here]
The results based on the two measures of location fundamentals are reported in Tables 7
and 8. We �nd that proxies for capital-good market externality and technology di¤usion exert
a stronger e¤ect on multinationals than on domestic plants in same industry pairs. The role
of the input-output relationship is not signi�cantly di¤erent between the two at disaggregated
geographic levels, but is signi�cantly stronger for multinationals at more aggregate geographic
levels (such as 800 km). Interestingly, potential externality in the labor market, captured by
industry-pair similarity in labor demand, exerts a greater e¤ect on the agglomeration of domestic
plants than on the agglomeration of multinational foreign subsidiaries. Location fundamental
variables� including market size, comparative advantage, and infrastructure� also play a greater
role in the agglomeration patterns of domestic plants.
These �ndings are consistent with the characteristics of multinational �rms. Relative to their
domestic counterparts, multinationals exhibit greater participation in capital- and technology-
intensive activities. As a result, in industries with strong potential for capital-good market exter-
nality and technology di¤usion, MNCs are more likely to realize these agglomeration economies
when they agglomerate with other, productive and capital- and knowledge-intensive MNCs. In
contrast, domestic plants� with lower capital- and technology-intensity� place a greater empha-
sis on fundamental location characteristics such as market size, production cost, and infrastruc-
ture and labor market considerations.
6.3 MNC Headquarters Agglomeration
We next examine the determinants of MNC headquarters clusters relative to MNC clusters
overseas. To control for the role of location fundamentals in explaining the agglomeration of
27

MNC headquarters, we follow the procedure described in Section 5.1, but obtain the level of
MNC activities predicted for each MNC home country and construct the expected distribution
and agglomeration of MNC headquarters following the rest of the procedure.
Table 9 reports the estimation results. All variables except vertical production linkages exert
a signi�cant e¤ect. A one-standard-deviation increase in the location fundamental variable is
associated with a 0.21 standard-deviation increase in MNC headquarters agglomeration, which
suggests an important role for the characteristics of headquarter countries including market size,
skilled labor endowment, and access to host countries. At 200 km, both technology di¤usion and
labor market correlation play a positive and signi�cant role, with a cumulative e¤ect of about
0.06. Beyond 200 km, the e¤ect of the labor market becomes insigni�cant. Again, this result is
consistent with the localized feature of labor markets and with lower mobility of labor.
[Table 9 about here]
Comparing Table 9 with Table 3, we �nd that (i) location fundamentals and capital-good
market externality exert a stronger e¤ect on MNCs�o¤shore agglomeration than on the agglom-
eration of MNC headquarters and (ii) input-output relationships a¤ect MNC subsidiaries but
not headquarters. These results suggest that the agglomeration of MNC subsidiaries, with their
market-seeking and input-sourcing focuses, is more in�uenced by market-access and comparative-
advantage motives, capital-good market externalities, and vertical production linkages, whereas
the agglomeration of headquarters, with their specialization in providing services such as R&D
and management, is more in�uenced by technology di¤usion.
6.4 Accounting for Trade Costs
In this subsection, we re-construct the agglomeration index based on two alternate measures of
trade cost. First, we use an estimate of trade cost that accounts for other forms of trade barrier
including border, tari¤s, and language. The role of location fundamentals and agglomeration
economies in explaining this index may be di¤erent because, for example, intermediate inputs
and �nal goods can be more tradable than physical- and knowledge-capital.
We use a two-step procedure to estimate a comprehensive measure of trade costs for each
pair of establishments. We �rst estimate a standard trade gravity equation given by
qijt = EXit + IMjt + �Zijt + "ijt; (9)
where the dependent variable qijt is the natural log of imports of country j from country i,
EXit denotes an exporter-year �xed e¤ect, IMjt represents an importer-year �xed e¤ect, and
�Zijt � �1 ln dij + �2Bij + �3Bij � Lij + �4PTAijt with Zijt representing a vector of bilateralmarket access variables. In particular, Zijt includes ln dij , the natural log of the distance between
the capital cities of the importer and exporter countries, Bij , a dummy variable that equals 1
if the trading countries share a border and 0 otherwise, Lij , a dummy variable that equals 1 if
28
the two countries share a language, and PTAijt, an indicator of a preferential trade agreement
between the two countries in year t. As in Head and Mayer (2004a), the equation allows the
border e¤ect to di¤er across importing countries depending on whether they speak the same
language as the exporting country. The expectations are �1 < 0 , �2 > 0, �3 > 0; and �4 > 0.
Following Santos Silva and Tenreyro (2006), we estimate the gravity equation using Poisson
quasi-MLE (QMLE).
A dataset that covers the trade �ows amongst 80 countries is used in the estimation. We
obtain the trade data from the COMTRADE database, and geographic information, including
distance, border, and language, from the CEPII distance dataset. The PTA information is taken
from the Tuck Trade Agreements Database and the WTO Regional Trade Agreements Dataset.
Our estimates of the gravity equation are broadly consistent with the existing literature. All the
bilateral market access variables exert an expected e¤ect on trade volume.38
In the second stage, we use the estimated parameters of bilateral access variables, i.e.��1-�4,
to construct the generalized measure of trade cost. Speci�cally, we consider
b�ij = �b�1 ln dij �Bij(b�2 + b�3Lij)� b�4PTAijt (10)
and substitute the distance, contiguity, language, and PTA information for each pair of estab-
lishments into the equation to compute the �tted trade cost b�ij . To account for home bias inintra-national trade costs, we subtract a positive constant from b�ij (in addition to assumingBii = 1, Lii = 1, and PTAiit = 1) for establishments located in the same country based on home
bias estimates reported in Anderson and van Wincoop (2003). Because estimating the home bias
for each country in our sample requires intra-national trade �ow data for all the countries and is
beyond the scope of this analysis, we used Anderson and van Wincoop�s (2003) U.S. estimates.39
Repeating the methodology described in Section 3.1, we construct a agglomeration index
based on the generalized measure of trade costs (instead of distance). As shown in Table 10, we
�nd that technology di¤usion and capital-good market externality have a positive and signi�cant
e¤ect while the e¤ects of the labor- and production-linkages variables are insigni�cant. These
results suggest that vertical production linkages do not play a signi�cant role in explaining the
agglomeration of MNC subsidiaries once you take into account the ease of trading intermediate
inputs and �nal goods due to low tari¤s, country contiguity, and low language barriers. For ag-
glomeration forces to be meaningful, goods and factors must have little tradability (for example,
physical capital) or, more generally, must face high trade and movement barriers.
[Table 10 about here]
Alternatively, we compute the agglomeration index based on distance by assuming country
borders to have an in�nite e¤ect on trade cost. This essentially excludes all establishment pairs38The estimation results are available upon request.39We also considered Anderson and van Wincoop�s (2003) home bias estimate for Canada (which is considerably
greater than that for the U.S.) and the results were qualitatively similar.
29

located in two di¤erent countries, regardless of their actual distance, and focuses exclusively on
establishments located in the same country. As shown in Table A.1, this implies that 40 per-
cent of establishment pairs that are located within 400 km will be dropped from the analysis.
The index therefore, by design, exhibits signi�cantly greater values than the index accounting
for establishments worldwide. Regressing the index on the measures of location fundamentals
and agglomeration forces, we �nd that sharing common location fundamentals and capital-good
market correlations play particularly important roles in explaining the patterns of the index.
The strong impact of location fundamentals is not surprising given that we expect multinational
foreign subsidiaries to concentrate in the same countries when they share common location funda-
mentals. The signi�cant e¤ect of capital-good market variable is consistent with the hypothesis
that capital goods have less tradability and mobility than general intermediate inputs.
7 Additional Econometric Analysis
7.1 Lower Distance Thresholds
In our analysis so far, we have constructed the agglomeration indices at thresholds of 200 km
or more following previous work such as DO and EGK. In this subsection, we examine agglom-
eration patterns at more disaggregated levels and explore how the estimated e¤ects of location
fundamentals and agglomeration economies di¤er. Speci�cally, we consider three low-distance
thresholds, namely, 20, 50 and 100 km. As expected, the values of the agglomeration indices
diminish at lower distance thresholds. However, the patterns of agglomeration, including those
presented in the stylized facts, remain largely similar.
In Table 11, we present the estimation results at the low distance thresholds. The normalized
parameters suggest that the e¤ects of input-output linkages, capital-good market externality, and
technology di¤usion are qualitatively similar to those reported earlier and quantitatively similar
across 20, 50 and 100 km.
[Table 11 about here]
7.2 The Endogeneity of Agglomeration Economies
A potential concern with our analysis thus far is that the agglomeration economy measures
might endogenously re�ect the agglomeration patterns of multinational �rms. For example, the
input-output linkage between the apparel and cotton industries may re�ect not just the inherent
characteristics of apparel manufacturing, but also the agglomeration of the two industries due,
for example, to the availability of raw materials leading apparel manufacturers to favor cotton
over other types of fabrics. Similarly, the technology di¤usion between the telecommunication
and computer industries might be due not only to the intrinsic technological relationship between
the two industries, but also to a historical factor that led the two industries to locate together
and subsequently become familiar with each other�s technologies.
30
This concern is mitigated in our paper by three factors. First, our analysis controls for the
role of location fundamentals and industry-speci�c characteristics. This enables us to separate
industries� geographic concentration due to location attractiveness from agglomeration activi-
ties driven by agglomeration economies. Second, our measures of agglomeration economies are
constructed using U.S. industry account data while the paper examines global agglomeration
patterns. U.S. industries�input-output linkages, factor market correlations, and technology dif-
fusion are not very likely a result of agglomeration around the world. Third, the focus on MNCs
reduces the possibility of reverse causation, as MNCs constitute a small subset of �rms in each
industry and the agglomeration economy measures are built with industry wide data that include
information on domestic �rms.
We nevertheless perform an additional exercise to further alleviate concerns about endogene-
ity. Because the global agglomeration patterns of multinational �rms include the agglomeration
of MNCs in the United States, we examine regional agglomeration which excludes the U.S. If U.S.
domestic industry-pair relationships are a¤ected by the agglomeration of MNCs in the United
States, then one would expect the former to be less likely to be a¤ected by the agglomeration of
MNCs located in other regions such as Europe. In this case, the agglomeration economy mea-
sures constructed with U.S. industry account data are orthogonal to the agglomeration patterns
observed in Europe.40
We proceed by repeating the procedure described in Section 3.1 to construct the agglomera-
tion indices for MNCs located in Europe. These indices capture the degree to which MNCs in a
given industry pair agglomerate in Europe at various threshold distances.
[Table 12 about here]
The results are reported in Table 12. We �nd the estimates to be qualitatively similar to
those reported in Tables 3.41 Multinational subsidiaries in industries with greater labor market
correlation and technology di¤usion are found to have a higher level of agglomeration, especially
at the 200 and 400 km levels. Input-output production linkage and capital-good market corre-
lation also exert a signi�cant e¤ect on the agglomeration of MNCs in Europe. Consistent with
our earlier results, the e¤ects of labor market externalities and technology di¤usion diminish at
more aggregate geographic levels. Further, labor market externality appears to be the strongest
agglomeration force at disaggregated distance levels.
40 In examining the agglomeration of U.S. �rms, EGK address the endogeneity of the U.S. agglomeration economymeasures by instrumenting the variables with the U.K. counterpart measures. But using another country�s data toinstrument the agglomeration economy variables would not alleviate the potential for endogeneity in our analysisbecause that data would face issues similar to the issues facing the U.S. data. Using the U.S. agglomeration economymeasures to predict the agglomeration patterns in a non-U.S. region would, however, mitigate the possibility ofreverse causation and help identify the causal e¤ects of agglomeration forces.41Because we are now examining regional, rather than global, agglomeration, we consider only threshold distances
up to 800 km.
31
7.3 The Process of MNC Agglomeration
To shed light on the formation of MNC clusters, in particular, the spatial interdependence
between incumbents and entrants, we now turn from the geographic patterns to the process of
multinational agglomeration. Doing so also helps us to address two econometric concerns in
evaluating the determinants of agglomeration. The �rst is the di¤erent establishment dates of
plants. Our estimates thus far take into account not only new plants�entry decisions but also
incumbents�decisions to continue in their current locations. But the mix of old and new plants
could create the potential for reverse causality between MNC location patterns and measures
of economic fundamentals and agglomeration economies. Second, it is possible that our index
of MNC agglomeration captures not only the agglomeration between MNCs, but also clustering
between MNC and domestic plants.42 Although the low correlation between the indices of MNC
agglomeration and domestic plant agglomeration reported in Section 4 suggests that this is not
likely to be a signi�cant issue, we take a further measure to address the concern.
We therefore explore in this subsection the dynamics of location decisions. Speci�cally, we
distinguish new from incumbent plants and assess new MNC plants�propensity to agglomerate
with incumbents. This enables us to identify the roles of location fundamentals and agglomer-
ation economies in MNCs�entry decisions. Repeating the procedure described in Section 3, we
construct an index of agglomeration between MNC entrants in 2004-2005 and MNC incumbents
established before 2004. For each industry pair k and ek, the index measures the propensity ofnew MNC subsidiaries in industry k to cluster with incumbent MNCs in industry ek, and viceversa.
[Table 13 about here]
We compare the agglomeration index for MNC entrants against two benchmarks. First, as in
Section 6, we adopt domestic plants as the benchmark and compare how MNCs agglomerate with
incumbent MNCs relative to the clustering of domestic plants. Table 13 reports the estimates.
The role of second-nature agglomeration forces remains robust in explaining the entry patterns
of MNCs. Relative to domestic plants, multinational entrants display a stronger propensity to
cluster with incumbent multinationals when technology di¤usion bene�ts, capital-good market
externality, and vertical production linkages are relatively stronger. Labor-market and location-
fundamental variables, again, have a greater impact on the agglomeration of domestic plants.
42A related concern here is that when multinational establishments come into existence as a result of cross-border acquisitions, their agglomeration patterns might simply re�ect the agglomeration patterns of domesticestablishments. We argue that MNCs�acquisition decisions, like their location choices in general, are dependenton location fundamentals and agglomeration economies. Moreover, the option to restructure (including to retainor shut down) acquired plants further enables MNCs to optimize their location decisions in response to locationfactors. The fact that we observe a low correlation between the agglomeration indices of MNCs and domesticplants suggests that MNCs�agglomeration patterns do not simply re�ect the agglomeration patterns of domesticplants. But to provide further assurance that our analysis captures the agglomeration incentives of multinationals,we explore in this section the entry patterns of new green�eld FDI.
32
To address the possibility that the index of MNC agglomeration re�ects clustering with
domestic plants, we construct an alternative benchmark, an agglomeration index measures the
propensity of new MNC subsidiaries to cluster with domestic plants. We �nd that for each
industry pair, new MNC foreign subsidiaries exhibit a stronger tendency to agglomerate with
incumbent MNC plants than with incumbent domestic plants. Moreover, the estimated e¤ects
of the location fundamentals and agglomeration economies remain largely similar.
7.4 Plant-level Agglomeration
In this subsection, we take the analysis to a more disaggregated level and examine micro-
agglomeration patterns by exploring plant-level agglomeration indices. Speci�cally, we compute
plant-level agglomeration densities to measure the degree to which a plant is proximate to other
plants (in both the same and other industries) and examine how plant characteristics� such as
ownership structure, size, age and the number of products� and industry characteristics� such
as capital intensity, skilled-labor intensity, and R&D intensity� might jointly explain the extent
of agglomeration centered around each plant.
[Table 14 about here]
Table 14 reports the estimation results based on plant-level agglomeration indices at 50 and
200 km. To control for the role of location fundamentals, a vector of region-industry dummies is
included in the analysis. We �nd that the degree of agglomeration varies sharply across plants in
the same country and industry. First, multinational foreign subsidiaries attract signi�cantly more
agglomeration than domestic plants in capital-, skilled-labor-, and R&D-intensive industries.
This result, consistent with the industry-level agglomeration patterns documented in Section
4, suggests that multinational foreign subsidiaries enjoy greater agglomeration bene�ts than
their domestic counterparts do when industrial activities are capital- and knowledge-intensive.43
Second, plant size also matters. At 50 km, we �nd that plants with larger revenue tend to
attract signi�cantly more agglomeration. This is similarly true for older plants. On the other
hand, the number of products produced by each plant does not appear to have a signi�cant e¤ect
on agglomeration.
8 Conclusion
The emergence of new multinational clusters is one of the most notable phenomena in the
process of globalization. In this paper, we examine the global patterns and forces of MNC
agglomeration� both o¤shore and at headquarters� relative to the patterns and forces of domestic-
�rm agglomeration. Our analysis, using a worldwide plant-level dataset and a novel index of
43We also considered including a separate dummy variable to represent MNCs�domestic subsidiaries and foundthat the agglomeration patterns of MNC domestic subsidiaries is fairly similar to that of domestic plants in theMNC headquarters country when controlling for plant characteristics. The result is available upon request.
33

agglomeration, yields a number of new insights into the industrial landscape of multinational
production.
First, o¤shore clusters of MNCs are not simply a re�ection of domestic industrial clusters.
Across di¤erent types of plants, multinational headquarters are, on average, most agglomerative,
followed by domestic plants and multinational foreign subsidiaries. Further, the agglomeration
indices of MNC foreign subsidiaries, MNC headquarters, and domestic plants exhibit only limited
correlations, suggesting that multinationals follow distinctively di¤erent agglomeration patterns
o¤shore than their domestic counterparts do. Multinational foreign subsidiaries are more agglom-
erative than domestic plants in capital-, skilled-labor-, and R&D-intensive industries. Second,
exploring the determinants of the multinational agglomeration, we �nd that MP location funda-
mentals, although important, are not the only driving force. Multinationals�location choices are
signi�cantly a¤ected by agglomeration economies including not only vertical production linkages
but also technology di¤usion and capital-market externality. Third, the importance of location
fundamentals and agglomeration economies varies signi�cantly between MNCs�o¤shore agglom-
eration and the agglomeration of MNC headquarters and domestic plants. For example, MNCs�
o¤shore plants are signi�cantly more in�uenced than non-MNC plants by capital-good market
and technological agglomeration factors. Finally, multinational entrants display stronger propen-
sities to cluster with incumbent multinationals than with incumbent local plants. Again, this is
especially the case when the capital-good market externality and technology di¤usion bene�ts
are strong.
One potential extension of our analysis that is worthy of particular attention is to explore
how patterns of MNC agglomeration vary across regions. For example, labor market externality
can o¤er a stronger incentive for agglomeration in countries with more rigid and less mobile labor
markets. Similarly, the varying quality of infrastructure across regions can a¤ect the value of
proximity for vertically linked industries. Firms are likely to have a stronger motive to cluster
with suppliers and customers when they are in a country with poorer infrastructure. Further
analysis of the role of regional characteristics in determining the clustering of MNCs could yield
additional insights.
34

References
[1] Acemoglu, Daron, Johnson, Simon and Mitton, Todd (2009) Determinants of Vertical Inte-
gration: Financial Development and Contracting Costs. Journal of Finance 63, 1251-1290.
[2] Aitken, Brian, Harrison, Ann and Lipsey, Robert (1996) Wages and Foreign Ownership: A
Comparative Study of Mexico, Venezuela, and the United States. Journal of International
Economics 40(3-4): 345-371.
[3] Alfaro, Laura and Charlton, Andrew (2009) Intra-Industry Foreign Direct Investment.
American Economic Review 99(5): 2096-2119.
[4] Alfaro, Laura, Kalemli-Ozcan, Sebnem, and Volosovych, Vadym (2008) Why Doesn�t Cap-
ital Flow from Rich to Poor Countries? An Empirical Investigation. Review of Economics
and Statistics 90: 347-368.
[5] Anderson, James and Wincoop, Eric van (2003) Gravity with Gravitas: A Solution to the
Border Puzzle. American Economic Review 93(1): 170-192.
[6] Antràs, Pol (2003) Firms, Contracts and Trade Structure. Quarterly Journal of Economics
118: 1375-1418.
[7] Antràs, Pol and Helpman, Elhanan (2004) Global Sourcing. Journal of Political Economy
112(3): 552-580.
[8] Antràs, Pol and Helpman, Elhanan (2008) "Contractual Frictions and Global Sourcing," in
Elhanan Helpman, Dalia Marin, and Thierry Verdier (Eds.), The Organization of Firms in
a Global Economy, Cambridge: Harvard University Press, forthcoming.
[9] Ahlfeldt, Gabriel, Redding, Stephen J., Sturn, Daniel and Wolf, Nikolaus (2012) The Eco-
nomics of Density: Evidence from the Berlin Wall. CEP Discussion Papers dp1154, Centre
for Economic Performance, LSE.
[10] Barro, Robert J. and Lee, Jong-Wha (2000) International Data on Educational Attainment:
Updates and Implications. CID Working Paper No. 42.
[11] Bénassy-Quéré, Agnes, Coupet, Maylis and Mayer, Thierry (2007) Institutional Determi-
nants of Foreign Direct Investment. World Economy 30(5): 764-782.
[12] Bobonis, Gustavo J. and Shatz, Howard J. (2007) Agglomeration, Adjustment, and State
Policies in the Location of Foreign Direct Investment in the United States. Review of Eco-
nomics and Statistics 89(1): 30-43.
[13] Carr L. David, Markusen, James R. and Maskus, Keith E. (2001) Estimating the Knowledge-
Capital Model of the Multinational Enterprise. American Economic Review 91(3): 693-708.
35
[14] Chen, Maggie (2011) Interdependence in Multinational Production Networks. Canadian
Journal of Economics 44(3): 930-956.
[15] Debaere Peter, Lee, Joonhyung, and Paik, Myungho. 2010. "Agglomeration, Backward and
Forward linkages: Evidence from South Korean Investment in China." Canadian Journal of
Economics 43(2), 520-546.
[16] Duranton, Gilles and Overman, Henry (2005) Testing for Localization Using MicroGeo-
graphic Data. Review of Economic Studies 72(4): 1077-1106.
[17] Duranton, Gilles and Overman, Henry (2008) Exploring the Detailed Location Patterns of
U.K. Manufacturing Industries Using Microgeographic Data. Journal of Regional Science
48(1): 213-243.
[18] Duranton, Gilles and Puga, Diego (2004) Micro-foundations of urban agglomeration
economies. In J. Vernon Henderson and Jacques-François Thisse (eds.) Handbook of Re-
gional and Urban Economics, Vol. 4. Amsterdam: North-Holland, 2063-2117.
[19] Duranton, Gilles and Puga, Diego (2005) From Sectoral to Functional Urban Specialisation.
Journal of Urban Economics 57(2): 343-370.
[20] Ellison, Glenn and Glaeser, Edward (1997) Geographic Concentration in U.S. Manufacturing
Industries: A Dartboard Approach. Journal of Political Economy 105(5): 889-927.
[21] Ellison, Glenn, Glaeser, Edward and Kerr, William (2010) What Causes Industry Agglom-
eration? Evidence from Coagglomeration Patterns. American Economic Review 100: 1195�
1213.
[22] Grossman, Gene M. and Helpman, Elhanan (2002) Integration Versus Outsourcing In In-
dustry Equilibrium. Quarterly Journal of Economics 117(1): 85-120.
[23] Hall, Bronwyn H., Adam B. Ja¤e, and Manuel Trajtenberg. 2001. "The NBER Patent Cita-
tion Data File: Lessons, Insights and Methodological Tools." National Bureau of Economic
Research Working Paper 8498.
[24] Harrison, Ann E. and Rodríguez-Clare, Andrés (2010) Trade, Foreign Investment, and In-
dustrial Policy. In Dani Rodrik and Mark Rosenzweig (eds.) Handbook of Development Eco-
nomics, Vol. 5, North Holland, 4039-4214.
[25] Harrison, Ann E., Love, Inessa and McMillan, Margaret S. (2004) Global Capital Flows and
Financing Constraints. Journal of Development Economics 75(1): 269-301.
[26] Hanson, Gordon (2005) Market potential, increasing returns and geographic concentration.
Journal of International Economics 67(1): 1-24.
36
[27] Head, Keith and Mayer, Thierry. 2004a. "Market Potential and the Location of Japanese
Firms in the European Union." Review of Economics and Statistics 86(4): 959-972.
[28] Head, Keith and Mayer, Thierry (2004b) The Empirics of Agglomeration and Trade. In:
Henderson, J.V., and Thisse, J.-F. (Eds.), Handbook of Regional and Urban Economics,
volume 4. Amsterdam: Elsevier, pp. 2609-2669.
[29] Head, Keith, Ries, John and Swenson, Deborah (1995) Agglomeration Bene�ts and Location
Choice: Evidence from Japanese Manufacturing Investments in the United States. Journal
of International Economics 38(3-4): 223-247.
[30] Head, Keith and Ries, John (2008) FDI as an Outcome of the Market for Corporate Control:
Theory and Evidence. Journal of International Economics 74(1): 2-20.
[31] Helpman, Elhanan (1984) A Simple Theory of Trade with Multinational Corporations. Jour-
nal of Political Economy 92(3): 451-471.
[32] Helpman, Elhanan (2006) Trade, FDI and the Organization of Firms. Journal of Economic
Literature 44(3): 589-630.
[33] Helpman, Elhanan, Melitz, Marc and Rubinstein, Yona (2008) Estimating Trade Flows:
Trading Partners and Trading Volumes. Quarterly Journal of Economics 123(2): 441-487.
[34] Helpman, Elhanan, Melitz, Marc, and Yeaple, Stephen (2004) Export versus FDI with
Heterogeneous Firms. American Economic Review 94 (1): 300-316.
[35] Helsley, Robert W. and Strange, William C. (1990) Matching and Agglomeration Economies
in a System of Cities. Regional Science and Urban Economics 20(2): 189-212.
[36] Ja¤e, Adam, Trajtenberg, Manuel and Fogarty, Michael (2000) Knowledge Spillovers and
Patent Citations: Evidence from a Survey of Inventors. American Economic Review Paper
and Proceedings 90: 215-218.
[37] Krugman, Paul (1991) Increasing Returns and Economic Geography. Journal of Political
Economy 99(3): 483-499.
[38] Lipsey, Robert E. (1978) The Creation of Microdata Sets for Enterprises and Establishments.
Annales de l�INSEE 30(31): 395-422.
[39] Limao, Nuno, and Venables, Anthony (2002) Geographical Disadvantage: a Hecksher-Ohlin-
Von-Thunen Model of International Specialisation. Journal of International Economics
58(2): 239-63.
[40] Markusen, James and Venables, Anthony J. (1998) Multinational Firms and the New Trade
Theory. Journal of International Economics 46(2): 183-203.
37
[41] Markusen, James and Venables, Anthony J. (2000) The Theory of Endowment, Intra-
industry and Multi-national trade. Journal of International Economics 52(2): 209-234.
[42] Markusen, James (2002) Multinational Firms and the Theory of International Trade. Cam-
bridge: MIT Press.
[43] Marshall, Alfred (1890) Principles of Economics. London: MacMillan and Co.
[44] Navaretti, Giorgio Barba and Venables, Anthony J. (2006)Multinational Firms in the World
Economy. Princeton University Press.
[45] Nunn, Nathan (2007) Relationship-Speci�city, Incomplete Contracts, and the Pattern of
Trade. The Quarterly Journal of Economics 122(2): 569-600.
[46] Ottaviano, Gianmarco I. P. and Puga, Diego, (1998) Agglomeration in the Global Economy:
A Survey of the "New Economic Geography." World Economy 21(6): 707-731.
[47] Ottaviano, Gianmarco and Thisse, Jacques-François (2004). Agglomeration and economic
geography. In: Henderson, J. Vernon, and Thisse, Jacques-François. (Eds.), Handbook of
Regional and Urban Economics, vol. 4. Amsterdam: Elsevier, pp.2563-2608.
[48] Puga, Diego (2010) The Magnitude and Causes of Agglomeration Economies. Journal of
Regional Science 50(1): 203-219.
[49] Redding, Stephen (2010) The Empirics of New Economic Geography. Journal of Regional
Science 50(1): 297-311.
[50] Redding, Stephen (2011) Economic Geography: a Review of the Theoretical and Empirical
Literature. The Palgrave Handbook of International Trade, Chapter 16.
[51] Redding, Stephen and Venables, Anthony (2004) Economic Geography and International
Inequality. Journal of International Economics 62(1): 53-82.
[52] Rosenthal, Stuart and Strange, William (2001) The Determinants of Agglomeration. Journal
of Urban Economics 50(2):191�229.
[53] Rosenthal, Stuart and Strange, William (2003) Geography, Industrial Organization, and
Agglomeration. Review of Economics and Statistics 85(2): 377-393.
[54] Rosenthal, Stuart and Strange, William (2004) Evidence on the nature and sources of ag-
glomeration economies. In: Henderson, J. Vernon, Thisse, Jacques-François (Eds.), Hand-
book of Regional and Urban Economics, vol. 4. Elsevier, Amsterdam, pp. 2119-2171.
[55] Rotemberg, Julio and Saloner, Garth (2000) Competition and Human Capital Accumu-
lation: A Theory of Interregional Specialization and Trade. Regional Science and Urban
Economics 30(4): 373-404.
38
[56] Santos Silva, J. M. C. and Tenreyro, Silvana (2006) The Log of Gravity. Review of Economics
and Statistics 88(4): 641-658.
[57] Venables, Anthony (1996) Equilibrium Locations of Vertically Linked Industries. Interna-
tional Economic Review 37(2): 341-359.
[58] Yeaple, Stephen (2003a) The Role of Skill Endowments in the Structure of U.S. Outward
Foreign Direct Investment. Review of Economics and Statistics 85(3): 726-734.
[59] Yeaple, Stephen (2003b) The Complex Integration Strategies of Multinational Firms and
Cross-Country Dependencies in the Structure of Foreign Direct Investment. Journal of In-
ternational Economics 60(2): 293-314.
39

Table 1: Descriptive Statistics for MNC and Domestic Agglomeration Indices
Obs. Mean Std. Dev. Min. Max.
MNC Foreign Subsidiaries (Percentage Points)Threshold (T) = 200 km 7938 0.099 0.239 0.000 3.060T = 400 km 7938 0.219 0.522 0.000 6.631T= 800 km 7938 0.520 1.206 0.000 14.419T= 1600 km 7938 1.028 2.357 0.000 23.941
Domestic Plants (Percentage Points)Threshold (T) = 200 km 7938 0.102 0.289 0.000 4.012T = 400 km 7938 0.235 0.545 0.000 7.935T= 800 km 7938 0.550 1.384 0.000 16.539T= 1600 km 7938 1.210 2.424 0.000 26.340
MNC Foreign Subsidiary Workers (Percentage Points)Threshold (T) = 200 km 7938 0.095 0.274 0.000 2.997T = 400 km 7938 0.194 0.528 0.000 5.553T= 800 km 7938 0.418 1.038 0.000 10.139T= 1600 km 7938 0.742 1.853 0.000 17.211
MNC Headquarters (Percentage Points)Threshold (T) = 200 km 7938 0.140 0.348 0.000 8.400T = 400 km 7938 0.325 0.779 0.000 18.198T= 800 km 7938 0.782 1.772 0.000 39.871T= 1600 km 7938 1.402 2.987 0.000 44.693
Notes: The agglomeration indices are constructed by comparing the estimated distance kernel functionof each industry pair with the 95 percent global con�dence band of counterfactual kernel estimators at200 km, 400 km, 800 km, and 1600 km. All industry pairs (SIC3) are included. See text for detaileddescriptions of the variables.
40
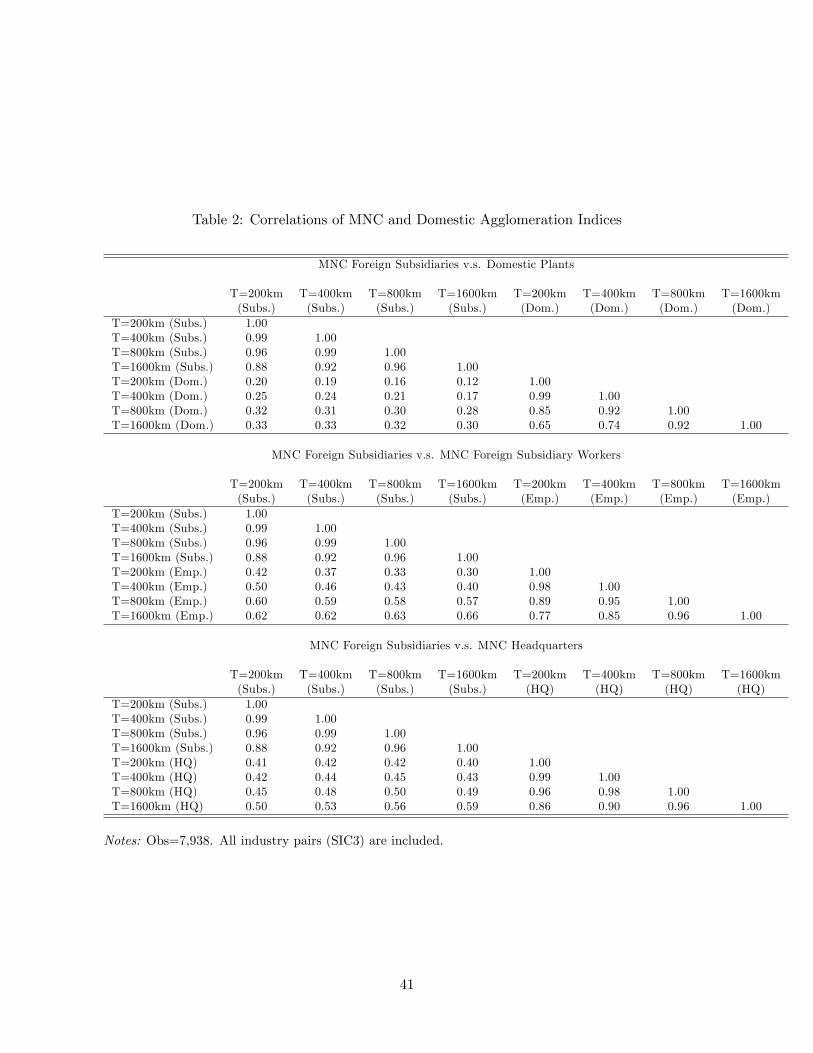
Table 2: Correlations of MNC and Domestic Agglomeration Indices
MNC Foreign Subsidiaries v.s. Domestic Plants
T=200km T=400km T=800km T=1600km T=200km T=400km T=800km T=1600km(Subs.) (Subs.) (Subs.) (Subs.) (Dom.) (Dom.) (Dom.) (Dom.)
T=200km (Subs.) 1.00T=400km (Subs.) 0.99 1.00T=800km (Subs.) 0.96 0.99 1.00T=1600km (Subs.) 0.88 0.92 0.96 1.00T=200km (Dom.) 0.20 0.19 0.16 0.12 1.00T=400km (Dom.) 0.25 0.24 0.21 0.17 0.99 1.00T=800km (Dom.) 0.32 0.31 0.30 0.28 0.85 0.92 1.00T=1600km (Dom.) 0.33 0.33 0.32 0.30 0.65 0.74 0.92 1.00
MNC Foreign Subsidiaries v.s. MNC Foreign Subsidiary Workers
T=200km T=400km T=800km T=1600km T=200km T=400km T=800km T=1600km(Subs.) (Subs.) (Subs.) (Subs.) (Emp.) (Emp.) (Emp.) (Emp.)
T=200km (Subs.) 1.00T=400km (Subs.) 0.99 1.00T=800km (Subs.) 0.96 0.99 1.00T=1600km (Subs.) 0.88 0.92 0.96 1.00T=200km (Emp.) 0.42 0.37 0.33 0.30 1.00T=400km (Emp.) 0.50 0.46 0.43 0.40 0.98 1.00T=800km (Emp.) 0.60 0.59 0.58 0.57 0.89 0.95 1.00T=1600km (Emp.) 0.62 0.62 0.63 0.66 0.77 0.85 0.96 1.00
MNC Foreign Subsidiaries v.s. MNC Headquarters
T=200km T=400km T=800km T=1600km T=200km T=400km T=800km T=1600km(Subs.) (Subs.) (Subs.) (Subs.) (HQ) (HQ) (HQ) (HQ)
T=200km (Subs.) 1.00T=400km (Subs.) 0.99 1.00T=800km (Subs.) 0.96 0.99 1.00T=1600km (Subs.) 0.88 0.92 0.96 1.00T=200km (HQ) 0.41 0.42 0.42 0.40 1.00T=400km (HQ) 0.42 0.44 0.45 0.43 0.99 1.00T=800km (HQ) 0.45 0.48 0.50 0.49 0.96 0.98 1.00T=1600km (HQ) 0.50 0.53 0.56 0.59 0.86 0.90 0.96 1.00
Notes: Obs=7,938. All industry pairs (SIC3) are included.
41

Table 3: Location Fundamentals, Agglomeration Economies, and MNC O¤shore AgglomerationI
T= 200 km T= 400 km T= 800 km T= 1600 km
IO Linkages 0.265* 0.573* 1.331** 2.596**(0.147) (0.306) (0.656) (1.296)
Capital Good 0.038*** 0.093*** 0.241*** 0.506***(0.014) (0.032) (0.066) (0.139)
Labor -0.002 -0.015 -0.079 -0.231(0.016) (0.035) (0.068) (0.160)
Technology 0.609** 1.178** 2.521** 4.395**(0.293) (0.546) (1.117) (2.371)
Location Fundamentals 0.018 0.019 0.020 0.021*(0.025) (0.019) (0.022) (0.012)
Obs. 7875 7875 7875 7875R2 0.571 0.600 0.627 0.631
Beta Coe¢ cientsIO Linkages 0.014 0.014 0.014 0.013Capital Good 0.035 0.039 0.043 0.046Labor -0.002 -0.007 -0.015 -0.023Technology 0.031 0.027 0.025 0.022Location Fundamentals 0.266 0.264 0.279 0.333
Notes: Bootstrapped standard errors in parentheses, *** p<0.01, ** p<0.05, * p<0.1. All regressionsinclude industry �xed e¤ect. Normalized beta coe¢ cients in lower panel. See text for detailed descriptionsof the variables.
42

Table 4: Location Fundamentals, Agglomeration Economies, and MNC O¤shore AgglomerationII
T= 200 km T= 400 km T= 800 km T= 1600 km
IO Linkages 0.249** 0.541* 1.252*** 2.413***(0.112) (0.302) (0.222) (0.576)
Capital Good 0.037** 0.092*** 0.237*** 0.499***(0.017) (0.017) (0.092) (0.153)
Labor 0.001 -0.001 -0.045 0.153(0.014) (0.015) (0.165) (0.135)
Technology 0.573*** 1.101*** 2.330*** 3.943*(0.161) (0.458) (0.343) (2.560)
Location Fundamentals (Regional) 0.006 0.004*** 0.002* 0.001(0.007) (0.001) (0.001) (0.003)
Obs. 7875 7875 7875 7875R2 0.570 0.600 0.626 0.630
Beta Coe¢ cientsIO Linkages 0.013 0.013 0.013 0.012Capital Good 0.034 0.038 0.042 0.045Labor 0.004 -0.001 -0.009 -0.015Technology 0.029 0.025 0.023 0.019Location Fundamentals (Regional) 0.038 0.025 0.013 0.006
Notes: Bootstrapped standard errors in parentheses, *** p<0.01, ** p<0.05, * p<0.1. All regressionsinclude industry �xed e¤ect. Normalized beta coe¢ cients in lower panel. See text for detailed descriptionsof the variables.
43
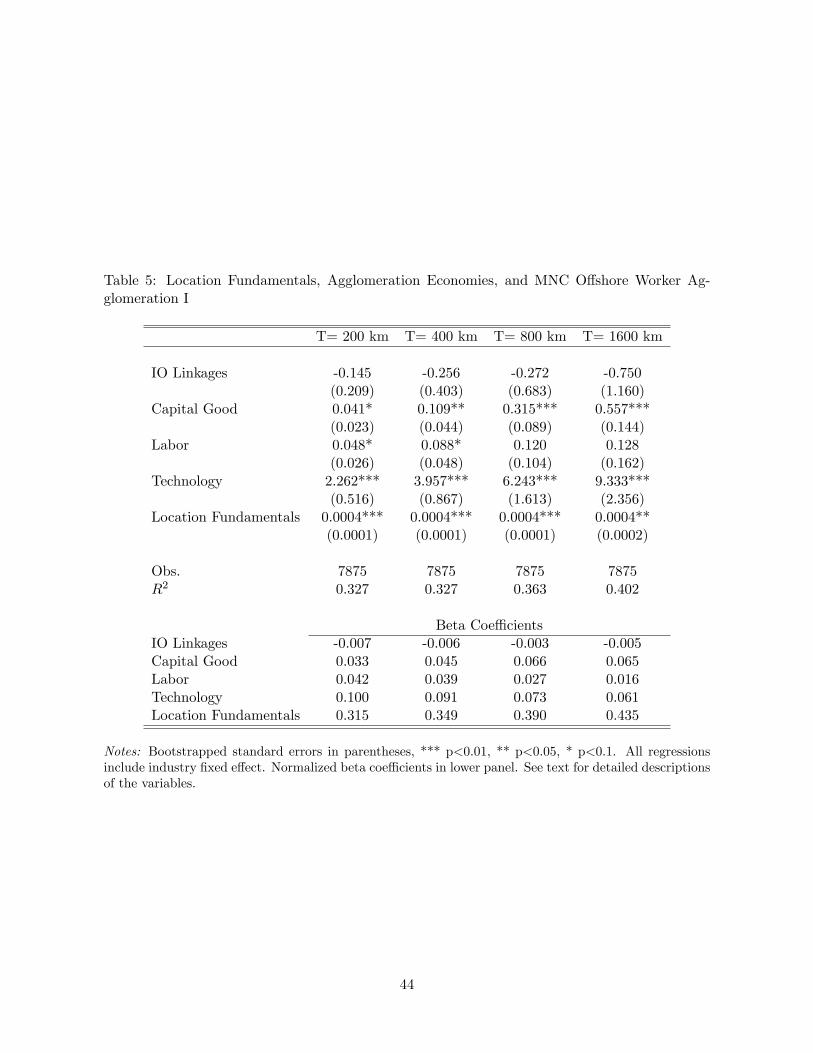
Table 5: Location Fundamentals, Agglomeration Economies, and MNC O¤shore Worker Ag-glomeration I
T= 200 km T= 400 km T= 800 km T= 1600 km
IO Linkages -0.145 -0.256 -0.272 -0.750(0.209) (0.403) (0.683) (1.160)
Capital Good 0.041* 0.109** 0.315*** 0.557***(0.023) (0.044) (0.089) (0.144)
Labor 0.048* 0.088* 0.120 0.128(0.026) (0.048) (0.104) (0.162)
Technology 2.262*** 3.957*** 6.243*** 9.333***(0.516) (0.867) (1.613) (2.356)
Location Fundamentals 0.0004*** 0.0004*** 0.0004*** 0.0004**(0.0001) (0.0001) (0.0001) (0.0002)
Obs. 7875 7875 7875 7875R2 0.327 0.327 0.363 0.402
Beta Coe¢ cientsIO Linkages -0.007 -0.006 -0.003 -0.005Capital Good 0.033 0.045 0.066 0.065Labor 0.042 0.039 0.027 0.016Technology 0.100 0.091 0.073 0.061Location Fundamentals 0.315 0.349 0.390 0.435
Notes: Bootstrapped standard errors in parentheses, *** p<0.01, ** p<0.05, * p<0.1. All regressionsinclude industry �xed e¤ect. Normalized beta coe¢ cients in lower panel. See text for detailed descriptionsof the variables.
44
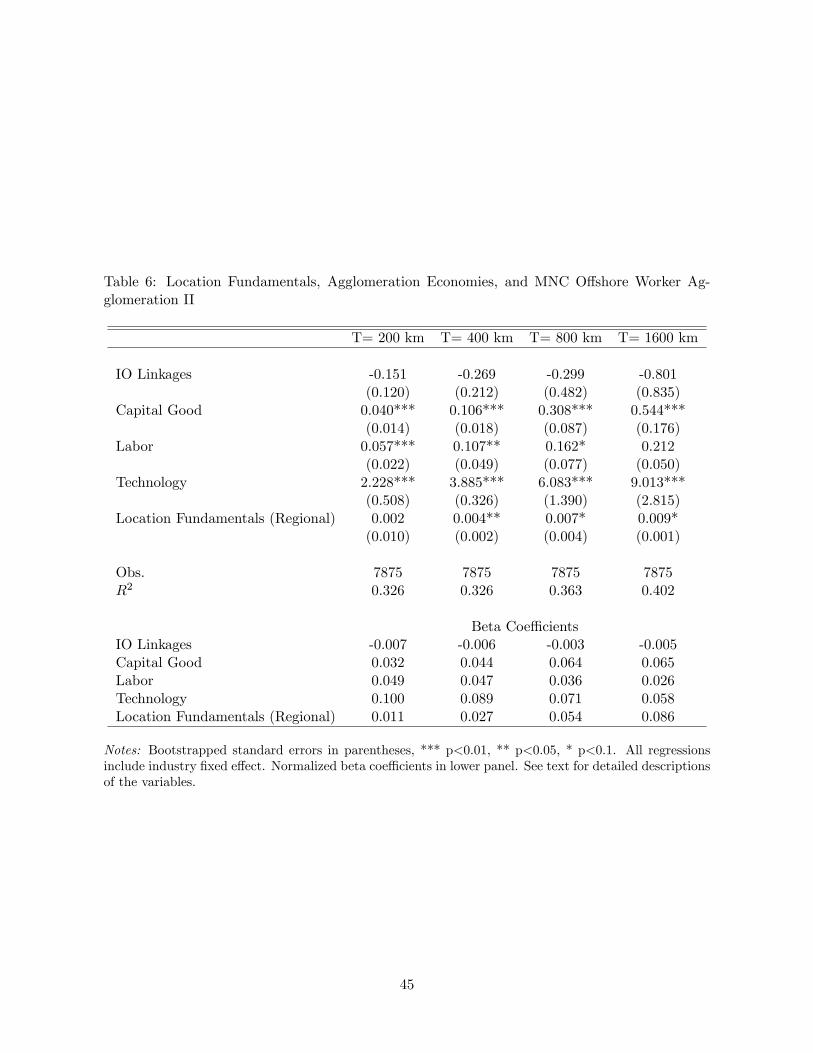
Table 6: Location Fundamentals, Agglomeration Economies, and MNC O¤shore Worker Ag-glomeration II
T= 200 km T= 400 km T= 800 km T= 1600 km
IO Linkages -0.151 -0.269 -0.299 -0.801(0.120) (0.212) (0.482) (0.835)
Capital Good 0.040*** 0.106*** 0.308*** 0.544***(0.014) (0.018) (0.087) (0.176)
Labor 0.057*** 0.107** 0.162* 0.212(0.022) (0.049) (0.077) (0.050)
Technology 2.228*** 3.885*** 6.083*** 9.013***(0.508) (0.326) (1.390) (2.815)
Location Fundamentals (Regional) 0.002 0.004** 0.007* 0.009*(0.010) (0.002) (0.004) (0.001)
Obs. 7875 7875 7875 7875R2 0.326 0.326 0.363 0.402
Beta Coe¢ cientsIO Linkages -0.007 -0.006 -0.003 -0.005Capital Good 0.032 0.044 0.064 0.065Labor 0.049 0.047 0.036 0.026Technology 0.100 0.089 0.071 0.058Location Fundamentals (Regional) 0.011 0.027 0.054 0.086
Notes: Bootstrapped standard errors in parentheses, *** p<0.01, ** p<0.05, * p<0.1. All regressionsinclude industry �xed e¤ect. Normalized beta coe¢ cients in lower panel. See text for detailed descriptionsof the variables.
45
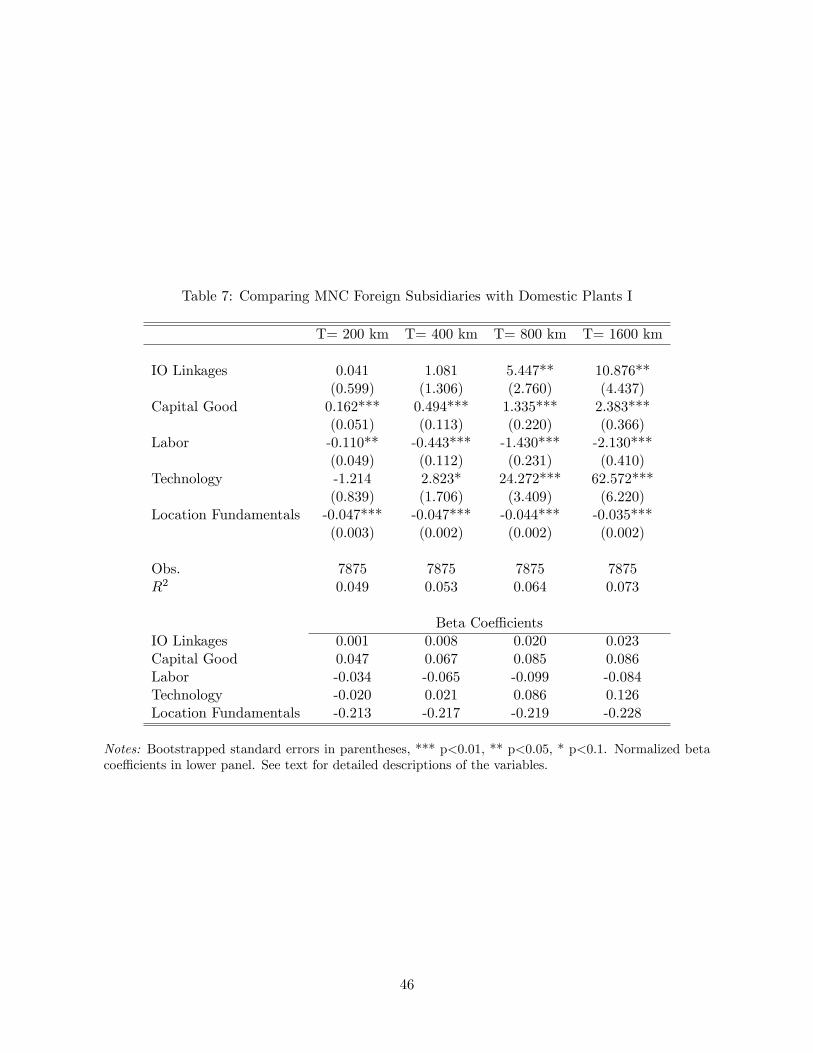
Table 7: Comparing MNC Foreign Subsidiaries with Domestic Plants I
T= 200 km T= 400 km T= 800 km T= 1600 km
IO Linkages 0.041 1.081 5.447** 10.876**(0.599) (1.306) (2.760) (4.437)
Capital Good 0.162*** 0.494*** 1.335*** 2.383***(0.051) (0.113) (0.220) (0.366)
Labor -0.110** -0.443*** -1.430*** -2.130***(0.049) (0.112) (0.231) (0.410)
Technology -1.214 2.823* 24.272*** 62.572***(0.839) (1.706) (3.409) (6.220)
Location Fundamentals -0.047*** -0.047*** -0.044*** -0.035***(0.003) (0.002) (0.002) (0.002)
Obs. 7875 7875 7875 7875R2 0.049 0.053 0.064 0.073
Beta Coe¢ cientsIO Linkages 0.001 0.008 0.020 0.023Capital Good 0.047 0.067 0.085 0.086Labor -0.034 -0.065 -0.099 -0.084Technology -0.020 0.021 0.086 0.126Location Fundamentals -0.213 -0.217 -0.219 -0.228
Notes: Bootstrapped standard errors in parentheses, *** p<0.01, ** p<0.05, * p<0.1. Normalized betacoe¢ cients in lower panel. See text for detailed descriptions of the variables.
46

Table 8: Comparing MNC Foreign Subsidiaries with Domestic Plants II
T= 200 km T= 400 km T= 800 km T= 1600 km
IO Linkages -0.023 0.916 5.014** 10.094**(0.603) (1.285) (2.515) (4.406)
Capital Good 0.183*** 0.536*** 1.421*** 2.533***(0.048) (0.118) (0.217) (0.375)
Labor -0.264*** -0.774*** -2.136*** -3.419***(0.045) (0.102) (0.225) (0.406)
Technology 0.943 1.252** 20.632*** 55.824***(0.880) (0.602) (3.346) (6.314)
Location Fundamentals (Regional) -0.011*** -0.010*** -0.025*** -0.454***(0.001) (0.001) (0.003) (0.005)
Obs. 7875 7875 7875 7875R2 0.012 0.016 0.028 0.034
Beta Coe¢ cientsIO Linkages -0.0004 0.007 0.018 0.021Capital Good 0.053 0.072 0.090 0.091Labor -0.083 -0.114 -0.148 -0.134Technology 0.007 0.009 0.073 0.112Location Fundamentals (Regional) -0.079 -0.089 -0.101 -0.103
Notes: Bootstrapped standard errors in parentheses, *** p<0.01, ** p<0.05, * p<0.1. Normalized betacoe¢ cients in lower panel. See text for detailed descriptions of the variables.
47
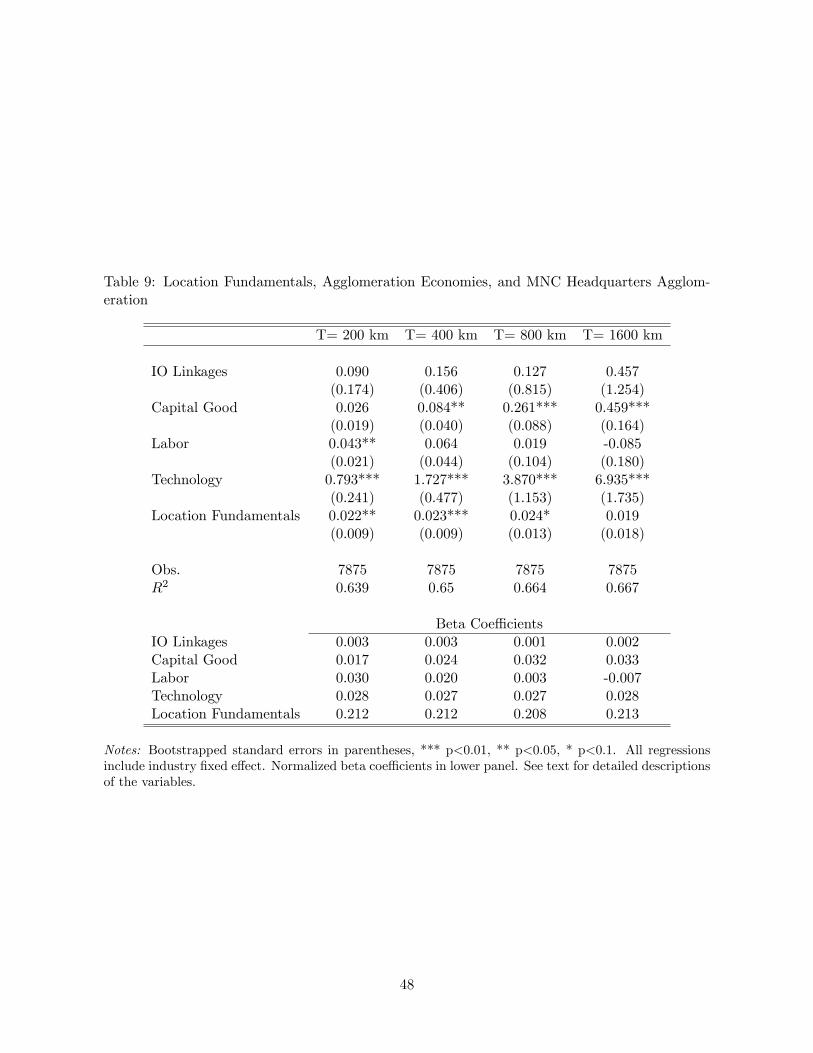
Table 9: Location Fundamentals, Agglomeration Economies, and MNC Headquarters Agglom-eration
T= 200 km T= 400 km T= 800 km T= 1600 km
IO Linkages 0.090 0.156 0.127 0.457(0.174) (0.406) (0.815) (1.254)
Capital Good 0.026 0.084** 0.261*** 0.459***(0.019) (0.040) (0.088) (0.164)
Labor 0.043** 0.064 0.019 -0.085(0.021) (0.044) (0.104) (0.180)
Technology 0.793*** 1.727*** 3.870*** 6.935***(0.241) (0.477) (1.153) (1.735)
Location Fundamentals 0.022** 0.023*** 0.024* 0.019(0.009) (0.009) (0.013) (0.018)
Obs. 7875 7875 7875 7875R2 0.639 0.65 0.664 0.667
Beta Coe¢ cientsIO Linkages 0.003 0.003 0.001 0.002Capital Good 0.017 0.024 0.032 0.033Labor 0.030 0.020 0.003 -0.007Technology 0.028 0.027 0.027 0.028Location Fundamentals 0.212 0.212 0.208 0.213
Notes: Bootstrapped standard errors in parentheses, *** p<0.01, ** p<0.05, * p<0.1. All regressionsinclude industry �xed e¤ect. Normalized beta coe¢ cients in lower panel. See text for detailed descriptionsof the variables.
48
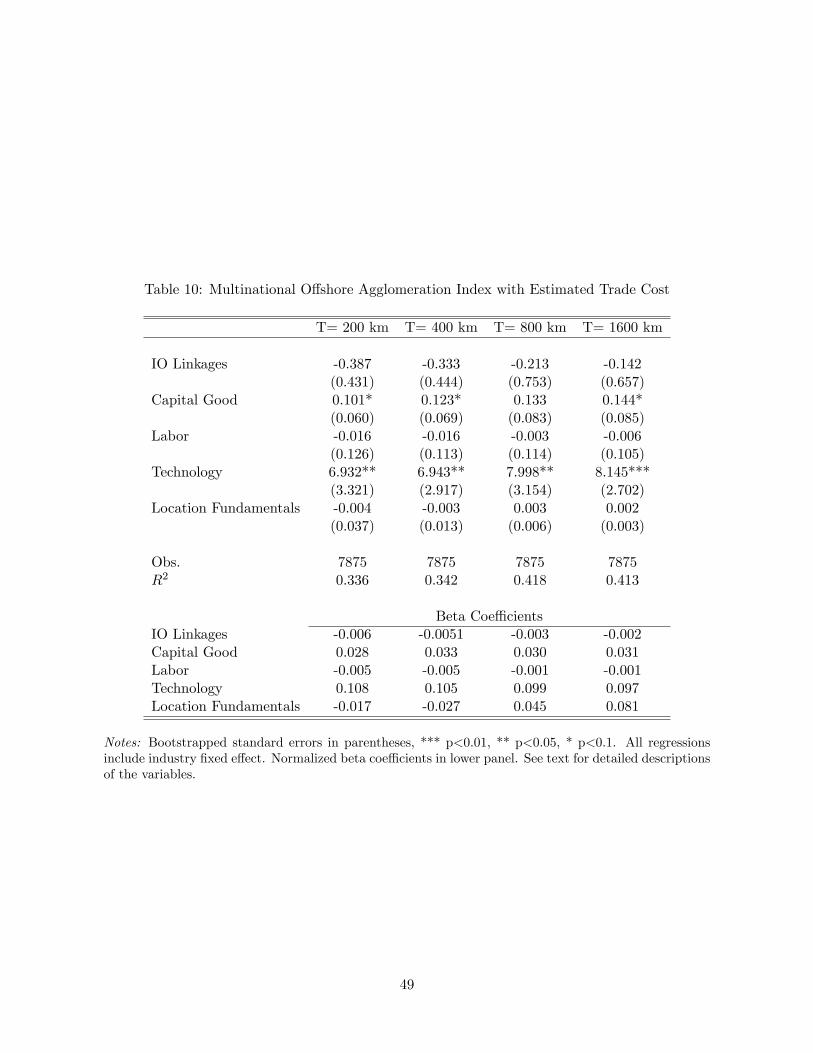
Table 10: Multinational O¤shore Agglomeration Index with Estimated Trade Cost
T= 200 km T= 400 km T= 800 km T= 1600 km
IO Linkages -0.387 -0.333 -0.213 -0.142(0.431) (0.444) (0.753) (0.657)
Capital Good 0.101* 0.123* 0.133 0.144*(0.060) (0.069) (0.083) (0.085)
Labor -0.016 -0.016 -0.003 -0.006(0.126) (0.113) (0.114) (0.105)
Technology 6.932** 6.943** 7.998** 8.145***(3.321) (2.917) (3.154) (2.702)
Location Fundamentals -0.004 -0.003 0.003 0.002(0.037) (0.013) (0.006) (0.003)
Obs. 7875 7875 7875 7875R2 0.336 0.342 0.418 0.413
Beta Coe¢ cientsIO Linkages -0.006 -0.0051 -0.003 -0.002Capital Good 0.028 0.033 0.030 0.031Labor -0.005 -0.005 -0.001 -0.001Technology 0.108 0.105 0.099 0.097Location Fundamentals -0.017 -0.027 0.045 0.081
Notes: Bootstrapped standard errors in parentheses, *** p<0.01, ** p<0.05, * p<0.1. All regressionsinclude industry �xed e¤ect. Normalized beta coe¢ cients in lower panel. See text for detailed descriptionsof the variables.
49
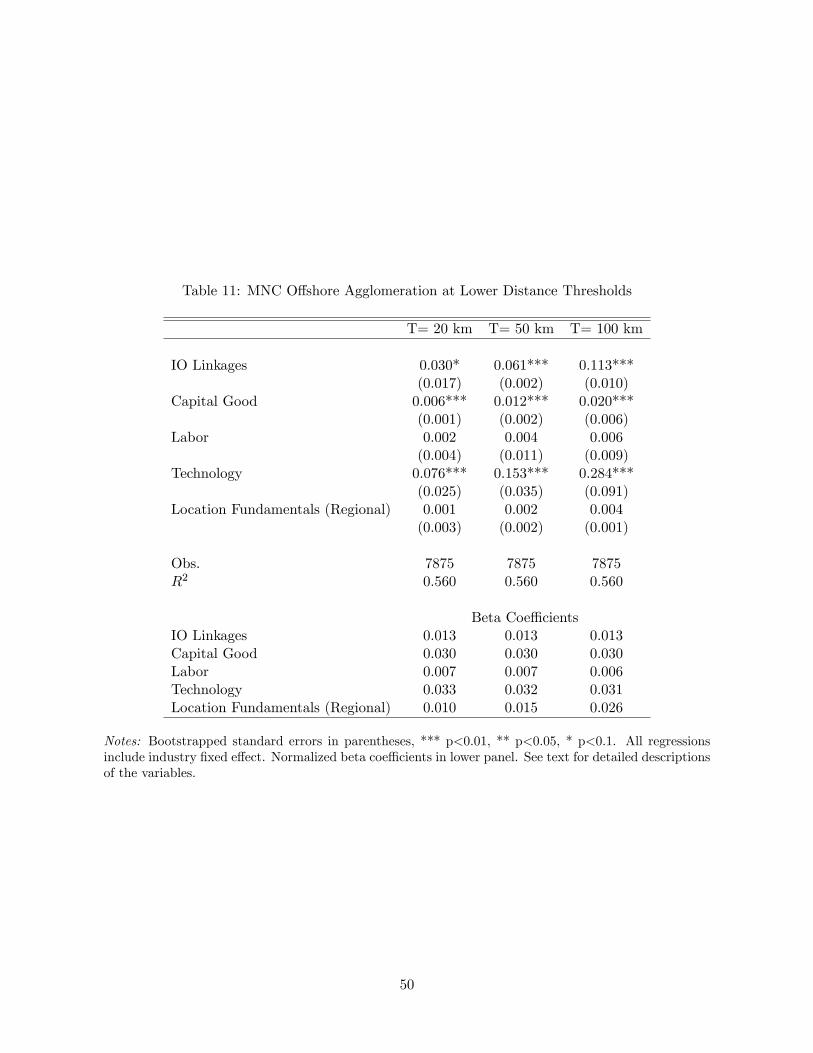
Table 11: MNC O¤shore Agglomeration at Lower Distance Thresholds
T= 20 km T= 50 km T= 100 km
IO Linkages 0.030* 0.061*** 0.113***(0.017) (0.002) (0.010)
Capital Good 0.006*** 0.012*** 0.020***(0.001) (0.002) (0.006)
Labor 0.002 0.004 0.006(0.004) (0.011) (0.009)
Technology 0.076*** 0.153*** 0.284***(0.025) (0.035) (0.091)
Location Fundamentals (Regional) 0.001 0.002 0.004(0.003) (0.002) (0.001)
Obs. 7875 7875 7875R2 0.560 0.560 0.560
Beta Coe¢ cientsIO Linkages 0.013 0.013 0.013Capital Good 0.030 0.030 0.030Labor 0.007 0.007 0.006Technology 0.033 0.032 0.031Location Fundamentals (Regional) 0.010 0.015 0.026
Notes: Bootstrapped standard errors in parentheses, *** p<0.01, ** p<0.05, * p<0.1. All regressionsinclude industry �xed e¤ect. Normalized beta coe¢ cients in lower panel. See text for detailed descriptionsof the variables.
50

Table 12: The Endogeneity of Agglomeration Economy Measures �the Agglomeration Patternsof MNCs in Europe
T= 200 kms T= 400 kms T= 800 kms
IO Linkages 0.104 0.248* 0.454**(0.079) (0.157) (0.209)
Capital Good 0.008 0.031* 0.044*(0.010) (0.019) (0.026)
Labor 0.031*** 0.032* 0.036(0.008) (0.018) (0.030)
Technology 0.335** 0.514** 0.715**(0.151) (0.262) (0.393)
Location Fundamentals -0.001 -0.004 -0.003(0.003) (0.005) (0.004)
Obs. 7166 7166 7166R2 0.635 0.717 0.853
Beta Coe¢ cientsIO Linkages 0.009 0.009 0.008Capital Good 0.014 0.021 0.014Labor 0.055 0.023 0.012Technology 0.030 0.019 0.013Location Fundamentals -0.158 -0.087 -0.076
Notes: Bootstrapped standard errors in parentheses, *** p<0.01, ** p<0.05, * p<0.1. All regressionsinclude industry �xed e¤ect. Normalized beta coe¢ cients in lower panel. See text for detailed descriptionsof the variables.
51
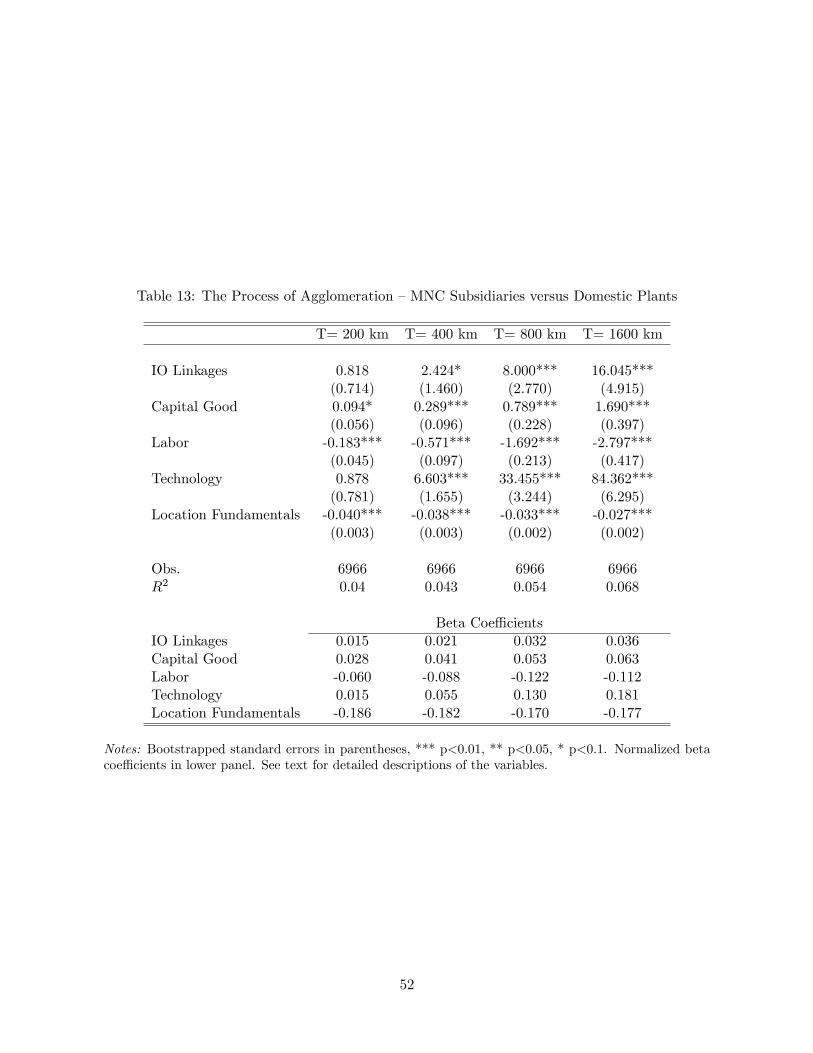
Table 13: The Process of Agglomeration �MNC Subsidiaries versus Domestic Plants
T= 200 km T= 400 km T= 800 km T= 1600 km
IO Linkages 0.818 2.424* 8.000*** 16.045***(0.714) (1.460) (2.770) (4.915)
Capital Good 0.094* 0.289*** 0.789*** 1.690***(0.056) (0.096) (0.228) (0.397)
Labor -0.183*** -0.571*** -1.692*** -2.797***(0.045) (0.097) (0.213) (0.417)
Technology 0.878 6.603*** 33.455*** 84.362***(0.781) (1.655) (3.244) (6.295)
Location Fundamentals -0.040*** -0.038*** -0.033*** -0.027***(0.003) (0.003) (0.002) (0.002)
Obs. 6966 6966 6966 6966R2 0.04 0.043 0.054 0.068
Beta Coe¢ cientsIO Linkages 0.015 0.021 0.032 0.036Capital Good 0.028 0.041 0.053 0.063Labor -0.060 -0.088 -0.122 -0.112Technology 0.015 0.055 0.130 0.181Location Fundamentals -0.186 -0.182 -0.170 -0.177
Notes: Bootstrapped standard errors in parentheses, *** p<0.01, ** p<0.05, * p<0.1. Normalized betacoe¢ cients in lower panel. See text for detailed descriptions of the variables.
52
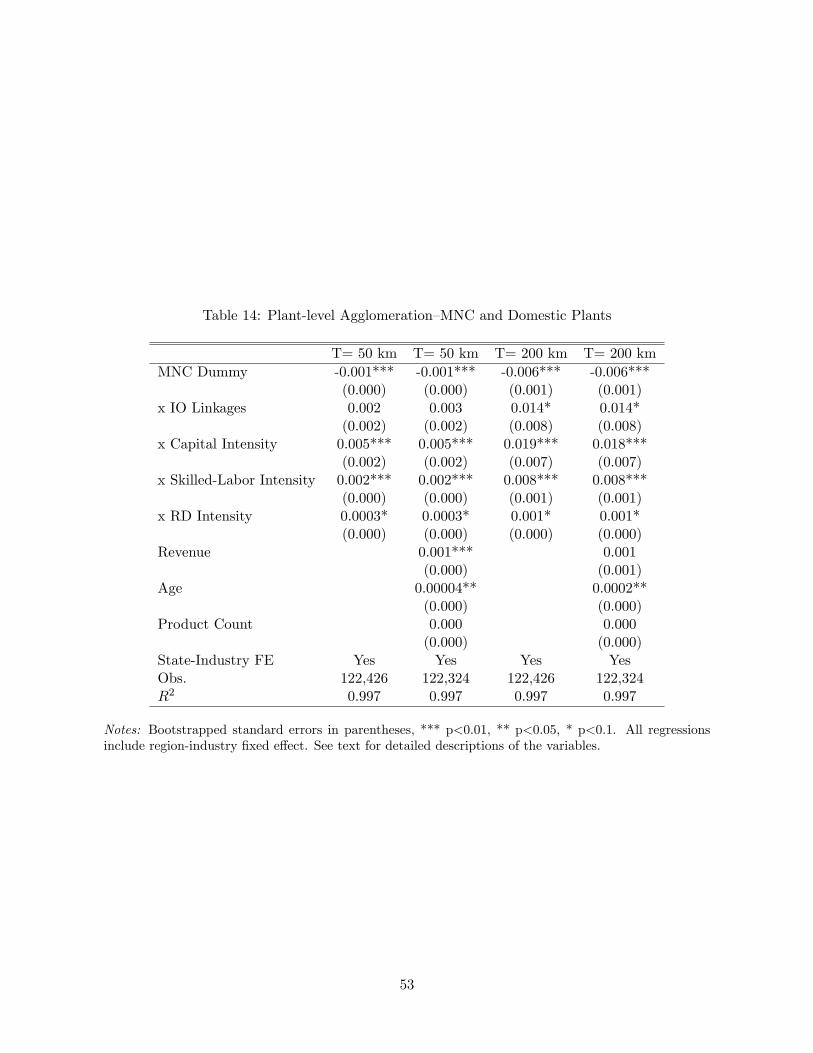
Table 14: Plant-level Agglomeration�MNC and Domestic Plants
T= 50 km T= 50 km T= 200 km T= 200 kmMNC Dummy -0.001*** -0.001*** -0.006*** -0.006***
(0.000) (0.000) (0.001) (0.001)x IO Linkages 0.002 0.003 0.014* 0.014*
(0.002) (0.002) (0.008) (0.008)x Capital Intensity 0.005*** 0.005*** 0.019*** 0.018***
(0.002) (0.002) (0.007) (0.007)x Skilled-Labor Intensity 0.002*** 0.002*** 0.008*** 0.008***
(0.000) (0.000) (0.001) (0.001)x RD Intensity 0.0003* 0.0003* 0.001* 0.001*
(0.000) (0.000) (0.000) (0.000)Revenue 0.001*** 0.001
(0.000) (0.001)Age 0.00004** 0.0002**
(0.000) (0.000)Product Count 0.000 0.000
(0.000) (0.000)State-Industry FE Yes Yes Yes YesObs. 122,426 122,324 122,426 122,324R2 0.997 0.997 0.997 0.997
Notes: Bootstrapped standard errors in parentheses, *** p<0.01, ** p<0.05, * p<0.1. All regressionsinclude region-industry �xed e¤ect. See text for detailed descriptions of the variables.
53

Table A.1: Distribution of Cross-country Establishment Pairs by Distance
All pairs Pairs located in two di¤erent countriesPairs (mil) Ave. dist (km) Pairs (mil) Percentage Ave. dist (km)
dist � 200 28.3 91.6 5.6 0.2 131.4dist � 400 54.8 194.1 24.5 0.4 268.7dist � 800 124.2 423.0 85.6 0.7 510.9dist � 1600 257.1 806.6 198.7 0.8 885.8
Notes: Authors�calculations.
54

Table A.2: Within- and Between-Industry Agglomeration Indices
Within-Industry Between-IndustryObs. Mean Obs. Mean
Subsidiaries (Percentage Points)Threshold (T) = 200 km 126 0.328 7875 0.095T = 400 km 126 0.672 7875 0.213T= 800 km 126 1.389 7875 0.506T= 1600 km 126 2.433 7875 1.006
Domestic Plants (Percentage Points)Threshold (T) = 200 km 126 0.330 7875 0.096T = 400 km 126 0.680 7875 0.224T= 800 km 126 1.421 7875 0.531T= 1600 km 126 2.503 7875 1.180
Subsidiaries Workers (Percentage Points)Threshold (T) = 200 km 126 0.369 7875 0.090T = 400 km 126 0.737 7875 0.186T= 800 km 126 1.448 7875 0.402T= 1600 km 126 2.338 7875 0.717
Headquarters (Percentage Points)Threshold (T) = 200 km 126 0.446 7875 0.135T = 400 km 126 0.951 7875 0.315T= 800 km 126 2.027 7875 0.761T= 1600 km 126 3.156 7875 1.373
55

Table A.3: Top Industry Pairs by MNC Subsidiary Agglomeration Index
MNC Subsidiary Agglomeration IndexT = 200 km
274 Miscellaneous Publishing 379 Miscellaneous Transportation Equipment314 Footwear, Except Rubber 313 Boot And Shoe Cut Stock And Findings225 Knitting Mills 313 Boot And Shoe Cut Stock And Findings367 Electronic Components And Accessories 225 Knitting Mills225 Knitting Mills 314 Footwear, Except Rubber
T = 400 km274 Miscellaneous Publishing 379 Miscellaneous Transportation Equipment314 Footwear, Except Rubber 313 Boot And Shoe Cut Stock And Findings225 Knitting Mills 313 Boot And Shoe Cut Stock And Findings274 Miscellaneous Publishing 213 Chewing And Smoking Tobacco And Snu¤263 Paperboard Mills 213 Chewing And Smoking Tobacco And Snu¤
MNC Subsidiary Worker Agglomeration IndexT = 200 km
394 Dolls, Toys, Games And Sporting 314 Footwear, Except Rubber394 Dolls, Toys, Games And Sporting 313 Boot And Shoe Cut Stock And Findings225 Knitting Mills 314 Footwear, Except Rubber314 Footwear, Except Rubber 313 Boot And Shoe Cut Stock And Findings225 Knitting Mills 394 Dolls, Toys, Games And Sporting And Athletic
T = 400 km394 Dolls, Toys, Games And Sporting 314 Footwear, Except Rubber394 Dolls, Toys, Games And Sporting 313 Boot And Shoe Cut Stock And Findings225 Knitting Mills 314 Footwear, Except Rubber314 Footwear, Except Rubber 313 Boot And Shoe Cut Stock And Findings225 Knitting Mills 313 Boot And Shoe Cut Stock And Findings
56
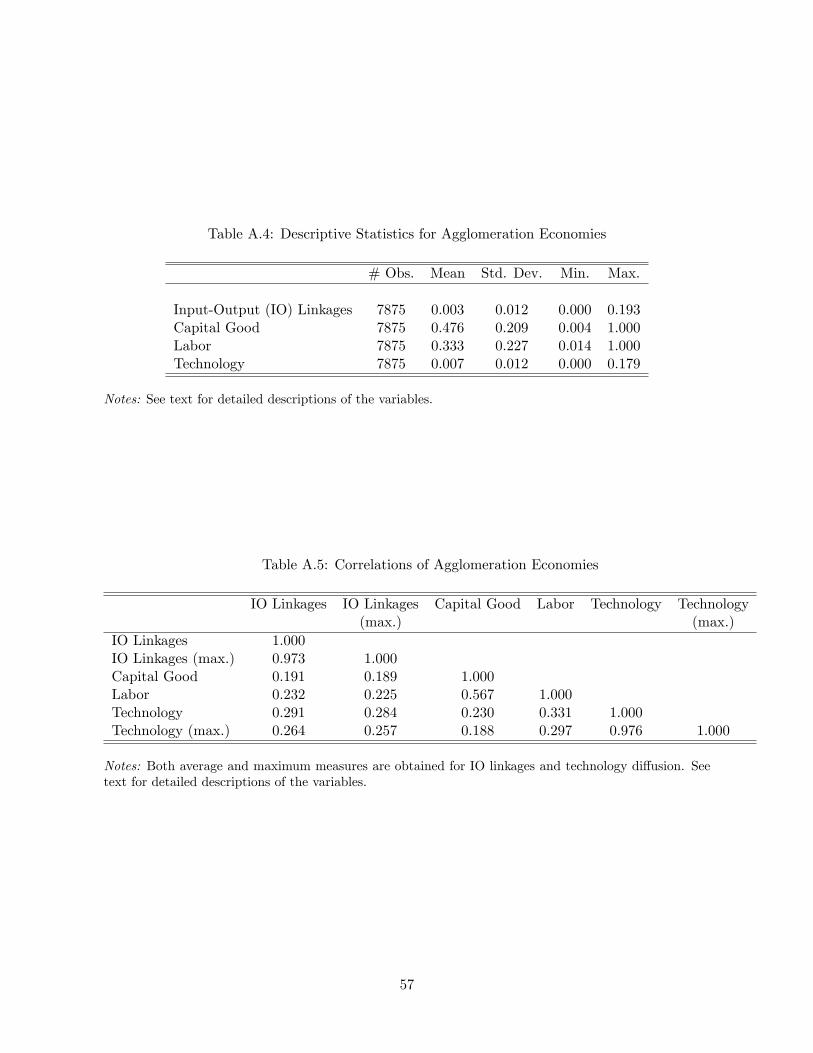
Table A.4: Descriptive Statistics for Agglomeration Economies
# Obs. Mean Std. Dev. Min. Max.
Input-Output (IO) Linkages 7875 0.003 0.012 0.000 0.193Capital Good 7875 0.476 0.209 0.004 1.000Labor 7875 0.333 0.227 0.014 1.000Technology 7875 0.007 0.012 0.000 0.179
Notes: See text for detailed descriptions of the variables.
Table A.5: Correlations of Agglomeration Economies
IO Linkages IO Linkages Capital Good Labor Technology Technology(max.) (max.)
IO Linkages 1.000IO Linkages (max.) 0.973 1.000Capital Good 0.191 0.189 1.000Labor 0.232 0.225 0.567 1.000Technology 0.291 0.284 0.230 0.331 1.000Technology (max.) 0.264 0.257 0.188 0.297 0.976 1.000
Notes: Both average and maximum measures are obtained for IO linkages and technology di¤usion. Seetext for detailed descriptions of the variables.
57