the global environment natural resources and economic growth
DESCRIPTION
Global Environment, Economic GrowthTRANSCRIPT


The Global Environment, NaturalResources, and Economic Growth

This page intentionally left blank

The Global Environment,Natural Resources, andEconomic Growth
Alfred Greiner and Willi Semmler
12008

3Oxford University Press, Inc., publishes works that furtherOxford University’s objective of excellencein research, scholarship, and education.
Oxford New YorkAuckland Cape Town Dar es Salaam Hong Kong KarachiKuala Lumpur Madrid Melbourne Mexico City NairobiNew Delhi Shanghai Taipei Toronto
With offices inArgentina Austria Brazil Chile Czech Republic France GreeceGuatemala Hungary Italy Japan Poland Portugal SingaporeSouth Korea Switzerland Thailand Turkey Ukraine Vietnam
Copyright © 2008 by Oxford University Press, Inc.
Published by Oxford University Press, Inc.198 Madison Avenue, New York, New York 10016
www.oup.com
Oxford is a registered trademark of Oxford University Press.
All rights reserved. No part of this publication may be reproduced,stored in a retrieval system, or transmitted, in any form or by any means,electronic, mechanical, photocopying, recording, or otherwise,without the prior permission of Oxford University Press.
Library of Congress Cataloging-in-Publication Data
Greiner, Alfred.The global environment, natural resources, and economic growth/Alfred Greiner, Willi Semmler.p. cm.Includes bibliographical references and index.ISBN 978-0-19-532823-31. Economic development—Environmental aspects. 2. Pollution—Economic aspects.3. Natural resources—Management. I. Semmler, Willi. II. Title.HD75.6.G745 2008333.7—dc22q 2007047160
9 8 7 6 5 4 3 2 1
Printed in the United States of Americaon acid-free paper

“We have not inherited the earth from our ancestors, we have only borrowed itfrom our children.”
—Ancient Proverb
“Act so that the effects of your action are compatible with the permanence ofgenuine human life.”
—Hans Jonas (1903–1993),German-born philosopher,
taught at the New School, 1955–1976

This page intentionally left blank

Preface
Recently public attention has turned toward the intricate interrelationbetween economic growth and global warming. This book focuses onthis nexus but broadens the framework to study this issue. Growthis seen as global growth, which affects the global environment andclimate change. Global growth, in particular high economic growthrates, implies a fast depletion of renewable and nonrenewable resources.Thus the book deals with the impact of economic growth on the envi-ronment and the effect of the exhaustive use of natural resources aswell as the reverse linkage. We thus address three interconnected issues:economic growth, environment and climate change, and renewable andnonrenewable resources. These three topics and the interrelationshipamong them need to be treated in a unified framework. In addition, notonly intertemporal resource allocation but also the eminent issues relat-ing to intertemporal inequities, as well as policy measures to overcomethem, are discussed in the book. Yet more than other literature on globalwarming and resources, we study those issues in the context of moderngrowth theory. Besides addressing important issues in those areas wealso put forward a dynamic framework that allows focus on the appli-cation of solution methods for models with intertemporal behavior ofeconomic agents.
The material in this book has been presented by the authors atseveral universities and conferences. Chapters have been presentedas lectures at Bielefeld University; Max Planck Institute for Demo-graphic Research, Rostock; Sant’Anna School of Advanced Studies ofPisa, Itlay; University of Technology, Vienna; University of Aix-en-Provence; Bernard Schwartz Center for Economic Policy Analysis ofthe New School, New York; and Chuo University, Tokyo, Japan. Somechapters have also been presented at the annual conference of the Soci-ety of Computational Economics and the Society of Nonlinear Dynamicsand Econometrics. We are grateful for comments by the participants ofthose workshops and conferences.
Some parts of the book are based on joint work with co-authors.Chapter 14 is based on the joint work of Almuth Scholl and WilliSemmler, and chapter 15 originated in the joint work of Malte Sievekingand Willi Semmler. We particularly want to thank Almuth Scholl andMalte Sieveking for allowing us to use this material here.
vii

viii Preface
We are also grateful for discussions with and comments from PhilippeAghion, Toichiro Asada, Buz Brock, Graciela Chichilnisky, Lars Grüne,Richard Day, Ekkehard Ernst, Geoffrey Heal, James Ramsey, HirofumiUzawa, and colleagues of our universities. We thank Uwe Köller forresearch assistance and Gaby Windhorst for editing and typing themanuscript. Financial support from the Ministry of Education, Scienceand Technology of the State of Northrhine-Westfalia, Germany, and fromthe Bernard Schwartz Center for Economic Policy Analysis of the NewSchool is gratefully acknowledged. Finally we want to thank numer-ous anonymous readers and Terry Vaughn and Catherine Rae at OxfordUniversity Press, who have helped the book to become a better product.

Contents
Introduction 3
Part I The Environment and Economic Growth
1 Introduction and Overview 7
2 The Basic Economic Model 102.1 The Household Sector 102.2 The Productive Sector 112.3 The Government 122.4 Equilibrium Conditions and the Balanced
Growth Path 13
3 Growth and Welfare Effects of Fiscal Policy 173.1 Growth Effects of Fiscal Policy on the BGP 173.2 Growth Effects on the Transition Path 223.3 Welfare Effects of Fiscal Policy on the BGP
and the Social Optimum 263.3.1 Welfare Effects 263.3.2 The Social Optimum 28
4 The Dynamics of the Model with StandardPreferences 31
5 Pollution as a Stock 395.1 The Household Sector 395.2 The Productive Sector and the Stock of Pollution 405.3 The Government 415.4 Equilibrium Conditions and the Balanced
Growth Path 415.5 The Dynamics of the Model 435.6 Effects of the Different Scenarios on
the Balanced Growth Rate 47
6 Concluding Remarks 51

x Contents
Part II Global Warming and Economic Growth
7 Introduction and Overview 55
8 Facts on GHG Emissions and the Change inAverage Global Surface Temperature 60
9 A Descriptive Model of Endogenous Growth 639.1 Structure of the Model 639.2 The Balanced Growth Path 659.3 Numerical Examples 68
10 The AK Endogenous Growth Model 7110.1 The Second-Best Solution 7210.2 The Social Optimum 7510.3 A Multiregion World 77
10.3.1 The Noncooperative World 7910.3.2 The Cooperative World 8410.3.3 Equal Marginal Damages in All Regions 87
11 A Model with Optimizing Agents 8911.1 The Competitive Economy 89
11.1.1 The Structure of the Economy 8911.1.2 Analytical Results 92
11.2 The Social Optimum 10011.3 Modeling Nonlinear Feedback Effects of the Rise in
Temperature 10711.3.1 The Competitive Economy 10911.3.2 The Social Planner’s Problem 116
12 Concluding Remarks 120
Part III Depletion of Resources andEconomic Growth 123
13 Introduction and Overview 125
14 Nonrenewable Resources 12714.1 Introduction 12714.2 Economic Growth with Resource Constraints 128
14.2.1 A Basic Model 12814.2.2 Technological Change 13014.2.3 The Role of Backstop Technology 132

Contents xi
14.3 The Importance of Intergenerational Equity 13314.3.1 The Amenity Value of Natural Resources 13314.3.2 Resources and Intergenerational Equity 135
14.4 Assessment of the Finiteness of Resources 13714.5 Assessment of Petroleum Reserves 14014.6 Estimation of a Basic Model 142Appendix: Sketch of Solutions and Data Sources 145
15 Renewable Resources 15715.1 Introduction 15715.2 Renewable Resources and Optimal Growth 15915.3 Open Access: Zero Horizon Optimization 166
15.3.1 Elasticity of Demand and Optimal Effort 16615.3.2 Predator-Prey System 16615.3.3 System of Competing Species 167
15.4 The Monopoly: Infinite Horizon Optimization 17115.5 Concluding Remarks 175Appendix 177
16 Regulation of Resources 18016.1 Introduction 18016.2 The Model 18216.3 Numerical Results for the Partial
and Complete Model 18416.4 Concluding Remarks 186Appendix 188
17 Conclusion 190
Appendix: Three Useful Theorems from DynamicOptimization 194
Bibliography 197
Index 205

This page intentionally left blank

The Global Environment, NaturalResources, and Economic Growth

This page intentionally left blank

Introduction
The globalization of economic activities since the 1980s and 1990s,accelerated through free trade agreements, liberalized capital markets,and labor mobility, has brought into focus the issues related to globalgrowth, resources, and environment. The industrialization in manycountries in the past 100 years and the resource-based industrial activi-ties have used up resources, mostly produced by poor and developingcountries. The tremendous industrial growth in the world economy, par-ticularly since World War II, and the current strong economic growth insome regions of the world, for example inAsia and some LatinAmericancountries, have generated a high demand for specific inputs. Renewableas well as nonrenewable resources have been in high demand, and theyare threatened with being depleted. In particular, the growing interna-tional demand for metals and energy derived from fossil fuels, as wellas other natural resources, which are often extracted from developingcountries, has significantly reduced the years to exhaustion for thoseresources.
It is true that technical progress has reduced the dependence ofmodern economies on natural resources, which is beneficial for theirconservation, but this positive effect mostly holds for advancedeconomies producing with up-to-date technologies. Developing nationsproducing with older technologies usually do not have this advantage.In addition, several of those countries have experienced high growthrates over the past years. In particular, China and India have grown veryfast over the past decades. These two countries alone comprise a pop-ulation of more than two billion citizens, and the high growth rates inthese countries have led to a dramatic increase in the demand for naturalresources.
Whereas modern economies, like those in Western Europe andJapan, could reduce their dependence on nonrenewable resources, thisdoes not necessarily hold for renewable resources. In particular, manyoceans have been overfished for a long time. Current estimates assumethat about 75 percent of the worldwide fish population is overfished.Although this problem has been realized by scientists and politicians, theshort-run gains seem to be more important than conservation, leadingto a severe threat to some fish species.
There is also an issue of inequity involved. An overwhelming frac-tion of resources, located in the South, are used up in the North, in
3

4 Introduction
the industrialized countries, and the North has become the strongestpolluter of the global environment. Many recent studies have confirmedthat the emission of greenhouse gases is the main cause for global warm-ing. Moreover, concerning intergenerational equity, current generationsextensively use up resources and pollute the environment. Both producenegative externalities for future generations.
Indeed, not only does the environmental pollution strongly affect thecurrent generation, but the environmental degradation affects futuregenerations as well. It is true that as for the dependence on natu-ral resources, technical progress has led to a more efficient use oftechnologies so that emissions of some pollutants have been reducedconsiderably. Indeed, in a great many regions in Europe and in theUnited States, for example, air pollution has been successfully reduced,leading to a cleaner environment. However, this does not hold for alltypes of emissions. In particular, emissions of greenhouse gases are ata high level and still increasing. Concerning greenhouse gas emissions,the high standard of living of modern Western societies makes thesecountries emit most of these gases, if measured per capita. Since theconference and protocol of Kyoto in 1997, the global change of the cli-mate has become an important issue for academics as well as politicians.Although some countries had cast doubt on the fact that it is humankindthat produces a global climate change, this question seems to have beenanswered now. There is vast evidence that the climate of the Earth ischanging due to increases in greenhouse gases caused by human activ-ities (see, for example, the report by Stern 2006, 2007, and the IPCCreport 2007).
Although some may argue that to address and study those issues onglobal growth, environment, and resources, large-scale macro modelsmay be needed. Yet when those models are solved through simulations,the mechanisms get blurred, and policy implication are not transpar-ently derived. This book takes a different route. In the context of modernsmall-scale growth models, where the behavior of the agents and theframework are well defined, clear and coherent results are derived thatmay become useful guidelines for policy makers and practitioners.
The outline of the book reflects the discussed major issues. Part Ideals with the environment and growth. We present models that incor-porate the role of environmental pollution into modern growth modelsand derive optimal abatement activities as public policy. Part II modelsglobal climate change in the context of economic growth models. Policyimplications are direct and transparent. Part III evaluates the use andoveruse of nonrenewable and renewable resources in the context ofintertemporal economic models. Aspects of global and intertemporalinequities as well as policy measures to overcome them are discussedin each part of the book.

PART IThe Environment andEconomic Growth

This page intentionally left blank
1
Introduction and Overview
There are numerous economic models that study the interrelationbetween economic growth and the environment. We focus on a class ofmodels in which economic activities lead to environmental degradation,and thus economic activity negatively affect the utility of households orthe production activities of firms. This line of research goes back toForster (1973) and was extended by Gruver (1976). Forster (1973), forexample, studies a dynamic model of capital accumulation, the Ramseygrowth model, with pollution as a byproduct of capital accumulationthat can be reduced by abatement spending. In the long run, this modelis characterized by a stationary state where all variables are constantunless exogenous shocks occur.
Another early contribution in environmental economics is the bookby Mäler (1974), which can be considered as a classical contribution inthis field. Mäler analyzes several aspects associated with environmen-tal degradation in different frameworks, such as a general equilibriummodel of environmental quality and an economic growth model incor-porating the environment. But Mäler assumes a finite time horizon andis less interested in the long-run evolution of economies, in contrast toForster (1973).
If one studies a growth model and intends to analyze the long-runevolution of economies, models with constant variables in the long runare rather unrealistic. With the publication of the papers by Romer (1986,1990) the “new” or endogenous growth theory has become prominent.The major feature of models within this line of research is that the growthrate becomes an endogenous variable, the per capita income rises overtime, and the government may affect growth through fiscal policy, forexample. Concerning the forces that can generate ongoing growth, onecan think of positive externalities associated with investment, the for-mation of human capital, or the creation of a stock of knowledge throughR&D spending (for a survey, see Greiner et al. 2005).
Another type of model in endogenous growth theory assumes that thegovernment can invest in productive public capital, which stimulatesaggregate productivity. This approach goes back to Arrow and Kurz(1970), who presented exogenous growth models with that assumptionin their book. The first model in which productive public spending leadsto sustained per capita growth in the long run was presented by Barro(1990). In his model, productive public spending positively affects the
7

8 The Environment and Economic Growth
marginal product of private capital and makes the long-run growth ratean endogenous variable. However, the assumption that public spendingas a flow variable affects aggregate production activities is less plausiblefrom an empirical point of view, as pointed out in a study by Aschauer(1989).
Futagami et al. (1993) have extended the Barro model by assumingthat public capital as a stock variable shows positive productivity effectsand then investigated whether the results derived by Barro are still validgiven their modification of the model. However, the assumption madeby these researchers implies that the model has transition dynamics,which does not hold for the model when public spending as a flowvariable shows productive effects. In the latter case, the economy imme-diately jumps on the balanced growth path. The model presented byFutagami and colleagues is characterized by a unique balanced growthpath, which is a saddle point. Although the questions of whether thelong-run balanced growth path is unique and whether it is stable areimportant issues, they are not frequently studied in this type of research.Most of the contributions study growth and welfare effects of fiscalpolicy for a model on the balanced growth path.
As to the question of whether public spending can affect aggre-gate production possibilities at all, the empirical studies do not obtainunambiguous results. However, this is not too surprising because thesestudies often consider different countries over different time periodsand the effect of public investment in infrastructure, for example, islikely to differ over countries and over time. A survey of the empiricalstudies dealing with that subject can be found in Pfähler et al. (1996),Sturm et al. (1998), Romp and de Haan (2005), and Semmler et al. (2007).
Problems of environmental degradation have also been studied inendogenous growth models. There exist many models dealing withenvironmental quality or pollution and endogenous growth (for asurvey, see, for example, Smulders 1995 or Hettich 2000). Most of thesemodels assume that pollution or the use of resources influences pro-duction activities either through affecting the accumulation of humancapital or by directly entering the production function. Examples ofthat type of research are the publications by Bovenberg and Smulders(1995), Gradus and Smulders (1993), Bovenberg and de Mooij (1997),and Hettich (1998). The goal of these studies, then, is to analyze how dif-ferent tax policies affect growth, pollution, and welfare in an economy.But as with the approaches already mentioned, most of these models donot have transition dynamics or the analysis is limited to the balancedgrowth path. An explicit analysis of the dynamics is often beyond thescope of these contributions. An exception is provided by the paperby Koskela et al. (2000), who study an overlapping generations modelwith a renewable resource that serves as a store of value and as aninput factor in the production of the consumption good. They find that

Introduction and Overview 9
indeterminacy and cycles may result in their model, depending on thevalue of the intertemporal elasticity of consumption.
In part I we analyze a growth model where pollution only affects util-ity of a representative household but does not affect production activitiesdirectly through entering the aggregate production function. However,there is an indirect effect of pollution on output because we supposethat resources are used for abatement activities. Concerning pollution,we assume that it is an inevitable byproduct of production and can bereduced to a certain degree by investing in abatement activities. Asto the growth rate, we suppose that it is determined endogenouslyand that public investment in a productive public capital stock bringsabout sustained long-run per capita growth. Thus we adopt that type ofendogenous growth models that was initiated by Barro (1990), Futagamiet al. (1993), and others as mentioned.
Our approach is closely related to the contributions by Smulders andGradus (1996) and Bovenberg and de Mooij (1997), who are interested ingrowth and welfare effects of fiscal policy affecting the environment butdo not explicitly study the dynamics of their models. Concerning thestructure, our model is similar to the one presented by Bovenberg and deMooij (1997) with the exception that we assume that public capital as astock enters the aggregate production function, whereas Bovenberg andde Mooij assume that public investment as a flow has positive effects onaggregate production.
In chapter 2 we present a simple variant of an economic model withenvironmental pollution and productive public capital. This model willbe analyzed assuming a logarithmic utility function. Chapter 3 studiesboth growth and welfare effects of fiscal policy. In particular, we analyzehow the long-run balanced growth rate reacts to fiscal policy and to theintroduction of a less polluting technology. Further, we study the effectsof fiscal policy, taking into account transition dynamics, and we ana-lyze welfare effects of fiscal policy on the environment on the balancedgrowth path as well as the social optimum. In chapter 4 we general-ize our model and allow for a more general isoelastic utility function.The goal, then, is to give an explicit characterization of the dynamicbehavior resulting from more general assumptions. An extension of themodel is presented in chapter 5 , where we assume that environmentalpollution as a stock negatively affects utility of the household. In thisvariation of the model, we consider three different scenarios: first, weanalyze a scenario with a constant stock of pollution; second, we studya scenario with an improving environmental quality; and finally, weanalyze a scenario in which environmental pollution grows at the samepositive rate as all other endogenous variables.

2
The Basic Economic Model
We consider a decentralized economy with a household sector, a pro-ductive sector, and the government (see Greiner 2005a). First, wedescribe the household sector. For reasons of simplicity we presumehere the household’s preferences to be logarithmic in consumption andpollution.
2.1 THE HOUSEHOLD SECTOR
The household sector in our economy consists of many identical house-holds, which are represented by one household. The goal of thishousehold is to maximize a discounted stream of utility arising fromconsumption C(t) over an infinite time horizon subject to its budgetconstraint:
maxC(t)
∫ ∞
0e−ρtV(t)dt, (2.1)
with V(t) the instantaneous subutility function that depends positivelyon the level of consumption and negatively on effective pollution, PE(t).V(t) takes the logarithmic form
V(t) = lnC(t) − lnPE(t), (2.2)
with ln giving the natural logarithm.1 ρ in (2.1) is the subjective discountrate. Later in the book, at various places, we discuss further the impor-tance of the discount rate for the solution of our models. Here it maysuffice to refer the reader to an important recent work on the discountrate; see Weitzman (2007a,b).
The budget constraint for the household is given by2
K = (w+ rK)(1 − τ) − C. (2.3)
The budget constraint (2.3) states that the individual has to decide howmuch to consume and how much to save, thus increasing consumption
1 For a survey of how to incorporate pollution in the utility function, see Smulders(1995), pp. 328–29.2 In what follows we suppress the time argument if no ambiguity arises.
10

The Basic Economic Model 11
possibilities in the future.3 The depreciation of physical capital isassumed to equal zero.
The wage rate is denoted by w. The labor supply L is constant, sup-plied inelastically, and we normalize L ≡ 1. r is the return to per capitacapital K, and τ ∈ (0, 1) gives the income tax rate.
To derive necessary conditions we formulate the current-valueHamiltonian function as
H(·) = lnC − lnPE + λ(−C + (w+ rK)(1 − τ)), (2.4)
with λ the costate variable. The necessary optimality conditions aregiven by
λ = C−1, (2.5)
λ/λ = ρ − r(1 − τ), (2.6)
K = −C + (w+ rK)(1 − τ). (2.7)
Because the Hamiltonian is concave in C and K jointly, the necessaryconditions are also sufficient if in addition the transversality conditionat infinity limt→∞ e−ρtλ(t)K(t) = 0 is fulfilled. Moreover, strict concavityin C also guarantees that the solution is unique (see the appendix and,for more details, Seierstad and Sydsaeter [1987], pp. 234–35).
2.2 THE PRODUCTIVE SECTOR
The productive sector in our economy consists of many identical firmsthat can be represented by one firm. The latter behaves competitivelyand chooses inputs to maximize profits.
As to pollution P, we suppose that it is a byproduct of aggregateproduction Y. In particular, we assume that
P(t) = ϕY(t), (2.8)
with ϕ = const. > 0. Thus, we follow the line invited by Forster (1973)and worked out in more detail by Luptacik and Schubert (1982).
Effective pollution PE, which affects utility of the household, is thatpart of pollution that remains after investing in abatement activities A.This means that abatement activities reduce pollution but cannot elim-inate it completely. As to the modeling of effective pollution, we followGradus and Smulders (1993) and Lighthart and van der Ploeg (1994)and make the following specification:
PE = PAβ
, 0 < β ≤ 1. (2.9)
3 The dot over a variable gives the derivative with respect to time.

12 The Environment and Economic Growth
The limitation β ≤ 1 ensures that a positive growth rate of aggregateproduction goes along with an increase in effective pollution, β < 1, orleaves effective pollution unchanged, β = 1. We make that assumptionbecause we think it is realistic to assume that higher production alsoleads to an increase in pollution, although at a lower rate because ofabatement. In looking at the world economy, that assumption is certainlyjustified. But it should also be noted that for β = 1 sustained outputgrowth goes along with a constant level of effective pollution, whichwill be seen in detail in the next section. Further, we posit that Aβ > 1holds such that effective pollution is smaller than pollution withoutabatement, which is in a way an obvious assumption.
Pollution is taxed at the rate τp > 0, and the firm takes into accountthat one unit of output causes ϕ units of pollution, for which it has to payτpϕ per unit of output. The per capita production function is given by
Y = KαH1−αL1−α ≡ KαH1−α, (2.10)
with H denoting the stock of productive public capital and α ∈ (0, 1)
giving the per capita capital share. Recall that K denotes per capitacapital and L is normalized to one.
Assuming competitive markets and taking public capital as given,the first-order conditions for a profit maximum are obtained as
w = (1 − τpϕ)(1 − α)KαH1−α, (2.11)
r = (1 − τpϕ)αKα−1H1−α. (2.12)
2.3 THE GOVERNMENT
The government in our economy uses resources for abatement activitiesA(t) that reduce total pollution. Abatement activitiesA ≥ 0 are financedby the tax revenue coming from the tax on pollution, that is, A(t) =ητpP(t), with η > 0. If η < 1, not all of the pollution tax revenue isused for abatement activities and the remaining part is spent for publicinvestment in the public capital stock Ip, Ip ≥ 0, in addition to the taxrevenue resulting from income taxation. For η > 1 a certain part of thetax revenue resulting from the taxation of income is used for abatementactivities in addition to the tax revenue gained by taxing pollution. Asto the interpretation of public capital, one can think of infrastructurecapital, for example. However, one could also interpret public capital ina broader sense so that it also includes human capital, which is built upas a result of public education.
It should be mentioned that there are basically two approaches inthe economics literature to model abatement. The first assumes thatprivate firms engage in abatement (see Bovenberg and de Mooij 1997

The Basic Economic Model 13
or Bovenberg and Smulders 1995). In the second approach, which wefollow here, abatement spending is financed by the government (seeLighthart and van der Ploeg 1994 or Nielsen et al. 1995).
The government in our economy runs a balanced budget at anymoment in time. Thus, the budget constraint of the government iswritten as
Ip = τpP(1 − η) + τ(w+ rK). (2.13)
The evolution of public capital is described by
H = Ip, (2.14)
where for simplicity we again assume that there is no depreciation ofpublic capital.
2.4 EQUILIBRIUM CONDITIONS AND THE BALANCEDGROWTH PATH
Combining the budget constraint of the government and the equationdescribing the evolution of public capital over time, the accumulationof public capital can be written as
H = −ηϕτpKαH1−α + τpϕKαH1−α + τ(w+ rK)
= KαH1−α(ϕτp(1 − η) + (1 − ϕτp)τ), (2.15)
where we have used (2.11) and (2.12).To obtain the other differential equations describing our economy, we
note that the growth rate of private consumption is obtained from (2.5)and (2.6), with r taken from (2.12) and where we have used PE/PE =(1−β)Y/Y. Using (2.11) and (2.12), K/K is obtained from (2.7). It shouldbe noted that the accumulation of public capital, which is positive forIp > 0, is the source of sustained economic growth in our model andmakes the growth rate an endogenous variable.
Thus the dynamics of our model are completely described by thefollowing differential equation system:
CC
= −ρ + (1 − τ)(1 − ϕτp) α
(HK
)1−α
, (2.16)
KK
= −CK
+(HK
)1−α
(1 − ϕτp) (1 − τ), (2.17)
HH
=(HK
)−α (ϕτp (1 − η) + (1 − ϕτp) τ
). (2.18)

14 The Environment and Economic Growth
The initial conditions K(0) and H(0) are given and fixed, and C(0) canbe chosen freely by the economy. Further, the transversality conditionlimt→∞ e−ρtK(t)/C(t) = 0 must be fulfilled.4
In the following, we first examine our model as to the existence andstability of a balanced growth path (BGP). To do so, we define a BGP.
Definition 1 A balanced growth path (BGP) is a path such that C/C =K/K = H/H ≡ g > 0 holds, with g constant and C, K, and H strictlypositive. A balanced growth path is sustainable if V > 0 holds.
This definition shows that on a BGP the growth rates of economicvariables are positive and constant over time. Notice that aggregateoutput and pollution grow at the same rate on the BGP. This implies thateffective pollution is not constant in the long run (unless β = 1 holds).Nevertheless, one may say that the BGP is sustainable if one adoptsthe definition given in Byrne (1997), which is done in our definition.There, sustainable growth is given if instantaneous utility grows overtime, that is, if V is positive. For our model with logarithmic utility,this is automatically fulfilled on the BGP because V = C/C − PE/PE =C/C − (1 − β)Y/Y = βg > 0 holds.
To analyze the model further, we first have to perform a change ofvariables. Defining c = C/K and h = H/K and differentiating thesevariables with respect to time, we get c/c = C/C − K/K and h/h =H/H − K/K. A rest point of this new system then corresponds to a BGPof our original economy where all variables grow at the same constantrate. The system describing the dynamics around a BGP is given by
c = c(c− ρ − (1 − α)(1 − τ)(1 − ϕτp)h1−α
), (2.19)
h = h(c− h1−α(1 − ϕτp)(1 − τ) + h−α(ϕτp(1 − η) + (1 − ϕτp)τ)
). (2.20)
Concerning a rest point of system (2.19) and (2.20), note that we onlyconsider interior solution. That means that we exclude the economi-cally meaningless stationary point c = h = 0. As to the uniqueness andstability of a BGP, we can state the following proposition.
Proposition 1 Assume that τpϕ < 1 and (1 − τpϕ)τ + (1 − η)τpϕ > 0.Then there exists a unique BGP which is saddle point stable.
Proof: To prove that proposition we first calculate c� on a BGP,5 which isobtained from h/h = 0 as
c� = h1−α(1 − ϕτp)(1 − τ) − h−α(ϕτp(1 − η) + (1 − ϕτp)τ).
4 Note that (2.5) yields λ = 1/C.5 We denote values on the BGP by �.

The Basic Economic Model 15
Inserting c� in (2.19) gives after some modifications
f (·) ≡ c/c = −ρ + (1 − τ)(1 − ϕτp)αh1−α − h−α(ϕτp(1 − η) + (1 − ϕτp)τ),
with limh→0 f (·) = −∞ (for Ip > 0) and limh→∞ f (·) = ∞. A rest pointfor f (·), that is, a value for h such that f (·) = 0 holds, then gives a BGPfor our economy. Further, we have
∂f (·)/∂h = (1 − τ)(1 − ϕτp)(1 − α)αh−α + αh−α−1(ϕτp(1 − η)
+ (1 − ϕτp)τ) > 0,
for Ip > 0. Note that on a BGP H/H > 0 must hold, implying Ip > 0 andthus ϕτp(1 − η)+ (1 −ϕτp)τ > 0. ∂f/∂h > 0 for h such that f (·) = 0 meansthat f (·) cannot intersect the horizontal axis from above. Consequently,there exists a unique h� such that f (·) = 0 and, therefore, a unique BGP.
The saddle point property is shown as follows. Denoting with J theJacobian matrix of (2.19) and (2.20) evaluated at the rest point we firstnote that det J< 0 is a necessary and sufficient condition for saddlepoint stability, that is, for one negative and one positive eigenvalue. TheJacobian in our model can be written as
J =[c −c h−α(1 − α)2(1 − τ)(1 − τpϕ)
h −υ
],
with
υ = (1 − α)h1−α(1 − τ)(1 − τpϕ) + αh−α(ϕτp(1 − η) + (1 − ϕτp)τ).
The determinant can be calculated as
det J = −c hα(h−α−1(ϕτp(1 − η) + (1 − ϕτp)τ)
+ (1 − α)h−α(1 − τ)(1 − τpϕ))
< 0.
Thus, the proposition is proved. �
Proposition 1 states that our model is both locally and globally deter-minate, that is, there exists a unique value for c(0) such that the economyconverges to the unique BGP in the long run. Note that we followBenhabib and Perli (1994) and Benhabib et al. (1994) concerning thedefinition of local and global determinacy. According to that definition,local determinacy is given if there exist unique values for the variablesthat are not predetermined but can be chosen at t = 0, such that theeconomy converges to the BGP in the long run. If there exists a contin-uum of values for the variables that can be chosen at time t = 0, so thatthe economy asymptotically converges to the BGP, the model revealslocal indeterminacy.

16 The Environment and Economic Growth
Global indeterminacy arises if there exists more than one BGP andthe variables that are not predetermined at time t = 0 may be chosento place the economy on the attracting set of either of the BGPs. In thiscase, the initial choice of the variables, which can be chosen at timet = 0, affects not only the transitional growth rates but also the long-rungrowth rate on the BGP. If the long-run BGP is unique, the economy issaid to be globally determinate.
The assumption (1 − ϕτp) > 0 is necessary for a positive growth rateof consumption and is sufficient for a positive value of c�.6 The secondassumption (ϕτp(1 −η)+ (1 −ϕτpτ) > 0 must hold for a positive growthrate of public capital. Note that (ϕτp(1 − η) + (1 − ϕτpτ)) = Ip/Y, statingthat the second assumption in proposition 1 means that on a BGP theratio of public investment to GDP must be positive.
6 This is realized if c� is calculated from c/c = 0 as c� = ρ + (1 − α)(1 − τ)(1 − τpϕ)h1−α.

3
Growth and Welfare Effects ofFiscal Policy
In the last chapter we demonstrated that there exists a unique BGP underslight additional assumptions. Thus, our model including the transitiondynamics is completely characterized. In this chapter we analyze howthe growth rate and welfare in our economy react to fiscal policy. Thefirst will be done for the model on the BGP and taking into accounttransition dynamics, and the latter is done for the model on the BGP.
3.1 GROWTH EFFECTS OF FISCAL POLICY ON THE BGP
Before we analyze growth effects of fiscal policy, we study effects ofintroducing a less polluting production technology, that is, the impactof a decline in ϕ.
The balanced growth rate, which we denote by g, is given by(2.18) as
g = H/H = (h)−α (ϕτp(1 − η) + (1 − ϕτp)τ
).
Differentiating g with respect to ϕ gives
∂g∂ϕ
= h−ατp(1 − η − τ) − (ϕτp(1 − η) + (1 − ϕτp)τ)αh−α−1 ∂h∂ϕ
.
∂h/∂ϕ is obtained by implicit differentiation from f (·) = 0 (from the proofof proposition 1) as
∂h∂ϕ
= τp(1 − η − τ) + τp(1 − τ)αh
α(1 − τ)(1 − ϕτp)(1 − α) + αh−1(ϕτp(1 − η) + (1 − ϕτp)τ).
For (1 − η − τ) = 0 we get ∂g/∂ϕ < 0. To get results for (1 − η − τ) �= 0we insert ∂h/∂ϕ in ∂g/∂ϕ. That gives
∂g∂ϕ
= h−ατp(1 − η − τ)
·
1 − (ϕτp(1 − η) + (1 − ϕτp)τ)[(1 − η − τ) + hα(1 − τ)]
(1 − η − τ)
[(ϕτp(1 − η) + (1 − ϕτp)τ)
+h(1 − τ)(1 − τpϕ)(1 − α)
] .
17

18 The Environment and Economic Growth
From that expression, it can be seen that the expression in brackets isalways positive for (1−η−τ) < 0 such that ∂g/∂ϕ < 0. For (1−η−τ) > 0it is immediately seen that
∂g∂ϕ
> = < 0 ⇔ (1 − ϕτp)(1 − α)(1 − η − τ)
> = < α (ϕτp(1 − η) + (1 − ϕτp)τ),
which simplifies to
∂g∂ϕ
> = < 0 ⇔ (1 − η)(1 − α) > = < ϕτp(1 − η) + (1 − ϕτp)τ.
The right-hand side of that expression is equivalent to IP/Y. Thus wehave proved the following proposition.
Proposition 2 If (1 − η − τ) ≤ 0, the use of a less polluting technologyraises the balanced growth rate. For (1−η−τ) > 0, the use of a less pollutingtechnology raises (leaves unchanged, lowers) the balanced growth rate if
IpY
> (=, <)(1 − α)(1 − η).
To interpret that result we first note that a cleaner production technology(i.e., a lower ϕ) shows two different effects: on one hand, it impliesthat fewer resources are needed for abatement activities, leaving moreresources for public investment. That effect leads to a higher ratioH/K,thus raising the marginal product of private capital r in (2.12). Thatis, the return on investment rises. Further, a less polluting technologyimplies that the firm has to pay less pollution taxes (the term (1 − τpϕ)
rises), which also has a stimulating effect on r, which can be seen from(2.12) and which also raises the incentive to invest. On the other hand,less pollution implies that the tax revenue resulting from the taxation ofpollution declines and thus so does productive public spending. Thateffect tends to lower the ratioH/K and, therefore, the marginal productof private capital. This tends to lower the balanced growth rate.
If η ≥ 1 − τ, that is, if much of the pollution tax is used for abate-ment activities, a cleaner technology always raises the balanced growthrate. In that case, the negative growth effect of a decline in the pollu-tion tax revenue is not too strong because most of that revenue is usedfor abatement activities that are nonproductive anyway. If, however,η < 1 − τ, that is, a good deal of the pollution tax is used for pro-ductive government spending, a cleaner technology may either raise orlower economic growth. It increases the balanced growth rate if the shareof public investment per GDP is larger than a constant that positively

Growth and Welfare Effects of Fiscal Policy 19
depends on the elasticity of aggregate output with respect to publiccapital and negatively on η, and vice versa.
Let us next study growth effects of varying the income tax rate. Thenext proposition demonstrates that a rise in that tax may have positiveor negative growth effects and that there exists a growth-maximizingincome tax rate.
Proposition 3 Assume that there exists an interior growth-maximizingincome tax rate. Then this tax rate is given by
τ = (1 − α) − αϕτp(1 − η)/(1 − ϕτp).
Proof: To calculate growth effects of varying τ we take the balancedgrowth rate g from (2.18) and differentiate it with respect to thatparameter. Doing so gives
∂g∂τ
= h−α(1 − τpϕ)
(1 − α((1 − τpϕ)τ + (1 − η)τpϕ)
1 − τpϕ
∂h∂τ
1h
),
where ∂h/∂τ is obtained by implicit differentiation from f (·) = 0leading to
∂h∂τ
= (1 − ϕτp)(1 + α h)hh(1 − τ)(1 − ϕτp)(1 − α)α + α((1 − τpϕ)τ + (1 − η)τpϕ)
.
Inserting ∂h/∂τ in ∂g/∂τ we get
∂g∂τ
= h−α(1 − τpϕ)
×(
1 − ((1 − τpϕ)τ + (1 − η)τpϕ)(1 + α h)h(1 − τ)(1 − ϕτp)(1 − α) + ((1 − τpϕ)τ + (1 − η)τpϕ)
),
showing that
∂g∂τ
> = < 0 ⇔ (1 − τ)(1 − ϕτp)(1 − α) > = < α((1 − τpϕ)τ + (1 − η)τpϕ).
Solving for τ gives
∂g∂τ
> = < 0 ⇔ τ <= > (1 − α) − αϕτp(1 − η)/(1 − ϕτp)
That shows that the balanced growth rate rises with increases in τ aslong as τ is smaller than the expression on the right-hand side, which isconstant. �
Proposition 3 shows that the growth-maximizing income tax ratedoes not necessarily equal zero in our model, which was to be expected

20 The Environment and Economic Growth
because the government finances productive public spending with thetax revenue. There are two effects going along with variations of theincome tax rate: on one hand, a higher income tax lowers the marginalproduct of private capital and, therefore, is a disincentive for investment.
On the other hand, the government finances productive public spend-ing with tax revenue, leading to a rise in the ratioH/K, which raises themarginal product of private capital r and has, as a consequence, a pos-itive effect on economic growth. However, boundary solutions, that is,τK = 0 or τK = 1, cannot be excluded. Whether there exists an interior ora boundary solution for the growth-maximizing capital income tax ratedepends on the numerical specification of the parameters ϕ, τp, and η.Only for ϕτp = 0 or η = 1 is the growth-maximizing tax rate always inthe interior of (0, 1) and equal to the elasticity of aggregate output withrespect to public capital.
Concerning the relation between the tax on pollution and the growth-maximizing income tax rate, we see that it negatively varies withthe latter if η < 1. For η > 1 the growth maximizing income tax rateis the higher the higher the tax on pollution τp. The interpretation ofthat result is as follows: if η < 1, the government uses a part of thepollution tax revenue for the creation of public capital, which haspositive growth effects. Increasing the tax on pollution implies that apart of the additional tax revenue is used for productive investmentin public capital. Consequently, the income tax rate can be reducedwithout having negative growth effects. It should be noticed that adecrease in the income tax rate shows an indirect positive growth effectbecause it implies a reallocation of private resources from consump-tion to investment. In contrast to that, if η > 1 the whole pollutiontax revenue is used for abatement activities. Raising the pollution taxrate in that situation implies that the additional tax revenue is usedonly for abatement activities but not for productive public spending.Consequently, the negative indirect growth effect of a higher pollutiontax (through decreasing the return on capital r) must be compensatedby an increase in the income tax rate. Note that the latter also hasa negative indirect growth effect but that one is dominated in thiscase by the positive direct growth effect of higher productive publicspending.
We next analyze long-run growth effects of a rise in the pollution taxrate. The result is summarized in the following proposition.
Proposition 4 For (1 − η − τ) ≤ 0, a rise in the pollution tax rate alwayslowers the balanced growth rate. If (1 − η − τ) > 0, the pollution tax ratemaximizing the balanced growth rate is determined by
τp =(
1ϕ
)(1 − η − τ − α(1 − η)
1 − η − τ
),

Growth and Welfare Effects of Fiscal Policy 21
which is equivalent to
IpY
= (1 − α)(1 − η).
Proof: To calculate growth effects of varying τp we take the balancedgrowth rate g again from (2.18) and differentiate it with respect to thatparameter. Doing so gives
∂g∂τp
= h−αϕ(1 − η − τ)
·
1 − (ϕτp(1 − η) + (1 − ϕτp)τ)[(1 − η − τ) + hα(1 − τ)]
(1 − η − τ)
[(ϕτp(1 − η) + (1 − ϕτp)τ)
+h(1 − τ)(1 − τpϕ)(1 − α)
].
From that expression, it can be seen that the expression in brackets isalways positive for (1−η−τ) < 0 such that ∂g/∂τp < 0. For (1−η−τ) = 0the result can directly be seen by multiplying out the expression above.For (1 − η − τ) > 0, it is seen that
∂g∂τp
> = < 0 ⇔ (1 − ϕτp)(1 − α)(1 − η − τ)
> = < α (ϕτp(1 − η) + (1 − ϕτp)τ),
which simplifies to
∂g∂τp
> = < 0 ⇔ τp < = >
(1ϕ
)(1 − η − τ − α(1 − η)
1 − η − τ
)
and is equivalent to
∂g∂τp
> = < 0 ⇔ IpY
< = > (1 − η)(1 − α).
Thus, the proposition is proved. �
The interpretation of that result is straightforward. An increasein the pollution tax rate always lowers the balanced growth rate if(1 − η − τ) ≤ 0. In that case, too much of the additional tax revenue(gained through the increase in τp) goes in abatement activities so thatthe positive growth effect of a higher pollution tax revenue (i.e., theincrease in the creation of the stock of public capital) is dominated bythe negative indirect effect of a reduction of the rate of return to phys-ical capital r. The latter effect namely implies a reallocation of private

22 The Environment and Economic Growth
resources from investment to consumption, which reduces economicgrowth. For (1 − η − τ) > 0, however, there exists a growth-maximizingpollution tax rate.1 In that case, the pollution tax has to be set such thatpublic investment per GDP equals the elasticity of aggregate outputwith respect to public capital multiplied with that share of the pollutiontax revenue not used for abatement activities but for productive publicspending.
Further, notice that the growth-maximizing value of τp2 is the higher
the lower the amount of pollution tax revenue used for abatementactivities. In the limit (η = 0) we get the same result as in the studyby Futagami et al. (1993) where the growth-maximizing share of pub-lic investment per GDP equals the elasticity of aggregate output withrespect to public capital.
Also note that the conditions for a positive growth effect of an increasein the pollution tax rate are just reverse to the conditions that must befulfilled such that the introduction of a less polluting technology raiseseconomic growth.
3.2 GROWTH EFFECTS ON THE TRANSITION PATH
In this section we study how the growth rates of consumption and publicand private capital react to a change in the income tax and pollution taxrate, taking into account transition dynamics. To do this we proceed asfollows. We assume that initially the economy is on the BGP when thegovernment changes the tax rates at time t = 0, and then we characterizethe transition path to the new BGP, which is attained in the long run.
First, we consider the effects of an increase in the income tax rate τ.To do this we state that the c = 0 and h = 0 isoclines are given by
c |c=0 = ρ + (1 − α)(1 − τ)(1 − τpϕ)h1−α, (3.1)
c |h=0 = h1−α(1 − τ)(1 − τpϕ) − h−α((1 − τpϕ)τ + (1 − η)τpϕ) . (3.2)
Calculating the derivative dc/dh, it can easily be seen that the h = 0isocline is steeper than the c = 0 isocline. Further, for the c = 0 isoclinewe have c = ρ for h = 0 and c → ∞ for h → ∞. For the h = 0 isoclinewe have c → −∞ for h → 0, c = 0 for h = ((1 − τpϕ)τ + (1 − η)τpϕ)/
((1 − τ)(1 − τpϕ)) and c → ∞ for h → ∞. This shows that there exists aunique (c�, h�) where the two isoclines intersect.
If the income tax rate is increased, it can immediately be seen that theh = 0 isocline shifts to the right and the c = 0 isocline turns right with
1 But it must kept in mind that 1 − τpϕ > 0 must hold so that a BGP exists. Therefore, theboundary condition τp = ϕ−1 − ε, ε > 0, cannot be excluded.2 Note that Ip/Y positively varies with τp for (1 − η − τ) > 0.

Growth and Welfare Effects of Fiscal Policy 23
E
E’
+–
+–
+ –
+ –
c
h
Figure 3.1 Effect of an increase in the income tax rate.
c = ρ for h = 0 remaining unchanged. This means that on both the newc = 0 and the new h = 0 isocline any given h goes along with a lowervalue of c compared to the isoclines before the tax rate increase. Thisimplies that the increase in the income tax rate raises the long-run valueh� and may reduce or raise the long-run value of c�. Further, the capitalstocks K and H are predetermined variables that are not affected by thetax rate increase at time t = 0. These variables react only gradually. Thisimplies that ∂h(t = 0, τ)/∂τ = 0. To reach the new steady state3 (c�, h�) thelevel of consumption adjusts and jumps to the stable manifold implying∂c(t = 0, τ)/∂τ < 0, as shown in figure 3.1.
Over time both c and h rise until the new BGP is reached at (c�, h�).That is, we get c/c = C/C − K/K > 0 and h/h = H/H − K/K > 0,implying that on the transition path the growth rates of consumptionand public capital are larger than that of private capital for all t ∈ [0, ∞).The impact of a rise in τ on the growth rate of private consumption isobtained from (2.16) as
∂
∂τ
(C(t = 0, τ)C(t = 0, τ)
)= −h1−αα(1 − τpϕ) < 0,
where again K and H are predetermined variables implying ∂h(t =0, τ)/∂τ = 0. This shows that at t = 0 the growth rate of private
3 The economy in steady state means the same as the economy on the BGP.

24 The Environment and Economic Growth
consumption reduces as a result of the increase in the income tax rate τ
and then rises gradually (since h rises) as the new BGP is approached.The same must hold for the private capital stock because we know fromthe foregoing that the growth rate of the private capital stock is smallerthan that of consumption on the transition path. The impact of a rise inτ on the growth rate of public capital is obtained from (2.18) as
∂
∂τ
(H(t = 0, τ)H(t = 0, τ)
)= h−α(1 − τpϕ) > 0,
where again hdose not change at t = 0. This result states that the growthrate of public capital rises and then declines over time (since h rises) asthe new BGP is approached. This result was to be expected because anincrease in the income tax rate at a certain point in time means that theinstantaneous tax revenue rises. Because a certain part of the additionaltax revenue is spent for public investment, the growth rate of publiccapital rises.
We summarize the results of our considerations in the followingproposition.
Proposition 5 Assume that the economy is on the BGP. Then a rise inthe income tax rate leads to a temporary decrease in the growth rates ofconsumption and private capital but a temporary increase in the growthrate of public capital. Further, on the transition path the growth ratesof public capital and consumption exceed the growth rate of privatecapital.
Next, we analyze the effects of a rise in the pollution tax rate τp. Todo so we proceed analogously to the case of the income tax rate. Doingthe analysis it turns out that we have to distinguish between two cases.If 1 − η − τ > 0 the results are equivalent to those we derived for anincrease in the income tax rate. If 1−η−τ < 0 two different scenarios arepossible.4 First, if the new h�, that is, h� after the increase in τp, is smallerthan −(1−η−τ)/(1−τ), the long-run values h� and c� decline. This holdsbecause the new h = 0 isocline lies above the old h = 0 isocline, that is,the isocline before the increase in τp, for h < −(1 −η− τ)/(1 − τ) and thec = 0 isocline turns right with c = ρ for h = 0 remaining unchanged.K and H are predetermined values, so the level of consumption mustdecrease and jump to the stable manifold, implying ∂c(t = 0, τ)/∂τ < 0to reach the new steady state (c�, h�). Figure 3.2 shows the phasediagram.
4 For 1 − η − τ = 0 the analysis is equivalent to that of a rise in the income tax rate withthe only difference that ∂(H(t = 0, τp)/H(t = 0, τp))/∂τp = 0 holds. Note that in this casethe balanced growth rate declines.

Growth and Welfare Effects of Fiscal Policy 25
h
c
E’
+
–
–+–
E
+–+
Figure 3.2 Effect of an increase in the pollution tax rate.
Over time both c and hdecline until the new BGP is reached at (c�, h�).That is, we get c/c = C/C− K/K < 0 and h/h = H/H− K/K < 0, imply-ing that on the transition path the growth rates of consumption andpublic capital are smaller than that of private capital for all t ∈ [0, ∞).The impact of a rise in τp on the growth rate of private consumption isobtained from (2.16) as
∂
∂τp
(C(t = 0, τp)C(t = 0, τp)
)= −h1−αα(1 − τ)ϕ < 0,
where again K and H are predetermined variables implying ∂h(t =0, τ)/∂τ = 0. This shows that at t = 0 the growth rate of private consump-tion falls as a result of the increase in the tax rate τp and then continuesto decline gradually (since h declines) as the new BGP is approached.The impact of a rise in τp on the growth rate of public capital is obtainedfrom (2.18) as
∂
∂τp
(H(t = 0, τp)H(t = 0, τp)
)= h−α(1 − η − τ)ϕ < 0, for 1 − η − τ < 0,
where again hdoes not change at t = 0. This result states that the growthrate of public capital declines and then rises over time (since h declines)

26 The Environment and Economic Growth
as the new BGP is approached. As with a rise of the income tax rate,a higher pollution tax rate implies an instantaneous increase of the taxrevenue. However, if η is relatively large, so that 1 − η − τ < 0, a largepart of the additional tax revenue is used for abatement activities so thatthe growth rate of public capital declines although the tax revenue rises.The growth rate of the private capital stock may rise or decline. Whatwe can say as to the the growth rate of the private capital stock on thetransition path is that it is always larger than those of consumption andof public capital.
Second, if the new h�, that is, h� after the increase in τp, is larger than−(1 − η − τ)/(1 − τ) the value for h� rises while c� may rise or fall. Thisholds because for h > −(1 − η − τ)/(1 − τ) the new h = 0 isocline liesbelow the old h = 0 isocline, that is, the isocline before the increase in τp.In this case, the phase diagram is the same as the one in figure 3.1 withthe exception that the h = 0 isoclines before and after the rise in the taxrate intersect at h = −(1−η−τ)/(1−τ). Another difference to the effectsof a rise in the income tax rate is that the growth rate of public capitalat t = 0 declines. The rest of the analysis is analogous to that of a rise inthe income tax rate. In particular, we have again c/c = C/C − K/K > 0and h/h = H/H − K/K > 0.
We can summarize our results in the following proposition.
Proposition 6 Assume that the economy is on the BGP. Then a rise in thepollution tax rate shows the same temporary effects concerning the growthrates of consumption, private capital, and public capital as a rise in theincome tax rate if 1 − η − τ > 0. If 1 − η − τ < 0, two situations arefeasible: first, h� declines and the temporary growth rates of consumptionand public capital decline while the growth rate of private capital may rise orfall. Further, the temporary growth rates of consumption and public capitalare smaller than that of private capital. Second, h� rises and the temporarygrowth rates of consumption, public capital, and private capital fall. Further,on the transition path the growth rates of public capital and of consumptionexceed the growth rate of private capital.
In the next section we analyze welfare effects of fiscal policy assumingthat the economy is on the BGP.
3.3 WELFARE EFFECTS OF FISCAL POLICY ON THE BGPAND THE SOCIAL OPTIMUM
3.3.1 Welfare Effects
In analyzing welfare effects, we confine our considerations to the modelon the BGP. That is we assume that the economy immediately jumps tothe new BGP after a change in fiscal parameters. In particular, we are

Growth and Welfare Effects of Fiscal Policy 27
interested in the question of whether growth and welfare maximizationare identical goals.
To derive the effects of fiscal policy on the BGP arising from increasesin tax rates at t = 0, we first compute (2.1) on the BGP as
W(·) ≡ arg maxC(t)
∫ ∞
0e−ρt(lnC(t) − lnPE(t))dt. (3.3)
Denoting again the balanced growth rate by g, (3.3) can be rewritten as
W(·) = ρ−1(
lnC0 + β g/ρ + β ln η + ln τp − (1 − β) ln ϕ
− (1 − β) lnKα0H
1−α0
), (3.4)
with C0 = C(0), K0 = K(0), and H0 = H(0). From (2.16) and (2.17) weget
g = α(1 − τ)(1 − τpϕ)h1−α − ρ and C0 = K0
((1 − τ)(1 − τpϕ)h1−α
0 − g)
.
Combining these two expressions leads to C0 = K0(ρ + g(1 − α))/α.Inserting C0 in (3.4) W can be written as
W(·) = ρ−1 (ln(ρ/α + g (1 − α)/α) + β g/ρ + ln τp + C1)
, (3.5)
with C1 a constant given by C1 = lnK0 + β ln η − (1 − β) ln ϕ − (1 −β) ln(Kα
0H1−α0 ). Equation(3.5) shows that welfare in the economy pos-
itively varies with the growth rate on the BGP, that is, the higher thegrowth rate the higher welfare. Differentiating (3.5) with respect to τ
and τp yields
∂W∂τ
= ∂ g∂ τ
(c0
1 − α
α · ρ+ β
ρ2
),
∂W∂τp
= 1τp ρ
+ ∂ g∂ τp
(c0
1 − α
α · ρ+ β
ρ2
).
(3.6)
With the expressions in (3.6) we can summarize our results in thefollowing proposition.
Proposition 7 Assume that the economy is in steady state and that thereexist interior growth-maximizing values for the income and pollution taxrates. Then the welfare-maximizing pollution tax rate is larger than thegrowth-maximizing rate and the welfare-maximizing income tax rate isequal to the growth-maximizing income tax rate.
Proof: The fact that the growth-maximizing income tax rate also maxi-mizes welfare follows immediately from (3.6). Because the pollution tax

28 The Environment and Economic Growth
rate τp maximizes the balanced growth we have ∂g/∂τp = 0. But (3.6)shows that for ∂g/∂τp = 0, ∂W/∂τp > 0 holds. Thus, the proposition isproved. �
Proposition 7 states that welfare maximization may be different fromgrowth maximization. If the government sets the income tax rate, it canbe assured that the rate maximizing economic growth also maximizeswelfare if one neglects transition dynamics. However, if the govern-ment chooses the pollution tax rate, it has to set the rate higher thanthat value maximizing the balanced growth rate to achieve maximumwelfare. The reason for this outcome is that the pollution tax rate exerts adirect positive welfare effect by reducing effective pollution, in contrastto the income tax rate. This is seen from (3.5), where the expression ln τpappears explicitly but τ does not.
The same also holds for variation of the parameter ϕ, which deter-mines the degree of pollution as a byproduct of aggregate production.If ϕ declines, meaning that production becomes cleaner, there is alwaysa positive partial and direct welfare effect going along with that effect.Again, this can be seen from (3.5), where ln ϕ appears. The overall effectof a decline in ϕ, that is, of the introduction of a cleaner technology, con-sists of this partial welfare effect and of changes in the balanced growthrate.
3.3.2 The Social Optimum
Next we compute the social optimum and study how the tax rates mustbe set so that the competitive economy replicates the social optimum. Todo so, we first formulate the optimization problem of the social planner.Taking into account that PE = ϕY/A holds the social planner solves
maxC,A,Ip
∫ ∞
0e−ρt (lnC + lnA− α lnK − (1 − α) lnH − ln ϕ
)dt,
subject to
K = KαH1−α − C − A− Ip , H = Ip and 0 ≤ Ip ≤ Ip < ∞.
The maximum principle yields C=A= λ−11 and λ1 = λ2, with λ1 the
costate variable or the shadow price of private capital and λ2 the shadowprice of public capital. These conditions state that at any moment in time,the level of consumption and the level of abatement must be equal. Thisis obvious because consumption and abatement have the same effectson the utility of the household, and K is linear in both C and A. Thelevel of public investment Ip has to be set such that the shadow priceof private capital and that of public capital are equal for all t ∈ [0, ∞).Since K and H are linear in Ip, there is a so-called bang-bang solution,

Growth and Welfare Effects of Fiscal Policy 29
that is, Ip = 0 must hold for λ1 < λ2 and Ip = Ip must hold for λ1 > λ2.In a way this can be seen as a no-arbitrage condition.
The shadow prices evolve according to
λ1 = ρλ1 − λ1αKα−1H1−α + α/K (3.7)
λ2 = ρλ2 − λ1(1 − α)KαH−α + (1 − α)/H (3.8)
Together with the conditions given by the maximum principle, theseconditions are also sufficient if the limiting transversality conditionlimt→∞ e−ρt(λ1K+λ2H) = 0 holds. Proposition 8 characterizes the socialoptimum and shows how the fiscal parameters τ, τp, and η must be setso that the competitive economy replicates the social optimum.
Proposition 8 Assume that the social optimum does not lead to sustainedgrowth. Then the competitive economy replicates the social optimum if τ,τp, and η are chosen such that
CK
=(
1 − α
α
)1−α((1 − τ)(1 − ϕτp) − 1
)+ 2ρ,
τ = ϕτp(η − 1)
1 − ϕτp, ϕτp = 1− ρ(1 − α)α−1
α(1 − τ)(3.9)
hold for all t ∈ [0, ∞). If the social optimum leads to ongoing growth, thecompetitive economy replicates the social optimum if τ, τp, and η are chosensuch that
η = ρ
(1 − α
α
)α 1ϕτp
+ τ
ϕτp− (1 − τ)((1 − ϕτp)α − ϕτp)
ϕτp
ρ
α=(
1 − α
α
)1−α
−(
1 − α
α
)1−α
(1 − τ)(1 − ϕτp)
CK
=(
1 − α
α
)1−α ((1 − τ)(1 − ϕτp) − α
)+ 2 ρ (3.10)
hold for all t ∈ [0, ∞). Further, the ratios of endogenous variables in thesocial optimum are given by
CK
= AK
= ρ
α,HK
= 1 − α
α,IpK
= (1 − α)
((1 − α
α
)1−α
− 2ρ
α
).
(3.11)
Proof: Using Ip = 0 and setting equal the growth rates of K in the socialoptimum and the competitive economy yields the first equation in (3.9).The second equation is obtained by setting equal the growth rates of C

30 The Environment and Economic Growth
in the social optimum and the competitive economy. The third equation,finally, is obtained from C/C = 0.
The first equation in (3.10) is obtained from setting H/K = (1 − α)/α
and then solving f (·) = 0 from the proof of proposition 8 with respectto η. The second equation in (3.10) is obtained by equating the growthrate of consumption in the competitive economy with that in the socialoptimum.
The second equation in (3.11) is obtained by setting λ1 = λ2 and usingC = 1/λ1. This relation holds for both the BGP and for all t ∈ [0, ∞). Thefirst and third equations are obtained by using H/K = (1 − α)/α and bysetting c/c = 0 and h/h = 0, with c = C/K and h = H/K. �
Proposition 8 shows that η > 1 must hold so that the competitiveeconomy can replicate the social optimum, in case the social optimumdoes not lead to ongoing growth. In this case, the model is the con-ventional neoclassical growth model with exogenous growth, which iswell known and therefore was not considered explicitly in the previoussection. The inequality η > 1 means that a certain part of the tax revenuemust be used for abatement besides the revenue gained from taxing pol-lution. If the social optimum generates sustained growth, (3.10) showshow the fiscal parameters have to set such that the competitive economyreplicates the social optimum.
The second equation in (3.11) states that the ratio of public to privatecapital equals the ratio of their elasticities in the social optimum. Thethird equation can also be written as Ip/K = (1 − α)(Y − C − A)/K,implying I/K = α(Y − C − A)/K, stating that the share of public toprivate investment is equal to the ratio of their elasticities with respectto output.

4
The Dynamics of the Model withStandard Preferences
In chapter 2 we presented and analyzed a growth model with envi-ronmental pollution and productive public capital. The analysis of thedynamics of the model demonstrated that it is characterized by local andglobal determinacy. However, we must also point out that this resultmay be due to the assumptions we made, especially concerning theutility function of the household.
Our goal in this chapter is to allow for a more general utility functionand then give a complete characterization of the dynamics of our modelas in Greiner (2007). We also intend to contribute to the literature on thedynamics of competitive economies with externalities.
Examples of such studies are the contributions by Benhabib andFarmer (1994) and by Benhabib et al. (2000). The difference of ourwork from these studies is twofold. First, we consider negative externaleffects of production, that is, pollution as a byproduct of produc-tion, in contrast to the aforementioned papers, which assume positiveexternalities associated with production or capital. Second, we donot assume that these externalities affect production in our econ-omy but instead have negative repercussions on the utility of thehousehold.
The structure of our economy is basically the same as in chapter 2,that is, we consider a decentralized economy consisting of three sec-tors: the household sector, a productive sector, and the government.Therefore, concerning the description of this model economy, we do notgo into details but only point out differences compared to the previouschapter.
The representative household again maximizes its discounted streamof utility subject to its budget constraint:
maxC(t)
∫ ∞
0e−ρtV(t)dt, (4.1)
with V(t) the instantaneous subutility function as in the last section,which depends positively on the level of consumption, C(t), and neg-atively on effective pollution, PE(t). However, in contrast to the lastchapter, we do not assume that the utility function is additively sep-arable in C(t) and PE(t). Concretely, V(t) now takes the following
31

32 The Environment and Economic Growth
form
V(t) = (C(t)PE(t)−ξ)1−σ/(1 − σ), (4.2)
where ξ > 0 gives the disutility arising from effective pollution. 1/σ > 0is the intertemporal elasticity of substitution of private consumptionbetween two points in time for a given level of effective pollution, andln is the natural logarithm.
Setting the income tax rate equal to zero, τ = 0, the budget constraintof the household is written as1
K = −C + wL+ rK. (4.3)
Assuming that a solution to (4.1) subject to (4.3) exists, we can use thecurrent-value Hamiltonian to describe that solution. The Hamiltonianfunction is written as
H(·) = (CP−ξ
E )1−σ/(1 − σ) + λ(−C + wL+ rK), (4.4)
with λ the costate variable. The necessary optimality conditions aregiven by
λ = C−σP−ξ(1−σ)
E , (4.5)
λ/λ = ρ − r, (4.6)
K = −C + wL+ rK. (4.7)
Because the Hamiltonian is concave in C and K jointly, the necessaryconditions are also sufficient if in addition the transversality conditionat infinity limt→∞ e−ρtλ(t)K(t) = 0 is fulfilled. Moreover, strict concavityin C also guarantees that the solution is unique.
The productive sector in our economy is equivalent to the one insection 2.2. In particular, the production function is given by,
Y = KαL1−αH1−α. (4.8)
Pollution is given by P = ϕY and taxed at the rate τp > 0. Firms takeinto account that one unit of output causes ϕ units of pollution for whichthey have to pay τpϕ < 1 per unit of output. Thus, the optimizationproblem of the firm is given by
maxK,L
KαL1−αH1−α(1 − ϕτp) − rK − wL. (4.9)
1 We again suppress the time argument if no ambiguity arises.

The Dynamics of the Model with Standard Preferences 33
Assuming competitive markets and taking public capital as given,optimality conditions for a profit maximum are obtained as
w = (1 − τpϕ)(1 − α)L−αKαH1−α, (4.10)
r = (1 − τpϕ)αKα−1H1−αL1−α. (4.11)
The government in our economy is now assumed to receive tax rev-enue only from the taxation of pollution. Positing that the governmentagain runs a balanced budget at any moment in time and setting theincome tax rate equal to zero, the budget constraint of the governmentis written as2
Ip + A = τpP ↔ Ip = τpP(1 − η). (4.12)
Abatement effects pollution in the same way as in 2.2, that is, PE = P/Aβ,and the evolution of public capital is described by
H = Ip, (4.13)
where for simplicity we again neglect depreciation of public capital.In the following, labor is normalized to one, L ≡ 1. An equilibrium
allocation in the economy, then, is given ifK(t) and L(t) maximize profitsof the firm, C(t) maximizes (4.1), and the budget of the government isbalanced.
Profit maximization of the firm implies that the marginal products ofcapital and labor equal the interest rate and the wage rate. This impliesthat in equilibrium the growth rate of physical capital is given by
KK
= −CK
+(HK
)1−α
(1 − ϕτp), K(0) = K0. (4.14)
Using the budget constraint of the government the growth rate of publiccapital is
HH
=(HK
)−α
ϕτp(1 − η), H(0) = H0. (4.15)
Utility maximization of the household yields the growth rate of con-sumption as
CC
= −ρ
σ+ σ−1(1 − ϕτp)α
(HK
)1−α
− ξ(1 −β)1 − σ
σ
(αKK
+ (1−α)HH
).
(4.16)
2 The budget constraint is the same as in Bovenberg and de Mooij (1997), except that theseauthors also impose a tax on output.

34 The Environment and Economic Growth
Equations (4.14), (4.15), and (4.16) completely describe the economy inequilibrium. The initial conditions K(0) = K0 and H(0) = H0 are givenand fixed, and C(0) can be chosen freely by the economy. Further, thetransversality condition limt→∞ e−ρtλ(t)K(t) = 0 must be fulfilled, withλ determined by (4.5).
Before we study the dynamics of the model, we recall the definitionof a balanced growth path given in definition 1. According to that def-inition, all variables grow at the same rate on a BGP, implying that theratios c ≡ C/K and h ≡ H/K are constant. Further, we defined a BGP assustainable if the growth of instantaneous utility, V, is strictly positive.
If the utility function is logarithmic inC and PE, we saw that any BGPis also sustainable. However, for the more general utility function (4.2),this does not necessarily hold. From V/V = (1 − σ)(C/C − ξPE/PE) =(1 − σ)(C/C − ξ(1 − β)Y/Y) we see that ξ(1 − β) < 1 is a necessary andsufficient condition for sustainability of the BGP.3 From an economicpoint of view, this means that a BGP is sustainable if abatement is veryeffective, that is, if β is high, or if effective pollution does not have astring impact on utility, that is, if ξ is small.
The differential equation system describing the dynamics around aBGP is now written as
cc
= −ρ
σ+ αh1−α(1 − ϕτp)
σ− (1 − α)ξ(1 − β)
1 − σ
σh−αϕτp(1 − η)
+(
1 + αξ(1 − β)1 − σ
σ
)(c− h1−α(1 − τpϕ)), (4.17)
hh
= c− h1−α(1 − ϕτp) + h−αϕτp(1 − η). (4.18)
Concerning a rest point of system (4.17) and (4.18), note that again weonly consider interior solutions. That means that we exclude the eco-nomically meaningless stationary point c = h = 0 such that we canconsider our system in the rates of growth.4 As to the existence andstability of a BGP, we can state the following proposition.
Proposition 9 If 1 + ξ(1 − β)(1 − σ)/σ ≥ 0 there exists a unique BGPthat is a saddle point.
Proof: To prove the proposition we first calculate c� on a BGP obtainedfrom h/h = 0 as
c� = h1−α(1 − ϕτp) − h−αϕτp(1 − η).
3 Note that (1 − σ) and V have the same sign so that (1 − σ)V > 0 holds.4 Note also that h is raised to a negative power in (4.17).

The Dynamics of the Model with Standard Preferences 35
Inserting c� in c/c gives
f (·) ≡ c/c = −ρ/σ + (1 − ϕτp)αh1−α/σ
− h−αϕτp(1 − η)(1 + ξ(1 − β)(1 − σ)/σ).
For (1 + ξ(1 − β)(1 − σ)/σ) ≥ 0 we have
limh→0
f (·) = −∞ and limh→∞
f (·) = ∞ and
∂f (·)/∂h = (1 − ϕτp)(1 − α)αh−α/σ + αh−α−1ϕτp(1 − η)
× (1 + ξ(1 − β)(1 − σ)/σ) > 0.
This shows that there exists a finite h� > 0 such that f (·) = 0 holds and,thus, a unique BGP.
Saddle point stability is shown as follows. Denoting with J theJacobian of c and h evaluated at the rest point, we first note that det J < 0is a necessary and sufficient condition for saddle point stability, that is,for one negative and one positive eigenvalue. The Jacobian in the modelcan be written as
J =[c�(1 + αξ(1 − β)(1 − σ)/σ) c�φ
h� h�υ
],
with φ given by φ = (1 − ϕτp)(1 − α)(h�)−α(−1 + α/σ) − (ξ(1 − β)
(1 − σ)/σ)(1 − α)α(h�)−α−1[(h�)(1 − ϕτp) − ϕτp(1 − η)] and υ = −α
(h�)−α−1ϕτp(1 − η) − (1 − α)(h�)−α(1 − ϕτp). c� and h� denote the val-ues of c and h on the BGP. The determinant can be calculated asdet J = c�h�(−α(1−α)(1−ϕτp)(h�)−α/σ)−α(h�)−α−1ϕτp(1−η)(1+ξ(1−β)
(1 − σ)/σ)) < 0, for (1 + ξ(1 − β)(1 − σ)/σ) ≥ 0. �
Proposition 9 gives conditions for the model to be locally and globallydeterminate, that is, for the existence of a unique value for c(0) such thatthe economy converges to the BGP in the long run.5
A prerequisite for that outcome is 1+ξ(1−β)(1−σ)/σ ≥ 0. For σ ≤ 1,one immediately sees that 1 + ξ(1 − β)(1 − σ)/σ ≥ 0 always holds. Forσ > 1, it can be stated that a unique BGP is more likely the larger β andthe smaller ξ for a given value of σ. From an economic point of view, thismeans that an effective abatement technology, that is, a large β, makesa unique BGP more likely.6 Furthermore, a small ξ also favors that out-come. A small ξ implies that the effect of pollution on instantaneous
5 For a definition of local and global determinacy, see Benhabib and Perli (1994) orBenhabib et al. (1994).6 For β = 1, the inequality is always fulfilled.

36 The Environment and Economic Growth
utility is small. Thus, we can summarize that the smaller the negativeexternal effect of production, either because abatement is very effectiveor because the household does not attach much value to a clean environ-ment, the less likely the emergence of global and local indeterminacy.So the externality gives rise to possible indeterminacy of equilibriumpaths.
The intertemporal elasticity of substitution, 1/σ, often plays an impor-tant role as to the question of whether the model is global indeterminate(see Benhabib and Perli 1994 or Benhabib et al. 1994). For our model, wesee from proposition 9 that σ > 1 is a necessary condition for multipleBGPs to be feasible. In other publications, a small value for σ, that is, ahigh intertemporal elasticity of substitution, is a necessary condition formultiple BGPs (see, for example, Benhabib and Perli 1994). The differentoutcome in our model compared to other contributions in the literatureis due to the fact that in our model utility does not only depend onconsumption but also on effective pollution, which is a byproduct ofaggregate production.
Therefore, the outcome stated in proposition 9 makes sense from aneconomic point of view: global indeterminacy means that the economymay either converge to the BGP with the high balanced growth rate orto the BGP with the low balanced growth rate in the long run. It mayeither choose a path with a higher initial consumption level (but lowerinitial investment) or a path with a lower level of initial consumption(but higher initial investment). In the latter case, the household must bewilling to forgo current consumption and shift it into the future. If pro-duction and thus consumption do not have negative effects in form ofpollution, then the household will do that only if it has a high intertem-poral elasticity of substitution of consumption. However, if production(and thus consumption) do have negative repercussions because theylead to a rise in effective pollution (ifβ < 1), then the household is willingto forgo current consumption even with a low intertemporal elastic-ity of substitution because renouncing consumption also has a positiveeffect because effective pollution is then lower, too, which raises currentutility.
Note that our result is in line with the outcome in Koskela et al.(2000) who find that indeterminacy and cycles occur for relatively smallvalues of the intertemporal elasticity substitution of consumption. Butit must be recalled that their model is quite different from ours becauseit considers a renewable resource and no externalities and is formulatedin discrete time.
Also note that we cannot give conditions for the analytical modelguaranteeing that c on the BGP, c�, is strictly positive on the BGP.From the proof of the proposition it becomes immediately clear thatthis can only be done when numerical values for the parameters are

The Dynamics of the Model with Standard Preferences 37
assumed. We do not do this but instead assume that c on a BGP ispositive.7
Next we consider the case 1 + ξ(1 − β)(1 − σ)/σ < 0. The nextproposition gives the dynamics in this case.
Proposition 10 If 1+ξ(1−β)(1−σ)/σ < 0, ρmust be sufficiently large forthe existence of two BGPs. The BGP yielding the lower growth rate is saddlepoint stable, and the BGP giving the higher growth rate is asymptoticallystable.
Proof: To prove the proposition we recall from the proof of proposition 9that a h� such that f (·) ≡ c/c = 0 holds gives a BGP.
For (1 + ξ(1 − β)(1 − σ)/σ) < 0 we have
limh→0
f (·) = ∞ and limh→∞
f (·) = ∞ and
∂f (·)/∂h > =< 0 ⇔ h >=< hmin and limh→0
∂f (·)/∂h = −∞,
limh→∞
∂f (·)/∂h = 0,
with hmin = (−1)αϕτp(1 − η)(1 − α)−1(1 + ξ(1 − β)(1 − σ)/σ)(1 − ϕτp)−1.
This implies that f (h, ·) is strictly monotonic decreasing for h < hmin,reaches a minimum for h = hmin, and is strictly monotonic increasingfor h > hmin. This implies that there exist two BGPs (two points of inter-section with the horizontal axis) if f (h, ·) crosses the horizontal axis. Thisis guaranteed if f (hmin, ·) < 0 holds. Inserting hmin in f (·) gives
f (hmin, ·) = −ρ/σ − h−αminϕτp(1 − η) (1 + ξ(1 − β)(1 − σ)/σ)
× (1 + α/(1 − α)).
A sufficient condition for f (hmin, ·) < 0 is a large ρ.To analyze stability, we note that the determinant of the Jacobian can
be written as det J = −c�h�∂f (·)/∂h. This shows that the first intersectionpoint of f (·) with the horizontal axis (smaller h� and thus larger balancedgrowth rate, see [4.15]) cannot be a saddle point because ∂f (·)/∂h < 0holds at this point. This point is asymptotically stable (only negativeeigenvalues or eigenvalues with negative real parts) if the trace is neg-ative, i.e. if tr J < 0 holds. The trace of the Jacobian can be calculatedas tr J = −const. + c�α(1 + ξ(1 − β)(1 − σ)/σ), which is negative for(1 + ξ(1 − β)(1 − σ)/σ) < 0.
7 What can be said is that h on the BGP, h�, must be larger than ϕτp(1 − η)/(1 − ϕτp) for c�
to be positive.

38 The Environment and Economic Growth
The second intersection point of f (·) with the horizontal axis (lowerh� and thus higher balanced growth rate, see [4.15]) is a saddle pointbecause ∂f (·)/∂h > 0 holds at this point, implying det J < 0. �
Proposition 10 states that two BGPs can be observed in our modeldepending on parameter values. In this case, the model is both glob-ally and locally indeterminate. However, neither of the two BGPs aresustainable. This holds because for 1 + ξ(1 − β)(1 − σ)/σ < 0, σ mustbe larger than 1. σ > 1 implies that ξ(1 − β) > 1 must hold so that theinequality 1 + ξ(1 − β)(1 − σ)/σ < 0 ↔ ξ(1 − β)(σ − 1)/σ > 1 can be ful-filled. But ξ(1 −β) > 1 implies that the BGP is not sustainable. Thus, theeconomy grows over time, but the growth rate of instantaneous utilityis negative.

5
Pollution as a Stock
In the last chapter we assumed that pollution as a flow variable affectsthe utility of the household. In this chapter, we study our model econ-omy assuming that production leads to emissions that build up a stockof pollution that negatively affects utility. We focus on the question ofwhether ongoing growth is feasible with a constant or even decliningstock of pollution, and we derive both growth effects in the long rundepending on the different scenarios.
First we describe the structure of the decentralized model economywhere we start with the behavior of the economic agents. Basically,the structure of the economy is equivalent to that of the last chapter.Nevertheless, for the sake of readability, we briefly repeat it here.
5.1 THE HOUSEHOLD SECTOR
Again, our economy is represented by one household. The goal of thishousehold is to maximize a discounted stream of utility arising fromconsumption C(t) over an infinite time horizon subject to its budgetconstraint. As to the utility function, we use the function introduced inchapter 4:
maxC(t)
∫ ∞
0e−ρtVdt, where V = C1−σX−ξ(1−σ)
1 − σ, (5.1)
with 1/σ > 0 the intertemporal elasticity of substitution of consumptionbetween two points in time and ξ > 0 giving the disutility of addi-tional pollution. For σ = 1 the utility function is logarithmic.1 X givescumulated pollution, and ρ is again the rate of time preference.
The budget constraint is given by
K = (w+ rK)(1 − τ) − C, (5.2)
with τ the income tax rate. The wage rate is denoted by w. The laborsupply L is constant, supplied inelastically, and we normalize L ≡ 1.r gives the return to per capita capital K. The budget constraint (5.2)states that the individual has to decide how much to consume and how
1 We do not consider the case σ = 1 in this chapter.
39

40 The Environment and Economic Growth
much to save, thus increasing consumption possibilities in the future.The depreciation of physical capital is again assumed to equal zero.
To derive necessary conditions, we formulate the Hamiltonian func-tion as H(·) = C1−σX−ξ(1−σ)/(1 − σ) + λ(−C + (w + rK)(1 − τ)),with λ the costate variable. The necessary optimality conditions aregiven by
λ = C−σX−ξ(1−σ), (5.3)
λ/λ = ρ − r(1 − τ), (5.4)
K = −C + (w+ rK)(1 − τ). (5.5)
Because the Hamiltonian is concave in C and K jointly, the necessaryconditions are also sufficient if in addition the transversality conditionat infinity limt→∞ e−ρtλ(t)K(t) ≥ 0 is fulfilled.
5.2 THE PRODUCTIVE SECTOR AND THE STOCKOF POLLUTION
The productive sector in our economy is represented by one firm thatchooses inputs to maximize profits and behaves competitively. Concern-ing pollution or emissions, P(t), we suppose as in the last chapter that itis a byproduct of aggregate production Y(t). In particular, we again setP(t) = ϕY(t), with ϕ = const. > 0.
The stock of pollution X, which affects utility of the household,evolves over time according to the following differential equation (seeBrock and Taylor 2004)
X = P − A− δxX, 0 < δx, (5.6)
where A gives abatement that reduces pollution and δx gives the expo-nential rate at which the environment dissipates pollution. Further,we posit that X≥ 0 holds with X= 0, giving the pristine state of theenvironment.
Emissions are taxed at the rate τp > 0 and the firm takes into accountthat one unit of output causes ϕ units of emissions for which it hasto pay τpϕ per unit of output. The per capita production function isgiven by,
Y = KαH1−αL1−α ≡ KαH1−α, (5.7)
with H denoting the stock of productive public capital and α ∈ (0, 1)
gives the per capita capital share. Recall thatK denotes per capita capitaland that L is normalized to one.

Pollution as a Stock 41
Assuming competitive markets and taking public capital as given,the first-order conditions for a profit maximum are obtained as
w = (1 − τpϕ)(1 − α)KαH1−α, (5.8)
r = (1 − τpϕ)αKα−1H1−α. (5.9)
5.3 THE GOVERNMENT
The government in our economy uses resources for abatement activitiesA, which reduce the stock of pollution. Abatement activities A ≥ 0 arefinanced by the tax revenue coming from the tax on emissions, that is,A = ητpE, with 0 < η. This means that η determines that part of theemission tax revenue used for abatement. Consequently, 1 − η givesthat part of the revenue used for public investment in the public capitalstock Ip, Ip ≥ 0. For η > 1, a certain part of the tax revenue resultingfrom the income taxation is used for abatement in addition to the taxrevenue gained by taxing emissions.
The government in this economy runs a balanced budget at anymoment in time. Thus, the budget constraint of the government iswritten as
Ip = τpE(1 − η) + τ(w+ rK). (5.10)
The evolution of public capital is described by
H = Ip, (5.11)
where for simplicity we again assume that there is no depreciation ofpublic capital.
5.4 EQUILIBRIUM CONDITIONS AND THE BALANCEDGROWTH PATH
Before we define a balanced growth path we define an equilibrium.
Definition 2 An equilibrium is a sequence of variables {C(t),K(t),H(t),X(t)}∞t=0 such that given a sequence of prices {w(t), r(t)}∞t=0, the firmmaximizes profits, the household solves (5.1) subject to (5.2), and the budgetconstraint of the government (5.10) is fulfilled.
Thus, in equilibrium the dynamics of the model are completelydescribed by the following differential equation system:
CC
= −ρ
σ+ α(1 − τ)(1 − ϕτp)
σ
(HK
)1−α
+ ξ
(1 − σ
σ
)δx
− ξ
(1 − σ
σ
)ϕ
(HK
)1−α (KX
)(1 − ητp), (5.12)

42 The Environment and Economic Growth
KK
= −CK
+(HK
)1−α
(1 − τ)(1 − ϕτp), K(0) > 0, (5.13)
HH
=(HK
)−α (ϕτp (1 − η) + τ(1 − ϕτp)
), H(0) > 0, (5.14)
XX
= ϕ
(HK
)1−α (KX
)(1 − ητp) − δx, X(0) > 0. (5.15)
The initial conditions K(0),H(0), andX(0) are given and fixed, and C(0)
can be chosen freely by the economy. It should also be noted that weassume X(0) > 0, meaning that the environment initially is polluted.
In the following we examine our model concerning existence andstability of a balanced growth path (BGP). To do so, we define a BGP inthis chapter as follows.
Definition 3 Abalancedgrowthpath (BGP) is a path such that the economyis in equilibrium and such that consumption, private capital, and pub-lic capital grow at the same strictly positive constant growth rate, that is,C/C = K/K = H/H = g, g > 0, g = constant, and either
(i) X = 0 or(ii) X/X = −δx or(iii) X/X = C/C = K/K = H/H = g.
This definition shows that on a BGP the growth rates of consump-tion, private capital, and public capital are positive and constant overtime. Concerning the state of the environment, we consider three differ-ent scenarios. Scenario i describes a situation where the environmentalquality is constant over time. Scenario ii describes an economy withan improving environment, and scenario iii finally gives an economywhere the state of the environment deteriorates over time. Note that inscenarios i and ii the ratioX/K asymptotically converges to zero becausecumulated pollution,X, is constant or declines in these scenarios, respec-tively, while K rises. In scenario iii, X/K is constant because X grows atthe same rate as K in that scenario.
It should be pointed out that scenarios i and scenario ii can certainlybe considered as reflecting a sustainable BGP because the environment isconstant or even improves. This does not necessarily hold for scenarioiii, where the environment deteriorates at the same rate as economicvariables grow. If one adopts the definition of sustainability as given byByrne (1997) and presented in the last chapter, scenario iii could alsobe sustainable. This holds because according to that definition, a BGPis said to be sustainable if instantaneous utility grows over time, thatis, if V > 0 holds. Depending on the parameters in the model this mayhold for our economy. However, most contributions in the literature

Pollution as a Stock 43
define a sustainable BGP as a path on which the quality of the environ-ment is constant. In any case, we also consider scenario iii because itmay serve as an approximation to real-world economies, which growover time, which goes along with a deterioration of the environmentalquality.
To analyze the model further, we first perform a change of variables.Defining c = C/K, h = H/K, and x = X/K and differentiating thesevariables with respect to time gives c/c = C/C−K/K, h/h = H/H−K/K,and x/x = X/X− K/K. A rest point of this new system then correspondsto a BGP of our original model economy. The system describing thedynamics around a BGP is given by
c = c(c− ρ
σ+ α(1 − ϕτp)(1 − τ)
σh1−α − (1 − τ)(1 − ϕτp)h1−α
)
+ c
(ξ
(1 − σ
σ
)δx − ξ
(1 − σ
σ
)ϕ
(HK
)1−α
(1 − ητp)x−1
), (5.16)
h = h(c+ h−α
(ϕτp (1 − η) + τ(1 − ϕτp)
)− (1 − τ)(1 − ϕτp)h1−α)
,
(5.17)
x = x(c+ ϕh1−αx−1(1 − ητp) − δx − (1 − τ)(1 − ϕτp)h1−α
). (5.18)
Concerning a rest point of system (5.16)–(5.18), note that we only con-sider interior solutions with respect to c and h, that is, we exclude theeconomically meaningless stationary point c� = h� = 0.
Before we continue and present results as concerns the dynam-ics of our economy, we note that scenario i is modeled by settingη = (ϕ − δxxhα−1)/(τpϕ), which gives X = 0 for all t ∈ [0, ∞). Scenarioii is obtained by setting η = 1/τp, which yields X/X = −δx for allt ∈ [0, ∞).
5.5 THE DYNAMICS OF THE MODEL
In this section we analyze the dynamics of the model economy. Thus,we study the question of whether a BGP exists, whether it is unique,and whether it is stable. As to the uniqueness and stability of a BGP forscenario i and for scenario ii we can state the following proposition.
Proposition 11 Assume that (ϕ − τ)/ϕ(1 − τ) < τp < 1/ϕ holds. Thenthere exists a unique saddle point stable balanced growth path for scenario iand for scenario ii.
Proof: To prove this proposition, we solve c/c = 0 with respect to cleading to c = ρ/σ − h1−αα(1 − τ)(1 − τpϕ)/σ + (1 − τ)(1 − τpϕ)h1−α +

44 The Environment and Economic Growth
ξ(1 − σ)ϕh1−α(1 − ητp)x−1/σ − ξδx(1 − σ)/σ. Inserting the expression inh gives for scenario i,
h = h(ρ/σ + h−α(ϕ(τp − 1) + τ(1 − ϕτp)
)− (1 − τ)(1 − ϕτp)αh1−α/σ),
where we used η = (1/τp)−δxxhα−1/(τpϕ) and x = 0, for t → ∞, becauseon the BGP K grows faster than X in scenarios i and ii. An h� such thath = 0 gives a BGP for our model. For scenario ii we get
h = h(ρ/σ + h−α(ϕ(τp − 1) + τ(1 − ϕτp)
)− (1 − τ)(1 − ϕτp)αh1−α/σ − ξ (1 − σ) δx/σ),
where we used η = 1/τp and x = 0, for t → ∞. It is easily seen thatlimh→0 h/h = +∞, for τp > (ϕ − τ)/ϕ(1 − τ), and limh→∞ h/h = −∞, forτp < 1/ϕ. Further, given these assumptions, ∂(h/h)/∂h < 0 holds so thatthe existence of a unique BGP is shown.
To show saddle point stability, we compute the Jacobian matrix forscenarios, i and ii, which is given by
J =c� ∂c/∂h 0h� ∂h/∂h 00 0 X/X − K/K
,
where we used x� = 0. Because X is constant in scenario i and declinesin scenario ii while K/K is strictly positive on the BGP, we get the firsteigenvalue of this matrix as µ1 = X/X − K/K < 0. Further, it is eas-ily seen that for scenarios i and ii, c�(∂h/∂h) − h�(∂c/∂h) < 0 holds sothat the second eigenvalue is negative, too, and the third eigenvalue ispositive. �
The assumption (ϕ − τ)/ϕ(1 − τ) < τp is equivalent to ϕτp (1 − η) +τ(1 − ϕτp) > 0 in scenarios i and ii and is needed for H/H > 0. It sim-ply states that public investment must be positive for sustained growth,which is obvious because productive public spending is the source ofongoing growth in this model. Note that (ϕ − τ)/ϕ(1 − τ) < 1/ϕ impliesϕ < 1. This means that scenarios i and ii are only feasible if an addi-tional unit of output leads to less than one additional unit of pollution.Loosely speaking, this means that the technology in use must not betoo polluting. This is intuitively plausible because it is difficult to havea constant or even improving quality of the environment with ongoinggrowth if production leads to a strong degradation of the environment.If production is very polluting, that is, ϕ ≥ 1, a constant quality of theenvironment can be achieved only without sustained growth.
Given the assumptions, proposition 11 shows that there exists aunique saddle point stable BGP for our model economy for scenarios

Pollution as a Stock 45
i and ii. It should be mentioned that saddle point stability means thattwo eigenvalues of the Jacobian matrix are negative and one is positive.This implies that there exists a unique value for initial consumptionC(0)
lying on the stable manifold of the rest point of (5.16)–(5.18). From aneconomic point of view, this result tells us that both global and local inde-terminacy cannot arise in this economy with a constant or improvingenvironment, that is, for scenarios i and ii.
For scenario iii, the situation is more complex. Chapter 4 has alreadyshown there may be more than one BGP. Proposition 12 gives the exactoutcome.
Proposition 12 Assume that ϕτp < 1 and ϕτp (1 − η) + τ(1 − ϕτp) > 0hold in scenario iii. Then there exists a unique balanced growth path for1/σ > (ξ − 1)/ξ. For 1/σ < (ξ − 1)/ξ, there exist either two BGPs orno BGP.
Proof: To prove this proposition we set h/h = 0, giving c − (1 − τ)
(1 − τpϕ) = −h−α(ϕτp(1 − η) + τ(1 − ϕτp)). Inserting this in x/x = 0leads to ϕh1−α(1 − ητp)x−1 = δx + h−α(ϕτp(1 − η) + τ(1 − ϕτp)). Usingthese relationships we get for c/c,
c/c = −ρ/σ + (1 − τ)(1 − τpϕ)αh1−α/σ − h−α(ϕτp(1 − η)
+ τ(1 − ϕτp))(1 + ξ(1 − σ)/σ).
For 1 + ξ(1 − σ)/σ > 0 ↔ 1/σ > (ξ − 1)/ξ, we get
limh→0
(c/c) = −∞, limh→∞
(c/c) = +∞ and ∂(c/c)/∂h > 0,
where ϕτp < 1 and ϕτp (1 − η) + τ(1 − ϕτp) > 0 must hold. This showsthat there exists a unique BGP for 1/σ > (ξ − 1)/ξ.
If 1 + ξ(1 − σ)/σ < 0 ↔ 1/σ < (ξ − 1)/ξ holds we get
limh→0
(c/c) = +∞ and limh→∞
(c/c) = +∞
and
∂(c/c)∂h
= α(1 − α)h−α(1 − τ)(1 − τpϕ)/σ + αh−α−1
× (ϕτp(1 − η) + τ(1 − ϕτp))(1 + ξ
(1 − σ
σ
),
with ∂(c/c)/∂h → −∞ (0), for h → 0 (∞). For h < (>)h1 the deriva-tive is negative (positive), with h1 = −(ϕτp(1 − η) + τ(1 − ϕτp))(1 + ξ
(1 − σ)/σ)/((1 − α)(1 − τ)(1 − τpϕ)/σ) > 0. Furthermore, there existsa unique inflection point of the function c/c, h2, given by h2 =

46 The Environment and Economic Growth
(1 + α)h1/α > h1. This shows that, for 1/σ < (ξ − 1)/ξ, there are eithertwo points of intersection of c/c with the horizontal axis, and thus twoBGPs or none.2 �
Proposition 12 demonstrates that the BGP is unique if the intertem-poral elasticity of substitution is larger than one minus the inverse ofthe parameter determining the (dis)utility of additional pollution, thatis, for 1/σ > (ξ − 1)/ξ. From a qualitative point of view, this result isthe same as in chapter 4, where a low intertemporal elasticity of sub-stitution was a necessary condition for multiple BGPs, too. Note alsothat for a small effect of additional pollution on utility, that is, for ξ ≤ 1,uniqueness of the BGP is always given, independent of the intertempo-ral elasticity of substitution. Thus we can state that global indeterminacycan only arise when the effect of pollution on utility is strong.
Concerning the dynamics around the BGP, this question is more dif-ficult to answer. Proposition 13 gives insight into the local dynamicsaround a BGP for scenario iii.
Proposition 13 Assume that there exists a unique BGP for scenario iii.Then the BGP is either saddle point stable or unstable. Assume that thereexist two BGPs. Then the BGP yielding the lower growth rate is either saddlepoint stable or unstable, whereas the BGP yielding the higher growth rateis asymptotically stable or unstable.
Proof: To prove this theorem, we compute the Jacobian matrix, which isobtained as
J = c� ∂c/∂h c�(x�)−2(h�)1−αϕξ(1 − σ)(1 − ητp)/σ
h� ∂h/∂h 0x� ∂x/∂h −ϕ(h�)1−α(1 − ητp)
.
The sign of the determinant of the Jacobian is equivalent to the signof αh−α−1(ϕτp(1 − η) + τ(1 − ϕτp))(1 + ξ(1 − σ)/σ) + α(1 − α)h−α(1 − τ)
(1− τpϕ)/σ. If the BGP is unique, we have (1+ ξ(1−σ)/σ) > 0, implyingthat det J > 0 holds.
Denoting by µj, j = 1, 2, 3, the jth eigenvalue of the Jacobian, we knowthat µ1 · µ2 · µ3 = det J. Therefore, a positive determinant implies thatthere are either two negative eigenvalues (or two complex conjugateeigenvalues with negative real parts) or three positive eigenvalues (orone positive eigenvalue and two complex conjugate eigenvalues withpositive real parts).
2 We neglect the case where c/c is tangent to the horizontal axis, which has Lebesquemeasure zero.

Pollution as a Stock 47
If there are two BGPs, the BGP associated with the smaller h� yieldsthe higher growth rate and vice versa. From the proof of proposition 12we know that c/c first intersects the horizontal axis from above andthen from below. So at the first intersection point we have ∂(c/c)/∂h < 0,and at the second we have ∂(c/c)/∂h > 0. Because ∂(c/c)/∂h =α(1 − α)h−α(1 − τ)(1 − τpϕ)/σ + αh−α−1(ϕτp(1 − η) + τ(1 − ϕτp))(1 +ξ(1 − σ/σ), we know that det J < 0 at the smaller h� and det J > 0 at thehigher h�. Thus, the BGP yielding the higher growth rate has either threenegative eigenvalues (or one negative eigenvalue and two complex con-jugate eigenvalues with negative real parts) or two positive eigenvalues(or two complex conjugate eigenvalues with positive real parts) andone negative. If det J > 0 we have the same situation as for the case of aunique BGP. �
Proposition 13 demonstrates that for scenario iii the dynamics maybe more complex. For this scenario, the economy may be characterizedby both global and local indeterminacy. We do not pursue this questionfurther because it was extensively studied in the last chapter. In thenext section we compare the different scenarios concerning the long-rungrowth rate.
5.6 EFFECTS OF THE DIFFERENT SCENARIOS ON THEBALANCED GROWTH RATE
In this section we study the question of which scenario generates ahigher balanced growth rate. To do so we take scenario i, where envi-ronmental quality is constant over time, as a benchmark. Proposition 14compares scenario i with scenario ii, which is characterized by animproving environmental quality.
Proposition 14 For 1/σ > (<) 1 scenario i is characterized by a lower(higher) balanced growth rate than scenario ii.
Proof: To prove this proposition, we note from the proof of proposition 11that a BGP in scenario i is given for a h� such that
h = h(ρ/σ + h−α(ϕ(τp − 1) + τ(1 − ϕτp)
)− (1 − τ)(1 − ϕτp)αh1−α/σ) = 0
holds.A BGP in scenario ii is given for an h� such that
h = h(ρ/σ + h−α(ϕ(τp − 1) + τ(1 − ϕτp)
)− (1 − τ)(1 − ϕτp)αh1−α/σ)
− ξδx(1 − σ)/σ = 0
holds.

48 The Environment and Economic Growth
This shows that the graph of h in scenario i is above (below) the graphof h in scenario ii for 1/σ > (<)1, implying that scenario i gives a higher(lower) value h�. The balanced growth rate is given by equation (5.14).Because of x� = 0, η = 1/τp holds both in scenarios i and ii on the BGP,leading to the result in proposition 14. �
Proposition 14 states that for a relatively high intertemporal elasticityof substitution, that is, for 1/σ > 1, the scenario in which environmentalquality improves, scenario ii, yields a higher balanced growth rate thanthe scenario where the environmental quality is constant, scenario i.This holds because for an intertemporal elasticity of substitution largerthan one, the marginal utility of consumption is higher the smaller thestock of pollution is, that is, the better the environmental quality, andvice versa. This is seen by computing the cross derivative of the utilityfunction which is given by
∂2V∂C∂X
= −ξ(1 − σ)C−σX−ξ(1−σ)−1 > (<) 0 ↔ 1/σ < (>) 1 . (5.19)
Because in scenario ii the environmental quality is better than inscenario i, because the level of X declines in scenario ii while it is con-stant in scenario i, the household forgoes more consumption today andshifts it into the future in scenario ii compared to scenario i. Therefore,scenario ii implies a higher balanced growth rate for 1/σ > 1.
Equation (5.19) suggests that consumption and a clean environment,that is, a small value of pollution, are complementary for 1/σ > 1because, in this case, marginal utility of consumption rises with a declinein the level of pollution. This means that marginal utility of consumptionis higher the cleaner the environment is. For 1/σ < 1, consumption andpollution can be considered substitutes because the marginal (dis)utilityof additional pollution declines with a rising level of consumption. Thus,one could interpret proposition 14 such that scenario i leads to lowergrowth than scenario ii if consumption is complementary to a cleanenvironment. If the household considers consumption as a substitute forthe negative effect of pollution, scenario i generates a higher balancedgrowth rate than scenario ii.
Comparing scenario i with scenario iii, the analysis is more complex.Proposition 15 gives results as concerns the ratio of public capital toprivate capital on the BGP in these scenarios as well as concerning thelong-run growth rate.
Proposition 15 A necessary condition for scenario i to be associated with ahigher h� than scenario iii is 1/σ < 1. A sufficient condition for scenario i tobe associated with a lower h� than scenario iii is 1/σ > 1. Further, 1/σ > 1is a necessary condition for scenario i to generate a higher balanced growthrate than scenario iii.

Pollution as a Stock 49
Proof: To prove this proposition we note from the proof of proposition 11that an h� such that
h/h = ρ/σ − (1 − τ)(1 − ϕτp)αh1−α/σ
+ h−α(ϕτp(1 − τ−1
p ) + τ(1 − ϕτp))
= 0
gives a BGP for scenario i.From the proof of proposition 12 we know that an h� such that
−c/c = ρ/σ − (1 − τ)(1 − τpϕ)αh1−α/σ + h−α(ϕτp(1 − η)
+τ(1 − ϕτp))(1 + ξ(1 − σ)/σ) = 0
gives a BGP for scenario iii.Further, we know that in scenario iii, η < 1/τp holds on the BGP.
Setting η = (1/τp) − ε, with ε > 0, we can write −c/c as
−c/c = ρ/σ + h−α(ϕτp(1 − τ−1
p ) + τ(1 − ϕτp))
(1 + ξ(1 − σ)/σ)
+ h−αϕ τp ε (1 + ξ(1 − σ)/σ) − (1 − τ)(1 − τpϕ)αh1−α/σ .
This shows that 1/σ > (<) 1 is a sufficient (necessary) condition forthe graph of h/h to lie above (below) the graph of −c/c so that h� inscenario i is lower (higher) compared to scenario iii.
To derive growth effects, we first note that the balanced growth ratefor scenario i, g(i), and for scenario iii, g(iii), are obtained from (5.14) as
g(i) = (h�(i))
−α(ϕτp(1 − τ−1
p ) + τ(1 − ϕτp))
,
g(iii) = (h�(iii))
−α(ϕτp(1 − τ−1
p ) + τ(1 − ϕτp))
+ (h�(iii))
−αϕ τp ε.
This shows that h�(i) > (<) h�
(iii) is sufficient (necessary) for a higher(lower) balanced growth rate in scenario iii compared to scenario i. Thusproposition 15 is proved. �
This proposition states that a high intertemporal elasticity of sub-stitution is a necessary condition such that the balanced growth ratein scenario i, where environmental quality is constant, exceeds thegrowth rate of scenario iii, in which the state of the environmentdegrades over time. The mechanism behind this result is the same as inproposition 14. Thus, only with a large intertemporal elasticity of substi-tution, the household may be willing to forgo more consumption todayand shift it into the future in scenario i compared to scenario iii, becausethe marginal utility of consumption rises with a cleaner environmentwhen the intertemporal elasticity of substitution is larger than one.

50 The Environment and Economic Growth
Proposition 15 also shows that scenario i can never lead to a higherbalanced growth rate than scenario iii if the ratio of public to privatecapital on the BGP in scenario iii is lower than in scenario i. Thus, fora small intertemporal elasticity of substitution, that is, for 1/σ < 1, it isto be expected that scenario iii leads to higher long-run growth because1/σ < 1 is a necessary condition for a lower h� in scenario iii comparedto scenario i.
An additional result can be derived concerning the balanced growthrates in scenario iii and scenario i, depending on the number of BGPsin scenario iii. This holds because the number of BGPs in scenario iiidepends on the relation between the intertemporal elasticity of substi-tution and the parameter giving the (dis)utility of pollution. This is thecontents of the following corollary to proposition 15.
Corollary 1 Assume that there exist two BGPs in scenario iii. Thenscenario i yields a lower balanced growth rate than scenario iii.
Proof: To prove this corollary, we recall from proposition 12 that theexistence of two BGPs in scenario iii implies 1/σ < (ξ − 1)/ξ ↔ 1 +ξ(1−σ)/σ < 0. The proof of proposition 15 shows that the latter inequal-ity is sufficient for h� in scenario i to be larger than in scenario iiiso that the long-run growth rate in scenario iii is larger than that inscenario i. �
When there exist two BGPs for scenario iii, the intertemporal elasticityof substitution of consumption is smaller than one minus the inverse ofthe parameter giving the (dis)utility of additional pollution. Then, thebalanced growth rate in scenario iii goes along with a smaller value ofpublic capital relative to private capital, h�, compared to scenario i sothat the growth rate in scenario i is smaller than that of scenario iii. Itshould be noted that this holds for both BGPs in scenario iii. Thus, for asufficiently small intertemporal elasticity of consumption, the balancedgrowth rates in the scenario with a declining environmental qualityexceed both the balanced growth rate of the scenario with a constantenvironmental quality.
It should also be pointed out that 1/σ < 1−1/ξ is a sufficient conditionfor the balanced growth rates in scenario iii to exceed that of scenario i.Thus, corollary 1 gives a sufficient condition while the condition formu-lated in proposition 15, with respect to the intertemporal elasticity ofsubstitution, is only necessary.

6
Concluding Remarks
In this part we presented an endogenous growth model with publiccapital and pollution. The main novelty of this approach compared tothe literature on environmental pollution and endogenous growth is theassumption that pollution only affects the utility of the household andnot production possibilities directly.
Analyzing our model, we derived the effects of fiscal policy on thelong-run balanced growth rate. We demonstrated that variations in boththe income tax rate and the pollution tax rate may have positive or neg-ative growth effects. This holds because on one hand, the governmentfinances productive public spending, which tends to raise economicgrowth, by the tax revenue, whereas, on the other hand, higher taxesreduce economic growth. Furthermore, we derived conditions that mustbe fulfilled so that an increase in these tax rates leads to a higher bal-anced growth rate. In particular, we could derive growth-maximizingvalues of tax rates without resorting to numerical simulations. Roughlyspeaking, a higher pollution tax rate can lead to higher growth only if thegovernment spends a large part of its revenues for productive purposes.
In addition, we studied the effects of a rise in the income and pollutiontax rate on the growth rates of consumption, private capital, and publiccapital on the transition path, and we have seen that the transition effectsof fiscal policy may differ from the long-run effects.
We could also demonstrate that growth maximization and welfaremaximization need not be equivalent goals on the balanced growthpath. In particular, it turned out that the welfare-maximizing val-ues of parameters are different from the growth-maximizing values ifthe parameters have a direct impact on effective pollution and, thus,on utility. For example, a pollution tax rate that exceeds its growth-maximizing value can generate higher welfare. Thus, lower growth andless environmental pollution can imply higher welfare compared to a sit-uation characterized by high-output growth and more pollution. Thisseems to be of particular relevance for fast growing countries in Asiafor example.
Finally, we derived the social optimum and showed how the gov-ernment has to set fiscal parameters so that the competitive economyreplicates the social optimum. Among other things, it was demonstratedthat a certain part of the income tax revenue has to be spent for abatementbesides the tax revenue gained from taxing pollution.
51

52 The Environment and Economic Growth
As to the dynamics of our growth model, we could demonstrate(again without resorting to numerical examples) that the model is bothlocally and globally determinate if the utility function is logarithmicin consumption. For the case of an isoelastic utility function, we couldshow that the parameters determining the negative effect of pollution onutility are crucial to the question of whether indeterminate equilibriumpaths may exist. In general, it turned out that the stronger the exter-nal effect, the more likely are multiple balanced growth paths. Thus,environmental pollution can lead to indeterminacy.
In an extension of the model, we assumed that environmental pol-lution as a stock negatively affects utility of the household. In thisvariation we considered three different scenarios: first, we studied thescenario where the stock of pollution is constant; second, we analyzedthe scenario with an improving environmental quality; and finally, westudied the scenario in which environmental pollution grows at the samepositive rate as all other endogenous variables.
The analysis of this extension has demonstrated that the model ischaracterized by a unique saddle point stable balanced growth pathfor the scenarios with a constant or improving environmental quality.However, it also turned out that the latter scenarios are compatible withsustained economic growth only if the production technology in use isnot too polluting. The model with the scenario where all endogenousvariables grow at the same rate in the long run may also reveal a morecomplex dynamic outcome, just as in the previous chapter. Thus, bothlocal and global indeterminacy may occur again.
Concerning the balanced growth rate, the analysis of the extendedmodel has revealed that the intertemporal elasticity of substitution ofconsumption must be high such that the scenarios with a smaller stock ofpollution are associated with a higher balanced growth rate. The reasonfor this outcome is that the household is more willing to forgo consump-tion and shift it into the future in scenarios with a cleaner environment,if the marginal utility of consumption in the future is higher, which isthe only case if the intertemporal elasticity of substitution is relativelylarge.

PART IIGlobal Warming andEconomic Growth

This page intentionally left blank

7
Introduction and Overview
Another environmental problem, which has global dimensions, is globalwarming. The emission of greenhouse gases (GHGs), like carbon diox-ide (CO2) or methane (CH4), has drastically increased in the twentiethcentury and continues to rise, leading to higher concentrations of GHGsin the atmosphere. Higher GHG concentrations can generate a rise inthe average global surface temperature and may make extreme weatherevents more likely.
According to the Intergovernmental Panel on Climate Change (IPCC2001, 2007), it is certain that the global average surface temperature of theEarth has increased since 1861. The global average surface temperaturehas risen by 0.6 ± 0.2 ◦C over the twentieth century. It is very likely1
that the 1990s was the warmest decade and 1998 the warmest year since1861 (IPCC 2001, p. 26) and the warming of the Earth continues. Inaddition, it is likely that statistically significant increases in heavy andextreme weather events have occurred in many mid- and high-latitudeareas, primarily in the Northern Hemisphere.2
Changes in climate occur as a result of both internal variability withinthe climate system and external factors where the latter can be natural oranthropogenic. However, natural factors have made small contributionsto the climate change observed over the past century. Instead, thereis strong evidence that most of the warming observed over the pastfifty years is the result of human activities.3 Especially the emission of6HGs are considered the cause for climate changes, and these emissionscontinue to alter the atmosphere in ways that are expected to affect theclimate.
In the economics literature, numerous studies analyze the impactof environmental degradation on economic growth using endoge-nous growth models, as already mentioned in part I. These studiesare rather simplified because they intend to derive general qualita-tive results showing the effects governmental measures can have. Itis assumed that economic activities lead to environmental degrada-tion and, as a consequence, reduce utility and production possibilities.The goal of these studies often is to analyze how public policy affects
1 Very likely (likely) means that the level of confidence is between 90–99 (66–90) percent.2 More climate changes are documented in IPCC (2001, 2007), p. 34.3 For details on the role of human activities for global warming, see Stern (2006, 2007).
55

56 Global Warming and Economic Growth
environmental conditions as well as the growth rate and welfare ofeconomies. An example for such a model was presented in part 1.
However, studies that incorporate climate models in endogenousgrowth models and then study the effects of different time paths of GHGemissions on the growth rate of economies are less common. Instead,economic studies dealing with global warming are mostly cost-benefitanalysis, which take the growth rate of economies as an exogenous vari-able. These studies then compute the discounted cost of reducing GHGemissions and confront them with the discounted benefit of a lowerincrease in GHG concentration and, as a consequence, a smaller increasein average global surface temperature. Thus, different environmentalpolicies are evaluated.
Typically, the effect of global warming is modeled mostly using inte-grated assessment models. These are computable general equilibriummodels in which stylized climatic interrelations are taken into accountby a climate subsystem incorporated in the model. Examples for thistype of models are CETA (see Peck and Teisberg 1992), FUND (see Tol1999), RICE and DICE (see Nordhaus and Boyer 2000 and Nordhaus2007b), WIAGEM (see Kemfert 2001), or DART (see Deke et al. 2001).Other examples for cost-benefit analyses are the contributions by Hackland Pruckner (2003) and Tol (2001, 2003).4 The goal of these studies,then, is to evaluate different abatement scenarios as to economic wel-fare and their effects on GHG emissions.5 In analyzing implicationsof climate policies, these models often assume that the growth rate ofthe economy is exogenously given, and feedback effects of lower GHGconcentrations in the atmosphere on economic growth are frequentlyneglected. For example, in Nordhaus and Boyer (2000) different abate-ment scenarios are analyzed where the growth rate of the economy isassumed to be an exogenous variable and the results are compared withthe social optimum. In this study it is shown, among other results, thatin all scenarios carbon taxes rise over time.
Another approach is taken by Uzawa (2003) who constructs a the-oretical framework in which three major problems concerning globalenvironmental issues are addressed. First, all aspects involved withglobal environmental issues exhibit externalities. Another aspect is thatglobal warming involves international and intergenerational equity andjustice. Finally, the problem of global warming concerns the manage-ment of the atmosphere, the oceans, and other natural resources thathave to be decided by a consensus of all affected economies.
4 We do not go into the details of these studies. The interested reader is referred to theIPCC report (1996) for the structure of such models.5 However, the results partly are very sensitive with respect to the assumptions made.See, for example, Popp (2003), who shows that the outcome in Nordhaus and Boyer (2000)changes when technical change is taken into account.

Introduction and Overview 57
A great problem in studying the economic consequences of globalwarming is the uncertainty as to the damages caused by a change ofthe Earth’s climate. Nevertheless, this is done. For example, the IPCCestimates that a doubling of CO2, which goes along with an increaseof global average surface temperature between 1.5 and 4.5 ◦C reducesworld GDP by 1.5 to 2 percent (see IPCC 1996, p. 218). This damage isobtained for the economy in steady state and comprises both market andnonmarket impacts, where nonmarket impacts are direct reductions ofpeople’s welfare resulting from a climate change. But of course it must berepeated that there is great uncertainty in social cost estimates, especiallyconcerning the direct impact of climate changes on individuals’ welfare.
In this part, we study the interaction between global warming andeconomic growth. The model we use is basically in the line of the DICE94framework presented by Nordhaus (1994, 2007b). The major extensionof the framework consists in allowing for endogenous growth, imply-ing that environmental policy does not only affect the level of economicvariables but also the long-run growth rate. Because an important styl-ized fact of market economies is that sustained per capita growth can beobserved without a tendency for declining growth rates, it seems neces-sary to incorporate that aspect in a model dealing with climate changeand evaluate climate policies within this framework. Thus, we want tobring together models of endogenous growth and models dealing withchanges in the climate on Earth.
First, we integrate a simple climate model in a descriptive modelof endogenous growth to analyze the effects of GHG emissions andabatement policies on economic growth. We study a descriptive growthmodel because in a first step we want to focus on the interrelationbetween global warming, production activities, and economic growthleaving aside preferences. As far as the forces of growth that lead tosustained growth, we assume in chapter 9 that there are positive exter-nalities of investment in physical capital that generate ongoing growth.Within this model we define the balanced growth path, which will bebasically the same throughout this part, and we present some numer-ical examples to get an idea of how the economy reacts to differentenvironmental policies.
In chapter 10 we present theAK endogenous growth model and com-pute the second-best abatement share as well as the socially optimalvalue for the investment share and the abatement share assuming a log-arithmic utility function. The analysis in chapter 10 takes as a startingpoint the world as one homogeneous region and does not distinguishbetween different regions with different levels of emissions and differentdamages caused by global warming.
This shortcoming is taken into account in section 10.3, where differ-ent regions are assumed that differ with respect to their contributionsto GHG emissions as well as the damages they suffer from a rise in

58 Global Warming and Economic Growth
temperature. This section, then, studies the situation for both the non-cooperative and cooperative cases. Further, the section analyzes thesituation when the environmental instrument is set such that marginaldamages are the same for all regions.
An economy where both the household sector and the productivesector optimize is presented in chapter 11. As to the forces of economicgrowth, we again adopt the approach with positive externalities ofinvestment (see Greiner et al. 2005). This chapter analyzes the com-petitive economy and the social optimum and derives those values offiscal parameters that make the competitive economy replicate the socialoptimum.
There is another important research direction, undertaken by sci-entists, that studies the impact of GHG emissions on climate changethrough the change of ocean circulations. The papers by Deutsch et al.(2002) and Keller et al. (2000), for example, describe how the Gulf Streamand the North Atlantic current, part of the North Atlantic thermohalinecirculation (THC), transport a large amount of heat from warm regionsto Europe. As those publications show, due to the heating of surfacewater, the currents could suddenly change and trigger a swift changein temperature. The THC collapse and the sudden cooling of regionswould most likely have a strong economic impact on Europe and Africa.An event like this would have an impact on the climate in these regionsand would also affect economic growth. Further results on THC mecha-nisms are given in Broecker (1997). In our modeling of the interaction ofeconomic growth and climate change in 11.3, we leave aside this possibleevent, although it might exacerbate some of the results.
The overall goal of section 11.3 is different from the cited studies.Our primary goal is not to evaluate different abatement policies as totheir welfare effects nor modeling exacerbating events for global warm-ing. We want to study, in the context of a simple endogenous growthmodel, the long-run effects of the interaction of global warming and eco-nomic growth, in particular the transitions dynamics that might occurwith global warming. More specifically, we want to study the questionof whether there possibly exist multiple equilibria and thresholds thatseparate basins of attraction for optimal paths to some long-run steadystate. To study such a problem, we take the basic endogenous growthmodel from this chapter as the starting point and integrate a simplenonlinear feedback effect.
We also want to point out some limitations of the model. We donot intend to use an elaborate large-scale macro model describing theprocess of global warming. Instead, we confine our analysis to a basicenergy balance model (EBM) that allows for feedback effects. As to thosefeedback effects we posit that the albedo of the Earth is affected byincreases in GHGs. Other possible feedback effects, such as a change inthe flux ratio (see chapter 8) for example, are neglected. We are aware

Introduction and Overview 59
that this limits the relevance of our model in a way. However, the qual-itative outcome and the message of this book remain the same with oursimplified specification.
Further, we also point out that we pursue an approach that assumesthat losses due to temperature increases can be expressed in terms ofGDP. This implies that the environment does not have an intrinsic valuefor humankind or that the loss can be substituted by consuming anadditional amount of goods. This approach may be seen as problematicbecause the possible value of an unpolluted environment in the futuremay not yet be known. Furthermore, destroying large parts of the envi-ronment and species without even knowing of their existence may beextremely costly because its potential can never be exploited.
Taking these arguments seriously would require a different approachwhere the destruction of the environment equals its regenerative capac-ity so that the constancy of the environmental quality is a constraintthat has to be fulfilled in solving an economic problem, like welfaremaximization, for example. For the problem of global warming, thiswould mean that the GHG concentration remains at its preindustriallevel, which is not a realistic assumption. So allowing for a frame-work where the GHGs exceed their preindustrial level seems to be moreappropriate. Nevertheless, the problem of estimating future costs goingalong with environmental damages, whether caused by global warmingor by other human activities, is difficult and should be addressed withcare. More details concerning the problem of estimating costs associatedwith global warming are given in Azar and Schneider (2003), Gerlaghand Papyrakis (2003), and Weitzman (2007a,b). The latter in particulardiscusses the role of the discount rate in evaluating the cost of futuredamages.

8
Facts on GHG Emissions andthe Change in AverageGlobal Surface Temperature
Before we present the economic framework, we begin with a descriptionof scientific knowledge concerning GHG emissions and the change inglobal average surface temperature. The simplest method of consideringthe climate system of the Earth is in terms of its global energy balancewhich is done by so-called energy balance models (EBM). Accordingto an EBM, the change in the average surface temperature on Earth isdescribed by1
dT(t)dt
ch ≡ T(t) ch = SE −H(t) − FN(t), T(0) = T0, (8.1)
with T(t) the average global surface temperature measured in Kelvin(K),2 ch the heat capacity3 of the Earth with dimension J m−2 K−1 (Joulesper square meter per Kelvin),4 which is considered a constant parameter,SE is the solar input, H(t) is the nonradiative energy flow, and FN(t) =F ↑ (t) − F ↓ (t) is the difference between the outgoing radiative fluxand the incoming radiative flux. SE,H(t), and FN(t) have the dimensionWatts per square meter (Wm−2). t is the time argument, which will beomitted in the following as long as no ambiguity can arise. F ↑ followsStefan-Boltzmann-Gesetz, which is
F↑ = ε σT T4, (8.2)
with ε the emissivity that gives the ratio of actual emission to blackbodyemission. Blackbodies are objects that emit the maximum amount ofradiation and have ε = 1. For the Earth, ε can be set to ε = 0.95. σT is theStefan-Boltzmann constant, which is given by σT = 5.67 10−8Wm−2K−4.
1 This part follows Roedel (2001) chapter 10.2.1 and chapter 1. See also Henderson Sellersand McGuffie (1987) and Gassmann (1992). A more complex presentation can be found inHarvey (2000).2 273 Kelvin equals 0 ◦C.3 The heat capacity is the amount of heat that needs to be added per square meter ofhorizontal area to raise the surface temperature of the reservoir by 1K.4 1 Watt is 1 Joule per second.
60

Facts on GHG Emissions and Change in Global Surface Temperature 61
Further, the ratio F↑/F↓ is given by F↑/F↓ = 109/88. The differenceSE−H can be written as SE−H = Q(1−α1)α2/4, withQ = 1367.5Wm−2
the solar constant, α1 = 0.3 the planetary albedo, determining howmuch of the incoming energy is reflected by the atmosphere, and α2(α2 = 0.3) captures the fact that a part of the energy is absorbed by thesurface of the Earth.
Summarizing this discussion, the EBM can be rewritten as
T(t) ch = 1367.54
0.21 − 0.95(
5.67 10−8)
(21/109) T4, T(0) = T0. (8.3)
In equilibrium, that is, for T = 0, (8.3) gives a surface temperature ofabout 288.4K which is about 15.4◦C. ch is the heat capacity of the Earth.Because most of the Earth’s surface is covered by sea water, ch is largelydetermined by the oceans. Therefore, the heat capacity of the oceans isused as a proxy for that of the Earth. ch is then given by ch = ρw cw d 0.7,with ρw the density of sea water (1027m−3 kg), cw the specific heat ofwater (4186 J kg−1 K−1), and d the depth of the mixed layer, which isset to 70 m. The constant 0.7 results from the fact that 70 percent ofthe Earth is covered with sea water. Inserting the numerical values,assuming a depth of 70 m and dividing by the surface of the Earth givesch = 0.1497 J m−2 K−1.
The effect of emitting GHGs is to raise the concentration of them inthe atmosphere, which increases the greenhouse effect of the Earth. Thisis done by calculating the so-called radiative forcing, which is a measureof the influence a GHG, like CO2 or CH4, has on changing the balanceof incoming and outgoing energy in the Earth-atmosphere system. Thedimension of the radiative forcing is Wm−2. For example, for CO2 theradiative forcing, which we denote as F, is given by
F = 6.3 lnMMo
, (8.4)
with M the actual CO2 concentration, Mo the preindustrial CO2 con-centration, and ln the natural logarithm (see IPCC 1990, p. 52–53).5 Forother GHGs, other formulas can be given describing their respectiveradiative forcing, and these values can be converted in CO2 equivalents.Incorporating (8.4) in (8.3) gives
T(t) ch = 1367.54
0.21 − 0.95(
5.67 10−8)
(21/109)T4
+ β1 (1 − ξ) 6.3 lnMMo
, T(0) = T0. (8.5)
5 The CO2 concentration is given in parts per million (ppm).

62 Global Warming and Economic Growth
Table 8.1 Important Parameters Used in the EBM.
Parameter Meaning Adopted Value Unit
ch Heat capacity 0.1497 Jm−2K−1
σT Stefan-Boltzmann constant 5.67 10−8 Wm−2K−1
Q Solar constant 1367.5 Wm−2
ξ Part of temperature rise absorbedby oceans
0.23 percentage
β1 Feedback effect 1.1 percentage
β2 Emissions absorbed by oceans 0.49 percentage
µ Inverse of atmospheric lifetime ofGHG
0.1 percentage
β1 is a feedback factor that captures the fact that a higher GHG con-centration affects, for example, atmospheric water vapor, which haseffects for the surface temperature on Earth. β1 is assumed to take val-ues between 1.1 and 3.4. The parameter ξ, finally, captures the fact thatξ = 0.3 of the warmth generated by the greenhouse effect is absorbedby the oceans, which transport the heat from upper layers to the deepsea. Setting β1 = 1.1 and assuming a doubling of GHGs implies that inequilibrium the average surface temperature rises from 15.4 to 18.7 ◦C,implying a rise of about 3.3 degrees. This is in the range of IPCC esti-mates,6 which yield increases between 1.5 and 4.5◦C as a consequenceof doubling GHG concentration (IPCC 2001, p. 67).
The concentration of GHGs M evolves according to the followingdifferential equation
M = β2E− µM,M(0) = M0. (8.6)
E denotes emissions and µ is the inverse of the atmospheric lifetimeof GHGs. As to the parameter µ, we assume a value of µ = 0.1.7 β2captures the fact that a certain part of GHG emissions are taken up byoceans and do not enter the atmosphere. According to IPCC, β2 = 0.49for the time period 1990 to 1999 for CO2 emissions (IPCC 2001, p. 39).
Table 8.1 gives a survey of the parameters used in our energy balancemodel.
6 IPCC results are obtained with more sophisticated atmosphere-ocean general circulationmodels.7 The range of µ for CO2 given by IPCC is µ ∈ (0.005, 0.2), see IPCC (2001), p. 38.

9
A Descriptive Model ofEndogenous Growth
9.1 STRUCTURE OF THE MODEL
We start with the description of our growth model. We assume thataggregate production takes place according to the following aggregateproduction function (see Greiner 2004a)
Y(t) = AK(t)α(H(t)L(t))1−αD(T(t) − To), (9.1)
with Y(t) aggregate production, A a positive constant, H(t) humancapital or a stock of knowledge formed as a byproduct of aggregateinvestment, and L(t) labor input. K is aggregate physical capital, α ∈(0, 1) is the capital share, and t gives time. D(T(t) − To) is the damagefunction giving the damage resulting from deviations of actual tem-perature from preindustrial temperature, To. It should be mentionedthat the assumption of a continuous damage function is only justifiedprovided the temperature increase does not exceed a certain threshold.This holds because for higher increases of the temperature, catastrophicevents may occur, along with extremely high economic costs that can-not be evaluated. Just one example is the breakdown of the Gulf Stream,which would dramatically change the climate in Europe. Therefore, theanalysis assuming a damage function only makes sense for temperatureincreases within certain bounds.
Per capita production is obtained by dividing both sides of (9.1)by L as
Y = AKαH1−αD(·). (9.2)
The income identity in per capita variables in the economy is given by
Y − X = I + C + B, (9.3)
with X= τY, τ ∈ (0, 1), the (per capita) tax revenue, I investment, C con-sumption, and B abatement activities. This means that national incomeafter tax is used for investment, consumption, and abatement. As forabatement activities, we assume that this variable is expressed as ratio
63

64 Global Warming and Economic Growth
to total tax revenue X,
B = τbX = τbτY, (9.4)
with τb ∈ (0, 1) the ratio of abatement spending to the tax revenue.As for the damage function D(T − To), we assume that it is C2 and
satisfies
D(T − To){= 1, for T = To< 1, for T �= To,
(9.5)
with derivative
∂D(·)∂ T
≡ D′(·){> 0, for T < To< 0, for T > To.
(9.6)
The per capita capital accumulation function is given by
K = AKαH1−αD(·)(1 − τ) − C − B− (δ + n)K
= AKαH1−αD(·)(1 − τ(1 + τb) − c(1 − τ)) − (δ + n)K, (9.7)
with n ∈ (0, 1) the growth rate of labor input and δ ∈ (0, 1) is the depreci-ation rate of physical capital. Further, we express consumption as ratioto GDP after tax, that is, C = c Y(1− τ), c ∈ (0, 1). It should be noted thatfor K > 0 the parameters must be such that τ(1 + τb) + c(1 − τ) ∈ (0, 1)
holds.As mentioned, we assume that gross investment in physical capital is
associated with positive externalities that build up a stock of knowledgecapital that positively affects labor productivity. Knowledge per capitaevolves according to
H = ϕ I − (η + n)H = ϕ(AKαH1−αD(·)(1 − τ) − C − B) − (η + n)H
= ϕ(AKαH1−αD(·)(1 − τ(1 + τb) − c(1 − τ))) − (η + n)H, (9.8)
with ϕ > 0 a coefficient determining the external effect associated withinvestment and η ∈ (0, 1) depreciation of knowledge.
It should also be mentioned that our formulation implies that gov-ernment spending except for abatement does not affect productionpossibilities. Concerning emissions of GHGs, we assume that these area byproduct of production and expressed in CO2 equivalents. So emis-sions are a function of per capita output relative to per capita abatementactivities. This implies that a higher production goes along with higheremissions for a given level of abatement spending. This assumption isfrequently encountered in environmental economics (see, e.g., Smulders1995). It should also be mentioned that the emission of GHGs does not

A Descriptive Model of Endogenous Growth 65
affect production directly but only indirectly by affecting the climateof the Earth, which leads to a higher surface temperature and to moreextreme weather situations. Formally, emissions are described by
E =(a YB
)γ
, (9.9)
with γ > 0 and a> 0 constants. The parameter a can be interpreted asa technology index describing how polluting a given technology is.For large values of a, a given production (and abatement) goes alongwith high emissions, implying a relatively polluting technology andvice versa.
The economy is completely described by equations (9.7), (9.8), (8.5),and (8.6), with emissions given by (9.9).
9.2 THE BALANCED GROWTH PATH
The balanced growth path is defined in this chapter as follows1
Definition 4 A balanced growth path (BGP) is a path such that T = 0,M = 0, and K/K = H/H hold, with M ≥ Mo.
This definition contains several aspects. First, we require that thetemperature and the GHG concentration must be constant along a BGP.This is a sustainability aspect. Second, the growth rate of per capitacapital equals that of per capita knowledge and is constant. Note thatthis implies that the growth rates of per capita GDP and per capita con-sumption are constant, too, and equal to that of capital and knowledge.Third, we only consider BGPs with a GHG concentration larger than orequal to the preindustrial level. This requirement is made for reasonsof realism. Because GHG concentration has been rising monotonicallyover the past decades, it is not necessary to consider a situation withdeclining GHG concentration. The next proposition shows that thereexists a unique BGP for this economy.
Proposition 16 For the model economy, there exists a unique BGP that isasymptotically stable.
Proof : First, we define k = K/H, giving k/k = K/K − H/H.2 To showuniqueness of the steady state we solve k/k = 0, (8.5) = 0, and (8.6) = 0
1 In the following, steady state is used equivalently to balanced growth path.2 Since k is raised to a negative power in (9.7)/K, k = 0 is not feasible and we thereforeconsider the equation k/k in the rate of growth.

66 Global Warming and Economic Growth
with respect to k, T, and M. Setting (8.5) = 0 gives
T1,2 = ±99.0775 (71.7935 + 4.851 ln(M/Mo))1/4
T3,4 = ±99.0775√−1 (71.7935 + 4.851 ln(M/Mo))
1/4.
Clearly T3,4 are not feasible. Further, becauseM ≥ Mo, only the positivesolution of T1,2 is feasible. Uniqueness of M is immediately seen. Theequation k/k is given by
f (k, ·) ≡ kk
= Akα−1D(·)(1 − ϕk)((1 − τ)(1 − c) − ττb) − (δ − η),
with ∂f (k, ·)/∂k < 0 and limk→0 f (k, ·) = +∞ and limk→∞ f (k, ·) = −∞for a given T. This shows that there exists a unique k that solves k/k = 0.
To study the local dynamics, we calculate the Jacobian matrix Jcorresponding to this dynamic system, which is obtained as
J=∂k/∂k D′(·)A(k�)α(1− ϕk�)((1 − τ)(1 − c)− ττb) 0
0 −(79.8(5.67 10−8) (T�)3)/(109ch) 4.851/(chM�)
0 0 −µ
,
with � denoting steady-state values and the parameter values as insection 9.3. The eigenvalues of J are given by
e1 = −µ, e2 = −(79.8(
5.67 10−8)
(T�)3)/(109ch) and e3 = ∂k/∂k.
Because ∂f (k, ·)/∂k < 0, ∂k/∂k < 0 also holds. Thus, the proposition isproved. �
This proposition shows that any solution starting in the vicinity ofthe BGP will converge to this path in the long run. The balanced growthrate of the economy is given by (9.7)/K as
g ≡ A(k�)α−1D(·)((1 − τ)(1 − c) − ττb) − (δ + n), (9.10)
with k� the value of k on the BGP, where k is defined as k≡K/H. How-ever, it cannot be excluded that the BGP goes along with a negativegrowth rate because the sign of the balanced growth rate depends on theconcrete numerical values of the parameters. The question of whetherthere exists a BGP with a positive growth rate for a certain parameterconstellation is addressed in the next section. In this section we makethe assumption that a non-degenerate BGP exists and analytically studygrowth effects of varying the tax rate and abatement spending.

A Descriptive Model of Endogenous Growth 67
In the next step we analyze how the balanced growth rate reacts tochanges in the income tax rate τ and to different values of the ratio τb.To do so we differentiate g with respect to τ. This gives
∂g∂τ
= AD(·)(k�)α−1(−1)(1 − c+ τb)
+ (α − 1)(k�)α−2 ∂k∂τAD(·)((1 − τ)(1 − c) − ττb)
+D′(·)∂T∂τ
(k�)α−1A((1 − τ)(1 − c) − ττb) >< 0 (9.11)
From (8.5) and (8.6) it is easily seen that ∂k�/∂τ < 0 and ∂T�/∂τ < 0,forT > To. To see this one uses thatT� positively depends onM�, which,for its part, negatively depends on τ. The latter is seen by calculatingM� from M = 0 and using (9.9). ∂k�/∂τ < 0 is obtained from implicitlydifferentiating k/k = K/K − H/H.
The second inequality in (9.11) results from the fact that in our modelan increase in the tax revenue raises abatement activities since weassume a fixed ratio of abatement activities to tax revenue. The firstinequality states that a rise in the tax rate reduces the ratio of physi-cal to human capital. This shows that an increase in the tax rate hasboth positive and negative partial growth effects. On the one hand, ahigher tax rate reduces investment because more resources are spent forabatement.
On the other hand, a higher tax rate reduces the increase in averageglobal surface temperature and, as a consequence the damage resultingfrom an increase in T. This raises aggregate production which has apositive growth effect. Further, it should be mentioned that the decreasein K/H = k has also a positive growth effect since a lower ratio ofphysical to human capital goes along with higher growth. This meansthat economies with small physical capital stocks and high stocks ofknowledge are likely to show large growth rates. This, for example, wasthe case for Germany and Japan after the Second World War. So theanalytical model does not answer the question of whether a higher taxrate reduces or increases the long-run balanced growth rate.
Next, we analyze the effects of an increase in abatement activitiesimplying a higher value of τb. The derivative of g with respect to τb isgiven by
∂g∂τb
= AD(·)(k�)α−1(−τ)
+ AD(·)(α − 1)(k�)α−2 ∂k∂τb
((1 − τ)(1 − c) − ττb)
+ AD′(·) ∂T∂τb
(k�)α−1((1 − τ)(1 − c) − ττb) >< 0. (9.12)

68 Global Warming and Economic Growth
As for the tax rate, we see that higher abatement activities may raiseor lower economic growth. The reason is as above. On the one hand,more abatement activities reduce investment spending; on the otherhand, higher abatement activities have positive indirect growth effectsby reducing the temperature increase, and thus the damage, and byreducing the value k = K/H.
To get further insights, we undertake simulations in the next section.
9.3 NUMERICAL EXAMPLES
We consider one time period to comprise one year. The populationgrowth rate is assumed to be n = 0.02 and the depreciation rate ofcapital is δ = 0.075. The preindustrial level of GHGs is normalized toone, i.e. Mo = 1. We do this because M denotes all types of greenhousegases (e.g. such as CO2 and CH4) so that we cannot insert the specificconcentration of a certain type of greenhouse gas, say CO2 or CH4.Further, we are interested in the change of GHG concentration relativeto the pre-industrial level. Further, we set γ = 0.9 which is motivatedby an OECD study which runs regressions with emissions per capita asthe dependent variable which is explained among others by GDP percapita and which obtains a value of about 0.9 (see OECD, 1995). β1 andξ are set to β1 = 1.1 and ξ = 0.3 (see chapter 8). c = 0.8 and the tax shareis set to τ = 0.2 which is about equal to the tax share in Germany in 1996(see Sachverständigenrat, 2001). The capital share is α = 0.35 and A isset to A = 2.9. As to τb we consider the values τb = 0.0075, 0.01, 0.0125.For example, in Germany the ratio of abatement spending to prevent airpollution to total tax revenue was 0.01 in 1996 (see Sachverständigenrat,2001, table 30 and table 65). a is set to a = 0.00075. This implies that GHGsdouble for τb = 0.01.
An important role is played by the damage functions D(·). This willbe introduced now. As to D(·) we assume the function
D(·) = (m1 (T − To)2 + 1)−φ, (9.13)
with m1 > 0, φ > 0.As to the numerical values of the parameters in (9.13) we assumem1 =
0.05 and φ = 0.05 and m1 = 0.025 and φ = 0.025. (m1 = 0.05, φ = 0.05)
implies that an increase of the surface temperature by 1 (2, 3) degree(s)leads to a decrease of aggregate production by 0.2 (0.9, 1.8) percent.The combination (m1 = 0.025, φ = 0.025) implies that an increase of thesurface temperature by 1 (2, 3) degree(s) leads to a decrease of aggregateproduction by 0.06 (0.2, 0.5) percent. Comparing these values with theestimates published in IPCC (1996), we see that the values we chooseyield a damage which is a bit lower than the one reported by IPCC(1996).

A Descriptive Model of Endogenous Growth 69
Table 9.1 Varying the Abatement Sharebetween 0.0075 and 0.0125 withm1 = 0.05, φ = 0.05.
τb T � M � g gY
0.0075 293.0 2.63 0.0185 0.0191
0.01 291.8 2.03 0.0198 0.0203
0.0125 290.8 1.66 0.0207 0.0211
In the following tables we report the results of our numerical studieswhere we report the temperature on the BGP and the GHG concentrationon the BGP. Further, we report the balanced growth rate denoted byg. gY is the average growth rate of per capita GDP on the transition pathfor the next 100 years, where initial conditions are set to T(0) = 289,M(0) = 1.13 and k(0) = 8.1. The growth rate of output is given by
YY
= αKK
+ (1 − α)HH
+ D′(·)D(·) T.
In table 9.1 we vary the abatement share between τb = 0.0075 andτb = 0.0125.
This table shows that an increase in the ratio of abatement spendingto tax revenue, and also to GDP, leads to both higher growth rates and toa smaller increase in GHG emissions and, as a consequence, to a smallerincrease in average global surface temperature. This holds both for thelong-run balanced growth rate as well as for the transition path for thenext 100 years. In this case, the decline in investment caused by moreabatement spending is compensated by the higher production resultingfrom a smaller damage since the temperature increase is smaller withhigher abatement. The maximum growth rate is obtained then thereis no increase in the average temperature implying that the damage iszero. This is achieved for τb about τb = 0.02. This outcome, of course,depends on the specification of the damage function. This is shown inthe next table, where we set m1 = 0.025 and φ = 0.025.
Table 9.2 shows that the growth rate first rises when abatement spend-ing is increased but then declines when abatement is further increased,although the growth effects are very small. This is due to the smallerdamage caused by the increase in average global surface temperature.
Next we consider the case of varying the tax share between 15 and25 percent. The results for (m1 = 0.05, φ = 0.05) are shown in table 9.3.
Table 9.3 shows that raising the tax rate reduces GHG emissions andalso the balanced growth rate and the GDP growth rate on the transitionpath. It is true that a higher tax revenue raises economic growth andabatement spending because the latter are always in fixed proportion to

70 Global Warming and Economic Growth
Table 9.2 Varying the Abatement Sharebetween 0.0075 and 0.0125 withm1 = 0.025, φ = 0.025.
τb T � M � g gY
0.0075 293.0 2.63 0.0218 0.0222
0.01 291.8 2.03 0.022 0.0223
0.0125 290.8 1.66 0.0219 0.0222
Table 9.3 Varying the Tax Sharebetween 0.15 and 0.25 withm1 = 0.05, φ = 0.05.
τ T � M � g gY
0.15 293.0 2.63 0.0266 0.0274
0.2 291.8 2.03 0.0198 0.0203
0.25 290.8 1.66 0.0124 0.0127
the tax revenue. However, the negative direct growth effect of a highertax share clearly dominates the positive growth effect of smaller damagedue to less GHG emissions and a smaller increase in temperature.
We also studied the effects of varying abatement activities for differ-ent values of γ . To do so we set γ = 0.5 and γ = 1.5.3 From a qualitativepoint of view, the results are the same as for γ = 0.9. The only differenceis that the quantitative growth effects are a bit different.
In the next chapter we present a special form of the growth modelby assuming that physical capital and the stock of knowledge can besummarized in one variable. This gives the so-called AK model ofendogenous growth.
3 To get temperature increase that are compatible with IPCC estimates, we set a = 0.00035and a = 0.0011, respectively.

10
The AK Endogenous Growth Model
Assuming that physical capital and human capital evolve at the samerate, that is, K = H and K(0) = H(0) hold, allows us to rewrite theaggregate per capita production function as follows,
Y = AKD(·), (10.1)
which is linear in capital. In the economics literature, this simplify-ing assumption is frequently made, and in the following we studythis model. First, we consider the descriptive growth model and thenanalyze the second-best solution where abatement activities are chosenoptimally.
The differential equation describing the evolution of capital is nowgiven by
K = AKD(·)(1 − τ(1 + τb) − c(1 − τ)) − (δ + n)K, (10.2)
where we assume again B = τbX and C = cY(1−τ) as in section 9.1. Theeconomy then is completely described by (10.2), (8.5), and (8.6), withemissions given by (9.9), and the balanced growth path (BGP) is
g = AD(·)(1 − τ(1 + τb) − c(1 − τ)) − (δ + n). (10.3)
The balanced growth rate is independent from the capital stock but onlydepends on the average global surface temperature T. This implies thata BGP is as defined in section 9.2 with the only difference that we onlyhave to consider the equations M and T.1
From (10.3) it is immediately seen that variations in τb and in τ affectthe balanced growth rate both directly as well as indirectly by affectingthe temperature on the balanced growth path. As in chapter 9, there is apositive indirect growth effect and a negative direct growth effect goingalong with changes in τb and in τ; the overall effect, however, cannotbe determined for the general model. Therefore, we present the resultsof numerical examples without presenting the results for the analyticalmodel.
The parameters are as in section 9.3, that is,n = 0.02, δ = 0.075, τ = 0.2,Mo = 1, c = 0.8, γ = 0.9, β1 = 1.1, ξ = 0.3, a = 0.00075, and α = 0.35. The
1 Of course, the AK model is also asymptotically stable.
71

72 Global Warming and Economic Growth
Table 10.1 Varying the AbatementShare between 0.0075 and0.02 with τ = 0.2.
τb T � M � g
0.0075 293.0 2.63 0.0197
0.01 291.8 2.03 0.0208
0.0125 290.8 1.66 0.0216
0.018 289.3 1.19 0.022
0.02 288.8 1.08 0.0219
Table 10.2 Varying the Tax Share0.15 and 0.25 withτb = 0.01.
τ T � M � g
0.15 293.0 2.63 0.0269
0.2 291.8 2.03 0.0208
0.25 290.8 1.66 0.0142
only different parameter is the value of A, which we set to A = 0.75 toget growth rates that are in line with those observable in the real world.The tax share is set to τ = 0.2, and we consider for τb the values τb =0.0075, 0.01, 0.0125. m1 and φ are again set to m1 = 0.05 and φ = 0.05.
Tables 10.1 and 10.2 present the results of varying abatement spend-ing and of variations of the tax share with τ = 0.2, and τb = 0.01,respectively.2
Tables 10.1 and 10.2 largely confirm the results of chapter 9. That is,a rise in the tax share reduces the balanced growth rate and also GHGemissions. The growth rates in the AK model differ a bit from those ofchapter 9, but the change is about the same. However, in contrast tochapter 9, the growth rate is maximized for τb such that the temperatureis larger than the preindustrial temperature To. Next, we consider thesecond-best solution.
10.1 THE SECOND-BEST SOLUTION
To derive the second-best solution we assume that the government takesprivate consumption and the tax share as given and sets abatementsuch that welfare is maximized. As to welfare, we assume as usual
2 In this section we only consider the balanced growth path.

The AK Endogenous Growth Model 73
that it is given by the discounted stream of per capita utility times thenumber of individuals over an infinite time horizon. Concerning utility,we assume a logarithmic function. More concretely, the governmentsolves the following optimization problem
maxτb
∫ ∞
0e−(ρ−n)tL(0) ln(c(1 − τ)AKD(·))dt (10.4)
subject to (10.2), (8.6), (8.5) with c(1−τ)AKD(·) = C per capita consump-tion. ln denotes the natural logarithm, and ρ is the discount rate. In thefollowing we normalize L(0) ≡ 1.
To find necessary optimality conditions, we formulate the current-value Hamiltonian as
H(·) = ln(c(1 − τ)AKD(·)) + λ1(AKD(·)(1 − τ(1 + τb) − c(1 − τ))
− (δ + n)K) + λ2
(β2
(a
τbτ
)γ
− µM)
+ λ3 (ch)−1 ·(
1367.54
0.21
−(5.67 10−8)(19.95/109)T4 + β1 (1 − ξ) 6.3 lnMMo
), (10.5)
with λi, i = 1, 2, 3, the shadow prices of K, M, and T, respectively, andE = aγYγB−γ emissions. Note that λ1 is positive while λ2 and λ3 arenegative.
The necessary optimality conditions are obtained as
∂H(·)∂τb
= λ1AKD(·)(−τ) − λ2β2(a/τ)γ(−γ)τ−γ−1b = 0, (10.6)
λ1 = (ρ + δ) λ1 − K−1 − λ1 AD(·)(1 − τ(1 + τb) − c(1 − τ)), (10.7)
λ2 = (ρ − n) λ2 + λ2 µ − λ3 (1 − ξ) β1 6.3 c−1h M−1, (10.8)
λ3 = (ρ − n) λ3 − D′(·)D
− λ1 AKD′(·)(1 − τ(1 + τb) − c(1 − τ))
+ λ3(5.67 10−8(19.95/109) 4T3)
ch. (10.9)
Furthermore, the limiting transversality condition limt→∞ e−(ρ+n)t(λ1K+λ2T + λ3M) = 0 must hold.
From (10.6) we get the second-best optimal abatement activities (asratio to the tax revenue) as
τob =(−λ2β2γ(a/τ)γ
AD(·)Kλ1τ
)1/(1+γ)
. (10.10)
Equation (10.10) shows that τob is higher the more polluting the technol-ogy in use is, which is modeled in the framework by the coefficient a.

74 Global Warming and Economic Growth
This means that economies with less clean production technologies havea higher optimal abatement share than economies with a cleaner tech-nology. However, this does not mean that economies with a cleanertechnology have higher emissions. This holds because on one hand, thehigher abatement share may not be high enough to compensate for themore polluting technology. On the other hand, the second-best pollutiontax rate also depends on λ1, λ2, and K. Further, from the expression forτob one realizes that the higher the absolute value of the shadow price ofGHG concentrations, |λ2|, the higher the abatement share has to be set.
For the second-best solution, a balanced growth path is definedsimilar to definition 4.
Definition 5 For the second-best solution, a balanced growth path is a pathsuch that T = M = λ2 = λ3 = 0 and K/K = −λ1/λ1 hold, with M ≥ Mo.
Unlike for the descriptive versions of our growth models, we cannotgive results as to the existence and stability of a BGP for the analyticalmodel. Therefore, and to get an impression about the quantitative resultsof the second-best solution, we again make simulations with the sameparameters as in chapter 8, with τ = 0.2 and a discount rate of 5 percent,ρ = 0.05. For the numerical values of the parameters, it can be shownthat there exists a unique BGP that is, however, not asymptotically stablebut a saddle point. This is the content of proposition 17.
Proposition 17 For the second-best model economy there exists a uniqueBGP that is a saddle point for the numerical parameter values of section 9.3.
Proof : To prove that proposition we define � ≡ K · λ1 giving �/� =K/K + λ1/λ1. Setting �/� = 0 gives �� = (ρ − n)−1. Inserting �� in(10.10) and the resulting expression as well as �� in equations (8.6), (8.5),(10.8), and (10.9) gives an autonomous system of differential equationsthat depends onM,T, λ2, and λ3. Arest point of this system yields a BGP.With the numerical parameters the solution is given by M � = 1.25625,T � = 289.50603, λ�
2 = −0.75023, and λ�3 = −0.00378.
The eigenvalues of the Jacobian are given by
e1 = 6.75544, e2 = −6.75544 e3 = 0.19010 e4 = −0.19010.
Thus, the proposition is proved. For a = 5 · 10−4 the numerical valuesare different, but the qualitative result remains unchanged. �
Table 10.3 gives the balanced growth rate and the values of T,M,B/Y, and τob on the BGP.
Table 10.3 shows that for theAK growth model there exists an optimalshare for abatement spending that maximizes utility and also the bal-anced growth rate. This share is about 1.7 percent of the tax revenue fora = 7.5 · 10−4, implying a share of abatement spending per GDP, B �/Y �,

The AK Endogenous Growth Model 75
Table 10.3 The Second-Best Solution.
a τob B �/Y � T � M � g
7.5 · 10−4 0.017 0.0034 289.5 1.26 0.0221
5 · 10−4 0.012 0.0024 289.2 1.17 0.0229
of 0.34 percent. Further, it is seen that in a world with a more pollutingtechnology (higher a) the second-best pollution tax rate is larger, butnevertheless, emissions and the increase in temperature are also higher.Economies with a more polluting production technology should havehave a higher pollution tax rate. In spite of this, the emissions in the econ-omy with the more polluting technology are higher because the higherabatement share is not enough to compensate for the more pollutingtechnology.
Thus, our model is in part consistent with the literature that postu-lates that an environmental Kuznets curve exists, where emissions firstrise with an increase in GDP (when the technology in use is relativelypolluting) but decline again when a certain level of GDP is reached andthe technology becomes cleaner (see, e.g., the contribution by Stockey1998).3 But keep in mind that our result is obtained for second-bestgovernment policies and it may be doubted that in reality governmentspursue optimal policies.
It should also be mentioned that the choice of the discount rate ρ
affects the optimal τob and also the balanced growth rate. However, nei-ther the growth rate nor optimal abatement react sensitively to changesin ρ. For example, setting ρ = 0.02 or ρ = 0.1 basically leaves unchangedboth optimal abatement spending and the growth rate.
In the next section we study the problem of the social planner. Thedifference to the optimization problem faced by the government in thissection is that the social planner decides on both the consumption shareand the abatement share instead of taking consumption as given.
10.2 THE SOCIAL OPTIMUM
As mentioned at the end of the last section, the social planner can decideon both the investment share and the abatement share. The optimizationproblem, then, is given by
maxcs,b
∫ ∞
0e−(ρ−n)tL(0) ln(cs AKD(·))dt, (10.11)
3 In the model by Stockey, the pollution intensity is a choice variable, whereas it is aparameter in our model.

76 Global Warming and Economic Growth
with cs the consumption share and b the abatement share in the socialoptimum, respectively. Again, ln denotes the natural logarithm, ρ is thediscount rate, and we normalize L(0) ≡ 1. The constraints are (8.5) and(8.6), where b ≡ B/Y, and the differential equation K. The latter is nowgiven by K = AKD(·)(1 − cs − b) − (δ + n)K. Again, we formulate thecurrent-value Hamiltonian, which is
H(·) = ln(cs AKD(·)) + λ4K + λ5M + λ6T, (10.12)
with λi, i = 4, 5, 6, the shadow prices of K, M, and T in the socialoptimum. As in the previous section, λ4 is positive and λ5 and λ6 arenegative.
The necessary optimality conditions now are
∂H(·)∂cs
= c−1s − λ4AKD(·) = 0, (10.13)
∂H(·)∂b
= −λ4AKD(·) − λ5β2γb−γ−1aγ = 0, (10.14)
λ4 = (ρ + δ) λ4 − K−1 − λ4 AD(·)(1 − cs − b), (10.15)
λ5 = (ρ − n+ µ) λ5 − λ6 (1 − ξ) β1 6.3 c−1h M−1, (10.16)
λ6 = (ρ − n) λ6 − D′(·)D
− λ4 AKD′(·)(1 − cs − b)
+ λ6(5.67 10−8(19.95/109) 4T3)
ch. (10.17)
The transversality condition is as in the last section.From (10.13) and (10.14) we get the first-best consumption share and
abatement share (relative to GDP, respectively) as
cs = (λ4AKD(·))−1 (10.18)
b =(−λ5β2γaγ
AD(·)Kλ4
)1/(1+γ)
. (10.19)
One immediately realizes that (10.19) is similar to (10.10) and theinterpretation is basically the same as in 10.1. Equation (10.18) showsthat the first-best optimal consumption share negatively depends onboth physical capital and its shadow price. That means the higher thestock of capital and the higher its “price,” the smaller the consump-tion share. Of course, as for the second-best solution, consumptiongrows while the consumption share is constant on the BGP. Further-more, the higher the damage caused by the temperature increase,the smaller the consumption share in the economy. This outcomeis due to the fact that the temperature increase negatively affects

The AK Endogenous Growth Model 77
Table 10.4 The Social Optimum.
a B �/Y � T � M �
7.5 · 10−4 0.0041 288.65 1.05
5 · 10−4 0.0028 288.57 1.04
aggregate production, Y, and thus consumption, which is equalto cs · Y.
As to the question of whether there exists a BGP for the social opti-mum, we again resort to simulations. Here, we can state the followingproposition.
Proposition 18 For the social optimum there exists a unique BGP, definedanalogous to definition 5, which is a saddle point for the numerical parametervalues in section 9.3.
Proof : The proof of the proposition proceeds in complete analogy to thatof proposition 17. Therefore, we do not mention it in detail. Again, thevalue of a affects the numerical values but leaves the qualitative outcomeunchanged. �
In the following we focus our attention on the abatement share andthe temperature increase in the social optimum compared to the second-best economy. Table 10.4 gives the values of T, M, and B/Y on the BGPfor a = 7.5 · 10−4 and a = 5 · 10−4, respectively. The other parametersare as in section 10.1.
Table 10.4 demonstrates that, in the social optimum, economieswith a less polluting technology (smaller a) have a smaller abatementshare than economies with a more polluting technology. Neverthe-less, the economies with the cleaner technology have a smaller levelof GHG emissions and, consequently, a smaller increase in tempera-ture. This result is equivalent to the one obtained for the second-bestsolution. That means that the higher abatement share cannot compen-sate for the less clean production technology. One also realizes thatthe abatement share in the social optimum is higher compared to thesecond-best solution, and as a consequence, the temperature increase issmaller.
10.3 A MULTIREGION WORLD
Up to now we have assumed that the world consists of homogeneousregions that can be represented by one economy. In this section weallow for regions that differ with respect to the damages they sufferfrom global warming and with respect to their emissions (see Greiner2005b).

78 Global Warming and Economic Growth
We assume that aggregate production in region i, i = 1, . . . ,n, takesplace according to the following per capita production function:
Yi(t) = AiKiDi(T − To), (10.20)
with Yi per capita production in region i, Ai a positive constant, and Kia composite of human and physical capital. Di(T − To) is the functiongiving the decline in aggregate per capita production in country i result-ing from deviations of the actual temperature from the preindustrialtemperature, To.
We point out that AK models are very sensitive with respect to theparameters. However, we do not intend to make calibrations, but wewant to get insights into the structure of the model and see how certainclimate policies affect economies qualitatively. This should be kept inmind when interpreting the results in the next sections.
As to the function Di(T − To), we assume that it is continuouslydifferentiable and that it satisfies (9.5) and (9.6).
The per capita capital accumulation function is given by
Ki = AiKiDi(·)(1 − ci − τB,i) − (δi + ni)Ki, (10.21)
with ci the consumption share in region i and τB,i the abatement share.ni ∈ (0, 1) is the population growth rate in region i and δi ∈ (0, 1) is thedepreciation rate of capital.
Recall that we take as a starting point the Solow-Swan approach witha given consumption and saving share. We do this because we want tofocus on effects resulting from climate changes that affect productionas modeled in equations (10.20)–(10.21) and therefore neglect effectsresulting from different preferences.
From equations (10.20) and (10.21) we see that the gross marginalproduct of private capital, which equals the interest rate in our economy,is equal to AiDi(·) and that deviations from the preindustrial temper-ature affect both the level of production as well as the growth rate ofcapital and production.
Concerning GHG emissions, we again assume that these are abyproduct of production and expressed in CO2 equivalents. Emissionsare a function of per capita output relative to per capita abatement activi-ties. This implies that higher production goes along with more emissionsfor a given level of abatement spending. It should also be mentioned thatthe emission of GHGs does not affect production directly but only indi-rectly by raising the concentration of GHGs in the atmosphere, whichaffects the climate of the Earth and leads to a higher surface temperatureand more extreme weather situations.
As far as emissions go, we make the same assumption as in section 9.1.The only difference now is that we consider different regions. Formally,

The AK Endogenous Growth Model 79
emissions in region i are described by
Ei =(ai YiBi
)γi
=(aiτB,i
)γi
, (10.22)
where Bi is per capita abatement with Bi = τB,i Yi. γi > 0 and ai > 0 arepositive constants. The parameter ai can again be interpreted as a tech-nology index describing how polluting a given technology is. For largevalues of ai, a given production (and abatement) goes along with highemissions, implying a relatively polluting technology and vice versa.
The concentration of GHGs, M, then evolves according to thefollowing differential equation
M = β1
n∑j=1
Ej − µM,M(0) = M0. (10.23)
Note that this is analogous to section 9.1, and we also assume the sameparameter values as in 9.1. The equation giving the change in globalaverage surface temperature is given by equation (8.5).
Thus, the world economy is completely described by equations(10.21), (8.5), and (10.23), with emissions given by (10.22).
10.3.1 The Noncooperative World
In this section we analyze the noncooperative world or the Nashequilibrium. Each region maximizes utility resulting from per capitaconsumption where we assume a logarithmic utility function. Assumingthat each region maximizes per capita utility, the optimization problemin each region i = 1, . . . ,n is given by
maxτB,i
∫ ∞
0e−ρit ln(ciAiKiDi(·))dt, (10.24)
subject to (10.23), (8.5), and (10.21) with ciAiKiDi(·) = Ci per capita con-sumption. ln denotes the natural logarithm, and ρi is the discount rate.
To find the optimum we construct the current-value Hamiltonian,which is
Hi(·) = ln(ciAiKiDi(·)) + λ1,i
β1
n∑j=1
(ajτB,j
)γj
− µM
+ λ2,i
(k1 − k2T4 + k3 ln
MMo
)
+ λ3,i (AiKiDi(·)(1 − ci − τB,i) − (δi + ni)Ki), (10.25)

80 Global Warming and Economic Growth
with k1 ≡ c−1h 0.21 · 1367.5/4, k2 ≡ c−1
h 0.95(5.67 10−8) (21/109), and k3 ≡
4.851c−1h . λk,i, i = 1, 2, 3, denote the shadow prices of M, T, and Ki in
region i, respectively, and Ei = aγii Yγii B
−γii are emissions. Note that λ1,i
and λ2,i are negative, and λ3,i are positive.The necessary optimality conditions are obtained as
∂Hi(·)∂τB,i
= λ1,iβ1(−γi)aγii τ
−γi−1B,i − λ3,iAiKiDi(·) = 0, (10.26)
λ1,i = (ρi + µ) λ1,i − λ2,ik3M−1, (10.27)
λ2,i = ρi λ2,i −D′i(·)/Di + λ2,ik2 4T3
− λ3,i Ai Ki D′i(·)(1 − ci − τB,i), (10.28)
λ3,i = (ρi + δi + ni) λ3,i − K−1i − λ3,i Ai Di(·)(1 − ci − τB,i). (10.29)
Furthermore, the limiting transversality condition limt→∞ e−ρit(λ1,iM+λ2,iT + λ3,iKi) = 0 must hold.
From (10.26) we get the optimal abatement activities (as a ratio toGDP) in each region as
τoB,i =(
β1(−λ1,i)γiaγii
λ3,iAiKiDi(·)
)1/(1+γi)
. (10.30)
Equation (10.30) shows that τoB,i is higher the more polluting the technol-ogy in use is, which is modeled in our framework by the coefficient ai.This means that economies with less clean production technologies havea higher optimal abatement share than these with a cleaner technology.However, this does not mean that economies with a cleaner technologyhave higher emissions, which was already obtained in the last section.This holds because on one hand, the higher abatement share may not behigh enough to compensate for the more polluting technology. On theother hand, the second-best pollution tax rate also depends on λ1,i, λ3,i,and Ki. Further, from the expression for τoB,i one realizes that the higherthe absolute value of the shadow price of the GHG concentration, |λ1i |,the higher the abatement share has to be set.
In the following we confine our investigations to the BGP. A BGPis defined analogously to the definition 4.4 In particular, we requireagain that the GHG concentration and the temperature must be constantalong a BGP (sustainability aspect). Furthermore, the growth rate of percapita capital is constant over time. Finally, for reasons of realism, weonly consider BGPs with an aggregate GHG concentration larger thanor equal to the preindustrial level.
4 In the following, steady state is again used equivalently to balanced growth path.

The AK Endogenous Growth Model 81
To gain further insight into our model, we use numerical calcula-tions and consider three regions. Two are relatively highly developedregions, where one is producing with a relatively clean technology andthe other uses a relatively polluting technology. One may think of theEuropean OECD countries as the first region and the United States asthe second region. The third region is given by low-income countrieswith a technology that is more polluting than the other two regions. Weset a1 = 3.75 10−4. a2 is twice as large as a1, that is, a1 = 7.5 10−4, anda3 is four times as large as a1, that is, a3 = 0.003. These relations reflectabout the situation in European OECD countries relative to the UnitedStates and relative to low-income countries in 1995 (see Nordhaus andBoyer 2000, table 3.1). γi, i = 1, 2, 3, is set to one in all three regions, thatis, γi = 1, i = 1, 2, 3.
As to the functionDi(T(t)−To) we assume the specification as in 9.1,
Di = (1 +mi(T − To)2)−φi , mi, φi > 0. (10.31)
The damage caused by a higher GHG concentration is assumed to be thesame for the first and second region and about three times as high in thethird region for a doubling of GHGs. This is achieved by the followingparameter values, m1 = m2 = 0.0013, φ1 = φ2 = 1, and m3 = 0.0087,φ3 = 0.5. This implies that an increase of the average surface temperatureby 3 ◦C as a result of a doubling of GHGs goes along with a damage ofabout 1.2 percent in regions 1 and 2. A rise of the temperature by about6 ◦C implies a damage of roughly 4.5 percent. For the third region thedamage is 4 percent for a 3 ◦C increase of the temperature and about13 percent when the temperature rises by 6 ◦C. These values roughlyreflect the situation in European OECD countries, the United States,and low-income countries (see Hackl and Pruckner 2003, table 1).
Damages are not the same in the regions because of differences in thestate of development. For example, in developing countries people areprepared worse for possible catastrophes than in developed countriesbecause they cannot afford to invest in preventive measures. Further-more, poor countries depend more heavily on agriculture and haveless means to compensate losses in agricultural production compared tomore developed countries so that the consequences of climatic changesare more dramatic in less developed countries.
The subjective discount rate is assumed to be the same in the threeregions and we set ρi = 0.03, i = 1, 2, 3. We assume the same discountrates in all regions because we want to focus on growth effects result-ing from the supply side, which is affected by a possible temperatureincrease, and we are not interested in differences resulting from differentpreferences. If the discount rates were different, this would lead to dif-ferences in growth rates even if the effects of the temperature increase inthe regions were the same, and this would complicate the analysis. The

82 Global Warming and Economic Growth
population growth rates are assumed to be zero in the first two regions,n1 = n2 = 0, and 2 percent in the third region, n3 = 0.02.
The marginal propensity to consume is set to 80 percent in all threeregions, ci = 0.8, i = 1, 2, 3. The marginal product of capital in the secondregion is assumed to be larger than in the first region, and the latter islarger than in the third region, and we setA1 = 0.35,A2 = 0.5, andA3 =0.25. This implies a higher marginal product of capital in the secondregion compared with the first and third. A justification for differentmarginal products can be seen in different levels of technology and incapital transfer constraints. Depreciation rates are set to δ1 = δ2 = 0.04in regions 1 and 2 and δ3 = 0.01 in region 3. Thus, we acknowledge thatdepreciation of capital is higher in those regions with higher income.
Defining κi ≡ λ3,i ·Ki, a BGP is given by the solution of the equations.
0 = β1
3∑j=1
(ajτoB,j
)− µM, (10.32)
0 = k1 − k2T4 + k3 lnMMo
, (10.33)
0 = κi(Ki/Ki + λ3,i/λ3,i
), (10.34)
0 = (ρi + µ) λ1,i − λ2,ik3M−1, (10.35)
0 = ρi λ2,i −D′i(·)/Di + λ2,i k2 4T3 − κi Ai D′
i(·)(1 − ci − τB,i), (10.36)
with τoB,i = ((β1(−λ1,i)ai)/(λ3,iAiKiDi(·)))0.5 , i = 1, 2, 3. Equation (10.32)
follows from (10.23), and (10.33) follows from (8.5). Equation (10.34)is obtained by combining (10.21), and (10.29), and (10.35) and (10.36),finally, are obtained from (10.27) and (10.28). It should be noted thata constantly rising capital stock goes along with a constantly declin-ing (shadow) price of capital, implying that κi is constant on a BGP.Solving equations (10.32)–(10.36) gives steady-state values5 for the levelof GHGs (M �), the temperature (T �), the product of the capital stockand its shadow price (κ �), and the shadow prices of GHGs (λ �
1 ) andtemperature (λ �
2 ). These variables, then, give the balanced growth ratein region i, which is given by gi ≡ AiDi(·)(1 − ci − τB,i) − (δi + ni), withτoB,i as before.
As for the existence of a BGP, Rosen (1965) has derived general condi-tions such that an N-person game has a unique solution. However, thisresult cannot be applied to our model because we consider a differentialgame with ongoing growth. Therefore, we will numerically computeBGPs in our examples where the computations show that existence andlocal uniqueness is assured in each case.
5 Recall that the � denotes values on the BGP.

The AK Endogenous Growth Model 83
Table 10.5 Optimal Abatement Shares, Emissions, Balanced GrowthRates for the three Regions as Well as Average GlobalTemperature (Noncooperative Case) for µ = 0.1. (The valuesin parantheses are for µ = 0.005.)
τoB,1 E1 g1 τoB,2 E2 g2 τoB,3 E3 g3
0.29% 0.131 2.69% 0.38% 0.1949 5.51% 1.36% 0.2214 1.27%
(0.15%) (0.25) (0.5%) (0.2%) (0.377) (2.4%) (0.7%) (0.443) (−0.8%)
T � = 293.1 (308.8)
In table 10.5 we give the result of our calculations for the three regions.As to the rate of decay of GHGs, we consider two values, µ = 0.1 andµ = 0.005.
For µ = 0.1 this table shows that the region with the less clean produc-tion technology (region 2) has a higher abatement share than the regionwith the cleaner production technology (region 1) if damages caused bya rise in the average surface temperature are the same in both regions.However, this does not mean that emissions in region 2 are smaller thanin region 1. So region 1 has fewer emissions than region 2. This meansthat the higher abatement share cannot compensate for the less cleanproduction technology.
Taking into account that both the production technology and thedamages caused by a rise in GHGs are different (comparing regions2 and 3), one can see that region 2 spends relatively less for abatementthan region 3–0.4 percent versus 1.4 percent. Further, region 3 has higheremissions than region 2, although the first spends a higher share of GDPfor abatement.
With no cooperation, GHGs rise by about 2.7 of the preindustriallevel, implying an increase in the average global surface temperature of4.7 ◦C for a decay rate of GHGs of 10 percent and the other parametervalues we assume.
Setting µ = 0.005, the qualitative results remain unchanged. Itshould also be mentioned that now the model does not produce sus-tained growth in region 3 because of the high damages going alongwith the rise in temperature. The temperature increase in this case isabout 10 ◦C.
Note that we study optimal policies. Therefore, the outcome of thenumerical example does not necessarily reflect what we can observe inreality. This holds because abatement policies in real-world economiesare not necessarily optimal.
In the next section we compare this result to the outcome in thecooperative world.

84 Global Warming and Economic Growth
10.3.2 The Cooperative World
In the cooperative world, the optimization problem of the planner isgiven by6
maxτB,i
∫ ∞
0e−ρt
n∑j=1
wj ln(cjAjKjDj(·))dt, (10.37)
subject to (10.23) and (10.21) with ciAiKiDi(·) = Ci per capita consump-tion in region i. ln again denotes the natural logarithm, and ρ is thediscount rate. wi gives the weight given to region i.
To find the optimum, we construct the current-value Hamiltonian,which is now written as
H(·) =n∑j=1
wj ln(cjAjKjDj(·)) + λ4
β1
n∑j=1
(ajτB,j
)γj
− µM
+ λ5
(k1 − k2T4 + k3 ln
MMo
)
+n∑j=1
λ6,j(Aj Kj Dj(·)(1 − cj − τB,j) − (δj + nj)Kj), (10.38)
with λ4, λ5 the shadow prices of M and T and λ6,i the shadow prices ofKi. Again, λ4 and λ5 are negative and λ6,i positive.
The necessary optimality conditions are obtained as
∂H(·)∂τB,i
= λ4β1(−γi)aγii τ
−γi−1B,i − λ6,iAiKiDi(·) = 0, (10.39)
λ4 = (ρ + µ) λ4 − λ5 k3 M−1, (10.40)
λ5 = λ5ρ + λ5 k2 4T3 −n∑j=1
wjD′j(·)/Dj
−n∑j=1
λ6,j Aj Kj D′j(·)(1 − cj − τB,j), (10.41)
λ6,i = (ρ + δi + ni) λ6,i − wi K−1i − λ6,i Ai Di(·)(1 − ci − τB,i). (10.42)
Further, the limiting transversality condition limt→∞ e−ρt(λ4M+ λ5T +∑nj=1 λ6,jKj) = 0 must hold.
6 We do not call this situation pareto optimum because in the pareto optimum the socialplanner would also determine the savings rate, which is exogenous in our context.Therefore, this solution is in a way second-best.

The AK Endogenous Growth Model 85
From (10.39) we get the optimal abatement ratios as
τoB,i =(
β1(−λ4)γiaγii
λ6,iAiKiDi(·)
)1/(1+γi)
. (10.43)
Equation (10.43) basically is equivalent to (10.30) with the exception thatthe shadow prices are different. This holds because in the cooperativeworld regions do not optimize separately.
To get further insight we proceed as in the last section. That is, weconsider three regions, insert numerical values for the parameters, andthen calculate the corresponding abatement shares, emissions, balancedgrowth rates, as well as the rise in GHGs and in the average globalsurface temperature. The parameter values are as in the last section,with ρ = 0.03.
Defining κi ≡ λ6,i · Ki a BGP is given by the solution of the followingsystem of equations:
0 = β1
3∑j=1
(ajτoB,j
)− µM, (10.44)
0 = k1 − k2T4 + k3 lnMMo
, (10.45)
0 = κi(Ki/Ki + λ6,i/λ6,i
), (10.46)
0 = (ρ + µ) λ4 − λ5 k3 M−1, (10.47)
0 = λ5ρ + λ5 k2 4T3 −n∑j=1
wj D′j(·)/Dj −
n∑j=1
κj Aj D′j(·)(1 − cj − τB,j),
(10.48)
with τoB,j given by (10.43). Table 10.6 gives the result assuming equalweight to each region (w1 = w2 = w3 = 1).
Table 10.6 Optimal Abatement Shares, Emissions, and Balanced GrowthRates for the Three Regions as Well as Average GlobalTemperature (Cooperative Case) for µ = 0.1. (The values inparentheses are for µ = 0.005.)
τoB,1 E1 g1 τo
B,2 E2 g2 τoB,3 E3 g3
0.57% 0.065 2.75% 0.68% 0.11 5.59% 1.9% 0.155 1.41%
(0.39%) (0.096) (0.9%) (0.5%) (0.162) (3.1%) (1.5%) (0.196) (−0.5%)
T � = 290.7 (305)

86 Global Warming and Economic Growth
Table 10.7 Abatement Shares, Emissions, and Balanced Growth Rates forthe Three Regions as Well as Average Global Temperature(w3 = 2w1 = 2w2 = 2, µ = 0.1).
τoB,1 E1 g1 τo
B,2 E2 g2 τoB,3 E3 g3 T �
0.66% 0.057 2.71% 0.78% 0.096 5.53% 1.6% 0.19 1.49% 290.9
Comparing the outcome of the cooperative case with the noncooper-ative one, it is realized that the rise in GHGs is smaller, and consequentlythe increase in the temperature is smaller. With µ = 0.1 GHGs rise byabout factor of 1.6, implying an increase in temperature by 2.3◦C. This isdue to higher abatement shares in the cooperative world and, as a con-sequence, smaller emissions in all regions. As for the qualitative results,we see that they do not differ from the last section.
It can also be seen that emissions are clearly smaller than in the non-cooperative case. In region 1 emissions are 50 percent smaller, in region2, 44 percent, and in region 3, there are 37 percent fewer emissions com-pared to the noncooperative world. The reason emissions in regions 1and 2 in the cooperative case are much smaller than in the noncoopera-tive case compared with region 3 is that the shadow price of emissionsfor regions 1 and 2 in the cooperative case is much higher in absolutevalues than in the noncooperative case. This holds because in the cooper-ative case regions 1 and 2 take into account not only their own damagesbut also damages in region 3.
Furthermore, growth rates tend to be larger in the cooperative world.This holds for all three regions and is due to the smaller rise in theaverage surface temperature. But in region 3, still no positive sustainedgrowth can be observed for µ = 0.005.
From a qualitative point of view the results remain the same forµ = 0.005. In particular, emissions in region 3 are again higher thanin region 2. In the noncooperative case the same outcome could beobserved. Further, the increase in the average global surface temper-ature is much larger compared to the case µ = 0.1.
In table 10.7 we study the model assuming that welfare in region 3gets a weight that is double the weight given to welfare in regions 1and 2, that is, w3 = 2w1 = 2w2 = 2, where we limit our considerationto the case µ = 0.1. A possible justification for higher weights can beseen by thinking of the Rawls criterion, according to which welfare in aneconomy is determined by the poorest. Then one can argue that welfarein the poorest region should receive a higher weight in the world.7
7 Of course, a strict application of the Rawls criterion would require maximizing welfareof only the poorest region, which, however, would not be a cooperative solution.

The AK Endogenous Growth Model 87
Table 10.7 shows that now region 3 has a smaller abatement shareand higher emissions if its welfare gets a higher weight compared to thecase where all three regions get the same weight. The other two regionshave higher abatement shares and smaller emissions. As a result, thegrowth rates in regions 1 and 2 tend to fall while that in region 3 tendsto rise.
10.3.3 Equal Marginal Damages in All Regions
In this section we consider the world economy where abatement ratiosare set such that marginal damages in steady state are equalized inall regions, given that the steady-state increase in temperature attainsan exogenously determined level (marginal damage rule). A justifica-tion for considering this scenario is that countries have agreed to limitoverall GHG emissions to a certain steady-state level M �, implying thesteady-state temperature T �. Furthermore, countries are myopic andonly consider present damages but not future damages, which are dif-ficult to estimate. Then each country sets the abatement share such thatit maximizes its instantaneous return, where the return is the reduc-tion in the damage resulting from the rise in temperature, implyingthat the marginal benefit of the abatement share equals its marginalcost.
Technically, we proceed as follows. From (10.23) and (10.22) we getin steady state
M � = β1
µ
n∑j=1
(ajτB,j
)γj
. (10.49)
Inserting (10.49) in (8.5) gives the temperature on the BGP as a functionof the abatement shares.
Abatement shares, τB,j, then are obtained as the solution of theequations
T = 0 and∂Di∂τB,i
= ∂Dj∂τB,j
, i �= j, (10.50)
subject to T � = T, where T is the temperature going along with theexogenously fixed level of GHGsM �. The balanced growth rate is againgiven by (10.21)/Ki.
To get insight into the model, we compare the outcome of the cooper-ative world (with equal weights) with that where marginal damages areequalized. Table 10.8 shows the result whereT � is set toT � = T = 290.7.

88 Global Warming and Economic Growth
Table 10.8 Abatement Shares, Emissions, and Balanced Growth Rates forthe Three Regions as Well as Average Surface Temperature withEqual Marginal Damages (for µ = 0.1).
τoB,1 E1 g1 τo
B,2 E2 g2 τoB,3 E3 g3 T �
0.45% 0.083 2.79% 0.64% 0.12 5.61% 2.2% 0.131 1.33% 290.7
As far as emissions go, one realizes that worldwide emissions do notchange,8 but emissions in the regions are different compared with thecooperative world. So emissions in regions 1 and 2 are 22 and 8.3 percenthigher, respectively, and in region 3 they are 15.5 percent lower com-pared to the cooperative world. This is due to the smaller respectivelyhigher abatement shares in the regions and tends to raise the growthrates in regions 1 and 2 and lower the growth rate in region 3.
The reason the abatement share in region 3 is higher and emissions arelower compared to the cooperative solution is that the direct negativeeffects of the temperature increase are more important when marginaldamages are equated. In the dynamic optimization problem, the dam-age going along with a temperature increase was taken into accountonly indirectly, as a side condition, and the goal was to maximizethe discounted stream of utility resulting from consumption. In thescenario in this section, equating marginal damages is the goal, andconsequently the region with the higher marginal damages, resultingfrom a temperature rise, has to choose a higher abatement share andemit less.
Thus, our calculations show that in the scenario where the marginaldamage rule is applied, emissions in all regions are different comparedwith the outcome of the cooperative solution. There are changes con-cerning the level of GHG emissions of up to 20 percent. In general, itcan be said that those countries with high marginal damages will emitless than in the cooperative solution.
8 Of course, this is due to the requirement that the temperature increase is the same as inthe cooperative world.

11
A Model with Optimizing Agents
Up to now we have considered descriptive models of ongoing growth.Here, we study a model of endogenous growth and climate changeassuming optimizing agents. We start with the description of thestructure of our economy.
11.1 THE COMPETITIVE ECONOMY
11.1.1 The Structure of the Economy
We consider an economy where one homogeneous good is produced.Furthermore, the economy is represented by one individual with house-hold production who maximizes a discounted stream of utility arisingfrom per capita consumption times the number of household memberssubject to a budget constraint (see Greiner 2004b). A frequently usedstandard utility function U in economics is
U ={(CD1(T − To))1−σ/(1 − σ), for σ > 0, σ �= 1lnC + lnD1(T − To), for σ = 1.
(11.1)
Cdenotes per capita consumption and σ is the inverse of the intertempo-ral elasticity of substitution of consumption between two points in time.D1(T−To) gives the disutility resulting from deviations from the normaltemperature To.1 As to the functional form of D1(T − To), we assumethat it is given by equation (9.5) with derivative as in (9.6). Note thatwe now suppose that deviations from the preindustrial surface temper-ature have direct impacts on the individual’s utility. We do this becausehigher temperatures lead to more extreme weather events, like stormsor flooding, which reduce people’s well-being.
The individual’s budget constraint in per capita terms is given by2
Y(1 − τ) = K + C + B+ τEEL−1 + (δ + n)K, K(0) = K0, (11.2)
with Y per capita production, K per capita capital, B per capita abate-ment activities, and E emissions. τ ∈ [0, 1) is the tax rate on production,
1 The normal temperature is the preindustrial temperature.2 The per capita budget constraint is derived from the budget constraint with aggregatevariables, denoted by the subscript g, according to K/K = Kg/Kg − L/L.
89

90 Global Warming and Economic Growth
and τE > 0 is the tax on emission. δ is the depreciation rate of capital.L is labor, which grows at rate n. In our model formulation abatementis a private good.3 The production function is given by
Y = AKαK1−αD2(T − T0), (11.3)
with K per capita capital, α ∈ (0, 1) the capital share, and A a positiveconstant. D2(T − T0) is the damage due to deviations from the normaltemperature To and has the same functional form as D1(·). We will con-cretely specify both D1(·) and D2(·). K gives positive externalities fromcapital resulting from spillovers. This assumption implies that in equi-librium the private gross marginal returns to capital4 are constant andequal to αAD2(·), thus generating sustained per capita growth if A issufficiently large. This is the simplest endogenous growth model exist-ing in the economics literature. However, because we are interestedless in explaining sustained per capita growth but more in the inter-relation between global warming and economic growth, this model issufficiently elaborate.
Concerning emissions of GHGs, we now make a slightly differentassumption. We assume that these are a byproduct of capital used inproduction and expressed in CO2 equivalents. So emissions are a func-tion of per capita capital relative to per capita abatement activities. Thisimplies that a higher capital stock goes along with higher emissions fora given level of abatement spending. It should also be mentioned thatthe emission of GHGs does not affect utility and production directly,but only indirectly by affecting the climate of the Earth, which leadsto a higher surface temperature and more extreme weather situations.Formally, emissions are described by
E =(a KB
)γ
, (11.4)
with γ > 0 and a > 0 constants. The parameter a can be interpretedas a technology index describing how polluting a given technology is.For large values of a a given stock of capital (and abatement) goes alongwith high emissions, implying a relatively polluting technology andvice versa.
The government in our economy is modeled very simply. The gov-ernment’s task is to correct the market failure caused by the negative
3 There exist some contributions that model abatement as a public good. See Ligthart andvan der Ploeg (1994) or Nielsen et al. (1995) and part I.4 With gross return we mean the return to capital before tax and for the temperature equalto the preindustrial level.

A Model with Optimizing Agents 91
environmental externality.5 The revenue of the government is usedfor nonproductive public spending so that it does not affect theconsumption-investment decision.
We also point out that we only consider an emission tax and not otherenvironmental policies, such as tradeable permits. We do this becausewe consider a representative agent. We do not have multiple actors inthis chapter who can trade permits. Therefore, we consider the emissiontax as the regulatory instrument. However, we are aware that undercertain more realistic scenarios, permits may be superior to taxation asan environmental policy measure. Permits might become important, inparticular when it is difficult for the government to evaluate marginalcosts and benefits of abatement so that the effects of an environmentaltax are difficult to evaluate. In this case, permits that limit the quantityof total emissions are preferable.6
The individual’s optimization problem can be written as
maxC,A
∫ ∞
0e−ρtL0entU(C,D1(T − To))dt, (11.5)
subject to (11.1), (11.2), (11.3), and (11.4). ρ in (11.5) is the subjective dis-count rate; L0 is labor supply at time t = 0, which we normalize to unityand grows at constant rate n. Note that in the competitive economy theindividual takes into account neither the negative externality of capital,the emission of GHGs, nor the positive externalities, that is, the spillovereffects.
To find the optimal solution, we form the current-value Hamiltonian,which is
H(·) = (CD1(T − To))1−σ / (1 − σ) + λ1((1 − τ)AKαK1−αD2(T − To)
− C − A− τEL−1aγKγB−γ − (δ + n)K), (11.6)
with λ1 the shadow price of K. Note that we used E = aγKγB−γ .The necessary optimality conditions are given by
∂H(·)∂C
= C−σD1−σ1 − λ1 = 0, (11.7)
∂H(·)∂B
= τEL−1aγKγγB−γ−1 − 1 = 0, (11.8)
λ1 = (ρ + δ)λ1 − λ1((1 − τ)AαD2(·) − (τE/LK) γ aγ KγB−γ
).
(11.9)
5 How the government has to take into account the positive externality is studied insection 5.6 For an extensive treatment of permits and their implementation problems when usedas regulator instruments to correct for market failure, see Chichilnisky (2004).

92 Global Warming and Economic Growth
In (11.9) equilibrium K = K holds. Further, the limiting transversalitycondition limt→∞ e−(ρ+n)tλ1K = 0 must hold.
Using (11.7) and (11.9) we can derive a differential equation givingthe growth rate of per capita consumption. This equation is obtained as
CC
= −ρ + δ
σ+ α
σ(1 − τ)AD2(·) − γ
σ
τE
LKaγKγB−γ + 1 − σ
σ
D′1(·)
D1(·) T,
(11.10)
where D′1(·) stands for the derivative of D1(·) with respect to T.
Combining (11.8) and (11.4) yields
E =( τE
LK
)−γ/(1+γ)
aγ/(1+γ) γ−γ/(1+γ). (11.11)
Using (8.5) and (8.6) from chapter 8 with the numerical parametervalues introduced and the equations derived in this section, the com-petitive economy is completely described by the following differentialequations
T ch = 71.7935 − 5.6710−8(19.95/109)T4 + 6.3β1 (1 − ξ) lnMMo
,
T(0) = T0 (11.12)
M = β2
( τE
LK
)−γ/(1+γ)
aγ/(1+γ) γ−γ/(1+γ)µM,
−M(0) = M0, (11.13)
CC
= −ρ + δ
σ+ α
σ(1 − τ)AD2(·) − γ
σ
( τE
LK
)1/(1+γ)
× aγ/(1+γ)γ−γ/(1+γ) + 1 − σ
σ
D′1(·)
D1(·) T, (11.14)
KK
= AD2(T − T0) (1 − τ) −( τE
LK
)1/(1+γ)
aγ/(1+γ) γ−γ/(1+γ)(1 + γ)
− CK
− (δ + n), K(0) = K0, (11.15)
where C(0) can be chosen by society.
11.1.2 Analytical Results
Before we study comparative static properties of our model on the BGP,we analyze its dynamics. Again, a BGP is defined as a path on whichvariables grow at the same rate and GHGs as well as the average surface

A Model with Optimizing Agents 93
temperature are constant. The next proposition shows that there existsa unique BGP for this economy under a slight additional assumption.
Proposition 19 For the competitive model economy there exists a uniqueBGP for a constant value of τE/LK that is a saddle point with one positiveand two negative real eigenvalues.
Proof : To show uniqueness of the steady state we solve (11.12) = 0,(11.13) = 0, and (11.14) = (11.15) with respect to T, M, and c ≡ C/K.Setting (11.12) = 0 gives
T1,2 = ±99.0775 (71.7935 + 6.3 β1 (1 − ξ) ln(M/Mo))1/4
T3,4 = ±99.0775√−1 (71.7935 + 6.3 β1 (1 − ξ) ln(M/Mo))
1/4.
Clearly T3,4 are not feasible. Further, because M ≥ Mo only the pos-itive solution of T1,2 is feasible. Uniqueness of M and c on the BGPis immediately seen.7 To study the local dynamics we note that theeconomy around the BGP is described by (11.12), (11.13), and c =c (C/C − K/K). The Jacobian matrix J corresponding to this dynamicsystem is obtained as
J =
−4 (5.67 10−8) (19.95/109)(T�)3 c−1h 6.3 β1 (1 − ξ) (M�)−1 c−1
h 0
0 −µ 0
a311−σσ
D′1(·)D1
c� 6.3 β1 (1 − ξ)(M�)−1 c−1h c�
,
with � denoting steady-state values and
a31 = c�(
(1 − τ)AD′2(·)
(α
σ− 1)
+ 1 − σ
σ
×(D′′
1(·)D1(·) −D′1(·)2
D1(·)2 T + ∂ T∂ T
D′1(·)
D1(·)
)).
The eigenvalues of J are given by
e1 = −4(5.67 10−8)(19.95/109) (T�)3 c−1h , e2 = −µ and e3 = c�.
Thus the proposition is proved. �
Proposition 19 shows that there exists a two-dimensional stable man-ifold. Solutions starting on that manifold converge to the BGP in the
7 We neglect the economically meaningless steady state c� = 0.

94 Global Warming and Economic Growth
long run while all other solutions diverge. Since T(0), M(0), and K(0)
are given, the value for C(0) must be chosen such that c(0) ≡ C(0)/K(0)
lies on the stable manifold. Further, it cannot be excluded that the BGPgoes along with a negative growth rate because the sign of the balancedgrowth rate depends on the concrete numerical values of the parame-ters. The question of whether there exists a BGP with a positive growthrate, that is, a nondegenerate BGP, for a certain parameter constellationis addressed in the next section. Here we make the assumption that anondegenerate BGP exists.
An important aspect is that on a BGP M is constant, implying thatemissions of GHGs are constant, too. In a growing economy, however,this is only possible if abatement activities rise with the same rate as thecapital stock. Because abatement activities are set by private agents tosatisfy (11.8), the government has to raise the emission tax in such a waythat the ratio τE/LK is constant. This implies that the tax on the emissionmust rise with the same rate as the aggregate capital stock LK. However,note that this only holds for a given relation between the ratio K/B andemissions. So technical progress, generating a less polluting technology,which implies that a given capital stock K causes less emissions, wouldchange this outcome. In our framework this would be modeled by adecrease in a. This would affect the value of τE. In the following we donot go into the details of this aspect but analyze our model for constantparameter values and assume that the government keeps the ratio τE/LKconstant.
In a next step we analyze how the balanced growth rate, which wedenote by g and which is given by (11.14) with T = 0, reacts to changesin the production tax rate τ and to different values of the ratio τE/LK. Todo so, we differentiate g with respect to τ. This gives
∂g∂τ
= A(α
σ
) ((1 − τ)D′
2(·)∂T�
∂τ−D2(·)
),
with T� denoting the surface temperature on the BGP. From (11.12) and(11.13) it is immediately seen that ∂T�/∂τ = 0, so that a higher tax rateon production unequivocally lowers the balanced growth rate.
This does not hold for variations of the emission tax. Differentiatingg with respect to (τE/LK) yields
∂g∂(τE/LK)
= A(α
σ
)(1 − τ)D′
2(·)∂T�
∂(τE/LK)− γ
σ(1 + γ)E, (11.16)
with E given by (11.11). To get an idea about the sign of this expression,we need to know the sign of ∂T�/∂(τE/LK). ∂T�/∂(τE/LK) is obtained bysolving (11.12) with respect toT�, insertingM� obtained from (11.13) = 0,and then differentiating with respect to (τE/LK). It is immediately seen

A Model with Optimizing Agents 95
that this derivative is negative. Because T ≥ To, which holds on a BGPdue to M ≥ Mo, the derivative of D2(·) is negative so that the first partof the foregoing expression is positive.
With these considerations we can state that this derivative showsthat an increase in the emission tax may raise or lower the balancedgrowth rate. This holds because there are two counteracting forces: onone hand, a higher emission tax reduces the net marginal product ofprivate capital, thus reducing the balanced growth rate. On the otherhand, a higher emission tax reduces the average surface temperatureand, as a consequence, the damage resulting from deviations of theactual temperature from its preindustrial level. This tends to raise thenet marginal product of private capital and the incentive to invest. Sowe can state that a higher tax on GHG emissions may yield a win-winsituation, or a double dividend, by both raising the balanced growthrate and reducing GHG emissions. It should also be mentioned that thedirect negative effect of global warming as to utility does not affect thisoutcome. This is easily seen from (11.11) and (11.12) withM� determinedby (11.13) = 0.
These considerations suggest that there exists a growth-maximizingvalue for the emission tax ratio. This implies that a so-called doubledividend may exist: a higher emissions tax leads to both less emissionsand higher growth and, as a consequence, to higher welfare.
This general result is not too surprising because our model can beseen as a special variant of a more general model where emissions raisea stock of pollutants, which negatively affects utility and productivityin an economy. For this general class it is known that a double divi-dend may exist. However, our goal is not only to state that such anoutcome is feasible but to derive more concrete results for the problemof global warming where insights from physics are used. We intendto analyze our model for parameter values that are considered reason-able and study growth and welfare effects of different emissions taxratios.
To study these questions, it is necessary to concretely specify the twodamage functions D1(T − To) and D2(T − To) and resort to numericalexamples. This is done next.
NUMERICAL EXAMPLES
We analyze how the growth rate and welfare react to variations inthe emission tax ratio. We do this for the economy on the BGP usingnumerical examples, and we start this section with a description of theparameter values employed in our numerical analysis.
We consider one time period to comprise one year. The discount rateis set to ρ = 0.03, the population growth rate is assumed to be n = 0.02,and the depreciation rate of capital is δ = 0.075. The preindustrial level

96 Global Warming and Economic Growth
of GHGs is normalized to one, Mo = 1. γ , β1, and ξ are set to γ = 1,β1 = 1.1, and ξ = 0.3 (for the latter two, see the discussion in chapter 8).The tax rate on output is τ = 0.1, and the capital share is α = 0.45. Thisvalue seems high. However, if capital is considered in a broad sense—meaning that it also comprises human capital—this value is reasonable.8
A is set to A = 0.35, implying that the social gross marginal return tocapital is 35 percent for T = To.
As for τE/LK, we consider the values τE/LK = 0.005, 0.01, 0.015. Forexample, in Germany the ratio of tax on mineral oil to private grosscapital (excluding residential capital) was 0.0037 (0.0068) in 1999 (seeStatistisches Bundesamt 2000, pp. 510, 639). a is set to a = 1.65 10−3 sothat a doubling of GHGs implies a rise in the average surface tempera-ture of about 3.3 ◦C for τE/LK = 0.01. We also consider the lower valuesτE/LK = 0.0005, 0.001, 0.0015.9 As for the inverse of the intertemporalelasticity of substitution of consumption, we consider the values σ = 1.1and σ = 2.
An important role is played by the damage functionsD1(·) andD2(·).These are the same as in equation (9.5). ForD1(·) we assume the function
D1(·) = (a1 (T − To)2 + 1)−ϕ, (11.17)
with a1 > 0, ϕ > 0. D2(·) is given by
D2(·) = (a2 (T − To)2 + 1)−φ, (11.18)
with a2 > 0, φ > 0.For the numerical values of the parameters in (11.17) we assume a1 =
0.035 and ϕ = 0.035, which are left unchanged in the examples exceptfor table 11.4. These values imply that a rise of the surface temperatureby 1 (2, 3) degree(s) implies a decrease of utility by 0.012 (0.046, 0.096)percent for σ = 1.1. For σ = 2 the decrease is 0.12 (0.46, 0.96) percentfor a temperature increase of 1 (2, 3) degree(s). Setting a1 = 0.07 andϕ = 0.07 gives a decrease in utility of 0.047, 0.17, 0.34 (0.47, 1.74, 3.48)percent for a temperature increase of 1, 2, 3 degrees with σ = 1.1 (σ = 2).
In IPCC (1996), pp. 196–197, an example is given how a monetaryvalue can be attached to a change in the risk of death as a result of aclimate change. The IPCC cites the study by Fankhauser (1995) whoestimates this number to be on average 0.26 percent of world GDP fora doubling of CO2 concentration,10 which corresponds in our model toa temperature increase of about 3.3 ◦C. Note that there are other effectsthat have an impact on individual’s utility, like an increase in extreme
8 The choice of α does not affect the qualitative results, only the magnitude of endogenousvariables like the balanced growth rate for example.9 To get temperature increases for a doubling of GHGs in line with IPCC calculations, weset a = 1.65 10−4 in this case.10 This holds for the economy in steady state.

A Model with Optimizing Agents 97
Table 11.1 Varying the Emission Tax between 0.005 and 0.015 withm2 = 0.025, φ = 0.025.
τE/LK σ T � M � g W B �/K �
0.005 1.1 293.3 2.8 0.0293 −388.612 2.87 10−3
0.005 2 293.3 2.8 0.0161 −3.659 10−2 2.87 10−3
0.01 1.1 291.7 1.99 0.0289 −389.291 4.06 10−3
0.01 2 291.7 1.99 0.0159 −3.656 10−2 4.06 10−3
0.015 1.1 290.7 1.6 0.0285 −390.615 4.97 10−3
0.015 2 290.7 1.6 0.0157 −3.686 10−2 4.97 10−3
weather events, for example, so that different values may be plausible,too. Furthermore, it should also be kept in mind that empirical estimatesfor damages are necessarily uncertain, as already mentioned. This holdsin particular for the direct effect of global warming concerning people’sutility.
As far as the numerical values of a2 and φ, we consider the cases(a2 = 0.025, φ = 0.025), (a2 = 0.035, φ = 0.035), and (a2 = 0.05, φ =0.05). The combination (a2 = 0.025, φ = 0.025) implies that an increaseof the surface temperature by 1 (2, 3) degree(s) leads to a decrease ofaggregate production by 0.06 (0.2, 0.5) percent. With (a2 = 0.05, φ =0.05) an increase of the surface temperature by 1 (2, 3) degree(s) leads toa decrease of aggregate production by 0.2 (0.9, 1.8) percent. Comparingthese values with the estimates published in IPCC (1996), we see thatmost of the values we choose tend to be within the range of that study.
In the following tables we report the results of our numerical studies.These studies compare different scenarios where it is assumed that theexogenous variables, that is, τE/LK and σ, take their respective values forall t ∈ [0, ∞) and the economy immediately jumps to its BGP. Table 11.1shows the effects of different ratios τE/LK where the � denotes valueson the BGP. g is the balanced growth rate given by (11.14) with T = 0and W denotes welfare. W is given by
W =∫ ∞
0e−(ρ−n)tU(C(t),D1(T � − To))dt,
with U(·) given by (11.1) and C(t) = C � egt. C � is determined endoge-nously by (11.15) such that K/K = g holds for all t ∈ [0, ∞). As toK0 = K � we set K0 = 5500, which is about the capital stock in Germany(in billion euros) in 2000 (see Institut der Deutschen Wirtschaft 2003).11
11 The numerical value of K0 does not affect the qualitative outcome, only the absolutevalue of welfare W .

98 Global Warming and Economic Growth
Table 11.2 Varying the Emission Tax between 0.005 and 0.015 withm2 = 0.05, φ = 0.05.
τE/LK σ T � M � g W B �/K �
0.005 1.1 293.3 2.8 0.0258 −399.396 2.87 10−3
0.005 2 293.3 2.8 0.0142 −3.95 10−2 2.87 10−3
0.01 1.1 291.7 1.99 0.0269 −395.408 4.06 10−3
0.01 2 291.7 1.99 0.0148 −3.817 10−2 4.06 10−3
0.015 1.1 290.7 1.6 0.0273 −394.099 4.97 10−3
0.015 2 290.7 1.6 0.015 −3.778 10−2 4.97 10−3
We also report the steady-state ratio of abatement activities to capital,B �/K �.
Table 11.1 shows that an increase in the emission tax reduces thebalanced growth rate independent of the value of σ. However, the valueof σ affects welfare. For σ = 1.1 welfare decreases as a consequenceof the lower balanced growth rate. For σ = 2, welfare first rises withan increase in the emission tax rate, although the balanced growth ratedeclines. In this case, the negative effect of a lower balanced growth rateon welfare is dominated by the positive direct welfare effect resultingfrom a lower increase in the average surface temperature. If the emissiontax rate is further increased, welfare declines again. The effect that anincrease in the emission tax rate lowers the balanced growth rate butraises welfare is more likely the larger the direct effect of a temperatureincrease on utility. This is demonstrated in table 11.4 where we setm1 =0.07 and ϕ = 0.07.
In case of σ = 1.1, maximum welfare is obtained for about τE/LK =0.001. However, this implies that the temperature increase is approx-imately 8 ◦C. Here it must be mentioned that the assumption of acontinuous damage function is only justified provided the rise in tem-perature does not exceed a certain threshold. This holds because forhigher increases of the temperature catastrophic events may occur, goingalong with extremely high economic costs that cannot be evaluated. Justone example is the breakdown of the Gulf Stream, which would dramat-ically change the climate in Europe. Therefore, the analysis assuminga damage function only makes sense for temperature increases withincertain bounds. In table 11.2 we consider our model on the BGP for thecase (m2 = 0.05, φ = 0.05).
Table 11.2 shows that an increase in the damage caused by a higheraverage surface temperature yields a double dividend.12 In this case, arise in the emission tax yields both a higher balanced growth rate and a
12 It should be recalled that this effect is independent of the function D1(·), whichdetermines the direct utility effect of global warming.

A Model with Optimizing Agents 99
Table 11.3 Varying the Emission Tax between 0.0005 and0.0015 with a2 = 0.025, φ = 0.025.
τE/LK σ T � M � g W B �/K �
0.0005 1.1 293.3 2.8 0.0316 −381.226 2.87 10−4
0.0005 2 293.3 2.8 0.0174 −3.435 10−2 2.87 10−4
0.001 1.1 291.7 1.99 0.0323 −378.88 4.06 10−4
0.001 2 291.7 1.99 0.0177 −3.343 10−2 4.06 10−4
0.0015 1.1 290.7 1.6 0.0325 −377.85 4.97 10−4
0.0015 2 290.7 1.6 0.0179 −3.303 10−2 4.97 10−4
lower rise in the average global surface temperature independent of theintertemporal elasticity of substitution of consumption. Of course, thisimplies that welfare along the BGP unequivocally rises. The maximumgrowth rate and maximum welfare are obtained for about τE/LK = 0.02,implying M � = 1.4 and T � = 290.1.
We do not show a table for the case (a2 = 0.035, φ = 0.035). Theresults for this case are in between the results obtained in tables 11.1and 11.2. This means that rising τE/LK from 0.005 to 0.01 first raises thebalanced growth rate. Increasing τE/LK further from 0.01 to 0.015 thenreduces the balanced growth rate, which, however, remains larger thanfor τE/LK = 0.005. This holds for both σ = 1.1 and σ = 2. The sameholds as concerns welfare, that is, welfare first rises with an increase inτE/LK and then declines but remains higher than for the initial level ofτE/LK.
Next we consider the case of smaller values for the emission tax ratio.The results for (a2 = 0.025, φ = 0.025) are shown in table 11.3.
Table 11.3 shows that with smaller values for the emission tax ratio,a double dividend is obtained even in the case where the damage causedby a climate change is relatively small. Thus, the smaller the emissiontax ratio, the more likely it is that raising this policy variable both raisesthe long-run growth rate and reduces the increase in the average sur-face temperature. The reason for the outcome in table 11.3 is that thenegative growth effect of an increase in the emission tax is smaller ifthe technology in use is less polluting. This is seen from (11.16) togetherwith (11.11). From an economic point of view, the interpretation is asfollows.
If the emission tax rate is increased, the individual shifts resourcesfrom investment to abatement. The rise in abatement relative to thecapital stock to get a certain decrease in emissions, however, is smallerwhen the technology in use is relatively clean.13 Consequently, the
13 This is seen by differentiating B/K, obtained from (11.8), with respect to τE/LK.

100 Global Warming and Economic Growth
Table 11.4 Varying the Emission Tax between 0.005 and0.015 with m2 = 0.025, φ = 0.025 andm1 = 0.07, ϕ = 0.07.
τE/LK σ T � M � g W A �/K �
0.005 1.1 293.3 2.8 0.0322 −390.476 2.87 10−3
0.005 2 293.3 2.8 0.0161 −3.839 10−2 2.87 10−3
0.01 1.1 293.3 1.99 0.0318 −390.395 4.06 10−3
0.01 2 291.7 1.99 0.0159 −3.761 10−2 4.06 10−3
0.015 1.1 290.7 1.6 0.0313 −391.262 4.97 10−3
0.015 2 290.7 1.6 0.0157 −3.748 10−2 4.97 10−3
negative growth effect is smaller compared to a situation with a morepolluting technology. The balanced growth rate, is maximized for aboutτE/LK= 0.003. Of course, the double dividend is also obtained for(a2 = 0.035, φ = 0.035) and (a2 = 0.05, φ = 0.05). In the latter cases,the effects are larger in magnitude compared to those in table 11.3.
In table 11.4 we show that with a higher direct damage of a rise intemperature concerning utility, an increase in the emission tax reducesthe balanced growth rate but leads to higher welfare. This holds forσ = 2 but for σ = 1.1 only when τE/LK is increased from 0.005 to 0.01.In the latter case, raising τE/LK further reduces welfare. Together withtable 11.1, this shows that a rise in welfare going along with a smallergrowth rate is the more likely the smaller the intertemporal elasticityof substitution of consumption 1/σ. The reason for that outcome is thatwith a smaller intertemporal elasticity of substitution the individual isless willing to shift utility benefits into the future. Therefore, he prefersa higher utility today, resulting from a smaller temperature increase, toa higher growth rate of consumption, which would yield utility only inthe future.
In next section we present and analyze the social optimum andcompare the outcome with the competitive model economy.
11.2 THE SOCIAL OPTIMUM
In formulating the optimization problem, a social planner takes intoaccount both the positive and negative externalities of capital. Conse-quently, for the social planner the resource constraint is given by
K = AKD2(T − To) − C − B− (δ + n)K,K(0) = K0. (11.19)

A Model with Optimizing Agents 101
The optimization problem is14
maxC,A
∫ ∞
0e−ρtL0ent
(lnC + lnD1(T − To)
)dt, (11.20)
subject to (11.19), (8.5), (8.6), and (11.4), where D1(·) and D2(·) are againgiven by (11.17) and (11.18).
To find necessary optimality conditions we formulate the current-value Hamiltonian, which is
H(·) = (lnC + lnD1(T − To))+ λ2(AKD2(T − To) − C − B− (δ + n)K)
+ λ3(β2 aγKγB−γ − µM
)+ λ4 (ch)−1 ·(
1367.54
0.21
−(5.67 10−8)(19.95/109)T4 + β1 (1 − ξ) 6.3 lnMMo
), (11.21)
with λi, i = 2, 3, 4, the shadow prices of K, M, and T respectively andE = aγKγA−γ . Note that λ2 is positive while λ3 and λ4 are negative.
The necessary optimality conditions are obtained as
∂H(·)∂C
= C−1 − λ2 = 0, (11.22)
∂H(·)∂B
= −λ3 β2 aγ Kγ γB−γ−1 − λ2 = 0, (11.23)
λ2 = (ρ + δ) λ2 − λ2 AD2(·) − λ3 β2 γ aγ Kγ−1 B−γ , (11.24)
λ3 = (ρ − n) λ3 + λ3 µ − λ4 (1 − ξ) β1 6.3 c−1h M−1, (11.25)
λ4 = (ρ − n) λ4 − D′1(·)D1
− λ2AKD′2(·) + λ4
((19.95/109) 4T3)(5.67 108) ch
.
(11.26)
Further, the limiting transversality condition limt→∞ e−(ρ+n)t(λ2K +λ3T + λ4M) = 0 must hold.
Comparing the optimality conditions of the competitive economywith that of the social planner demonstrates how the government hasto set taxes to replicate the social optimum. The next proposition givesthe result.
14 For the social optimum we only study the case σ = 1.

102 Global Warming and Economic Growth
Proposition 20 The competitive model economy replicates the socialoptimum if τE/LK and τ are set according to
τE
LK= β2
−λ3
λ2K, τ = 1 − α−1.
Proof : The first condition is obtained by setting (11.8) = (11.23). Thesecond is obtained by setting the growth rate of per capita consumptionin the competitive economy equal to that of the social optimum. �
This proposition shows that the emission tax per aggregate capitalhas to be set such that it equals the effective price of emissions, −λ3β2,divided by the shadow price of capital times per capita capital, λ2K,for all t ∈ [0, ∞). This makes the representative household internalizethe negative externality associated with capital. Furthermore, it can beseen that as usual, the government has to pay an investment subsidy(or negative production tax) of τ = 1 − α−1. The latter is to make therepresentative individual take into account the positive spillover effectsof capital. The subsidy is financed by the revenue of the emission taxand/or by a nondistortionary tax, like a consumption tax, or a lump-sum tax.
From (11.22) and (11.23) we get
BK
= (c (−λ3) β2 γ aγ)1/(1+γ) , (11.27)
with c≡C/K. Using (11.27), (11.22), and (11.24), the social optimum iscompletely described by the following system of autonomous differen-tial equations
C = C(AD2(·) − (ρ + δ) − ((C/K) (−λ3) β2 γ aγ
)1/(1+γ))
, (11.28)
K = K(AD2(·) − C
K− ((C/K) (−λ3) β2 γ aγ
)1/(1+γ) − (δ + n))
,
(11.29)
M = (C/K)−γ/(1+γ) (−λ3)−γ/(1+γ) β
1/(1+γ)
2 γ−γ/(1+γ) aγ/(1+γ) − µM,(11.30)
T = c−1h
(71.7935 − 5.67 10−8(19.95/109)T4+ 6.3β1 (1 − ξ) ln
MMo
),
(11.31)
λ3 = (ρ − n) λ3 + λ3 µ − λ4 (1 − ξ) β1 6.3 c−1h M−1, (11.32)
λ4 = (ρ − n)λ4 − D′1(·)D1
− AKCD′
2(·) + λ4
(5.6710−8(19.95/109)c−1
h 4T3)
,
(11.33)

A Model with Optimizing Agents 103
with K(0) = K0, M(0) = M0, and T(0) = T0.As for the competitive economy, a BGP is given for variables T �,
M �, λ�3 , λ�
4 , and c � such that T = M = 0 and C/C = K/K holds, withM ≥ Mo. It should be noted that T = M = 0 implies λ3 = λ4 = 0.Proposition 21 gives sufficient conditions for a unique BGP to exist inthe social optimum.
Proposition 21 Assume that D′′i (·) < 0, i = 1, 2, and γ < (4/3) κ(1)T4
o ,with κ(1) = 5.67 10−8(19.95/109)/(6.3β1 (1 − ξ)). Then there exists aunique BGP for the social optimum.
Proof : To prove the proposition we compute M � from (11.30) = 0 as
M � = (−λ3)−γ/(1+γ) (c �)−γ/(1+γ) β
1/(1+γ)
2 γ−γ/(1+γ) aγ/(1+γ)/µ,
with c � = ρ −n from C/C = K/K. InsertingM � in λ3 and solving λ3 = 0with respect to λ4 yields
λ�4 = −κ(2)(−λ3)
1/(1+γ),
with
κ(2) = ρ − n+ µ
(1 − ξ) β1 6.3 c−1h (c �)γ/(1+γ) β
−1/(1+γ)
2 γγ/(1+γ) a−γ/(1+γ) µ> 0.
Inserting λ�4 andM � in λ4 and T, respectively, and setting the latter two
equations equal to zero leads to
(−λ3)1/(1+γ) = −D′
1/D1 −D′2 A/c
κ(3) + κ(4)T3 , (11.34)
(−λ3)1/(1+γ) =
(κ(5)
e(−71.7935+5.67 10−8(19.95/109)T4)/(6.3 β1 (1−ξ))
)1/γ
, (11.35)
with
κ(3) = (ρ − n) κ(2) > 0 ,
κ(4) = 5.67 10−8(19.95/109) c−1h 4 κ(2) > 0 ,
κ(5) = c−γ/(1+γ) β1/(1+γ)
2 γ−γ/(1+γ) aγ/(1+γ)/(µM0) > 0.
Setting the right-hand side in (11.34) equal to the right-hand side in(11.35) gives
−D′1/D1 −D′
2 A/cκ(5)1/γ
= κ(3) + κ(4)T3
e(κ(6)+κ(1)T4)/γ, (11.36)

104 Global Warming and Economic Growth
with
κ(6) = −71.7935/(6.3 β1 (1 − ξ)),
κ(1) = 5.67 10−8(19.95/109)/(6.3 β1 (1 − ξ)).
For T = To the right-hand side of (11.36) is zero and the left-hand side isstrictly positive. Further, the derivative of the left-hand side of (11.36) isstrictly positive for D′′
i (·) < 0, i = 1, 2. The derivative of the right-handside is given by
e(−κ(6)−κ(1)T4)/γ 3T2 κ(4)
(1 − 4 κ(3) κ(1)T
3 γ κ(4)− 4
3 γκ(1)T4
).
Using κ(1) = 5.67 10−8(19.95/109)/(6.3 β1 (1 − ξ)) shows that γ <
(4/3) κ(1)T4o is a sufficient condition for the derivative to be negative
for T ≥ To. Thus, the proposition is proved. �
Note that this proposition gives conditions that are sufficient but notnecessary for a unique BGP so that a unique BGP may exist even if theyare not fulfilled. The first condition states that the damage functionsare strictly concave.15 The second gives a condition as to the structuralparameter γ , which determines the level of emissions in the economy.Inserting β1 = 1.1, ξ = 0.3 (see chapter 8), and To = 288.4 gives γ <
19.73, which does not impose a severe limitation. For our numericalexamples the existence of a unique BGP is always assured in the socialoptimum.
As for the local dynamics, it is difficult to derive concrete results forthe analytical model. This is due, among other things, to the determinantof the Jacobian matrix at the steady state, which may be positive ornegative. Nevertheless, something can also be said with respect to theanalytical model. This is the contents of proposition 22.
Proposition 22 Assume there exists a unique BGP for the social optimum.Then there exists at most a two-dimensional stable manifold. Further, aHopfbifurcation can be excluded.
Proof : To prove the proposition we first recall that the dynamics aroundthe BGP are described by the dynamic system consisting of the equationsc/c = C/C − K/K = n − ρ + c, (11.30), (11.31), (11.32), and (11.33).Because c � = 0 can be excluded because c is raised to a negative powerin (11.30), we consider the differential equation for c in the rate of growth.Equation c/c shows thatC(0) must be chosen such that c takes its steady-state value at t = 0, meaning that c is a constant. The dynamics of the
15 This implies that the damage caused by a higher temperature is a convex function ofthe temperature.

A Model with Optimizing Agents 105
other variables then are described by (11.30), (11.31), (11.32), and (11.33).The Jacobian matrix J is given by
J =
−µ 0
aγ/(1+γ) β21/(1+γ) γ1−γ/(1+γ)(−λ3
�)−γ/(1+γ)
(−λ3�) (c �)γ /(1+γ) (1+γ)
0
6.3 β1 (1−ξ)ch M �
5.67 10−8 ·19.95·4 (T �)3
(−1) 109 ch0 0
6.3 β1 (1−ξ) λ �4
ch (M �)2 0 µ − n+ ρ−6.3 β1 (1−ξ)
ch M �
0 a42 0 −n+ ρ+5.67 10−8 ·19.95·4 (T �)3
109 ch
,
with
a42 = 12 · 5.67 10−8 · 19.95 λ�4 (T �)2
109 ch+ 2 a1 ϕ
1 + a1 (T � − To)2
+2 a2 ϕA
(1 + a2
(T � − To
)2)−1−φ
c �− 4 a2
1 ϕ(T � − To
)2(
1 + a1 (T � − To)2)2
+4 a2
2 (−1 − φ) φA(
1 + a2(T � − To
)2)−2−φ (T � − To
)2c �
.
The eigenvalues of J are calculated according to
e1,2,3,4 = ρ − n2
±
√√√√(ρ − n2
)2
− K1
2±√(
K1
2
)2
− det J,
with K1 defined as
K1 =∣∣∣∣a11 a13a31 a33
∣∣∣∣+∣∣∣∣a22 a24a42 a44
∣∣∣∣+ 2∣∣∣∣a12 a14a32 a34
∣∣∣∣ ,with aij the element of the ith column and jth row of the matrix J (seeDockner and Feichtinger 1991). It is immediately seen that K1 < 0 holdsin our model. In Dockner and Feichtinger (1991) it is shown thatK1 > 0 isa necessary condition for a Hopf bifurcation, which leads to limit cycles.Consequently, a Hopf bifurcation can be excluded in the social optimum.Furthermore, the eigenvalues are symmetrical around (ρ − n)/2 so that

106 Global Warming and Economic Growth
Table 11.5 Steady-State Values and Eigenvalues in the SocialOptimum for a = 1.65 10−3, a1 = 0.035, and ϕ = 0.035.
a2 φ T � M � E � Eigenvalues
0.025 0.025 291.1 1.77 0.362 0.005 ± 6.84828, 0.005 ± 0.107673
0.05 0.05 289.3 1.2 0.246 0.005 ± 6.71707, 0.005 ± 0.179849
Table 11.6 Steady-State Values and Eigenvalues in the SocialOptimum for a = 1.65 10−3, m1 = 0.07 and ϕ = 0.07.
m2 φ T � M � E � Eigenvalues
0.025 0.025 290.9 1.68 0.344 0.005 ± 6.83093, 0.005 ± 0.110683
0.05 0.05 289.3 1.2 0.244 0.005 ± 6.71475, 0.005 ± 0.182964
there are at most two negative eigenvalues or two eigenvalues with neg-ative real parts. This depends on the signs of det J and of K1. However,we cannot derive more concrete results for this analytical model. �
This proposition shows that the BGP in the social optimum is a sad-dle point, and a Hopf bifurcation generating persistent limit cycles isnot possible. However, we cannot answer whether the eigenvalues arereal or complex conjugate. Therefore, to gain further insight in the struc-ture of the social optimum, we compute steady-state values16 and theeigenvalues of the Jacobian matrix at the steady state for the numericalexamples in 11.1. The results for the case a = 1.65 10−3 and a1 = 0.035and ϕ = 0.035 are shown in table 11.5.
It can be seen that the higher the damage caused by a tempera-ture increase with respect to aggregate output, the smaller the optimalincrease in GHG emissions and in the average global surface tempera-ture. Note that the smaller increase in GHGs is due to higher abatementspending, B �, relative to gross emissions, aK �. The same outcome isobtained when the direct damage concerning utility, caused by a highersurface temperature increase, is set higher. This is seen in table 11.6,where we set m1 = 0.07 and ϕ = 0.07.
In table 11.7, finally, we look at the optimal steady state values ofGHG emissions and of the temperature in an economy with a less pol-luting technology, that is, with a lower value of a. It is seen that theemissions are lower compared to the situation with a more pollutingtechnology shown in table 11.6, and consequently, the optimal levels ofGHG concentrations and of the temperature increase in steady state arelower.
16 The steady-state values were computed using Newton’s method.

A Model with Optimizing Agents 107
Table 11.7 Steady-State Values and Eigenvalues in the SocialOptimum for a = 1.65 10−4, m1 = 0.035, and ϕ = 0.035.
m2 φ T � M � E � Eigenvalues
0.025 0.025 288.8 1.08 0.22 0.005 ± 6.67681, 0.005 ± 0.277638
0.05 0.05 288.5 1.02 0.208 0.005 ± 6.64358, 0.005 ± 0.52092
The analysis of the social optimum demonstrated that the increase intemperature is smaller the higher the damage caused by the temperatureincrease. This holds because abatement spending is larger relative togross emissions for high damages. This result is not too surprising.
Further, our analysis shows that the less polluting the technology, thesmaller are emissions after abatement in steady state, and consequently,the smaller the temperature increase. This implies that economies withclean technologies should emit less compared to economies with lessclean technologies.
The intuition for this result is as follows. The economy receives util-ity from consumption and disutility from the temperature increase.The latter acts both directly by affecting utility and indirectly byreducing aggregate production. If the technology in use is rela-tively clean, it is cheaper to avoid the increase in temperature com-pared to economies with relatively polluting technologies. Therefore,economies with a less polluting technology have a cost advantagecompared to other economies and should have smaller temperatureincreases.
It should be repeated that the result derived here holds only ifdeviations of the temperature form the preindustrial level affect theproductivity of the economy. In addition, it is only relevant for thesocial optimum. This implies that this result is not necessarily truefor the second-best solution, where the government sets the tax ratestaking into account the individual’s optimal decisions. If the tax ratesare set such that the market economy replicates the social optimum,as stated in proposition 20, this result also holds for the marketeconomy.
11.3 MODELING NONLINEAR FEEDBACK EFFECTSOF THE RISE IN TEMPERATURE
In the last section, we saw that both the competitive economy and thesocial optimum are characterized by a unique BGB that is saddle pointstable. Here we want to study the dynamics of the model when we allowfor a nonlinear feedback effect of the temperature increase as in Greinerand Semmler (2005).

108 Global Warming and Economic Growth
In chapter 8 we introduced the basic energy balance model, accordingto which the change in the average surface temperature on Earth isgiven by
dT(t)dt
ch ≡ T(t) ch = SE −H(t) − FN(t), T(0) = T0. (11.37)
Furthermore, the difference SE − H can be written as SE − H = Q(1 −α1)α2/4, withQ = 1367.5Wm−2 the solar constant, α1 = 0.3 the planetaryalbedo, determining how much of the incoming energy is reflected bythe atmosphere, and α2 (α2 = 0.3) takes into account that a part of theenergy is absorbed by the surface of the Earth. Both α1 and α2 wereassumed to be constant.
However, according to Henderson-Sellers and McGuffie (1987)and Schmitz (1991) the albedo of the Earth is a function that neg-atively depends on the temperature on Earth. This holds becausedeviations from the equilibrium average surface temperature havefeedback effects that affect the reflection of incoming energy. Exam-ples of such feedback effects are the ice-albedo feedback mechanismand the water vapor “greenhouse” effect (see Henderson-Sellers andMcGuffie 1987, chap. 1.4). With higher temperatures a feedback mech-anism occurs, with the areas covered by snow and ice likely to bereduced. This implies that a smaller amount of solar radiation isreflected when the temperature rises, tending to increase the tempera-ture on Earth further. Therefore, Henderson-Sellers and McGuffie (1987,chap. 2.4) and Schmitz (1991, p. 194) propose a function as shown infigure 11.1.
Figure 11.1 shows 1 − α1(T), that part of energy that is not reflectedby Earth. For the average temperature smaller than Tl, the albedo isa constant, then the albedo declines linearly, so that 1 − α1(T) rises,until the temperature reaches Tu, from which point on, the albedois constant again. Here, we like to point out that other feedbackeffects may occur, such as a change in the flux ratio of outgoing toincoming radiative flux, for example. However, we do not take intoaccount these effects because the qualitative result would remain thesame.
With these considerations, the EBM can be rewritten as
T(t) ch = 1367.54
(1 − α1(T)) − 0.95(5.67 10−8)(21/109) T4,
T(0) = T0. (11.38)

A Model with Optimizing Agents 109
Tl Tu
T
1 � a1
Figure 11.1 Albedo as a Function of the Temperature.
According to Roedel (2001), (1 − α1(T)) = 0.21 holds in equilibrium,for T = 0, giving a surface temperature of about 288 K which is about15 ◦C.
Taking into account the emission of GHGs into the atmosphere, theequation can be rewritten as
T(t) ch = 1367.54
(1 − α1(T)) − 0.95(
5.67 10−8)
(21/109)T4
+ β1(1 − ξ) 6.3 lnMMo
,T(0) = T0. (11.39)
11.3.1 The Competitive Economy
In this section we present our economic framework. We start with thedescription of the structure of our economy, which is basically the sameas in the last section.
THE STRUCTURE OF THE ECONOMY
We consider an economy where one homogeneous good is produced.Further, the economy is represented by one individual with householdproduction who maximizes a discounted stream of utility arising from

110 Global Warming and Economic Growth
per capita consumption, C, times the number of household memberssubject to a budget constraint. As to the utility function we assume alogarithmic function U(C) = lnC.17
The individual’s budget constraint in per capita terms is given by(11.2) and (11.3). Concerning emissions of GHGs, we assume that theseare a byproduct of capital used in production and expressed in CO2equivalents, so emissions are a function of per capita capital relative toper capita abatement activities. Formally, emissions are described thesame equation as in the last section, (11.4).
The agent’s optimization problem can be written as
maxC,B
∫ ∞
0e−ρtL0ent lnC dt, (11.40)
subject to (11.2), (11.3), and (11.4). L0 is labor supply at time t = 0, whichwe again normalize to unity and grows at constant rate n. Recall thatin the competitive economy the agents neither take into account thenegative externality of capital, the emission of GHG, nor the positiveexternalities (i.e., the spillover effects).
To find the optimal solution, we form the current-value Hamiltonian,which is
H(·) = lnC + λ1((1 − τ)AKαK1−αD(·) − C − B− τEL−1aγKγB−γ)
− λ1(δ + n)K, (11.41)
with λ1 the shadow price of K. Note that we used E = aγKγB−γ .The necessary optimality conditions are given by
∂H(·)∂C
= C−1 − λ1 = 0, (11.42)
∂H(·)∂B
= τEL−1aγKγγB−γ−1 − 1 = 0, (11.43)
λ1 = (ρ + δ)λ1 − λ1((1 − τ)AαD(·) − (τE/LK) γ aγ KγB−γ
).
(11.44)
In (11.44) we state that in equilibrium K = K holds. Further, the limitingtransversality condition limt→∞ e−(ρ+n)tλ1K = 0 must hold.
Using (11.42) and (11.44) we can derive a differential equation givingthe growth rate of per capita consumption. This equation is obtained as
CC
= −(ρ + δ) + α (1 − τ)AD(·) − γτE
LKaγKγB−γ . (11.45)
17 In this section we do not model direct effects of a rise in the temperature on theindividual’s utility.

A Model with Optimizing Agents 111
Combining (11.43) and (11.4) yields
E =( τE
LK
)−γ/(1+γ)
aγ/(1+γ) γ−γ/(1+γ). (11.46)
Using (11.39) and (8.6), with the numerical parameter values intro-duced and the equations derived in this section, the competitive econ-omy is completely described by the following differential equations:
T(t) ch = 1367.54
(1 − α1(T)) − 0.95(5.67 10−8)(21/109) T4
+ (1 − ξ) 6.3 lnMMo
, T(0) = T0, (11.47)
M = β1
( τE
LK
)−γ/(1+γ)
aγ/(1+γ) γ−γ/(1+γ) − µM,
M(0) = M0, (11.48)
CC
= −(ρ + δ) + α (1 − τ)AD(·) − γ( τE
LK
)1/(1+γ)
× aγ/(1+γ)γ−γ/(1+γ), (11.49)
KK
= (1 − τ)AD(T − T0) −( τE
LK
)1/(1+γ)
aγ/(1+γ) γ−γ/(1+γ)(1 + γ)
− CK
− (δ + n), K(0) = K0, (11.50)
where C(0) can be chosen by society.
THE DYNAMICS OF THE COMPETITIVE ECONOMY
A balanced growth path or steady state is defined as in the last sections,that is, GHGs and the temperature are constant while all economicvariables grow at the same rate.
To study the dynamics of our model, we consider the ratio c ≡ C/K,which is constant on a BGP. Thus, our dynamic system is given by thefollowing differential equations
T(t) =(
1367.54
(1 − α1(T)) − 0.95(5.67 10−8)(21/109) T4
)c−1h
+(
(1 − ξ) 6.3 lnMMo
)c−1h , T(0) = T0, (11.51)

112 Global Warming and Economic Growth
M = β1
( τE
LK
)−γ/(1+γ)
aγ/(1+γ) γ−γ/(1+γ) − µM, M(0) = M0, (11.52)
c = c(n− ρ) − (1 − α)(1 − τ)AD(·) +
( τE
LK
)1/(1+γ)
×aγ/(1+γ)γ−γ/(1+γ))
+ c2, (11.53)
where c(0) can again be chosen freely by society.To study the dynamics of our model we resort to numerical simula-
tion. We start with a recapitulation of the parameter values we employin the numerical analysis.
We consider one time period to comprise one year. The discount rateis set to ρ = 0.03, the population growth rate is assumed to be n = 0.02,and the depreciation rate of capital is δ = 0.075. The preindustrial level ofGHGs is normalized to one (i.e., Mo = 1), and we set γ = 1. The incometax rate is τ = 0.15, and the capital share is α = 0.45. This value seemsto be high. However, if capital is considered in a broad sense (meaningthat it also comprises human capital), this value is reasonable. A is setto A = 0.35, implying that the social gross marginal return to capital is35 percent for T = To.
As to τE/LK we set τE/LK = 0.001, and a is set to a = 1.65·10−4. τE/LKand a determine the ratio of abatement per capital stock, which is givenby B/K = (aτE/LK)0.5. With these values B/K takes the value B/K =4.1 · 10−4. For example, in Germany the ratio of abatement spendingto capital in 2000 was 9.7 · 10−4 (see Institut der Deutschen Wirtschaft2003, tables 2.11 and 8.7). Shortly, we will analyze how different valuesfor τE/LK affect the dynamics of our model.
Concerning the damage function D(·), we assume function (11.18),which we now denote by D(·), that is,
D(·) =(m1 (T − To)2 + 1
)−φ
, (11.54)
withm1 = 0.04 and φ = 0.05. These values imply that a rise of the surfacetemperature by 3 (2, 1) ◦C implies a damage of 1.5 (0.7, 0.2) per-cent. Recall that the IPCC estimates that a doubling of GHGs, whichgoes along with an increase of the global average surface temperaturebetween 1.5 ◦C and 4.5 ◦C, reduces world GDP by 1.5 to 2 percent (seeIPCC 1996, p. 218), so that our choice for the parameters seems justified.
As to the albedo, α1(T), we use a function as shown in figure 11.1.We approximate the function shown in figure 11.1 by a differentiablefunction. More concretely, we use the function
1 − α1(T) = k1
(2�
)ArcTan
(� (T − 293)
2
)+ k2. (11.55)

A Model with Optimizing Agents 113
288 290 292 294 296 298
0.208
0.212
0.214
0.216
0.218
1 � a1
T
Figure 11.2 Albedo as a Smooth Function of the Temperature.
k1 and k2 are parameters that are set to k1 = 5.6 10−3 and k2 = 0.2135.Figure 11.2 shows the function (1 − α1(T)) for these parameter values.
With (11.55) the preindustrial average global surface temperature isabout 287.8 K (for M = Mo) and 1 − α1(·) = 0.2083. For T→ ∞ theexpression 1 − α1(·) converges to 1 − α1(·) = 0.2191, which correspondsto an increase of about 5 percent.
To get insight into our model, we first note that on a BGP the GHG con-centration and the average global surface temperature are completelydetermined by the emission tax rate τE/LK. This holds because this ratiodetermines optimal abatement spending via (11.43). The global surfacetemperature on the BGP, then, gives the ratio of consumption to capitaland the balanced growth rate, g. Solving (11.52) = 0 with respect to Mand inserting the result in (11.51) ≡ dT gives a function as shown infigure 11.3.
One realizes that there are three solutions for dT = 0. Table 11.8 givesthe steady-state values for T � and c � and the balanced growth rate,g, as well as the eigenvalues of the Jacobian matrix corresponding to(11.51)–(11.53).
Table 11.8 shows that the first and third long-run steady states (Iand III) are saddle point stable, while the second is unstable, with theexception of a one-dimensional stable manifold. Thus, there are twopossible long-run steady states to which the economy can converge.The first one implies a temperature increase of about 3.7 ◦C and a bal-anced growth rate of about 2.6 percent; the other BGP corresponds to atemperature increase of about 6.2 ◦C and a balanced growth rate of about

114 Global Warming and Economic Growth
290 291
dT
T292 293 294 295 296
�7.5
–5
�2.5
2.5
5
Figure 11.3 Multiple Steady States in the Long Run.
Table 11.8 Steady-State Values, Balanced GrowthRate, and Eigenvalues for the CompetitiveModel with τE/LK = 0.001.
Steady State T� c � g Eigenvalues
I 291.5 0.1697 2.6% −4.99, 0.17, −0.1
II 293.2 0.167 2.3% 4.76, 0.167, −0.1
III 294 0.1657 2.2% −3.55, 0.166, −0.1
2.2 percent. 1 − α1(·) takes the value 0.2093 for T � = 291.5 and 0.2171for T � = 294, showing that the quantitative decrease in the albedo doesnot have to be large for the occurrence of multiple equilibria. Our resultsuggests that there exists a threshold such that the initial conditionsdetermine whether it is optimal to converge to steady state I or III.
ROBUSTNESS AND COMPARATIVE STATIC RESULTS
The last section demonstrated that there may exist a threshold for thecompetitive economy that determines whether it is optimal to convergeto the long-run equilibrium that corresponds to a relatively small rise inthe temperature or to the one with a large temperature increase. Herewe address the question of how robust this result is with respect tothe emission tax ratio τE/LK. Furthermore, we want to undertake somewelfare considerations for the economy on the BGP.

A Model with Optimizing Agents 115
We also point out that in the very long run, when fossil fuels will beexhausted, the problem of global warming does not exist any longer.However, our approach models an economy where fossil fuels are animportant input factor in the production process. Studying the modelalong the BGP, then, implies that the economy is successful in stabilizingemissions at a constant but higher level and that the convergence speedis sufficiently high. Of course, the BGP is only reached for t → ∞, butnevertheless, the BGP may be a good approximation if the deviationsfrom it are only small.
Varying the emission tax rate τE/LK affects the position of the dTcurve in figure 11.3, thus determining the equilibrium temperature andpossibly the number of equilibria. A rise in τE/LK shifts the dT curvedownward and to the left, implying a decrease of the temperature(s) onthe BGP. Further, for a sufficiently high value of τE/LK, only one equilib-rium exists. For example, raising τE/LK to τE/LK = 0.0011 gives a uniquelong-run BGP with a steady-state temperature of 291.8 K. This equilib-rium is saddle point stable (two negative real eigenvalues). ReducingτE/LK to τE/LK = 0.0008 also gives a unique BGP with a steady-stateequilibrium temperature of 294.8 K. This equilibrium is also saddle pointstable (two negative real eigenvalues). This demonstrates that the gov-ernment choice of the emission tax ratio is crucial in terms of the long-runoutcome. This holds for both the temperature in equilibrium and thedynamics of the system.
Presuming the uniqueness of the steady state, we can concentrate onwelfare considerations. We limit our investigations to the model on theBGP, although this can only be an approximation. Welfare on the BGPis given by
W =∫ ∞
0e−(ρ−n)t ln(c�K�egt)dt, (11.56)
which shows that welfare in steady state positively depends on the con-sumption ratio, c�; on the balanced growth rate, g, which is determinedendogenously; and on K �, which we normalize to one (K� ≡ 1). From(11.49) and (11.53) one realizes that τE/LK has a negative direct effect onc� and on g and a positive indirect effect by reducing the equilibriumsurface temperature, which implies smaller damages. This suggests thatthere exists an inverted U-shaped curve between the emission tax ratioand the growth rate and welfare. To see this more clearly, we calculatethe balanced growth rate, c�, and the average global surface tempera-ture for different values of τE/LK and for different damage functions.The results are shown in table 11.9. As for the damage function, we usethe parameter values from the last section, m1 = 0.04, φ = 0.05, and, inaddition, m1 = 0.03, φ = 0.03. Setting m1 = 0.03 and φ = 0.03 impliesthat a rise of the surface temperature by 3 (2, 1) ◦C implies a damage of0.7 (0.3, 0.09) percent of world GDP.

116 Global Warming and Economic Growth
Table 11.9 Balanced Growth Rate, c �, and T � for DifferentValues of τE/LK with m1 = 0.04, φ = 0.05, andm1 = 0.03, φ = 0.03, Respectively.
m1 = 0.04, φ = 0.05 m1 = 0.03, φ = 0.03
τE/LK g c � T � τE/LK g c � T �
0.0011 0.0260 0.1702 291.2 0.0011 0.0273 0.1718 291.2
0.004 0.0280 0.1728 287.8 0.0035 0.0281 0.1729 288.4
0.0055 0.0277 0.1725 287.0 0.0042 0.0280 0.1728 287.8
First, we can see from table 11.9 that the balanced growth rate, g,and the consumption share, c�, react in the same manner to changes inthe emission tax ratio τE/LK so that maximizing the balanced growthrate also maximizes welfare. Furthermore, table 11.9 confirms that thereexists an inverted U-shaped curve18 between the emission tax ratioand the balanced growth rate and welfare. For the higher damage(m1 = 0.04, φ = 0.05) it is optimal to choose the emission tax rate sothat the temperature remains at its preindustrial level, implying that thedamage is zero. For a lower damage corresponding to the temperatureincrease (m1 = 0.03, φ = 0.03) the balanced growth rate is maximizedfor a value of τE/LK that gives an average surface temperature exceed-ing the preindustrial level. In this case, accepting a deviation from thepreindustrial average global surface temperature has positive growthand welfare effects in the long run.
11.3.2 The Social Planner’s Problem
In formulating the optimization problem, a social planner takes intoaccount both the positive and negative externalities of capital. Conse-quently, for the social planner the resource constraint is given by
K = AKD(T − To) − C − B− (δ + n)K,K(0) = K0. (11.57)
Then the optimization problem is
maxC,B
∫ ∞
0e−ρtL0ent lnC dt, (11.58)
subject to (11.2), (11.3), (11.4), (11.39), and (8.6), whereD(·) is again givenby (11.18).
18 We calculated more values that we, however, do not show here.

A Model with Optimizing Agents 117
To find necessary optimality conditions, we formulate the current-value Hamiltonian, which is
H(·) = lnC + λ2(AKD(T − To) − C − B− (δ + n)K)
+ λ3(β1 aγKγB−γ − µM
)+ λ4 (ch)−1 ·(
1367.54
(1 − α1(T))
−(5.6710−8)(19.95/109)T4 + (1 − ξ)6.3 lnMMo
), (11.59)
with α1(T) given by (11.55). λi, i = 2, 3, 4, are the shadow prices of K,M,and T, respectively, and E = aγKγB−γ . Note that λ2 is positive 2nd λ3and λ4 are negative.
The necessary optimality conditions are obtained as
∂H(·)∂C
= C−1 − λ2 = 0, (11.60)
∂H(·)∂B
= −λ3 β1 aγ Kγ γB−γ−1 − λ2 = 0, (11.61)
λ2 = (ρ + δ) λ2 − λ2 AD(·) − λ3 β1 γ aγ Kγ−1 B−γ , (11.62)
λ3 = (ρ − n) λ3 + λ3 µ − λ4 (1 − ξ) 6.3 c−1h M−1, (11.63)
λ4 = (ρ − n) λ4 − λ2 AKD′(·) + λ4 (ch)−1 341.875 α′1(·)
+ λ4
(5.67 10−8(19.95/109) 4T3
)(ch)−1, (11.64)
with α′1 = − k1(1 + 0.25�2(T − 293)2)−1. Furthermore, the limiting
transversality condition limt→∞ e−(ρ+n)t(λ2K + λ3T + λ4M) = 0 musthold.
Comparing the optimality of the competitive economy with that ofthe social planner demonstrates how the government has to set taxesto replicate the social optimum. Setting (3.112) = (3.130) shows thatτE/LK has to be set such that τE/LK = β1(−λ3)/(λ2K) holds. Furthersetting the growth rate of per capita consumption in the competitiveeconomy equal to that of the social optimum gives τ = 1 − α−1, whichis the same result as in the last section.
From (11.60) and (11.61) we get
BK
= (c (−λ3) β1 γ aγ)1/(1+γ) , (11.65)
with c≡C/K. Using (11.65), (11.60), and (11.62) the social opti-mum is completely described by the following system of autonomous

118 Global Warming and Economic Growth
differential equations
C = C(AD(·) − (ρ + δ) − ((C/K) (−λ3) β1 γ aγ
)1/(1+γ))
, (11.66)
K = K(AD(·) − C
K− ((C/K) (−λ3) β1 γ aγ
)1/(1+γ) − (δ + n))
,
K(0) = K0, (11.67)
M = (C/K)−γ/(1+γ) (−λ3)−γ/(1+γ) β
1/(1+γ)
1 γ−γ/(1+γ) aγ/(1+γ) − µM,
M(0) = M0, (11.68)
T = c−1h
(341.875(1 − α1(T)) − 5.67 10−8(19.95/109)T4
+6.3 (1 − ξ) lnMMo
),T(0) = T0, (11.69)
λ3 = (ρ − n) λ3 + λ3 µ − λ4 (1 − ξ) 6.3 c−1h M−1, (11.70)
λ4 = (ρ − n) λ4 − AKCD′(·) + λ4 (ch)−1 341.875 α′
1(·)
+ λ4
(5.67 10−8(19.95/109) c−1
h 4T3)
. (11.71)
As for the competitive economy, a BGP is given for variables T �,M �, λ�3 ,
λ�4 , and c � such that T = M = 0 and C/C = K/K holds, with M ≥ Mo.
It should be noted that T = M = 0 implies λ3 = λ4 = 0.To study the dynamics, we proceed as follows. Because C/C = K/K
holds on the BGP, we get from (11.67) and (11.66) c � = ρ − n. Next, weset M = 0, givingM = M(λ3, ·). InsertingM = M(λ3, ·) in λ3 and settingλ3 = 0 yields λ4 = λ4(λ3, ·). Using M = M(λ3, ·) and λ4 = λ4(λ3, ·) andsetting T = 0 gives λ3 = λ3(T, ·). Finally, inserting λ3 = λ3(T, ·) in λ4gives a differential equation that only depends on T and a T � such thatλ4 = 0 holds and gives a BGP for the social optimum.
For the parameter values employed in the last section with m1 =0.04, φ = 0.05 in the damage function shows that there exists a uniqueBGP that is saddle point stable (two negative real eigenvalues). Thetemperature and the GHG concentration are T � = 287.9 andM � = 1.02,implying a temperature increase of 0.1◦C.
However, this result depends on the damage function. For extremelysmall damages going along with global warming, we get a different out-come. For example, with m1 = 0.004, φ = 0.004, a temperature increaseof 3 ◦C reduces worldwide GDP by merely 0.014 percent. With thesesvalues we get three equilibria where two are saddle point stable and oneis unstable. The temperatures on the BGPs are T �
1 = 292, T �2 = 294.3,
and T �3 = 295.4. The eigenvalues of the Jacobian matrix, µi, i = 1, 2, 3, 4,
corresponding to (11.68)–(11.71) are µ11 = 3.37, µ12 = −3.36, µ13 = 0.31,

A Model with Optimizing Agents 119
292 293 294 295 296T
�0.005
�0.0025
0.0025
0.005
0.0075
0.01
0.0125
dl4
Figure 11.4 Multiple equilibra in the Social Optimum for m1 = 0.004,φ = 0.004.
292 293 294 295 296T
�0.0025
0.0025
0.005
0.0075
0.01
0.0125
dl4
Figure 11.5 Unique Equilibrium in the Social Optimum for m1 = 0.004,φ = 0.005.
µ14 = −0.3 for T = T �1 ; µ12 = 4.7, µ22 = −4.69, µ23 = 0.005 + 0.12
√i,
µ24 = 0.005 − 0.12√i for T = T �
2 ; and µ34 = 6.34, µ32 = −6.33,µ33 = 0.07, µ34 = −0.06 for T = T �
3 . If the damage of the tempera-ture increase is slightly larger, then the long-run BGP is again unique.Setting a1 = 0.004, ψ = 0.005 we get T � = 291.8, and this equilibrium issaddle point stable. Figures 11.4 and 11.5 illustrate the two situations.
12
Concluding Remarks
In this part we have studied the interrelation between anthropogenicglobal warming and economic growth assuming a simple descriptivemodel of endogenous growth. Using simulations, we have seen thatincreases in abatement spending may yield a win-win situation. Thatmeans a rise in abatement activities both reduces greenhouse gas emis-sions and raises economic growth. This holds for both the balancedgrowth rate and for the growth rate of GDP on the transition path.Of course, the result that a win-win situation may be observed cru-cially depends on the damage caused by the temperature increase.The damage function we used was well in line with the damagereported by IPCC studies, so our outcome cannot be dismissed as purelyacademic.
Furthermore, we have seen that a situation may exist where maxi-mum growth is obtained if the average global surface temperature isreduced to its preindustrial level. This outcome, however, depends onthe growth model employed. So in the AK model, maximum growthwas obtained for an average global surface temperature that is higherthan the preindustrial level.
Assuming a logarithmic utility function, we computed the second-best value for the share of abatement spending, and we have seen that thecleaner the production technology, the smaller the temperature increaseshould be, compared to economies with more polluting technologies,although in the latter a higher share should be spent for abatement. Thesame outcome has been obtained for the social optimum. This impliesthat developing countries countries with less clean technologies spendrelatively more for abatement, but nevertheless emit more GHGs thandeveloped countries due to their less clean technology. Further, theabatement share in the social optimum is higher than in the second-bestsolution, as was expected.
Similar results could also be observed when we allowed for a worldwith heterogeneous regions concerning the production technology anddamages caused by global warming. Our analysis in section 10.3 showed(among other things) that countries with more polluting technologiesand higher damages should spend a higher share of GDP for abate-ment, but nevertheless, may still emit more than countries with cleanertechnologies and smaller damages. This holds for both the noncooper-ative and the cooperative world. Furthermore, the study showed that
120

Concluding Remarks 121
countries with higher damages from the temperature increase emit lesswhen instruments are set such that marginal damages are equal betweenregions, compared to the solution of the dynamic optimization problemwith cooperation among regions.
In chapter 11 we allowed for optimizing agents and then analyzedboth the competitive economy and the social optimum and derivedtax rates, which make the competitive economy replicate the socialoptimum. Using simulations, we could derive the following results.
A situation can again be observed where an increase in the emissiontax reduces the temperature increase and raises both economic growthand welfare. Such a win-win situation or double dividend is more likelythe higher the damage caused by the increase in temperature concerningaggregate output and the smaller the initial level of the emission taxrate. Note that the emission tax ratio will be smaller with less pollutingtechnology employed. Consequently, economies with a cleaner techno-logy are more likely to experience a double dividend when the emissiontax is raised to reduce atmospheric GHG concentrations.
Further, we found that an increase in the emission tax rate may reducethe balanced growth rate but nevertheless lead to higher welfare. Thisoutcome is due to the fact that we allowed for direct disutility effects ofan increase in the temperature. This result is more likely the higher thedirect negative effect of a temperature increase on utility. Furthermore,for a given damage function, this effect is more likely the smaller theintertemporal elasticity of substitution of consumption.
In the social optimum the increase in temperature is smaller thehigher the damage caused by the temperature increase concerningaggregate output and utility, which is not too surprising.
Furthermore, emissions are smaller (and consequently the increasein temperature is lower) the less polluting the technology in use is. Thereason for this result is that it is cheaper for economies with cleaner pro-duction technologies to avoid the damage caused by the temperatureincrease. Thus, countries with cleaner technologies should emit less thancountries with more polluting technologies. This means that it is optimalfor developing countries, which have relatively polluting technologies,to emit more than industrialized countries with relatively clean tech-nologies. This result is quite robust because it was also obtained for allother models in this part.
In section 11.3, finally, we analyzed the dynamics of our endoge-nous growth model with global warming, taking into account that thealbedo of the Earth may depend on the average global surface tempera-ture. Given this assumption, we could demonstrate that the competitiveeconomy can be characterized by multiple long-run BGPs. In this case,the long-run outcome depends on the initial conditions of the economy.
We should like to point out that the change in the albedo does nothave to be large to generate this outcome. Our example showed that

122 Global Warming and Economic Growth
even a quantitatively small decrease in the albedo may generate multipleequilibria. The existence of the nonlinear feedback effect of a higher tem-perature influencing the albedo of the Earth leads to this result. Further,other feedback effects, for example, a change in the ratio of emittedto reflected radiative flux, leading to nonlinearities would produce thesame qualitative outcome.
The government plays an important role in our models because thechoice of the emission tax ratio affects not only the temperature changein equilibrium but also the dynamics of the competitive economy. Sothe emission tax, and thus the abatement share, is crucial as to whetherthe long-run BGP is unique or whether there exist several BGPs. Thesocial planner’s problem is characterized by a unique BGP for plausibledamages going along with global warming. However, if the damagescaused by the temperature increase are very small, the social optimummay also generate multiple equilibria and possibly thresholds.
Overall, in terms of government actions, we obtain in the modelresults similar to those in part I. A zero emission tax is not necessarilywelfare-improving. Because there are negative externalities arising fromprivate activities, a government emission tax increases incentives forprivate abatement activities. As we have demonstrated, by presuminga unique steady state, there exists a growth- and welfare-maximizing,emission tax, and the optimal emission tax is not necessarily zero. How-ever, we want to note that if the presumption of a unique steady statedoes not hold, bifurcations to multiple equilibria could occur. In thiscase, however, the problem of an “optimal” tax scheme is more difficultto treat because the welfare effects of tax schemes are more complex.1
An interesting and important topic in the analysis of global warming,which we did not take into account, is technical change. Buonanno et al.(2003) and Popp (2003) consider induced technical change in theirapproaches and demonstrate that this has far-reaching consequences.For example, Popp (2003) shows that integrating technical change inthe approach by Nordhaus and Boyer (2000) drastically reduces thecost of abatement and raises welfare gains of lower GHG emissions.However, that model is not an endogenous growth model. As to futureresearch, it would be interesting to extend the model by developing amore elaborate endogenous growth model that incorporates endoge-nous technical change affecting production and emissions going alongwith the production process.2
1 For a further study of tax rates in the presence of multiple equilibria, see Grüne et al.(2005).2 A promising approach working with one representative country is the paper by Gerlagh(2004).

PART IIIDepletion of Resourcesand Economic Growth

This page intentionally left blank

13
Introduction and Overview
Now we deal with another topic that has become important with the riseof a global economy. Global economic growth and strong growth in someparticular regions of the world economy, for example, the United States,Asia, and some Latin American countries, have given rise to a highdemand for nonrenewable and renewable resources. Those resourcesare in high demand as inputs in the global growth process. Here, too,we can observe a strong externality produced across generations. Whencurrent generations deplete resources, future generations will not havethose resources at their disposal.
Chapter 14 concentrates on nonrenewable resources and studiesmodels on sustainable economic growth with resource constraints. Wealso explore to what extent resource constraints can be overcome bysubstitution and technological change. We examine the problem of inter-generational equity and the different criteria that have been suggestedin the literature. Chapter 14 also gives a presentation of stylized facts onexhaustible resources and an estimation of a basic model with resourceconstraints. We use U.S. time series data. The estimated years left untildepletion and the empirical trends of the ratios of capital stock andconsumption to resources seem to indicate that there is likely to be athreat to sustainable growth in the future. In our estimation, we obtainparameter values that help interpret the extent to which growth withexhaustible resources is sustainable or nonsustainable. Yet because thetime series data are rather short and there are great uncertainties con-cerning the size of existing stocks, chapter 14 should be seen more asmethodological device to estimate resource models, rather then givingdefinite answers.
Chapter 15 turns to renewable resources and studies the interactionof economic agents, extracting renewable resources, and the resourcedynamics as well as the fate of the resources in the long run. We thuspresent only theoretical work. We demonstrate—partly analytically andpartly numerically—that traditional results in resource economics on thedepletion of resources obtained from the study of only one resource donot carry over to ecologically interacting resources. As in the traditionalapproach, and in the approaches of the previous two parts, we employdynamic optimization. We use a new analytical method. The limitingbehavior of the resources is first studied analytically by letting the dis-count rate approach infinity. A numerical study is then undertaken by
125

126 Depletion of Resources and Economic Growth
means of a dynamic programming algorithm to explore the fate of theresources for various finite discount rates. The relation of our resultsto results in optimal growth theory is also discussed. We show that ifresources are considered in their dynamic interaction, when extractedby economic agents, new insight can be gained that were not feasiblein the traditional way of studying resource exploitation (when only oneresource was considered). We also study the fate of renewable resourceswhen they interact locally or globally and explore how economic com-petition may accelerate the depletion of resources. This method alsoallows us to point out an approach to pricing of environmental assets.
Finally, in chapter 16, we study the problem of how and what typeof regulation could be implemented if resources are threatened to beexhausted. This chapter presents a prototype intertemporal model ofresource extraction with three state variables and one control variable.The three state variables are the stock of the resource, the capacity ofthe extractive industry, and its evolution of debt. As an example, fora regulatory control variable we study the effect of a regulatory taxrate. As shown for certain growth functions of the extracted resource,the optimal tax rate is cyclical. We then conjecture that the results maycarry over to other regulatory policies.

14
Nonrenewable Resources
14.1 INTRODUCTION
After World War II, many OECD countries exhibited strong economicgrowth. Since the early 1970s there was growing concern that eco-nomic growth has increasingly depleted the available resources.1 Aseconomic decisions are restricted by the finiteness of natural resourcesattention has been devoted to the question whether it is possible anddesirable to continue present patterns of economic growth.
Economists such as Meadows et al. (1972) or Daly (1987) have putforward pessimistic predictions about a “sudden and uncontrollabledecline in both population and industrial capacity” if no “conditionsfor ecological and economic stability that is sustainable far into thefuture” are established.2 This concern about sustainable growth wassoon echoed by others. Yet other economists, like Beckerman (1974),held a more optimistic view, stating that technological progress and thediscovery of new substitutes make continued economic growth possi-ble. A general consensus of the economic growth debate is that there aretrade-offs among environmental and economic goals. The agreementis that economic activity that ignores the biological or social system isnot sustainable. There exist many different definitions of sustainabil-ity, and all of them have two points in common. First, they recognizethat resource and environmental constraints affect the patterns of deve-lopment and consumption in the long run. Second, they are concernedabout equity between generations (intergenerational equity). One of themost famous definitions is stated by the Brundtland Commission (1987):“Sustainable development is development that meets the needs of thepresent without compromising the ability of future generations to meettheir own needs.” Similarly Solow (1974) defines sustainablity as “anobligation to conduct ourselves so that we leave to future the option orthe capacity to be as well off as we are.” Pearce et al. (1990) point out that“natural capital stock should not decrease over time,” whereas Pezzey(1961) defines sustainable economic growth as “non-declining outputor consumption over time” and sustainable economic development as“non-declining utility over time.”
1 This chapter is based on joint work with Almuth Scholl; see Scholl and Semmler (2002).2 Meadows et al. (1972), p. 23.
127

128 Depletion of Resources and Economic Growth
As to the sustainability of natural resources, one can distinguishbetween renewable and nonrenewable resources. Dynamic modelson renewable resources can be found in Clark (1990), Sieveking andSemmler (1997), Semmler and Sieveking (1994b), and in chapter 15 ofthis book. In those works, theorems on the sustainability of resourceeconomics that have been developed by studying the fate of renewableresources when resources interact as an ecological system. Further-more, in Semmler and Sieveking (2000), credit-financed extractions ofresources are considered and the fate of resources studied.
The current chapter deals with dynamic models with exhaustibleresources. We discuss protype growth models that incorporate andstudy the consequences of finitely available exhaustible resources. Someof the problems studied here will also arise in the case of renewableresources, for example, the problem of intergenerational justice. Theremainder of this chapter is organized as follows. In section 14.2 wesurvey growth models with natural resource constraints. Section 14.3discusses the problem of intergenerational justice. Sections 14.4 and 14.5present stylized facts of exhaustible resources. Section 14.6 presents theestimation of our growth model. An appendix concludes this chapter.
14.2 ECONOMIC GROWTH WITH RESOURCE CONSTRAINTS
We review growth models that take into account the presence ofexhaustible natural resources. The main interest of the analysis is thequestion of to what extent the economic growth process is restricted bythe finiteness of resource stocks and whether sustained consumptionand utility levels are feasible.
We first consider a basic model where the exhaustible natural resourceis used as an input for the production of a good that is then eitherconsumed or added to the capital stock to enhance future production.Then the consequences of different extensions concerning technologicalprogress are analyzed; finally, it is assumed that natural resources mayprovide services in preserved states.
Before turning to the description of the models, it is important tohave a clear distinction between renewable and exhaustible resources.The main feature of an exhaustible resource is that its growth rate is nil,and it is unrecyclable. Furthermore, it is used up when used as an inputin production. To have a meaningful problem, the natural resource mustbe essential, that is, production is impossible without it.3
14.2.1 A Basic Model
Economists like Dasgupta and Heal (1974), Stiglitz (1974), and Solow(1973) analyze the optimal depletion of exhaustible natural resources in
3 Dasgupta and Heal (1979).

Nonrenewable Resources 129
the context of a growth model where the resource is used as an inputfor the production of a composite commodity. The production functionF depends on the flow of the exhaustible resource at date t and on thestock of a reproducible good at date t. To obtain greatest possible socialwelfare, the present value of utility U derived from consumption Ct ofthe produced good is maximized subject to the evolution of the repro-ducible capital stock Kt and the constraints imposed by the finiteness ofthe resource stock St:
Max∫ ∞
0U(Ct)e−δt dt (14.1)
s.t.
Kt = F(Kt,Rt) − Ct
St = S0 −∫ ∞
0Rt dt
St = −Rt.δ denotes the discount rate, andRt is the flow of the exhaustible resource.The initial capital stocks K0 and S0 are strictly positive and given. Theproduction function F(Kt,Rt) is assumed to be increasing, strictly con-cave, twice continuously differentiable, and homogenous of degreeunity. The utility function U(Ct) is supposed to be strictly concave,and for Ct → 0 its first derivative is infinity. Here, the extraction of theresource is assumed to be costless.
Solving the maximization problem and combining the optimalityconditions yields the following results. For details see appendix A.1.First, along an optimal path the rate of consumption depends on thediscount rate δ, on the elasticity of marginal utility of consumption η,and on the marginal productivity of reproducible capital FK :
CtCt
= FK − δ
η(14.2)
with η(Ct) = − (CtU ′′(Ct)/U ′(Ct)) and FK = ∂F(Kt,Rt)/∂Kt. Equation(14.2) states that the higher the discount rate, the more the rate ofconsumption falls over time along an optimal path. Second, along anoptimal path the rates of return of exhaustible and reproducible capitalare equal:
FK = ∂FR∂t
1FR
, (14.3)
with FR = ∂F(Kt,Rt)/∂Rt. If the production function is homogenousof degree one, it is possible to set xt =Kt/Rt with f (xt) = F (Kt/Rt, 1).

130 Depletion of Resources and Economic Growth
Substituting FR = f (xt) − xtf ′(xt) and FK = f ′(xt) in equation (3) yieldsthe following capital-resource ratio along an optimal path:
xtxt
= σf (xt)xt
, (14.4)
with
σ = −f ′(xt)( f (xt) − xtf ′(xt))xtf (xt)f ′′(xt)
as the elasticity of substitution between reproducible capital and theexhaustible resource. Equation (14.4) represents the rate at which repro-ducible capital is substituted for the exhaustible resource. It depends onthe elasticity of substitution and the average product per unit of fixedcapital.
To conclude whether a positive level of consumption is sustainableover time, Dasgupta and Heal (1974) analyze an economy where outputis produced by a CES-production function, that is, the case of a constantelasticity of substitution. There are three cases to mention.
1. σ = 1 (i.e., the Cobb-Douglas-production function). The exhau-stible resource is essential and infinitely valuable at the margin,whereas the asymptotic value of marginal productivity of cap-ital is zero. Solow (1973) concludes that sustained per capitaconsumption is feasible if the share of capital exceeds that ofnatural resources.
2. 0 ≤ σ < 1. The exhaustible resource is essential but finitely valu-able at the margin. Thus, a positive and nondecreasing level ofconsumption over an infinite time horizon is not sustainable.
3. ∞ > σ > 1. Sustained consumption is feasible because in thiscase the exhaustible resource is inessential.
14.2.2 Technological Change
The basic model can be augmented by introducing technical change,which makes it easier to find new substitutes to render an essential natu-ral resource inessential. Dasgupta and Heal (1974) assume that technicalprogress is uncertain: the exact date of discovering a substitute and itsdetailed characteristics and usefulness are unknown. The new techniqueis supposed to occur at an unknown date T, which is a random numberwith an exogenously given probability density function ωt:
Probability (T = t) = ωt∫ ∞
0ωt dt = 1
ωt > 0

Nonrenewable Resources 131
To express the situation of uncertainty, the objective is to maximize theexpected present value of utility. After some manipulation one obtainsthe following maximization problem:4
Max∫ ∞
0[U(Ct)�t + ωtW(Kt, St)]e−δt dt (14.5)
s.t.
Kt = F(Kt,Rt) − Ct
St = S0 −∫ ∞
0Rt dt
St = −Rt,with �t = ∫∞
t ωt dt andW(Kt, St) = Max∫∞T U(Ct)e−δ[t−T] dt. Kt, Ct, Rt,
and St are all non-negative, and the initial values K0 and S0 are given.Solving the maximization problem, combining the first order conditions,and arguing that at the discovery date of the substitute the then-existingstocks of reproducible and natural capital have no economic value any-more because the new technology is more efficient (i.e., WK = WS = 0),allows for the following conclusions (for details, see appendixA.2). First,along an optimal path the rate of consumption depends on a modifieddiscount rate:
CtCt
= FK − (δ + ψt)
η, (14.6)
with ψt = ωt/�t as the conditional probability of the technologicalbreakthrough at date t given the substitute has not been discoveredearlier. The discount rate is modified by the addition of the factor ψt,showing the probability of the essential resource becoming inessentialas a result of technical progress. Thus, in a situation of uncertainty, thediscount rate is higher than in a situation of certainty.5 Obviously, theequation describing the ratio of capital-resource input is the same asbefore:
xtxt
= σf (xt)xt
. (14.7)
Stiglitz (1974) examines an economy where output is produced by aCobb-Douglas-production function. He concludes that sustained percapita consumption is feasible, if there is a resource augmenting techni-cal change at any positive rate (for σ ≥ 1). Toman et al. (1993) point outthat for the case σ < 1 sustained per capita consumption is possible iftechnological progress is high enough.
4 Dasgupta and Heal (1974), p. 20.5 See also Sieveking and Semmler (1997).

132 Depletion of Resources and Economic Growth
14.2.3 The Role of Backstop Technology
So far it is assumed that the natural resource is exhaustible, that is, onceit is used up, it is impossible to find more, and the extraction is cost-less. As an extension it is now supposed that the resource is available inunlimited quantities but at various grades and various costs. For exam-ple, the ores of a number of metals can be extracted from the depositscurrently used that are exhaustible. If they are used up, the metals them-selves can be extracted from the sea or from rock formations, which ismuch more expensive. Thus, at higher prices the natural resource maybe of unlimited availability. Heal (1993) calls this a backstop technology.We can incorporate it into the basic model described in section 2.1. Thetotal amount of the resource used at date t is denoted as follows:
z(t) =∫ ∞
0Rt dt.
It is assumed that at date T the conventional deposits are exhaustedand a backstop technology takes over. Up to the level zT the extrac-tion costs rise with cumulative extraction, then the backstop technologyis available at a constant cost per unit b. g(zt) denotes the extractioncosts per unit at date t with ∂g/∂zt = g′(zt) > 0 for 0 ≤ zt ≤ zT andg(zT) = b > 0 for zt ≥ zT .
The maximization problem is solved in two steps (see appendix A.3).First, the situation is examined before current deposits are exhausted(maximization problem [14.8]); second, the situation is examined afterthe backstop technology has taken over (maximization problem [14.9]).
Max∫ ∞
0U(Ct)e−δt dt (14.8)
s.t.
Kt = F(Kt,Rt) − Ct − g(zt)Rt
St = S0 −∫ ∞
0Rt dt
St = −Rt,
where g(zt)Rt represents the total extraction costs.
Max∫ ∞
0U(Ct)e−δt dt (14.9)
s.t.
Kt = F(Kt,Rt) − Ct − bRt.

Nonrenewable Resources 133
The initial capital stocks K0 and S0 are strictly positive and given.Computing the conditions along an optimal path of problem (8) yields:
CtCt
= FK − δ
η(14.10)
and
FK = ∂FR∂t
1FR
+ FKg(zt)FR
. (14.11)
Substituting FK = f ′(xt) and FR = f (xt)−xtf ′(xt) with f (xt) = F (Kt/Rt, 1)
results in the following capital-resource ratio along an optimal path:
xtxt
= σf (xt)xt
+ f ′(xt)xtf ′′(xt)
g(zt)xt
. (14.12)
Condition (14.12) is a generalization of condition (14.4). Here, the equa-tion is augmented by the term [f ′(xt)/xtf ′′(xt) × g(zt)/xt], which reflectsthe cumulative costs of extraction.
Following Heal (1993), we can draw the following conclusions.During the initial period the lower-cost stocks of the natural resource areexhausted, and the path of the economy is described by problem (14.8)and conditions (14.10) and (14.11). The difference between prices andextraction costs, that is, the user costs, decline until they reach zero atdate T, when the backstop technology takes over because the lower-coststocks are totally used up. From then on, the economy behaves accord-ing to problem (14.9), thus, the extraction costs of the natural resourcealways equal its price.
14.3 THE IMPORTANCE OF INTERGENERATIONAL EQUITY
As apparent from the foregoing models, the depletion of resources gen-erates externalities for future generations. Therefore, the problem ofintergenerational equity arises. To study this problem, we first showhow natural resources may affect the welfare of the society.
14.3.1 The Amenity Value of Natural Resources
There are two ways a natural resource contributes to society’s welfare.The models described so far refer to the first way: the resource is utilizedas an input factor for the production of a composite commodity. Thesecond way to serve the well-being of the society is that it may providevaluable services in preserved states, that is scientific, recreational, andaesthetic values. To take into account these so-called amenity values ofnatural resources, the resource stock St is included in the utility function

134 Depletion of Resources and Economic Growth
(Krautkraemer [1985]). The objective is to maximize present value ofutility (see appendix A.4):
Max∫ ∞
0U(Ct, St)e−δt dt (14.13)
s.t.
Kt = F(Kt,Rt) − Ct
St = S0 −∫ ∞
0Rt dt
St = −Rt,
where Ct, Kt, Rt, St are all non-negative. U(Ct, St) is assumedto be twice continuously differentiable with UC = ∂U(Ct, St)/∂Ct > 0,andUS = ∂U(Ct, St)/∂St > 0,UCC = ∂2U(Ct, St)/∂C2
t < 0 andUSS = ∂2
U(Ct, St)/∂St <, and limCt→0UC = ∞. The production function F(Kt,Rt)has the same properties as before. Solving the maximization problemand combining the first order conditions yield the following conditionsfor the rate of consumption and for the capital-resource ratio along anoptimal path:
CtCt
= FK − δ − (UCS/UC)Rtη
, (14.14)
xtxt
= σf (xt)xt
+ US/UCx2t f
′′(xt). (14.15)
The amenity services of a natural resource affect the extraction andconsumption mainly through contribution to the rate of return to theresource stock. Resource amenities enhance the value of the resourcestock. Therefore, the initial price of the resource must be higher thanin the previous models. Furthermore, because f ′′(xt) < 0, the amenityservices lower the rate of change in the capital-resource ratio by theterm (US/UC)/x2
t f′′(xt). The higher the marginal rate of substitution
between amenities and consumption, the higher the reduction of therate of change of the input ratio.
In this framework, where natural environments are valued in theirown rights, the so-called Green Golden Rule6 can be introduced, whichis motivated by the Golden Rule of Economic Growth.7 The GoldenRule of Economic Growth gives the growth path with the highest indef-initely maintainable level of consumption, whereas the Green Golden
6 Chichilnisky (1996) and Beltratti et al. (1994).7 Phelps (1961).

Nonrenewable Resources 135
Rule focuses on the highest indefinitely maintainable level of instan-taneous utility. Thus, the Green Golden Rule incorporates the aim ofsustainability. Formally the rule can be written as:8
maxfeasible paths limt→∞U(Ct, St).
If the resource is used as an input factor for the production of a compositecommodity, in the long run the only constant level of resource input iszero. Because the resource is essential, no output can be produced andconsumption is zero. Hence, the highest indefinitely maintainable utilitylevel is feasible if the total initial stock is conserved.
14.3.2 Resources and Intergenerational Equity
Standard growth models that incorporate the concept of sustainabilityfocus on the consequences of natural resource constraints on the long-run pattern of economic development and consumption. To determineintertemporal welfare, recent growth theory has used the concept of dis-counted utilitarism, that is, the future is discounted in comparison withthe present. Ramsey (1928) states that discounting is “ethically indefen-sible and arises merely from the weakness of the imagination” because apositive discount rate results in an asymmetric treatment of present andfuture generations.9 As for the future damages, the role of the size of thediscount rate has become a controversial issue in the recently publishedStern report.10 Many economists took issue with the low discount rateused in the Stern report in the computation of the current cost of futuredamages arising from climate change.
Discounted future utility from resources, using a high discount rate,neglects intergenerational equity as the second important point of theconcept of sustainability. In the following, we give a brief review of somealternative concepts that try to meet the objective of a fair treatment ofdifferent generations.
A simple way to account for intergenerational equity is to assumethe case of a zero utility discount rate, that is, present and future gen-erations are given the same weight. Another alternative is to apply the“overtaking criterion,” as proposed by Weizsäcker (1967), which statesthat one consumption path is better than another if from some date ontotal utility of that path is greater. Formally, if
∫ T
0U(C1
t ) dt ≥∫ T
0U(C2
t ) dt.
8 Heal (1998), p. 43.9 The discount rate is also important to assess the impact of future damages arising fromexternal effects.10 See Stern (2006, 2007).

136 Depletion of Resources and Economic Growth
But applying these approaches gives rise to technical problems. For azero discount rate the set of attainable values of the integral may be open,and the way of ranking consumption paths according to the overtakingcriterion is incomplete.
According to the Rawlsian criterion,11 intergenerational equitymeans: maximize the welfare of the less advantaged generation.Formally,
maxfeasible paths mingenerations t (Welfaret).
The consequence of this decision rule is that the welfare level should bethe same for all generations. If a later generation enjoys higher welfare,an earlier generation should increase its own welfare at the expense ofthe later generation and vice versa. Solow (1973) points out that in com-parison with the discounted solution based on utilitarism the Rawlsiancriterion will use up the natural resource stock faster. Because the utilita-rian rule demands higher savings, earlier generations will have a lowerstandard of living than the constant max-min rule would generate. TheRawlsian criterion has two main difficulties. First, a society needs aninitial capital stock high enough to make a decent standard of livingpossible, but the explanation of its existence is missing. Second, therule does not yield a reasonable result if ongoing technical progress isassumed.12
More recently, Chichilnisky (1996) defines two axioms for sustain-ability that deal with the problem of intergenerational equity. The firstaxiom states that the present generation should not dictate the outcomein disregard for the future. The second axiom states that the long-runfuture should not dictate the present. Welfare criteria that do satisfy thetwo axioms are called sustainable preferences. To formulate a criterionthat belongs to the class of sustainable preferences, positive weight isplaced on the present and on the very long-run properties of a growthpath. Formally,
α
∫ ∞
0U(Ct, St)�(t) dt+ (1 − α)limt→∞(Ct, St),
where α ∈ (0, 1). �(t) is any measure with∫∞
0 �(t) dt = 1. If �(t) = e−δt,the first term is just the discounted integrals of utilities. The second termreflects the limiting properties of the utility stream, and it has alreadybeen mentioned as the Green Golden Rule solution. The Chichilniskycriterion places more weight on the future than the standard approach
11 Rawls (1972).12 A more elaborate version of the Rawls criterion is proposed in Semmler and Sieveking(2000).

Nonrenewable Resources 137
of discounting utility but less than the Green Golden Rule. It is possibleto apply the Chichilnisky criterion to neoclassical growth models at theaforementioned type,13 but finding the solution is quite complicated.We therefore leave aside detailed discussions.
This very short review of different welfare criteria has shown that itis very difficult to find approaches that do meet the objective of permit-ting intergenerational equity and are technically operable at the sametime. For that reason, discounted utility is still dominant, as it the tech-nically most convincing approach, though it favors the present over thefuture.
14.4 ASSESSMENT OF THE FINITENESS OF RESOURCES
Next we discuss some stylized facts that may become relevant in termsof the previously stated theories. Economic theory states that substitu-tion possibilities, technological progress, and the value of the resourcein preserved states may prevent the total depletion of natural capital.In this section, the patterns of some selected nonrenewable resourcesof the U.S. economy are analyzed from 1960 to 1995, which is an inter-esting time period because due to large oil shocks in the 1970s, bigchanges took place. We are using these limited time series data toillustrate the methodology that can be used for the estimation of theaforementioned theoretical model. The empirical illustrations serve asbackground for our estimations in section 14.6. First extraction rates,available resource quantities today and in the future, as well as the timeto exhaustion, are examined. We also pursue the question whether thereare reasons to argue that improved technology and the developmentof reproducible substitutes make a sustainable economic developmentpossible.
Two different kinds of natural resources fulfill the main characteristicsof exhaustibility: fuel minerals, such as energy resources, and nonfuelminerals, such as metals and industrial minerals. A detailed discussionof the data sources and some rough trends in the time series data canbe found in appendix 6. When talking about the limited availability ofnatural resources, it is important to have clear definitions of the differ-ent components of which the total resource stock consists. Figure 14.A1in appendix A.6 explains the different parts. The reserves of the dis-covered resources consist of proved reserves and other reserves, suchas inferred reserves (field growth), measured reserves, and indicatedreserves.14 Proved reserves are those amounts of the resource that geo-logical and engineering data demonstrate with reasonable certainty to
13 For a detailed analysis see Heal (1995).14 Thus, as literature on exhaustible resources has pointed out, there is great uncertaintyas to the size of the available stocks; see Nyarko and Olson (1996).

138 Depletion of Resources and Economic Growth
be recoverable in the future from known reservoirs under existing eco-nomic and technological conditions. The other reserves consist on onehand of that part of the identified economically recoverable resource thatwill be added to proved reserves in the future through extensions, revi-sions, and the discovery of new fields in already discovered regions,and on the other hand on those quantities of the resource that maybecome economically recoverable in the future from existing produc-tion reservoirs through the application of currently available but as yetuninstalled recovery technology.15
As noted before, fuel minerals are energy sources such as crudepetroleum, coal, and natural gas. To take the time period from the 1960sto the 1990s while the U.S. economy experienced continued economicgrowth, that is, a rising level of real GDP, total energy consumption hasincreased by roughly 35 percent (but where also some major oil shockshave occurred). To satisfy increasing energy demand, the production ofespecially coal and natural gas have risen. To draw conclusions whetherthe resources are used more efficiently over time methodologically, onecan analyze the patterns of production rates per dollar of real GDP, seefigures 14.A3–A4 in appendix A.6. Tables 14.A1–A2 in appendix A.6summarize the results for a 35-year time period.
As exemplified for the time period 1960–95 in table 14.A1, for everyenergy resource the production rates per GDP have been falling, that is,crude petroleum, coal, and natural gas have been used more efficientlyover the 35 years, which may be the result of improved technology.Nonfuel minerals are on one hand metals and on the other hand indus-trial minerals. Here, only some selected metals (such as copper, ironore, lead, and zinc) are analyzed. The production rates of these metalsbehave quite unregulary from 1960 to 1995, and no trends can be deter-mined. Figure 14.A3 and table 14.A2 show that the production rates perdollar real GDP are decreasing.
Note that exhaustible energy resources can be substituted by renew-able energy sources, for example, wind and solar power. Figure 14.A4shows the shares of the different energy sources. Recently, nuclearpower and renewable energy together are just 20 percent of total energyproduction. But the trend is that the production of crude petroleum,coal, and natural gas is decreasing while nuclear and renewable energyproduction has been increasing over time. Copper, lead, and zinc aremetals that can be substituted by aluminium and plastic. For iron ore,there does not exist any substitutes, but as it will be shown later,the reserves of iron ore are very high and will last for the next fewcenturies.
To draw conclusions about future availability of exhaustibleresources, it is necessary to have a closer look at the amount of proved
15 See Energy Information Administration, U.S. Geological Survey.

Nonrenewable Resources 139
and other reserves of a resource in comparison with its productionrates.
For the exhaustible energy resources crude petroleum and naturalgas, we plot the reserve-production ratio for the observed time period,see figure 14.A5. The smaller the ratio, the scarcer the natural resource.Already since the 1960s for petroleum and natural gas the trend isdeclining, thus, proved reserves will tend to be depleted if, for exam-ple, extensions/discoveries of new fields in already discovered regionsor new discoveries make reserve additions only minor. This issue willdiscussed more in detail in section 14.5.
Every year the Energy Information Administration and the U.S.Geological Survey estimate quantities of technically recoverableresource amounts that could be added to the the already proved reservesof the United States. Given the trends over the time period 1960–95, itis interesting to ask how many years it will take to exhaust the currentestimated technical recoverable resources quantities. Because the pro-duction rates of the energy resources coal and natural gas are steadilyincreasing during the observed time period, it is assumed that they con-tinue to increase with an average production growth rate. The otherresources do not show any clear trend in their production rates, andtherefore, it is supposed that production will continue to follow a sta-ble pattern during the years ahead. Tables 14.A3 to 14.A5 summarizethe results for the United States. Here again we are less interested inthe accuracy of the predicted results but in some rough sketch of sometrends.
Although the results of the empirical analysis are restricted by thelength of the examined time period and there should be a clear concernwith the finiteness of resources. On the other hand, the data may alsogive reasons not to be too pessimistic because there are other worldwideresources, and in addition, technological progress has made a furtherdevelopment of renewable substitutes for exhaustible resources possi-ble. As the U.S. economy has experienced continued economic growthduring the second half of this century, in particular since the 1990s, theproduction rates of exhaustible resources have risen, and for all analyzedminerals the production per dollar real GDP has declined. Increasedefficiency from the consequence of advanced technology and the use ofclose substitutes are likely explanations for that fact.
Assuming no changes in production trends yields predictions ofthe number of years left until present estimated resource reserves aredepleted. For the United States the estimated reserves of coal and nat-ural gas will last for the next two or three centuries. On the other hand,the present estimated reserves of crude petroleum should raise moreconcerns. The petroleum resources in the United States will be depletedin decades, for example in 30 to 40 years. Yet there are other worldwidepetroleum resources that we discuss next.

140 Depletion of Resources and Economic Growth
14.5 ASSESSMENT OF PETROLEUM RESERVES
As to the share in total world petroleum supply, the Middle East is thecrucial supplier. To see just how important it is, consider the follow-ing data taken from the Energy Information Administration (January2003). The data are summarized in table 14.A6 in appendix 6. Total netimports of oil worldwide in 2002–2003 were 24 million barrels per day.The United States accounts for roughly 40 percent of this figure. TheOECD Europe has also large import shares, most of it from the MiddleEast. In terms of percentages, see the figures in brackets in the table14.A6; the U.S. import share from the Middle East is lower, 20.2 percentas opposed to 35.9 percent in OECD Europe. As can be observed, for theUnited States, the largest fraction of imports comes from Saudi Arabia.Saudi Arabia is in fact the largest source of oil for all the major OECDcountries and also for OECD Europe. For the United States, however,a considerable fraction of imports comes also from Venezuela, whichexports nothing to OECD Europe.
This shows that the Middle East is currently important as petroleumsupplier. Other important figures are the annual production, in relationto the remaining reserves, and the time to exhaustion. Table 14.A7 sum-marizes world petroleum reserves, the ratio of production to reservesand time in exhaustion (in brackets). These figures are also from theEnergy Information Administration (January 2003).
Overall, we can see that roughly two thirds of the world’s provenreserves are in the Middle East. To see how unbalanced this really is notethat 25.7 percent of world reserves (and roughly 40 percent of MiddleEast reserves) are in Saudi Arabia alone. Iraq, second in line, has a sharein world oil reserves of about 11 percent.
The first row in table 14.A7 represents the proven petroleum reserves,which of course, depends on detection and exploration technology andrelated matters. In the row in brackets, we can see the share of eachcountry’s or region’s petroleum reserves as a percentage of total worldreserves. The numbers in brackets denote the percentage of the worldtotal. In the second row the ratio of annual production (obtained by mul-tiplying the second column by the number of days per year) to reserveare shown and in brackets the time to exhaustion.
As mentioned, if we take the total petroleum reserves in the UnitedStates, proven and unproven, at the current rate of extraction ofpetroleum through annual production, they will not last for more somedecades. Taking world petroleum reserves as a whole, at current ratesof production there are more than 40 years left before exhaustion.Considering individual countries at their present rates of production, forIran there are 81 years, for Iraq 140, for Kuwait 150, for Saudi Arabia 96,and for the United Arab Emirates 86. Venezuela has 53 years to run.
The important point is that the Middle East petroleum resources—in particular those in Iraq—are very much underexploited. That is

Nonrenewable Resources 141
why the time to exhaustion in Iraq is very long. Table 14.A7 in factunderscores a major issue. On one hand, the reserves of the advancedeconomies are rapidly shrinking and thus overexploited, while onthe other hand, those of the Middle East are both much larger andsignificantly underexploited.
As mentioned, the reserves consists of proved reserves and otherreserves (inferred, measured, and indicated), which will be added to theproved reserves in the future. Of course, the exploration and productiontechnology for petroleum is continuously changing, more rapidly thanever. This is the result of the so called DOFF—the “digital oil field of thefuture.” The DOFF is based on information, exploration, and produc-tion far more exact and targeted. Recently, estimates of the recoverablereserves in Alberta, Canada, and Venezuela have been greatly increasedby using new methods. The resources are now deemed recoverablebecause there have been great advances in the technology of processingtar and petroleum sands. Furthermore, new oil explorations, for exam-ple, in the Gulf of Mexico and Colombia, have come up with significantnew findings.16
To sum up: in the United States, petroleum, natural gas, and coaltogether provide about 82 percent of all energy, and oil and gas roughlytwo thirds. Two thirds of the world’s proved petroleum reserves arein the Middle East. In the United States, Mexico, Venezuela (less so inCanada), the remaining years to exhaustion of the known oil resourcesare only one fifth of the years to exhaustion in Middle East.
Substitutes for coal, natural gas, and crude petroleum are nuclearand renewable power. Because the share of these alternative energyproduction sources has increased in the past four decades, it seems likelythat further research and development will enhance this trend. Also, anincreased use of plastics particularly as a renewable substitute may relaxthe constraints that a sustainable development faces.
The foregoing assessments for nonrenewable resources are madeunder the assumption that only currently available technology isapplied. But it seems to be likely that technological progress improves,for example, mining and refining methods or makes discoveries ofnew resources fields possible and therefore enhances present estima-tions of available reserves. Yet to ensure sustainable growth in the senseof minimal degradation of natural capital stocks and intergenerationalequity, it appears to be important to develop further renewable substi-tutes. Given our rough assessment of the finiteness of the nonrenewable
16 However, the costs of recovering petroleum from oil sands may prove daunting; almostas much energy must be used in processing as the final product will contain. Moreover, theprocesses generate severe pollution. The new strikes in the Gulf are in exceptionally deepwaters and have already run into problems. Finally, all new unconventional petroleumwill be expensive, and it will be some time before any comes on line. On the other hand,rapid advances in petroleum exploration and recovery are possible in all oil rich regions.

142 Depletion of Resources and Economic Growth
resources, we want to make an attempt to estimate a model with resourceconstraints.
14.6 ESTIMATION OF A BASIC MODEL
Here we introduce a methodological device of how to estimate a modelwith nonrenewable resources. To estimate the model as described insection 14.2, first consumer preferences and the technology of producinggoods have to be specified, and second, a data set has to be constructed.We use data of a time period that is of particular interest, because thetime series data cover the period of the large oil shocks in the 1970s.In our estimation, we focus on the standard model as presented insection 14.2.
We use a very simple version of a growth model with resources. Itis assumed that the natural resource contributes to economic activityonly in one way: it is used as an input factor for the production of acommodity that is either consumed or added to the capital stock. Thepresent value of utility received from consumption is given by
∫ ∞
0
C1−ηt − 11 − η
e−δt dt,
where η is the elasticity of marginal utility. The technology of goodsis described by a Cobb-Douglas-production function that depends onreproducible capital Kt and the exhaustible resource flow Rt. The elas-ticity of substitution between reproducible capital and the exhaustibleresource σ equals 1. The evolution of capital is determined by
Kt = Kβt R
1−βt − Ct.
β denotes the share of reproducible capital in production. Maximiz-ing present value of utility and setting yt = Ct/Rt yields the followingestimable system:17
ytyt
= βxβ−1t − δ
η− φ, (14.16)
xtxt
= xβ−1t , (14.17)
RtRt
= φ, (14.18)
with φ as the growth rate of the exhaustible resource flow.
17 For a detailed study of the solution, see appendix A.5.

Nonrenewable Resources 143
Table 14.1 Estimation Results.
Parameter Value Standard Error
β 0.32 3.4668
δ 0.03 0.0369
η 0.5 0.2488
φ 0.002 0.1856
For time series data we need consumption, reproducible capitalstock,18 and the exhaustible resource flow.19
The reproducible capital stock, Kt, is gross real private fixed capitalstock, and C is private consumption. The time series for the resource, R,is based on our own computation. Because the total mineral productionvalue is the amount of extracted exhaustible resources times averageprices, it is used to measure the exhaustible resource flow. All timeseries are deflated by the GDP price index 1990 = 100.
Equations (14.16), (14.17), and (14.18) are estimated directly byusing nonlinear least squares techniques (NLLS).20 In the estimationwe have prefixed the discount rate, δ, and the parameter of relativerisk aversion, η. The reason for this procedure is that the model we areconsidering—leaving aside substitution, technological change, and therole of other inputs—in its current form is rather incomplete, and reli-able estimates for the discount rate as well as for relative risk aversioncannot be expected. Therefore, we prefix them at levels that have beenobtained by other recent studies. The estimation results are summarizedin table 14.1.
The estimated capital share in income, β, and the estimated growthrate of the resource flow, φ, are reasonable.
Although there is a very irregular behavior of the total mineralproduction value over the observed time period, the data show an enor-mous increase in the years 1972 to 1981 caused by the price effects of theoil crisis. Our estimation still gives reasonable parameter values.
Figures 14.1 and 14.2 show the estimated (fitted) and actual time seriesfor the ratio of capital stock to resources and the ratio of consumptionto resources.
As figures 14.1 and 14.2 show, the model with our estimated param-eters matches the data well. As already noted, the very simple structureof the model may explain the observable slight correlation of the errorterms. We also have supposed that population remains constant, which
18 Data on consumption and capital stock are obtained from Citibase (1998).19 Source: U. S. Department of Commerce, Economics and Statistics (1965–1997).20 Computed with GAUSS OPTMUM version 3.00.

capi
tal-
reso
urce
rat
io
years1964 1968 1972 1976 1980 1984 1988 1992 1996
20
30
40
50
60
70
90
100
110
estimationreal
80
Figure 14.1 Capital Stock to Resource Ratio.
cons
umpt
ion-
reso
urce
rat
io
years1964 1968 1972 1976 1980 1984 1988 1992 1996
18
estimationreal
26
30
34
38
42
14
10
22
Figure 14.2 Consumption to Resource Ratio.
144

Nonrenewable Resources 145
implies that labor as an input factor in production is constant, too. Thisassumption seems justified when analyzing the very short run, but notappropriate when examining a time period of 35 years. It seems to belikely that incorporating the factor labor into the model would improvethe estimation results. Especially the exhaustible resource share in pro-duction, 1 − β, is likely to be smaller. Furthermore, as the stylized factssupport, it would be reasonable to allow technological change and sub-stitution. Finally, the quality of nonlinear estimations depends stronglyon the number of observations. Because the analyzed time period consistof only 35 data points, it is difficult to achieve sufficient robustness in theestimations. This problem was clearly observable when we attemptedto estimate the prefixed parameters η and δ. Their estimation, in fact,turned out to be nonrobust with respect to the algorithm used. Wetherefore kept them prefixed.
In summary, future research should take into account the factor laborand technological progress and substitution and estimate such a modelover a longer time period or with data with a higher frequency. Yet ourmethodology and estimation results for the period of the large oil crisesin the 1970s and their effect on the 1980s and 1990s may already be ofinterest.
Appendix: Sketch of Solutions and Data Sources
A.1 THE BASIC MODEL
The following maximization problem must be solved:
Max∫ ∞
0U(Ct)e−δt dt (14.19)
subject to
Kt = F(Kt,Rt) − Ct
§t = S0 −∫ ∞
0Rt dt
St = −Rt.
The current-value Hamiltonian is defined as
Hc = U(Ct) + pt(−Rt) + qt(F(Kt,Rt) − Ct), (14.20)
where pt denotes the shadow price of the resource constraint and qtdenotes the shadow price of capital accumulation. Computing the firstorder conditions yields the following equations, which must be fulfilled

146 Depletion of Resources and Economic Growth
along an optimal path:
pt = δpt (14.21)
U ′(Ct) = qt (14.22)
pt = qtFR (14.23)
qt − δqt = −qtFK , (14.24)
with FR = ∂F(Kt,Rt)/∂Rt and FK = ∂F(Kt,Rt)/∂Kt. Differentiating (14.22)with respect to time and substituting (14.24) yields the consumption ratealong an optimal path:
CtCt
= FK − δ
η. (14.25)
Differentiating (14.23) with respect to time and using (14.21) and (14.24)results in
FK = ∂FR∂t
1FR
. (14.26)
Substituting FR = f (xt)−xtf ′(xt) and FK = f ′(xt) with f (xt) = F (Kt/Rt, 1)
and xt = Kt/Rt in (14.26) yields the capital-resource ratio along anoptimal path
xtxt
= σf (xt)xt
. (14.27)
A.2 TECHNOLOGICAL CHANGE
The following maximization problem must be solved:
Max∫ ∞
0[U(Ct)�t + ωtW(Kt, St)]e−δt dt (14.28)
subject to
Kt = F(Kt,Rt) − Ct
St = S0 −∫ ∞
0Rt dt
St = −Rt.
The current-value Hamiltonian is
Hc = U(Ct)�t + ωtW(Kt, St) + pt(−Rt) + qt(F(Kt,Rt) − Ct). (14.29)

Nonrenewable Resources 147
Computing the first order conditions yields
pt = δpt (14.30)
�tU ′(Ct) = qt (14.31)
pt = ωtWS + qtFR (14.32)
qt − δqt = −ωtWK − qtFK . (14.33)
Differentiating (14.31) with respect to time and substituting (14.33)results in
CtCt
= FK − δ + ψt(WK −U ′(Ct))/U ′(Ct)η
, (14.34)
with ψt = ωt/�t. If Wk = WS = 0, one gets the following consumptionrate along an optimal path
CtCt
= FK − (δ + ψt)
η. (14.35)
A.3 BACKSTOP TECHNOLOGY
The following maximization problem must be solved
Max∫ ∞
0U(Ct)e−δt dt (14.36)
subject to
Kt = F(Kt,Rt) − Ct − g(zt)Rt
St = S0 −∫ ∞
0Rt dt
St = −Rt,where g(zt)Rt represents the total extraction costs. The current-valueHamiltonian is
Hc = U(Ct) + pt(−Rt) + qt(F(Kt,Rt) − Ct − g(zt)Rt). (14.37)
Computing the first order conditions yields
pt = δpt + qtg′(zt)Rt (14.38)
= δptqtg′(zt)zt
= δptqt∂g(zt)
∂t

148 Depletion of Resources and Economic Growth
U ′(Ct) = qt (14.39)
−pt = qt(FR − g(zt)) (14.40)
qt − δqt = −qtFK . (14.41)
Differentiating (14.40) with respect to time and using (14.38) and (14.41)results in
FK = ∂FR∂t
1FR
+ FKg(zt)FR
. (14.42)
Substituting FR = f (xt) − xtf ′(xt) and FK = f ′(xt) in (14.42) results in thefollowing capital-resource ratio along an optimal path
xtxt
= σf (xt)xt
+ f ′(xt)xtf ′′(xt)
g(zt)xt
. (14.43)
A.4 THE AMENITY VALUE OF A NATURAL RESOURCE
The following maximization problem must be solved
Max∫ ∞
0U(Ct, St)e−δt dt (14.44)
subject to
Kt = F(Kt,Rt) − Ct
St = S0 −∫ ∞
0Rt dt
St = −Rt.
The current-value Hamiltonian is defined as
Hc = U(Ct, St) + pt(−Ct) + qt(F(Kt,Rt) − Ct). (14.45)
Computing the first order conditions yields
pt − δpt = −US (14.46)
UC = qt (14.47)
pt = qtFR (14.48)
qt − δqt = −qtFK . (14.49)

Nonrenewable Resources 149
Differentiating (14.47) with respect to time and substituting (14.49)results in the following consumption rate along an optimal path:
CtCt
= FK − δ − (UCS/UC)Rtη
. (14.50)
Differentiating (48) with respect to time and using (14.46) and (14.49)yields
FK = ∂FR∂t
1FR
+ US/UCFR
. (14.51)
Substituting FR = f (xt) − xtf ′(xt) and FK = f ′(xt) in (14.51) yields thefollowing capital-resource ratio
xtxt
= σf (xt)xt
+ US/UCx2t f
′′(xt). (14.52)
A.5 ESTIMATION
The following maximization problem has to be solved:
Max∫ ∞
0
C1−ηt
1 − ηe−δt dt (14.53)
subject to (14.54)
Kt = Kβt R
1−βt − Ct (14.55)
St = −Rt. (14.56)
The optimality conditions are
CtCt
= FK − δ
η, (14.57)
xtxt
= f (xt)xt
. (14.58)
With FK = βKβ−1t R1−β
t = β(Kt/RT)β−1 = βxβ−1t and F(Kt/Rt, 1) =
f (xt) = xβ, one gets
CtCt
= βxβ−1t − δ
η, (14.59)
xtxt
= xβ−1t . (14.60)

150 Depletion of Resources and Economic Growth
Setting yt = Ct/Rt yields yt/yt = (Ct/Ct) − (Rt/Rt), and the followingestimable system is obtained:
ytyt
= βxβ−1t − δ
η− φ (14.61)
xtxt
= xβ−1t (14.62)
RtRt
= φ, (14.63)
where φ denotes the growth rate of the resource flow.
A.6 DATA SOURCES, FIGURES, AND TABLES
• Annual data from 1960 to 1995, taken from the U.S. Depart-ment of Commerce, Economics and Statistics, Bureau of theCensus, Statistical Abstract of the United States, 1965–1996: crudepetroleum production, coal production, natural gas produc-tion, copper production, iron ore production, zinc production,lead production, share of nuclear power, renewable energy andfuel minerals in total energy production, total mineral produc-tion value, proved reserves of crude petroleum and naturalgas, gross private consumption, accumulated gross fixed capitalformation.
• Estimated reserves of crude petroleum and natural gas, U.S.Geological Survey, National Assessment of Oil and Gas Resources,1995: proved reserves, field growth, undiscovered resources,total reserves.
• Estimated reserves of coal, Energy Information Administra-tion, Coal Industry Annual 1996, Executive Summary 1996: provedreserves, other reserves, total reserves.
• Estimated reserves of copper, iron ore, lead, and zinc, U.S.Geological Survey, Mineral Commodity Summary, 1996: provedreserves, other reserves, total reserves.
FIGURES
Fuel mineral production per 1990 $ GDP (coal production measuredshort tons, crude petroleum production measured in barrels, naturalgas production measured in millions of cubic feet).

RESOURCE STOCK
recoverableresource
nonrecoverableresource
undiscoveredresource
discoveredresource
reservescumulativeproduction
provedreserves
otherreserves
Figure 14.A1. The Components of a Resource Stock.
151

prod
ucti
on p
er 1
990
$ G
DP
years1964 1968 1972 1976 1980 1984 1988 1992 1996
0.0000
0.0004
0.0008
0.0012
0.0016
0.0020
0.0024coal � 10crude petroleumnatural gas � 100
Figure 14.A2. Fuel.
years1964 1968 1972 1976 1980 1984 1988 1992 1996
0.00
0.01
0.02
0.03
0.04
0.05
0.06
copper � 100iron orelead � 100zinc � 100
prod
ucti
on in
sho
rt to
ns p
er 1
990
$ G
DP
Figure 14.A3. Metal Production per GDP (metal production in short tons per1990 $ GDP).
152

years1964 1968 1972 1976 1980 1984 1988 1992 1996
ener
gy p
rod
ucti
on in
per
cent
of t
otal
0
10
20
30
70
90
100
80
60
50
40
nuclear powerrenewable energycoal � petroleum � natural gas
Figure 14.A4. Energy Production Sources in Percent of Total.
years1964 1968 1972 1976 1980 1984 1988 1992 1996
crude petroleumnatural gas
rese
rve
prod
ucti
on r
atio
8
12
16
20
24
Figure 14.A5. Reserve-Production Ratio.
153

TABLES
Table 14.A1. Fuel Mineral Production per Dollar Real GDP.
Crude PetroleumBarrels
Coal in ShortTons
Natural Gas inMillions of CubicFeet
1960 1.2680* 10−3 2.0526* 10−4 6.3155* 10−6
1995 3.8447* 10−4 1.6589* 10−4 3.1316* 10−6
change in % −70 −19 −48
Table 14.A2. Nonfuel Mineral Production per Dollar Real GDP.
Copper in Iron Ore in Lead in Zinc inShort Tons Short Tons Short Tons Short Tons
1960 5.3287* 10−4 4.0952* 10−2 1.2187* 10−4 2.1463* 10−4
1995 2.9700* 10−3 9.8124* 10−3 6.1990* 10−5 9.8605* 10−5
change in % −44 −76 −49 −54
Table 14.A3. Estimated Reserves of Petroleum and NaturalGas, 1995.
CrudePetroleum inBillion Bbl.
Natural Gasin Trillion.Cu. Ft.
Proved reserves 20.2 135
Field growth 60.0 322
Undiscovered resources 30.3 259
Total reserves 110.5 716
Average annual production/average production growth rate
3.0076 0.012
Years left until exhaustion 40 300
154

Table 14.A4. Estimated Reserves of Coal 1996.
ProvedReserves
OtherReserves
TotalReserves
AverageProductionGrowthRate
Years LeftUntilExhaustion
19,428 507,740 527,168 0.026 250
Table 14.A5. Estimated Reserves of Some Selected Metals, 1997.
Copper in1000Metric Tons
Iron Orein 1000Metric Tons
Lead in1000Metric Tons
Zinc in1000Metric Tons
Proved reserves 45,000 10,000,000 6,500 25,000
Other reserves 90,000 23,000,000 20,000 80,000
Total reserves 135,000 33,000,000 26,500 105,000
Average annualproduction
1414.25 68844.44 439.72 437.14
Years left untilexhaustion
95 480 60 240
Table 14.A6. Petroleum Import Shares.
PersianGulf/MiddleEast
Iran Iraq Kuwait Saudi Arabia UnitedArabEmirates
Venezuela
U.S. 2.25 0 0.32 0.22 1.68 0.012 1.32(% of [20.20] [0] [2.88] [1.98] [15.11] [0.11] [11.87]importsfrom)
OECD 2.56 0.74 0.58 0.09 1.13 0.04 0Europe( % of [35.96] [10.39] [8.15] [1.26] [15.87] [0.56] [0]importsfrom)
155

Table 14.A7. Petroleum Production and Petroleum Reserves.
WorldTotal
OPEC PersianGulf/MiddleEast
Iran Iraq Kuwait SaudiaArabia
Unit. ArabEmirates
Venezuela UnitedStates
Russia
Reserves(2001) 1.017,73 662,48 99.08 115,00 98,85 261,65 62,82 50,22 21,50 53,86(billion [65.09] [9.74] [11.3] [9.71] [25.71] [6.17] [4.93] [2.11] [5.29]barrels)[%ofworld total]
Ratio ofproduction to 0.024 0.0123 0.00073 0.00067 0.0104 0.0117 0.0189 0.057 0.047reserves [41.6] [81.3] [140.1] [149.1] [96.1] [85.5] [52.9] [17.5] [21.0](2001)(annualproduction/reserves)
156

15
Renewable Resources
15.1 INTRODUCTION
Renewable resources are empirically more difficult to treat.1 Whereasstocks of nonrenewable resources can only be estimated with greatuncertainty, the estimation problem is compounded for renewableresources. Here we only present some theoretical models. Yet what wetake into account more explicitly is the interaction of resources.
For a long time resource economists, applying dynamic optimiza-tion, have confined their studies on the depletion of renewable resourcesto the analysis of a single isolated resource.2 Recent work in resourceeconomics has embarked on studying the exploitation of ecologicallyinterrelated resources. The optimal exploitation of interrelated resourcesis frequently modeled as an optimally controlled Lotka-Volterra sys-tem.3 It might, however, be fair to state the basic infinite horizondiscounted optimal control problem has not completely been resolvedsince it was first introduced in 1976 by Clark (1990). Yet there are numer-ous partial models and also precise conjectures—due to Clark (1990) andRagozin and Brown (1985)—about the type of solutions that one wouldexpect; see section 15.2.
In this chapter, we make use of some advancement in analyticalmethods and employ computer studies to discuss a number of issuesand eventually disprove—by means of counterexamples—some state-ments made in the literature on optimal exploitation of interactingresources. In the study of the fate of optimally exploited interactingresources, there are essential modeling issues involved. The follow-ing issues have become important and are considered in our variousmodels: (1) zero time horizon optimization and infinite time horizonoptimization, (2) sole owner control over harvesting and free access toharvesting, (3) selective (independent harvesting) and nonselective har-vesting (joint harvesting) of different resources, (4) elastic and inelastic
1 This chapter relies heavily on the joint work of Willi Semmler with Malte Sieveking.2 This tradition started with the pathbreaking work by Hotelling (1931). For a recentsurvey, see Heal (1999).3 See, for example, Clark (1990, 1985), Hannesson (1983), Ragozin and Brown (1985),Conrad and Adu-Asamoah (1986), and Falk (1988). A detailed discussion of this literatureis undertaken in section 15.2.
157

158 Depletion of Resources and Economic Growth
demand curves, and (5) predator-prey and competitive interaction ofresources.
It can be shown that zero time horizon optimization is related to theinfinite time horizon optimization by a limit process in which the dis-count rate tends to infinity and reduces that latter to a simple differentialequation. We provide a counterexample to Clark’s (1985) fundamentalprinciple of renewable resources, which says that higher discount ratesnormally imply a lower level of resource conservation by private own-ers, other things being equal. As also shown, the sole owner, who hasbeen said to be more conservative with respect to the exploitation of theresource than the free access regime because of his capability to plan,may turn out to be of more serious threat to extinction than free accessin some cases. The same appears to hold true for selective and nons-elective harvesting. The former is often considered a sharper strategy,yet as will be seen, it may be more dangerous in certain situations. Wealso show that inelastic demand may cause the resources to oscillate andproduce limit cycles when optimally exploited, whereas the more elasticdemand may lead to stable equilibria. Oscillations—limit cycles—willalso be shown to occur in a system of competing species that withoutbeing harvested, never oscillates.
The foregoing results are generated partly analytically, partly bymeans of numerical studies. Because of the possible nonconcavity ofthe Hamiltonian involved in our optimization problems, we do notapply Pontryagin’s maximum principle4 but rather study the dynamicsof the optimally controlled system by means of a dynamic programmingalgorithm. The numerical studies are undertaken for specific examples,specific functional forms,5 and parameters. Fully worked out examplesare given for two resources that either exhibit predator-prey or competi-tive interrelations. Although our specifications and simulations may nothave the same generic status as analytical statements, they are, however,indispensable in tracking the exact long-term behavior of the trajectoriesof the optimally controlled systems.
The remainder of this chapter is organized as follows. Section 15.2introduces the model and various specifications of it as well as twotheorems. The theorems reveal the relation between zero horizon
4 A dynamic programming algorithm is preferred in our context because it approximatestruly optimal trajectories as compared to procedures working on the basis of necessaryconditions like Pontryagin’s maximum principle. The latter might only yield “subopti-mal” trajectories. This is the reason the Hamiltonian method employed, for example, byDockner and Feichtinger (1991) who show the existence of optimal periodic solutionsfor certain variants of their model (under the assumption of a concave Hamiltonian) isdifficult to apply in our context.5 A variety of different functional forms, for example, concerning the inverse demandfunction, are examined in Sieveking and Semmler (1990) with similar outcomes for theresource dynamics as reported here in.

Renewable Resources 159
optimization where the discount rate tends to infinity, and infinite timehorizon optimization, where the discount rate is finite. A brief dis-cussion on the related literature is added. In section 15.3, analyticalresults for the open access regime—in the literature typically viewed asa zero horizon optimization problem—are gathered concerning the sys-tems of predator-prey and competitive interactions. Both interactionsallow for limit cycles in the optimal trajectories. Numerical studies areadded to support and extend the results. Section 15.4 presents numericalresults for the monopoly problem, by nature an infinite horizon opti-mization problem. To track the exact solution paths of both systems forvarying discount rates—possibly exhibiting limit cycles, instability, orextinction—a dynamic programming algorithm is employed.6
Finally, we note that renewable resources can be considered (at least toa great extent) as environmental assets. We have set up a typical dynamicresource exploitation model, with a discount payoff as objective func-tion, so that the objective function gives us the present value of theresource (or resources). This way we can also study the issue of pricing ofenvironmental assets. We study this issue in a deterministic frameworkand do not consider a stochastic modeling of the pricing of environmen-tal assets, though the algorithm applied here may help do this.7
15.2 RENEWABLE RESOURCES AND OPTIMAL GROWTH
Following the aforementioned bioeconomic literature, we commencewith simple Lotka-Volterra equations for two resources, for example,two species x1, x2 that exhibit intraspecific competition:
x1 = x1(a0 − a1x1 − a2x2) = f (x1.x2),
x2 = x2(b0 + (−)b1x1 − b2x2) = f (x1, x2),(15.1)
where ai, bi are positive constants, except b0, which may also be anegative constant. The terms −a1x1 and −b2x2, respectively, denoteintraspecific competition, for example, population pressure. In taking−a1x1, −b1x1 we wish to represent two species that compete for thesame resources, while −a2x2, +b1x1 stands for x1 being the prey for thepredator x2.
If we take harvesting into account, we do this by writing
x1 = f (x1, x2) − x1u1,
x2 = f (x1.x2) − x2u2,(15.2)
6 The dynamic programming algorithm is described in Semmler and Sieveking (2000);see also Falcone (1987). A further development and refinement of this algorithm has beenundertaken in Grüne and Semmler (2004).7 See Grüne and Semmler (2004).

160 Depletion of Resources and Economic Growth
where u1 ≥ 0, u2 ≥ 0 denote harvesting effort to be chosen by the eco-nomic agents. We assume the yield yi of the effort ui at the stock level xito be given by
yi = (x, u) = qixiui, (15.3)
where qi is a nonnegative constant.8 Other functional relationships than(15.2) and (15.3) between effort rate, growth rate, and yield have beendiscussed (see Clark 1985). We choose the simplest version.
The incentives for the agent to choose a specific ui is to increase thetotal net income flow
2∑1
pi( yi)yi − ci(ui) = G(x, u), (15.4)
where pi( yi) is the price per unit of biomass of xi depending on the rate ofsupply yi, and ci(ui) is the cost per unit of effort of type i. The subsequentformula expresses the fact that our agent has complete control over theharvesting process. We therefore call him or her sole owner. The priceof the harvested resource is determined by an inverse demand function.We assume that pi(y) has the shape
pi(yi) = (γ0 + yi)−α (15.5)
for some α > 0, γ0 > 0. The reason for this choice is that we want to positthat
pi > 0, p′i > 0, p
′′i = 0; lim
yi→∞ pi(yi) < +∞.
These properties permit a simple analytical study of the dynamics.9
Note that we may equivalently view the sole owner as an agent whofixes a price and then satisfies the resulting demand. Moreover, forsimplicity we take cost
ci(ui) = ciui (15.6)
for some constant ci ≥ 0.The setU of admissible control vectors (u1, u2) is capable of represent-
ing characteristics of the harvesting technology as follows. We defineselective harvesting by
U = {(u1, u2) | 0 ≤ u1 ≤ u1, 0 ≤ u2 ≤ u2}, (15.7)
8 In later computations and computer simulations we will set q = 1.9 Other forms of inverse demand functions are explored in Sieveking and Semmler (1990).

Renewable Resources 161
where u1,u2 are positive constants or +∞. Subsequently, in the analysisand numerical simulations of the model, we confine the study to the casewhere only one resource is permitted to be caught (or salable), but theother resource is caught as well.10 This is called nonselective harvestingand is represented by
U = {(u1, u2) | 0 ≤ u2 ≤ u2, = k2u2}, (15.8)
where k2 is a non-negative constant.There are two problems connected with the sole owner that we wish
to study: the infinite horizon problem and the finite horizon problem.The infinite horizon problem can be described as
max∫ ∞
0e−δtG(x(t), u(t))dt (15.9)
s.t. (2) and
u(t) = (u1(t), u2(t)) ∈ U(t ≥ 0); x(0) = x0.
Here again, δ is the discount rate, which is likely to play an importantrole in models of resource management. According to the followingtheorem there is a limit in (15.9) as δ tends to infinity.
Theorem 15.2.1 Let (xn, un) be a solution11 to (9) for discount rates
δn(n ∈ N such that limn→∞ δn = +∞ and lim
n→∞ xn(0) = a.
Then a subsequence of (xn)n∈N converges uniformly on bounded intervalsof [0, +∞) to a solution of the following differential inclusion
y(t) ∈ F(y(t)); y(0) = a, (15.10)
where
y(t) = (y1(t), y2(t)),
and
f (y1, y2) = {(f1(y1, y2) − y1u1, f2(y1, y2) − y2u2) || u = (u1, u2)∈U
and
G(y, u) = maxG(y,U)}.
10 For details of such models, see Clark (1985).11 For details of the subsequent theorem, see Semmler and Sieveking (1994b).

162 Depletion of Resources and Economic Growth
Equation (15.10) has been called a free access problem in Falk (1988),but we prefer to call it differently. In a free access regime there is unre-stricted entry, and the coordination of activities is not feasible so as tomaximize G(x, u). We therefore call (15.10) the zero horizon optimizationproblem for the sole owner (monopolist).12 It will turn out that for ourparticular f1, f2, andG, (15.10) is actually a system of ordinary differentialequation
x1 = f (x1, x2) − x1u1(x),
x2 = f (x1, x2) − x2u2(x),(15.11)
with u(x) uniquely determined by
G(x, u) = maxG(x,U).
In fact we will have to consider only
u2(x) = u2(x2) and u1(x) = k2u2(x2)
for some constant k2 ≥ 0.Our concept of free access regime generalizes Gordon’s (1954) idea of
dissipation of economic rent from the stationary state (Gordon’s case)to any state at any time. That is, we posit agents to enter the industry aslong as there isG(xu) > 0, thereby increasing the total effortU = (u1, u2)
until eventually G(x, u) = 0. If the adjustment process that drives rentto zero is infinitely fast, we arrive at the following system, which wecall open access problem:
x1 = f (x1, x2) − x1v1(x),
x2 = f (x1, x2) − x2v2(x),(15.12)
where v(x) = (v1(x), v2(x)) is determined by
v(x) = sup{u ∈ U | G(x(x, u) ≥ 0},and U is partially ordered by
(u1, u2) ≤ (u∗1, u∗
2) ⇐⇒ u1 ≤ u∗1 and u2 ≤ u∗
2.
In general v(x) will be a set, and hence (15.12) is to be read as differentialinclusion. In the following examples, however, v is single-valued:
v2(x) = v2(x2) and v1(x) = k2v2(x2),
12 Although, as some authors have pointed out, the monopolist’s problem is by naturean infinite horizon optimization problem, we employ the limit case as a modeling deviceto obtain conjectures for the infinite horizon case.

Renewable Resources 163
for some k2 ≥ 0 and hence (15.12) is a system of two ordinary differentialequations. We also term (15.12) a zero time horizon problem. For a modelwhere the adaptation of effort is modeled by a differential equation, seeClark (1990, p. 322).
The zero horizon optimization problem is a helpful modeling devicefor studying the infinite horizon case. In fact, because the former repre-sents a system of ordinary differential equations in the plane, we are ableto study the existence of limit cycles via Hopf bifurcation theory or thePoincaré-Bendixson theorem.13 From the horizon optimization prob-lem, one may conclude back to the infinite horizon problem accordingto theorem 15.2.2.
Theorem 15.2.2 Suppose the sole owner zero horizon problem (15.11)admits a stable limit cycle; then for sufficiently large δ > 0, problem (15.9)admits a limit cycle solution, too.
Theorem 15.2.2 follows from a general theorem according to whichlimit cycles and asymptotically stable attractors are structurally stable.The theorem is, of course, also applicable to other parameters than δ (fordetails, see Sieveking 1990). Thus, the study of the zero horizon problemand theorem 15.2.2 guided us in the search for specific parameters forthe simulations of the infinite horizon problem in section 15.4.
It is worth contrasting the properties of our system (15.9) with theliterature in bioeconomics and the turnpike solution in optimal growththeory. In bioeconomic literature such as Clark (1985, 1990), there is openaccess or sole owner (who faces an inverse demand function) in the caseof a single resource. In case of interacting resources the literature, to ourknowledge, assumes constant sales prices. Yet no general solution hasbeen given (see Clark 1985, p. 175) and there has not been significantprogress since 1976 (Clark 1990).
To fix ideas, let us consider the following problem
max∫ ∞
0e−δt(px2(t) − c)u2(t)dt
s.t. x1 = x1(a0 − a1x1 − a2x2) = f1(x1, x2),
x2 = x2(b0 − b1x1 − b2x2) = f2(x1, x2) − u2x2,
0 ≤ u2 ≤ u2,
x(0) = x0. (15.13)
13 There is, however, also an economic reason for considering the zero horizon problem.Clark, for example, notes that “resource ownership forces the exploiter to adopt in essencean infinite discount rate” (Clark 1985, p. vi). Note, however, that we do not identify thecase of an infinite discount rate with an open access regime. These appear to be two distinctcases.

164 Depletion of Resources and Economic Growth
Here p, c, a0, a1, a2, b1, b2 are positive constants and b0 ∈ R, that is, weconsider selective harvesting of a predator by a sole owner who faces afixed price.
The current-value Hamiltonian of (15.13) is defined to be
H = λ0(px2 − c)u2 + λ1f1(x1, x2) + λ2(f2(x1, x2) − x2u2).
According to Pontryagin’s maximum principle (MP), if (x, u) is a solutionto (15.13), there exists λ(t) = (λ0, λ1(t), λ2(t)) such that
λ0 ∈ {0, 1}, λ(t) �= 0 for all t ≥ 0,
H(x(t), λ(t), u(t)) = max{H(x(t), λ(t), v) | 0 ≤ v ≤ u2}and
λ1 = δλ1(t) − ∂
∂x1H(x(t), λ(t), u(t)),
λ2 = δλ2(t) − ∂
∂x2H(x(t), λ(t), u(t)).
(15.14)
The latter are the adjoint equations. Let us call14 a solution (x(t), u(t)) tothe necessary conditions of the MP bang-bang on an interval I, if for allt ∈ I, u(t) = {0,us} and singular on I, if for all t ∈ I,
λ0(px2 − c) − λ2x2 = 0.
Clark (1990) and Ragozin and Brown (1985) conjecture the following.Turnpike Property: There exists a unique stationary solution (x∞, u∞)
to (15.13) that is singular on [0, ∞) and such that for every solution(x(t), u(t)) to (13),
limt→∞ x(t) = x∞.
The proviso has to be made that the stationary states with u2 = 0 andu2 = u2, respectively, are not optimal. In fact, these authors noted thatthere exists a unique stationary singular solution (x∞, u∞) to the MPconditions and a unique pair (x∗, u∗), (x∗∗, u∗∗) of singular solutions tothe MP conditions such that
limt→∞ x∗(t) = x∞ = lim
t→∞ x∗∗(t),
and [0, +∞)2 is divided into connected components by these solutions.They conjectured that any solution to (15.13) is steered in a bang-bang
14 For the following statement, see also Ragozin and Brown (1985).

Renewable Resources 165
fashion (most rapidly) to the stable manifold, which is composed of thetrajectories x∗ and x∗∗ and the equilibrium x∞.
A proof of the turnpike property of predator-prey systems (15.13)and perhaps some systems of competitive interactions would probablymake an important contribution to optimal control theory. How-ever, a numerical test with several sets of randomly chosen param-eters and a dynamic programming algorithm could already be fairlyconvincing.
There is an important literature where the turnpike property isproved, for example, Rockafellar (1976), Brock and Scheinkman (1976),Cass and Shell (1976), Carlson and Haurie (1987), and Sorger (1989).These authors, however, assume that the Hamiltonain H is concavejointly in u and x. In that case, with small discount rates an asymptot-ically stable optimal path is obtained; see Cass and Shell (1976), Brockand Scheinkman (1976), and Rockafellar (1976). For large discount rates,as demonstrated by Boldrin and Montrucchio (1986), irregular (chaotic)dynamic behaviors are admissible solutions in optimal growth theory.Under the hypotheses of a concave Hamiltonian H, other studies—such as Benhabib and Nishimura (1979) and more recently Docknerand Feichtinger (1991)—demonstrate that limit cycles exist. The demon-stration is undertaken via Hopf bifurcation analysis for the systemof state equations plus adjoint equations with control u eliminatedvia the MP.
In our case, the Hessian of H with respect to x and u is
λ1
∂2
∂x22
f1 + λ2∂2
∂x22
f2 λ0p− λ2
λ0p− λ2 0
.
The characteristic polynomial has a positive and negative root, whichshows that H is not concave jointly in x and u. Therefore, becausethe Hamiltonian is not of concave type, the cited literature on opti-mal growth theory does not apply directly to the problems we considerhere.15
We need to add, however, that in the present article our intentionis not to solve the aforementioned turnpike problem; rather, we showby examples that the turnpike property may fail to hold if prices areallowed to be nonconstant.
15 We want to note, however, that optimal growth theory has also departed from theassumption of a concave Hamiltonian. Based on original work of Clark (1971), a noncon-vex production technology is posited; see Majumdar and Mitra (1982), and Dechert andNishimura (1983). These publications show that for an economy with nonconvex technol-ogy (i.e., with first increasing then decreasing returns to scale) a sufficiently high δ willgive rise to a depletion of capital stock, causing the economy’s extinction.

166 Depletion of Resources and Economic Growth
15.3 OPEN ACCESS: ZERO HORIZON OPTIMIZATION
As mentioned, we characterize the open access exploitation as zerohorizon optimization problem. In theorem 15.3.1 we obtain the shape ofthe optimal effort depending on the elasticity of demand. Limit cyclesfor the predator-prey system and the system of competing species areestablished in theorems 15.3.2 and 15.3.3. The detected limit cycles arethen replicated in a numerical study. Let us first consider the impact ofthe elasticity of demand in the optimal effort.
15.3.1 Elasticity of Demand and Optimal Effort
We consider the effort vα(x) in the open access case (15.12), which bydefinition is determined by
vα = max{v | pα(xv)xv− cv ≥ 0; v ≥ 0},pα( y) = (γ0 + y)−α, (15.15)
where (x, v) stands for (x2, v2). Thus, only one effort, v2, is spent.Although the first resource is harvested as a byproduct, it is not salable.The second resource generates a yield y = x2v2.
Theorem 15.3.1 (open access optimal effort):
a. There is a unique solution vα(x) to (15.15):
vα(x) = 0 for 0 ≤ x ≤ γα0 ß,
and
vα(x) = c−1/αx1/α−1 − γ0x−1 for γα0 c < x.
b.v′α(x) > 0 ⇐⇒ 0 < α ≤ 1 or x < γα
0 c(
α
α − 1
)α
.
c. The optimal supply xvα(x) is increasing in x.
For a derivation of these results, see appendix A.1.
15.3.2 Predator-Prey System
Consider a predator-prey system, such as
x = x1(a0 − a1x1 − a2x2 − v1(x1)),
x = x2(−b0 − b1x1 − b2x2 − v2(x2)),(15.16)
where ai, bj are positive and v1, v2 non-negative but not necessarily opti-mal effort functions. We assume that (15.16) admits a unique stationary
Renewable Resources 167
state (x1, x2) in (0, +∞)2:
x1 > 0, x2 > 0,
a0 − a1x1 − a2x2 − v1(x1) = 0,
−b0 − b1x1 − b2x2 − v2(x2) = 0.
We shall call the function v : (0, +∞) → R increasing at xi(i = 1, 2) ifv(x′) < v(xi) < v(x′′) for 0 ≤ x′ ≤ xi ≤ x′′ < +∞, and locally decreasingat xi(i = 1, 2), if there exists ε > 0 such that v(x′) > v(xi) > v(x′′) forxi − ε < x′ < xi < x′′ < xi + ε.
Theorem 15.3.2 (limit cycles for the predator-prey system):
a. Suppose a1x1v1(x1) and b2x2 + v2(x2) are increasing at x1 andx2, respectively. Then (x1, x2) is globally asymptotically stable for(0, +∞)2; thus every trajectory with positive coordinates spiralstoward (x1, 2).
b. Suppose a1x1v1(x1) and b2x2 + v2(x2) is locally decreasing at x1 andx2, respectively. Then any trajectory that starts sufficiently close to(x1, x2) but is nonstationary spirals toward a limit cycle.
Note that the condition of a is satisfied if vi both are strictly increasingand the condition of b is satisfied if a1 +v′
1(x1) < 0, b2 +v′2(x2) < 0. Thus,
different dynamics are generated via the variation of the elasticity α. Forthe proof of theorem 15.3.2, see appendix A.3.
15.3.3 System of Competing Species
Generically, every trajectory of a system of two species that are compet-ing intraspecifically as well as interspecifically will converge to someequilibrium as time t tends to infinity; see Hirsch and Smale (1974). Itis therefore interesting to note that such a system may begin to oscil-late and even tend to a limit cycle when exploited. The system westudy is
x1 = x1(a0 − a1x1 − a2x2 − v1(x1)),
x2 = x2(b0 − b1x1 − b2x2 − k1v1(x1)).
Here the first species is harvested, and the harvesting technology isunable to select between x1 and x2. The system exhibits multiple equi-libria, which are studied in appendix A.4. A particular case, exhibitingthree equilibria, is depicted in figure 15.1.
Let σ+(σ−) be the trajectory that emanates from (tends to) x withincreasing (decreasing) first coordinates. Similarly let τ+(τ−) be the tra-jectory emanating from (tends to) y with first coordinates decreasing(increasing).

168 Depletion of Resources and Economic Growth
x2
x1w1 y1 z1
τ+ (t+) σ− (s−)
τ− (t−)
σ+ (s+)
Figure 15.1 Phase Portrayal for the System of Competing Species.
Let s+(s−) be the first instant t such that
σ+(t)1 = y1 and σ−(t)1 = y1, respectively.
Similarly, t+(t−) denotes the first instant t such that
τ+(t)t = y1 and τ−(t)t = y1, respectively.
The reader may thus convince him or herself that figure 15.1 illustratesthe following theorem.
Theorem 15.3.3 (limit cycles for the system of competing species): Ifσ+(s+)2 > τ−(t−)2, and τ+(t+)2 < σ−(s−)2 then a limit cycle aroundy exists.
In fact there are four isoclines and eight separatrices, two of whichtend to a limit cycle. Trajectories below τ− and to the left of x1 will tendto some (x+, 0). Those above τ+ and to the right of w1 will tend to some(0, y∗) where y∗ < +∞ if b2 > 0.
Let us now turn to the numerical study.16 For the predator-preysystem the following parameters are employed:
a0 = 1.04, a1 = 0.001, a2 = 0.07, b0 = 1.01, b1 = 0.2,
b2 = 0.001, c = 0.25, k1 = 1, γ0 = 1.
16 The subsequent parameters possibly generating limit cycles were obtained throughHopf bifurcation analysis by Harald Diefenbach.

Renewable Resources 169
For the system of competing species the parameters employed are
a0 = 3, a1 = 0.122, a2 = 0.75, b0 = 2.251, b1 = 0.0625,
b2 = 0.001, c = 0.25, k1 = 1, γ0 = 1.
The predator-prey system, in the open access case, α = 2, createslocally unstable trajectories. In fact, a limit cycle arises as predictedfrom theorem 15.3.2b; see figure 15.2.Thus, the fate of resources depends on the elasticity of demand.17
The result for the system of competing species are as follows. First, theopen access exploitation appears likely to drive a resource to extinctionwhen α is small. Figure 15.3 illustrates this for α = 1.
2 4 6 8 10 12 140
2
4
8
10
12
14
x2
x1
6
18
16
Figure 15.2 Predator-Prey, Open Access, α = 2, Initial Values (7,2).
17 Note that for the monopoly case with a discount rate tending to infinity, there are limitcycles predicted for α = 1; see appendix A.2. This was replicated by simulations that alsohave shown that a steeper demand curve, that is, a greater α creates larger cycles and theresources tended to be extinct. The result that the monopoly case is less conservative thanthe open access case for the predator-prey system contradicts the usual statement for one-dimensional resource examples where the sole owner appears to be more conservative(see Clark 1990, ch. 2.5). Note that according to the theorem 15.2.2 our results must alsohold in the monopoly case for finite but large discount rates.

170 Depletion of Resources and Economic Growth
0.06 0.08 0.10 0.120.04
x2
0.14 0.16x1
0.005
0.010
0.015
0.020
0.030
0.035
0.040
0.025
0.000
Figure 15.3 System of Competing Species, Open Access, α = 1, Initial Values(0.016,0.004).
With a less elastic demand, α = 2, a limit cycle18 arises as predictedby theorem 15.3.3; see figure 15.4.
The foregoing results were obtained by positing nonselective har-vesting. Usually, because of the nonintentional harvesting of the otherresources, nonselective harvesting is considered potentially more dan-gerous for the survival of them. In Semmler and Sieveking (1992)additional simulations are reported pertaining to selective harvesting.The results were that overall for the predator-prey system selective har-vesting appeared to be more conservative than nonselective harvesting(whereas for the system of competing species we obtained the reverseresult).
In sum, contingent on the elasticity of demand we find that for theopen access case both the predator-prey system as well as the system ofcompeting species admit limit cycles. These also occur for a sole ownerregime (when the discount rate tends to infinity or is very large). Regard-ing the conservation of resources, we show that open access exploitationis generally inferior to the sole owner regime—as demonstrated for
18 Note that for the monopoly case, with discount rate tending to infinity, already α = 1generates limit cycles that will be preserved for large discount rates. Thus, only in the caseα = 1 does a monopolist appear to be more conservative than the open access regime.

Renewable Resources 171
0 2 4 10 12 146 80.2
0.4
0.6
1.0
1.2
1.4
1.6
0.8
x2
x1
Figure 15.4 System of Competing Species, Open Access, α = 2, Initial Values(8,1).
the predator-prey system—and nonselective harvesting appears to notnecessarily be more destructive than selective harvesting.
15.4 THE MONOPOLY: INFINITE HORIZON OPTIMIZATION
Let us turn more specifically to the sole owner and the problemof the infinite horizon optimization. Here we expect, according totheorem 15.2.2, trajectories exhibiting limit cycles in the monopoly caseoccurring for δ → ∞ to be replicated,19 at least for large discount rates.We study a sampling of trajectories and analyze model versions whereall parameters are held fixed except the discount rate under which theoptimization, as described by (15.9), takes place. According to the onespecies theory, a lower discount rate is less critical for the survival of aspecies (see Clark 1990, chap. 2.5). For two or more species it may bejust the opposite, as the following simulations demonstrate. In fact, thelimit δ → 0 may result in extinction of the species. Results for a varyingdiscount rate are explored with respect to the systems of predator-prey
19 Limit cycles in the monopoly case for the discount rate tending to infinity are reported inthe previous section. Those simulations were employed as benchmark cases for studyingthe trajectories for finite discount rates.

172 Depletion of Resources and Economic Growth
and competitive interactions. We restrict our study to nonselective har-vesting. A dynamic programming algorithm as described in Semmlerand Sieveking (1992) is employed in computing the optimal trajectories.
Let us start again with the predator-prey system. Figure 15.5 depictsthe monopoly case for δ = 5.
As one can observe in the figure 15.5, the zero time-horizon optimiza-tion trajectory for the monopoly case, α = 1 (which should be the sameas in figure 15.2 for the open access, α = 2), is replicated for infinite timehorizon optimization with a large discount rate.
Further simulations with our dynamic programming algorithm wereundertaken for the monopoly case in the predator-prey system withdiminished discount rates. The results, for discount rates δ = 1, 5 andδ = 0.05 are shown in figures 15.6 and 15.7.
The limit cycles, depicting the optimal trajectories, appear to increasewith smaller discount rates. If δ tends to be small, for example δ = 0.05,one of the species tends to be driven to the axis.
Next we consider the system of competing species for a finite δ, againfor the monopoly case only. Note that now the corresponding limit cyclefor the monopoly with δ → ∞, α = 1, is figure 15.4 (open access, α = 2).
Figure 15.8 again exhibits a limit cycle for δ = 30, resembling thecorresponding figure 15.4.
2 4 10 12 146 80
2
4
6
8
10
12
14
16
18
20x2
x1
Figure 15.5 Predator-Prey, Monopoly, α = 1(δ = 5), Initial Values (7,2).

42 10 126 80
4
8
16
12
0 14 16
20
24
28
32
x2
x1
Figure 15.6 Predator-Prey, Monopoly, α = 1(δ = 1.5), Initial Values (7,2).
4 1280
4
8
16
12
0
20
24
28
32
36
16 20 24
x2
x1
Figure 15.7 Predator-Prey, Monopoly, α = 1(δ = 0, 05), Initial Values (7,2).
173

0 2 4 6 8 10 12x1
0.2
0.4
0.6
1.0
1.2
1.4
1.6
0.8
x2
Figure 15.8 System of Competing Species, Monopoly, α = 1(δ = 30), InitialValues (7,1).
0 2 4 6 8 10 12x1
0.2
0.4
0.6
1.0
1.2
1.4
1.6
1.8
0.8
x2
Figure 15.9 System of Competing Species, Monopoly, α = 1(δ = 10), InitialValues (4,8).
174

Renewable Resources 175
0 1 2 3 4 5 6 7x1
0.0
0.4
1.2
2.4
2.0
1.6
0.8
x2
Figure 15.10 System of Competing Species, Monopoly, α = 1(δ = 2), InitialValues (5, 0.8).
However, as exhibited in figure 15.9 for a discount rate δ = 10, thecycles tend to be more unstable, with one of the species driven toextinction.20
For a discount rate of δ = 2, as figure 15.10 shows, one species appearsto be completely driven to extinction.
As it turns out, in these examples, the discount rates do not have to betoo large to replicate the limit cycles (in fact, in the predator-prey exam-ple, figure 15.7, it is rather small). Moreover, as shown, in the contextof multispecies harvesting, lower discount rates do not necessarily giverise to a better resource conservation. Lower discount rates, as demon-strated for the systems of predator-prey and competing species mayadmit more unstable trajectories (and drive species to extinction).
15.5 CONCLUDING REMARKS
This chapter has studied the optimal exploitation of ecologically inter-related resources and demonstrates that propositions derived from
20 From figure 15.10 it is visible that there are points of extinction on the x1 and x2 axes.The fact that for certain discount rates the trajectories converge toward one of the axesindicates that there are bifurcation values for δ at which a new dynamic is generated.Several initial conditions were tried for simulations such as depicted in figure 15.9. Noneof them continued to generate a limit cycle.
176 Depletion of Resources and Economic Growth
models of harvesting of a single isolated resource only do not carry overto the case of ecologically interacting resources.21 As shown, the usefulanalytical distinction between zero time horizon and infinite time hori-zon optimization helps study the dynamics of interrelated resources andtheir final fate. The zero time-horizon optimization gives predictions forthe behavior of the trajectories in infinite time-horizon optimization forlarge discount rates. How large the discount rate has to be to reproducethe results from the zero optimization problem is explored by computersimulations. Those simulations undertaken by the aid of a dynamic pro-gramming algorithm can indeed track the predicted trajectories well.The amplitude and frequency of persistent cycles (limit cycles)—if theyexist—as well as extinction of resources can be investigated. Computersimulations are thus indispensable to explore, for example, for variousdiscount rates the fate of interacting resources when harvested underthe different regime studied.
Furthermore, our study revealed several substantive results ofinterest for resource economists and resource management. Ouranalytical (but in particular our numerical) study of optimal exploita-tion of interacting resources showed that (1) monopoly ownership isnot likely to conserve resources better than open access relations; (2)selective (in contrast to nonselective), harvesting will not always leadto superior results regarding the conservation of resources; (3) lowerdiscount rates may, contrary to what one might expect from a singleresource, give rise to greater instability of the trajectories and possiblylead to depletion of resources; and (4) the dynamics of resources dependon the elasticity of demand when the resource is sold on the market.We may tentatively summarize that the results of this study point tothe conclusion that management policies for a single resource are notnecessarily prudent in many circumstances for interacting resources.
Finally we note that when environmental resources are viewed asenvironmental assets, our method of using dynamic programming canalso compute the value of the value function at each point of the two-dimensional state space (if we have two interacting resources) and thusthe asset value of the resources. This is basically the discounted futurepayoff along the paths that are computed. Such a computation is under-taken in Grüne and Semmler (2004) where the value function, in additionto the dynamics of the state equations, are computed and shown howthe asset value behaves depending on the dynamics of the state vari-ables. The latter, as our examples in section 15.4 showed, can follow arather intricate dynamics, and one expects the same for asset value of
21 Note that optimization models for economic growth and resource extraction also havemostly considered only one (homogenous) resource; see the seminal work by Hotelling(1931), Dasgupta and Heal (1974), and Koopmans (1985). It would be of interest to recastthose types of models for the case when the extraction of interrelated resources is admitted.

Renewable Resources 177
the environmental resources. Yet because dynamic programming solvesfor the value function, it can also answer crucial questions on the pricingof environmental assets.22
Appendix
A.1 OPEN ACCESS OPTIMAL EFFORT (THEOREM 15.3.1)
Consider the function vα(x) as proposed in (15.15) with
pα( y) = ( y0 + y)−α; α > 0, y = xv(x)
for G(x, v) = pα/xv(x)) − (c/x) = 0; then
vα(x) = x−1[(cx−1)−1/α − γ0]= x−1[c−1/αx1/α − γ0]= c−1/αx1/α−1 − γ0x−1,
vα = 0 for 0 ≤ x ≤ γα0 c,
and
vα = c−1/αx1/α−1 − γ0x−1 for γα0 c < x;
v′α(x) = 1 − α
αc−1/αx1/α−2 + γ0x−2
and
v′α > 0 ⇔ γ0 ≥ α − 1
αc−1/αx1/α.
Therefore, v′α(x) > 0 ⇔ 0 < α ≤ 1 and decreasing for α > 1 because in
the latter case v′α < 0 ⇔ x > γα
0 c(
αα−1
)α
.
A.2 THE MONOPOLIST’S OPTIMAL EFFORT δ → ∞With δ → ∞ for the monopolist’s optimal effort, we have
a. There is a unique solutionuα(x) to 15.11 that is a smooth functionof x ≥ cγα
0 ; uα(x) = 0 for 0 ≤ x ≤ cγα0 .
b. The optimal supply yα(x) = xuα(x) is increasing in x and satis-fies limx→∞ yα(x) = γ0/α − 1 for α > 1 and limx→∞ y − α(x) =+∞ else.
22 For explicit examples of computing the asset value through dynamic programming,see Grüne and Semmler (2004) and Becker et al. (2007).

178 Depletion of Resources and Economic Growth
c. For α = 1,
u1(x) = c−1/2γ1/2x−1/2 − γ0x−1;
max u1 = 14c
, u′1(x) < 0 for x > 4γ0c.
d. If α > 1,uα(x) is increasing-decreasing with limx→+∞ uα = 0; if4/5 < α < 1, then uα(x) is increasing-decreasing-increasing withlimx→+∞ uα(x) = +∞; if 0 < α < 4/5, then uα(x) is increasingwith limx→+∞ uα(x) = +∞.
The case α = 1 then admits a limit cycle. Note that for α = 1 the effortuα(x), in the case of the monopolist, is the same for the open access casewith α = 2. For proofs of these propositions, see Semmler and Sieveking(1994b).
A.3 LIMIT CYCLE FOR THE PREDATOR-PREY SYSTEM(THEOREM 15.3.2)
Consider the functionH = a2x2logx2 +b1x1logx1 −b1x1 −a2x2. Note thatHx1x1(a2x2 − a2x2) + Hx2x2(−b1x1 + b1x1) = 0. Note also that togetherwith v1(x1) and v2(x2), the functions
v1 = v1(x1) + a1x1, v2 = v2(x2) + b2(x2)
are increasing at x1, x2. Therefore,
ddtH(x(t)) = Hx1x1(a0 − a1x1 − a2x2 − v1(x1))+
+Hx2x2(−b0 + b1x1 − b2x2 − v2(x2))
= Hx1x1(a1x1 + v1(x1) − a1x1 − v1(x1))
+Hx2x2b2x2 + v2(x2) − b2x2 − v2(x2))
= b1(x1 − x1)(v1(x1) − v1(x1))
+ a2(x2 − x2)(v2(x2) − v2(x2)) > 0.
Hence H is a Liapunov function on (0, +∞)2 and assertion a fol-lows. Also, b holds. We use the same Liapunov function as before. Thehypothesis that vi is locally decreasing at xi implies that any nonstation-ary trajectory near (x1, x2) spirals away from (x1, x2). It must then tendto a limit cycle provided the trajectory is bounded, which it is becauseof a1 + b2 > 0.

Renewable Resources 179
A.4 EQUILIBRIA FOR THE SYSTEM OF COMPETING SPECIES
Let (x1, x2) = e be a stationary state with positive coordinates. TheJacobian at such a state is[ −x1(a1 + v′
1(x1)) −x1a2−x2(b1 + k1v′
1(x1)) −x2b2
].
The roots if the corresponding characteristic polynomial are
λ± = −12[x1(a1 + v′
1(x1)) + x2b2] ± √d,
where d = (1/4)[x1(a1 + v′1(x1)) − x2b2]2 + x1x2a2(b1 + k1v′
1(x1)).Thus, if v′
1(x1) > 0, x will be stable or a saddle point. In fact, x will bea saddle point if and only if
(a2k1 − b2)v′1 > a1b2 − a2b1.
To simplify, we assume a1 = b2 = 0.If limit cycles turn out, small a1 > 0, b2 > 0 may be reintroduced
without destroying them, see Sieveking (1990).Let φ(x1) = b0 − b1x1 − k1v1(x1).If φ has two or more zeros, then it has at least three zeros on [0, +∞)
because since we assumev1 ≥ 0. At the first zero, sayw1, b1+k1v′1(w1) > 0
and the corresponding stationary state w = (w1,w2) is a saddle. At thesecond, say, y = (y1, y2), b1 + k1v′
1(y1) < 0. Therefore, y is repelling.A third one, z = (z1, z2), will again be a saddle. In the case of three sta-tionary states with positive coordinates, different phase portraits may beclassified according to the relative position of the separatrices emanatingfrom the saddles.

16
Regulation of Resources
16.1 INTRODUCTION
The work of Clark (1971, 1990) has demonstrated that governmentresource management is in particularly needed to avoid the depletion ofrenewable resources. Also the last chapter showed that resource man-agement appears to be indispensible regardless of whether resourcesare common property or owned privately.1 However, the regulatorymeans by which resources are managed are controversial. For commonproperty resources, a large number of instruments have been proposedfor pursuing a policy of resource conservation.2 Among them are quotaand licensing schemes, issuing and trading permits, levying taxes, for-mal entry restrictions for new firms, and subsidization of the exit offirms.
In this chapter we exemplify the problem of resource regulation bystudying the tax rate as regulatory instrument. Tax rates and other regu-latory instruments to reduce pollution were studied in chapter 10. Forthe use of the tax rates in ecological management problems, see Grüneet al. (2005). In this chapter we study how tax rate on operating firms canprevent renewable resources from depletion. The model underlying ourconsiderations here originates in a study by Clark (1990, pp. 118–122).In the present chapter some of Clark’s conjectures are explored. More-over, an extended version of the original Clark model is presented,and a dynamic programming algorithm is applied that replicates (bymeans of computer simulations) the model as well as an extendedversion.
Three features of the modeling approach to study regulatory prob-lems are worth mentioning. First, the regulated resource is assumed tobe renewable. It is extracted through an effort and a constant cost perunit of effort spent. Firms that extract the resource behave optimally.They maximize the present value of a return from their action in thecontext of an infinite horizon optimization model. Also, for reasons ofsimplicity, as commonly used in models of resource exploitation, we
1 A careful reading of Hotelling (1931) will reveal that even for exhaustible resourcessome “state interference” (Hotelling 1931, p.143) is needed, for example, in the form ofrestriction of resource exploitation or taxation.2 For an extensive discussion, however, in a static framework, see Dasgupta and Heal(1979), ch. 3.
180

Regulation of Resources 181
assume the output price to be fixed.3 Because there is only one resource,complicated interactions between different types of resources while oneis extracted are disregarded. As shown in the last chapter, the exploita-tion of interacting resources usually generates more intricate dynamics.An optimization model for this case but without regulatory policies ispresented in Semmler and Sieveking (1994b) and was also studied inthe previous chapter.
Second, the effort spent in extracting the resource is represented bya variable capacity utilization rate that is endogenously determined.Effort is thus not a control variable in the optimization model but astate variable. This approach originates in Clark (1990, pp. 118–122) andClark et al. (1979) where the effort cannot be reduced instantaneouslyby reducing the rented capital stock. With irreversible investment deci-sions, the capital stock might be reducible only slowly as argued in Clarket al. (1979), who relate their model back to a contribution by Arrowand Kurz (1970) on capital accumulation with irreversible investment.4
In our work, too, the capacity can be adjusted only slowly and there-fore cannot be a choice variable for the firms extracting the resource.This entails that firms also continue to undertake the operation, thoughthey temporarily face negative profits.5 In a more complete version ofour model then, we keep track of the budget constraint of the firmsso that in addition to the stock of the resource and the utilization rate,the evolution of the debt of firms also enters the dynamics of the statevariables.
A third feature of our model springs from the regulatory policy pro-posed in this chapter. To levy a fixed tax on the extraction of a resourceis surely not optimal and might not necessarily conserve the resource.What we discuss along the lines of Clark (1990, pp. 118–122) is an opti-mal tax. In the limit case, when the discount rate tends to infinity, theoptimal tax turns out to be of the bang-bang type: a simple feedbackcontrol of the tax rate with the tax rate high when the resource tends tobe depleted and low when the stock of the resource is large. This bang-bang policy (frequently employed as a rule of thumb) is shown to beoptimal. The varying tax rate also turns out to be optimal for the case ofa finite discount rate.6 A cyclical tax rate is thus the optimal regulatory
3 A variable price determined by an inverse demand function can easily be included insuch an approach. See Semmler and Sieveking (1994b).4 For an excellent survey on the theory and empirical evidence of irreversible investment,see Pindyck (1991).5 The fact that firms can be taxed more easily if investment is irreversible was alreadydiscussed in Kalecki (1938) who derives irreversible investment from the “time to build”or the gestation period of investment goods.6 Recently a number of papers have been published that study optimal taxes in the contextof two dimensional optimal growth models as originating in Lucas (1988) and Romer(1990). Here it is shown that a consumption or lump-sum tax are nondistortionary, whereasthe optimal income or profit taxes are zero. This means that a tax rate on income or

182 Depletion of Resources and Economic Growth
policy with a heavy tax rate applied when the stock of the resource islow and a low tax rate when the stock of the resource is high. Indeed,with certain assumptions on the “production function” governing thestock of the resource, limit cycles can be proved to exist for the stock ofthe resource, the utilization rate, and the optimal tax policy.
Though we focus here only on one regulatory instrument to regulateresources, the result may lend itself to wider implications. A varietyof public interventions, including aspects of quota policies, subsi-dies, entry restrictions, property right restrictions, and other regulatorymeans, such as issuing and trading of permits, may be studied in a sim-ilar manner. The results might potentially be interpreted as bearing onother aspects of governmental actions.
Section 16.2 lays out a three-dimensional model of resource exploita-tion that originates in Clark’s contribution. Clark’s original model doesnot introduce a budget constraint of firms and gives no analytical resultsregarding persistent cycles. For the two-dimensional variant, we analyt-ically demonstrate that the optimal tax is cyclical. The analytical study ofthe partial system provides us with predictions of how the trajectories ofthe full system will behave (see appendix). Section 16.3 demonstrates, byemploying a dynamic programming algorithm, that the cyclical trajec-tories remain preserved even if a dynamic equation for the evolution ofdebt is added to the dynamics. Section 16.4 provides some concludingremarks.
16.2 THE MODEL
Our intertemporal model of the extraction of resources originates inClark (1990, p. 118). There is a present value to be maximized. Thepresent value is the discounted stream of revenues of the firms, for exam-ple, in an industry extracting a renewable resource. There are three stateequations: one represents the law of motion for the exploitable resource(in Clark, for example, stock of fish); the second depicts the capacityutilization or effort E by which the resource is exploited.7 Because weallow firms to borrow from the capital market to close the budget gap,
a profit tax are inversely related to the growth rate of the economy. In the papers byChamley (1986), Judd (1987), Rebelo (1991), King and Rebelo (1990), and Lucas (1990)the effects of taxes—particularly capital tax—on growth are studied. Frequently, thesemodels, however, provide solely a steady-state analysis. With government expendituresviewed as pure consumption, it is then derived that capital tax should be zero at the steadystate. However, as in Jones et al. (1993) and Greiner et al. (2005, ch. 6) when governmentexpenditure is treated as productive input, then the optimal tax on capital also can benonzero at the steady state.7 A formulation of a model where the change of effort (the number of firms or amountof capital) is a sign preserving function of the excess profit earned in resource extractionwas first set up by Smith (1968) and later development further by Clark (1990) and Berck(1979). Some of the models in this tradition assume additionally that for each competitive

Regulation of Resources 183
there is a third state equation that characterizes the evolution of debt ofthe firms. The tax rate is the control variable (the optimality of whichClark has conjectured in a two-dimensional system.) The assumptionof a certain shape of the growth function F (see appendix) allows thedescription of the law of motion of the resource stock. The model readsas follows:
(∗)
Vmax∫∞
0 e−δtG(xt.Et,Dt)dtwith G(xt,Et,Dt) = (pxt − c)Et − φ(iDt)
subject to
E = kEt´[(p− τ)xt − c]. (16.1)
x = xt[F(xt) − Et], (16.2)
D = iDt − [(p− τ)xt − c]Et,τmin ≤ τmax x(0) = x0, E(0) = E0, (16.3)
where p is the price (taken as fixed), c is a constant extraction cost perunit of effort spent (c includes a rental price of capital), τ is the taxrate, k > 0 is a constant, and p > τmax. Similarly as in Clark (1990,p. 118) the objective is to maximize the (net) rent flow G(x1,E1,D1) ofthe extractive industry, which is then divided between the extractiveindustry, which receives the portion [(p − τ)x1 − c]E1, and the taxingauthority, which receives the remainder τx1E1. Note that the controlvariable τ does not appear under the integral.D is the debt of firms andi is the interest rate that is assumed to be different from the discountrate δ. Debt enters in the return function G(x1,E1,D1) that affects thenet present value of the industry.8 For reasons of simplicity, we assumeφ(iD1) = iD1. Equation (16.1) represents the evolution of the effort spentE and can be read as the capacity of the industry. Because x denotes thestock of resource, equation (16.2) depicts the change of the stock withF(·) describing its growth function and E denotes the effort by whichthe stock is reduced.
Equation (16.3) denotes the change of debt of the industry, the firstexpression being the debt service and the second the rent flow of theresource industry. Thus, firms borrow when the debt service is greaterthan the rent flow, otherwise, when they accumulate financial assets andreceive an interest payment iD1. Moreover, the tax τ is constrained to bebetween a feasible maximum and minimum level. This model will bestudied further in section 16.3.
The partial model put forward by Clark (1990, pp. 118–122) includesonly two state equations: one for the exploitable resource and the other
firm the price is equated instantly to marginal cost, and then with fixed cost present, theexcess of price over average cost will encourage entry.8 For details of such an approach see Asada and Semmler (1991).
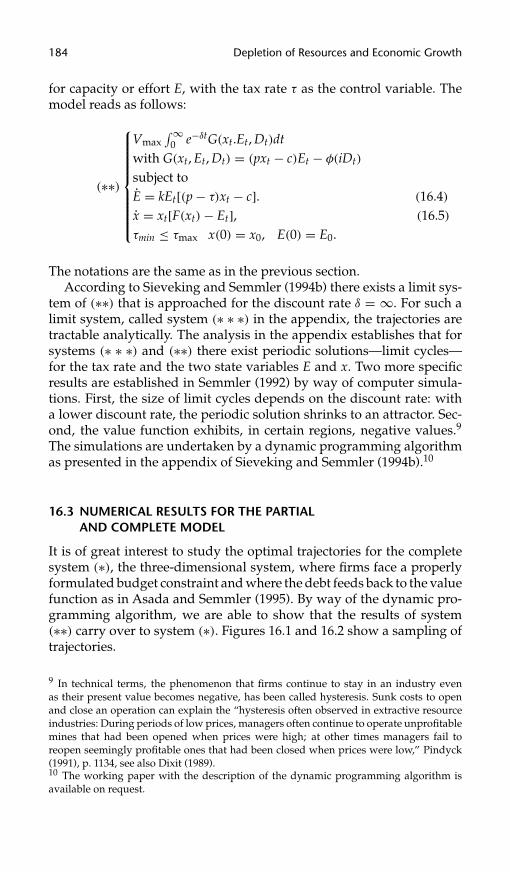
184 Depletion of Resources and Economic Growth
for capacity or effort E, with the tax rate τ as the control variable. Themodel reads as follows:
(∗∗)
Vmax∫∞
0 e−δtG(xt.Et,Dt)dtwith G(xt,Et,Dt) = (pxt − c)Et − φ(iDt)subject toE = kEt[(p− τ)xt − c]. (16.4)
x = xt[F(xt) − Et], (16.5)
τmin ≤ τmax x(0) = x0, E(0) = E0.
The notations are the same as in the previous section.According to Sieveking and Semmler (1994b) there exists a limit sys-
tem of (∗∗) that is approached for the discount rate δ = ∞. For such alimit system, called system (∗ ∗ ∗) in the appendix, the trajectories aretractable analytically. The analysis in the appendix establishes that forsystems (∗ ∗ ∗) and (∗∗) there exist periodic solutions—limit cycles—for the tax rate and the two state variables E and x. Two more specificresults are established in Semmler (1992) by way of computer simula-tions. First, the size of limit cycles depends on the discount rate: witha lower discount rate, the periodic solution shrinks to an attractor. Sec-ond, the value function exhibits, in certain regions, negative values.9
The simulations are undertaken by a dynamic programming algorithmas presented in the appendix of Sieveking and Semmler (1994b).10
16.3 NUMERICAL RESULTS FOR THE PARTIALAND COMPLETE MODEL
It is of great interest to study the optimal trajectories for the completesystem (∗), the three-dimensional system, where firms face a properlyformulated budget constraint and where the debt feeds back to the valuefunction as in Asada and Semmler (1995). By way of the dynamic pro-gramming algorithm, we are able to show that the results of system(∗∗) carry over to system (∗). Figures 16.1 and 16.2 show a sampling oftrajectories.
9 In technical terms, the phenomenon that firms continue to stay in an industry evenas their present value becomes negative, has been called hysteresis. Sunk costs to openand close an operation can explain the “hysteresis often observed in extractive resourceindustries: During periods of low prices, managers often continue to operate unprofitablemines that had been opened when prices were high; at other times managers fail toreopen seemingly profitable ones that had been closed when prices were low,” Pindyck(1991), p. 1134, see also Dixit (1989).10 The working paper with the description of the dynamic programming algorithm isavailable on request.

E
2.0
1.9
1.8
1.7
1.6
1.5
1.3
1.4
1.2
1.1
1.01.0 1.2 1.4 1.6 1.8 2.0
X2.2 2.4
Figure 16.1 Limit Cycle for (x,E) of System (∗)[δ = 1, D(0) = 0.1].
00.00
0.04
0.08
0.12
0.16
0.20
0.24
0.26
0.32
10 20 30 40 50 60 70 80t
τ
90 100
Figure 16.2 Optimal Tax Rate τ from System (∗)[δ = 1, D(0) = 0.1].
185

186 Depletion of Resources and Economic Growth
Figure 16.1 depicts the trajectories for x and E for the optimallycontrolled system (∗) when δ = 111 and the initial condition D(0) = 0.1.
As can be observed also for the system (∗) in the plane, there is alimit cycle for (x,E). The value function as obtained from our dynamicprogramming algorithm for the three-dimensional case (∗) has roughlythe same shape as reported for the system (∗∗) in Semmler (1994). Italso showed regions of negative values. Because of space limitation, weforgo a graph of it.
Next, we want to demonstrate the time path of the optimal tax rateresulting from system (∗). As can be seen in figure 16.2, the optimal taxrate is cyclical.
Thus, as depicted in figures 16.1–16.2, the limit cycle that result fromsystem (∗∗) remains preserved for system (∗), that is, even the evolu-tion of debt—with a feedback to the value function—is added. In thenumerical study for system (∗) we could, however, observe a slightlyunstable trajectory of the debt,Dt. This requires to study the critical levelof debt.12 Empirically, one would not expect the debt to increase with-out bounds. Firms in the industry would lose credit-worthiness. Thus,realistically, one should assume some bounds for an unstable trajectoryDt. These bounds are likely to feed back to the dynamics of system (∗)
and prevent a further explosion ofDt. This is likely to keep the dynamics(a limit cycle for x, E, and τ) inside those bounds.13
16.4 CONCLUDING REMARKS
In the context of an intertemporal optimization model with irreversibleinvestment, we show that optimal policies for protecting resources fromextinction might be cyclical. This is demonstrated to hold for an optimaltax rate in the context of a static optimization problem (zero horizonoptimization problem with discount rate tending to infinity) as well asan infinite horizon problem (finite discount rate). A periodic tax rateis the optimal regulatory policy with a heavy tax when the resourcestock is low, and a low tax rate is applied when the stock of resourceis large. Indeed, with certain assumptions on the production functiongoverning the growth of the resource, the optimal solution paths areperiodic. This holds for the capacity utilization rate, the stock of theresource, and the tax rate. These results appear to hold true for theoriginal two-dimensional Clark model as well as for a three-dimensional
11 Cyclical trajectories are also obtained for smaller discount rates; see Semmler (1994).12 Such a critical level of debt, although in a different model, is further explored inSemmler and Sieveking (1994b).13 It is easy to reformulate system (∗) in a way that it turns into different dynamicswhen the debt becomes too high but where for a level of debt below an upper boundthe old dynamics (∗) remain intact. This way the dynamics would only change at outerboundaries, keeping a limit cycle inside those boundaries.

Regulation of Resources 187
extension of it that includes a budget constraint of firms in the extractiveindustry.
Technically, the problem under consideration is of broader interest.Two methods are employed that admit a study of the out-of-steady-statedynamics of an intertemporal optimization problem. First, the infinitehorizon optimization problem is reduced to a zero horizon problemwhere the control variable can be computed explicitly in feedback formand the system’s dynamics can be studied analytically; see the appendix.Second, a dynamic programming algorithm permits computation forour chosen parameter constellations of the optimal trajectories for theinfinite horizon problem with a finite discount rate. The dynamics fromthe first system (zero horizon problem, system (∗ ∗ ∗)) carry over tothe second system (infinite horizon, finite discount rate, system (∗∗)).In addition, by way of computer simulations, it is also shown that thedynamics reappear for the three-dimensional system where the evo-lution of financial structure of firms is modeled in a third differentialequation, system (∗). Another technical aspect is also of interest. In themodel, the control variable does not appear in the return function, butrather in the state equations. An appropriate transformation, however,can be shown to lead back to a common optimization problem with thecontrol variable included in the return function.
Last, we want to note that there are, of course, other regulatory instru-ments for controlling the overuse of renewable resources. In resourceeconomics, in addition to taxes, the effects of property rights, quota,and license schemes issuing and trading of permits as well as instru-ments limiting entry into extractive industries have been discussedextensively.14 Most of the studies on the regulation of extractive indus-tries, however, do not consider the effects of the regulatory instrumentsin the context of a dynamic decision model, and it is therefore not clearwhether the advantages and disadvantages of regulatory policies dis-cussed in the static model would carry over to dynamic models. Forexample, employing quotas or entry restrictions to an extractive indus-try, in the context of our model, will affect industry effort E and thisintroduce an upper bound for the state variable E. Without going intoa deeper analysis of this problem, one can conjecture that the cyclicalsolutions resulting from a control by taxation will most likely be altered,depending, however, on the specification of the kind of quota schemeemployed. Preliminary work along this line, with one state variableonly, has been undertaken by Clark (1990, ch. 8). Also in the context ofour model, this would be a worthwhile question to pursue further in afuture study.
14 For an elaborate discussion of advantages and disadvantages of different regulatorymeans, see Dasgupta and Heal (1979, ch. 3) and Clark (1990, ch. 8).
188 Depletion of Resources and Economic Growth
Another important regulatory instrument is currently discussed inthe context of how to control carbon emission that is now proved togive rise to global warming. In part II of the book, we have discussedtax rates and abatement policy instruments. Recently, to fulfill the Kyotoagreement on the reduction of carbon emission until 2012, the tradingof carbon emission has been introduced as regulatory instrument inEurope. National governments in the EU are required to agree (since2005) to reduce carbon emission in certain industries, for example, steel,chemical, and electricity production. Some success seems to be visible,but whether this instrument will effectively reduce carbon emission inthe long run remains to be seen.15
AppendixThe limit system of (∗ ∗ ∗), with δ → ∞, is
(∗ ∗ ∗)
maxG(x,E, τ)subject toE = kEt[( p− τ)xt − c]. (16.6)
x = xt[F(xt) − Et], (16.7)
τmin ≤ τmax x(0) = x0, E(0) = E0.
Thus, with δ → ∞, a static optimization problem arises.16 To obtain(∗ ∗ ∗), we employ partial integration after writing y = (x,E). Expressthe integral in (∗∗) as∫ x
0e−δtG( yt)dt = −1/δG( y0) + 1/δ
∫ x
0e−δtG′( yt)ydt.
Thus G(yt) = (pxt − c)Et is replaced by the expression
G(x,E, τ)0px[F(x) − E]e + ( px − c)kE[( p− τ)x − c]. (16.8)
When δ → ∞ and (∗ ∗ ∗) is obtained, (16.8) is to be maximized. Thederivative of (16.8) with respect to τ yields
−( px − c)kEτx (16.9)
(16.8) is maximized if
τ ={
τ ′min for px ≥ c,
τ′max for px ≤ c.
15 In particular, a cap on carbon emissions in industries leaves open the questions ofcarbon emission in energy production, transport, households, and other areas of economicand social life.16 A theorem explaining this procedure is presented in Sieveking and Semmler (1994b).

Regulation of Resources 189
For the optimization with zero time horizon, as represented by (∗∗∗),a bang-bang control arises.
For (∗ ∗ ∗) the following three equilibria exist:
(E0) : (0, 0). (E1) : (x1, F(x1)), (E2) : (x2, 0)
with x1 = c/(p− τmin) and x1 < x2.The characteristic polynomial of the Jacobian, for example, at the
equilibrium (E1) is
χE1(λ) = λ2 − x1F′(x1)λ + ckF(x1),
with roots 1/2x1F′(x1) =√
1/4x21[F′(x1)2 − ckF(x1)]. Hence if F′(x1) > 0,
then (E1) is a repeller. The characteristic polynomial at (2) is
χE2(λ) = (x2F′(x2) − λ)((p− τmin)x2 − c− λ),
with λ1(E2) = x2F′(x2) and λ2(E2) = (p− τmin)x2 − c.A phase portrait in Semmler (1994) shows that there is a invariant
compact set. All trajectories will enter this set. Moreover, if f ′(x1) > 0,all trajectories may not tend to one of the equilibria (E0), (E1), or (E2) andmust therefore tend to a limit cycle. (For limit cycles in related model,see Feichtinger et al. [1991]).
There are two interesting cases.
Case 1: F(x) = rx(1−xK−1). Thenx2 = K andF′(x2) > 0 ↔ c < 1/2K(p − τmin). In this case there is a limit cycle for (∗ ∗ ∗), hence,with sufficiently large δ also for (∗∗).17
Case 2: F(x) = r(1 − xK−1). Consider
H(x,E) = q(x − x1 ln x) + E− F(x1)ln E,
where q = (p− τmin)k.H is a Liapunov function for (∗∗∗). Then
H(x,E) = ∂H∂xx + ∂H
∂EE
= q(
1 − x1
x
)x(F(x) − E) +
(1 − F(x1)
E
)kE[(p− τmin)x − c]
= k(x − x1)(F(x) − F(x1)).
H is a Liapunov function provided that (x−x1)( f (x)−F(x1)) < 0for x ≥ 0.
Thus, in case 2, (E1) is a global attractor for the limit system (∗ ∗ ∗)
on (0.+∞). In fact, asymptotic stability was conjectured by Clark (1990,p. 118) also for finite δ > 0.
17 The latter conclusion is shown to hold in Semmler and Sieveking (1994b).

17
Conclusion
Since the industrial take-off of many countries more then 150 years ago,the industrialization of countries in the North has increased their incomeper capita by roughly 2 percent a year. Since the end of the nineteenthcentury, the United States, for example, experienced an increase of percapita income by a factor of 10. The industrialization has spread in thetwentieth century with many Asian countries taking off and catchingup with the advanced countries. Yet the long-run process of economicgrowth and the rapidly spreading globalization in the past decades havealso exhausted nonrenewable and renewable resources and led to thedeterioration of the environment in some parts of the world. There isa rising concern of academics and politicians that the exhaustion ofresources, the global change of the environment, and the climate changemay have detrimental effects on economic activity and living conditionsof future generations. To study those issues in a transparent and coherentframework, we designed small-scale models that have allowed us tostudy those issues and the implications for growth, environmental, andresource policies in a proper way.
In the first part of the book we analyzed in a small-scale model theinterrelation between economic growth, the environment, and welfareof a country. We also introduced and discussed fiscal policy—incometaxation, public investment, and abatement policies—and show howthose can be used as instruments to improve the environment as wellas economic growth. More specifically, we studied variants of modelsof endogenous growth with productive public spending and pollution,where we assume that pollution affects the utility of the household sectorbut not production possibilities directly. This assumption was madebecause it is obvious that environmental degradation affects growthif it has negative repercussions on production possibilities, whereas agrowth effect is not so obvious if only utility is affected by pollution.
The analysis has demonstrated how a good policy can influence eco-nomic growth and welfare in the long run. We have seen that an increasein the pollution tax rate may raise the growth rate if sufficiently enoughof the additional tax revenue is used for productive public spending,which stimulates the incentive to invest. This also means that a higherpollution tax rate, leading to a smaller increase in effective pollution, canreduce the balanced growth rate. Furthermore, we show that growthand welfare maximization may be different goals, particularly if the
190

Conclusion 191
fiscal policy under consideration exerts a direct effect on the level ofpollution. This result may be of particular relevance for developingcountries and fast growing economies such as some Asian countriesat the end of the twentieth century and the beginning of the twenty-firstcentury. Concerning the dynamics of our model, we could demon-strate that indeterminate equilibrium paths may emerge, dependingon the strength of the effect of pollution. Thus, pollution not only affectsthe growth rate in the long run, but may also be crucial as far as the tran-sitional growth rate as well as regarding the question of to which growthrate the economy converges. Finally, we demonstrated that fiscal policymay lead to overshooting the variables, implying the transitional effectsof economic policy differ from its long-run effects. Hence, a fiscal policythat raises the balanced growth rate may lead to temporarily smallergrowth rates of economic variables.
We also analyzed a model economy where the environmental qualityis either constant, improves, or deteriorates over time. The analysis ofthis model has demonstrated that sustained economic growth is com-patible with a constant or improving environmental quality only if theproduction technology in use is not too polluting. It also turned outthat an economy with a cleaner environment can only generate a higherbalanced growth rate if the intertemporal elasticity of substitution ofconsumption is relatively high. This holds because with a high intertem-poral elasticity of substitution, the marginal utility of consumption ishigher in the future in those scenarios where the environmental qual-ity is relatively clean. Therefore, the household is more willing to forgoconsumption and shift it into the future in those scenarios implying acleaner environment.
In the second part of the book, we studied the interaction of growthand global warming. This is also done within the framework of endoge-nous growth models. We presumed a simple endogenous growth modelin which positive externalities of physical capital are the source of per-sistent growth. As for the modeling of the environment and the climatesystem, we integrated an energy balance model in the respective eco-nomic model and posited that deviations of the actual temperature fromthe preindustrial level imply damages by negatively affecting aggre-gate production. We analyzed both descriptive growth models as wellas models with optimizing agents. An important result in this respectis that we could derive (which turned out to be quite robust) thateconomies with more polluting technologies should spend relativelymore for abatement activities but nevertheless can emit more green-house gases compared to countries with less polluting technologies.This outcome is obtained because it is cheaper for economies with acleaner technology to avoid emissions, so overall emissions in thesecountries should be lower. Furthermore, allowing for a nonlinear feed-back effect of a higher average temperature in the climate subsystem,

192 Depletion of Resources and Economic Growth
we could show that the economy may be characterized by multiplelong-run balanced growth paths, implying that in this case initial con-ditions are crucial as to which equilibrium is obtained. Thus, there aretipping points where climate policies strongly matter to obtain desir-able outcomes. This result is obtained on the basis of a carbon tax as aregulatory instrument which is preferred to a cap and trade system inour study.
The third part was concerned with economic growth and renew-able and nonrenewable resources as well as with policies to preventoverextraction of those resources. With the currently ongoing process ofglobal growth, there is a high demand for renewable and nonrenewableresources. This implies a strong externality effect across generations.The currently depleted resources are not available for future genera-tions. For renewable and nonrenewable resources, we discussed theconcept of sustainable growth and study how resource constraints canbe overcome by substitution and technical progress. By building reason-able small-scale growth models for nonrenewable resources, we studiedthose issues and also estimated model variants and studied the time toexhaustion of specific resources.
Concerning renewable resources, we also explored small-scaledynamic decision models, which allowed us to analyze the fate of theresources when they are extracted. We were able to demonstrate that theusual results one obtains from the optimal exploitation of one resourcedo not carry over to ecologically interacting resources. Technically, wealso showed how short and long horizon models hang together. Wedemonstrated how competition, in particular in a short time horizoncontext, leads to a faster depletion of resources. We also addressed thepolicy question of how regulatory instruments can be used to preventthe overextraction of natural resources. Although only tax rates are ana-lyzed as regulatory instruments to prevent the depletion of the naturalresources, we demonstrated that our approach lends itself to the studyof other regulatory instruments.
It is worth reminding the reader that the issue of public regulationof the overextraction of natural resources was at the heart of the begin-ning of studies on natural resources.1 As Hotelling (1931) pointed out,natural resources are not properly regulated under either free competi-tion (which may lead to an overexploitation of resources) or monopoly(which may lead to high prices and monopoly profits). Some pub-lic regulation is needed. In part III of the book, we came to similarconclusions.
Essential for the externality effects on future generations—either theoveruse of resources or pollution and climate change—is the size of the
1 See, for example, the seminal paper by Hotelling (1931), using an intertemporalframework.

Conclusion 193
discount rate. Already Hotelling (1931) made a difference between themarket operation for which it is reasonable to use a market rate of interestas discount rate and some resources of social value that may be valuedhigher (and thus discounted at a lower rate) than for the production ofmarket goods. The size of the discount rate has also become crucial inthe discussion on the Stern (2006, 2007) report, where it is argued thatthe almost zero discount rate, will overrate future damages arising fromglobal warming and overstate current cost to make future damages lesslikely.2 Yet, following Hotelling’s distinction, it might make sense tosuggest two different discount rates, one for resources of social valueand one for market goods.
Overall, we presented a type of work that helps integrate the researchon environmental and climate issues, as well as research on renewableand nonrenewable resources, into a consistent economic framework thattakes the perspective of modern growth theory.
2 For a detailed discussion on the issue of the discount rate see Nordhaus (2007a) andWeitzmann (2007c).

Appendix: Three Useful Theoremsfrom Dynamic Optimization
In this book, we have presumed that economic agents behave intertem-porally and perform dynamic optimization. In this appendix, we presentsome basics of the method of dynamic optimization using Pontryagin’smaximum principle and the Hamiltonian.
Let an intertemporal optimization problem be given by
maxu(t)
W(x(0), 0),W(·) ≡∫ ∞
0e−ρtF(x(t), u(t))dt, (A.1)
subject to
dx(t)dt
≡ x(t) = f (x(t), u(t)), x(0) = x0, (A.2)
with x(t) ∈ Rn the vector of state variables at time t and u(t) ∈ � ∈ R
m
the vector of control variables at time t and F : Rn × R
m → R andf : R
n × Rm → R
n. ρ is the discount rate and e−ρt is the discountfactor.F(x(t), u(t)), fi(x(t), u(t)), and ∂fi(x(t), u(t))/∂xj(t), ∂F(x(t), u(t))/∂xj(t)
are continuous with respect to all n + m variables for i, j = 1, . . . , nFurther, u(t) is said to be admissible if it is a piecewise continuousfunction on [0, ∞) with u(t) ∈ �.
Define the current-value Hamiltonian H(x(t), u(t), λ(t), λ0) as follows:
H(x(t), u(t), λ(t), λ0) ≡ λ0 F(x(t), u(t)) + λ(t) f (x(t), u(t)), (A.3)
with λ0 ∈ R a constant scalar and λ(t) ∈ Rn the vector of co-state vari-
ables or shadow prices. λj(t) gives the change in the optimal objectivefunctional Wo resulting from an increment in the state variable xj(t). Ifxj(t) is a capital stock, λj(t) gives the marginal value of capital at time t.Assume that there exists a solution for (A.1) subject to (A.2). Then, wehave the following theorem.
Theorem A.1 Let uo(t) be an admissible control and xo(t) is the trajec-tory belonging to uo(t). For uo(t) to be optimal, it is necessary that there
194

Appendix: Three Useful Theorems from Dynamic Optimization 195
exists a continuous vector function λ(t) = (λ1(t), . . . , λn(t))with piecewisecontinuous derivatives and a constant scalar λ0 such that
a. λ(t) and xo(t) are solutions of the canonical system
xo(t) = ∂
∂λH(xo(t), uo(t), λ(t), λ0),
λ(t) = ρλ(t) − ∂
∂xH(xo(t), uo(t), λ(t), λ0).
b. For all t ∈ [0, ∞) where uo(t) is continuous, the following inequalitymust hold: H(xo(t), uo(t), λ(t), λ0) ≥ H(xo(t), u(t), λ(t), λ0),
c. (λ0, λ(t)) �= (0, 0) and λ0 = 1 or λ0 = 0.
Remarks:
1. If the maximum with respect to u(t) is in the interior of �,∂H(·)/∂u(t) = 0 can be used as a necessary condition for a localmaximum of H(·).
2. It is implicitly assumed that the objective functional (A.1) takeson a finite value, that is,
∫∞0 e−ρtF(xo(t), uo(t)) < ∞. If xo and uo
grow without an upper bound F(·) must not grow faster than ρ.
Theorem A.1 provides only necessary conditions. The next theoremgives sufficient conditions.
Theorem A.2 If the Hamiltonian with λ0 = 1 is concave in (x(t), u(t))jointly and if the transversality condition limt→∞ e−ρtλ(t)(x(t)−xo(t)) ≥0 holds, conditions a and b from theorem A.1 are also sufficient for anoptimum. If the Hamiltonian is strictly concave in (x(t), u(t)) the solutionis unique.
Remarks:
1. If the state and co-state variables are positive the transversalitycondition can be written as stated in the foregoing chapters,that is, as limt→∞ e−ρtλ(t)xo(t) = 0.1
2. Given some technical conditions, it can be shown that thetransversality condition is also a necessary condition.
Theorem A.2 requires joint concavity of the current-valueHamiltonian in the control and state variables. A less restrictive theoremis the following.
Theorem A.3 If the maximized Hamiltonian
Ho(x(t), λ(t), λ0) = maxu(t)∈�
H(x(t), λ(t), λ0)
1 Note that in the book we did not indicate optimal values by o.

196 Appendix: Three Useful Theorems from Dynamic Optimization
with λ0 = 1 is concave in x(t) and if the transversality conditionlimt→∞ e−ρtλ(t)(x(t) − xo(t)) ≥ 0 holds, conditions a and b fromtheorem A.1 are also sufficient for an optimum. If the maximizedHamiltonian Ho(x(t), λ(t), λ0) is strictly concave in x(t) for all t, xo(t)is unique (but not necessarily uo(t)).
Because the joint concavity of H(x(t), u(t), λ(t), λ0) with respect to(x(t), u(t)) implies concavity of Ho(x(t), λ(t), λ0) with respect to x(t), butthe reverse does not necessarily hold, theorem A.3 may be applicablewhere theorem A.2 cannot be applied.
The three theorems demonstrate how optimal control theory canbe applied to solve dynamic optimization problems. The main role isplayed by the Hamiltonian (A.3). It should be noted that in most eco-nomic applications, as in this book, interior solutions are optimal so that∂H(·)/∂u(t) = 0 can be presumed. For further reading and more detailsconcerning optimal control theory, we refer to the books by Feichtingerand Hartl (1986) or Seierstad and Sydsaeter (1987).

Bibliography
Arrow, K. and M. Kurz (1970) Public Investment, the Rate of Return, and OptimalFiscal Policy. Baltimore: John Hopkins Press.
Asada, T. and W. Semmler (1995) “Growth, Finance and Cycles: An Inter-temporal Model.” Journal of Macroeconomics 17(4): 623–649.
Aschauer, D.A. (1989) “Is Public Expenditure Productive?” Journal of MonetaryEconomics 23: 177–200.
Azar, C. and S.H. Schneider (2003) “Are the Economic Costs of (Non-)Stabilizingthe Atmosphere Prohibitive? A Response to Gerlagh and Papyrakis.”Ecological Economics 46: 329–332.
Barro, R.J. (1990) “Government Spending in a Simple Model of EndogenousGrowth.” Journal of Political Economy 98: S103–S125.
Becker, S., L. Grüne and W. Semmler (2007) “Comparing Accuracy of Second-order Approximation and Dynamic Programming.” Computational Economics30: 65–91.
Beckerman, W. (1974) In Defence of Economic Growth. London: Trinity Press.Beltratti, A., G. Chichilnisky and G.M. Heal (1994) “The Environment and the
Long-Run: A Comparison of Different Criteria.” Richerche Economiche 48:319–340.
Benhabib, J. and R.E.A. Farmer (1994) “Indeterminacy and Increasing Returns.”Journal of Economic Theory 63: 19–41.
Benhabib, J. and K. Nishimura (1979) “The Hopf-Bifurcation and the Existenceand Stability of Closed Orbits in Multisector Models of Optimal Growth.”Journal of Economic Theory 21: 412–444.
Benhabib, J. and R. Perli (1994) “Uniqueness and Indeterminacy: On theDynamics of Endogenous Growth,” Journal of Economic Theory 63: 113–142.
Benhabib, J., Q. Meng and K. Nishimura (2000) “Indeterminacy under ConstantReturns to Scale in Multisector Economies.” Econometrica 68: 1541–1548.
Benhabib, J., R. Perli and D. Xie (1994) “Monopolistic Competition, Indetermi-nacy and Growth.” Ricerche Economiche 48: 279–298.
Berck, P. (1979) “Open Access and Extinction.” Econometrica 47(4): 877–883.Boldrin, M. and L. Montrucchio (1986) “On the Indeterminacy of Capital Accu-
mulation Paths.” Journal of Economic Theory 40: 26–39.Bovenberg, L.A. and R.A. de Mooij (1997) “Environmental Tax Reform and
Endogenous Growth.” Journal of Public Economics 63: 207–237.Bovenberg, L.A. and S. Smulders (1995) “Environmental Quality and Pollution-
Augmenting Technological Change in a Two-Sector Endogenous GrowthModel.” Journal of Public Economics 57: 369–391.
Brock, W.A. and J.A. Scheinkman (1976) “Global Asymptotic Stability of Opti-mal Control System with Applications to the Theory of Economic Growth.”Journal of Economic Theory 12: 164–190.
197

198 Bibliography
Brock, W.A. and M.S. Taylor (2004) “Economic Growth and the Environment:A Review of Theory and Empirics.” NBER Working Paper, 10854.
Broecker, W.S. (1997) “Thermohaline Circulation, the Achilles Heel of OurClimate System: Will Man Made CO2 Upset the Current Balance?” Science278: 1582–1588.
Brundtlandt Commission (1987) Report of the World Commission on Environmentand Development. Our Common Future. United Nations.
Buonanno, P., C. Carraro and M. Galeotti (2003) “Endogenous Induced Tech-nical Change and the Costs of Kyoto.” Resource and Energy Economics 21:11–34.
Byrne, M. (1997) “Is Growth a Dirty Word? Pollution, Abatement and Endoge-nous Growth.” Journal of Development Economics 54: 261–284.
Carlson, D.A. and A. Haurie (1987) Infinite Horizon Optimal Control, Theoryand Applications. Heidelberg: Springer. Lecture Notes in Economics andMathematical Systems, vol. 290.
Cass, D. and K. Shell (1976) “The Structure and Stability of CompetetiveSystems.” Journal of Economic Theory 12: 31–70.
Chamley, C. (1986) “Optimal Taxation of Capital Income in General Equilibriumwith Infinite Lives.” Econometrica 54(3): 607–622.
Chichilnisky, G. (1996) “What Is Sustainable Development?” Paper presentedat Stanford Institute for Theortical Economics, 1993; published as “AnAxiomatic Approach to Sustainable Development,” Social Choice and Wefare13(2): 219–248.
Citibase (1998). U.S. Basic Economics Database, Ball Sate University,Muncie, IN.
Clark, C.W. (1971) “Economically Optimal Policies for the Utilization ofBiologically Renewable Resources.” Mathematical Bioscience 17: 245–368.
——— (1985) Bioeconomic Modelling and Fishery Management. New York: WileyInterscience.
——— (1990) Mathematical Bioeconomics: The Optimal Management of RenewableResources. New York: J. Wiley. (first ed. 1976).
Clark, C.W., F.H. Clarke and G.R. Munro (1979) “The Optimal Exploita-tion of Renewable Resource Stocks: Problems of Irreversible Investment.”Econometrica 47: 25–47.
Conrad, J.M. and R. Adu-Asamoah (1986) “Single and Multispecies Systems:The Case of Tuna in the Eastern Tropical Atlantic.” Journal of EnvironmentalEconomics and Management 13: 50–86.
Daly, H.E. (1987) “The Economic Growth Debate: What Some EconomistsHave Learned But Many Have Not.” Journal of Environmental Economics andManagement 14(4): 323–336.
Dasgupta, P. and G. Heal (1974) “The Optimal Depletion of ExhaustibleResources.” Review of Economic Studies (Symposium on the Economic ofExhaustible Resources): 3–28.
——— (1979) Economic Theory and Exhaustible Resources. Welwyn: CambridgeUniversity Press.
Dechert, W.D. and K. Nishimura (1983) “A Complete Characterization of Opti-mal Growth Path in an Agregate Model with Non-Concave ProductionFunction.” Journal of Economic Theory 31: 332–354.

Bibliography 199
Deke O., K.G. Hooss, C. Kasten, G. Klepper and K. Springer (2001) “Eco-nomic Impact of Climate Change: Simulations with a Regionalized Climate-Economy Model.” Kiel Working Paper, no. 1065.
Deutsch, C., M.G., Hall, D.F., Bradford and K., Keller, (2002) “Detectinga Potential Collapse of the North Atlantic Thermohaline Circulation: Impli-cations for the Design of an Ocean Observation System.” Mimeo PrincetonUniversity.
Dixit, A. (1989) “Entry and Exit Decisions under Uncertainty.” Journal of PoliticalEconomy 97(3): 620–638.
Dockner, E.J. and G. Feichtinger (1991) “On the Optimality of Limit Cycles inDynamic Economic Systems.” Journal of Economics 53: 31–50.
Energy Information Administration. Official Energy Statistics from the U.S.Government (www.eia.doe.gov).
Falcone, M. (1987) “A Numerical Approach to the Infinite Horizon Problemof Deterministic Control Theory.” Applied Mathematics and Optimization 15:1–13.
Falk, I. (1988) “A Dynamic Model of Interrelated Renewable Resources.”Resources and Energy 10: 55–77.
Fankhauser, S. (1995) Valuing Climate Change. The Economics of the GreenhouseEffect. London: Earthscan.
Feichtinger, G. and R.F. Hartl (1986) Optimale Kontrolle Ökonomischer Prozesse:Anwendungen des Maximumprinzips in den Wirtschaftswissenschaften. Berlin:de Gruyter.
Feichtinger, G., V. Kaitala and A. Novak (1991) “Stable Resource-EmploymentLimit Cycles in an Optimally Regulated Fishery.” Mimeo, University ofTechnology, Vienna.
Forster, B.A. (1973) “Optimal CapitalAccumulation in a Polluted Environment.”Southern Economic Journal 39: 544–547.
Futagami, K., Y. Morita and A. Shibata (1993) “Dynamic Analysis of an Endoge-nous Growth Model with Public Capital.” Scandinavian Journal of Economics95: 607–625.
Gassmann, F. (1992) “Die wichtigsten Erkenntnisse zum Treibhaus-Problem.”In Schweizerische Fachvereeinigung für Energiewirtschaft, ed., Wege in eineCO2–arme Zukunft. Zürich: Verlag der Fachvereine, pp. 11–25.
Gerlagh, R. (2004) “Climate Change and Induced Technological Change.”Paper presented at the 13th Annual Conference of the European Asso-ciation of Environmental and Resource Economics (EAERE). Available ateaere2004.bkae.hu/download/paper/gerlaghpaper.pdf.
Gerlagh, R. and E. Papyrakis (2003) “Are the Economic Costs of (Non-)Stabilizing the Atmosphere Prohibitive? A Comment.” Ecological Economics46: 325–327.
Gordon, F.S. (1954) “The Economic Theory of a Common Property Resource:The Fishery.” Journal of Political Economy 62: 124–138.
Gradus, R. and S. Smulders (1993) “The Trade-Off between Environmental Careand Long-Term Growth—Pollution in Three Prototype Growth Models.”Journal of Economics 58: 25–51.
Greiner A. (2004a) “Anthropogenic Climate Change in a Descriptive GrowthModel.” Environment and Development Economics 9: 645–662.

200 Bibliography
Greiner A. (2004b) “Global Warming in a Basic Endogenous Growth Model.”Environmental Economics and Policy Studies 6: 49–73.
——— (2005a) “Fiscal Policy in an Endogenous Growth Model with PublicCapital and Pollution.” Japanese Economic Review 56: 67–84.
——— (2005b) “Anthropogenic Climate Change and Abatement in a Multi-Region World with Endogenous Growth.” Ecological Economics 55: 224–234.
——— (2007) “The Dynamic Behaviour of an Endogenous Growth Modelwith Public Capital and Pollution.” Studies in Nonlinear Dynamics andEconometrics 11.
Greiner, A. and W. Semmler (2005) “Economic Growth and Global Warming:A Model of Multiple Equilibria and Thresholds.” Journal of EconomicBehaviour and Organization 57: 430–447.
Greiner, A., W. Semmler and G. Gong (2005) The Forces of Economic Growth—A Time Series Approach. Princeton: Princeton University Press.
Grüne, L. and W. Semmler (2004) “Using Dynamic Programming with Adap-tive Grid Scheme for Optimal Control Problems in Economics.” Journal ofEconomic Dynamics and Control 28: 2427–2456.
Grüne, L., M. Kato and W. Semmler (2005) “Solving Ecological ManagementProblems Using Dynamic Programming.” Journal of Economic Behavior andOrganization 57(4): 448–474.
Gruver, G. (1976) “Optimal Investment and Pollution Control in a Neoclassi-cal Growth Context.” Journal of Environmental Economics and Management 5:165–177.
Hackl, F. and G.J. Pruckner (2003) “How Global Is the Solution to GlobalWarming?” Economic Modelling 20: 93–117.
Hannesson, R. (1983) “Optimal Harvesting of Ecologically Interrelated FishSpecies.” Journal of Environmental Economics and Management 10: 329–345.
Harvey, D.L.D. (2000)Global Warming—The Hard Science. Harlow: Prentice Hall.Haurie, A. (2003) “Integrated Assessment Modeling for Global Climate Change:
An Infinite Horizon Optimization Viewpoint.” Environmental Modeling andAssessment 2: 117–132.
Heal, G. (1999) Valuing the Future: Economic Theory and Sustainability. New York:Columbia University Press.
Heal. G.M. (1993) “The Relationship between Price and Extraction Cost for aResource with a Backstop Technology.” In Geoffrey Heal, ed.,TheEconomics ofExhaustible Resources. International Library of Critical Writings in Economics.Cheltenham: Edward Elgar.
——— (1995) “Interpreting Sutstainability.” Nota Di Lavoro 1: 1–14.Henderson-Sellers, A. and K. McGuffie (1987) A Climate Modelling Primer.
Chichester: John Wiley.Hettich, F. (1998) “Growth Effects of a Revenue-Neutral Environmental Tax
Reform.” Journal of Economics 67: 287–316.——— (2000) Economic Growth and Environmental Policy. Cheltenham: Edward
Elgar.Hirsch, M.W. and S. Smale (1974) Differential Equation, Dynamical Systems and
Linear Algebra. New York: Academic Press.Hotelling, H. (1931) “The Economics of Exhaustible Resources.” Journal of
Political Economy 39: 137–175.Institut der deutschen Wirtschaft (2003) Deutschland in Zahlen. Köln.

Bibliography 201
IPCC (1990) Climate Change. The IPCC Scientific Assessment. Cambridge:Cambridge University Press.
——— (1996) “Climate Change 1995: Economic and Social Dimensions of Cli-mate Change.” Contribution of Working Group III to the Second AssessmentReport of the IPCC. In J.P. Bruce, H. Lee and E.F. Haites, eds. Economic andSocial Dimensions of Climate Change. Cambridge: Cambridge University Press,pp. 40–78.
——— (2001) “Climate Change 2001: The Scientific Basis.” IPCC Third Assess-ment Report of Working Group I. Available at www.ipcc.ch.
Jones, L., R.E. Manuelli and P.E. Rossi (1993) “Optimal Taxation in Models ofEconomic Growth.” Journal of Political Economy 101(3): 485–517.
Judd, K.L. (1987) “The Welfare Cost of Factor Taxation in a Perfect ForesightModel.” Journal of Political Economy 49(4): 675–707.
Kalecki, M. (1938) Essays on Economic Dynamics. Cambridge: CambridgeUniversity Press (1966 edition).
Keller, K., K. Tan, F.M. Morel and D.F. Bradford (2000) “Preserving the OceanCirculation: Implications for the Climate Policy.” Climate Change 47: 17–43.
Kemfert, C. (2001) Economy-Energy-Climate Interaction. The Model WIAGEM.Fondazione Eni Enrico Mattei, Nota di Lavoro (FEEM Working Paper)71.2001.
King, R.G. and S. Rebelo (1990) “Public Policy and Economic Growth: Develop-ing Neoclassical Implications.” Journal of Political Economy 98(5): 126–150.
Koopmans, T.C. (1985) “The Transition from Exhaustible to Renewable orInexhaustible Resources.” In T.C. Koopmans, Scientific Papers, vol. 2.Cambridge, MA: MIT Press.
Koskela, E., M. Ollikainen and M. Puhakka (2000) “Saddles, Indeterminacy,and Bifurcations in an Overlapping Generations Economy with a RenewableResource.” CESifo, Working Paper Series no. 298.
Krautkraemer, J.A. (1985) “Optimal Growth, Resource Amenities and thePreservation of Natural Environments.” Review of Economic Studies 52:153–171.
Ligthart, J.E. and F. van der Ploeg (1994) “Pollution, the Cost of Public Funds,and Endogenous Growth.” Economics Letters 46: 339–348.
Lucas, R.E. (1988) “On the Mechanics of Economic Growth.” Journal of MonetaryEconomics 22: 3–42.
——— (1990) “Supply-Side Economics: An Analytical Review.”Oxford EconomicPapers 42: 293–316.
Luptacik, M. and U. Schubert (1982) Optimal Economic Growth and the Environ-ment: Economic Theory of Natural Resources. Vienna: Physica.
Majumdar, M. and T. Mitra (1982) “Inter-temporal Allocation with Noncon-vex Technology, the Aggregative Framework.” Journal of Economic Theory 27:101–136.
Mäler, K.G. (1974) Environmental Economics: A Theoretical Inquiry. Baltimore:Johns Hopkins University Press.
Meadows, D.H., D.L. Meadows, J. Randers and W.W. Behrens (1972) The Limitsto Growth. New York: Universe Books.
Montrucchio, L. (1992) “Dynamical Systems That Solve Continuous Time Con-cave Optimization Problems: Anything Goes.” In J. Benhabib, ed., Cycles andChaos in Economic Equilibrium, Princeton: Princeton University Press.

202 Bibliography
Nielsen, S.B., L.H. Pedersen and P.B. Sorensen (1995) “Environmental Policy,Pollution, Unemployment, and Endogenous Growth.” International Tax andPublic Finance 2: 185–205.
Nordhaus W.D. (1994) Managing the Global Commons: The Economics of ClimateChange. Cambridge, MA: MIT Press.
——— (2007a) “The Stern Review on the Economics of Climate Change.” Journalof Economics Literature 45: 686–702.
——— (2007b)The challenge ofGlobalWarning: EconomicModels andEnvironmentalPolicy. New Haven: Yale University Press.
Nordhaus, W.D. and J. Boyer (2000)Warming theWorld. EconomicModels of GlobalWarming. Cambridge, MA: MIT Press.
Nyarko, Y. and L.J. Olson (1996) “Optimal Growth with Unobservable Resourcesand Learning.” Journal of Economic Behavior and Organization 29: 465–491.
OECD (1995) “Global Warming—Economic Dimensions and Policy Responses.”Paris.
Pearce, D., E.B. Barbier and A. Markandya (1990) Sustainable Development:Economics and Environment in the Third World. Worcester: Edward Elgar.
Peck, S. and T.J. Teisberg (1992) “CETA:AModel for Carbon Emissions TrajectoryAssessment.” Energy Journal 13: 55–77.
Pezzey, E.S. (1961) “Economic Analysis of Sustainable Growth and Sus-tainable Development.” World Bank Policy Planning and Research Staff,Environment Department Working Paper no. 15.
Pfähler, W., U. Hofmann and W. Bönte (1996) “Does Extra Public Capital Matter?An Appraisal of Empirical Literature.” Finanzarchiv N.F. 53: 68–112.
Phelps, E.S. (1961) “The Golden Rule of Accumulation: A Fable forGrowthmen.” American Economic Review 638–643.
Pindyck, R.S. (1991) “Irreversibility, Uncertainty, and Investment.” Journal ofEconomics Literature 29(3): 1110–1148.
Popp, D. (2003) “ENTICE: Endogenous Technological Change in the DICEModel of Global Warming.” NBER Working Paper no. 9762.
Ragozin, D.L. and G. Brown (1985) “Harvest Policies and Nonmarket Valu-ation in a Predator-Prey System.” Journal of Environmental Economics andManagement 12: 155–168.
Ramsey, F. (1928) “A Mathematical Theory of Saving.” Economic Journal 38:543–559.
Rawls, J. (1972) A Theory of Justice. Oxford: Clarendon.Rebelo, S. (1991) “Long-Run Analysis and Long-Run Growth.” Journal of Political
Economy 99(31): 500–521.Rockafellar, R.T. (1976) “Saddle Points of Hamiltonian Systems in Convex
Lagrange Problems Having a Nonzero Discount Rate.” Journal of EconomicTheory 12: 71–113.
Roedel, W. (2001)Physik unsererUmwelt: DieAtmosphäre. Berlin: Springer-Verlag.Romer, P.M. (1986) “Increasing Returns and Long-Run Growth.” Journal of
Political Economy 94: 1002–1037.——— (1990) “Endogenous Technological Change.” Journal of Political Economy
98: S71–S02.Romp, W. and J. de Haan (2005) “Public Capital and Economic Growth: ACritical
Survey.” EIB Papers 10 (1).

Bibliography 203
Rosen, J.B. (1965) “Existence and Uniqueness of Equilibrium Points for ConcaveN-Person Games.” Econometrica 33: 520–534.
Sachverständigenrat zur Begutachtung der gesamtwirtschaftlichen Lage (2001),Chancen auf einen höheren Wachstumspfad. Stuttgart: Metzler-Poeschel.
Schmitz, G. (1991) “Klimatheorie und -modellierung.” In P. Hupfer, ed.,Das Klimasystem der Erde: Diagnose und Modellierung, Schwankungen undWirkungen. Berlin: Akademie Verlag, pp. 181–217.
Scholl, A. and W. Semmler (2002) “Susainable Economic Growth and ExhaustibleResources: A Model and Estimation for the US.” Discrete Dynamics in Natureand Society 7(2): 79–92.
Seierstad, A. and K. Sydsaeter, (1987)Optimal Control with Economic Applications.Amsterdam: North-Holland.
Semmler, W. (1994) “On the Optimal Regulation of an Extractive Industry.”Journal of Business and Economics 46: 409–420.
——— (1994b) “On the Optimal Exploitation of Interacting Resources.” Journalof Economics 59: 23–49.
——— (2000) “Debt Dynamics and Sustainable Debt.” Journal of EconomicDynamics and Control 24: 1121–1144.
Semmler, W., A. Greiner, B. Dialo, A. Rezai and A. Rajaram (2007) “Fiscal Pol-icy, Public Expenditure Composition, and Economic Growth.” World BankPolicy Research working paper no. 4405, Washington, DC.
Sieveking, M. (1990) “Stability of Limit Cycles.” Mimeo, Department ofMathematics, University of Frankfurt.
Sieveking, M. and W. Semmler (1990) “Optimization without Planning: Growthand Resource Exploitation with a Discount Rate Tending to Infinity.”Working Paper, New School for Social Research.
——— (1997) “The Present Value of Resources with Large Discount Rates.”Applied Mathematics and Optimization 38: 283–309.
Smith, V. (1968) “Economics of Production from Natural Resources.” AmericanEconomic Review 58: 4909–4931.
Smulders, S. (1995) “Entropy, Environment, and Endogenous Growth.” Interna-tional Tax and Public Finance 2: 319–340.
Smulders, S., Gradus S. (1996) “Pollution Abatement and Long-Term Growth.”European Journal of Political Economy 12: 505–532.
Solow, R.M. (1973) “Is the End of the World at Hand?” In Andrew Weintraub,Eli Schwartz, and J. Richard Aronson, eds., The Economic Growth Controversy.New York: International Arts and Sciences Press.
——— (1974) “Intergenerational Equity and Exhaustible Resources.” Review ofEconomic Studies (Symposium on the Economics of Exhaustible Resources):29–45.
Sorger, G. (1989) “On the Optimality and Stability of Competitive Paths in TimeContinuous Growth Models.” Journal of Economic Theory 48: 526–547.
Statistisches Bundesamt (2000) Statistisches Jahrbuch 2000 für die BundesrepublikDeutschland. Metzler-Poeschel, Stuttgart.
Stern, N. (2006, 2007) “What Is the Economic Impact of Climate Change?Stern Review on the Economics of Climate Change.” Discussion Paper,www.hm-treasury.gov.uk; printed version (2007) Cambridge: CambridgeUniversity Press.

204 Bibliography
Stiglitz, J.E. (1974) “Growth with Exhaustible Natural Resources: Efficient andOptimal Growth Paths.” Review of Economic Studies (Symposium on theEconomics of Exhaustible Resources): 123–137.
Stockey, N.L. (1998) “Are There Limits to Growth?” International EconomicReview39: 1–31.
Sturm, J.E., G.H. Kuper and J. de Haan (1998) “Modelling Government Invest-ment and Economic Growth on a Macro Level.” In S. Brakman, H. van Ees andS.K. Kuipers, eds., Market Behaviour and Macroeconomic Modelling, London:Macmillan/St. Martin’s Press, pp. 359–406.
Tol, R.S.J. (1999) “Spatial and Temporal Efficiency in Climate Policy: AnApplication of FUND.” Environmental and Resource Economics 14: 33–49.
——— (2001) “Equitable Cost-Benefit Analysis of Climate Change.” EcologicalEconomics 36: 71–85.
——— (2003) “Is the Uncertainty about Climate Change Too Large for ExpectedCost-Benefit Analysis.” Climatic Change 56: 265–289.
Toman, M.A., J. Pezzey and J.A. Krautkraemer (1993) “Neoclassical EconomicGrowth Theory and Sustainability.” In Daniel W. Bromley, ed., Handbook ofEnviroenmental Economics. Cambridge, MA: Blackwell Press.
U.S. Department of Commerce, Economics and Statistics, Bureau of the Cencus(1965–1997) Statistical Abstract of the United States.
U.S. Geological Survey (1995) Maps, Imaging and publications. http://www.usgs.gov/
Uzawa H. (2003) Economic Theory and Global Warming. New York: CambridgeUniversity Press.
Weitzman, M. (2007a) “The Role of Uncertainty in the Economics of CatastrophicClimate Change.” Manuscript, MIT.
——— (2007b) “Subjective Expectations and Asset Return Puzzles.”Manuscript, MIT.
——— (2007c) “A Review of the Stern Review on the Economics of ClimateChange.” Journal of Economics Literature 45:703–25.
Weizsäcker, C.C. (1967) “Symposium on Optimal Infinite Programmes: Lemmasfor a Theory of Approximate Optimal Growth.” Review of Economic Studies34: 143–151.

Index
abatement, 12, 26, 33, 41, 63, 72, 79, 90, 191albedo, 58, 61, 108, 112amenity value, 133, 148
balanced growth path, 8, 13, 34, 41,65, 74, 192
bifurcation, 104–106, 122, 165,backstop technology, 132, 147Brundtland Commission, 127budget constraint, of the household; of the
government, 10, 13, 32–33, 39, 41, 89,110, 181, 184
capital, human; knowledge, physical,public, 7–9, 11–13, 24–26, 40–42,63–65, 78, 90, 102, 129–131, 142–143,181–183, 194
climate model, 56–57competitive markets, 12, 33, 41cost-benefit analysis, 56current-value Hamiltonian, 11, 32, 73, 76,
79, 84, 101, 110, 117, 145–148, 158,164–165, 194–196
damage function, 63–64, 68–69, 95–96, 98,104, 112, 115
depletion, 125–126, 133, 157, 180, 192discount rate, 10, 57, 73–76, 81, 91, 95, 112,
125–126, 129, 131, 135–136, 158–159,165, 170–172, 175–176, 183–184,193–194
double dividend, 95, 98–100, 121dynamic optimization, 88, 121, 125,
157, 194dynamic programming, 126, 158–159, 165,
172, 176–177, 184, 186–187
eigenvalues, 37, 45–47, 66, 74, 93, 105–107,113–115, 118
elasticity of substitution, 39, 46, 48–50, 52,89, 96, 99–100, 121, 130, 142, 191
emission, 39–41, 55–58, 60–62, 65, 68–69,71–75, 85–88, 90–91, 110, 122, 188
emission tax rate, 98–99, 113, 115–116, 121energy balance model (EBM), 60, 62, 108energy flow, 60endogenous growth model, 8–9, 55–58, 90,
121–122, 191exhaustible resource, 125, 128–130,
138–139, 142–143externalities, of investment; pollution as,
7, 31, 56–58, 64, 90–91, 116, 133
feedback effect, 56, 58, 62, 107–108, 122fiscal policy, 7–9, 17, 26–27, 51, 190–191
global warming, 4, 55–56, 59, 77, 90, 95,120–122, 191, 193
greenhouse gas, 4, 55, 68, 120, 191Gulf Stream, 58, 63, 98
heat capacity, 60–62
income tax rate, 11, 19–20, 22–27, 39,67, 112
indeterminacy, global; local, 15–16, 36,45–47, 52
interacting resources, 125, 157, 163, 176,181, 192
interactions, competitive; predator-prey,158–159, 165–170, 172–175
intergenerational equity, 4, 56, 125–127,133, 135–137
Intergovernmental Panel on ClimateChange, 55
integrated assessment model, 56investment, in capital; public, 7–9, 18, 28,
30, 41, 44, 57–58, 63–64, 181
marginal product of capital, 8, 18, 20, 33,78, 82, 95, 129–130
205

206 Index
maximum principle, 28–29, 158, 194multiregion world, cooperative solution;
non-cooperative solution, 77, 79, 84
nonrenewable resources, 3, 125, 127–128,141–142, 192–193
optimal growth theory, 163, 165optimization horizon, 157–159, 161–163,
166, 171–172, 187
permits, 91, 182, 187pollution, effective, 4, 7–9, 10–12, 31–36,
40–41, 68pollution tax rate, 20–24, 26–28, 74–75, 80production function, 8–9, 12, 32, 40, 63, 71,
78, 90, 129–131, 134, 142
Rawls criterion, 86, 136resource constraint, 100, 116, 125, 128, 135,
142, 145renewable resources, 3–4, 125–126,
157–159, 190, 192regulation, regulatory instruments, 180,
187, 192reserves, proved; unproved, 137–141,
150–151, 154–156
second-best policy, 57, 71–75, 80, 120social optimum, 9, 28–30, 51, 56, 58, 75–77,
100–104, 106–107, 117–119Stefan-Boltzmann constant, 60, 62surface temperature, 55–57, 60–62, 65,
67–69, 81, 85–86, 97–99, 108–109,112–113, 116
sustainability, 34, 42, 65, 80, 127–128,135–136
sustainable growth, 14, 127, 141
technology, 17–18, 22, 35, 44, 65, 73–75, 77,81–83, 90, 99–100, 106–107, 131–133,140–142, 147, 160, 167
technological change, 130, 143, 145–146threshold, 58, 63, 98, 114, 122time to exhaustion, 137, 140–141, 192tipping point, 192transition path, 22–26, 69, 120transversality condition, 11, 14, 29, 32, 34,
40, 73, 80, 84, 92, 101, 110, 117, 195–196
utility function, 9–10, 31, 34, 39, 48, 52, 79,89, 110, 129
welfare, 8–9, 17, 26–28, 51, 56, 72, 86,97–100, 115–116, 129, 133, 135–137