the global house of prestige beauty/media/files/e/estee-lauder/investors/... · the global house of...
TRANSCRIPT

2017 | INVESTOR FACT SHEET | NYSE:EL
THE EST{E LAUDER COMPANIES INC.The Global House of Prestige Beauty

Global leaderin prestige beauty
Consumer inspired and creativity driven
Accomplished,experienced
management team
A rich heritageand strong core values
ABOUT US
Culture of respect,equality, inclusion and diversity
25+Prestige brands
150+Countries and
territories
$11.8Billion in net sales:International 64%;
U.S. 36%
10+Prestige distribution
channels
Multiple engines of growthacross brands, categories, geographies
and channels
VISIONA well-diversified, brand-building powerhouse of unrivaled creativity and innovation.
A Sustainable Growth Story
The Estée Lauder Companies is a leader in global prestige beauty, a growing, dynamic industry that benefits from favorable long-term demographic trends. We are the only major company focused solely on prestige beauty. Through our powerful portfolio of more than 25 well-diversified brands and our global presence, we appeal to a broad consumer demographic. Our Company is balanced by product categories, geographies and channels. We are pivoting our business to the fastest-growing areas driving global prestige beauty to reach new consumers and align with their changing shopping preferences. Our strong business model, fueled by our multiple engines of growth, has produced consistent results, and our Company has steadily grown sales at a faster rate than global prestige beauty.
We are keenly focused on long-term value creation. Our 10-year Compass, an important long-range planning tool, helps us anticipate emerging trends and allocate resources to the most promising areas as consumer and market dynamics shift. Our continued financial discipline, cost savings programs and productivity improvements provide resources to pursue high-growth opportunities, invest in capabilities and position us to deliver strong earnings growth. Our solid financial position and cash flow from operations have supported our capital investments and acquisition strategy, while providing ample funds to return cash to stockholders through share repurchases and dividends.
With an unparalleled portfolio of authentic, aspirational brands, creating high-quality products that are desired by consumers around the world, we are uniquely positioned to capture a larger share of consumers’ beauty choices. We anticipate, identify and target the fastest growing and most profitable areas, leverage our enduring strengths, and we expand our brand portfolio to grow in established markets and develop in emerging markets through brand-building channels. We expect our successful strategy and excellent execution to continue to drive our momentum, and our goal remains to exceed global prestige beauty sales growth by at least one percentage point annually and deliver double-digit constant currency increases in earnings per share.
WE ARE POSITIONED FOR LONG-TERM SUSTAINABLE GROWTH
SEPTEMBER 2017This fact sheet contains forward-looking statements that involve risks and uncertainties. Please refer to the Company’s recent SEC filings or website for further details regarding risk factors and other factors that could cause actual results to differ materially from expectations.
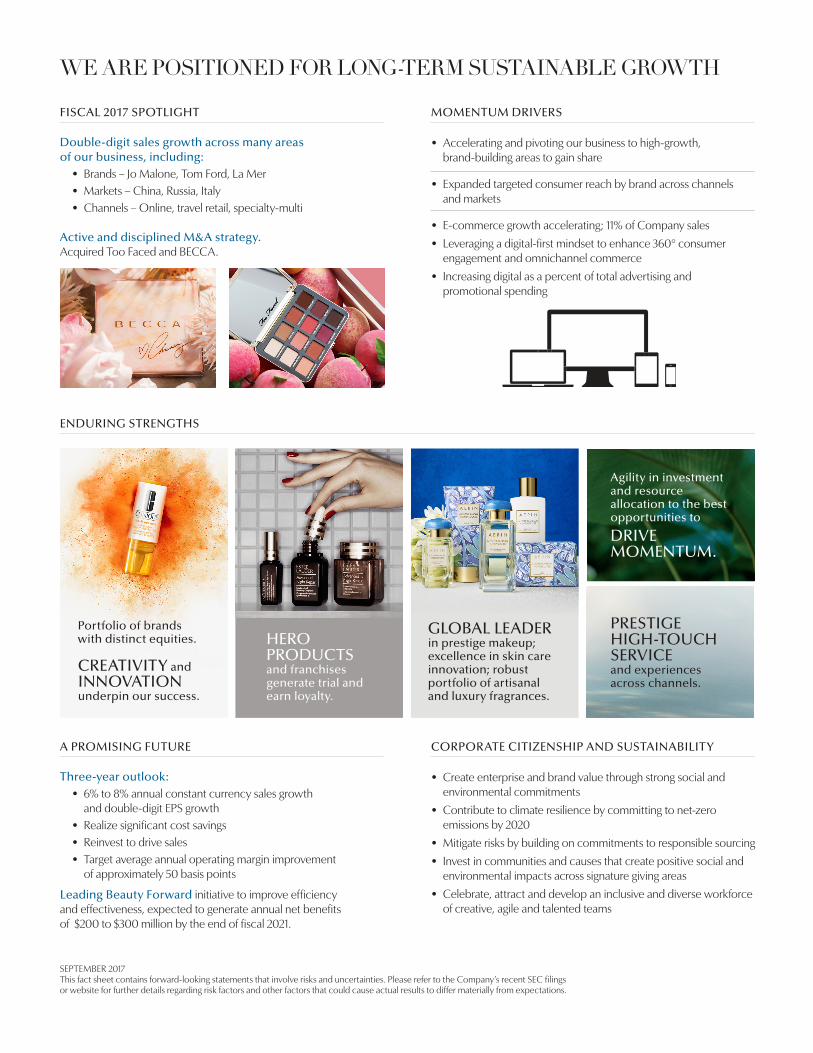
FISCAL 2017 SPOTLIGHT
Double-digit sales growth across many areas of our business, including:
• Brands – Jo Malone, Tom Ford, La Mer• Markets – China, Russia, Italy• Channels – Online, travel retail, specialty-multi
Active and disciplined M&A strategy. Acquired Too Faced and BECCA.
Portfolio of brands with distinct equities.
CREATIVITY and INNOVATION underpin our success.
HERO PRODUCTS and franchises generate trial and earn loyalty.
Agility in investment and resource allocation to the best opportunities to
DRIVE MOMENTUM.
PRESTIGE HIGH-TOUCH SERVICE and experiences across channels.
ENDURING STRENGTHS
GLOBAL LEADERin prestige makeup; excellence in skin care innovation; robust portfolio of artisanal and luxury fragrances.
MOMENTUM DRIVERS
• Accelerating and pivoting our business to high-growth, brand-building areas to gain share
• Expanded targeted consumer reach by brand across channels and markets
• E-commerce growth accelerating; 11% of Company sales
• Leveraging a digital-first mindset to enhance 360° consumer engagement and omnichannel commerce
• Increasing digital as a percent of total advertising and promotional spending
A PROMISING FUTURE
Three-year outlook:• 6% to 8% annual constant currency sales growth
and double-digit EPS growth• Realize significant cost savings• Reinvest to drive sales• Target average annual operating margin improvement
of approximately 50 basis points
Leading Beauty Forward initiative to improve efficiency and effectiveness, expected to generate annual net benefits of $200 to $300 million by the end of fiscal 2021.
CORPORATE CITIZENSHIP AND SUSTAINABILITY
• Create enterprise and brand value through strong social and environmental commitments
• Contribute to climate resilience by committing to net-zero emissions by 2020
• Mitigate risks by building on commitments to responsible sourcing
• Invest in communities and causes that create positive social and environmental impacts across signature giving areas
• Celebrate, attract and develop an inclusive and diverse workforce of creative, agile and talented teams
THE ESTÉE LAUDER COMPANIES INC.767 Fifth Avenue, New York, NY 10153www.elcompanies.com
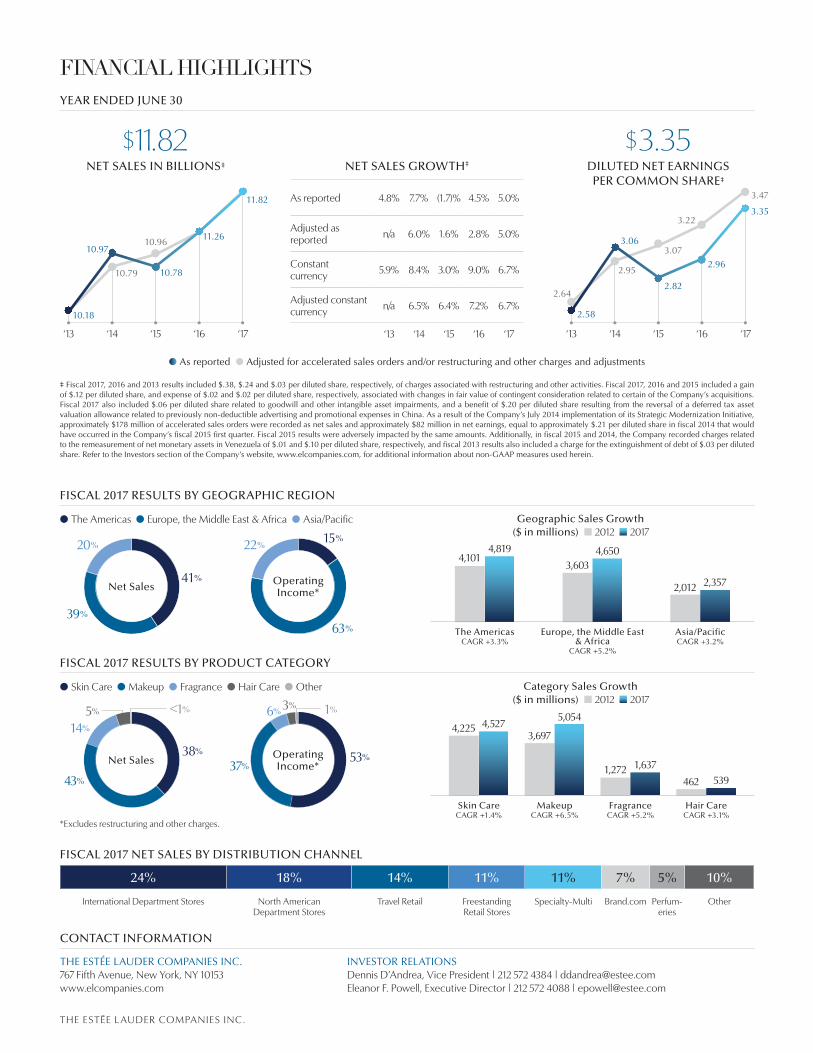
As reported 4.8% 7.7% (1.7)% 4.5% 5.0%
Adjusted as reported n/a 6.0% 1.6% 2.8% 5.0%
Constant currency 5.9% 8.4% 3.0% 9.0% 6.7%
Adjusted constant currency n/a 6.5% 6.4% 7.2% 6.7%
‘13 ‘14 ‘15 ‘16 ‘17
$11.82NET SALES GROWTH‡
$3.35DILUTED NET EARNINGS PER COMMON SHARE‡
YEAR ENDED JUNE 30
FINANCIAL HIGHLIGHTS
‡ Fiscal 2017, 2016 and 2013 results included $.38, $.24 and $.03 per diluted share, respectively, of charges associated with restructuring and other activities. Fiscal 2017, 2016 and 2015 included a gain of $.12 per diluted share, and expense of $.02 and $.02 per diluted share, respectively, associated with changes in fair value of contingent consideration related to certain of the Company’s acquisitions. Fiscal 2017 also included $.06 per diluted share related to goodwill and other intangible asset impairments, and a benefit of $.20 per diluted share resulting from the reversal of a deferred tax asset valuation allowance related to previously non-deductible advertising and promotional expenses in China. As a result of the Company’s July 2014 implementation of its Strategic Modernization Initiative, approximately $178 million of accelerated sales orders were recorded as net sales and approximately $82 million in net earnings, equal to approximately $.21 per diluted share in fiscal 2014 that would have occurred in the Company’s fiscal 2015 first quarter. Fiscal 2015 results were adversely impacted by the same amounts. Additionally, in fiscal 2015 and 2014, the Company recorded charges related to the remeasurement of net monetary assets in Venezuela of $.01 and $.10 per diluted share, respectively, and fiscal 2013 results also included a charge for the extinguishment of debt of $.03 per diluted share. Refer to the Investors section of the Company’s website, www.elcompanies.com, for additional information about non-GAAP measures used herein.
CONTACT INFORMATION
l Skin Care l Makeup l Fragrance l Hair Care l Other
*Excludes restructuring and other charges.
FISCAL 2017 RESULTS BY GEOGRAPHIC REGION
l As reported l Adjusted for accelerated sales orders and/or restructuring and other charges and adjustments
FISCAL 2017 RESULTS BY PRODUCT CATEGORY
Net Sales41%
39%
20%
Operating Income*
15%
63%
22%
l The Americas l Europe, the Middle East & Africa l Asia/Pacific
Net Sales38%
43%
5%
14%
<1%
11.82
10.18
10.97
10.78
10.96 11.26
‘17‘13 ‘14 ‘15 ‘16
10.79
FISCAL 2017 NET SALES BY DISTRIBUTION CHANNEL
24%
International Department Stores
18%
North American Department Stores
14%
Travel Retail
11%
Freestanding Retail Stores
11%
Specialty-Multi
7%
Brand.com
10%
Other
5%
Perfum-eries
INVESTOR RELATIONSDennis D’Andrea, Vice President | 212 572 4384 | [email protected] F. Powell, Executive Director | 212 572 4088 | [email protected]
NET SALES IN BILLIONS‡
‘17‘13 ‘14 ‘15 ‘16
2.58
3.06
2.82
2.96
3.35
2.64
2.95
3.07
3.22
3.47
Geographic Sales Growth($ in millions) n 2012 n 2017
Category Sales Growth($ in millions) n 2012 n 2017
53%37%
3%6% 1%
Operating Income*
Skin CareCAGR +1.4%
MakeupCAGR +6.5%
Hair CareCAGR +3.1%
FragranceCAGR +5.2%
539462
1,6371,272
5,054
3,6974,225 4,527
The AmericasCAGR +3.3%
Europe, the Middle East & Africa
CAGR +5.2%
Asia/PacificCAGR +3.2%
4,650
2,012 2,357
3,6034,101
4,819
THE EST{E L AUDER COMPANIES INC.