the global recession the global recession. world gdp growth, 2007-2010. emerging market countries...
TRANSCRIPT

The Global Recession
The Global Recession. World GDP Growth, 2007-2010.
Emerging market countries hoped that they could avoid a similar fate, that there would be in effect decoupling between advanced countries and emerging market countries. As Figure 1 shows, these hopes were dashed.
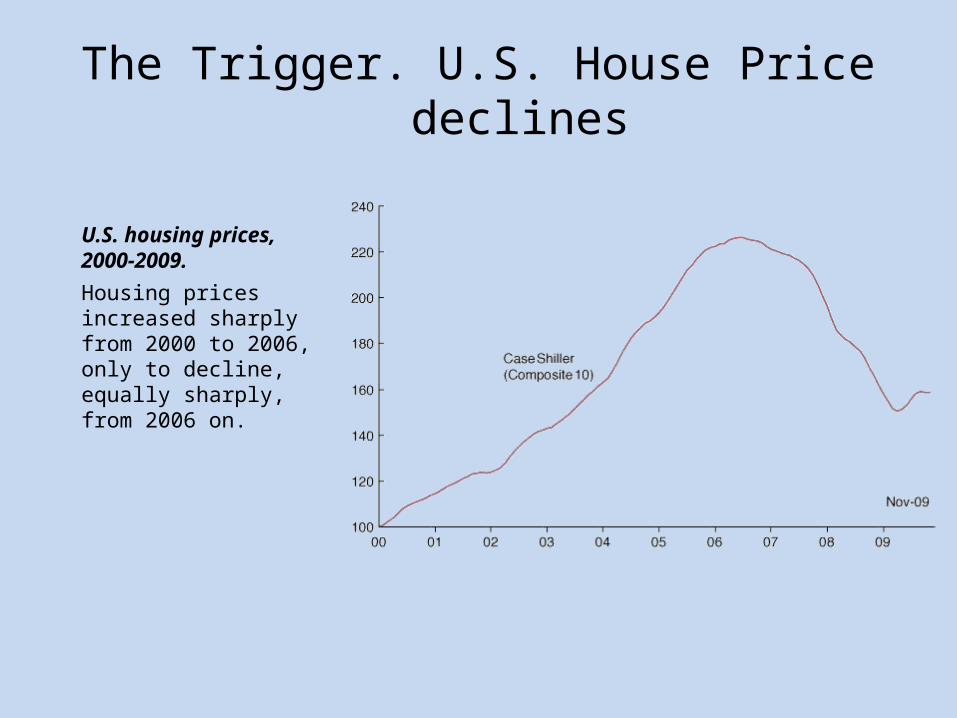
The Trigger. U.S. House Price declines
Housing prices increased sharply from 2000 to 2006, only to decline, equally sharply, from 2006 on.
U.S. housing prices, 2000-2009.

The Subprime Triggered Crisis: A Perfect StormConfluence of causes
– Past bailouts Greenspan Put Bulletproof system!?!??– Financial innovations: Finance as end in itself
– Income lagging spending: Household debt…National debt– Easy credit...Fed Funds Rate kept low...fear of deflation– Market fundamentalism– Weak global aggregate demand
The Players– Mortgage brokers/Banks—Securitizers/GSEs/Rating Agencies
Trigger and collapse
Bailouts: Wall Street, not Main Street
Stimulus
On-going slump

The Subprime Triggered Crisis: A Perfect StormFinding Fault
• Past bailouts Too big/Too interconnected to Fail– Black Monday (October 19, 1987)– Asian CrisisContagionLongTermCapitalManagement
(1997-8)– dot.com bubble … it takes a bubble
• Financial innovations– Overnight funding– Off-balance sheet vehicles – no capital requirements– Default insurance– Collateralized Debt Obligation (CDOs) – Chemistry: JunkAAA
Financial Engineering
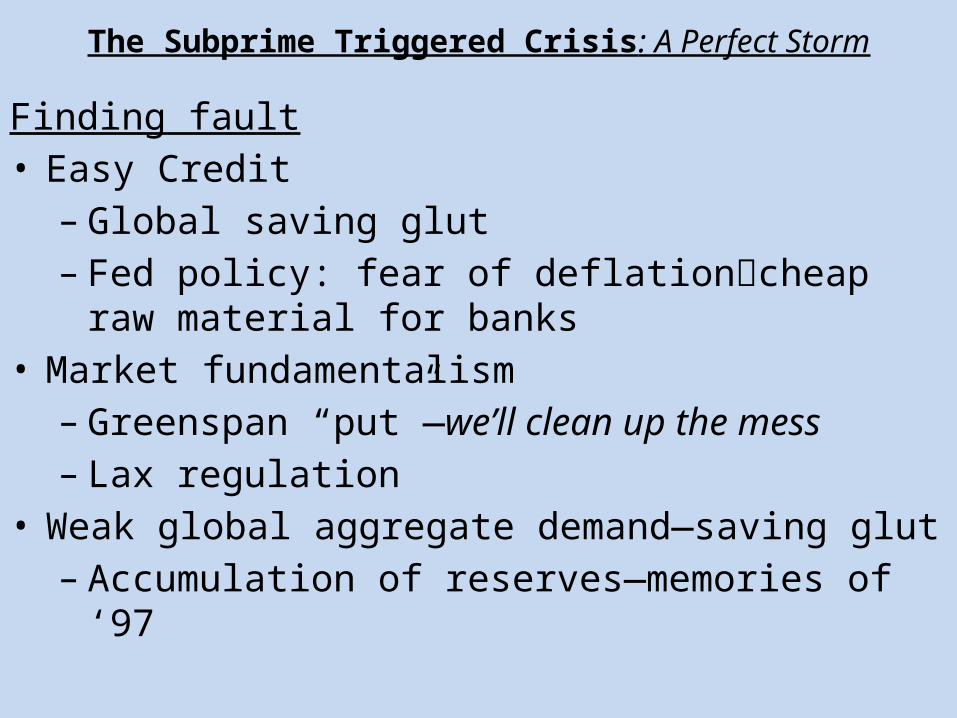
The Subprime Triggered Crisis: A Perfect Storm
Finding fault• Easy Credit– Global saving glut– Fed policy: fear of deflationcheap raw material for
banks• Market fundamentalism– Greenspan “put”—we’ll clean up the mess– Lax regulation
• Weak global aggregate demand—saving glut– Accumulation of reserves—memories of ‘97

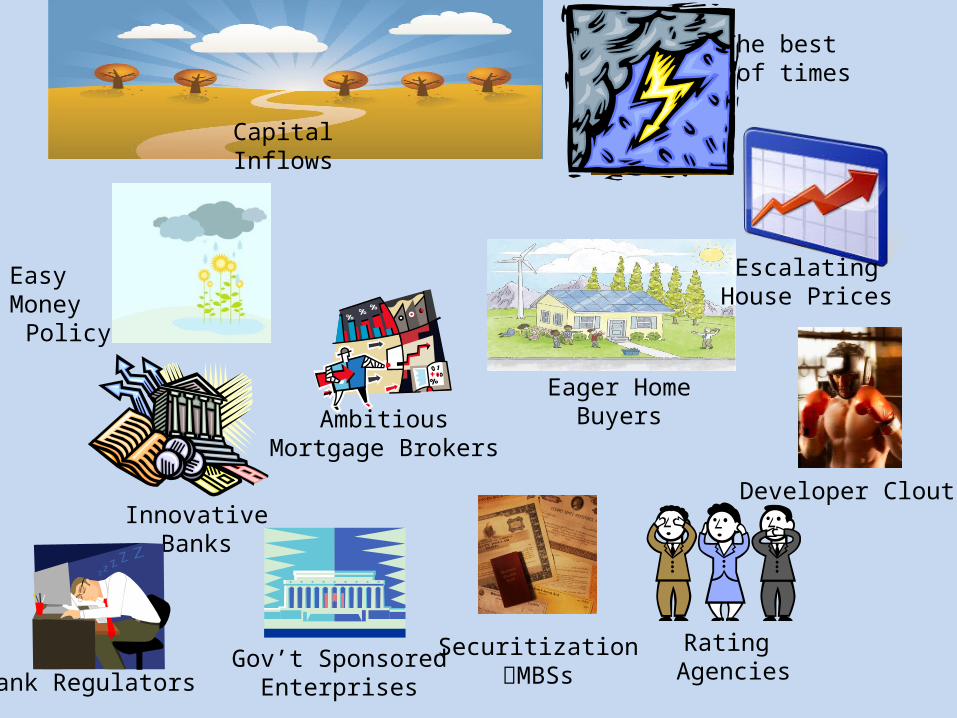
Easy MoneyPolicy
Capital Inflows
Eager Home Buyers
InnovativeBanks
Rating Agencies
AmbitiousMortgage Brokers
SecuritizationMBSs
EscalatingHouse Prices
Gov’t SponsoredEnterprises
Developer Clout
Bank Regulators
The best of times
A “Global Saving Glut”
Easy MoneyPolicy
Capital Inflows
Eager Home Buyers
InnovativeBanks
Rating Agencies
AmbitiousMortgage Brokers
SecuritizationMBSs
EscalatingHouse Prices
Gov’t SponsoredEnterprises
Developer Clout
Bank Regulators
The best of times

When housing prices declined, and some mortgages went bad High leverage sharp decline in the capital of banks. Forced sale of some assets that were often hard to value
Fire sale prices
Complexity of the securities (MBSs, CDOs) and bank true balance sheets (banks, and their SIVs)
Were banks solvent? Did they risk bankruptcy??
Interbank lending froze.
September 15, 2008: Lehman Brothers bankruptcy: a bank with $600 + billion in assets Leading financial outfits concluded that many, if not most, other banks
and financial institutions were at risk These guys vaguely knew the shape they themselves were in ...if they couldn’t trust themselves, how could they trust counterparties?
INTERBANK LENDING FROZE
Amplification Mechanisms. Leverage, Complexity, and Liquidity

Amplification mechanisms: Nervousness—Lack of Trust
The rate spread, which reflects the risk banks perceived in lending to each other, went sharply up in September 2008.
The Ted Spread, 2007-2009.
Banks became very reluctant to lend to each other. The TED Spread: The difference between the riskless rate (measured by the rate of 3-month government bonds) and the rate at which banks are willing to lend to each other (known as the Libor rate...which we now know was misstated!)

Responses Lender of Last Resort / Spender of Last Resort
• Tax Rebate $124 bil.• Fed Fund Rate Cuts• Fannie/Freddie $200 bil.• Bear-Stearns $29 bil.• AIG $174 bil.
Fed “Facilities”
• Primary Dealer Credit Facility (PDCF) $58 bil.• Treasury Security Loan Facility (TSLF) $133 bil.• Term Auction Facility (TAF) $416 bil.• Asset- Backed Commercial Paper Funding Facility (CPFF) $1,777 bil.• Money Market Investor Funding Facility (MMIFF) $540 bil.• More Fed Fund Rate Cuts … Hold At ~0%• Fed Purchases of Long-Term Securities: GSEs & MBSs $600 bil.• Term Asset-Backed Securities Loan Facility (TALF) $200 bil.• Emergency Economic Stabilization Act/TARP $700 bil.
Government Loans
Government Equity• Stimulus Package $787 bil.
aka The American Recovery and Reinvestment Act (ARRA)• TARP II
• Stress Tests• Quantitative Easing: QEI, QE2, QE3

Feeding a Crisis: Alphabet Soup
• Finance and its discontentsSIV, Repo, MBS, CDO, CDO2, CDS, S&P, AAA, ARM, TED–LIBOR
FOMC, FF, FDIC, GSE, AIG, G-7
• Bailout “facilities”PDCF, TSLF, TAF, CPFF, MMIFF, TALF
• LegislationTARP, ARRA
• Ben Bernanke: The Fed and the Crisishttp://www.federalreserve.gov/newsevents/lectures/federal-reserve-response-to-the-financial-crisis.htm

The Subprime Triggered Crisis: The PlayersCharles Kindleberger, Manias, Panics and CrashesA Minsky Story in Five Acts: In general; in particular1. Displacement—A breakthrough
– Financial innovation: securitization—sell off risk
2. Credit Expansion & BOOM– Low interest rates—defend against deflation– Shadow banking/SIVs/MBSs/CDOs/CDSs
3. Speculative Mania—self-fulfilling Euphoria– Teaser loans/ARMs/Home equity loans/Flipp’n’ to the bank
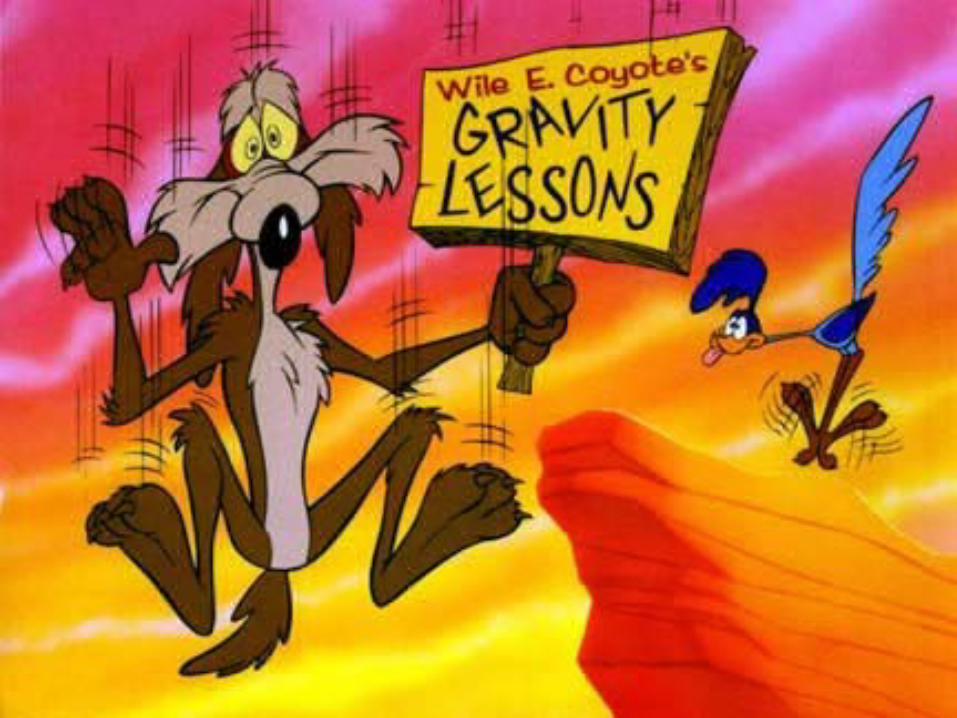
4. Distress—a Minsky/Wile E. Coyote moment– House prices plateau—Disappointed expectations
5. Panic & Crash—rush to liquidity…but there’s no liquidity– Firesale
• Foreclosures– Contagion
» Debt Deflation
– Bailout Helicopter Ben

A Long Slump:Liquidity Trap and Deflation
In words: The economy caught in a vicious cycle: Low output leads to more deflation. More deflation leads to a higher real interest rate and even lower output, and there is nothing monetary policy can do about it.
In the presence of a liquidity trap, there is a limit to how much monetary policy can increase output. Monetary policy may not be able to increase output back to its natural level. Suppose the economy is in a liquidity trap, and there is deflation. Output below the natural level of output leads to more deflation over time, which leads to a further increase in the real interest rate, and leads to a further shift of the IS curve to the left. This shift leads to a further decrease in output, which leads to more deflation, and so on.
The Liquidity Trap and Deflation

Negatively sloped AD:Inflation down Burden of debt on
debtors up They spend less
Wealth of creditors up but they’re not spenders

Prescriptions:• Fiscal stimulus• Increased gov’t debt inflationary expectations• Central bank commitment to irresponsible stance inflationary expectations• Debt forgiveness
• Raise wages and prices