the golden leaf stem initiative evaluation · stem skills and learning experiences that are closely...
TRANSCRIPT

The Golden LEAF STEM Initiative
Evaluation
Year Two Report - Appendices
Malinda Faber, Meredith Walton, Sherry Booth, Brandy Parker,
and Jeni Corn, Friday Institute for Educational Innovation
Eric Howard, SERVE Center at UNCG
May 2013
Consortium for Educational Research and Evaluation–North Carolina
We would like to thank the leaders and participants of The Golden LEAF STEM Initiative
Grants for their collaboration and partnership.
This project received support from The Golden LEAF Foundation.
The Golden LEAF Foundation
301 N. Winstead Avenue
Rocky Mount, NC 27804
(252) 442-7474
www.goldenleaf.org

Golden LEAF STEM Initiative
May 2013
1
Table of Contents
Table of Contents ............................................................................................................................ 1
Appendix A. Golden LEAF STEM Initiative Grant Descriptions .................................................. 2
Appendix B. Grant Coordinator Interview Protocol ....................................................................... 6
Appendix C. Focus Group Protocol ................................................................................................ 8
Appendix D. Science, Technology, Engineering, Mathematics, and Elementary Teacher Efficacy
and Attitudes toward STEM (T-STEM) Surveys ......................................................................... 11
Appendix E. Upper Elementary School (4-5th) and Middle/High School (6-12th) Student
Attitudes toward STEM (S-STEM) Surveys ................................................................................ 54
Appendix F. Pilot Leadership for STEM Self-Assessment .......................................................... 68
Appendix G. The High School Golden LEAF STEM Implementation Rubric ............................ 73
Appendix H. Classroom Observation Results from CLASS Protocol .......................................... 90
Appendix I. Combined Upper Elementary School and Middle/High School S-STEM Results –
Demographic Comparisons ........................................................................................................... 91
Appendix J. Upper Elementary School (4-5th) Student Attitudes toward STEM (S-STEM)
Survey Item-Level Results .......................................................................................................... 106
Appendix K. Middle and High School (6-12th) Student Attitudes toward STEM (S-STEM)
Survey Item-Level Results .......................................................................................................... 111
Appendix L. Combined Science, Technology, Engineering, Mathematics, and Elementary T-
STEM Results – Demographic Comparisons ............................................................................. 116
Appendix M. Science Teacher Efficacy and Attitudes toward STEM (T-STEM) Survey
Item-Level Results ...................................................................................................................... 129
Appendix N. Technology Teacher Efficacy and Attitudes toward STEM (T-STEM) Survey Item-
Level Results ............................................................................................................................... 135
Appendix O. Engineering Teacher Efficacy and Attitudes toward STEM (T-STEM) Survey .. 141
Appendix P. Mathematics Teacher Efficacy and Attitudes toward STEM (T-STEM) Survey .. 147
Appendix Q. Elementary Teacher Efficacy and Attitudes toward STEM (T-STEM) Survey ... 153
Appendix R. Elementary/Middle and High School Golden LEAF STEM Initiative Rubric Results
..................................................................................................................................................... 161
Appendix S. Pilot Leadership for STEM Self-Assessment Item-Level Results ......................... 165

Golden LEAF STEM Initiative
May 2013
2
Appendix A. Golden LEAF STEM Initiative Grant Descriptions
Table A1. Size and Scope of Golden LEAF STEM Initiative, June 2011 – June 2014
Grant
Grade-
levels
impacted
Participating
elementary
schools*
Participating
middle
schools
Participating
high schools
Estimated
teachers
impacted
Estimated
students
impacted
A 6-8 17 4 6 48 4,000
B 6-9 - 6 7 64 5,000
C 4-9 3 - 1 44 700
D 6-8 - 5 - 28 1,200
E 8 - 11 - 48 1,536
F 4-8 4 1 - 5 700
G 6-8 1 10 - 60 600
H 6-8 - 1 - 2 500
I 4-12 1 2 1 75 1,200
J 4-9 5 2 1 75 1,877
K 4-9 15 - 5 127 5,069
L 4-9 2 2 2 70 2,457
M 6-8 - 3 3 24 2,300
N 4-8 62 32 - 522 4,750
Total 110 79 26 1,192 31,889
* Includes K-6 schools.
ACCESS: Accessing Core Content and Ensuring Success in STEM (Catawba County Schools): This
Golden LEAF grant will be used by Catawba County Schools to implement a comprehensive STEM
program. The Science Education for Public Understanding Project (SEPUP) will be used to transform
teaching and learning using an issue-based science curriculum in life, earth and physical sciences. Project
Lead the Way will be expanded from the 8th grade program Gateway to Technology to the 7th grade

Golden LEAF STEM Initiative
May 2013
3
Design and Model course, and establish the Introduction to Engineering and Design at a feeder high
school in year two. The CyberKids program will be expanded to serve the other four middle schools as an
afterschool enrichment experience. Champions in Education and the NC Center for Engineering
Technology will partner with the district to connect the project with industry experiences.
Algebra 1 STEM Grant (Davidson County Schools): The purpose of this Golden LEAF grant is to
support Davidson County Schools' STEM Initiative which is aimed at strengthening efforts to increase
graduation rates and improve student success in Algebra 1 by implementing the new Future Ready Core
and Common Core Standards in mathematics. Through this initiative DCS plans to improve teaching and
learning by equipping 7th thru 9th grade math classrooms with SMART technology classrooms and
implementing a comprehensive professional development program for teachers. Funds will also be used
to establish Project Lead the Way (PLTW) and add PLTW's Gateway to Technology program at middle
schools in west Davidson County. DCS will partner with Davidson County Community College to
establish career pathways in health sciences, global logistics, creative enterprises and advanced
manufacturing / pre-engineering. Students completing PLTW at the high school level will have an
opportunity to earn up to ten engineering technology credits at the community college.
Alleghany CREST (Alleghany County Schools): This grant will assist Alleghany County Schools to
develop and implement a comprehensive STEM Education Plan that will initially serve students in grades
4-9. The funds will be used to: participate in the LASER K-12 Planning Institute; support professional
development activities focused on inquiry, project and problem based instruction; further develop the use
of technology as an instructional intervention tool; establish Project Lead the Way at the middle school
level; and provide dual credit opportunities with Wilkes Community College that are aligned with area
industry's workforce requirements.
North Carolina Eastern Region STEM (Craven County Schools, Jones County Schools, Lenoir
County Public Schools, Wayne County Public Schools): The purpose of this Golden LEAF grant is to
assist the NC Eastern Region in partnering with Craven, Jones, Lenoir and Wayne County Schools to
establish modular labs in the middle schools to drive relevant STEM content that is linked to industry
needs in the region. The labs will allow teachers to use project and problem-based instruction to apply
math and science concepts to real world problems. Each district will create an articulated pipeline from
middle school to high school to post-secondary education and into the workforce by targeting area
industry employment needs.
Leveraging North Carolina’s Biotechnology & Motorsports (Cabarrus County Schools, Kannapolis
City Schools, Richmond County Schools): The purpose of this Golden LEAF grant is to assist the NC
Biotechnology Center and its partners with implementing an innovative program using the lure and
tradition of motorsports and the new vision of biotechnology in the region (healthcare and nutrition) to
create relevant, fun and challenging educational activities to expose students in middle school grades to
STEM skills and learning experiences that are closely connected to industry clusters in the region.
MCS STEM Initiative (Madison County Schools): The purpose of this Golden LEAF grant is to
support Madison County Schools in expanding current programs aimed at establishing a comprehensive
approach to STEM education. Funds will be used to: implement the Engineering is Elementary (EIE)

Golden LEAF STEM Initiative
May 2013
4
program in grades 4 & 5; establish a Project Lead the Way (PLTW) program at the middle school level;
provide enrichment and summer experiences for 9th grade students; and support professional
development to strengthen teacher content knowledge at all levels. Madison County Schools will connect
students with industry experiences through programs such as Educators in Industry, Economic Summit,
Innovative Summit and others.
NC A&T University Regional Collaborative for Excellence in STEM (Bertie County Schools,
Edgecombe County Public Schools, Gates County Schools, Martin County Schools, Pitt County
Schools, Wilson County Schools): This Golden LEAF grant will support the NCA&T Regional
Collaborative for Excellence in STEM a comprehensive and inclusive program that targets the
enhancement of STEM education and learning outcomes for middle school aged children in six counties
in eastern NC: Bertie, Edgecombe, Gates, Pitt, Wilson and Martin. NCA&T will partner with local school
districts to assess, design, and implement programs focused on STEM education tailored to the needs and
capabilities of these rural schools to improve STEM education. The project will use 3 major strategies in
its approach. 1) Push-Pull Mentoring, 2) Professional Development Institute for Teaching and Learning,
3) Community Empowerment Network to build community engagement and capacity around the issues of
economics, education and health disparities.
PLTW/Ashe County Schools (Ashe County Schools): The purpose of this grant is to assist Ashe
County Schools with implementing Project Lead the Way for middle school students as part of a
comprehensive workforce strategy. The effort is part of the county's strategic plan to develop a pipeline of
workers for employment in area industry that are partners in this project (GE Aviation, Leviton, Gates
Corporation, American Emergency Vehicles, United Chem-Con and Ashe County Hospital). Students
will be exposed to careers through industry visits and classroom projects associated with industry
volunteers.
Project RESTE: Relevant Engineering, Science, and Technology Education (Johnston County
Schools): The purpose of this Golden LEAF grant is to assist Johnston County Schools with a STEM
education framework that combines curriculum/instruction, professional development, policy, student
support and community collaboration. The target schools have high numbers of minority students and
students living in poverty with overall student achievement below the county average. The district will
partner with Duke University and NC State to develop integrated lessons in engineering concepts within
core subject areas and work with Johnston CC to align the project to technical programs offered by the
college (machining, biotechnology, welding and others).
Project STEM Stars (Asheboro City School): This Golden LEAF grant will be used by Asheboro City
School System to transform teaching and learning in grades 4-9 science classes through 3 goals: (1)
provide intensive professional development to science teachers; (2) focus on rising 9th graders through
targeted preparation for success in STEM courses; and, (3) support cohorts of middle school students to
participate in summer and after school enrichment activities in partnership with Randolph CC. Student
experiences will include biotechnology, industrial technology, machining and green energy.
Rockingham STEM (Rockingham County Schools): The purpose of this Golden LEAF grant is to
establish a partnership between Rockingham Schools (RCS), NCA&T University, National Teaching

Golden LEAF STEM Initiative
May 2013
5
Network (NTN) and Rockingham County Business & Technical Center with a goal of enhancing the
ability of RCS teachers to effectively educate students in science, technology, engineering and math.
STEM Connect (Edenton-Chowan Schools, Perquimans County Schools): The purpose of this
Golden LEAF grant is to assist Perquimans County Schools, Edenton-Chowan Schools, and the College
of the Albemarle to implement a STEM initiative that integrates: 1) a regional career focus targeting area
industry; 2) professional development for math and science teachers in inquiry-based learning, supporting
technologies, and STEM careers; 3) leadership development for administrators, lead teachers and support
staff; 4) vertical collaboration across elementary, middle, high, and post-secondary schools and the
business community; 5) access to resources to improve content rigor and relevance to improve student
engagement; and 6) community engagement and partnerships.
STEM Project for Surry (Surry County Schools): The purpose of this Golden LEAF grant is to assist
Surry County School's with taking the next step in framing a base foundation to accomplish a long-term
vision of extending the district's 1:1 technology initiative within the scope of a STEM content focus for
all schools, PK-12 within the county. The primary focus of this proposal is to establish Project Lead the
Way at the middle school level. Project leaders will work with Surry CC to vertically align secondary
course offerings to workforce training programs offered at the college and provide dual credit
opportunities.
WNC LASER (Asheville City Schools, Avery County Schools, Buncombe County Schools,
Cherokee County Schools, Clay County Schools, Graham County Schools, Haywood County
Schools, Henderson County Schools,Jackson County Schools, Macon County Schools, Madison
County Schools, McDowell County Schools, Mitchell County Schools, Polk County Schools,
Rutherford County Schools, Swain County Schools, Transylvania County Schools): The purpose of
this Golden LEAF grant is to assist North Carolina’s Western Region Education Service Alliance
(WRESA) with initiating a comprehensive Science Education initiative for the 18 school districts in its
service area. The effort builds on previous work in the region to improve science instruction and integrate
technology as a tool to enhance teaching and learning.

Golden LEAF STEM Initiative
May 2013
6
Appendix B. Grant Coordinator Interview Protocol
GLF STEM Grant Coordinator Interview Protocol
2012-13 School Year
For ~ 30 minute phone interview
ORAL PRESENTATION OF CONSENT:
First, thank you for taking time out of your very busy schedules to be here today. We value your
effort and promise not to go over the allotted time.
As you know, we have been asked by the Golden LEAF Foundation to conduct an external
evaluation across all the grants. This is being done to help the Foundation and you all to
understand better the process and impacts of this STEM education work. Our purpose today is to
find out more from you about how the implementation and impacts of your grant have been
going so far.
We’d like to record today’s conversation, which we will be repeating with coordinators of all 14
grants, so that we don’t mischaracterize anything you say and can look for commonalities across
all 14 interviews. Is that okay with you? [Wait for answer. If yes, …] I’m going to hit record,
read you a brief consent agreement, basically repeating what I just said, and if you are still okay
with proceeding, you can say “yes.” I will not say your name once we begin recording as an
extra layer of protection for your privacy.
HIT RECORD. STATE THE FOLLOWING. “This is [Your Name, Date, Time] for the
Golden LEAF STEM evaluation.”
Your participation today is voluntary. You have the right to choose not to participate or to
stop participating at any time today.
The session will be tape recorded in order to have a complete record of our discussion.
The discussion will be kept completely confidential. Neither your name, school name,
district name, or name of the grant will be associated with any of the results. Audiotapes
will be destroyed or erased at the completion of the study.
You may ask clarifying questions any time.
We expect our discussion to last approximately 25 minutes.
Do you agree to participate?

Golden LEAF STEM Initiative
May 2013
7
1. So last year we know that you all engaged in these activities: [VERY BRIEF
DESCRIPTION]. What activities are you all planning to do this year with your grant
funds – more specifically, what have you already gotten started, including over this past
summer if at all, and what does the rest of the year look like?
2. We’ve spoken with you intermittently, but looking back, what would you say were your
top 1 or 2 successes in your program last year?
3. What would you say were your top 1 or 2 challenges last year?
4. What, if any, changes in teacher instructional practice have you noticed?
PROBE: How is teacher buy-in going?
5. What, if any, changes in student attitudes toward STEM have you noticed?
6. What, if any, changes in student learning in STEM have you noticed?
7. Anything else you’d like to mention at this point?
*** Finally, any questions or suggestions for the evaluation team about anything?
Golden LEAF STEM Initiative
May 2013
8
Appendix C. Focus Group Protocol
Golden LEAF STEM Initiative Evaluation
Participating Teacher Focus Group Protocol
2012-13
Oral Presentation of Consent for Teacher Focus Group
Hello, my name is [XXX], and I work for [the Friday Institute for Educational Innovation at
NCSU/SERVE Center at UNCG]. First, let me say thank you to all of you for taking time out of
your very busy schedules to be here today. We value your effort and promise not to go over the
allotted time.
Your school, along with over 200 across the state, have received some funding from the Golden
LEAF Foundation in support of a STEM education initiative. We have been asked by the
foundation to conduct a high-level, external evaluation across all these schools. This is being
done to help the Foundation and you all, your grant coordinators and other school and district
staff understand better the process and impacts of this STEM education work. We’re trying to
help uncover what’s been working well for you all and others involved with the grant, what’s
hasn’t been working well, and what can be learned from your work for the future.
Our purpose today is to discuss your overall experiences with the Golden LEAF STEM Initiative
grant at your school. We conducted a similar focus group last year; you can see the results from
our statewide conversations in our August 2012 evaluation report on our website – Cerenc.org.
I would like to begin by briefly discussing some basic features of the focus group, and some
ground rules. The focus group will be recorded and I’m about to tell you more about that. In the
interest of time I’m going to begin passing around a consent form for you to sign saying you
wish to participate while I am also telling you some disclosures. As I’m sharing this if you wish
to stop participating you may.
Disclosures
As I said, your participation in this study is voluntary. You have the right to be a part of
this study, to choose not to participate or to stop participating at any time.
The session will be tape recorded in order to have a complete record of our discussion
and to minimize the chance that we could mischaracterize what you say. The discussion
will be kept completely confidential. Niether your name, your school names, your district
name, or even the name of the grant will be associated with any of the results. All names
of individuals, schools, districts, etc. are removed from transcripts. We compile what you
all say with what other teachers in initiative schools across the state say and look for
common themes. Audiotapes and transcriptions will be destroyed at the completion of the
study.

Golden LEAF STEM Initiative
May 2013
9
I will begin the discussion by asking the group a question. Anyone may respond to the
question. We would like to hear from everyone. You may ask clarifying questions any
time.
We expect our discussion to last approximately 60 minutes.
1. To begin with, let’s go around the circle so that each of you can introduce yourself.
Please tell us your name, grade and the subject area you teach. 2 minutes
TURN ON THE RECORDER. STATE AT THE BEGINNING OF THE RECORDING:
“This is (YOUR NAME), conducting a Golden LEAF STEM Initiative teacher focus group
on (DATE).”
2. Your grant’s main strategies include [VERY BRIEF DESCRIPTION]. How or in what
ways, if at all, have you all individually or collectively participated in any of these
activities? 7-8 minutes
a. Are there other STEM education activities you’ve participated in?
b. Do you know if they are supported by the Golden LEAF STEM Initiative?
3. Have you noticed any changes in student engagement as a result of these activities? 7-8
minutes
a. Last year some teachers mentioned female students. Have you noticed any
changes in student engagement specifically among female students?
b. Last year some teachers also mentioned other general types of students. Have you
noticed any changes in student engagement specifically among other general
types of students?
4. Building off of student engagement, have you noticed any changes in student learning as
a result of these activities? 7-8 minutes
a. Some teachers brought-up problem-solving skills last year. Have you noticed a
change in students’ problem-solving skills?
5. Would you describe some of the professional development offered to you regarding
STEM education? 7-8 minutes
a. Do you know if they are supported by the Golden LEAF STEM Initiative?
b. What has been the most valuable part of the professional development?

Golden LEAF STEM Initiative
May 2013
10
c. How would you improve the professional development?
6. Last year multiple teachers brought of the topic of content integration. How, if at all, have
these STEM education activities impacted content integration? 7-8 minutes
a. For teachers?
b. For students?
7. How, if at all, have you changed your instructional practices as a result of your school’s
participation in the Golden LEAF STEM Initiative – as a result of these activities? 7-8
minutes
8. Reflecting back over this discussion, what would you say has been the top 1 or 2 most
beneficial components of these STEM education strategies or activities at your school? 7-
8 minutes
a. What would you improve?
9. We want to help “bubble-up” your reflections on these activities and the goal to support
STEM education. Is there anything we missed, or is there anything else you would like to
share about your experiences with STEM teaching and learning this year? 7-8 minutes

11
Appendix D. Science, Technology, Engineering, Mathematics, and Elementary Teacher
Efficacy and Attitudes toward STEM (T-STEM) Surveys
Science T-STEM Survey
Teacher Efficacy and Attitudes
Toward STEM Survey (T-STEM)
Science Teacher
These evaluation instruments were identified, modified, or developed through support provided by the
National Science Foundation and the Golden LEAF Foundation. The Friday Institute grants you permission to use these instruments for educational, non-commercial purposes only. You may use an
instrument as is, or modify it to suit your needs, but in either case you must credit its original source. By using this instrument you agree to allow the Friday Institute to use the data collected for additional validity and reliability analysis. The Friday Institute will take appropriate measures to maintain the confidentiality
of all data. For information about additional permissions, please contact Dr. Jeni Corn, Director of Evaluation Programs at The Friday Institute, at [email protected].
INFORMED CONSENT FORM FOR RESEARCH
Title of Study: Golden LEAF STEM Initiative Evaluation
Principal Investigators: Jenifer O. Corn ([email protected])
We are conducting a research study to evaluate the impact of the statewide Golden LEAF STEM
Initiative on attitudes towards STEM subjects and on STEM teaching and learning outcomes. The
Initiative consists of 14 single- and multi-district grants across North Carolina, impacting over 35
districts and over 200 schools.
INFORMATION. In this study, you will be asked to complete online surveys. (Some school personnel
may also be asked to participate in focus groups, interviews, and/or classroom observations.)
The Teacher Efficacy and Attitudes toward STEM Survey is intended to help district-level grant
administrators and the Golden LEAF Foundation support STEM teaching and learning in your district
and across North Carolina. You will need approximately 15 minutes to complete this online survey.
RISKS. No foreseeable risks or discomforts are expected from your participation in this study. All study
data will be summarized, and no data will be individually identifiable or traceable back to you.
BENEFITS. Findings from this study will be used to identify what is working well and what is not
working well broadly, across all Golden LEAF STEM Initiative grantees. The best practices identified

12
through this study may be used to develop future initiatives, tools and professional development
activities to further support STEM teaching and learning.
CONFIDENTIALITY. The information in the study records will be kept strictly confidential. Survey
and observation data will be stored securely in password-protected web forms. Interview and focus
group recordings will be destroyed after the data are transcribed, and the data will be stored on a
password secured server. No reference will be made in oral or written reports which could link you,
your school or your district to the study.
PARTICIPATION. Your participation in this study is voluntary; you may decline to participate without
penalty.
CONTACT. If you have questions at any time about the study or the procedures, you may contact the
researcher, Jenifer O. Corn, at The Friday Institute 1890 Main Campus Drive, North Carolina State
University, Raleigh, NC 27606, (or 919-513-8527).
Consent to Participate
“I have read and understand the above information. My decision to participate is as follows:”
Yes, I agree to participate with the understanding that I may withdraw at any time.
No, I decline to participate.

13
Today’s Date: ________________________
This survey is being administered to a variety of teachers involved in STEM. There are 5 versions of this
survey listed below which ask about efficacy and attitudes toward teaching. Which survey are you being
asked to complete for Golden LEAF STEM Initiative?
If you are unsure which survey you should be completing, please contact the person who coordinates
this project or has asked you to complete this survey.
Elementary STEM
Science
Technology
Engineering
Mathematics
Please select the school district and name of your school:
District Name
School Name
Are you involved in STEM-related classroom or instructional activities with students?
Yes
No
Grade(s) that you teach this year, the 2012-13 school year (check all that apply):
Kindergarten 3 6 9 11
1 4 7 10 12
2 5 8
Please select all subjects that you teach during the 2012-13 school year:
None Chemistry AP Physics C: Elect/Magn.
Elementary Science Earth/Environmental Science AP Physics C: Mechanics
6th Grade Science Physical Science AP Chemistry

14
7th Grade Science Physics Other (Please List)
8th Grade Science AP Environmental Science _______________________
Biology AP Physics B
Please select all subjects that you teach during the 2012-13 school year:
None
Computer Skills
AP Computer Science
Career & Technical Education
Other (Please List)
_______________________
Please select all subjects that you teach during the 2012-13 school year:
None Algebra 2 Adv. Functions & Model.
Elementary Math Technical Mathematics 1 Discrete Mathematics
6th Grade Math Technical Mathematics 2 Trigonometry
7th Grade Math Geometry Pre-Calculus
8th Grade Math Integrated Mathematics 1 AP Statistics
Introductory Mathematics Integrated Mathematics 2 AP Calculus AB
Pre-Algebra Integrated Mathematics 3 AP Calculus BC
Algebra 1 Integrated Mathematics 4 Other (Please list)
__________________
Do you teach any engineering-related classes during the 2012-13 school year?
Yes
No
If yes, please list the name(s) of the engineering class(es):
________________________________________________________________________________

15
Are you National Board Certified?
Yes
No
Are you a licensed educator? If so, please list your area(s) of licensure:
Yes
No ___________________________________________________
___________________________________________________
Years of Experience:
Years
Gender:
Male
Female
I identify as:
American Indian/Alaska Native
Asian
Black/African American
Native Hawaiian/Other Pacific Islander
White/Caucasian
Hispanic/Latino
Multiracial
Other __________________________

16
DIRECTIONS:
For each of the following statements, please indicate the degree to which you agree or disagree.
Even though some statements are very similar, please answer each statement. There are no
"right" or "wrong" answers. The only correct responses are those that are true for you. Whenever
possible, let the things that have happened to you help make your choice.
Personal STEM Teaching Efficacy and Beliefs (PSTEBS)1 – Science
Directions: Please respond to these questions regarding your feelings about your
own teaching.
Strongly
Disagree Disagree
Neither
Agree
nor
Disagree
Agree Strongly
Agree
1. I am continually improving my
science teaching practice. ○ ○ ○ ○ ○
2. I know the steps necessary to teach
science effectively. ○ ○ ○ ○ ○
3. I am confident that I can explain to
students why science experiments
work.
○ ○ ○ ○ ○
4. I am confident that I can teach science
effectively. ○ ○ ○ ○ ○
5. I wonder if I have the necessary skills
to teach science. ○ ○ ○ ○ ○
6. I understand science concepts well
enough to be effective in teaching
science.
○ ○ ○ ○ ○
7. Given a choice, I would invite a
colleague to evaluate my science
teaching.
○ ○ ○ ○ ○
8. I am confident that I can answer
students’ science questions. ○ ○ ○ ○ ○
1 This scale was developed from the STEBI (Science Teaching Efficacy Beliefs Instrument). Enochs, L.G. & Riggs,
I. (1990). Further development of an elementary science teaching efficacy belief instrument: A preservice
elementary scale. School Science and Mathematics, 90, 694-706.

17
9. When a student has difficulty
understanding a science concept, I am
confident that I know how to help the
student understand it better.
○ ○ ○ ○ ○
10. When teaching science, I am
confident enough to welcome student
questions.
○ ○ ○ ○ ○
11. I know what to do to increase student
interest in science. ○ ○ ○ ○ ○
STEM Teaching Outcome Expectancy Beliefs (STOES)2 - Science
Directions: Please respond to these questions regarding your feelings about
teaching in general.
Strongly
Disagree Disagree
Neither
Agree
nor
Disagree
Agree Strongly
Agree
12. When a student does better than usual
in science, it is often because the
teacher exerted a little extra effort.
○ ○ ○ ○ ○
13. The inadequacy of a student’s science
background can be overcome by good
teaching.
○ ○ ○ ○ ○
14. When a student’s learning in science
is greater than expected, it is most
often due to their teacher having
found a more effective teaching
approach.
○ ○ ○ ○ ○
15. The teacher is generally responsible
for students’ learning in science. ○ ○ ○ ○ ○
16. If students’ learning in science is less
than expected, it is most likely due to
ineffective science teaching.
○ ○ ○ ○ ○
17. Students’ learning in science is
directly realted to their teacher’s
effectiveness in science teaching.
○ ○ ○ ○ ○
2 This scale was developed from the STEBI (Science Teaching Efficacy Beliefs Instrument). Enochs, L.G. & Riggs,
I. (1990). Further development of an elementary science teaching efficacy belief instrument: A preservice
elementary scale. School Science and Mathematics, 90, 694-706.

18
18. When a low achieving child
progresses more than expected in
science, it is usually due to extra
attention given by the teacher.
○ ○ ○ ○ ○
19. If parents comment that their child is
showing more interest in science at
school, it is probably due to the
performance of the child’s teacher.
○ ○ ○ ○ ○
20. Minimal student learning in science
can generally be attributed to their
teachers.
○ ○ ○ ○ ○
Student Technology Use
Directions: Please answer the following questions about how often students use
technology in settings where you instruct students.
During science
instructional meetings (e.g.
class periods, after school
activities, days of summer
camp, etc.)
Never Occasionall
y
About
half the
time
Usually Every
time
Not
Applicable
21. Students use a variety of
technologies, e.g.
productivity, data
visualization, research, and
communication tools.
○ ○ ○ ○ ○ ○
22. Students use technology to
communicate and
collaborate with others,
beyond the classroom.
○ ○ ○ ○ ○ ○
23. Students use technology to
access online resources and
information as a part of
activities.
○ ○ ○ ○ ○ ○
24. Students use the same kinds
of tools that professional
researchers use, e.g.
simulations, databases,
satellite imagery.
○ ○ ○ ○ ○ ○
19
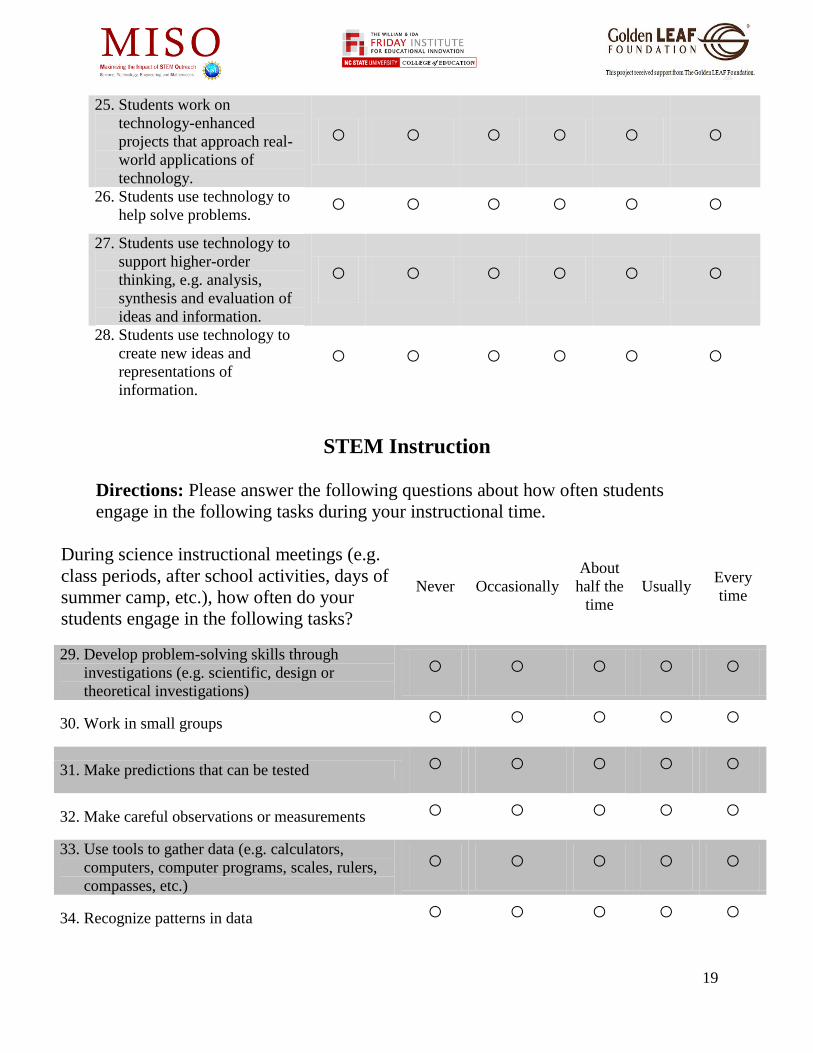
STEM Instruction
Directions: Please answer the following questions about how often students
engage in the following tasks during your instructional time.
During science instructional meetings (e.g.
class periods, after school activities, days of
summer camp, etc.), how often do your
students engage in the following tasks?
Never Occasionally
About
half the
time
Usually Every
time
29. Develop problem-solving skills through
investigations (e.g. scientific, design or
theoretical investigations)
○ ○ ○ ○ ○
30. Work in small groups ○ ○ ○ ○ ○
31. Make predictions that can be tested ○ ○ ○ ○ ○
32. Make careful observations or measurements ○ ○ ○ ○ ○
33. Use tools to gather data (e.g. calculators,
computers, computer programs, scales, rulers,
compasses, etc.)
○ ○ ○ ○ ○
34. Recognize patterns in data ○ ○ ○ ○ ○
25. Students work on
technology-enhanced
projects that approach real-
world applications of
technology.
○ ○ ○ ○ ○ ○
26. Students use technology to
help solve problems. ○ ○ ○ ○ ○ ○
27. Students use technology to
support higher-order
thinking, e.g. analysis,
synthesis and evaluation of
ideas and information.
○ ○ ○ ○ ○ ○
28. Students use technology to
create new ideas and
representations of
information.
○ ○ ○ ○ ○ ○
20
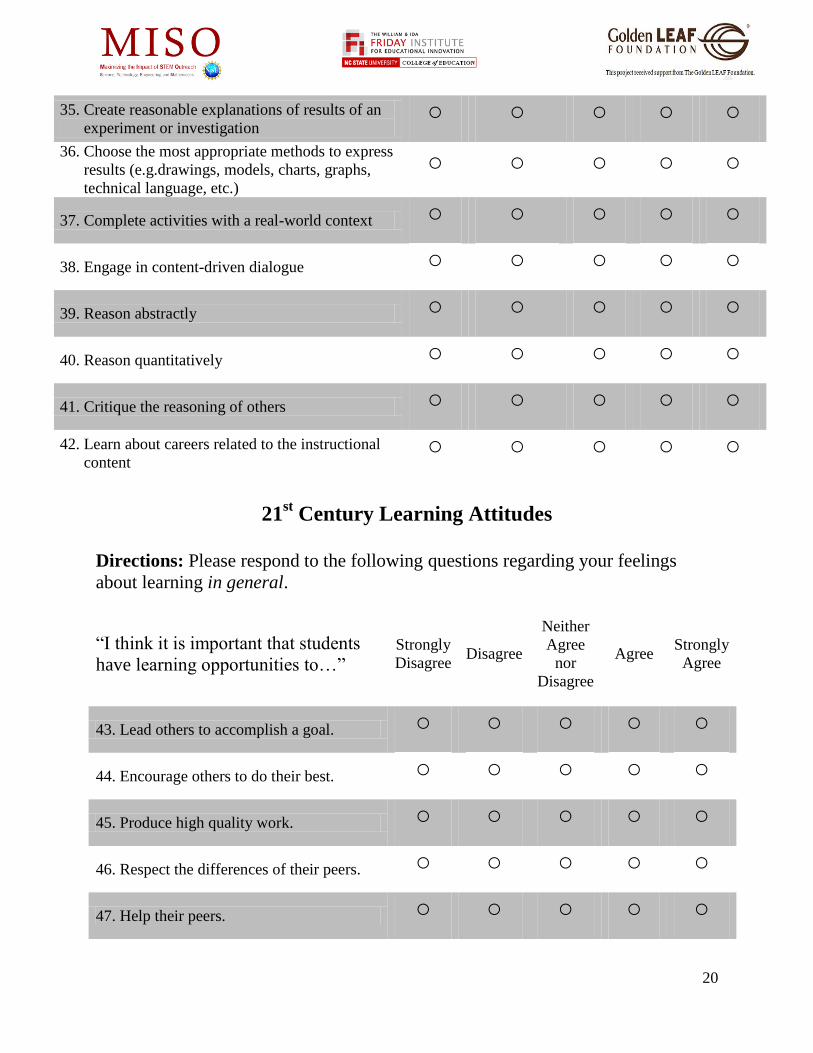
35. Create reasonable explanations of results of an
experiment or investigation ○ ○ ○ ○ ○
36. Choose the most appropriate methods to express
results (e.g.drawings, models, charts, graphs,
technical language, etc.)
○ ○ ○ ○ ○
37. Complete activities with a real-world context ○ ○ ○ ○ ○
38. Engage in content-driven dialogue ○ ○ ○ ○ ○
39. Reason abstractly ○ ○ ○ ○ ○
40. Reason quantitatively ○ ○ ○ ○ ○
41. Critique the reasoning of others ○ ○ ○ ○ ○
42. Learn about careers related to the instructional
content ○ ○ ○ ○ ○
21st Century Learning Attitudes
Directions: Please respond to the following questions regarding your feelings
about learning in general.
“I think it is important that students
have learning opportunities to…”
Strongly
Disagree Disagree
Neither
Agree
nor
Disagree
Agree Strongly
Agree
43. Lead others to accomplish a goal. ○ ○ ○ ○ ○
44. Encourage others to do their best. ○ ○ ○ ○ ○
45. Produce high quality work. ○ ○ ○ ○ ○
46. Respect the differences of their peers. ○ ○ ○ ○ ○
47. Help their peers. ○ ○ ○ ○ ○

21
Teacher Leadership Attitudes
Directions: Please respond to the following questions regarding your feelings
about teacher leadership in general.
“I think it is important that teachers …” Strongly
Disagree Disagree
Neither
Agree
nor
Disagree
Agree Strongly
Agree
54. Take responsibility for all students’
learning. ○ ○ ○ ○ ○
55. Communicate vision to students. ○ ○ ○ ○ ○
56. Use a variety of assessment data
throughout the year to evaluate
progress.
○ ○ ○ ○ ○
57. Use a variety of data to organize, plan
and set goals. ○ ○ ○ ○ ○
58. Establish a safe and orderly
environment. ○ ○ ○ ○ ○
59. Empower students. ○ ○ ○ ○ ○
48. Include others’ perspectives when
making decisions. ○ ○ ○ ○ ○
49. Make changes when things do not go as
planned. ○ ○ ○ ○ ○
50. Set their own learning goals. ○ ○ ○ ○ ○
51. Manage their time wisely when working
on their own. ○ ○ ○ ○ ○
52. Choose which assignment out of many
needs to be done first. ○ ○ ○ ○ ○
53. Work well with students from different
backgrounds. ○ ○ ○ ○ ○
22
STEM Career Awareness
Directions: Please respond to the following questions based upon how much you
disagree or agree with the statements.
“I know …” Strongly
Disagree Disagree
Neither
Agree
nor
Disagree
Agree Strongly
Agree
60. About current STEM careers. ○ ○ ○ ○ ○
61. Where to go to learn more about STEM
careers. ○ ○ ○ ○ ○
62. Where to find resources for teaching
students about STEM careers. ○ ○ ○ ○ ○
63. Where to direct students or parents to
find information about STEM careers. ○ ○ ○ ○ ○
23
Technology T-STEM
Teacher Efficacy and Attitudes
Toward STEM Survey (T-STEM)
Technology Teacher
DIRECTIONS:
For each of the following statements, please indicate the degree to which you agree or disagree.
Even though some statements are very similar, please answer each statement. There are no
"right" or "wrong" answers. The only correct responses are those that are true for you. Whenever
possible, let the things that have happened to you help make your choice.
Personal STEM Teaching Efficacy and Beliefs (PSTEBS)3 - Technology
Directions: Please respond to these questions regarding your feelings about your
own teaching.
Strongly
Disagree Disagree
Neither
Agree nor
Disagree
Agree Strongly
Agree
1. I am continually improving my
technology teaching practice. ○ ○ ○ ○ ○ 2. I know the steps necessary to teach
technology effectively. ○ ○ ○ ○ ○ 3. I am confident that I can explain to
students why technology experiments
work. ○ ○ ○ ○ ○
4. I am confident that I can teach
technology effectively. ○ ○ ○ ○ ○ 5. I wonder if I have the necessary skills
to teach technology. ○ ○ ○ ○ ○ 6. I understand technology concepts well
enough to be effective in teaching
technology. ○ ○ ○ ○ ○
7. Given a choice, I would invite a
colleague to evaluate my technology
teaching. ○ ○ ○ ○ ○
3 This scale was developed from the STEBI (Technology Teaching Efficacy Beliefs Instrument). Enochs, L.G. &
Riggs, I. (1990). Further development of an elementary technology teaching efficacy belief instrument: A preservice
elementary scale. School Technology and Mathematics, 90, 694-706.

24
8. I am confident that I can answer
students’ technology questions. ○ ○ ○ ○ ○ 9. When a student has difficulty
understanding a technology concept, I
am confident that I know how to help
the student understand it better.
○ ○ ○ ○ ○
10. When teaching technology, I am
confident enough to welcome student
questions. ○ ○ ○ ○ ○
11. I know what to do to increase student
interest in technology. ○ ○ ○ ○ ○
STEM Teaching Outcome Expectancy Beliefs (STOES)4 - Technology
Directions: Please respond to these questions regarding your feelings about
teaching in general.
Strongly
Disagree Disagree
Neither
Agree nor
Disagree
Agree Strongly
Agree
12. When a student does better than usual
in technology, it is often because the
teacher exerted a little extra effort. ○ ○ ○ ○ ○
13. The inadequacy of a student’s
technology background can be
overcome by good teaching. ○ ○ ○ ○ ○
14. When a student’s learning in
technology is greater than expected, it
is most often due to their teacher
having found a more effective
teaching approach.
○ ○ ○ ○ ○
15. The teacher is generally responsible
for students’ learning in technology. ○ ○ ○ ○ ○ 16. If students’ learning in technology is
less than expected, it is most likely
due to ineffective technology
teaching.
○ ○ ○ ○ ○
17. Students’ learning in technology is
directly realted to their teacher’s
effectiveness in technology teaching. ○ ○ ○ ○ ○
18. When a low achieving child
progresses more than expected in ○ ○ ○ ○ ○ 4 This scale was developed from the STEBI (Science Teaching Efficacy Beliefs Instrument). Enochs, L.G. & Riggs,
I. (1990). Further development of an elementary science teaching efficacy belief instrument: A preservice
elementary scale. School Science and Mathematics, 90, 694-706.
25
Strongly
Disagree Disagree
Neither
Agree nor
Disagree
Agree Strongly
Agree
technology, it is usually due to extra
attention given by the teacher.
19. If parents comment that their child is
showing more interest in technology
at school, it is probably due to the
performance of the child’s teacher.
○ ○ ○ ○ ○
20. Minimal student learning in
technology can generally be attributed
to their teachers. ○ ○ ○ ○ ○

26
Student Technology Use
Directions: Please answer the following questions about how often students use
technology in settings where you instruct students.
During technology
instructional meetings (e.g.
class periods, after school
activities, days of summer
camp, etc.)
Never Occasionally
About
half the
time
Usually Every time Not
Applicable
21. Students use a variety of
technologies, e.g.
productivity, data
visualization, research, and
communication tools.
○ ○ ○ ○ ○ ○
22. Students use technology to
communicate and
collaborate with others,
beyond the classroom.
○ ○ ○ ○ ○ ○
23. Students use technology to
access online resources and
information as a part of
activities.
○ ○ ○ ○ ○ ○
24. Students use the same kinds
of tools that professional
researchers use, e.g.
simulations, databases,
satellite imagery.
○ ○ ○ ○ ○ ○
25. Students work on
technology-enhanced
projects that approach real-
world applications of
technology.
○ ○ ○ ○ ○ ○
26. Students use technology to
help solve problems. ○ ○ ○ ○ ○ ○ 27. Students use technology to
support higher-order
thinking, e.g. analysis,
synthesis and evaluation of
ideas and information.
○ ○ ○ ○ ○ ○
28. Students use technology to
create new ideas and
representations of
information.
○ ○ ○ ○ ○ ○

27
STEM Instruction
Directions: Please answer the following questions about how often students
engage in the following tasks during your instructional time.
During technology instructional meetings
(e.g. class periods, after school activities,
days of summer camp, etc.), how often do
your students engage in the following tasks?
Never Occasionally
About
half the
time
Usually Every
time
29. Develop problem-solving skills through
investigations (e.g. scientific, design or
theoretical investigations) ○ ○ ○ ○ ○
30. Work in small groups ○ ○ ○ ○ ○ 31. Make predictions that can be tested ○ ○ ○ ○ ○ 32. Make careful observations or measurements ○ ○ ○ ○ ○ 33. Use tools to gather data (e.g. calculators,
computers, computer programs, scales, rulers,
compasses, etc.) ○ ○ ○ ○ ○
34. Recognize patterns in data ○ ○ ○ ○ ○ 35. Create reasonable explanations of results of an
experiment or investigation ○ ○ ○ ○ ○ 36. Choose the most appropriate methods to express
results (e.g. drawings, models, charts, graphs,
technical language, etc.) ○ ○ ○ ○ ○
37. Complete activities with a real-world context ○ ○ ○ ○ ○ 38. Engage in content-driven dialogue ○ ○ ○ ○ ○ 39. Reason abstractly ○ ○ ○ ○ ○ 40. Reason quantitatively ○ ○ ○ ○ ○ 41. Critique the reasoning of others ○ ○ ○ ○ ○ 42. Learn about careers related to the instructional
content ○ ○ ○ ○ ○
21st Century Learning Attitudes

28
Directions: Please respond to the following questions regarding your feelings
about learning in general.
Teacher Leadership Attitudes
Directions: Please respond to the following questions regarding your feelings
about teacher leadership in general.
“I think it is important that teachers …” Strongly
Disagree Disagree
Neither
Agree
nor
Disagree
Agree Strongly
Agree
54. Take responsibility for all students’
learning. ○ ○ ○ ○ ○
55. Communicate vision to students. ○ ○ ○ ○ ○
“I think it is important that students
have learning opportunities to…”
Strongly
Disagree Disagree
Neither
Agree nor
Disagree
Agree Strongly
Agree
43. Lead others to accomplish a goal. ○ ○ ○ ○ ○ 44. Encourage others to do their best. ○ ○ ○ ○ ○ 45. Produce high quality work. ○ ○ ○ ○ ○ 46. Respect the differences of their peers. ○ ○ ○ ○ ○ 47. Help their peers. ○ ○ ○ ○ ○ 48. Include others’ perspectives when
making decisions. ○ ○ ○ ○ ○ 49. Make changes when things do not go as
planned. ○ ○ ○ ○ ○
50. Set their own learning goals. ○ ○ ○ ○ ○ 51. Manage their time wisely when working
on their own. ○ ○ ○ ○ ○ 52. Choose which assignment out of many
needs to be done first. ○ ○ ○ ○ ○ 53. Work well with students from different
backgrounds. ○ ○ ○ ○ ○

29
56. Use a variety of assessment data
throughout the year to evaluate
progress. ○ ○ ○ ○ ○
57. Use a variety of data to organize, plan
and set goals. ○ ○ ○ ○ ○ 58. Establish a safe and orderly
environment. ○ ○ ○ ○ ○
59. Empower students. ○ ○ ○ ○ ○
STEM Career Awareness
Directions: Please respond to the following questions based upon how much you
disagree or agree with the statements.
“I know …” Strongly
Disagree Disagree
Neither
Agree
nor
Disagree
Agree Strongly
Agree
60. About current STEM careers. ○ ○ ○ ○ ○ 61. Where to go to learn more about STEM
careers. ○ ○ ○ ○ ○ 62. Where to find resources for teaching
students about STEM careers. ○ ○ ○ ○ ○ 63. Where to direct students or parents to
find information about STEM careers. ○ ○ ○ ○ ○
30
Engineering T-STEM
Teacher Efficacy and Attitudes
Toward STEM Survey (T-STEM)
Engineering Teacher
DIRECTIONS:
For each of the following statements, please indicate the degree to which you agree or disagree.
Even though some statements are very similar, please answer each statement. There are no
"right" or "wrong" answers. The only correct responses are those that are true for you. Whenever
possible, let the things that have happened to you help make your choice.
Personal STEM Teaching Efficacy and Beliefs (PSTEBS)5 – Engineering
Directions: Please respond to these questions regarding your feelings about your
own teaching.
Strongly
Disagree Disagree
Neither
Agree
nor
Disagree
Agree Strongly
Agree
1. I am continually improving my
engineering teaching practice. ○ ○ ○ ○ ○
2. I know the steps necessary to teach
engineering effectively. ○ ○ ○ ○ ○
3. I am confident that I can explain to
students why engineering experiments
work.
○ ○ ○ ○ ○
4. I am confident that I can teach
engineering effectively. ○ ○ ○ ○ ○
5. I wonder if I have the necessary skills
to teach engineering. ○ ○ ○ ○ ○
5 This scale was developed from the STEBI (Technology Teaching Efficacy Beliefs Instrument). Enochs, L.G. &
Riggs, I. (1990). Further development of an elementary technology teaching efficacy belief instrument: A preservice
elementary scale. School Technology and Mathematics, 90, 694-706.

31
6. I understand engineering concepts
well enough to be effective in
teaching engineering.
○ ○ ○ ○ ○
7. Given a choice, I would invite a
colleague to evaluate my engineering
teaching.
○ ○ ○ ○ ○
8. I am confident that I can answer
students’ engineering questions. ○ ○ ○ ○ ○
9. When a student has difficulty
understanding a engineering concept,
I am confident that I know how to
help the student understand it better.
○ ○ ○ ○ ○
10. When teaching engineering, I am
confident enough to welcome student
questions.
○ ○ ○ ○ ○
11. I know what to do to increase student
interest in engineering. ○ ○ ○ ○ ○
STEM Teaching Outcome Expectancy Beliefs (STOES)6 - Engineering
Directions: Please respond to these questions regarding your feelings about
teaching in general.
Strongly
Disagree Disagree
Neither
Agree
nor
Disagree
Agree Strongly
Agree
12. When a student does better than usual
in engineering, it is often because the
teacher exerted a little extra effort.
○ ○ ○ ○ ○
13. The inadequacy of a student’s
engineering background can be
overcome by good teaching.
○ ○ ○ ○ ○
6 This scale was developed from the STEBI (Science Teaching Efficacy Beliefs Instrument). Enochs, L.G. & Riggs,
I. (1990). Further development of an elementary science teaching efficacy belief instrument: A preservice
elementary scale. School Science and Mathematics, 90, 694-706.
32
Strongly
Disagree Disagree
Neither
Agree
nor
Disagree
Agree Strongly
Agree
14. When a student’s learning in
engineering is greater than expected,
it is most often due to their teacher
having found a more effective
teaching approach.
○ ○ ○ ○ ○
15. The teacher is generally responsible
for students’ learning in engineering. ○ ○ ○ ○ ○
16. If students’ learning in engineering is
less than expected, it is most likely
due to ineffective engineering
teaching.
○ ○ ○ ○ ○
17. Students’ learning in engineering is
directly realted to their teacher’s
effectiveness in engineering teaching.
○ ○ ○ ○ ○
18. When a low achieving child
progresses more than expected in
engineering, it is usually due to extra
attention given by the teacher.
○ ○ ○ ○ ○
19. If parents comment that their child is
showing more interest in engineering
at school, it is probably due to the
performance of the child’s teacher.
○ ○ ○ ○ ○
20. Minimal student learning in
engineering can generally be
attributed to their teachers.
○ ○ ○ ○ ○
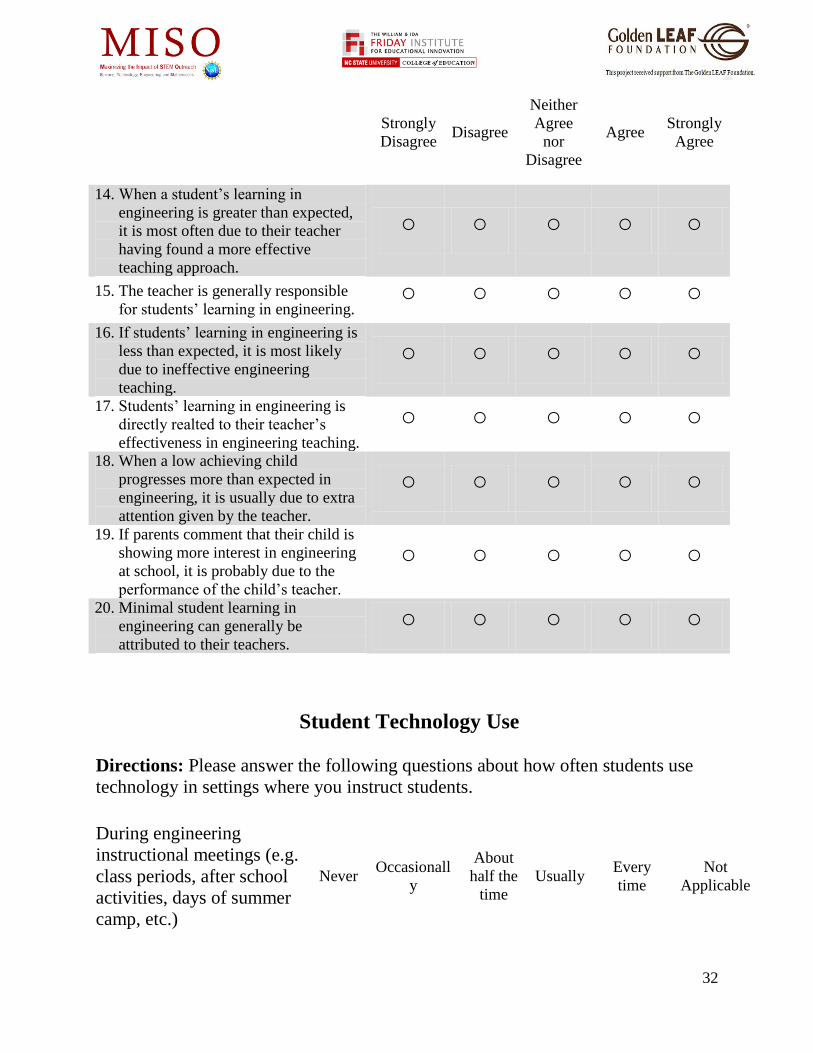
Student Technology Use
Directions: Please answer the following questions about how often students use
technology in settings where you instruct students.
During engineering
instructional meetings (e.g.
class periods, after school
activities, days of summer
camp, etc.)
Never Occasionall
y
About
half the
time
Usually Every
time
Not
Applicable

33
STEM Instruction
Directions: Please answer the following questions about how often students
engage in the following tasks during your instructional time.
21. Students use a variety of
technologies, e.g.
productivity, data
visualization, research, and
communication tools.
○ ○ ○ ○ ○ ○
22. Students use technology to
communicate and
collaborate with others,
beyond the classroom.
○ ○ ○ ○ ○ ○
23. Students use technology to
access online resources and
information as a part of
activities.
○ ○ ○ ○ ○ ○
24. Students use the same kinds
of tools that professional
researchers use, e.g.
simulations, databases,
satellite imagery.
○ ○ ○ ○ ○ ○
25. Students work on
technology-enhanced
projects that approach real-
world applications of
technology.
○ ○ ○ ○ ○ ○
26. Students use technology to
help solve problems. ○ ○ ○ ○ ○ ○
27. Students use technology to
support higher-order
thinking, e.g. analysis,
synthesis and evaluation of
ideas and information.
○ ○ ○ ○ ○ ○
28. Students use technology to
create new ideas and
representations of
information.
○ ○ ○ ○ ○ ○

34
During engineering instructional meetings
(e.g. class periods, after school activities,
days of summer camp, etc.), how often do
your students engage in the following tasks?
Never Occasionally
About
half the
time
Usually Every
time
29. Develop problem-solving skills through
investigations (e.g. scientific, design or
theoretical investigations)
○ ○ ○ ○ ○
30. Work in small groups ○ ○ ○ ○ ○
31. Make predictions that can be tested ○ ○ ○ ○ ○
32. Make careful observations or measurements ○ ○ ○ ○ ○
33. Use tools to gather data (e.g. calculators,
computers, computer programs, scales, rulers,
compasses, etc.)
○ ○ ○ ○ ○
34. Recognize patterns in data ○ ○ ○ ○ ○
35. Create reasonable explanations of results of an
experiment or investigation ○ ○ ○ ○ ○
36. Choose the most appropriate methods to express
results (e.g. drawings, models, charts, graphs,
technical language, etc.)
○ ○ ○ ○ ○
37. Complete activities with a real-world context ○ ○ ○ ○ ○
38. Engage in content-driven dialogue ○ ○ ○ ○ ○
39. Reason abstractly ○ ○ ○ ○ ○
40. Reason quantitatively ○ ○ ○ ○ ○
41. Critique the reasoning of others ○ ○ ○ ○ ○
42. Learn about careers related to the instructional
content ○ ○ ○ ○ ○

35
21st Century Learning Attitudes
Directions: Please respond to the following questions regarding your feelings
about learning in general.
“I think it is important that students
have learning opportunities to…”
Strongly
Disagree Disagree
Neither
Agree
nor
Disagree
Agree Strongly
Agree
43. Lead others to accomplish a goal. ○ ○ ○ ○ ○
44. Encourage others to do their best. ○ ○ ○ ○ ○
45. Produce high quality work. ○ ○ ○ ○ ○
46. Respect the differences of their peers. ○ ○ ○ ○ ○
47. Help their peers. ○ ○ ○ ○ ○
48. Include others’ perspectives when
making decisions. ○ ○ ○ ○ ○
49. Make changes when things do not go as
planned. ○ ○ ○ ○ ○
50. Set their own learning goals. ○ ○ ○ ○ ○
51. Manage their time wisely when working
on their own. ○ ○ ○ ○ ○
52. Choose which assignment out of many
needs to be done first. ○ ○ ○ ○ ○
53. Work well with students from different
backgrounds. ○ ○ ○ ○ ○

36
Teacher Leadership Attitudes
Directions: Please respond to the following questions regarding your feelings
about teacher leadership in general.
“I think it is important that teachers …” Strongly
Disagree Disagree
Neither
Agree
nor
Disagree
Agree Strongly
Agree
54. Take responsibility for all students’
learning. ○ ○ ○ ○ ○
55. Communicate vision to students. ○ ○ ○ ○ ○
56. Use a variety of assessment data
throughout the year to evaluate
progress.
○ ○ ○ ○ ○
57. Use a variety of data to organize, plan
and set goals. ○ ○ ○ ○ ○
58. Establish a safe and orderly
environment. ○ ○ ○ ○ ○
59. Empower students. ○ ○ ○ ○ ○
STEM Career Awareness
Directions: Please respond to the following questions based upon how much you
disagree or agree with the statements.
“I know …” Strongly
Disagree Disagree
Neither
Agree
nor
Disagree
Agree Strongly
Agree
60. About current STEM careers. ○ ○ ○ ○ ○
61. Where to go to learn more about STEM
careers. ○ ○ ○ ○ ○
62. Where to find resources for teaching
students about STEM careers. ○ ○ ○ ○ ○

37
63. Where to direct students or parents to
find information about STEM careers. ○ ○ ○ ○ ○
38
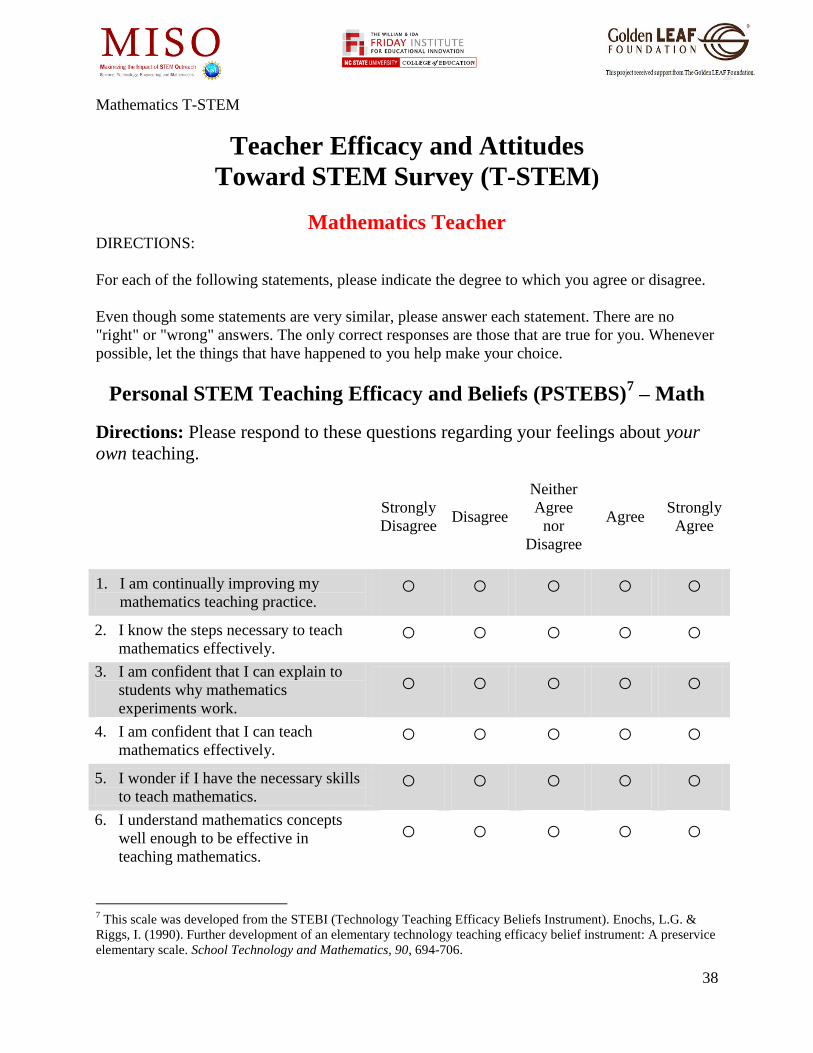
Mathematics T-STEM
Teacher Efficacy and Attitudes
Toward STEM Survey (T-STEM)
Mathematics Teacher DIRECTIONS:
For each of the following statements, please indicate the degree to which you agree or disagree.
Even though some statements are very similar, please answer each statement. There are no
"right" or "wrong" answers. The only correct responses are those that are true for you. Whenever
possible, let the things that have happened to you help make your choice.
Personal STEM Teaching Efficacy and Beliefs (PSTEBS)7 – Math
Directions: Please respond to these questions regarding your feelings about your
own teaching.
Strongly
Disagree Disagree
Neither
Agree
nor
Disagree
Agree Strongly
Agree
1. I am continually improving my
mathematics teaching practice. ○ ○ ○ ○ ○
2. I know the steps necessary to teach
mathematics effectively. ○ ○ ○ ○ ○
3. I am confident that I can explain to
students why mathematics
experiments work.
○ ○ ○ ○ ○
4. I am confident that I can teach
mathematics effectively. ○ ○ ○ ○ ○
5. I wonder if I have the necessary skills
to teach mathematics. ○ ○ ○ ○ ○
6. I understand mathematics concepts
well enough to be effective in
teaching mathematics.
○ ○ ○ ○ ○
7 This scale was developed from the STEBI (Technology Teaching Efficacy Beliefs Instrument). Enochs, L.G. &
Riggs, I. (1990). Further development of an elementary technology teaching efficacy belief instrument: A preservice
elementary scale. School Technology and Mathematics, 90, 694-706.

39
7. Given a choice, I would invite a
colleague to evaluate my mathematics
teaching.
○ ○ ○ ○ ○
8. I am confident that I can answer
students’ mathematics questions. ○ ○ ○ ○ ○
9. When a student has difficulty
understanding a mathematics concept,
I am confident that I know how to
help the student understand it better.
○ ○ ○ ○ ○
10. When teaching mathematics, I am
confident enough to welcome student
questions.
○ ○ ○ ○ ○
11. I know what to do to increase student
interest in mathematics. ○ ○ ○ ○ ○
STEM Teaching Outcome Expectancy Beliefs (STOES)8 - Math
Directions: Please respond to these questions regarding your feelings about
teaching in general.
Strongly
Disagree Disagree
Neither
Agree
nor
Disagree
Agree Strongly
Agree
12. When a student does better than usual
in mathematics, it is often because the
teacher exerted a little extra effort.
○ ○ ○ ○ ○
13. The inadequacy of a student’s
mathematics background can be
overcome by good teaching.
○ ○ ○ ○ ○
14. When a student’s learning in
mathematics is greater than expected,
it is most often due to their teacher
having found a more effective
teaching approach.
○ ○ ○ ○ ○
15. The teacher is generally responsible
for students’ learning in mathematics. ○ ○ ○ ○ ○
8 This scale was developed from the STEBI (Science Teaching Efficacy Beliefs Instrument). Enochs, L.G. & Riggs,
I. (1990). Further development of an elementary science teaching efficacy belief instrument: A preservice
elementary scale. School Science and Mathematics, 90, 694-706.

40
16. If students’ learning in mathematics is
less than expected, it is most likely
due to ineffective mathematics
teaching.
○ ○ ○ ○ ○
17. Students’ learning in mathematics is
directly realted to their teacher’s
effectiveness in mathematics teaching.
○ ○ ○ ○ ○
18. When a low achieving child
progresses more than expected in
mathematics, it is usually due to extra
attention given by the teacher.
○ ○ ○ ○ ○
19. If parents comment that their child is
showing more interest in mathematics
at school, it is probably due to the
performance of the child’s teacher.
○ ○ ○ ○ ○
20. Minimal student learning in
mathematics can generally be
attributed to their teachers.
○ ○ ○ ○ ○
Student Technology Use
Directions: Please answer the following questions about how often students use
technology in settings where you instruct students.
During mathematics
instructional meetings (e.g.
class periods, after school
activities, days of summer
camp, etc.)
Never Occasionall
y
About
half the
time
Usuall
y
Every
time
Not
Applicable
21. Students use a variety of
technologies, e.g.
productivity, data
visualization, research, and
communication tools.
○ ○ ○ ○ ○ ○
22. Students use technology to
communicate and
collaborate with others,
beyond the classroom.
○ ○ ○ ○ ○ ○
23. Students use technology to
access online resources and
information as a part of
activities.
○ ○ ○ ○ ○ ○

41
STEM Instruction
Directions: Please answer the following questions about how often students
engage in the following tasks during your instructional time.
During mathematics instructional meetings
(e.g. class periods, after school activities,
days of summer camp, etc.), how often do
your students engage in the following tasks?
Never Occasionally
About
half the
time
Usually Every
time
29. Develop problem-solving skills through
investigations (e.g. scientific, design or
theoretical investigations)
○ ○ ○ ○ ○
30. Work in small groups ○ ○ ○ ○ ○
31. Make predictions that can be tested ○ ○ ○ ○ ○
32. Make careful observations or measurements ○ ○ ○ ○ ○
24. Students use the same kinds
of tools that professional
researchers use, e.g.
simulations, databases,
satellite imagery.
○ ○ ○ ○ ○ ○
25. Students work on
technology-enhanced
projects that approach real-
world applications of
technology.
○ ○ ○ ○ ○ ○
26. Students use technology to
help solve problems. ○ ○ ○ ○ ○ ○
27. Students use technology to
support higher-order
thinking, e.g. analysis,
synthesis and evaluation of
ideas and information.
○ ○ ○ ○ ○ ○
28. Students use technology to
create new ideas and
representations of
information.
○ ○ ○ ○ ○ ○

42
33. Use tools to gather data (e.g. calculators,
computers, computer programs, scales, rulers,
compasses, etc.)
○ ○ ○ ○ ○
34. Recognize patterns in data ○ ○ ○ ○ ○
35. Create reasonable explanations of results of an
experiment or investigation ○ ○ ○ ○ ○
36. Choose the most appropriate methods to express
results (e.g. drawings, models, charts, graphs,
technical language, etc.)
○ ○ ○ ○ ○
37. Complete activities with a real-world context ○ ○ ○ ○ ○
38. Engage in content-driven dialogue ○ ○ ○ ○ ○
39. Reason abstractly ○ ○ ○ ○ ○
40. Reason quantitatively ○ ○ ○ ○ ○
41. Critique the reasoning of others ○ ○ ○ ○ ○
42. Learn about careers related to the instructional
content ○ ○ ○ ○ ○
21st Century Learning Attitudes
Directions: Please respond to the following questions regarding your feelings
about learning in general.
“I think it is important that students
have learning opportunities to…”
Strongly
Disagree Disagree
Neither
Agree
nor
Disagree
Agree Strongly
Agree
43. Lead others to accomplish a goal. ○ ○ ○ ○ ○
44. Encourage others to do their best. ○ ○ ○ ○ ○

43
Teacher Leadership Attitudes
Directions: Please respond to the following questions regarding your feelings
about teacher leadership in general.
“I think it is important that teachers …” Strongly
Disagree Disagree
Neither
Agree
nor
Disagree
Agree Strongly
Agree
54. Take responsibility for all students’
learning. ○ ○ ○ ○ ○
55. Communicate vision to students. ○ ○ ○ ○ ○
56. Use a variety of assessment data
throughout the year to evaluate
progress.
○ ○ ○ ○ ○
57. Use a variety of data to organize, plan
and set goals. ○ ○ ○ ○ ○
45. Produce high quality work. ○ ○ ○ ○ ○
46. Respect the differences of their peers. ○ ○ ○ ○ ○
47. Help their peers. ○ ○ ○ ○ ○
48. Include others’ perspectives when
making decisions. ○ ○ ○ ○ ○
49. Make changes when things do not go as
planned. ○ ○ ○ ○ ○
50. Set their own learning goals. ○ ○ ○ ○ ○
51. Manage their time wisely when working
on their own. ○ ○ ○ ○ ○
52. Choose which assignment out of many
needs to be done first. ○ ○ ○ ○ ○
53. Work well with students from different
backgrounds. ○ ○ ○ ○ ○
44
58. Establish a safe and orderly
environment. ○ ○ ○ ○ ○
59. Empower students. ○ ○ ○ ○ ○
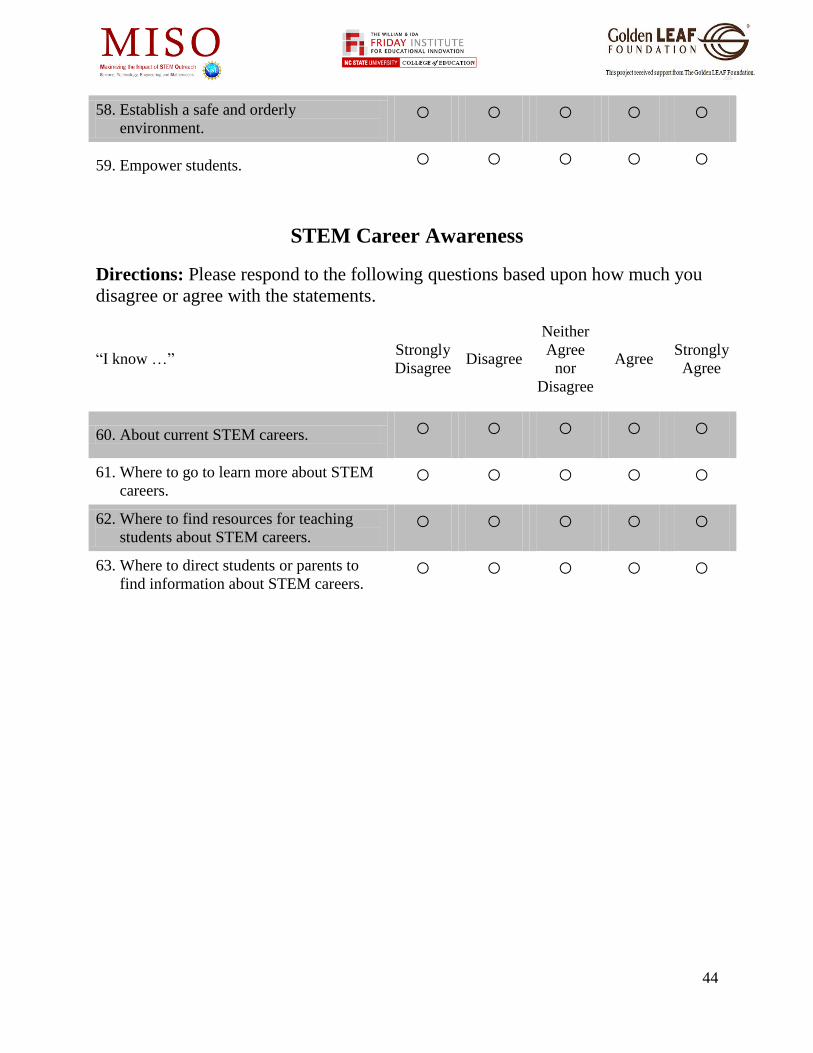
STEM Career Awareness
Directions: Please respond to the following questions based upon how much you
disagree or agree with the statements.
“I know …” Strongly
Disagree Disagree
Neither
Agree
nor
Disagree
Agree Strongly
Agree
60. About current STEM careers. ○ ○ ○ ○ ○
61. Where to go to learn more about STEM
careers. ○ ○ ○ ○ ○
62. Where to find resources for teaching
students about STEM careers. ○ ○ ○ ○ ○
63. Where to direct students or parents to
find information about STEM careers. ○ ○ ○ ○ ○

45
Elementary T-STEM
Teacher Efficacy and Attitudes
Toward STEM Survey (T-STEM)
Elementary Teacher DIRECTIONS:
For each of the following statements, please indicate the degree to which you agree or disagree.
Even though some statements are very similar, please answer each statement. There are no
"right" or "wrong" answers. The only correct responses are those that are true for you. Whenever
possible, let the things that have happened to you help make your choice.
Personal STEM Teaching Efficacy and Beliefs (PSTEBS)9 - Math
Directions: Please respond to these questions regarding your feelings about your
own teaching.
Strongly
Disagree Disagree
Neither
Agree
nor
Disagree
Agree Strongly
Agree
1. I am continually improving my
mathematics teaching practice. ○ ○ ○ ○ ○
2. I know the steps necessary to teach
mathematics effectively. ○ ○ ○ ○ ○
3. I am confident that I can explain to
students why mathematics
experiments work.
○ ○ ○ ○ ○
4. I am confident that I can teach
mathematics effectively. ○ ○ ○ ○ ○
5. I wonder if I have the necessary skills
to teach mathematics. ○ ○ ○ ○ ○
6. I understand mathematics concepts
well enough to be effective in
teaching mathematics.
○ ○ ○ ○ ○
9 This scale was developed from the STEBI (Technology Teaching Efficacy Beliefs Instrument). Enochs, L.G. &
Riggs, I. (1990). Further development of an elementary technology teaching efficacy belief instrument: A preservice
elementary scale. School Technology and Mathematics, 90, 694-706.

46
7. Given a choice, I would invite a
colleague to evaluate my mathematics
teaching.
○ ○ ○ ○ ○
8. I am confident that I can answer
students’ mathematics questions. ○ ○ ○ ○ ○
9. When a student has difficulty
understanding a mathematics concept,
I am confident that I know how to
help the student understand it better.
○ ○ ○ ○ ○
10. When teaching mathematics, I am
confident enough to welcome student
questions.
○ ○ ○ ○ ○
11. I know what to do to increase student
interest in mathematics. ○ ○ ○ ○ ○
STEM Teaching Outcome Expectancy Beliefs (STOES)10
– Math
Directions: Please respond to these questions regarding your feelings about
teaching in general.
Strongly
Disagree Disagree
Neither
Agree
nor
Disagree
Agree Strongly
Agree
12. When a student does better than usual
in mathematics, it is often because the
teacher exerted a little extra effort.
○ ○ ○ ○ ○
13. The inadequacy of a student’s
mathematics background can be
overcome by good teaching.
○ ○ ○ ○ ○
14. When a student’s learning in
mathematics is greater than expected,
it is most often due to their teacher
having found a more effective
teaching approach.
○ ○ ○ ○ ○
15. The teacher is generally responsible
for students’ learning in mathematics. ○ ○ ○ ○ ○
10
This scale was developed from the STEBI (Science Teaching Efficacy Beliefs Instrument). Enochs, L.G. & Riggs,
I. (1990). Further development of an elementary science teaching efficacy belief instrument: A preservice
elementary scale. School Science and Mathematics, 90, 694-706.

47
16. If students’ learning in mathematics is
less than expected, it is most likely
due to ineffective mathematics
teaching.
○ ○ ○ ○ ○
17. Students’ learning in mathematics is
directly realted to their teacher’s
effectiveness in mathematics teaching.
○ ○ ○ ○ ○
18. When a low achieving child
progresses more than expected in
mathematics, it is usually due to extra
attention given by the teacher.
○ ○ ○ ○ ○
19. If parents comment that their child is
showing more interest in mathematics
at school, it is probably due to the
performance of the child’s teacher.
○ ○ ○ ○ ○
20. Minimal student learning in
mathematics can generally be
attributed to their teachers.
○ ○ ○ ○ ○
Personal STEM Teaching Efficacy and Beliefs (PSTEBS) – Science
Directions: Please respond to these questions regarding your feelings about your
own teaching.
Strongly
Disagree Disagree
Neither
Agree
nor
Disagree
Agree Strongly
Agree
21. I am continually improving my
science teaching practice. ○ ○ ○ ○ ○
22. I know the steps necessary to teach
science effectively. ○ ○ ○ ○ ○
23. I am confident that I can explain to
students why science experiments
work.
○ ○ ○ ○ ○
24. I am confident that I can teach science
effectively. ○ ○ ○ ○ ○
25. I wonder if I have the necessary skills
to teach science. ○ ○ ○ ○ ○
26. I understand science concepts well
enough to be effective in teaching
science.
○ ○ ○ ○ ○

48
27. Given a choice, I would invite a
colleague to evaluate my science
teaching.
○ ○ ○ ○ ○
28. I am confident that I can answer
students’ science questions. ○ ○ ○ ○ ○
29. When a student has difficulty
understanding a science concept, I am
confident that I know how to help the
student understand it better.
○ ○ ○ ○ ○
30. When teaching science, I am
confident enough to welcome student
questions.
○ ○ ○ ○ ○
31. I know what to do to increase student
interest in science. ○ ○ ○ ○ ○
STEM Teaching Outcome Expectancy Beliefs (STOES) – Science
Directions: Please respond to these questions regarding your feelings about
teaching in general.
Strongly
Disagree Disagree
Neither
Agree
nor
Disagree
Agree Strongly
Agree
32. When a student does better than usual
in science, it is often because the
teacher exerted a little extra effort.
○ ○ ○ ○ ○
33. The inadequacy of a student’s science
background can be overcome by good
teaching.
○ ○ ○ ○ ○
34. When a student’s learning in science
is greater than expected, it is most
often due to their teacher having
found a more effective teaching
approach.
○ ○ ○ ○ ○
35. The teacher is generally responsible
for students’ learning in science. ○ ○ ○ ○ ○
36. If students’ learning in science is less
than expected, it is most likely due to
ineffective science teaching.
○ ○ ○ ○ ○

49
37. Students’ learning in science is
directly realted to their teacher’s
effectiveness in science teaching.
○ ○ ○ ○ ○
38. When a low achieving child
progresses more than expected in
science, it is usually due to extra
attention given by the teacher.
○ ○ ○ ○ ○
39. If parents comment that their child is
showing more interest in science at
school, it is probably due to the
performance of the child’s teacher.
○ ○ ○ ○ ○
40. Minimal student learning in science
can generally be attributed to their
teachers.
○ ○ ○ ○ ○
Student Technology Use
Directions: Please answer the following questions about how often students use
technology in settings where you instruct students.
During elementary STEM
instructional meetings (e.g.
class periods, after school
activities, days of summer
camp, etc.)
Never Occasionall
y
About
half
the
time
Usually Every
time
Not
Applicable
41. Students use a variety of
technologies, e.g.
productivity, data
visualization, research, and
communication tools.
○ ○ ○ ○ ○ ○
42. Students use technology to
communicate and
collaborate with others,
beyond the classroom.
○ ○ ○ ○ ○ ○
43. Students use technology to
access online resources and
information as a part of
activities.
○ ○ ○ ○ ○ ○
44. Students use the same kinds
of tools that professional
researchers use, e.g.
simulations, databases,
satellite imagery.
○ ○ ○ ○ ○ ○

50
STEM Instruction
Directions: Please answer the following questions about how often students
engage in the following tasks during your instructional time.
During elementary STEM instructional
meetings (e.g. class periods, after
school activities, days of summer
camp, etc.), how often do your students
engage in the following tasks?
Never Occasionally
About
half the
time
Usually Every
time
49. Develop problem-solving skills through
investigations (e.g. scientific, design or
theoretical investigations)
○ ○ ○ ○ ○
50. Work in small groups ○ ○ ○ ○ ○
51. Make predictions that can be tested ○ ○ ○ ○ ○
52. Make careful observations or
measurements ○ ○ ○ ○ ○
53. Use tools to gather data (e.g. calculators,
computers, computer programs, scales,
rulers, compasses, etc.)
○ ○ ○ ○ ○
45. Students work on
technology-enhanced
projects that approach real-
world applications of
technology.
○ ○ ○ ○ ○ ○
46. Students use technology to
help solve problems. ○ ○ ○ ○ ○ ○
47. Students use technology to
support higher-order
thinking, e.g. analysis,
synthesis and evaluation of
ideas and information.
○ ○ ○ ○ ○ ○
48. Students use technology to
create new ideas and
representations of
information.
○ ○ ○ ○ ○ ○

51
54. Recognize patterns in data ○ ○ ○ ○ ○
55. Create reasonable explanations of results
of an experiment or investigation ○ ○ ○ ○ ○
56. Choose the most appropriate methods to
express results (e.g. drawings, models,
charts, graphs, technical language, etc.)
○ ○ ○ ○ ○
57. Complete activities with a real-world
context ○ ○ ○ ○ ○
58. Engage in content-driven dialogue ○ ○ ○ ○ ○
59. Reason abstractly ○ ○ ○ ○ ○
60. Reason quantitatively ○ ○ ○ ○ ○
61. Critique the reasoning of others ○ ○ ○ ○ ○
62. Learn about careers related to the
instructional content ○ ○ ○ ○ ○
21st Century Learning Attitudes
Directions: Please respond to the following questions regarding your feelings
about learning in general.
“I think it is important that students
have learning opportunities to…”
Strongly
Disagree Disagree
Neither
Agree
nor
Disagree
Agree Strongly
Agree
63. Lead others to accomplish a goal. ○ ○ ○ ○ ○
64. Encourage others to do their best. ○ ○ ○ ○ ○
65. Produce high quality work. ○ ○ ○ ○ ○
66. Respect the differences of their peers. ○ ○ ○ ○ ○

52
Teacher Leadership Attitudes
Directions: Please respond to the following questions regarding your feelings
about teacher leadership in general.
“I think it is important that teachers …” Strongly
Disagree Disagree
Neither
Agree
nor
Disagree
Agree Strongly
Agree
74. Take responsibility for all students’
learning. ○ ○ ○ ○ ○
75. Communicate vision to students. ○ ○ ○ ○ ○
76. Use a variety of assessment data
throughout the year to evaluate
progress.
○ ○ ○ ○ ○
77. Use a variety of data to organize, plan
and set goals. ○ ○ ○ ○ ○
78. Establish a safe and orderly
environment. ○ ○ ○ ○ ○
79. Empower students. ○ ○ ○ ○ ○
67. Help their peers. ○ ○ ○ ○ ○
68. Include others’ perspectives when
making decisions. ○ ○ ○ ○ ○
69. Make changes when things do not go as
planned. ○ ○ ○ ○ ○
70. Set their own learning goals. ○ ○ ○ ○ ○
71. Manage their time wisely when working
on their own. ○ ○ ○ ○ ○
72. Choose which assignment out of many
needs to be done first. ○ ○ ○ ○ ○
73. Work well with students from different
backgrounds. ○ ○ ○ ○ ○

53
STEM Career Awareness
Directions: Please respond to the following questions based upon how much you
disagree or agree with the statements.
“I know …” Strongly
Disagree Disagree
Neither
Agree
nor
Disagree
Agree Strongly
Agree
80. About current STEM careers. ○ ○ ○ ○ ○
81. Where to go to learn more about STEM
careers. ○ ○ ○ ○ ○
82. Where to find resources for teaching
students about STEM careers. ○ ○ ○ ○ ○
83. Where to direct students or parents to
find information about STEM careers. ○ ○ ○ ○ ○

54
Appendix E. Upper Elementary School (4-5th) and Middle/High School (6-12th) Student
Attitudes toward STEM (S-STEM) Surveys
Upper Elementary School S-STEM
Student Attitudes toward STEM Survey (S-STEM)
Upper Elementary (4-5th
)
These evaluation instruments were identified, modified, or developed through support provided by the
National Science Foundation and the Golden LEAF Foundation. The Friday Institute grants you permission to use these instruments for educational, non-commercial purposes only. You may use an
instrument as is, or modify it to suit your needs, but in either case you must credit its original source. By using this instrument you agree to allow the Friday Institute to use the data collected for additional validity and reliability analysis. The Friday Institute will take appropriate measures to maintain the confidentiality
of all data. For information about additional permissions, please contact Dr. Jeni Corn, Director of Evaluation Programs at The Friday Institute, at [email protected].
We are asking you to take a survey so we can learn how students feel about math, science, engineering,
and their future.
You get to decide if you want to take the survey. You will not get in trouble if you decide not to take the
survey, but we hope you will. Your answers will help us decide what to teach in schools in the future.
Your responses are confidential, so no one will be able to connect what you said with who you are.
There are no right or wrong answers! How you feel is the best answer.
The survey should take around 15 minutes to complete.
Consent to Participate
“I have read and understand the above information.”
Yes, I agree to take the survey.
No, I will not take the survey.

55
Today’s Date: ________________________
Please select the school district and name of your school:
District Name
School Name
Your Grade:
Kindergarten 3 6 9 11
1 4 7 10 12
2 5 8
Gender:
Boy
Girl
I identify as:
American Indian/Alaska Native
Asian
Black/African American
Native Hawaiian/Other Pacific Islander
White/Caucasian
Hispanic/Latino
Multiracial
Other __________________________

56
DIRECTIONS:
There are lists of statements on the following pages. Please mark your answer sheets by marking
how you feel about each statement. For example:
Example 1: Strongly
Disagree Disagree
Neither
Agree nor
Disagree
Agree Strongly
Agree
I like engineering.
As you read the sentence, you will know whether you agree or disagree. Fill in the circle that describes
how much you agree or disagree.
Even though some statements are very similar, please answer each statement. This is not
timed; work fast, but carefully.
There are no "right" or "wrong" answers! The only correct responses are those that are true for
you. Whenever possible, let the things that have happened to you help you make a choice.
PLEASE FILL IN ONLY ONE ANSWER PER QUESTION.
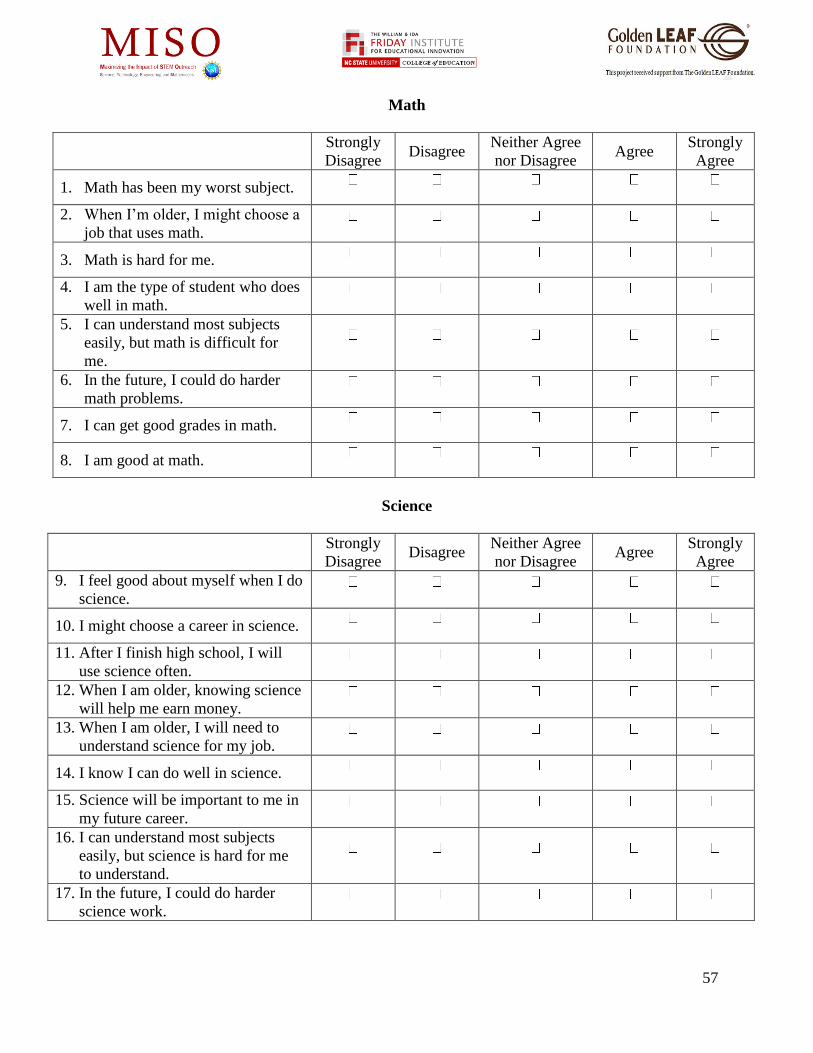
57
Math
Strongly
Disagree Disagree
Neither Agree
nor Disagree Agree
Strongly
Agree
1. Math has been my worst subject.
2. When I’m older, I might choose a
job that uses math.
3. Math is hard for me.
4. I am the type of student who does
well in math.
5. I can understand most subjects
easily, but math is difficult for
me.
6. In the future, I could do harder
math problems.
7. I can get good grades in math.
8. I am good at math.
Science
Strongly
Disagree Disagree
Neither Agree
nor Disagree Agree
Strongly
Agree
9. I feel good about myself when I do
science.
10. I might choose a career in science.
11. After I finish high school, I will
use science often.
12. When I am older, knowing science
will help me earn money.
13. When I am older, I will need to
understand science for my job.
14. I know I can do well in science.
15. Science will be important to me in
my future career.
16. I can understand most subjects
easily, but science is hard for me
to understand.
17. In the future, I could do harder
science work.
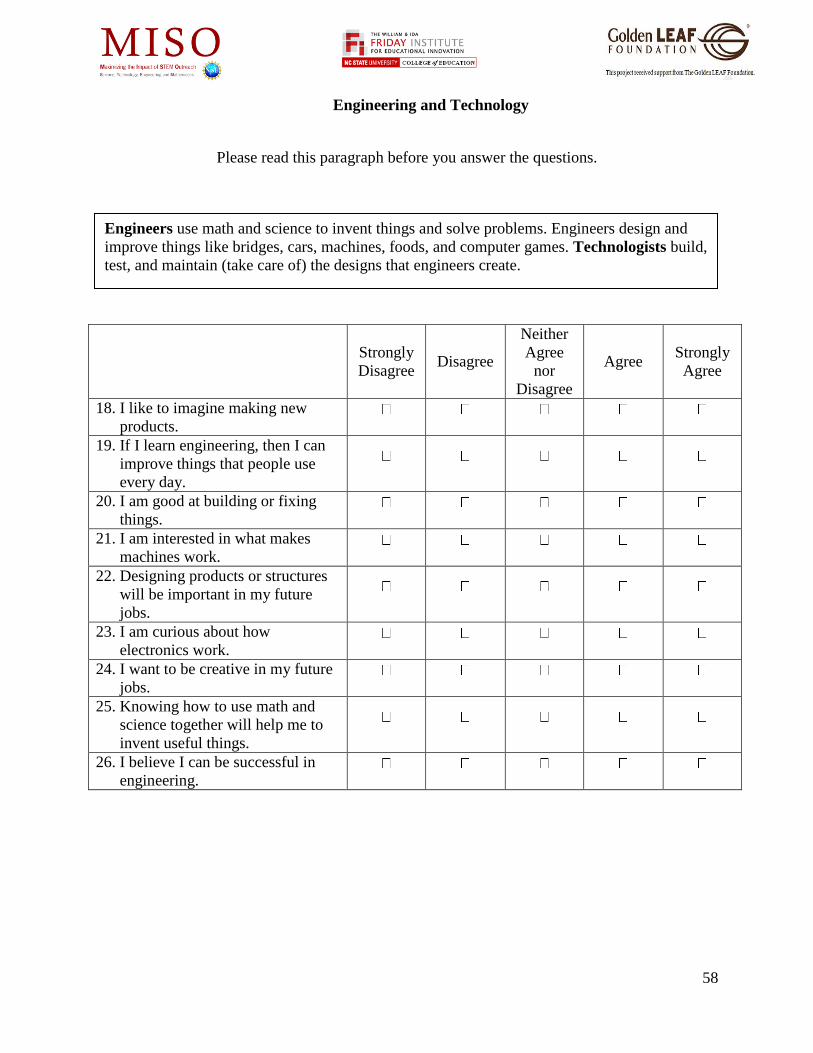
58
Engineering and Technology
Please read this paragraph before you answer the questions.
Strongly
Disagree Disagree
Neither
Agree
nor
Disagree
Agree Strongly
Agree
18. I like to imagine making new
products.
19. If I learn engineering, then I can
improve things that people use
every day.
20. I am good at building or fixing
things.
21. I am interested in what makes
machines work.
22. Designing products or structures
will be important in my future
jobs.
23. I am curious about how
electronics work.
24. I want to be creative in my future
jobs.
25. Knowing how to use math and
science together will help me to
invent useful things.
26. I believe I can be successful in
engineering.
Engineers use math and science to invent things and solve problems. Engineers design and
improve things like bridges, cars, machines, foods, and computer games. Technologists build,
test, and maintain (take care of) the designs that engineers create.

59
21st Century Learning
Strongly
Disagree Disagree
Neither
Agree
nor
Disagree
Agree Strongly
Agree
27. I can lead others to reach a goal.
28. I like to help others do their best.
29. In school and at home, I can do things
well.
30. I respect all children my age even if
they are different from me.
31. I try to help other children my age.
32. When I make decisions, I think about
what is good for other people.
33. When things do not go how I want, I
can change my actions for the better.
34. I can make my own goals for learning.
35. I can use time wisely when working
on my own.
36. When I have a lot of homework, I can
choose what needs to be done first.
37. I can work well with all students, even
if they are different from me.

60
Your Future
Below is a list of types of work that you could do when you are older. As you read about each
type of work, you will know if you think that work is interesting. Fill in the circle under the
words that describe how interested you are in doing that when you are older.
There are no “right” or “wrong” answers. The only correct responses are those that are true for
you.
Not at all
Interested
Not So
Interested Interested
Very
Interested
1. Physics: People study motion, gravity and what
things are made of. They also study energy, like
how a swinging bat can make a baseball switch
directions. They study how different liquids, solids
and gas can be turned into heat or electricity.
2. Environmental Work: People study how nature
works. They study how waste and pollution
affect the environment. They also invent
solutions to these problems.
3. Biology: People work with animals and plants and
how they live. They also study farm animals and the
food that they make, like milk. They can use what
they know to invent products for people to use.
4. Veterinary Work: People who prevent disease
in animals. They give medicines to help
animals get better and for animal and human
safety.
5. Mathematics: People use math and computers to
solve problems. They use it to make decisions in
businesses and government. They use numbers to
understand why different things happen, like why
some people are healthier than others.
6. Medicine: People learn how the human body
works. They decide why someone is sick or hurt
and give medicines to help the person get better.
They teach people about health, and sometimes they
perform surgery.
7. Earth Science: People work with the air, water,
rocks and soil. Some tell us if there is pollution and
how to make the earth safer and cleaner. Other
earth scientists forecast the weather.
8. Computer Science: People write instructions to
run a program that a computer can follow. They
design computer games and other programs. They
also fix and improve computers for other people.

61
Not at all
Interested
Not So
Interested Interested
Very
Interested
9. Medical Science: People study human diseases
and work to find answers to human health
problems.
10. Chemistry: People work with chemicals. They
invent new chemicals and use them to make new
products, like paints, medicine, and plastic.
11. Energy/Electricity: People invent, improve and
maintain ways to make electricity or heat. They also
design the electrical and other power systems in
buildings and machines.
12. Engineering: People use science, math and
computers to build different products (everything
from airplanes to toothbrushes). Engineers make
new products and keep them working.
About Yourself
How well do you expect to do this year in your:
Not Very Well OK/Pretty Well Very Well
English/Language Arts Class?
Math Class?
Science Class?
Yes No Not Sure
Do you plan to go to college?
Do you plan to take advanced math or
science classes in future years in school?
Yes No Not Sure
Do you know any adults who work as engineers?
Do you know any adults who work as scientists?
Do you know any adults who work as mathematicians?
Do you know any adults who work as technologists?

62
Middle/High School S-STEM
Student Attitudes toward STEM Survey (SATSS)
Middle and High School (6-12th
)
Math
Strongly
Disagree Disagree
Neither
Agree
nor
Disagree
Agree Strongly Agree
1. Math has been my worst subject.
2. I would consider choosing a
career that uses math.
3. Math is hard for me.
4. I am the type of student to do well
in math.
5. I can handle most subjects well,
but I cannot do a good job with
math.
6. I am sure I could do advanced
work in math.
7. I can get good grades in math.
8. I am good at math.
Science
Strongly
Disagree Disagree
Neither
Agree
nor
Disagree
Agree
Strongly Agree
9. I am sure of myself when I do
science.
10. I would consider a career in
science.
11. I expect to use science when I get
out of school.
12. Knowing science will help me
earn a living.
13. I will need science for my future
work.
14. I know I can do well in science.

63
15. Science will be important to me in
my life’s work.
16. I can handle most subjects well,
but I cannot do a good job with
science.
17. I am sure I could do advanced
work in science.
Engineering and Technology
Please read this paragraph before you answer the questions.
Strongly
Disagree Disagree
Neither
Agree
nor
Disagree
Agree Strongly
Agree
18. I like to imagine creating new
products.
19. If I learn engineering, then I can
improve things that people use
every day.
20. I am good at building and fixing
things.
21. I am interested in what makes
machines work.
22. Designing products or structures
will be important for my future
work.
23. I am curious about how
electronics work.
24. I would like to use creativity and
innovation in my future work.
25. Knowing how to use math and
science together will allow me to
invent useful things.
Engineers use math, science, and creativity to research and solve problems that improve
everyone’s life and to invent new products. There are many different types of engineering,
such as chemical, electrical, computer, mechanical, civil, environmental, and biomedical.
Engineers design and improve things like bridges, cars, fabrics, foods, and virtual reality
amusement parks. Technologists implement the designs that engineers develop; they build,
test, and maintain products and processes.

64
26. I believe I can be successful in a
career in engineering.
21st Century Learning
Strongly
Disagree Disagree
Neither
Agree
nor
Disagree
Agree Strongly
Agree
27. I am confident I can lead others to
accomplish a goal.
28. I am confident I can encourage others
to do their best.
29. I am confident I can produce high
quality work.
30. I am confident I can respect the
differences of my peers.
31. I am confident I can help my peers.
32. I am confident I can include others’
perspectives when making decisions.
33. I am confident I can make changes
when things do not go as planned.
34. I am confident I can set my own
learning goals.
35. I am confident I can manage my time
wisely when working on my own.
36. When I have many assignments, I can
choose which ones need to be done
first.
37. I am confident I can work well with
students from different backgrounds.

65
Your Future
Here are descriptions of subject areas that involve math, science, engineering and/or technology,
and lists of jobs connected to each subject area. As you read the list below, you will know how
interested you are in the subject and the jobs. Fill in the circle that relates to how interested you
are.
There are no “right” or “wrong” answers. The only correct responses are those that are true for
you.
Not at all
Interested
Not So
Interested Interested
Very
Interested
38. Physics: is the study of basic laws governing
the motion, energy, structure, and interactions
of matter. This can include studying the nature
of the universe. (physicist, lab technician,
astronomer, aviation engineer, alternative
energy technician)
39. Environmental Work: involves learning about
physical and biological processes that govern
nature and working to improve the
environment. This includes finding and
designing solutions to problems like pollution,
reusing waste and recycling. (pollution
control analyst, environmental engineer, or
scientist, erosion control specialist, energy
systems engineer and maintenance
technician)
40. Biology and Zoology: involve the study of
living organisms (such as plants and animals)
and the processes of life. This includes
working with farm animals and in areas like
nutrition and breeding. (biological technician,
biological scientist, plant breeder, crop lab
technician, animal scientist, geneticist,
zoologist)
41. Veterinary Work: involves the science of
preventing or treating disease in animals.
(veterinary assistant, veterinarian, animal
caretaker, livestock producer)
42. Mathematics: is the science of numbers and
their operations. It involves theory,
computation, and algorithms used to solve
problems and summarize data. (mathematician,
statistician, accountant, applied mathematician,
economist, financial analyst, market
researcher, stock market analyst)
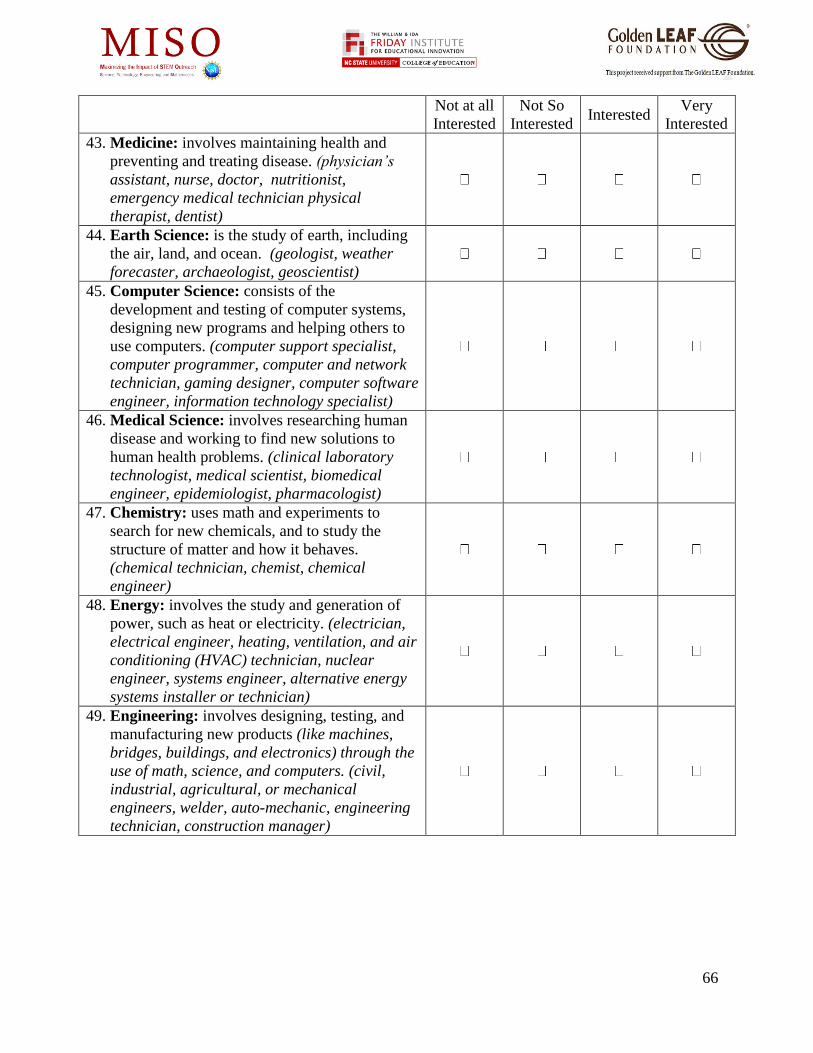
66
Not at all
Interested
Not So
Interested Interested
Very
Interested
43. Medicine: involves maintaining health and
preventing and treating disease. (physician’s
assistant, nurse, doctor, nutritionist,
emergency medical technician physical
therapist, dentist)
44. Earth Science: is the study of earth, including
the air, land, and ocean. (geologist, weather
forecaster, archaeologist, geoscientist)
45. Computer Science: consists of the
development and testing of computer systems,
designing new programs and helping others to
use computers. (computer support specialist,
computer programmer, computer and network
technician, gaming designer, computer software
engineer, information technology specialist)
46. Medical Science: involves researching human
disease and working to find new solutions to
human health problems. (clinical laboratory
technologist, medical scientist, biomedical
engineer, epidemiologist, pharmacologist)
47. Chemistry: uses math and experiments to
search for new chemicals, and to study the
structure of matter and how it behaves.
(chemical technician, chemist, chemical
engineer)
48. Energy: involves the study and generation of
power, such as heat or electricity. (electrician,
electrical engineer, heating, ventilation, and air
conditioning (HVAC) technician, nuclear
engineer, systems engineer, alternative energy
systems installer or technician)
49. Engineering: involves designing, testing, and
manufacturing new products (like machines,
bridges, buildings, and electronics) through the
use of math, science, and computers. (civil,
industrial, agricultural, or mechanical
engineers, welder, auto-mechanic, engineering
technician, construction manager)
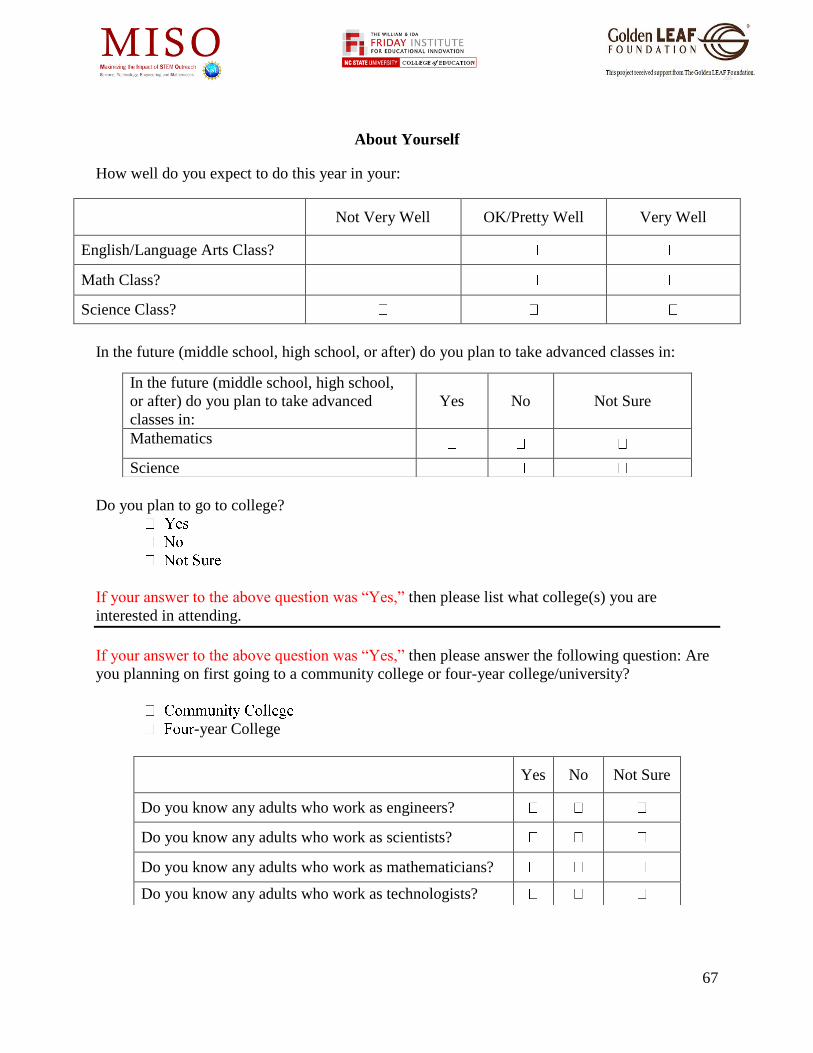
67
About Yourself
How well do you expect to do this year in your:
Not Very Well OK/Pretty Well Very Well
English/Language Arts Class?
Math Class?
Science Class?
In the future (middle school, high school, or after) do you plan to take advanced classes in:
Do you plan to go to college?
If your answer to the above question was “Yes,” then please list what college(s) you are
interested in attending.
If your answer to the above question was “Yes,” then please answer the following question: Are
you planning on first going to a community college or four-year college/university?
-year College
In the future (middle school, high school,
or after) do you plan to take advanced
classes in:
Yes No Not Sure
Mathematics
Science
Yes No Not Sure
Do you know any adults who work as engineers?
Do you know any adults who work as scientists?
Do you know any adults who work as mathematicians?
Do you know any adults who work as technologists?
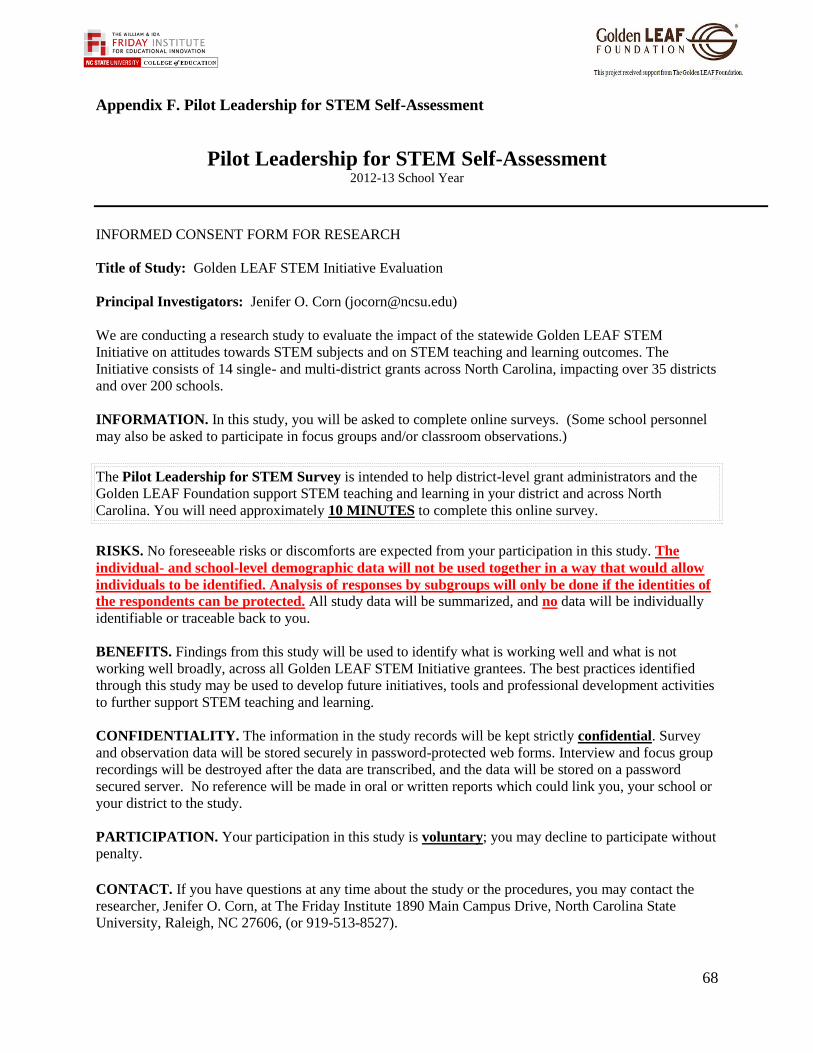
68
Appendix F. Pilot Leadership for STEM Self-Assessment
Pilot Leadership for STEM Self-Assessment 2012-13 School Year
INFORMED CONSENT FORM FOR RESEARCH
Title of Study: Golden LEAF STEM Initiative Evaluation
Principal Investigators: Jenifer O. Corn ([email protected])
We are conducting a research study to evaluate the impact of the statewide Golden LEAF STEM
Initiative on attitudes towards STEM subjects and on STEM teaching and learning outcomes. The
Initiative consists of 14 single- and multi-district grants across North Carolina, impacting over 35 districts
and over 200 schools.
INFORMATION. In this study, you will be asked to complete online surveys. (Some school personnel
may also be asked to participate in focus groups and/or classroom observations.)
The Pilot Leadership for STEM Survey is intended to help district-level grant administrators and the
Golden LEAF Foundation support STEM teaching and learning in your district and across North
Carolina. You will need approximately 10 MINUTES to complete this online survey.
RISKS. No foreseeable risks or discomforts are expected from your participation in this study. The
individual- and school-level demographic data will not be used together in a way that would allow
individuals to be identified. Analysis of responses by subgroups will only be done if the identities of
the respondents can be protected. All study data will be summarized, and no data will be individually
identifiable or traceable back to you.
BENEFITS. Findings from this study will be used to identify what is working well and what is not
working well broadly, across all Golden LEAF STEM Initiative grantees. The best practices identified
through this study may be used to develop future initiatives, tools and professional development activities
to further support STEM teaching and learning.
CONFIDENTIALITY. The information in the study records will be kept strictly confidential. Survey
and observation data will be stored securely in password-protected web forms. Interview and focus group
recordings will be destroyed after the data are transcribed, and the data will be stored on a password
secured server. No reference will be made in oral or written reports which could link you, your school or
your district to the study.
PARTICIPATION. Your participation in this study is voluntary; you may decline to participate without
penalty.
CONTACT. If you have questions at any time about the study or the procedures, you may contact the
researcher, Jenifer O. Corn, at The Friday Institute 1890 Main Campus Drive, North Carolina State
University, Raleigh, NC 27606, (or 919-513-8527).

69
1. Please select the name for your school district.
(District Name)
2. My school is a/an:
□ Elementary School
□ Middle School
□ High School
□ Other (please specify grade-levels served):
3. The size of the student body at my school is approximately:
□ 100 - 300
□ 400 - 600
□ 700 - 900
□ 1,000 – 1,500
□ 1,500 or more
4. The proportion of students at my school who receive free or reduced price lunch (FRL) is
approximately:
□ 0-25%
□ 26-50%
□ 51-75%
□ 76 – 100%
5. My role is:
□ Principal
□ Assistant Principal
□ Classroom Teacher
□ Other (please specify): _________________________________

70
6. Years of experience in your current role (including this year), in any district:
7. Total years of experience in school administration:
0
8. Total years of experience as a classroom teacher:
9. What is your highest level of education completed relevant to education?
□ Bachelor’s Degree
□ Bachelor’s Degree plus credits
□ Certificate of Advanced Study
□ Master’s Degree
□ Master’s Degree plus credits
□ Doctoral Degree
□ Other (please specify): ___________________________________

DIRECTIONS: Please indicate your level of agreement with the following
statements.
Regarding the Golden LEAF STEM project/work at my school, I …
Str
on
gly
Dis
ag
ree
Dis
ag
ree
Nei
ther
Ag
ree
no
r
Dis
ag
ree
Ag
ree
Str
on
gly
Ag
ree
Believe in the STEM project.
Have articulated a vision for the STEM project.
Have established clear objectives for the participants to meet.
Communicate how the STEM project supports the larger strategic plan for
the school.
Model effective STEM teaching and learning.
Model effective use of technology.
Encourage innovation among faculty, students and others.
Promote an inclusive culture of trust that honors creativity.
Promote the legal and ethical use of technology and other STEM resources
(e.g., respect for copyrights, intellectual property).
Make sure teachers have access to resources that facilitate STEM teaching
and learning (e.g. lab facilities, lab supplies and equipment, project rooms,
exhibition spaces).
Ensure technical support is available regarding physical resources.
Make sure teachers have access to technology tools that facilitate their work
(e.g., SmartBoards, virtual applications, classroom management software).
Work to ensure an appropriate computer network infrastructure is
maintained (e.g. wireless connection, IT support, server space, extra laptops,
power strips).
Design policies for the appropriate use of STEM equipment and technology
tools.
Support professional development by providing resources such as
substitutes, release time, etc.
Support the specific professional development needs of STEM teachers
(e.g. real-world experiences or externships).
Participate in administrative professional development.
Share information about STEM research and best practices with faculty.
Encourage teachers to incorporate project-based learning with integrated
content.
Understand that incorporating project-based learning may take more time
for some people.
Evaluate the effectiveness of professional development.
Make others feel comfortable in expressing their concerns or opinions
about the STEM project.
Make others feel comfortable in expressing their new suggestions for the
STEM project.

High School
PILOT VERSION
72
Include teachers in decisions about project policies on student use of
technology.
Include teachers in decisions about measuring STUDENT success in
STEM.
Include teachers in decisions about measuring TEACHER success in
STEM.
Trust teachers to make sound decisions about STEM instruction.
Request feedback from teachers about the STEM project.
Provide time to solve problems as a team.
Set ambitious, yet realistic (i.e., not too high, and not too low) goals.
Secure funding for the STEM project.
Take steps to ensure the sustainability of the STEM project.
Advocate for policies that support the STEM project at the district level.
Participate in a STEM network in which I communicate with peer
programs.
Leverage strategic partnerships to support the STEM project, such as
institutes of higher education and businesses.
Support a learning environment that uses multiple indicators of student
success (e.g. performance-based, project-based and portfolio assessments).
Use multiple sources of data for evaluating the impact of the STEM project
on student outcomes.
Use clearly defined criteria for assessing STEM teaching.
Communicate clearly how teacher performance will be assessed.
Provide constructive feedback to teachers.
Do you have any suggestions for how we can improve this survey?
_____________________________________________________________________________
Thank you for completing our survey!

High School
PILOT VERSION
Appendix G. The High School Golden LEAF STEM Implementation Rubric
Golden LEAF STEM Initiative Evaluation
Pilot STEM Program Implementation Rubric HIGH SCHOOL
2012-13 School Year
______________________________________________________________________
INFORMED CONSENT FORM FOR RESEARCH
Title of Study: Golden LEAF STEM Initiative Evaluation
Principal Investigators: Jenifer O. Corn ([email protected])
We are conducting a research study to evaluate the impact of the statewide Golden LEAF STEM Initiative on
attitudes towards STEM subjects and on STEM teaching and learning outcomes. The Initiative consists of 14
single- and multi-district grants across North Carolina, impacting over 35 districts and over 200 schools.
INFORMATION. In this study, you will be asked to complete online surveys. (Some school personnel may
also be asked to participate in focus groups, interviews, and/or classroom observations.)
Information gathered from the STEM Program Implementation Rubric is intended to help grant
administrators, the Golden LEAF Foundation, and others support STEM teaching and learning in your district
and across North Carolina. You will need approximately 40 minutes to complete this online survey.
RISKS. No foreseeable risks or discomforts are expected from your participation in this study. The individual-
and school-level demographic data will not be used together in a way that would allow individuals to be
identified. Analysis of responses by subgroups will only be done if the identities of the respondents can be
protected. All study data will be summarized, and no data will be individually identifiable or traceable back to
you.
BENEFITS. Findings from this study will be used to identify what is working well and what is not working
well broadly, across all Golden LEAF STEM Initiative grantees and schools. The best practices identified
through this study may be used to develop future initiatives, tools and professional development activities to
further support STEM teaching and learning.
CONFIDENTIALITY. The information in the study records will be kept strictly confidential. Survey, rubric
and observation data will be stored securely in password-protected web forms. Interview and focus group
recordings will be destroyed after the data are transcribed, and the data will be stored on a password secured
server. No reference will be made in oral or written reports which could link you, your school or your district to
the study.
PARTICIPATION. Your participation in this study is voluntary; you may decline to participate without
penalty.
CONTACT. If you have questions at any time about the study or the procedures, you may contact the
researcher, Jenifer O. Corn, at The Friday Institute 1890 Main Campus Drive, North Carolina State University,
Raleigh, NC 27606, (or 919-513-8527).

High School
PILOT VERSION
74
1. Please select the name for your school district.
(District Name)
2. My school is a/an:
□ Elementary School
□ Middle School
□ High School
□ Other (please specify grade-levels served):
3. The size of the student body at my school is approximately:
□ 0 - 300
□ 300 - 600
□ 600 – 1,000
□ 1,000 – 1,500
□ 1,500 or more
4. The proportion of students at my school who receive free or reduced price lunch (FRL) is approximately:
□ 0-25%
□ 26-50%
□ 51-75%
□ 76 – 100%
5. My role is:
□ Principal
□ Assistant Principal
□ Classroom Teacher
□ Other (please specify): _________________________________
6. Years of experience in your current role (including this year), in any district:

High School
PILOT VERSION
75
7. Total years of experience in school administration:
8. Total years of experience as a classroom teacher:
9. What is your highest level of education completed relevant to education?
□ Bachelor’s Degree
□ Bachelor’s Degree plus credits
□ Certificate of Advanced Study
□ Master’s Degree
□ Master’s Degree plus credits
□ Doctoral Degree
□ Other (please specify): ___________________________________
This should be completed in one sitting. You may use the back button at the bottom of each
page to navigate within the rubric. DO NOT use the back button in your browser - you will end your session and lose all entered data.
There are no right/wrong answers. This rubric is a self-assessment regarding your school, and all
data collected will remain confidential.
The rubric is organized around North Carolina Department of Public Instruction's 11 Attributes of a High School STEM School or Program.
At the end of the survey you will be sent to a page with a report of what you have entered, and you can save this report as a PDF to use for further reflection at your school.
Thank you in advance for your time.

76
North Carolina Department of Public Instruction’s Attributes of STEM School or Program
North Carolina Department of Public Instruction’s
STEM Attributes
Early
Developing
Prepared
Model
Integrated Science, Technology, Engineering and Mathematics (STEM) curriculum, aligned with state, national, international and industry standards
1) Project-based learning with integrated content across STEM subjects
2) Connections to effective in- and out-of-school STEM programs
3) Integration of technology and virtual learning
4) Authentic assessment and exhibition of STEM skills
5) Professional development on integrated STEM curriculum, community/industry partnerships and postsecondary education connections
6) Outreach, support and focus on underserved, especially females, minorities, and economically disadvantaged
On-going community and industry engagement
7) A communicated STEM plan is adopted across education, communities and businesses
8) STEM work-based learning experiences, to increase interest and abilities in fields requiring STEM skills, for each student and teacher
9) Business and community partnerships for mentorship, internship and other STEM opportunities that extend the classroom walls
Connections with postsecondary education
10) Alignment of student’s career pathway with postsecondary STEM program(s)
11) Credit completion at community colleges, colleges and/or universities*
* Applies only to high schools.

77
DIRECTIONS:
For each row in the rubric, mark which column description (Early - Model) best describes your school and in the space provided on the right briefly list the main activities being done at your school for that item. Some work being done at your school may apply to more than one row, so it is okay to list an activity more than once on this page or any other page in the rubric.

78
11
Project-based learning (PBL) activities have students working in small collaborative groups to go through a process of inquiry and produce high-quality products/presentations;
activities can mirror the real work of professionals and move beyond classroom in purpose or audience
(1) Curriculum: Project-based learning (PBL) with integrated content across STEM subjects
KE
Y
EL
EM
EN
T
Early Developing Prepared
Model Description of Your School/ Program
1.1
Fre
qu
en
cy
of
PB
L
Project-based learning11
is used rarely in all subject areas
Project-based learning1 is used
monthly in all subject areas
Project-based learning1 is
infused throughout all subject areas, which includes all 4
STEM content areas as well as additional subjects
Project-based learning1 is used as an
interdisciplinary teaching strategy in all subject areas, which includes all 4 STEM
content areas as well as additional subjects
1.2
Fre
qu
en
cy
of
ST
EM
Inte
gra
tio
n Up to 25% of teachers make
explicit efforts to integrate science, technology,
engineering and math, requiring students to organize knowledge across disciplines
25-50% of teachers make explicit efforts to integrate science,
technology, engineering and math, requiring students to organize knowledge across
disciplines
50-75% of teachers make explicit efforts to integrate
science, technology, engineering and math,
requiring students to organize knowledge across disciplines
Over 75% of teachers make explicit efforts to integrate science, technology,
engineering and math, requiring students to organize knowledge across
disciplines
1.3
Co
lla
bo
rati
ve
PL
Cs
Biannually, STEM teachers share STEM activities or ideas
and plan learning outcomes through professional learning
community meetings and common planning time
Quarterly, STEM teachers share STEM activities or ideas and plan
learning outcomes through professional learning community meetings and common planning
time
Monthly, STEM teachers share STEM activities or ideas and plan learning
outcomes through professional learning
community meetings and common planning time
Weekly, STEM teachers share or co-create STEM activities or ideas and plan learning outcomes through professional
learning community meetings and common planning time
1.4
Ph
ysic
al
Sp
ace
On special occasions computer labs or classrooms transformed into collaborative spaces and project work areas for face-to-
face and/or virtual collaboration among students and teachers
Computer labs or classrooms are occasionally transformed into
collaborative spaces and project work areas for face-to-face and/or virtual collaboration
among students and teachers
Computer labs or classrooms are frequently transformed
into collaborative spaces and project work areas for face-to-face and virtual collaboration
among students and teachers, or to be used as
exhibition spaces
One or more facilities or spaces are available specifically for students to use for collaboration and as a project work area; the spaces can be used for face-to-face and virtual collaboration among students and teachers; they can also be
used as exhibition space

79
12
For example, field trips, clubs, competitions, study trips, internships, and summer/afterschool/weekend programs taught by STEM teachers and/or industry professionals
(2) Curriculum: Connections to effective in- and out-of-school programs
KE
Y
EL
EM
EN
T
Early Developing Prepared
Model
Description of Your School/
Program
2.1
ST
EM
Ne
two
rk
Program is seeking to establish partnerships with other schools,
communities, postsecondary institutions, and businesses to identify solutions for building a
quality STEM program
Program engages with other schools, communities,
postsecondary institutions, and businesses to identify solutions for executing a quality STEM program
Program has documented partnerships with other schools, communities,
postsecondary institutions, and businesses to identify solutions for executing a quality STEM program
Program has multiple partnerships with other schools, communities,
postsecondary institutions, and businesses to identify solutions for executing a quality STEM program;
partnerships are purposeful, mutually beneficial,
monitored, and evaluated
2.2
Stu
de
nts
an
d
ST
EM
Pro
fes
sio
na
ls
Leaders are creating plans to provide opportunities for students to meet STEM
professionals and to participate in STEM learning environments
outside school12
Direct experiences with STEM professionals and STEM learning
environments during and/or outside school
2 are available to students 2
times throughout the year
Direct experiences with STEM professionals and
STEM learning environments during and/or outside school
2
are available to students monthly, and are directly
connected to in-class learning
Direct experiences with STEM professionals and
STEM learning environments during and/or
outside school2 are
available to students weekly, and are directly connected to in-class
learning
2.3
Rese
arc
h
&
Dev
elo
pm
en
t On an annual basis, program leaders and participating STEM teachers share with each other
research and information on best practices related to their STEM
program goals
On a biannual basis, program leaders and participating STEM teachers share with each other
research and information on best practices related to their STEM
program goals
On a quarterly basis, program leaders and
participating STEM teachers frequently share with each
other research and best practices related to their
STEM program goals
On a monthly basis, program leaders and
participating STEM teachers regularly share with each other research and best practices related to their
STEM program goals
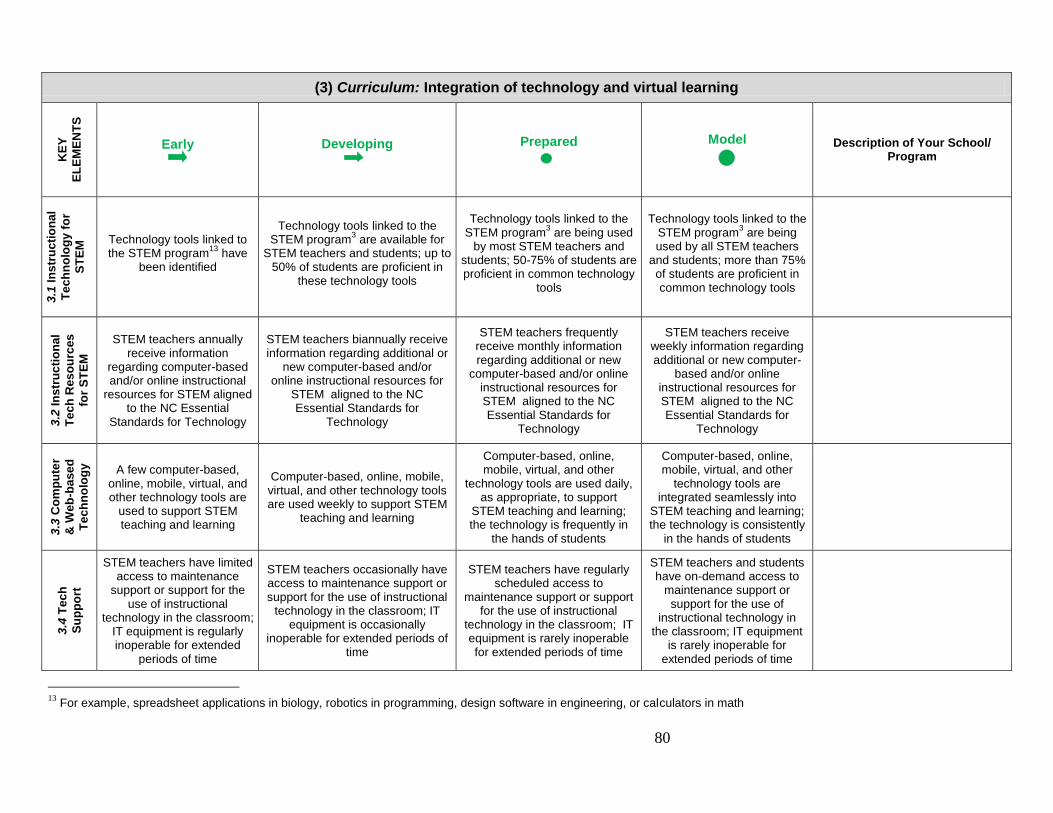
80
13
For example, spreadsheet applications in biology, robotics in programming, design software in engineering, or calculators in math
(3) Curriculum: Integration of technology and virtual learning
KE
Y
EL
EM
EN
TS
Early Developing Prepared
Model
Description of Your School/
Program
3.1
In
str
uc
tio
na
l
Te
ch
no
log
y f
or
ST
EM
Technology tools linked to the STEM program
13 have
been identified
Technology tools linked to the STEM program
3 are available for
STEM teachers and students; up to 50% of students are proficient in
these technology tools
Technology tools linked to the STEM program
3 are being used
by most STEM teachers and students; 50-75% of students are proficient in common technology
tools
Technology tools linked to the STEM program
3 are being
used by all STEM teachers and students; more than 75% of students are proficient in common technology tools
3.2
In
str
uc
tio
na
l
Te
ch
Res
ou
rces
for
ST
EM
STEM teachers annually receive information
regarding computer-based and/or online instructional
resources for STEM aligned to the NC Essential
Standards for Technology
STEM teachers biannually receive information regarding additional or
new computer-based and/or online instructional resources for
STEM aligned to the NC Essential Standards for
Technology
STEM teachers frequently receive monthly information regarding additional or new
computer-based and/or online instructional resources for STEM aligned to the NC Essential Standards for
Technology
STEM teachers receive weekly information regarding additional or new computer-
based and/or online instructional resources for STEM aligned to the NC Essential Standards for
Technology
3.3
Co
mp
ute
r
& W
eb
-ba
se
d
Te
ch
no
log
y
A few computer-based, online, mobile, virtual, and other technology tools are
used to support STEM teaching and learning
Computer-based, online, mobile, virtual, and other technology tools are used weekly to support STEM
teaching and learning
Computer-based, online, mobile, virtual, and other
technology tools are used daily, as appropriate, to support
STEM teaching and learning; the technology is frequently in
the hands of students
Computer-based, online, mobile, virtual, and other
technology tools are integrated seamlessly into
STEM teaching and learning; the technology is consistently
in the hands of students
3.4
Tec
h
Su
pp
ort
STEM teachers have limited access to maintenance
support or support for the use of instructional
technology in the classroom; IT equipment is regularly inoperable for extended
periods of time
STEM teachers occasionally have access to maintenance support or support for the use of instructional
technology in the classroom; IT equipment is occasionally
inoperable for extended periods of time
STEM teachers have regularly scheduled access to
maintenance support or support for the use of instructional
technology in the classroom; IT equipment is rarely inoperable for extended periods of time
STEM teachers and students have on-demand access to
maintenance support or support for the use of
instructional technology in the classroom; IT equipment
is rarely inoperable for extended periods of time

81
14
For example, formative, benchmark, or summative assessments which measure students’ knowledge and skills
(4) Curriculum: Authentic assessments and exhibition of STEM skills
KE
Y
EL
EM
EN
TS
Early Developing Prepared
Model
Description of Your School/ Program
4.1
Au
then
tic
Ass
es
sm
en
ts STEM teachers are encouraged
and supported to use multiple indicators of student success,
including knowledge- and performance-based assessments
(projects, portfolios)
As many as 50% of STEM teachers use multiple
indicators of student success, including knowledge- and
performance-based assessments (projects,
portfolios)
50-75% of STEM teachers use multiple indicators of student
success, including knowledge- and performance-based
assessments (projects, portfolios)
All STEM teachers and students are immersed in a student-centered
learning environment that supports the use of multiple indicators of
success, including knowledge- and performance-based assessments
(projects, portfolios)
4.2
Tea
ch
ers
Co
lla
bo
rati
ve
ly
Dev
elo
p
Ass
es
sm
en
ts
Once a year STEM teachers share assessment strategies
14
Twice a year STEM teachers share assessment
strategies4; they occasionally
co-create assessments and rubrics and examine and reflect on student work
STEM teachers collaborate quarterly to reflect on student work, to discuss strategies for
using results to inform instruction, and to co-create various measures of student
success4
STEM teachers collaborate at least monthly to reflect on student work,
to discuss strategies for using results to inform instruction, and to
co-create various measures of student success
4
4.3
Cele
bra
te
ST
EM
Wo
rk
Students, teachers and administrators annually celebrate high-quality student work in STEM
Students, teachers and administrators celebrate high-quality student work in STEM
with biannual on-site and online exhibits
Students, teachers and administrators celebrate high-quality student work in STEM
with quarterly on-site and online exhibits
Students, teachers and administrators celebrate high-quality student work in STEM through on-
going student exhibits on-site, online and/or in state and national forums
4.4
Cu
ltu
re
of
Inn
ov
ati
on
Program leadership yearly honors and encourages innovation in
STEM among students
Program leadership biannually honors and
encourages innovation in STEM among students
Program leadership and program participants quarterly honor and encourage innovation in STEM
among students
Program culture consistently honors, encourages and incentivizes
innovation in STEM among students

82
15
For example, curriculum alignment, action research, evaluating student work using protocols, coaching, lesson study, or problem-solving 16
For example, high-performing, low-performing, English as Second Language, Exceptional Children, etc.
(5) Curriculum: Professional development on integrated STEM curriculum, community/industry partnerships and connections with postsecondary education
KE
Y
EL
EM
EN
TS
Early Developing Prepared Model
Description of Your School/
Program
5.1
Ind
ivid
ua
lize
d P
D
STEM teachers participate in large group professional development sessions to
acquire basic STEM teaching skills
STEM teachers participate in large group professional development
sessions focusing on STEM teaching skills - strategies for inquiry-based
teaching and learning and for integrating STEM
STEM teachers have unique professional development goals
and tailor as much as 25% of their professional development activities
to meet their individual needs
STEM teachers have unique professional development goals
and tailor 50% of their professional development activities to meet their
individual needs
5.2
Jo
b-
em
be
dd
e
d P
D
A job-embedded or practice-based approach to
professional development15
for STEM teachers is used
twice during the school year
A job-embedded or practice-based approach to professional
development5 for STEM teachers is
used quarterly during the school year
A job-embedded or practice-based approach to professional
development5 for STEM teachers
is used monthly during the school year
A job embedded or practice-based approach to professional
development5 for STEM teachers
is used multiple times a month
5.3
Sp
ec
ific
to T
ea
ch
ers
& S
tud
en
ts
Professional development resources for STEM teachers
focus on standardized, scripted teaching strategies
On an annual basis professional development resources for STEM teachers focus on strategies for
teaching specific content to specific types of learners
16
On a quarterly basis professional development resources for STEM teachers focus on strategies for
teaching specific content to specific types of learners
6
Professional development resources for STEM teachers that focus on strategies for teaching specific content to specific types of learners
6 are always available
5.4
Fre
qu
en
cy
of
PD
STEM teachers participate in 10-20 hours per year of
STEM-related professional development which
addresses integrated content, community/industry
partnerships, connections with postsecondary
education, pedagogy, or digital learning
STEM teachers participate in 20-25 hours per year of STEM-related professional development which
addresses integrated content, community/industry partnerships, connections with postsecondary education, pedagogy, or digital
learning
STEM teachers participate in 25-30 hours per year of STEM-
related professional development which addresses integrated content, community/industry
partnerships, connections with postsecondary education,
pedagogy, or digital learning
STEM teachers participate in 30 or more hours per year of STEM-related professional development
which addresses integrated content, community/industry
partnerships, connections with postsecondary education,
pedagogy, or digital learning

83
17
In North Carolina and nationally groups of students underrepresented in advanced STEM work include female students, students of color, and students from low socio-economic
backgrounds
(6) Curriculum: Outreach, support and focus on underserved students, especially females, minorities and economically disadvantaged students
KE
Y
EL
EM
EN
TS
Early Developing Prepared
Model
Description of Your School/
Program
6.1
Cu
ltu
re o
f
Inq
uir
y
A few program leaders have articulated what a culture of inquiry and creativity looks
like, emphasizing the inclusion of all students in the
program and culture
A core group of program participants maintain a culture of inquiry and creativity and
emphasize the inclusion of all students in the program and
culture
A culture of inquiry and creativity exists throughout a majority of participants in the program and emphasizes the inclusion of all students in the program and
culture
A culture of inquiry and creativity exists between and among participating students, teachers and administrators
and emphasizes the inclusion of all students in the program
and culture
6.2
Rec
og
niz
e
Un
de
r-re
pre
se
nte
d
Stu
de
nts
1 guideline and/or practice focuses on increasing long-
term participation in the STEM education pipeline by
students from underrepresented groups
17
2 guidelines and/or practices focus on increasing long-term
participation in the STEM education pipeline by students
from underrepresented groups
7
Several guidelines and/or practices focus on increasing long-term participation in the STEM education pipeline by
students from underrepresented groups
7
Numerous guidelines and/or practices focus on increasing long-term participation in the STEM education pipeline by
students from underrepresented groups
7

84
18
A school- or district-level STEM plan which already exists may be substituted; for Prepared and Model levels, a STEM Leadership Team must still exist as well 19
A fully-formed STEM leadership Team is at the school-level, and includes at least 1 or more representatives of the following groups: students, teachers, administrators, community
college staff, college or university staff, business persons (at least one person for each career pathway represented in STEM school or program), community leaders, and parents; team includes more out-of-school partners than in-school 20
This includes student achievement in STEM career pathways/clusters
(7) Community: A communicated STEM plan is adopted across education, communities and businesses
KE
Y
EL
E-
ME
NT
S
Early Developing Prepared
Model
Descrip-tion of Your
School/ Program
7.1
ST
EM
Pro
gra
m P
lan
Program leaders create a basic STEM program
plan18
in which 1-4 STEM Attributes are evident
Program leaders creates a detailed STEM program plan
8
grounded in research and in which 5-10 STEM Attributes
are evident
At least 50% or more of a STEM Leadership Team”
19 is formed and creates a detailed
STEM program plan8 that is grounded in
research, aligned with school and/or school-system strategic plans, focused on student achievement in the STEM pipeline
20, and
demonstrates evidence of 11 STEM Attributes
A fully-formed STEM Leadership Team9 leads
stakeholders in a collaborative decision-making process to create a STEM program plan
8 that is
grounded in research, aligned with school and/or school-system strategic plans, focused on student
achievement in the STEM pipeline10
, and demonstrates evidence of 11 STEM Attributes
7.2
Co
mm
un
ica
te
ST
EM
Pro
gra
m P
lan
Program leaders’ communication of the STEM program plan
garners minimal participation and buy-in
from STEM teachers and key stakeholders
Program leaders’ annual communication of the STEM
program plan develops some participation and buy-in from STEM teachers and
key stakeholders
Program leaders’ biannual communication of the STEM program plan secures
participation and buy-in from STEM teachers and key stakeholders and bolsters the
sustainability of the initiative
Program leaders’ quarterly communication of the STEM program plan secures participation and
buy-in from STEM teachers and key stakeholders and bolsters the sustainability of the initiative
7.3
Pro
gra
m
Data
A variety of student data on STEM performance (from
test scores to work samples) is available
annually to administrators and teachers, and is used to inform instructional and programmatic decisions
A variety of student data on STEM performance (from
test scores to work samples) is available biannually to
administrators and teachers, and is used to inform
instructional and programmatic decisions
A variety of student data on STEM performance (from test scores to work
samples) is available quarterly to administrators and teachers, and is used to
inform instructional and programmatic decisions and to support continuous
improvement throughout the year
A variety of student data on STEM performance (from test scores to work samples) is available monthly to administrators and teachers, and is
regularly used to inform instructional and programmatic decisions and to support
continuous improvement throughout the year
7.4
Res
ou
rce
Allo
ca
tio
n
Limited discretionary funds are allocated for
implementation of STEM strategies
Discretionary funds and other resources are allocated to advance
implementation of some STEM strategies outlined in
the program plan
Discretionary funds and other resources are allocated to advance implementation of most
of the STEM strategies outlined in the program plan and a sustainability plan is in
place
Discretionary funds and other resources are allocated to advance implementation of all the
STEM strategies outlined in the program plan and a sustainability plan is in place

85
21
For example, study trips, fellowships, externships, etc.; durations of experiences could vary from 1 day to 1 year 22
A work experience may include apprenticeships, internships, competitions, service-learning, or other opportunities; durations of experiences could vary from 1 day to 1 year
(8) Community: STEM work-based learning experiences to increase interest and abilities in fields requiring STEM skills for each student and teacher
KE
Y
EL
EM
EN
TS
Early Developing Prepared
Model
Description of Your School/
Program
8.1
Lea
rnin
g
Co
nn
ec
ted
to I
nd
us
trie
s Program leaders are
researching and planning in-school learning opportunities for
students that are directly connected to current work in
STEM-related industries
1-2 in-school learning opportunities for students are directly connected to current
work in STEM-related industries
Several in-school learning opportunities for students are
directly connected to current work in STEM-related industries
In-school learning opportunities are frequently, directly connected to current work in STEM-related
industries
8.2
Stu
de
nts
Wo
rk
in T
eam
s Students rarely learn in teams
to frame problems and test solutions that incorporate
STEM content and/or apply STEM skills
Students occasionally learn in teams to frame problems and test solutions that incorporate STEM content and/or apply
STEM skills, with clearly defined individual and team
expectations
Students weekly learn in teams to frame STEM-related problems
and test solutions that incorporate STEM content and/or apply STEM
skills, with clearly defined individual and team expectations
Students regularly learn in teams to frame problems and test
solutions that incorporate STEM content and/or apply STEM skills, with clearly defined
individual and team expectations
8.3
Ap
plie
d
Le
arn
ing
fo
r
ST
EM
Te
ac
he
rs Very few STEM teachers
participate in customized, applied learning experiences
21
to increase their STEM content or career knowledge
As many as 50% of STEM teachers participate every-
other-year in at least 1 customized, applied learning experience
11 to increase their
STEM content or career knowledge
As much as 75% of STEM teachers participate every-other-year in at least one customized, applied learning experience
11 to
increase their STEM content or career knowledge
All STEM teachers participate annually in at least one
customized, applied learning experience
11 to increase their
STEM content or career knowledge
8.4
Stu
de
nts
Inte
rac
t w
ith
ST
EM
Ind
us
trie
s Students rarely have a work
experience22
with an external STEM industry partner either during or outside of the school
day
At least 50% of participating students have a work
experience12
with an external STEM industry partner either
during or outside of the school day
At least 75% of participating students have a work
experience12
with an external STEM industry partner either
during or outside of the school day
Over 75% of participating students have a work
experience12
with an external STEM industry partner either
during or outside of the school day
(8) Community: STEM work-based learning experiences to increase interest and abilities in fields requiring STEM skills for each student

86
(9) Community: Business and community partnerships for mentorships, internships, and other opportunities extend the classroom walls
KE
Y
EL
EM
EN
TS
Early Developing Prepared
Model
Description of Your School/
Program
9.1
Co
lla
bo
rati
on
in
Netw
ork
of
Sc
ho
ols
Program leadership participates annually in a network of schools that
addresses STEM education issues
Program leadership participates biannually in a network of schools that addresses STEM education
issues
Program leadership collaborates quarterly on
STEM education issues with other schools in an exchange of resources and the sharing of best practices and lessons
learned
Program leadership collaborates more than
quarterly on STEM education issues with other schools in an exchange of resources and the sharing of best practices and
lessons learned
9.2
Co
mm
un
ica
tio
n
To
ols
One-way communication tools, such as websites and
newsletters, and/or two-way tools, like social media
platforms, webinars, and meetings, are used biannually to communicate internally and
externally about STEM program activities
One-way communication tools, such as websites and newsletters,
and/or two-way tools, like social media platforms, webinars, and meetings, are used quarterly to
communicate internally and externally about STEM program
activities
One-way communication tools, such as websites and newsletters, and/or two-way
tools, like social media platforms, webinars, and
meetings, are used monthly to communicate internally and
externally about STEM program activities
One-way communication tools, such as websites and
newsletters, and/or two-way tools, like social media
platforms, webinars, and meetings, are used weekly to communicate internally and
externally about STEM program activities
9.3
Sta
ke
ho
lde
rs &
Fu
nd
ing
A team of stakeholders has assembled to discuss STEM
education solutions or to create funding streams
A team of stakeholders assembles roughly every 2-3 years to discuss
STEM education solutions, including long-term funding; these
individuals include the STEM Leadership Team, local business
partners, and other STEM industry professionals
A team of stakeholders assembles annually to
continue building a STEM program and long-term funding streams; these
individuals include the STEM Leadership Team, local
business partners, and other STEM industry professionals
A team of stakeholders assembles semi-annually to
maintain a STEM program and long-term funding streams;
these individuals include the STEM Leadership Team, local business partners, and other STEM industry professionals

87
(10) Connections: Alignment with students’ career pathways to postsecondary programs
KE
Y
EL
E-
ME
NT
S
Early Developing Prepared
Model
Description of Your School/ Program
10
.1
Ve
rtic
al
Pla
nn
ing
STEM teachers vertically plan within and across (elementary, middle and high) schools every
2 years
Once a year STEM teachers vertically plan within and across (elementary, middle and high)
schools
Twice a year STEM teachers vertically plan within schools; and once a year STEM teachers plan
across (elementary, middle and high) schools
STEM teachers vertically plan within schools as needed; and twice a year
STEM teachers plan across (elementary, middle, and high)
schools
10
.2
Info
rma
tio
n S
ha
rin
g Information about
postsecondary STEM programs and STEM career topics is
shared annually among counselors and some teachers
Information about postsecondary STEM programs and STEM
career topics is shared biannually among counselors
and some teachers
Information about postsecondary STEM programs and STEM career topics is shared quarterly among
counselors and all teachers
Information about postsecondary STEM programs and STEM career
topics is shared monthly among counselors and all teachers
10
.3
Div
ers
e
Co
urs
e
Se
lec
tio
n
Courses in 1 STEM- related career field are available to
students
Courses in 2-3 STEM-related career fields are available to
students
Courses in 4 STEM-related career fields are available to students both
face-to-face and virtually
A wide variety of courses in STEM-related career fields are available to
students both face-to-face and virtually
10
.4 C
ou
ns
elo
r &
Stu
de
nt
Rela
tio
nsh
ips
Counselors and students interested in STEM
communicate yearly about the students’ future plans and
coursework
Counselors and students interested in STEM communicate
virtually or face-to-face biannually about the students’ future plans and coursework
Counselors and students interested in STEM have developed one-on-one relationships, communicating
face-to-face or virtually at least quarterly to discuss, plan and track the connections and alignment of
students’ plans to careers and postsecondary education
Counselors and students interested in STEM have developed one-on-
one relationships and use both face-to-face and virtual communication
frequently, including at least quarterly face-to-face meetings, to
plan, discuss and track the connections and alignment of students’ plans to careers and
postsecondary education
10
.5
Co
un
se
lors
&
Te
ac
he
rs Counselors and STEM teachers
meet annually to discuss the alignment of students’
coursework to postsecondary careers and/or education
Counselors and STEM teachers meet biannually to discuss the
alignment of students’ coursework to postsecondary
careers and/or education
Counselors and STEM teachers communicate quarterly (with at least 2 face-to-face meetings) to discuss
the alignment of students’ coursework to postsecondary
careers and/or education
Counselors and STEM teachers communicate regularly (with at least 2 face-to-face meetings) to discuss
the alignment of students’ coursework to postsecondary
careers and/or education

88
(11) Connections: Availability of credit completion with postsecondary institutions, including community colleges, colleges and/or universities
KE
Y
EL
EM
EN
TS
Early Developing Prepared
Model
Description of Your School/
Program
11
.1 C
red
it C
om
ple
tio
n
Ava
ila
bilit
y STEM program plan
23 includes
1-2 offerings in STEM-related career fields based upon an
agreement with at least 2 postsecondary institutions
STEM program plan13
includes a few offerings in STEM-related career fields based upon an agreement
with at least 2 postsecondary institution
STEM program plan13
includes multiple offerings in STEM-
related career fields based upon agreements with 2-3
postsecondary institutions; offerings were thoughtfully selected based upon other course availabilities at the
school
STEM program plan13
includes a wide variety of offerings in STEM-related career fields based upon
agreements with 4 or more postsecondary institutions; offerings were thoughtfully selected based upon other course availabilities at the
school
11
.2
Stu
de
nt
En
roll
me
nt
Less than 10% of participating students are enrolled STEM
courses that provide access to postsecondary institutions
10-25% of participating students are enrolled STEM courses that provide access to postsecondary
institutions
25-50% of participating students are enrolled STEM
courses that provide access to postsecondary institutions
Over 50% of participating students are enrolled STEM courses that provide access to
postsecondary institutions
11
.3
Co
mp
reh
en
siv
e
Ad
vis
ing
Counselors understand the postsecondary enrollment process but rarely advise
students on STEM opportunities
Counselors understand the postsecondary enrollment process
and advise students on STEM opportunities
Both counselors and STEM teachers understand the pathway completion and
postsecondary enrollment process and regularly advise
students on STEM opportunities
All counselors and all teachers understand the pathway completion and
postsecondary enrollment process and regularly
advise students on STEM opportunities
23
The NC STEM Program Plan offers three major education choices for students: (1) Future-Ready Core Course of Study including a four elective credit concentration in a STEM
field; (2) Career and College Promise with three options: a. Core 44 College Transfer programs in Engineering and Mathematics or Life and Health Sciences, b. Career Technical Education Pathway, and c. Cooperative Innovative High School Program; and/or (3) Access to advanced coursework in college/university courses that lead to a STEM related degree.

89
References
Friday Institute for Educational Innovation (2008). North Carolina Learning Technology Initiative (NCLTI) framework for planning. Raleigh, NC: Author. Available from
http://www.fi.ncsu.edu/assets/research_papers/nc-11-learning-technology-initiative-planning/nclti-planning-framework-.doc. Ready, Set Go (2011). Statewide STEM Strategy. Raleigh, NC: Author. Rowley, J. (2010). STEM Education Quality Rubrics. University of Dayton, Ohio Texas High School Project T-STEM Initiative (2010). Texas Science Technology Engineering and Mathematics Academies Design Blueprint, Rubric, and Glossary. Available from: http://ntstem.tamu.edu/Academies/blueprint.pdf

Golden LEAF STEM Initiative
May 2013
90
Appendix H. Classroom Observation Results from CLASS Protocol
Table H1
Classroom Observation Results from CLASS Protocol – Instructional Support and Student
Engagement Dimensions by Mean Score
CLASS Dimension Mean Score
N 82
Content understanding 4.1
Analysis and problem-solving 3.6
Quality of feedback 4.5
Instructional dialogue 3.5
Student engagement 5.5
Note: The CLASS Protocol is rated on a seven-point scale, 1 = no evidence to 7 = very strong evidence. This
protocol is being used in multiple, national-level, education studies including the Bill & Melinda Gates Foundation’s
Measures of Effective Teaching (MET) project (Kane & Staiger, 2012). Golden LEAF STEM Initiative evaluation
team members received training on the use of the instrument and have received certification of their reliability. For
more information on the CLASS instrument see: http://www.teachstone.org/about-the-class/
Table H2
Classroom Observation Results from CLASS Protocol – Instructional Support and Student
Engagement Dimensions by Proportion of Scores Over “3”
CLASS Dimension Mean Score
N 82
Content understanding 84.1%
Analysis and problem-solving 75.6%
Quality of feedback 81.7%
Instructional dialogue 52.4%
Student engagement 97.6%
Note: The CLASS Protocol is rated on a seven-point scale, 1 = no evidence to 7 = very strong evidence. This
protocol is being used in multiple, national-level, education studies including the Bill & Melinda Gates Foundation’s
Measures of Effective Teaching (MET) project (Kane & Staiger, 2012). Golden LEAF STEM Initiative evaluation
team members received training on the use of the instrument and have received certification of their reliability. For
more information on the CLASS instrument see: http://www.teachstone.org/about-the-class/

Golden LEAF STEM Initiative
May 2013
91
Appendix I. Combined Upper Elementary School and Middle/High School S-STEM
Results – Demographic Comparisons
Table I1
Year Two Student Attitudes toward STEM by Gender
STEM Attitude Mean Composite Score
Female Male
N 5,809 6,021
Math Attitudes 3.5 3.6
Science Attitudes 3.4 3.5
Engineering and Technology Attitudes 3.2 3.7
21st Century Learning Attitudes 4.1 3.9
Note: Responses were recorded on a five-point Likert scale: “strongly disagree” (1), “disagree” (2), “neither agree
nor disagree” (3), “agree” (4), and “strongly agree” (5).
Table I2
Year Two Student Attitudes toward STEM by Race/Ethnicity
STEM
Attitude
Mean Composite Score American
Indian/
AK
Native
Asian
Black/
African
American
Native
Hawaiian/
Pacific
Islander
White/
Caucasian
Hispanic/
Latino Multiracial
N 423 182 1,517 29 7,294 1,380 477
Math Attitudes 3.4 3.6 3.6 3.3 3.6 3.5 3.4
Science
Attitudes 3.4 3.5 3.3 3.6 3.5 3.4 3.4
Engineering
and
Technology
Attitudes
3.5 3.5 3.4 3.2 3.4 3.5 3.4
21st Century
Learning
Attitudes
3.9 3.9 4.0 4.0 4.0 3.9 3.9
Note: Responses were recorded on a five-point Likert scale: “strongly disagree” (1), “disagree” (2), “neither agree
nor disagree” (3), “agree” (4), and “strongly agree” (5).
Table I3
Year Two Student Attitudes toward STEM by School-Level and All Students
STEM Attitude
Mean Composite Score
Upper
Elementary Middle High All Students
N 3,436 7,083 1,324 11,843

Golden LEAF STEM Initiative
May 2013
92
Math Attitudes 3.7 3.5 3.3 3.5
Science Attitudes 3.5 3.4 3.3 3.4
Engineering & Technology
Attitudes 3.6 3.4 3.3 3.4
21st Century Learning
Attitudes 4.0 4.0 3.9 4.0
Note: Responses were recorded on a five-point Likert scale: “strongly disagree” (1), “disagree” (2), “neither agree
nor disagree” (3), “agree” (4), and “strongly agree” (5). “Upper Elementary” includes grades 4-5, “Middle School”
includes grades 6-8, and “High School” includes grades 9-12.
Table I4
Year Two Student Interest in STEM Careers by Gender and All Students
STEM Career Area Proportion “Interested” or “Very Interested”
Female Male All Students
N 5,812 6,025 11,837
Physics 24.5% 39.4% 32.1%
Environmental Work 36.9% 36.9% 36.9%
Biology and Zoology 53.4% 43.3% 48.2%
Veterinary Work 63.9% 38.7% 51.1%
Mathematics 34.5% 39.5% 37.0%
Medicine 57.1% 37.5% 47.1%
Earth Science 35.3% 41.8% 38.6%
Computer Science 31.5% 52.2% 42.1%
Medical Science 46.6% 34.6% 40.5%
Chemistry 36.6% 44.1% 40.4%
Energy 22.6% 49.0% 36.0%
Engineering 31.1% 67.4% 49.6%
Note: Responses were recorded on a four-point scale: “Not At All Interested” (1), “No So Interested” (2),
“Interested” (3), and “Very Interested” (4).
Table I5
Year Two Student Interest in STEM Careers by Race/Ethnicity
STEM
Attitudes
Mean Composite Score American
Indian/
AK
Native
Asian
Black/
African
American
Native
Hawaiian/
Pacific
Islander
White/
Caucasian
Hispanic/
Latino Multiracial
N 424 182 1,518 29 7,299 1,380 477
Physics 34.4% 37.9% 31.4% 34.5% 30.6% 37.3% 33.3%
Environmental
Work 38.4% 40.7% 34.5% 34.5% 36.2% 38.8% 41.1%

Golden LEAF STEM Initiative
May 2013
93
Biology &
Zoology 47.9% 51.6% 41.2% 51.7% 49.5% 49.4% 44.4%
Veterinary
Work 54.2% 42.9% 42.8% 58.6% 52.7% 52.2% 46.5%
Mathematics 38.4% 41.8% 48.5% 37.9% 33.8% 40.7% 36.1%
Medicine 46.2% 54.4% 48.4% 51.7% 46.1% 52.4% 45.5%
Earth Science 42.0% 48.4% 37.9% 31.0% 36.7% 44.2% 40.0%
Computer
Science 43.9% 49.5% 47.8% 37.9% 39.2% 47.6% 43.4%
Medical
Science 41.5% 43.4% 41.9% 44.8% 39.1% 46.2% 38.6%
Chemistry 40.6% 44.5% 42.9% 55.2% 38.6% 43.7% 42.8%
Energy 39.2% 39.6% 39.2% 20.7% 33.6% 41.6% 35.6%
Engineering 55.0% 57.1% 47.6% 41.4% 49.0% 52.3% 49.3%
Note: Responses were recorded on a four-point scale: “Not At All Interested” (1), “No So Interested” (2),
“Interested” (3), and “Very Interested” (4).
Table I6
Year Two Student Interest in STEM Careers by School-Level
STEM Attitude
Mean Composite Score
Upper
Elementary Middle High
N 3,438 7,088 1,324
Physics 37.9% 29.6% 30.3%
Environmental work 46.6% 32.9% 33.2%
Biology & Zoology 57.8% 45.2% 39.6%
Veterinary work 62.2% 48.2% 37.9%
Mathematics 45.0% 33.9% 33.6%
Medicine 47.4% 46.6% 48.9%
Earth science 52.1% 33.7% 29.5%
Computer science 52.2% 39.2% 31.0%
Medical science 44.5% 38.4% 41.1%
Chemistry 50.1% 37.2% 32.1%
Energy 48.5% 31.3% 28.9%
Engineering 54.5% 48.2% 43.8%
Note: Responses were recorded on a four-point scale: “Not At All Interested” (1), “No So Interested” (2),
“Interested” (3), and “Very Interested” (4).
Table I7
Year Two Student English Class Performance Expectations by Gender and All Students
How Well do You Expect to Do Proportion of Respondents

Golden LEAF STEM Initiative
May 2013
94
This Year in Your English Class? Not Very Well OK/Pretty Well Very Well
Female (N=5,480) 4.9% 45.5% 49.7%
Male (N=5,654) 7.8% 54.5% 37.6%
All Students (N=11,145) 6.4% 50.1% 43.5%
Table I8
Year Two Student English Class Performance Expectations by Race/Ethnicity
How Well Do You Expect to Do
This Year in Your English Class?
Proportion of Respondents
Not very well OK/Pretty well Very well
American Indian/AK Native
(N=390) 8.5% 57.2% 34.4%
Asian
(N=176) 6.8% 56.8% 36.4%
Black/African American
(N=1,391) 8.8% 46.4% 44.8%
Native Hawaiian/Pacific Islander
(N=29) 14.3% 42.9% 42.9%
White/Caucasian
(N=6,930) 5.5% 48.4% 46.2%
Hispanic/Latino
(N=1,283) 6.3% 56.7% 37.0%
Multiracial
(N=448) 6.9% 53.8% 39.3%
Table I9
Year Two Student English Class Performance Expectations by School-level
How Well Do You Expect to Do
This Year in Your English Class?
Percentage of Respondents
Not Very Well OK/Pretty Well Very Well
Upper Elementary (N=3,210) 7.0% 51.9% 41.1%
Middle School (N=6,660) 6.2% 49.0% 44.8%
High School (N=1,275) 5.7% 51.4% 43.0%
Note: “Upper Elementary” includes grades 4-5, “Middle School” includes grades 6-8, and “High School” includes
grades 9-12.
Table I10
Year Two Student Mathematics Class Performance Expectations by Gender and All Students
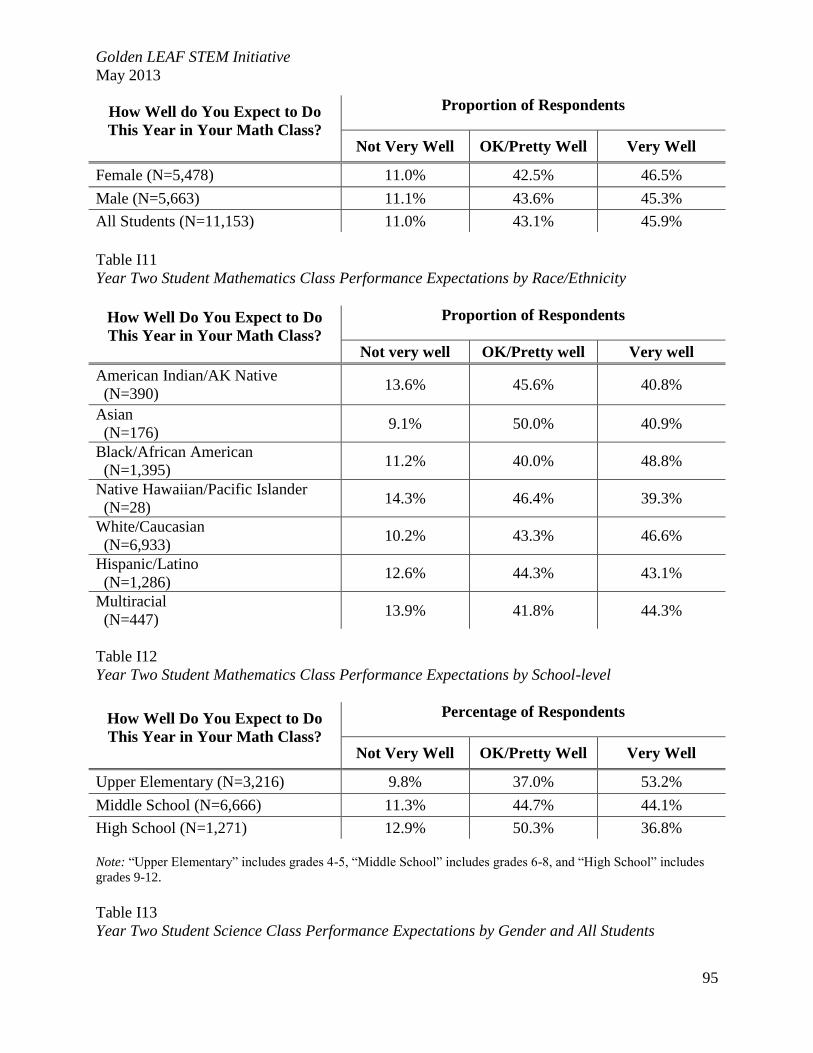
Golden LEAF STEM Initiative
May 2013
95
How Well do You Expect to Do
This Year in Your Math Class?
Proportion of Respondents
Not Very Well OK/Pretty Well Very Well
Female (N=5,478) 11.0% 42.5% 46.5%
Male (N=5,663) 11.1% 43.6% 45.3%
All Students (N=11,153) 11.0% 43.1% 45.9%
Table I11
Year Two Student Mathematics Class Performance Expectations by Race/Ethnicity
How Well Do You Expect to Do
This Year in Your Math Class?
Proportion of Respondents
Not very well OK/Pretty well Very well
American Indian/AK Native
(N=390) 13.6% 45.6% 40.8%
Asian
(N=176) 9.1% 50.0% 40.9%
Black/African American
(N=1,395) 11.2% 40.0% 48.8%
Native Hawaiian/Pacific Islander
(N=28) 14.3% 46.4% 39.3%
White/Caucasian
(N=6,933) 10.2% 43.3% 46.6%
Hispanic/Latino
(N=1,286) 12.6% 44.3% 43.1%
Multiracial
(N=447) 13.9% 41.8% 44.3%
Table I12
Year Two Student Mathematics Class Performance Expectations by School-level
How Well Do You Expect to Do
This Year in Your Math Class?
Percentage of Respondents
Not Very Well OK/Pretty Well Very Well
Upper Elementary (N=3,216) 9.8% 37.0% 53.2%
Middle School (N=6,666) 11.3% 44.7% 44.1%
High School (N=1,271) 12.9% 50.3% 36.8%
Note: “Upper Elementary” includes grades 4-5, “Middle School” includes grades 6-8, and “High School” includes
grades 9-12.
Table I13
Year Two Student Science Class Performance Expectations by Gender and All Students

Golden LEAF STEM Initiative
May 2013
96
How Well do You Expect to Do
This Year in Your Science Class?
Proportion of Respondents
Not Very Well OK/Pretty Well Very Well
Female (N=5,475) 8.3% 44.8% 47.0%
Male (N=5,653) 7.7% 45.1% 47.2%
All Students (N=11,139) 8.0% 44.9% 47.1%
Table I14
Year Two Student Science Class Performance Expectations by Race/Ethnicity
How Well Do You Expect to Do
This Year in Your Science Class?
Proportion of Respondents
Not very well OK/Pretty well Very well
American Indian/AK Native
(N=389) 7.7% 48.3% 44.0%
Asian
(N=176) 6.8% 60.8% 32.4%
Black/African American
(N=1,390) 11.6% 45.2% 43.2%
Native Hawaiian/Pacific Islander
(N=28) - 35.7% 64.3%
White/Caucasian
(N=6,929) 6.7% 42.8% 50.5%
Hispanic/Latino
(N=1,284) 9.6% 51.0% 39.4%
Multiracial
(N=446) 8.7% 49.8% 41.5%
Table I15
Year Two Student Science Class Performance Expectations by School-level
How Well Do You Expect to Do
This Year in Your Science Class?
Percentage of Respondents
Not Very Well OK/Pretty Well Very Well
Upper Elementary (N=3,207) 7.6% 42.3% 50.0%
Middle School (N=6,660) 7.8% 44.9% 47.4%
High School (N=1,272) 9.8% 51.9% 38.4%
Note: “Upper Elementary” includes grades 4-5, “Middle School” includes grades 6-8, and “High School” includes
grades 9-12.
Table I16

Golden LEAF STEM Initiative
May 2013
97
Year Two Middle & High School Student Plans to Take Advanced Mathematics Classes by
Gender and All Students
In the Future, Do You Plan to
Take Advanced Classes in
Mathematics?
Proportion of Respondents
Yes No Not Sure
Female (N=3,892) 50.0% 18.5% 31.5%
Male (N=3,970) 46.5% 21.6% 31.9%
All Students (N=7,868) 48.2% 20.1% 31.7%
Note: The Upper Elementary S-STEM did not contain this item.
Table I17
Year Two Middle & High School Student Plans to Take Advanced Mathematics Classes by
Race/Ethnicity
In the Future, Do You Plan to
Take Advanced Classes in
Mathematics?
Proportion of Respondents
Yes No Not Sure
American Indian/AK Native
(N=261) 44.4% 25.7% 29.9%
Asian
(N=157) 53.5% 12.1% 34.4%
Black/African American
(N=872) 54.1% 20.6% 25.2%
Native Hawaiian/Pacific Islander
(N=13) 38.5% - 46.2%
White/Caucasian
(N=5,043) 47.7% 20.1% 32.3%
Hispanic/Latino
(N=923) 49.7% 16.5% 33.8%
Multiracial
(N=306) 44.1% 24.2% 31.7%
Note: The Upper Elementary S-STEM did not contain this item.
Table I18
Year Two Middle & High School Student Plans to Take Advanced Mathematics Classes by
School-Level
In the Future, Do You Plan to
Take Advanced Classes in
Mathematics?
Percentage of Respondents
Yes No Not Sure

Golden LEAF STEM Initiative
May 2013
98
Upper Elementary - - -
Middle School (N=6,601) 49.0% 18.7% 32.3%
High School (N=1,267) 44.1% 27.6% 28.3%
Note: The Upper Elementary S-STEM did not contain this item. “Middle School” includes grades 6-8 and “High
School” includes grades 9-12.
Table I19
Year Two Middle & High School Student Plans to Take Advanced Science Classes by Gender
and All Students
In the Future, Do You Plan to
Take Advanced Classes in
Science?
Proportion of Respondents
Yes No Not Sure
Female (N=3,883) 41.8% 20.4% 37.9%
Male (N=3,974) 43.5% 20.7% 35.8%
All Students (N=7,864) 42.6% 20.5% 36.9%
Note: The Upper Elementary S-STEM did not contain this item.
Table I20
Year Two Middle & High School Student Plans to Take Advanced Science Classes by
Race/Ethnicity
In the Future, Do You Plan to
Take Advanced Classes in
Science?
Proportion of Respondents
Yes No Not Sure
American Indian/AK Native
(N=262) 39.7% 26.0% 34.4%
Asian
(N=156) 41.0% 16.7% 42.3%
Black/African American
(N=870) 39.3% 27.4% 33.3%
Native Hawaiian/Pacific Islander
(N=13) 61.5% - 38.5%
White/Caucasian
(N=5,038) 44.5% 19.2% 36.3%
Hispanic/Latino
(N=926) 39.1% 18.9% 42.0%
Multiracial
(N=309) 40.1% 23.6% 36.3%
Note: The Upper Elementary S-STEM did not contain this item.
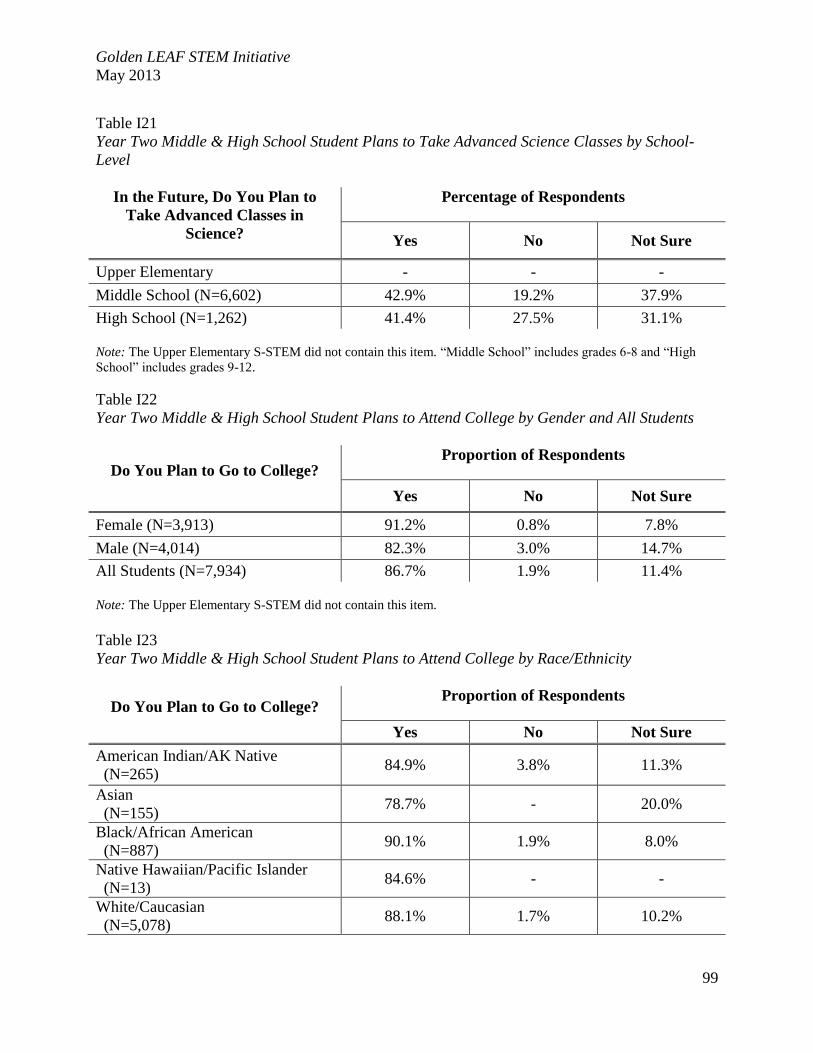
Golden LEAF STEM Initiative
May 2013
99
Table I21
Year Two Middle & High School Student Plans to Take Advanced Science Classes by School-
Level
In the Future, Do You Plan to
Take Advanced Classes in
Science?
Percentage of Respondents
Yes No Not Sure
Upper Elementary - - -
Middle School (N=6,602) 42.9% 19.2% 37.9%
High School (N=1,262) 41.4% 27.5% 31.1%
Note: The Upper Elementary S-STEM did not contain this item. “Middle School” includes grades 6-8 and “High
School” includes grades 9-12.
Table I22
Year Two Middle & High School Student Plans to Attend College by Gender and All Students
Do You Plan to Go to College? Proportion of Respondents
Yes No Not Sure
Female (N=3,913) 91.2% 0.8% 7.8%
Male (N=4,014) 82.3% 3.0% 14.7%
All Students (N=7,934) 86.7% 1.9% 11.4%
Note: The Upper Elementary S-STEM did not contain this item.
Table I23
Year Two Middle & High School Student Plans to Attend College by Race/Ethnicity
Do You Plan to Go to College? Proportion of Respondents
Yes No Not Sure
American Indian/AK Native
(N=265) 84.9% 3.8% 11.3%
Asian
(N=155) 78.7% - 20.0%
Black/African American
(N=887) 90.1% 1.9% 8.0%
Native Hawaiian/Pacific Islander
(N=13) 84.6% - -
White/Caucasian
(N=5,078) 88.1% 1.7% 10.2%

Golden LEAF STEM Initiative
May 2013
100
Hispanic/Latino
(N=936) 78.9% 1.7% 19.4%
Multiracial
(N=307) 86.6% 3.6% 9.8%
Note: The Upper Elementary S-STEM did not contain this item.
Table I24
Year Two Middle & High School Student Plans to Attend College by School-Level
Do You Plan to Go to College? Percentage of Respondents
Yes No Not Sure
Upper Elementary - - -
Middle School (N=6,669) 87.8% 1.3% 10.9%
High School (N=1,265) 81.0% 5.1% 13.8%
Note: The Upper Elementary S-STEM did not contain this item. “Middle School” includes grades 6-8 and “High
School” includes grades 9-12.
Table I25
Year Two Middle & High School Student Plans to Attend Two- or Four-Year College by Gender
and All Students
Are You Planning on Going to a Community
College or Four-Year College/University First?
Proportion of Respondents
Community
College
Four-Year
College/University
Female (N=3,479) 24.2% 75.8%
Male (N=3,172) 21.1% 78.9%
All Students (N=6,656) 22.7% 77.3%
Note: The Upper Elementary S-STEM did not contain this item. Students who responded “No” to the “Do you plan
to attend college?” item were not asked this question on the survey.
Table I26
Year Two Middle & High School Student Plans to Attend Two- or Four-Year College by
Race/Ethnicity
Are You Planning on Going to a Community
College or Four-Year College/University First?
Proportion of Respondents
Yes No
American Indian/AK Native
(N=218) 33.9% 66.1%

Golden LEAF STEM Initiative
May 2013
101
Asian
(N=118) 20.3% 79.7%
Black/African American
(N=762) 17.1% 82.9%
Native Hawaiian/Pacific Islander
(N=11) - 81.8%
White/Caucasian
(N=4,359) 21.4% 78.6%
Hispanic/Latino
(N=707) 31.7% 68.3%
Multiracial
(N=254) 21.7% 78.4%
Note: The Upper Elementary S-STEM did not contain this item. Students who responded “No” to the “Do you plan
to attend college?” item were not asked this question on the survey.
Table I27
Year Two Middle & High School Student Plans to Attend Two- or Four-Year College by School-
Level
Are You Planning on Going to a Community
College or Four-Year College/University First?
Percentage of Respondents
Yes No
Upper Elementary - -
Middle School (N=5,670) 22.0% 78.0%
High School (N=986) 26.4% 73.6%
Note: The Upper Elementary S-STEM did not contain this item. Students who responded “No” to the “Do you plan
to attend college?” item were not asked this question on the survey. “Middle School” includes grades 6-8 and “High
School” includes grades 9-12.
Table I28
Year Two Student Awareness of Scientists by Gender and All Students
Do You Know Any Adults Who
Work as Scientists?
Proportion of Respondents
Yes No Not Sure
Female (N=5,470) 22.5% 52.5% 25.0%
Male (N=5,652) 26.8% 52.7% 20.5%
All Students (N=11,134) 24.7% 52.6% 22.8%
Table I29
Year Two Student Awareness of Scientists by Race/Ethnicity

Golden LEAF STEM Initiative
May 2013
102
Do You Know Any Adults Who
Work as Scientists?
Proportion of Respondents
Yes No Not Sure
American Indian/AK Native
(N=387) 22.5% 52.5% 25.0%
Asian
(N=174) 26.8% 52.7% 20.5%
Black/African American
(N=1,402) 25.1% 53.4% 21.5%
Native Hawaiian/Pacific Islander
(N=28) 29.2% 47.6% 23.3%
White/Caucasian
(N=6,919) 20.1% 54.6% 25.3%
Hispanic/Latino
(N=1,284) 25.1% 53.4% 21.5%
Multiracial
(N=442) 39.3% 35.7% 25.0%
Table I30
Year Two Student Awareness of Scientists by School-Level
Do You Know Any Adults Who
Work as Scientists?
Percentage of Respondents
Yes No Not Sure
Upper Elementary (N=3,229) 18.1% 47.5% 34.4%
Middle School (N=6,641) 26.5% 54.3% 19.1%
High School (N=1,264) 31.7% 56.3% 12.1%
Note: “Upper Elementary” includes grades 4-5, “Middle School” includes grades 6-8, and “High School” includes
grades 9-12.
Table I31
Year Two Student Awareness of Engineers by Gender and All Students
Do You Know Any Adults Who
Work as Engineers?
Proportion of Respondents
Yes No Not Sure
Female (N=5,470) 56.9% 25.4% 17.8%
Male (N=5,644) 64.9% 22.6% 12.5%
All Students (N=11,126) 60.9% 24.0% 15.1%
Table I32
Year Two Student Awareness of Engineers by Race/Ethnicity

Golden LEAF STEM Initiative
May 2013
103
Do You Know Any Adults Who
Work as Engineers?
Proportion of Respondents
Yes No Not Sure
American Indian/AK Native
(N=387) 65.4% 20.2% 14.5%
Asian
(N=174) 56.3% 23.6% 20.1%
Black/African American
(N=1,397) 56.8% 30.1% 13.2%
Native Hawaiian/Pacific Islander
(N=28) 71.4% - 17.9%
White/Caucasian
(N=6,917) 62.8% 21.9% 15.3%
Hispanic/Latino
(N=1,285) 55.4% 28.7% 15.9%
Multiracial
(N=442) 60.2% 27.6% 12.2%
Table I33
Year Two Student Awareness of Engineers by School-Level
Do You Know Any Adults Who
Work as Engineers?
Percentage of Respondents
Yes No Not Sure
Upper Elementary (N=3,224) 52.4% 27.3% 20.4%
Middle School (N=6,638) 64.5% 22.0% 13.5%
High School (N=1,264) 63.8% 26.1% 10.1%
Note: “Upper Elementary” includes grades 4-5, “Middle School” includes grades 6-8, and “High School” includes
grades 9-12.
Table I34
Year Two Student Awareness of Mathematicians by Gender and All Students
Do You Know Any Adults Who
Work as Mathematicians?
Proportion of Respondents
Yes No Not Sure
Female (N=5,467) 38.3% 40.5% 21.2%
Male (N=5,642) 37.6% 44.7% 17.7%
All Students (N=11,121) 37.9% 42.6% 19.5%
Table I35

Golden LEAF STEM Initiative
May 2013
104
Year Two Student Awareness of Mathematicians by Race/Ethnicity
Do You Know Any Adults Who
Work as Mathematicians?
Proportion of Respondents
Yes No Not Sure
American Indian/AK Native
(N=387) 38.0% 40.8% 21.2%
Asian
(N=174) 27.6% 44.3% 28.2%
Black/African American
(N=1,396) 44.3% 40.0% 15.7%
Native Hawaiian/Pacific Islander
(N=28) 32.1% 46.4% 21.4%
White/Caucasian
(N=6,916) 37.5% 42.8% 19.8%
Hispanic/Latino
(N=1,283) 35.3% 44.9% 19.8%
Multiracial
(N=441) 38.8% 44.7% 16.6%
Table I36
Year Two Student Awareness of Mathematicians by School-Level
Do You Know Any Adults Who
Work as Mathematicians?
Percentage of Respondents
Yes No Not Sure
Upper Elementary (N=3,222) 29.7% 44.2% 26.1%
Middle School (N=6,635) 40.7% 41.8% 17.6%
High School (N=1,264) 44.6% 43.0% 12.4%
Note: “Upper Elementary” includes grades 4-5, “Middle School” includes grades 6-8, and “High School” includes
grades 9-12.
Table I37
Year Two Student Awareness of Technologists by Gender and All Students
Do You Know Any Adults Who
Work as Technologists?
Proportion of Respondents
Yes No Not Sure
Female (N=5,467) 42.4% 33.4% 24.2%
Male (N=5,642) 47.4% 33.2% 19.4%
All Students (N=11,121) 44.9% 33.3% 21.8%

Golden LEAF STEM Initiative
May 2013
105
Table I38
Year Two Student Awareness of Technologists by Race/Ethnicity
Do You Know Any Adults Who
Work as Technologists?
Proportion of Respondents
Yes No Not Sure
American Indian/AK Native
(N=387) 46.5% 31.5% 22.0%
Asian
(N=174) 37.9% 32.2% 29.9%
Black/African American
(N=1,396) 48.9% 33.5% 17.6%
Native Hawaiian/Pacific Islander
(N=28) 64.3% - 25.0%
White/Caucasian
(N=6,915) 44.0% 33.1% 22.9%
Hispanic/Latino
(N=1,284) 43.1% 36.6% 20.3%
Multiracial
(N=441) 49.4% 33.1% 17.5%
Table I39
Year Two Student Awareness of Technologists by School-Level
Do You Know Any Adults Who
Work as Technologists?
Percentage of Respondents
Yes No Not Sure
Upper Elementary (N=3,222) 39.3% 34.7% 26.0%
Middle School (N=6,636) 47.3% 32.1% 20.7%
High School (N=1,263) 46.9% 36.3% 16.9%
Note: “Upper Elementary” includes grades 4-5, “Middle School” includes grades 6-8, and “High School” includes
grades 9-12.

Golden LEAF STEM Initiative
May 2013
106
Appendix J. Upper Elementary School (4-5th) Student Attitudes toward STEM (S-STEM)
Survey Item-Level Results
Table J1
Year Two Upper Elementary School Student STEM Attitudes
Survey Item
Proportion of Respondents
(N=3,324 – 3,429)
Strongly
Disagree Disagree
Neither
Agree
Nor
Disagree
Agree Strongly
Agree
Math Attitudes
1. Math has been my worst subject. 5.0% 9.8% 11.7% 38.7% 34.8%
2. When I’m older, I might choose a
job that uses math. 15.6% 19.8% 24.7% 28.8% 11.1%
3. Math is hard for me. 6.7% 15.5% 14.5% 36.8% 26.5%
4. I am the type of student who does
well in math. 6.4% 15.7% 15.7% 37.0% 25.3%
5. I can understand most subjects
easily, but math is difficult for me. 6.7% 19.2% 12.3% 34.4% 27.3%
6. I am sure I could do advanced
work in math. 5.8% 9.3% 12.9% 39.6% 32.5%
7. I can get good grades in math. 3.9% 5.7% 9.9% 42.6% 37.9%
8. I am good at math. 5.2% 10.9% 13.5% 38.5% 31.9%
Science Attitudes
9. I am sure of myself when I do
science. 4.0% 8.3% 15.2% 46.4% 26.2%
10. I would consider a career in
science. 13.3% 25.3% 24.8% 23.2% 13.5%
11. I expect to use science when I get
out of school. 7.8% 19.6% 30.6% 29.7% 12.3%
12. Knowing science will help me earn
a living. 6.8% 17.2% 26.7% 31.7% 17.5%
13. I will need science for my future
work. 10.3% 20.8% 24.9% 28.1% 15.8%
14. I know I can do well in science. 2.9% 5.3% 10.0% 47.4% 34.4%
15. Science will be important to me in
my life’s work. 8.4% 18.7% 27.7% 28.0% 17.2%
16. I can handle most subjects well,
but I cannot do a good job with
science.
5.5% 15.0% 14.5% 34.5% 30.5%
17. I am sure I could do advanced
work in science. 7.3% 11.3% 17.0% 37.0% 27.4%
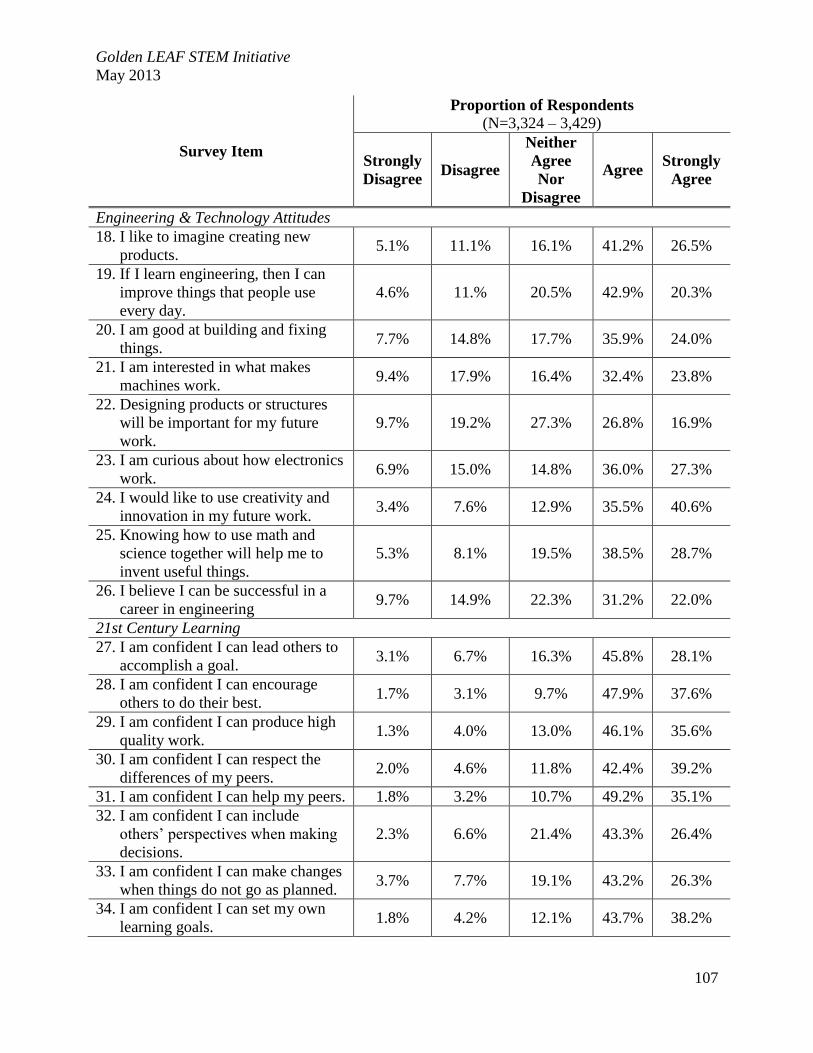
Golden LEAF STEM Initiative
May 2013
107
Survey Item
Proportion of Respondents
(N=3,324 – 3,429)
Strongly
Disagree Disagree
Neither
Agree
Nor
Disagree
Agree Strongly
Agree
Engineering & Technology Attitudes
18. I like to imagine creating new
products. 5.1% 11.1% 16.1% 41.2% 26.5%
19. If I learn engineering, then I can
improve things that people use
every day.
4.6% 11.% 20.5% 42.9% 20.3%
20. I am good at building and fixing
things. 7.7% 14.8% 17.7% 35.9% 24.0%
21. I am interested in what makes
machines work. 9.4% 17.9% 16.4% 32.4% 23.8%
22. Designing products or structures
will be important for my future
work.
9.7% 19.2% 27.3% 26.8% 16.9%
23. I am curious about how electronics
work. 6.9% 15.0% 14.8% 36.0% 27.3%
24. I would like to use creativity and
innovation in my future work. 3.4% 7.6% 12.9% 35.5% 40.6%
25. Knowing how to use math and
science together will help me to
invent useful things.
5.3% 8.1% 19.5% 38.5% 28.7%
26. I believe I can be successful in a
career in engineering 9.7% 14.9% 22.3% 31.2% 22.0%
21st Century Learning
27. I am confident I can lead others to
accomplish a goal. 3.1% 6.7% 16.3% 45.8% 28.1%
28. I am confident I can encourage
others to do their best. 1.7% 3.1% 9.7% 47.9% 37.6%
29. I am confident I can produce high
quality work. 1.3% 4.0% 13.0% 46.1% 35.6%
30. I am confident I can respect the
differences of my peers. 2.0% 4.6% 11.8% 42.4% 39.2%
31. I am confident I can help my peers. 1.8% 3.2% 10.7% 49.2% 35.1%
32. I am confident I can include
others’ perspectives when making
decisions.
2.3% 6.6% 21.4% 43.3% 26.4%
33. I am confident I can make changes
when things do not go as planned. 3.7% 7.7% 19.1% 43.2% 26.3%
34. I am confident I can set my own
learning goals. 1.8% 4.2% 12.1% 43.7% 38.2%

Golden LEAF STEM Initiative
May 2013
108
Survey Item
Proportion of Respondents
(N=3,324 – 3,429)
Strongly
Disagree Disagree
Neither
Agree
Nor
Disagree
Agree Strongly
Agree
35. I am confident I can manage my
time wisely when working on my
own.
2.6% 5.1% 14.2% 42.2% 36.0%
36. When I have many assignments, I
can choose which ones need to be
done first.
2.6% 4.6% 9.8% 43.1% 39.9%
37. I am confident I can work well
with students from different
backgrounds.
3.1% 6.1% 15.0% 40.4% 35.4%
Table J2
Year Two Upper Elementary School Student Interest in STEM Careers
Career
Proportion of Respondents
Not at All
Interested
Not So
Interested Interested
Very
interested Physics: is the study of basic laws governing the
motion, energy, structure, and interactions of
matter. This can include studying the nature of the
universe. (aviation engineer, alternative energy
technician, lab technician, physicist, astronomer)
23.8% 36.0% 27.0% 13.2%
Environmental Work: involves learning about
physical and biological processes that govern
nature and working to improve the environment.
This includes finding and designing solutions to
problems like pollution, reusing waste and
recycling. (pollution control analyst,
environmental engineer or scientist, erosion
control specialist, energy systems engineer and
maintenance technician)
16.8% 33.6% 33.7% 15.9%
Biology and Zoology: involve the study of living
organisms (such as plants and animals) and the
processes of life. This includes working with
farm animals and in areas like nutrition and
breeding. (biological technician, biological
scientist, plant breeder, crop lab technician,
animal scientist, geneticist, zoologist)
14.3% 24.2% 35.0% 26.5%
Veterinary Work: involves the science of
preventing or treating disease in animals.
(veterinary assistant, veterinarian, livestock
producer, animal caretaker)
13.4% 20.4% 32.1% 34.2%

Golden LEAF STEM Initiative
May 2013
109
Career
Proportion of Respondents
Not at All
Interested
Not So
Interested Interested
Very
interested Mathematics: is the science of numbers and their
operations. It involves computation, algorithms
and theory used to solve problems and summarize
data. (accountant, applied mathematician,
economist, financial analyst, mathematician,
statistician, market researcher, stock market
analyst)
23.0% 29.1% 29.9% 18.0%
Medicine: involves maintaining health and
preventing and treating disease. (physician’s
assistant, nurse, doctor, nutritionist, emergency
medical technician, physical therapist, dentist)
20.4% 29.2% 30.8% 19.7%
Earth Science: is the study of earth, including the
air, land, and ocean. (geologist, weather
forecaster, archaeologist, geoscientist) 17.5% 26.9% 32.2% 23.4%
Computer Science: consists of the development
and testing of computer systems, designing new
programs and helping others to use computers.
(computer support specialist, computer
programmer, computer and network technician,
gaming designer, computer software engineer,
information technology specialist)
17.6% 26.8% 30.9% 24.7%
Medical Science: involves researching human
disease and working to find new solutions to
human health problems. (clinical laboratory
technologist, medical scientist, biomedical
engineer, epidemiologist, pharmacologist)
22.5% 30.1% 29.2% 18.2%
Chemistry: uses math and experiments to search
for new chemicals, and to study the structure of
matter and how it behaves. (chemical technician,
chemist, chemical engineer)
19.5% 27.1% 30.6% 22.9%
Energy: involves the study and generation of
power, such as heat or electricity. (electrician,
electrical engineer, heating, ventilation, and air
conditioning (HVAC) technician, nuclear
engineer, systems engineer, alternative energy
systems installer or technician)
20.0% 28.3% 30.9% 20.8%
Engineering: involves designing, testing, and
manufacturing new products (like machines,
bridges, buildings, and electronics) through the
use of math, science, and computers. (civil,
industrial, agricultural, or mechanical engineers,
welder, auto-mechanic, engineering technician,
construction manager)
19.8% 22.2% 31.1% 26.9%
Table J3
Year Two Upper Elementary School Student Class Performance Expectations
How Well Do You Expect to
Do This Year in Your …
Proportion of Respondents
(N=3,216)

Golden LEAF STEM Initiative
May 2013
110
Not Very Well OK/Pretty Well Very Well
English/Language Arts Class? 7.0% 51.9% 41.1%
Math Class? 9.8% 37.0% 53.2%
Science Class? 7.6% 42.3% 50.0%
Table J4
Year Two Upper Elementary School Student Awareness of STEM Professionals
Do You Know Any Adults
Who Work As …
Proportion of Respondents
(N=3,229)
Yes No Not sure
Scientists? 18.1% 47.5% 34.4%
Engineers? 52.4% 27.3% 20.4%
Mathematicians? 29.7% 44.2% 26.1%
Technologists? 39.3% 34.7% 26.0%

Golden LEAF STEM Initiative
May 2013
111
Appendix K. Middle and High School (6-12th) Student Attitudes toward STEM (S-STEM)
Survey Item-Level Results
Table K1
Year Two Middle and High School Student STEM Attitudes
Survey Item
Proportion of Respondents
(N=8,113 – 8,404)
Strongly
Disagree Disagree
Neither
Agree
Nor
Disagree
Agree Strongly
Agree
Math Attitudes
1. Math has been my worst subject. 7.7% 13.1% 18.3% 32.4% 28.5%
2. I would consider choosing a career
that uses math. 16.0% 21.8% 29.5% 25.3% 7.5%
3. Math is hard for me. 7.2% 16.7% 23.9% 33.4% 18.7%
4. I am the type of student to do well
in math. 6.7% 14.3% 22.5% 37.1% 19.4%
5. I can understand most subjects
easily, but math is difficult for me. 5.8% 15.8% 19.2% 36.8% 22.4%
6. I am sure I could do advanced
work in math. 10.8% 15.9% 23.8% 32.4% 17.2%
7. I can get good grades in math. 3.8% 5.5% 14.9% 44.5% 31.4%
8. I am good at math. 5.6% 9.9% 21.9% 38.5% 24.1%
Science Attitudes
9. I am sure of myself when I do
science. 4.3% 10.9% 26.9% 42.5% 15.5%
10. I would consider a career in
science. 11.8% 21.6% 28.7% 24.6% 13.3%
11. I expect to use science when I get
out of school. 7.8% 18.1% 30.5% 30.3% 13.3%
12. Knowing science will help me earn
a living. 5.1% 11.3% 30.6% 37.4% 15.6%
13. I will need science for my future
work. 7.3% 16.7% 34.3% 27.4% 14.4%
14. I know I can do well in science. 2.7% 4.7% 14.6% 52.0% 26.0%
15. Science will be important to me in
my life’s work. 7.1% 16.8% 36.6% 26.1% 13.4%
16. I can handle most subjects well,
but I cannot do a good job with
science.
4.2% 10.7% 20.1% 38.8% 26.2%
17. I am sure I could do advanced
work in science. 9.5% 14.6% 27.8% 30.4% 17.7%

Golden LEAF STEM Initiative
May 2013
112
Survey Item
Proportion of Respondents
(N=8,113 – 8,404)
Strongly
Disagree Disagree
Neither
Agree
Nor
Disagree
Agree Strongly
Agree
Engineering & Technology Attitudes
27. I like to imagine creating new
products. 4.5% 12.2% 23.1% 42.1% 18.1%
28. If I learn engineering, then I can
improve things that people use
every day.
4.1% 10.6% 25.1% 44.9% 15.3%
29. I am good at building and fixing
things. 7.0% 15.9% 25.6% 33.4% 18.0%
30. I am interested in what makes
machines work. 10.6% 22.2% 24.4% 27.8% 15.0%
31. Designing products or structures
will be important for my future
work.
8.7% 22.8% 33.6% 23.5% 11.5%
32. I am curious about how electronics
work. 7.4% 17.6% 22.1% 35.2% 17.7%
33. I would like to use creativity and
innovation in my future work. 5.5% 13.8% 27.4% 34.7% 18.7%
34. Knowing how to use math and
science together will help me to
invent useful things.
5.1% 9.6% 27.8% 39.2% 18.2%
35. I believe I can be successful in a
career in engineering 10.0% 17.2% 30.4% 27.6% 14.7%
21st Century Learning
38. I am confident I can lead others to
accomplish a goal. 2.7% 4.8% 21.2% 47.8% 23.5%
39. I am confident I can encourage
others to do their best. 1.8% 3.5% 17.5% 49.7% 27.6%
40. I am confident I can produce high
quality work. 1.8% 4.7% 22.5% 45.5% 25.6%
41. I am confident I can respect the
differences of my peers. 1.7% 2.4% 14.4% 49.0% 32.5%
42. I am confident I can help my peers. 1.8% 3.0% 16.3% 50.1% 28.8%
43. I am confident I can include
others’ perspectives when making
decisions.
1.8% 3.6% 19.4% 50.8% 24.4%
44. I am confident I can make changes
when things do not go as planned. 1.7% 3.7% 20.1% 49.9% 24.7%
45. I am confident I can set my own
learning goals. 1.5% 3.4% 16.4% 47.2% 31.5%

Golden LEAF STEM Initiative
May 2013
113
Survey Item
Proportion of Respondents
(N=8,113 – 8,404)
Strongly
Disagree Disagree
Neither
Agree
Nor
Disagree
Agree Strongly
Agree
46. I am confident I can manage my
time wisely when working on my
own.
2.6% 5.9% 20.8% 45.6% 25.1%
47. When I have many assignments, I
can choose which ones need to be
done first.
2.1% 4.3% 17.7% 46.6% 29.4%
48. I am confident I can work well
with students from different
backgrounds.
2.2% 3.8% 19.9% 43.9% 30.3%
Table K2
Year Two Middle and High School Student Interest in STEM Careers
Career
Proportion of Respondents
Not at All
Interested
Not So
Interested Interested
Very
interested Physics: is the study of basic laws governing the
motion, energy, structure, and interactions of
matter. This can include studying the nature of the
universe. (aviation engineer, alternative energy
technician, lab technician, physicist, astronomer)
26.2% 42.7% 23.6% 7.6%
Environmental Work: involves learning about
physical and biological processes that govern
nature and working to improve the environment.
This includes finding and designing solutions to
problems like pollution, reusing waste and
recycling. (pollution control analyst,
environmental engineer or scientist, erosion
control specialist, energy systems engineer and
maintenance technician)
23.8% 41.7% 26.8% 7.7%
Biology and Zoology: involve the study of living
organisms (such as plants and animals) and the
processes of life. This includes working with
farm animals and in areas like nutrition and
breeding. (biological technician, biological
scientist, plant breeder, crop lab technician,
animal scientist, geneticist, zoologist)
21.4% 32.2% 30.5% 15.9%
Veterinary Work: involves the science of
preventing or treating disease in animals.
(veterinary assistant, veterinarian, livestock
producer, animal caretaker)
20.0% 31.1% 29.9% 19.1%

Golden LEAF STEM Initiative
May 2013
114
Career
Proportion of Respondents
Not at All
Interested
Not So
Interested Interested
Very
interested Mathematics: is the science of numbers and their
operations. It involves computation, algorithms
and theory used to solve problems and summarize
data. (accountant, applied mathematician,
economist, financial analyst, mathematician,
statistician, market researcher, stock market
analyst)
28.1% 36.4% 26.4% 9.1%
Medicine: involves maintaining health and
preventing and treating disease. (physician’s
assistant, nurse, doctor, nutritionist, emergency
medical technician, physical therapist, dentist)
19.7% 31.0% 29.7% 19.5%
Earth Science: is the study of earth, including the
air, land, and ocean. (geologist, weather
forecaster, archaeologist, geoscientist) 26.2% 39.2% 26.5% 8.1%
Computer Science: consists of the development
and testing of computer systems, designing new
programs and helping others to use computers.
(computer support specialist, computer
programmer, computer and network technician,
gaming designer, computer software engineer,
information technology specialist)
27.0% 33.2% 25.6% 14.1%
Medical Science: involves researching human
disease and working to find new solutions to
human health problems. (clinical laboratory
technologist, medical scientist, biomedical
engineer, epidemiologist, pharmacologist)
24.4% 34.9% 25.8% 14.9%
Chemistry: uses math and experiments to search
for new chemicals, and to study the structure of
matter and how it behaves. (chemical technician,
chemist, chemical engineer)
26.6% 35.3% 26.7% 11.5%
Energy: involves the study and generation of
power, such as heat or electricity. (electrician,
electrical engineer, heating, ventilation, and air
conditioning (HVAC) technician, nuclear
engineer, systems engineer, alternative energy
systems installer or technician)
28.4% 39.2% 24.3% 8.1%
Engineering: involves designing, testing, and
manufacturing new products (like machines,
bridges, buildings, and electronics) through the
use of math, science, and computers. (civil,
industrial, agricultural, or mechanical engineers,
welder, auto-mechanic, engineering technician,
construction manager)
23.5% 26.7% 28.3% 21.5%
Table K3
Year Two Middle and High School Student Class Performance Expectations
How Well Do You Expect to
Do This Year in Your …
Proportion of Respondents
(N=7,937)
Not Very Well OK/Pretty Well Very Well

Golden LEAF STEM Initiative
May 2013
115
English/Language Arts Class? 6.1% 49.4% 44.5%
Math Class? 11.5% 45.6% 42.9%
Science Class? 8.1% 46.0% 45.9%
Table K4
Year Two Upper Elementary School Student Awareness of STEM Professionals
Do You Know Any Adults
Who Work As …
Proportion of Respondents
(N=7,905)
Yes No Not sure
Scientists? 27.4% 54.6% 18.0%
Engineers? 64.4% 22.6% 13.0%
Mathematicians? 41.3% 42.0% 16.8%
Technologists? 47.2% 32.7% 20.1%
Table K5
Year Two Middle and High School Student Plans to Take Advanced Classes
In the Future, Do You Plan to
Take Advanced Classes In:
Proportion of Respondents
(N=7,868)
Yes No Not sure
Mathematics? 48.2% 20.1% 31.7%
Science? 42.6% 20.5% 36.9%
Table K6
Year Two Middle and High School Student Plans to Attend College
Do You Plan to Go to College?
Percentage of respondents
(N=7,934)
Yes No Not sure
All middle & high school
students 86.7% 1.9% 11.4%
Table K7
Year Two Middle and High School Student Plans to Attend Two- or Four-Year College
Are You Planning on Going to a Community
College or Four-Year College/University First?
Percentage of respondents
(N=6,656)
Community College Four-Year College
All Middle & High School Students 22.7% 77.3%
Note: Students who responded “No” to the “Do you plan to attend college?” item were not asked this question on
the survey.

Golden LEAF STEM Initiative
May 2013
116
Appendix L. Combined Science, Technology, Engineering, Mathematics, and Elementary
T-STEM Results – Demographic Comparisons
Table L1
Year Two Teacher Self-Efficacy and Beliefs (PSTEBS) and Outcome Expectancy (STOES) by
Subject Area and All Teachers
Note: Responses were recorded on a five-point Likert scale: “strongly disagree” (1), “disagree” (2), “neither agree
nor disagree” (3), “agree” (4), and “strongly agree” (5). “Science” and “Math” teacher results include results from
elementary school teacher respondents who taught either science only, math only, or science and math. For
elementary teacher respondents who taught both science and math, the “All Teachers” results were calculated using
composite PSTEBS and STOES score.
Table L2
Year Two Teacher Self-Efficacy and Beliefs (PSTEBS) and Outcome Expectancy (STOES) by
School-Level
Note: Responses were recorded on a five-point Likert scale: “strongly disagree” (1), “disagree” (2), “neither agree
nor disagree” (3), “agree” (4), and “strongly agree” (5). Composite PSTEBS and STOES scores were created for
elementary teacher respondents who taught both science and math.
Table L3
Year Two Science Teacher Self-Efficacy and Beliefs (PSTEBS) and Outcome Expectancy
(STOES) by School-Level
Scale
Mean Composite Score
Science Technology Engineering Math
All
Teachers
N 351 42 9 261 535
Personal (STEM) Teaching
Efficacy and Beliefs
Scale (PSTEBS)
3.9 4.0 4.2 4.0 4.0
(STEM) Teaching
Outcome Expectancy
Scale (STOES)
3.4 3.3 3.6 3.5 3.4
Scale Mean Composite Score
Elementary Middle High
N 247 201 77
Personal (STEM) Teaching Efficacy
and Beliefs Scale (PSTEBS) 3.9 4.1 3.9
(STEM) Teaching Outcome
Expectancy Scale (STOES) 3.5 3.4 3.3
Scale Mean Composite Score

Golden LEAF STEM Initiative
May 2013
117
Note: Responses were recorded on a five-point Likert scale: “strongly disagree” (1), “disagree” (2), “neither agree
nor disagree” (3), “agree” (4), and “strongly agree” (5).
Table L4
Year Two Math Teacher Self-Efficacy and Beliefs (PSTEBS) and Outcome Expectancy (STOES)
by School-Level
Note: Responses were recorded on a five-point Likert scale: “strongly disagree” (1), “disagree” (2), “neither agree
nor disagree” (3), “agree” (4), and “strongly agree” (5).
Table L5
Year Two Engineering Teacher Self-Efficacy and Beliefs (PSTEBS) and Outcome Expectancy
(STOES) by School-Level
Note: Responses were recorded on a five-point Likert scale: “strongly disagree” (1), “disagree” (2), “neither agree
nor disagree” (3), “agree” (4), and “strongly agree” (5).
Table L6
Year Two Technology Teacher Self-Efficacy and Beliefs (PSTEBS) and Outcome Expectancy
(STOES) by School-Level
Elementary
Science Middle Science High Science
N 208 110 28
Personal (STEM) Teaching Efficacy
and Beliefs Scale (PSTEBS) 3.8 4.1 4.1
(STEM) Teaching Outcome
Expectancy Scale (STOES) 3.4 3.5 3.3
Scale
Mean Composite Score
Elementary
Math Middle Math High Math
N 160 67 30
Personal (STEM) Teaching Efficacy
and Beliefs Scale (PSTEBS) 4.0 4.1 4.2
(STEM) Teaching Outcome
Expectancy Scale (STOES) 3.5 3.4 3.3
Scale
Mean Composite Score
Elementary
Engineering
Middle
Engineering
High
Engineering
N 0 5 4
Personal (STEM) Teaching Efficacy
and Beliefs Scale (PSTEBS) - 4.2 4.2
(STEM) Teaching Outcome
Expectancy Scale (STOES) - 3.7 3.6

Golden LEAF STEM Initiative
May 2013
118
Note: Responses were recorded on a five-point Likert scale: “strongly disagree” (1), “disagree” (2), “neither agree
nor disagree” (3), “agree” (4), and “strongly agree” (5).
Table L7
Year Two Technology Teacher Self-Efficacy and Beliefs (PSTEBS) and Outcome Expectancy
(STOES) by Year of Experience
Note: Responses were recorded on a five-point Likert scale: “strongly disagree” (1), “disagree” (2), “neither agree
nor disagree” (3), “agree” (4), and “strongly agree” (5).
Table L8
Year Two Teacher Use of Instructional Technology by Subject Area
Scale
Mean Composite Score
Elementary
Technology
Middle
Technology
High
Technology
N 0 19 15
Personal (STEM) Teaching Efficacy
and Beliefs Scale (PSTEBS) - 4.1 3.9
(STEM) Teaching Outcome
Expectancy Scale (STOES) - 3.4 3.2
Scale
Mean Composite Score
0-3 Years 4-10 Years 11 or More
Years
N 73 165 296
Personal (STEM) Teaching Efficacy
and Beliefs Scale (PSTEBS) 4.0 4.0 4.0
(STEM) Teaching Outcome
Expectancy Scale (STOES) 3.6 3.4 3.4
During [subject area]
instructional meetings
(e.g. class periods, after
school activities, days of
summer camp, etc.), how
often do your students...
Proportion “Usually” or “Every Time”
Science Technology Engineering Math
All
Teachers
N 324 42 9 245 510 Use a variety of technologies,
e.g. productivity, data
visualization, research, and
communication tools.
52.9% 65.9% 55.6% 50.8% 55.6%
Use technology to communicate
and collaborate with others,
beyond the classroom. 27.9% 53.7% 33.3% 35.7% 33.6%

Golden LEAF STEM Initiative
May 2013
119
Note: Responses were recorded on a six-point frequency scale: “never” (1), “occasionally” (2), “about half the time”
(3), “usually” (4), “every time” (5), and “not applicable” (6).
Table L9
Year Two Frequency of Teacher Use of Instructional Technology by School-Level
Use technology to access online
resources and information as a
part of activities. 57.7% 75.6% 77.8% 48.6% 56.7%
Use the same kinds of tools that
professional researchers use,
e.g. simulations, databases,
satellite imagery.
19.7% 31.0% 55.6% 12.9% 18.3%
Work on technology-enhanced
projects that approach real-
world applications of
technology.
22.3% 60.0% 66.7% 17.8% 24.0%
Use technology to help solve
problems. 39.3% 70.7% 77.8% 47.7% 47.0%
Use technology to support
higher-order thinking, e.g.
analysis, synthesis and
evaluation of ideas and
information.
38.0% 67.5% 77.8% 39.9% 42.6%
Use technology to create new
ideas and representations of
information. 37.9% 65.0% 66.7% 37.6% 41.1%
Use a variety of technologies,
e.g. productivity, data
visualization, research, and
communication tools.
52.9% 65.9% 55.6% 50.8% 55.6%
Use technology to communicate
and collaborate with others,
beyond the classroom. 27.9% 53.7% 33.3% 35.7% 33.6%
Use technology to access online
resources and information as a
part of activities. 57.7% 75.6% 77.8% 48.6% 56.7%
During [subject area] instructional
meetings (e.g. class periods, after
school activities, days of summer
camp, etc.), how often do your
students...
Proportion “Usually” or “Every Time”
Elementary Middle High
N 229 195 75 Use a variety of technologies, e.g. productivity,
data visualization, research, and
communication tools. 51.5% 55.4% 68.0%
Use technology to communicate and collaborate
with others, beyond the classroom. 29.1% 34.9% 40.0%
Use technology to access online resources and
information as a part of activities. 54.3% 56.4% 62.7%

Golden LEAF STEM Initiative
May 2013
120
Note: Responses were recorded on a six-point frequency scale: “never” (1), “occasionally” (2), “about half the time”
(3), “usually” (4), “every time” (5), and “not applicable” (6).
Table L10
Year Two Frequency of Science Teacher Use of STEM Instructional Practices
Use the same kinds of tools that professional
researchers use, e.g. simulations, databases,
satellite imagery. 15.2% 19.2% 25.3%
Work on technology-enhanced projects that
approach real-world applications of
technology. 20.7% 25.9% 26.7%
Use technology to help solve problems. 35.4% 52.1% 69.3% Use technology to support higher-order thinking,
e.g. analysis, synthesis and evaluation of ideas
and information. 34.5% 48.2% 52.0%
Use technology to create new ideas and
representations of information. 37.9% 42.1% 45.9%
Use a variety of technologies, e.g. productivity,
data visualization, research, and
communication tools. 51.5% 55.4% 68.0%
Use technology to communicate and collaborate
with others, beyond the classroom. 29.1% 34.9% 40.0%
Use technology to access online resources and
information as a part of activities. 54.3% 56.4% 62.7%
During Science
instructional meetings
(e.g. class periods, after
school activities, days of
summer camp, etc.), how
often do your students...
Proportion
(N=325)
Never Occasionally About Half
the Time Usually
Every
Time
Develop problem-solving skills
through investigations (e.g.
scientific, design or theoretical
investigations).
1.5% 27.5% 23.1% 42.0% 5.9%
Work in small groups. 0.3% 8.1% 24.3% 53.9% 13.4% Make predictions that can be
tested. 1.5% 26.6% 24.8% 40.2% 6.8%
Make careful observations or
measurements. 1.5% 27.9% 22.3% 41.2% 7.1%
Use tools to gather data (e.g.
calculators, computers,
computer programs, scales,
rulers, compasses, etc.).
1.8% 24.0% 26.8% 38.8% 8.6%
Recognize patterns in data. 2.5% 26.0% 27.2% 41.5% 2.8% Create reasonable explanations
of results of an experiment or
investigation. 2.2% 22.3% 27.6% 40.9% 7.1%
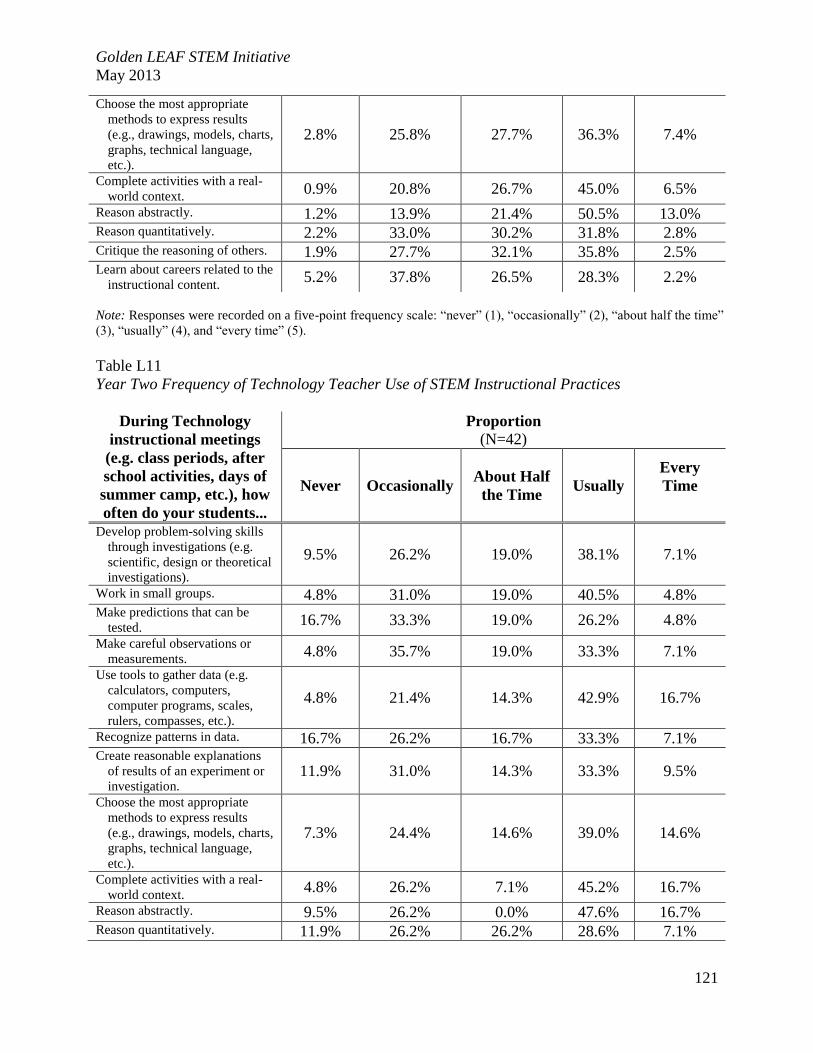
Golden LEAF STEM Initiative
May 2013
121
Note: Responses were recorded on a five-point frequency scale: “never” (1), “occasionally” (2), “about half the time”
(3), “usually” (4), and “every time” (5).
Table L11
Year Two Frequency of Technology Teacher Use of STEM Instructional Practices
Choose the most appropriate
methods to express results
(e.g., drawings, models, charts,
graphs, technical language,
etc.).
2.8% 25.8% 27.7% 36.3% 7.4%
Complete activities with a real-
world context. 0.9% 20.8% 26.7% 45.0% 6.5%
Reason abstractly. 1.2% 13.9% 21.4% 50.5% 13.0% Reason quantitatively. 2.2% 33.0% 30.2% 31.8% 2.8% Critique the reasoning of others. 1.9% 27.7% 32.1% 35.8% 2.5% Learn about careers related to the
instructional content. 5.2% 37.8% 26.5% 28.3% 2.2%
During Technology
instructional meetings
(e.g. class periods, after
school activities, days of
summer camp, etc.), how
often do your students...
Proportion
(N=42)
Never Occasionally About Half
the Time Usually
Every
Time
Develop problem-solving skills
through investigations (e.g.
scientific, design or theoretical
investigations).
9.5% 26.2% 19.0% 38.1% 7.1%
Work in small groups. 4.8% 31.0% 19.0% 40.5% 4.8% Make predictions that can be
tested. 16.7% 33.3% 19.0% 26.2% 4.8%
Make careful observations or
measurements. 4.8% 35.7% 19.0% 33.3% 7.1%
Use tools to gather data (e.g.
calculators, computers,
computer programs, scales,
rulers, compasses, etc.).
4.8% 21.4% 14.3% 42.9% 16.7%
Recognize patterns in data. 16.7% 26.2% 16.7% 33.3% 7.1% Create reasonable explanations
of results of an experiment or
investigation. 11.9% 31.0% 14.3% 33.3% 9.5%
Choose the most appropriate
methods to express results
(e.g., drawings, models, charts,
graphs, technical language,
etc.).
7.3% 24.4% 14.6% 39.0% 14.6%
Complete activities with a real-
world context. 4.8% 26.2% 7.1% 45.2% 16.7%
Reason abstractly. 9.5% 26.2% 0.0% 47.6% 16.7% Reason quantitatively. 11.9% 26.2% 26.2% 28.6% 7.1%

Golden LEAF STEM Initiative
May 2013
122
Note: Responses were recorded on a five-point frequency scale: “never” (1), “occasionally” (2), “about half the time”
(3), “usually” (4), and “every time” (5).
Table L12
Year Two Frequency of Engineering Teacher Use of STEM Instructional Practices
Note: Responses were recorded on a five-point frequency scale: “never” (1), “occasionally” (2), “about half the time”
(3), “usually” (4), and “every time” (5).
Table L12
Year Two Frequency of Mathematics Teacher Use of STEM Instructional Practices
Critique the reasoning of others. 7.3% 34.1% 22.0% 29.3% 7.3% Learn about careers related to the
instructional content. 4.8% 42.9% 11.9% 35.7% 4.8%
During Engineering
instructional meetings
(e.g. class periods, after
school activities, days of
summer camp, etc.), how
often do your students...
Proportion
(N=8)
Never Occasionally About Half
the Time Usually
Every
Time
Develop problem-solving skills
through investigations (e.g.
scientific, design or theoretical
investigations).
0.0% 12.5% 12.5% 50.0% 25.0%
Work in small groups. 0.0% 0.0% 25.0% 50.0% 25.0% Make predictions that can be
tested. 0.0% 25.0% 37.5% 37.5% 0.0%
Make careful observations or
measurements. 0.0% 12.5% 12.5% 75.0% 0.0%
Use tools to gather data (e.g.
calculators, computers,
computer programs, scales,
rulers, compasses, etc.).
0.0% 0.0% 12.5% 50.0% 37.5%
Recognize patterns in data. 0.0% 0.0% 50.0% 50.0% 0.0% Create reasonable explanations
of results of an experiment or
investigation. 0.0% 0.0% 25.0% 75.0% 0.0%
Choose the most appropriate
methods to express results
(e.g., drawings, models, charts,
graphs, technical language,
etc.).
0.0% 37.5% 25.0% 37.5% 0.0%
Complete activities with a real-
world context. 0.0% 0.0% 25.0% 62.5% 12.5%
Reason abstractly. 0.0% 0.0% 14.3% 42.9% 42.9% Reason quantitatively. 0.0% 25.0% 12.5% 62.5% 0.0% Critique the reasoning of others. 0.0% 12.5% 12.5% 75.0% 0.0% Learn about careers related to the
instructional content. 0.0% 25.0% 25.0% 37.5% 12.5%

Golden LEAF STEM Initiative
May 2013
123
Note: Responses were recorded on a five-point frequency scale: “never” (1), “occasionally” (2), “about half the time”
(3), “usually” (4), and “every time” (5).
Table L13
Year Two Frequency of Elementary School Teacher Use of STEM Instructional Practices
During Mathematics
instructional meetings
(e.g. class periods, after
school activities, days of
summer camp, etc.), how
often do your students...
Proportion
(N=245)
Never Occasionally About Half
the Time Usually
Every
Time
Develop problem-solving skills
through investigations (e.g.
scientific, design or theoretical
investigations).
3.7% 32.2% 22.9% 35.9% 5.3%
Work in small groups. 1.2% 10.8% 26.1% 51.5% 10.4% Make predictions that can be
tested. 4.5% 32.1% 24.3% 36.2% 2.9%
Make careful observations or
measurements. 4.1% 33.9% 22.9% 35.1% 4.1%
Use tools to gather data (e.g.
calculators, computers,
computer programs, scales,
rulers, compasses, etc.).
2.4% 26.4% 22.4% 41.1% 7.7%
Recognize patterns in data. 3.7% 21.3% 22.1% 48.8% 4.1% Create reasonable explanations
of results of an experiment or
investigation. 4.5% 24.9% 26.1% 38.8% 5.7%
Choose the most appropriate
methods to express results
(e.g., drawings, models, charts,
graphs, technical language,
etc.).
3.7% 23.6% 26.8% 38.6% 7.3%
Complete activities with a real-
world context. 1.2% 19.4% 28.9% 42.1% 8.3%
Reason abstractly. 1.6% 16.9% 23.5% 46.1% 11.9% Reason quantitatively. 3.7% 29.8% 30.2% 33.5% 2.9% Critique the reasoning of others. 3.7% 22.6% 29.6% 40.3% 3.7% Learn about careers related to the
instructional content. 5.3% 31.4% 31.4% 26.5% 5.3%
During instructional
meetings (e.g. class
periods, after school
activities, days of summer
camp, etc.), how often do
your students...
Proportion
(N=235)
Never Occasionally About Half
the Time Usually
Every
Time

Golden LEAF STEM Initiative
May 2013
124
Note: Responses were recorded on a five-point frequency scale: “never” (1), “occasionally” (2), “about half the time”
(3), “usually” (4), and “every time” (5).
Table L14
Year Two Frequency of Middle School Teacher Use of STEM Instructional Practices
Develop problem-solving skills
through investigations (e.g.
scientific, design or theoretical
investigations).
4.3% 29.9% 20.9% 39.7% 5.1%
Work in small groups. 1.7% 7.7% 23.6% 54.9% 12.0% Make predictions that can be
tested. 5.1% 25.2% 21.4% 43.6% 4.7%
Make careful observations or
measurements. 3.8% 29.1% 20.9% 41.9% 4.3%
Use tools to gather data (e.g.
calculators, computers,
computer programs, scales,
rulers, compasses, etc.).
3.0% 26.8% 24.7% 39.1% 6.4%
Recognize patterns in data. 4.3% 24.4% 23.1% 47.4% 0.9% Create reasonable explanations
of results of an experiment or
investigation. 5.1% 20.1% 26.5% 43.2% 5.1%
Choose the most appropriate
methods to express results
(e.g., drawings, models, charts,
graphs, technical language,
etc.).
4.7% 23.0% 28.5% 36.6% 7.2%
Complete activities with a real-
world context. 2.2% 17.7% 28.4% 44.4% 7.3%
Reason abstractly. 2.6% 13.8% 24.6% 47.8% 11.2% Reason quantitatively. 4.7% 32.2% 28.8% 31.3% 3.0% Critique the reasoning of others. 4.3% 26.7% 31.5% 34.9% 2.6% Learn about careers related to the
instructional content. 6.0% 34.9% 25.5% 29.8% 3.8%
During instructional
meetings (e.g. class
periods, after school
activities, days of summer
camp, etc.), how often do
your students...
Proportion
(N=192)
Never Occasionally About Half
the Time Usually
Every
Time
Develop problem-solving skills
through investigations (e.g.
scientific, design or theoretical
investigations).
1.0% 22.4% 26.6% 43.2% 6.8%
Work in small groups. 0.0% 12.2% 24.5% 52.1% 11.2% Make predictions that can be
tested. 2.6% 27.9% 28.9% 34.2% 6.3%
Make careful observations or
measurements. 1.6% 29.2% 21.9% 37.5% 9.9%

Golden LEAF STEM Initiative
May 2013
125
Note: Responses were recorded on a five-point frequency scale: “never” (1), “occasionally” (2), “about half the time”
(3), “usually” (4), and “every time” (5).
Table L15
Year Two Frequency of High School Teacher Use of STEM Instructional Practices
Use tools to gather data (e.g.
calculators, computers,
computer programs, scales,
rulers, compasses, etc.).
1.0% 18.8% 26.6% 40.1% 13.5%
Recognize patterns in data. 2.6% 22.5% 28.3% 40.3% 6.3% Create reasonable explanations
of results of an experiment or
investigation. 2.1% 22.5% 29.3% 35.1% 11.0%
Choose the most appropriate
methods to express results
(e.g., drawings, models, charts,
graphs, technical language,
etc.).
1.6% 24.6% 19.9% 44.5% 9.4%
Complete activities with a real-
world context. 1.0% 17.8% 24.6% 47.1% 9.4%
Reason abstractly. 1.0% 15.7% 15.2% 49.7% 18.3% Reason quantitatively. 1.6% 26.7% 33.0% 36.6% 2.1% Critique the reasoning of others. 1.6% 21.1% 33.7% 41.1% 2.6% Learn about careers related to the
instructional content. 3.7% 32.5% 31.4% 28.3% 4.2%
During instructional
meetings (e.g. class
periods, after school
activities, days of summer
camp, etc.), how often do
your students...
Proportion
(N=75)
Never Occasionally About Half
the Time Usually
Every
Time
Develop problem-solving skills
through investigations (e.g.
scientific, design or theoretical
investigations).
2.7% 26.7% 26.7% 37.3% 6.7%
Work in small groups. 1.4% 15.3% 27.8% 41.7% 13.9% Make predictions that can be
tested. 2.7% 37.8% 31.1% 27.0% 1.4%
Make careful observations or
measurements. 1.4% 33.8% 29.7% 33.8% 1.4%
Use tools to gather data (e.g.
calculators, computers,
computer programs, scales,
rulers, compasses, etc.).
1.3% 24.0% 21.3% 44.0% 9.3%
Recognize patterns in data. 5.4% 17.6% 33.8% 36.5% 6.8% Create reasonable explanations
of results of an experiment or
investigation. 2.7% 28.0% 29.3% 34.7% 5.3%

Golden LEAF STEM Initiative
May 2013
126
Note: Responses were recorded on a five-point frequency scale: “never” (1), “occasionally” (2), “about half the time”
(3), “usually” (4), and “every time” (5).
L16
Year Two Teacher Attitudes toward 21st Century Learning by Subject Area and All Teachers
Note: Responses were recorded on a five-point Likert scale: “strongly disagree” (1), “disagree” (2), “neither agree
nor disagree” (3), “agree” (4), and “strongly agree” (5). “Science” and “Math” teacher results include results from
elementary school teacher respondents who taught either science only, math only, or science and math. For
elementary teacher respondents who taught both science and math, the “All Teachers” results were calculated using
composite 21st Century Learning Attitudes score.
Table L17
Year Two Teacher Attitudes toward 21st Century Learning by School-Level
Note: Responses were recorded on a five-point Likert scale: “strongly disagree” (1), “disagree” (2), “neither agree
nor disagree” (3), “agree” (4), and “strongly agree” (5).
Table L18
Year Two Teacher Attitudes toward 21st Century Learning by Years of Experience
Choose the most appropriate
methods to express results
(e.g., drawings, models, charts,
graphs, technical language,
etc.).
2.7% 25.3% 33.3% 33.3% 5.3%
Complete activities with a real-
world context. 0.0% 22.7% 26.7% 41.3% 9.3%
Reason abstractly. 2.7% 18.7% 22.7% 44.0% 12.0% Reason quantitatively. 4.1% 33.8% 25.7% 32.4% 4.1% Critique the reasoning of others. 1.4% 28.4% 17.6% 45.9% 6.8% Learn about careers related to the
instructional content. 5.3% 42.7% 24.0% 24.0% 4.0%
Scale
Mean Composite Score
Science Technology Engineering Math
All
Teachers
N 333 42 8 245 503
21st Century Learning
Attitudes 4.4 4.4 4.4 4.4 4.4
Scale Mean Composite Score
Elementary Middle High
N 228 192 75
21st Century Learning Attitudes 4.4 4.4 4.4

Golden LEAF STEM Initiative
May 2013
127
Note: Responses were recorded on a five-point Likert scale: “strongly disagree” (1), “disagree” (2), “neither agree
nor disagree” (3), “agree” (4), and “strongly agree” (5).
Table L19
Year Two Teacher Attitudes toward Teacher Leadership by Subject Area and All Teachers
Note: Responses were recorded on a five-point Likert scale: “strongly disagree” (1), “disagree” (2), “neither agree
nor disagree” (3), “agree” (4), and “strongly agree” (5).
Table L20
Year Two Teacher Attitudes toward Teacher Leadership by School-Level
Scale
Mean Composite Score
0-3 Years 4-10 Years 11 or More
Years
N 66 158 284
21st Century Learning Attitudes 4.5 4.5 4.4
Scale
Proportion “Agree” or “Strongly Agree”
Science Technology Engineering Math
All
Teachers
N 324 42 8 246 508
Take responsibility for all
students’ learning. 82.7% 65.9% 87.5% 81.7% 81.3%
Communicate vision to
students. 99.4% 100.0% 100.0% 97.6% 98.6%
Use a variety of assessment
data throughout the year
to evaluate progress.
98.1% 97.6% 100.0% 99.2% 98.6%
Use a variety of data to
organize, plan and set
goals.
98.8% 82.9% 100.0% 98.0% 97.2%
Establish a safe and orderly
environment. 99.7% 97.6% 100.0% 99.6% 99.6%
Empower students. 99.1% 95.2% 100.0% 98.0% 98.4%
Scale Proportion “Agree” or “Strongly Agree”
Elementary Middle High
N 234 191 75
Take responsibility for all students’ learning. 83.8% 82.2% 73.0%
Communicate vision to students. 98.3% 99.0% 98.7%
Use a variety of assessment data throughout
the year to evaluate progress. 98.7% 97.9% 100.0%

Golden LEAF STEM Initiative
May 2013
128
Note: Responses were recorded on a five-point Likert scale: “strongly disagree” (1), “disagree” (2), “neither agree
nor disagree” (3), “agree” (4), and “strongly agree” (5).
Table L21
Year Two Teacher Awareness of STEM Careers by Subject Area and All Teachers
Note: Responses were recorded on a five-point Likert scale: “strongly disagree” (1), “disagree” (2), “neither agree
nor disagree” (3), “agree” (4), and “strongly agree” (5).
Table L22
Year Two Teacher Awareness of STEM Careers by School-Level
Note: Responses were recorded on a five-point Likert scale: “strongly disagree” (1), “disagree” (2), “neither agree
nor disagree” (3), “agree” (4), and “strongly agree” (5).
Use a variety of data to organize, plan and set
goals. 98.3% 96.8% 94.7%
Establish a safe and orderly environment. 99.6% 100.0% 98.7%
Empower students. 99.1% 97.4% 98.7%
I Know …
Proportion “Agree” or “Strongly Agree”
Science Technology Engineering Math
All
Teachers
N 322 40 9 244 506
About current STEM
careers. 48.4% 78.6% 87.5% 43.6% 51.4%
Where to go to learn more
about STEM careers. 49.1% 78.1% 100.0% 44.2% 52.4%
Where to find resources for
teaching students about
STEM careers.
47.5% 78.6% 75.0% 40.6% 49.6%
Where to direct students or
parents to find
information about STEM
careers.
44.1% 76.2% 87.5% 37.8% 46.9%
I Know … Proportion “Agree” or “Strongly Agree”
Elementary Middle High
N 233 189 75
About current STEM careers. 41.1% 60.8% 57.3%
Where to go to learn more about STEM careers. 39.4% 66.0% 55.6%
Where to find resources for teaching students
about STEM careers. 36.9% 62.4% 53.3%
Where to direct students or parents to find
information about STEM careers. 33.8% 59.3% 54.1%

Golden LEAF STEM Initiative
May 2013
129
Appendix M. Science Teacher Efficacy and Attitudes toward STEM (T-STEM) Survey
Item-Level Results
Table M1
Year Two Middle and High School Science Teacher Personal STEM Teaching Efficacy and
Beliefs (PSTEBS)
Survey Item
Proportion of Respondents
(N=142)
Strongly
Disagree Disagree
Neither
Agree
Nor
Disagree
Agree Strongly
Agree
1. I am continually improving my
science teaching practice. 0.0% 0.7% 0.0% 44.4% 54.9%
2. I know the steps necessary to teach
science effectively. 0.0% 0.7% 5.6% 59.2% 34.5%
3. I am confident that I can explain to
students why science experiments
work.
0.0% 0.7% 5.6% 62.0% 31.7%
4. I am confident that I can teach
science effectively. 0.0% 0.7% 7.8% 56.0% 35.5%
5. I wonder if I have the necessary
skills to teach science. 30.3% 44.4% 9.2% 12.7% 3.5%
6. I understand science concepts well
enough to be effective in teaching
science.
0.0% 0.7% 2.8% 54.9% 41.6%
7. Given a choice, I would invite a
colleague to evaluate my science
teaching.
0.0% 2.8% 9.2% 58.5% 29.6%
8. I am confident that I can answer
students’ science questions. 0.0% 1.4% 5.6% 59.9% 33.1%
9. When a student has difficulty
understanding a science concept, I
am confident that I know how to
help the student understand it
better.
0.0% 1.4% 3.5% 62.7% 32.4%
10. When teaching science, I am
confident enough to welcome
student questions.
0.0% 0.7% 2.8% 46.5% 50.0%
11. I know what to do to increase
student interest in science. 0.0% 2.1% 14.1% 49.3% 34.5%
Table M2

Golden LEAF STEM Initiative
May 2013
130
Year Two Middle and High School Science Teacher STEM Teaching Outcome Expectancy
Beliefs (STOES)
Survey Item
Proportion of Respondents
(N=141)
Strongly
Disagree Disagree
Neither
Agree
Nor
Disagree
Agree Strongly
Agree
12. When a student does better than
usual in science, it is often because
the teacher exerted a little extra
effort.
0.0% 10.6% 39.0% 41.8% 8.5%
13. The inadequacy of a student’s
science background can be
overcome by good teaching.
0.7% 3.6% 22.0% 63.8% 9.9%
14. When a student’s learning in
science is greater than expected, it
is most often due to their teacher
having found a more effective
teaching approach.
0.0% 5.0% 31.9% 56.0% 7.1%
15. The teacher is generally
responsible for students’ learning
in science.
0.0% 13.5% 41.8% 39.7% 5.0%
16. If students’ learning in science is
less than expected, it is most likely
due to ineffective science teaching.
1.4% 33.3% 45.4% 16.3% 3.6%
17. Students’ learning in science is
directly related to their teacher’s
effectiveness in science teaching.
0.0% 12.8% 39.0% 44.7% 3.6%
18. When a low achieving child
progresses more than expected in
science, it is usually due to extra
attention given by the teacher.
0.0% 7.8% 35.5% 50.4% 6.4%
19. If parents comment that their child
is showing more interest in science
at school, it is probably due to the
performance of the child’s teacher.
0.0% 4.3% 27.7% 57.5% 10.6%
20. Minimal student learning in
science can generally be attributed
to their teachers.
2.1% 25.5% 51.1% 16.3% 5.0%
Table M3
Year Two Middle and High School Science Teacher Use of Instructional Technology

Golden LEAF STEM Initiative
May 2013
131
During science instructional
meetings (e.g. class periods, after
school activities, days of summer
camp, etc.)
Proportion of Respondents
(N=140)
Never Occasi-
onally
About
Half the
Time
Usually Every
Time
Not
Applic-
able
21. Students use a variety of
technologies, e.g. productivity,
data visualization, research, and
communication tools.
0.0% 0.7% 20.0% 22.1% 45.0% 12.1%
22. Students use technology to
communicate and collaborate with
others, beyond the classroom.
0.0% 12.1% 46.4% 11.4% 20.0% 10.0%
23. Students use technology to access
online resources and information
as a part of activities.
0.0% 0.7% 21.4% 15.0% 40.0% 22.9%
24. Students use the same kinds of
tools that professional researchers
use, e.g. simulations, databases,
satellite imagery.
1.4% 10.7% 48.6% 17.1% 17.9% 4.3%
25. Students work on technology-
enhanced projects that approach
real-world applications of
technology.
0.7% 4.3% 53.6% 18.6% 17.9% 5.0%
26. Students use technology to help
solve problems. 0.0% 1.4% 36.7% 15.1% 37.4% 9.4%
27. Students use technology to support
higher-order thinking, e.g.
analysis, synthesis and evaluation
of ideas and information.
0.0% 0.7% 36.7% 18.0% 34.5% 10.1%
28. Students use technology to create
new ideas and representations of
information.
0.0% 2.9% 37.9% 19.3% 32.1% 7.9%
Table M4
Year Two Middle and High School Science Teacher Use of STEM Instructional Strategies
During science instructional
meetings (e.g. class periods, after
school activities, days of summer
camp, etc.)
Proportion of Respondents
(N=139)
Never Occasion-
ally
About
Half the
Time
Usually Every
Time
29. Develop problem-solving skills
through investigations (e.g.
scientific, design or theoretical
investigations).
0.7% 21.6% 26.6% 43.9% 7.2%

Golden LEAF STEM Initiative
May 2013
132
During science instructional
meetings (e.g. class periods, after
school activities, days of summer
camp, etc.)
Proportion of Respondents
(N=139)
Never Occasion-
ally
About
Half the
Time
Usually Every
Time
30. Work in small groups. 0.0% 8.9% 24.4% 52.6% 14.1%
31. Make predictions that can be
tested. 0.7% 26.8% 28.3% 34.8% 9.4%
32. Make careful observations or
measurements. 0.7% 26.8% 23.2% 38.4% 10.9%
33. Use tools to gather data (e.g.
calculators, computers, computer
programs, scales, rulers,
compasses, etc.).
0.7% 21.6% 28.8% 37.4% 11.5%
34. Recognize patterns in data. 2.2% 26.1% 33.3% 33.3% 5.1%
35. Create reasonable explanations of
results of an experiment or
investigation.
0.7% 24.6% 30.4% 31.9% 12.3%
36. Choose the most appropriate
methods to express results (e.g.
drawings, models, charts, graphs,
technical language, etc.).
2.2% 30.2% 23.0% 35.3% 9.4%
37. Complete activities with a real-
world context. 0.7% 22.3% 24.5% 44.6% 7.9%
38. Engage in content-driven dialogue. 0.7% 14.4% 18.0% 51.8% 15.1%
39. Reason abstractly. 1.5% 33.6% 29.9% 33.6% 1.5%
40. Reason quantitatively. 1.5% 29.0% 29.0% 38.4% 2.2%
41. Critique the reasoning of others. 6.5% 40.3% 26.6% 24.5% 2.2%
42. Learn about careers related to the
instructional content. 4.4% 38.7% 25.6% 29.9% 1.5%
Table M5
Year Two Middle and High School Science Teacher Attitudes toward 21st Century Learning
I think it is important that students
have learning opportunities to…
Proportion of Respondents
(N=139)
Strongly
Disagree Disagree
Neither
Agree
Nor
Disagree
Agree Strongly
Agree
43. Lead others to accomplish a goal. 0.0% 0.7% 6.5% 60.4% 32.4%
44. Encourage others to do their best. 0.0% 0.0% 2.2% 49.6% 48.2%
45. Produce high quality work. 0.0% 0.0% 0.0% 39.9% 60.1%
46. Respect the differences of their
peers. 0.0% 0.0% 0.7% 31.7% 67.6%

Golden LEAF STEM Initiative
May 2013
133
I think it is important that students
have learning opportunities to…
Proportion of Respondents
(N=139)
Strongly
Disagree Disagree
Neither
Agree
Nor
Disagree
Agree Strongly
Agree
47. Help their peers. 0.0% 0.0% 2.2% 47.5% 50.4%
48. Include others’ perspectives when
making decisions. 0.0% 0.0% 1.4% 45.3% 53.2%
49. Make changes when things do not
go as planned. 0.0% 0.7% 1.4% 39.6% 58.3%
50. Set their own learning goals. 0.7% 0.7% 10.8% 49.6% 38.1%
51. Manage their time wisely when
working on their own. 0.0% 0.7% 1.5% 34.8% 63.0%
52. Choose which assignment out of
many needs to be done first. 0.0% 4.4% 10.1% 51.5% 34.1%
53. Work well with students from
different backgrounds. 0.0% 0.7% 0.7% 38.0% 60.6%
Table M6
Year Two Middle and High School Science Teacher Attitudes toward Teacher Leadership
I think it is important that
teachers…
Proportion of Respondents
(N=138)
Strongly
Disagree Disagree
Neither
Agree
Nor
Disagree
Agree Strongly
Agree
54. Take responsibility for all
students’ learning. 0.7% 6.5% 11.6% 46.4% 34.8%
55. Communicate vision to students. 0.0% 0.0% 0.0% 42.0% 58.0%
56. Use a variety of assessment data
throughout the year to evaluate
progress.
0.0% 0.0% 2.2% 38.0% 59.9%
57. Use a variety of data to organize,
plan and set goals. 0.0% 0.7% 0.7% 46.0% 52.6%
58. Establish a safe and orderly
environment. 0.0% 0.0% 0.0% 21.2% 78.8%
59. Empower students. 0.0% 0.0% 0.7% 32.9% 66.4%
Table M7
Year Two Middle and High School Science Teacher Awareness of STEM Careers
I know … Proportion of Respondents
(N=137)

Golden LEAF STEM Initiative
May 2013
134
Strongly
Disagree Disagree
Neither
Agree
Nor
Disagree
Agree Strongly
Agree
60. About current STEM careers. 2.2% 15.3% 22.6% 51.1% 8.8%
61. Where to go to learn more about
STEM careers. 2.2% 18.7% 15.7% 53.0% 10.5%
62. Where to find resources for
teaching students about STEM
careers.
2.2% 16.8% 18.3% 51.1% 11.7%
63. Where to direct students or parents
to find information about STEM
careers.
2.2% 22.6% 15.3% 48.9% 11.0%

Golden LEAF STEM Initiative
May 2013
135
Appendix N. Technology Teacher Efficacy and Attitudes toward STEM (T-STEM) Survey
Item-Level Results
Table N1
Year Two Middle and High School Technology Teacher Personal STEM Teaching Efficacy and
Beliefs (PSTEBS)
Survey Item
Proportion of Respondents
(N=44)
Strongly
disagree Disagree
Neither
agree nor
disagree
Agree Strongly
agree
1. I am continually improving my
technology teaching practice. 0.0% 0.0% 2.3% 56.8% 40.9%
2. I know the steps necessary to teach
technology effectively. 0.0% 0.0% 11.4% 59.1% 29.6%
3. I am confident that I can explain to
students why technology
experiments work.
0.0% 0.0% 27.3% 54.6% 18.2%
4. I am confident that I can teach
technology effectively. 0.0% 0.0% 20.5% 43.2% 36.4%
5. I wonder if I have the necessary
skills to teach technology. 18.2% 43.2% 22.7% 13.6% 2.3%
6. I understand science concepts well
enough to be effective in teaching
technology.
0.0% 0.0% 18.2% 50.0% 31.8%
7. Given a choice, I would invite a
colleague to evaluate my
technology teaching.
0.0% 6.8% 25.0% 47.7% 20.5%
8. I am confident that I can answer
students’ technology questions. 0.0% 4.6% 29.6% 45.5% 20.5%
9. When a student has difficulty
understanding a technology
concept, I am confident that I
know how to help the student
understand it better.
0.0% 0.0% 22.7% 52.3% 25.0%
10. When teaching technology, I am
confident enough to welcome
student questions.
0.0% 0.0% 13.6% 52.3% 34.1%
11. I know what to do to increase
student interest in technology. 0.0% 4.6% 31.8% 45.5% 18.2%
Table N2
Year Two Middle and High School Technology Teacher STEM Teaching Outcome Expectancy
Beliefs (STOES)

Golden LEAF STEM Initiative
May 2013
136
Survey Item
Proportion of Respondents
(N=43)
Strongly
Disagree Disagree
Neither
Agree
Nor
Disagree
Agree Strongly
Agree
12. When a student does better than
usual in technology, it is often
because the teacher exerted a little
extra effort.
0.0% 9.3% 48.8% 34.9% 7.0%
13. The inadequacy of a student’s
technology background can be
overcome by good teaching.
0.0% 7.0% 25.6% 55.8% 11.6%
14. When a student’s learning in
technology is greater than
expected, it is most often due to
their teacher having found a more
effective teaching approach.
0.0% 11.6% 41.9% 34.9% 11.6%
15. The teacher is generally
responsible for students’ learning
in technology.
0.0% 20.9% 39.5% 37.2% 2.3%
16. If students’ learning in science is
less than expected, it is most likely
due to ineffective technology
teaching.
4.7% 32.6% 48.8% 14.0% 0.0%
17. Students’ learning in science is
directly related to their teacher’s
effectiveness in technology
teaching.
0.0% 23.3% 39.5% 34.9% 2.3%
18. When a low achieving child
progresses more than expected in
technology, it is usually due to
extra attention given by the
teacher.
0.0% 11.6% 41.9% 37.2% 9.3%
19. If parents comment that their child
is showing more interest in
technology at school, it is probably
due to the performance of the
child’s teacher.
0.0% 11.6% 39.5% 44.2% 4.7%
20. Minimal student learning in
technology can generally be
attributed to their teachers.
0.0% 16.3% 60.5% 23.3% 0.0%
Table N3
Year Two Middle and High School Technology Teacher Use of Instructional Technology

Golden LEAF STEM Initiative
May 2013
137
During technology instructional
meetings (e.g. class periods, after
school activities, days of summer
camp, etc.)
Proportion of Respondents
(N=43)
Never Occasi-
onally
About
Half the
Time
Usually Every
Time
Not
Applic-
able
21. Students use a variety of
technologies, e.g. productivity,
data visualization, research, and
communication tools.
4.7% 0.0% 20.9% 18.6% 30.2% 25.6%
22. Students use technology to
communicate and collaborate with
others, beyond the classroom.
7.0% 9.3% 32.6% 9.3% 27.9% 14.0%
23. Students use technology to access
online resources and information
as a part of activities.
2.3% 0.0% 25.6% 7.0% 30.2% 34.9%
24. Students use the same kinds of
tools that professional researchers
use, e.g. simulations, databases,
satellite imagery.
2.3% 27.9% 30.2% 11.6% 14.0% 14.0%
25. Students work on technology-
enhanced projects that approach
real-world applications of
technology.
4.7% 2.3% 32.6% 9.3% 23.3% 27.9%
26. Students use technology to help
solve problems. 4.7% 0.0% 25.6% 9.3% 30.2% 30.2%
27. Students use technology to support
higher-order thinking, e.g.
analysis, synthesis and evaluation
of ideas and information.
7.0% 0.0% 25.6% 9.3% 34.9% 23.3%
28. Students use technology to create
new ideas and representations of
information.
2.4% 0.0% 23.8% 21.4% 31.0% 21.4%
Table N4
Year Two Middle and High School Technology Teacher Use of STEM Instructional Strategies
During technology instructional
meetings (e.g. class periods, after
school activities, days of summer
camp, etc.)
Proportion of Respondents
(N=43)
Never Occasion-
ally
About
Half the
Time
Usually Every
Time

Golden LEAF STEM Initiative
May 2013
138
During technology instructional
meetings (e.g. class periods, after
school activities, days of summer
camp, etc.)
Proportion of Respondents
(N=43)
Never Occasion-
ally
About
Half the
Time
Usually Every
Time
29. Develop problem-solving skills
through investigations (e.g.
scientific, design or theoretical
investigations).
14.0% 30.2% 18.6% 32.6% 4.7%
30. Work in small groups. 2.3% 34.9% 20.9% 37.2% 4.7%
31. Make predictions that can be
tested. 18.6% 34.9% 20.9% 20.9% 4.7%
32. Make careful observations or
measurements. 9.3% 34.9% 16.3% 32.6% 7.0%
33. Use tools to gather data (e.g.
calculators, computers, computer
programs, scales, rulers,
compasses, etc.).
11.6% 30.2% 9.3% 37.2% 11.6%
34. Recognize patterns in data. 20.9% 30.2% 14.0% 27.9% 7.0%
35. Create reasonable explanations of
results of an experiment or
investigation.
18.6% 30.2% 11.6% 30.2% 9.3%
36. Choose the most appropriate
methods to express results (e.g.
drawings, models, charts, graphs,
technical language, etc.).
11.9% 26.2% 14.3% 38.1% 9.5%
37. Complete activities with a real-
world context. 4.7% 30.2% 9.3% 46.5% 9.3%
38. Engage in content-driven dialogue. 11.6% 30.2% 0.0% 44.2% 14.0%
39. Reason abstractly. 16.3% 25.6% 27.9% 25.6% 4.7%
40. Reason quantitatively. 14.3% 33.3% 23.8% 21.4% 7.1%
41. Critique the reasoning of others. 4.7% 46.5% 14.0% 30.2% 4.7%
42. Learn about careers related to the
instructional content. 4.7% 32.6% 16.3% 34.9% 11.6%
Table N5
Year Two Middle and High School Technology Teacher Attitudes toward 21st Century Learning
I think it is important that students
have learning opportunities to…
Proportion of Respondents
(N=43)
Strongly
Disagree Disagree
Neither
Agree
Nor
Disagree
Agree Strongly
Agree
43. Lead others to accomplish a goal. 0.0% 0.0% 11.6% 44.2% 44.2%

Golden LEAF STEM Initiative
May 2013
139
I think it is important that students
have learning opportunities to…
Proportion of Respondents
(N=43)
Strongly
Disagree Disagree
Neither
Agree
Nor
Disagree
Agree Strongly
Agree
44. Encourage others to do their best. 0.0% 0.0% 7.0% 44.2% 48.8%
45. Produce high quality work. 0.0% 0.0% 2.3% 44.2% 53.5%
46. Respect the differences of their
peers. 0.0% 0.0% 0.0% 41.9% 58.1%
47. Help their peers. 0.0% 0.0% 4.7% 51.2% 44.2%
48. Include others’ perspectives when
making decisions. 0.0% 2.3% 2.3% 51.2% 44.2%
49. Make changes when things do not
go as planned. 0.0% 2.3% 0.0% 41.9% 55.8%
50. Set their own learning goals. 0.0% 0.0% 14.0% 44.2% 41.9%
51. Manage their time wisely when
working on their own. 0.0% 0.0% 7.1% 50.0% 42.9%
52. Choose which assignment out of
many needs to be done first. 0.0% 7.1% 9.5% 45.2% 38.1%
53. Work well with students from
different backgrounds. 0.0% 2.3% 2.3% 48.8% 46.5%
Table N6
Year Two Middle and High School Technology Teacher Attitudes toward Teacher Leadership
I think it is important that
teachers…
Proportion of Respondents
(N=43)
Strongly
Disagree Disagree
Neither
Agree
Nor
Disagree
Agree Strongly
Agree
54. Take responsibility for all
students’ learning. 7.1% 9.5% 11.9% 42.9% 28.6%
55. Communicate vision to students. 0.0% 0.0% 0.0% 46.5% 53.5%
56. Use a variety of assessment data
throughout the year to evaluate
progress.
0.0% 0.0% 2.3% 51.2% 46.5%
57. Use a variety of data to organize,
plan and set goals. 0.0% 0.0% 14.3% 40.5% 45.2%
58. Establish a safe and orderly
environment. 0.0% 0.0% 2.4% 33.3% 64.3%
59. Empower students. 0.0% 2.3% 4.7% 41.9% 51.2%
Table N7

Golden LEAF STEM Initiative
May 2013
140
Year Two Middle and High School Technology Teacher Awareness of STEM Careers
I know …
Proportion of Respondents
(N=43)
Strongly
Disagree Disagree
Neither
Agree
Nor
Disagree
Agree Strongly
Agree
60. About current STEM careers. 4.7% 2.3% 18.6% 41.9% 32.6%
61. Where to go to learn more about
STEM careers. 4.8% 2.4% 21.4% 40.5% 31.0%
62. Where to find resources for
teaching students about STEM
careers.
4.7% 4.7% 18.6% 46.5% 25.6%
63. Where to direct students or parents
to find information about STEM
careers.
4.7% 4.7% 20.9% 41.9% 27.9%

Golden LEAF STEM Initiative
May 2013
141
Appendix O. Engineering Teacher Efficacy and Attitudes toward STEM (T-STEM) Survey
Table O1
Year Two Middle and High School Engineering Teacher Personal STEM Teaching Efficacy and
Beliefs (PSTEBS)
Survey Item
Proportion of Respondents
(N=8)
Strongly
Disagree Disagree
Neither
Agree
Nor
Disagree
Agree Strongly
Agree
1. I am continually improving my
engineering teaching practice. 0.0% 0.0% 0.0% 50.0% 50.0%
2. I know the steps necessary to teach
engineering effectively. 0.0% 0.0% 0.0% 75.0% 25.0%
3. I am confident that I can explain to
students why engineering
experiments work.
0.0% 0.0% 0.0% 62.5% 37.5%
4. I am confident that I can teach
engineering effectively. 0.0% 0.0% 12.5% 50.0% 37.5%
5. I wonder if I have the necessary
skills to teach engineering. 25.0% 12.5% 12.5% 50.0% 0.0%
6. I understand science concepts well
enough to be effective in teaching
engineering.
0.0% 0.0% 0.0% 75.0% 25.0%
7. Given a choice, I would invite a
colleague to evaluate my
engineering teaching.
0.0% 0.0% 0.0% 50.0% 50.0%
8. I am confident that I can answer
students’ engineering questions. 0.0% 0.0% 0.0% 62.5% 37.5%
9. When a student has difficulty
understanding an engineering
concept, I am confident that I
know how to help the student
understand it better.
0.0% 0.0% 0.0% 62.5% 37.5%
10. When teaching engineering, I am
confident enough to welcome
student questions.
0.0% 0.0% 0.0% 50.0% 50.0%
11. I know what to do to increase
student interest in engineering. 0.0% 12.5% 0.0% 37.5% 50.0%

Golden LEAF STEM Initiative
May 2013
142
Table O2
Year Two Middle and High School Engineering Teacher STEM Teaching Outcome Expectancy
Beliefs (STOES)
Survey Item
Proportion of Respondents
(N=8)
Strongly
Disagree Disagree
Neither
Agree
Nor
Disagree
Agree Strongly
Agree
12. When a student does better than
usual in engineering, it is often
because the teacher exerted a little
extra effort.
0.0% 25.0% 0.0% 50.0% 25.0%
13. The inadequacy of a student’s
engineering background can be
overcome by good teaching.
0.0% 0.0% 12.5% 62.5% 25.0%
14. When a student’s learning in
engineering is greater than
expected, it is most often due to
their teacher having found a more
effective teaching approach.
0.0% 25.0% 0.0% 50.0% 25.0%
15. The teacher is generally
responsible for students’ learning
in engineering.
0.0% 12.5% 12.5% 62.5% 12.5%
16. If students’ learning in science is
less than expected, it is most likely
due to ineffective engineering
teaching.
0.0% 37.5% 25.0% 25.0% 12.5%
17. Students’ learning in science is
directly related to their teacher’s
effectiveness in engineering
teaching.
0.0% 12.5% 50.0% 25.0% 12.5%
18. When a low achieving child
progresses more than expected in
engineering, it is usually due to
extra attention given by the
teacher.
0.0% 0.0% 12.5% 75.0% 12.5%
19. If parents comment that their child
is showing more interest in
engineering at school, it is
probably due to the performance of
the child’s teacher.
0.0% 0.0% 12.5% 62.5% 25.0%
20. Minimal student learning in
engineering can generally be
attributed to their teachers.
0.0% 25.0% 62.5% 12.5% 0.0%

Golden LEAF STEM Initiative
May 2013
143
Table O3
Year Two Middle and High School Engineering Teacher Use of Instructional Technology
During engineering instructional
meetings (e.g. class periods, after
school activities, days of summer
camp, etc.)
Proportion of Respondents
(N=24)
Never Occasi-
onally
About
Half the
Time
Usually Every
Time
Not
Applic-
able
21. Students use a variety of
technologies, e.g. productivity,
data visualization, research, and
communication tools.
4.2% 0.0% 12.5% 20.8% 33.3% 29.2%
22. Students use technology to
communicate and collaborate with
others, beyond the classroom.
4.2% 16.7% 20.8% 20.8% 25.0% 12.5%
23. Students use technology to access
online resources and information
as a part of activities.
4.2% 0.0% 8.3% 12.5% 33.3% 41.7%
24. Students use the same kinds of
tools that professional researchers
use, e.g. simulations, databases,
satellite imagery.
0.0% 12.5% 37.5% 12.5% 16.7% 20.8%
25. Students work on technology-
enhanced projects that approach
real-world applications of
technology.
4.2% 4.2% 16.7% 16.7% 25.0% 33.3%
26. Students use technology to help
solve problems. 4.2% 0.0% 12.5% 16.7% 29.2% 37.5%
27. Students use technology to support
higher-order thinking, e.g.
analysis, synthesis and evaluation
of ideas and information.
4.2% 0.0% 16.7% 16.7% 37.5% 25.0%
28. Students use technology to create
new ideas and representations of
information.
4.2% 4.2% 12.5% 25.0% 33.3% 20.8%
Table O4
Year Two Middle and High School Engineering Teacher Use of STEM Instructional Strategies
During engineering instructional
meetings (e.g. class periods, after
school activities, days of summer
camp, etc.)
Proportion of Respondents
(N=23)
Never Occasion-
ally
About
Half the
Time
Usually Every
Time

Golden LEAF STEM Initiative
May 2013
144
During engineering instructional
meetings (e.g. class periods, after
school activities, days of summer
camp, etc.)
Proportion of Respondents
(N=23)
Never Occasion-
ally
About
Half the
Time
Usually Every
Time
29. Develop problem-solving skills
through investigations (e.g.
scientific, design or theoretical
investigations).
0.0% 8.7% 30.4% 47.8% 13.0%
30. Work in small groups. 0.0% 13.0% 17.4% 56.5% 13.0%
31. Make predictions that can be
tested. 4.4% 30.4% 30.4% 30.4% 4.4%
32. Make careful observations or
measurements. 0.0% 13.0% 30.4% 47.8% 8.7%
33. Use tools to gather data (e.g.
calculators, computers, computer
programs, scales, rulers,
compasses, etc.).
0.0% 8.7% 26.1% 43.5% 21.7%
34. Recognize patterns in data. 4.4% 13.0% 34.8% 39.1% 8.7%
35. Create reasonable explanations of
results of an experiment or
investigation.
4.4% 13.0% 34.8% 39.1% 8.7%
36. Choose the most appropriate
methods to express results (e.g.
drawings, models, charts, graphs,
technical language, etc.).
4.4% 21.7% 34.8% 30.4% 8.7%
37. Complete activities with a real-
world context. 0.0% 13.0% 17.4% 56.5% 13.0%
38. Engage in content-driven dialogue. 4.4% 4.4% 13.0% 60.9% 17.4%
39. Reason abstractly. 8.7% 13.0% 34.8% 39.1% 4.4%
40. Reason quantitatively. 0.0% 22.7% 22.7% 50.0% 4.6%
41. Critique the reasoning of others. 0.0% 26.1% 34.8% 30.4% 8.7%
42. Learn about careers related to the
instructional content. 0.0% 13.0% 26.1% 47.8% 13.0%
Table O5
Year Two Middle and High School Engineering Teacher Attitudes toward 21st Century Learning
I think it is important that students
have learning opportunities to…
Proportion of Respondents
(N=23)
Strongly
Disagree Disagree
Neither
Agree
Nor
Disagree
Agree Strongly
Agree
43. Lead others to accomplish a goal. 0.0% 0.0% 0.0% 60.9% 39.1%
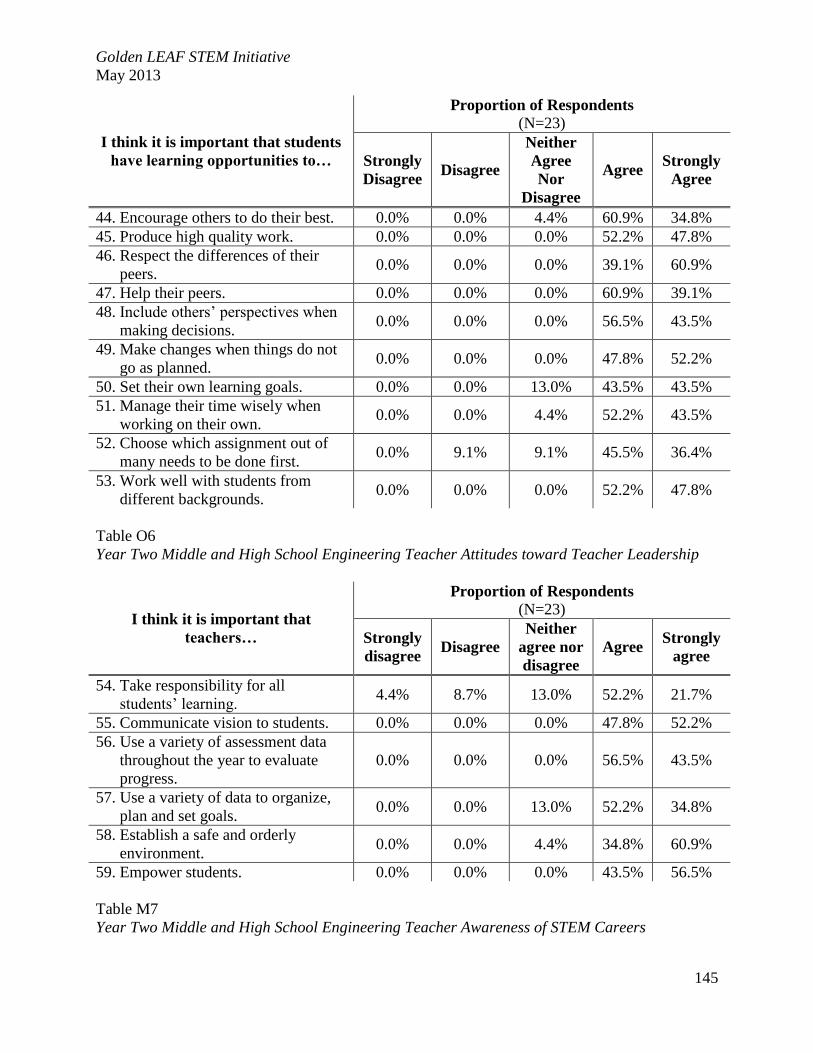
Golden LEAF STEM Initiative
May 2013
145
I think it is important that students
have learning opportunities to…
Proportion of Respondents
(N=23)
Strongly
Disagree Disagree
Neither
Agree
Nor
Disagree
Agree Strongly
Agree
44. Encourage others to do their best. 0.0% 0.0% 4.4% 60.9% 34.8%
45. Produce high quality work. 0.0% 0.0% 0.0% 52.2% 47.8%
46. Respect the differences of their
peers. 0.0% 0.0% 0.0% 39.1% 60.9%
47. Help their peers. 0.0% 0.0% 0.0% 60.9% 39.1%
48. Include others’ perspectives when
making decisions. 0.0% 0.0% 0.0% 56.5% 43.5%
49. Make changes when things do not
go as planned. 0.0% 0.0% 0.0% 47.8% 52.2%
50. Set their own learning goals. 0.0% 0.0% 13.0% 43.5% 43.5%
51. Manage their time wisely when
working on their own. 0.0% 0.0% 4.4% 52.2% 43.5%
52. Choose which assignment out of
many needs to be done first. 0.0% 9.1% 9.1% 45.5% 36.4%
53. Work well with students from
different backgrounds. 0.0% 0.0% 0.0% 52.2% 47.8%
Table O6
Year Two Middle and High School Engineering Teacher Attitudes toward Teacher Leadership
I think it is important that
teachers…
Proportion of Respondents
(N=23)
Strongly
disagree Disagree
Neither
agree nor
disagree
Agree Strongly
agree
54. Take responsibility for all
students’ learning. 4.4% 8.7% 13.0% 52.2% 21.7%
55. Communicate vision to students. 0.0% 0.0% 0.0% 47.8% 52.2%
56. Use a variety of assessment data
throughout the year to evaluate
progress.
0.0% 0.0% 0.0% 56.5% 43.5%
57. Use a variety of data to organize,
plan and set goals. 0.0% 0.0% 13.0% 52.2% 34.8%
58. Establish a safe and orderly
environment. 0.0% 0.0% 4.4% 34.8% 60.9%
59. Empower students. 0.0% 0.0% 0.0% 43.5% 56.5%
Table M7
Year Two Middle and High School Engineering Teacher Awareness of STEM Careers

Golden LEAF STEM Initiative
May 2013
146
I know …
Proportion of Respondents
(N=23)
Strongly
Disagree Disagree
Neither
Agree
Nor
Disagree
Agree Strongly
Agree
60. About current STEM careers. 0.0% 0.0% 4.4% 65.2% 30.4%
61. Where to go to learn more about
STEM careers. 0.0% 4.4% 4.4% 60.9% 30.4%
62. Where to find resources for
teaching students about STEM
careers.
0.0% 4.4% 17.4% 52.2% 26.1%
63. Where to direct students or parents
to find information about STEM
careers.
0.0% 4.4% 13.0% 56.5% 26.1%

Golden LEAF STEM Initiative
May 2013
147
Appendix P. Mathematics Teacher Efficacy and Attitudes toward STEM (T-STEM)
Survey
Table P1
Year Two Middle and High School Mathematics Teacher Personal STEM Teaching Efficacy and
Beliefs (PSTEBS)
Survey Question
Proportion of Respondents
(N=99)
Strongly
Disagree Disagree
Neither
Agree
Nor
Disagree
Agree Strongly
Agree
1. I am continually improving my
mathematics teaching practice. 1.0% 0.0% 1.0% 45.5% 52.5%
2. I know the steps necessary to teach
mathematics effectively. 1.0% 0.0% 3.0% 46.5% 49.5%
3. I am confident that I can explain to
students why mathematics
experiments work.
1.0% 0.0% 5.1% 49.5% 44.4%
4. I am confident that I can teach
mathematics effectively. 1.0% 0.0% 3.0% 42.4% 53.5%
5. I wonder if I have the necessary
skills to teach mathematics. 40.4% 35.4% 12.1% 8.1% 4.0%
6. I understand science concepts well
enough to be effective in teaching
mathematics.
1.0% 2.0% 1.0% 40.4% 55.6%
7. Given a choice, I would invite a
colleague to evaluate my
mathematics teaching.
2.0% 2.0% 9.2% 51.0% 35.7%
8. I am confident that I can answer
students’ mathematics questions. 1.0% 0.0% 5.1% 37.4% 56.6%
9. When a student has difficulty
understanding a mathematics
concept, I am confident that I
know how to help the student
understand it better.
1.0% 0.0% 3.0% 51.5% 44.4%
10. When teaching mathematics, I am
confident enough to welcome
student questions.
1.0% 0.0% 1.0% 32.3% 65.7%
11. I know what to do to increase
student interest in mathematics. 1.0% 4.0% 21.2% 49.5% 24.2%
Table P2

Golden LEAF STEM Initiative
May 2013
148
Year Two Middle and High School Mathematics Teacher STEM Teaching Outcome Expectancy
Beliefs (STOES)
Survey Question
Proportion of Respondents
(N=97)
Strongly
Disagree Disagree
Neither
Agree
Nor
Disagree
Agree Strongly
Agree
12. When a student does better than
usual in mathematics, it is often
because the teacher exerted a little
extra effort.
1.0% 8.3% 38.1% 45.4% 7.2%
13. The inadequacy of a student’s
mathematics background can be
overcome by good teaching.
1.0% 9.4% 28.1% 55.2% 6.3%
14. When a student’s learning in
mathematics is greater than
expected, it is most often due to
their teacher having found a more
effective teaching approach.
1.0% 6.3% 27.1% 56.3% 9.4%
15. The teacher is generally
responsible for students’ learning
in mathematics.
3.1% 8.3% 32.3% 51.0% 5.2%
16. If students’ learning in
mathematics is less than expected,
it is most likely due to ineffective
science teaching.
7.3% 34.4% 35.4% 22.9% 0.0%
17. Students’ learning in mathematics
is directly related to their teacher’s
effectiveness in science teaching.
3.1% 9.4% 35.4% 49.0% 3.1%
18. When a low achieving child
progresses more than expected in
mathematics, it is usually due to
extra attention given by the
teacher.
2.1% 6.3% 30.2% 52.1% 9.4%
19. If parents comment that their child
is showing more interest in
mathematics at school, it is
probably due to the performance of
the child’s teacher.
1.0% 5.2% 21.9% 62.5% 9.4%
20. Minimal student learning in
mathematics can generally be
attributed to their teachers.
9.4% 29.2% 39.6% 21.9% 0.0%
Table P3

Golden LEAF STEM Initiative
May 2013
149
Year Two Middle and High School Mathematics Teacher Use of Instructional Technology
During mathematics instructional
meetings (e.g. class periods, after
school activities, days of summer
camp, etc.)
Proportion of Respondents
(N=94)
Never Occasi-
onally
About
Half the
Time
Usually Every
Time
Not
Applic-
able
21. Students use a variety of
technologies, e.g. productivity,
data visualization, research, and
communication tools.
0.0% 3.2% 19.2% 16.0% 41.5% 20.2%
22. Students use technology to
communicate and collaborate with
others, beyond the classroom.
0.0% 13.8% 29.8% 12.8% 34.0% 9.6%
23. Students use technology to access
online resources and information
as a part of activities.
0.0% 3.2% 29.8% 22.3% 26.6% 18.1%
24. Students use the same kinds of
tools that professional researchers
use, e.g. simulations, databases,
satellite imagery.
1.1% 17.0% 55.3% 17.0% 7.5% 2.1%
25. Students work on technology-
enhanced projects that approach
real-world applications of
technology.
0.0% 11.7% 51.1% 21.3% 10.6% 5.3%
26. Students use technology to help
solve problems. 0.0% 2.1% 12.8% 20.2% 40.4% 24.5%
27. Students use technology to support
higher-order thinking, e.g.
analysis, synthesis and evaluation
of ideas and information.
0.0% 2.1% 25.5% 24.5% 35.1% 12.8%
28. Students use technology to create
new ideas and representations of
information.
0.0% 7.5% 22.3% 28.7% 29.8% 11.7%
Table O4
Year Two Middle and High School Mathematics Teacher Use of STEM Instructional Strategies
During Mathematics instructional
meetings (e.g. class periods, after
school activities, days of summer
camp, etc.)
Proportion of Respondents
(N=92)
Never Occasion-
ally
About
Half the
Time
Usually Every
Time
29. Develop problem-solving skills
through investigations (e.g. 0.0% 27.2% 28.3% 40.2% 4.4%

Golden LEAF STEM Initiative
May 2013
150
During Mathematics instructional
meetings (e.g. class periods, after
school activities, days of summer
camp, etc.)
Proportion of Respondents
(N=92)
Never Occasion-
ally
About
Half the
Time
Usually Every
Time
scientific, design or theoretical
investigations).
30. Work in small groups. 0.0% 12.4% 30.3% 44.9% 12.4%
31. Make predictions that can be
tested. 2.2% 33.3% 33.3% 30.0% 1.1%
32. Make careful observations or
measurements. 2.2% 35.9% 26.1% 31.5% 4.4%
33. Use tools to gather data (e.g.
calculators, computers, computer
programs, scales, rulers,
compasses, etc.).
0.0% 17.4% 25.0% 47.8% 9.8%
34. Recognize patterns in data. 0.0% 12.1% 26.4% 51.7% 9.9%
35. Create reasonable explanations of
results of an experiment or
investigation.
1.1% 21.7% 31.5% 38.0% 7.6%
36. Choose the most appropriate
methods to express results (e.g.
drawings, models, charts, graphs,
technical language, etc.).
0.0% 16.3% 27.2% 50.0% 6.5%
37. Complete activities with a real-
world context. 0.0% 12.1% 31.9% 45.1% 11.0%
38. Engage in content-driven dialogue. 0.0% 17.4% 21.7% 44.6% 16.3%
39. Reason abstractly. 0.0% 22.8% 31.5% 42.4% 3.3%
40. Reason quantitatively. 0.0% 11.0% 29.7% 53.9% 5.5%
41. Critique the reasoning of others. 1.1% 25.3% 37.4% 27.5% 8.8%
42. Learn about careers related to the
instructional content. 2.2% 48.9% 29.4% 19.6% 0.0%
Table P5
Year Two Middle and High School Mathematics Teacher Attitudes toward 21st Century
Learning
I think it is important that students
have learning opportunities to…
Proportion of Respondents
(N=92)
Strongly
Disagree Disagree
Neither
Agree
Nor
Disagree
Agree Strongly
Agree
43. Lead others to accomplish a goal. 0.0% 0.0% 7.6% 58.7% 33.7%
44. Encourage others to do their best. 0.0% 0.0% 3.3% 48.9% 47.8%

Golden LEAF STEM Initiative
May 2013
151
I think it is important that students
have learning opportunities to…
Proportion of Respondents
(N=92)
Strongly
Disagree Disagree
Neither
Agree
Nor
Disagree
Agree Strongly
Agree
45. Produce high quality work. 0.0% 0.0% 2.2% 38.0% 59.8%
46. Respect the differences of their
peers. 0.0% 0.0% 2.2% 42.9% 55.0%
47. Help their peers. 0.0% 0.0% 4.4% 55.0% 40.7%
48. Include others’ perspectives when
making decisions. 0.0% 0.0% 2.2% 53.3% 44.6%
49. Make changes when things do not
go as planned. 0.0% 0.0% 2.2% 40.2% 57.6%
50. Set their own learning goals. 0.0% 5.4% 6.5% 55.4% 32.6%
51. Manage their time wisely when
working on their own. 0.0% 0.0% 2.2% 41.3% 56.5%
52. Choose which assignment out of
many needs to be done first. 0.0% 2.2% 7.6% 55.4% 34.8%
53. Work well with students from
different backgrounds. 0.0% 0.0% 3.3% 42.4% 54.4%
Table P6
Year Two Middle and High School Mathematics Teacher Attitudes toward Teacher Leadership
I think it is important that
teachers…
Proportion of Respondents
(N=92)
Strongly
Disagree Disagree
Neither
Agree
Nor
Disagree
Agree Strongly
Agree
54. Take responsibility for all
students’ learning. 0.0% 7.6% 9.8% 54.4% 28.3%
55. Communicate vision to students. 0.0% 1.1% 2.2% 54.4% 42.4%
56. Use a variety of assessment data
throughout the year to evaluate
progress.
0.0% 0.0% 0.0% 48.9% 51.1%
57. Use a variety of data to organize,
plan and set goals. 0.0% 0.0% 2.2% 51.1% 46.7%
58. Establish a safe and orderly
environment. 0.0% 0.0% 0.0% 34.8% 65.2%
59. Empower students. 0.0% 0.0% 3.3% 43.5% 53.3%
Table P7
Year Two Middle and High School Mathematics Teacher Awareness of STEM Careers

Golden LEAF STEM Initiative
May 2013
152
I know …
Proportion of Respondents
(N=91)
Strongly
Disagree Disagree
Neither
Agree
Nor
Disagree
Agree Strongly
Agree
60. About current STEM careers. 0.0% 22.0% 27.5% 45.1% 5.5%
61. Where to go to learn more about
STEM careers. 1.1% 19.8% 24.2% 45.1% 9.9%
62. Where to find resources for
teaching students about STEM
careers.
0.0% 27.5% 24.2% 41.8% 6.6%
63. Where to direct students or parents
to find information about STEM
careers.
2.2% 24.4% 26.7% 40.0% 6.7%

Golden LEAF STEM Initiative
May 2013
153
Appendix Q. Elementary Teacher Efficacy and Attitudes toward STEM (T-STEM) Survey
Table Q1
Year Two Elementary Teacher Personal STEM Teaching Efficacy and Beliefs (PSTEBS) –
Mathematics
Survey Item
Proportion of Respondents
(N=159)
Strongly
Disagree Disagree
Neither
Agree
Nor
Disagree
Agree Strongly
Agree
1. I am continually improving my
mathematics teaching practice. 0.0% 0.6% 3.8% 59.1% 36.5%
2. I know the steps necessary to teach
mathematics effectively. 0.0% 1.9% 6.9% 67.9% 23.3%
3. I am confident that I can explain to
students why mathematics
experiments work.
0.6% 1.3% 10.1% 69.8% 18.2%
4. I am confident that I can teach
mathematics effectively. 0.6% 0.6% 7.0% 70.3% 21.5%
5. I wonder if I have the necessary
skills to teach mathematics. 14.5% 43.4% 21.4% 18.2% 2.5%
6. I understand mathematics concepts
well enough to be effective in
teaching mathematics.
0.0% 1.3% 5.0% 67.9% 25.8%
7. Given a choice, I would invite a
colleague to evaluate my
mathematics teaching.
1.3% 3.1% 17.6% 62.9% 15.1%
8. I am confident that I can answer
students’ mathematics questions. 0.0% 0.6% 5.0% 70.4% 23.9%
9. When a student has difficulty
understanding a mathematics
concept, I am confident that I
know how to help the student
understand it better.
0.0% 1.9% 6.3% 74.2% 17.6%
10. When teaching mathematics, I am
confident enough to welcome
student questions.
0.0% 0.6% 4.4% 63.5% 31.5%
11. I know what to do to increase
student interest in mathematics. 0.6% 2.5% 13.2% 64.8% 18.9%

Golden LEAF STEM Initiative
May 2013
154
Table Q2
Year Two Elementary Teacher STEM Teaching Outcome Expectancy Beliefs (STOES) –
Mathematics
Survey Item
Proportion of Respondents
(N=158)
Strongly
Disagree Disagree
Neither
Agree nor
Disagree
Agree Strongly
Agree
12. When a student does better than
usual in mathematics, it is often
because the teacher exerted a little
extra effort.
0.6% 6.4% 35.7% 52.9% 4.5%
13. The inadequacy of a student’s
mathematics background can be
overcome by good teaching.
0.6% 3.8% 30.6% 58.6% 6.4%
14. When a student’s learning in
mathematics is greater than
expected, it is most often due to
their teacher having found a more
effective teaching approach.
0.0% 5.1% 32.5% 55.4% 7.0%
15. The teacher is generally
responsible for students’ learning
in mathematics.
0.0% 8.2% 29.8% 55.7% 6.3%
16. If students’ learning in
mathematics is less than expected,
it is most likely due to ineffective
mathematics teaching.
0.0% 18.5% 52.9% 24.8% 3.8%
17. Students’ learning in mathematics
is directly related to their teacher’s
effectiveness in mathematics
teaching.
0.0% 8.9% 41.1% 44.9% 5.1%
18. When a low achieving child
progresses more than expected in
mathematics, it is usually due to
extra attention given by the
teacher.
0.6% 4.4% 31.7% 58.2% 5.1%
19. If parents comment that their child
is showing more interest in
mathematics at school, it is
probably due to the performance of
the child’s teacher.
0.0% 3.8% 38.0% 53.2% 5.1%
20. Minimal student learning in
mathematics can generally be
attributed to their teachers.
0.6% 13.9% 51.3% 30.4% 3.8%

Golden LEAF STEM Initiative
May 2013
155
Table Q3
Year Two Elementary Teacher Personal STEM Teaching Efficacy and Beliefs (PSTEBS) –
Science
Survey Item
Proportion of Respondents
(N=205)
Strongly
Disagree Disagree
Neither
Agree nor
Disagree
Agree Strongly
Agree
21. I am continually improving my
science teaching practice. 0.0% 1.0% 4.4% 62.4% 32.2%
22. I know the steps necessary to teach
science effectively. 0.0% 3.4% 14.6% 72.7% 9.3%
23. I am confident that I can explain to
students why science experiments
work.
0.0% 4.4% 17.6% 66.3% 11.7%
24. I am confident that I can teach
science effectively. 0.0% 3.4% 10.2% 76.1% 10.2%
25. I wonder if I have the necessary
skills to teach science. 10.2% 38.1% 27.8% 22.4% 1.5%
26. I understand science concepts well
enough to be effective in teaching
science.
0.0% 4.4% 13.7% 71.7% 10.2%
27. Given a choice, I would invite a
colleague to evaluate my science
teaching.
1.5% 8.3% 25.9% 57.1% 7.3%
28. I am confident that I can answer
students’ science questions. 0.0% 3.9% 18.5% 69.3% 8.3%
29. When a student has difficulty
understanding a science concept, I
am confident that I know how to
help the student understand it
better.
0.0% 5.9% 14.6% 70.7% 8.8%
30. When teaching science, I am
confident enough to welcome
student questions.
0.0% 2.0% 10.2% 70.2% 17.6%
31. I know what to do to increase
student interest in science. 0.0% 2.4% 15.1% 69.3% 13.2%
Table Q4
Year Two Elementary Teacher STEM Teaching Outcome Expectancy Beliefs (STOES) – Science
Survey Item Proportion of Respondents
(N=203)

Golden LEAF STEM Initiative
May 2013
156
Strongly
Disagree Disagree
Neither
Agree nor
Disagree
Agree Strongly
Agree
32. When a student does better than
usual in science, it is often because
the teacher exerted a little extra
effort.
0.0% 7.9% 46.8% 37.9% 7.4%
33. The inadequacy of a student’s
science background can be
overcome by good teaching.
0.0% 3.9% 22.7% 64.5% 8.9%
34. When a student’s learning in
science is greater than expected, it
is most often due to their teacher
having found a more effective
teaching approach.
0.0% 3.0% 37.0% 55.2% 4.9%
35. The teacher is generally
responsible for students’ learning
in science.
1.0% 9.4% 32.0% 51.7% 5.9%
36. If students’ learning in science is
less than expected, it is most likely
due to ineffective science teaching.
0.0% 24.6% 45.3% 27.6% 2.5%
37. Students’ learning in science is
directly related to their teacher’s
effectiveness in science teaching.
0.5% 12.3% 42.4% 39.9% 4.9%
38. When a low achieving child
progresses more than expected in
science, it is usually due to extra
attention given by the teacher.
0.5% 9.9% 41.9% 44.3% 3.5%
39. If parents comment that their child
is showing more interest in science
at school, it is probably due to the
performance of the child’s teacher.
0.0% 7.4% 33.0% 57.1% 2.5%
40. Minimal student learning in
science can generally be attributed
to their teachers.
1.5% 17.7% 47.3% 32.0% 1.5%
Table Q5
Year Two Elementary School Teacher Use of Instructional Technology
During elementary STEM
instructional meetings (e.g. class
periods, after school activities, days
of summer camp, etc.)
Proportion of Respondents
(N=237)
Never Occasi-
onally
About
Half the
Time
Usually Every
Time
Not
Applic-
able

Golden LEAF STEM Initiative
May 2013
157
During elementary STEM
instructional meetings (e.g. class
periods, after school activities, days
of summer camp, etc.)
Proportion of Respondents
(N=237)
Never Occasi-
onally
About
Half the
Time
Usually Every
Time
Not
Applic-
able
41. Students use a variety of
technologies, e.g. productivity,
data visualization, research, and
communication tools.
3.4% 1.3% 31.8% 14.0% 41.1% 8.5%
42. Students use technology to
communicate and collaborate with
others, beyond the classroom.
4.2% 15.3% 44.1% 9.3% 22.5% 4.7%
43. Students use technology to access
online resources and information
as a part of activities.
3.4% 1.7% 27.4% 15.6% 42.2% 9.7%
44. Students use the same kinds of
tools that professional researchers
use, e.g. simulations, databases,
satellite imagery.
5.1% 23.4% 44.7% 12.8% 12.3% 1.7%
45. Students work on technology-
enhanced projects that approach
real-world applications of
technology.
4.6% 11.4% 45.6% 19.4% 15.2% 3.8%
46. Students use technology to help
solve problems. 3.4% 5.9% 31.4% 25.9% 26.7% 6.8%
47. Students use technology to support
higher-order thinking, e.g.
analysis, synthesis and evaluation
of ideas and information.
3.8% 5.5% 35.4% 22.8% 26.2% 6.3%
48. Students use technology to create
new ideas and representations of
information.
3.4% 6.4% 35.9% 18.4% 29.5% 6.4%
Table Q6
Year Two Elementary School Teacher Use of STEM Instructional Strategies
During elementary STEM
instructional meetings (e.g. class
periods, after school activities, days
of summer camp, etc.)
Proportion of Respondents
(N=234)
Never Occasion-
ally
About
half the
time
Usually Every
time
49. Develop problem-solving skills
through investigations (e.g.
scientific, design or theoretical
investigations).
4.7% 30.5% 21.0% 38.6% 5.2%

Golden LEAF STEM Initiative
May 2013
158
During elementary STEM
instructional meetings (e.g. class
periods, after school activities, days
of summer camp, etc.)
Proportion of Respondents
(N=234)
Never Occasion-
ally
About
half the
time
Usually Every
time
50. Work in small groups. 1.7% 8.6% 23.3% 54.7% 11.6%
51. Make predictions that can be
tested. 5.6% 25.8% 21.5% 43.4% 3.9%
52. Make careful observations or
measurements. 3.9% 30.0% 21.0% 41.2% 3.9%
53. Use tools to gather data (e.g.
calculators, computers, computer
programs, scales, rulers,
compasses, etc.).
3.0% 27.8% 25.2% 37.6% 6.4%
54. Recognize patterns in data. 4.3% 25.8% 23.2% 46.4% 0.4%
55. Create reasonable explanations of
results of an experiment or
investigation.
5.2% 21.5% 26.6% 42.5% 4.3%
56. Choose the most appropriate
methods to express results (e.g.
drawings, models, charts, graphs,
technical language, etc.).
4.7% 23.9% 28.2% 35.9% 7.3%
57. Complete activities with a real-
world context. 2.2% 19.1% 28.6% 43.3% 6.9%
58. Engage in content-driven dialogue. 2.6% 14.7% 24.7% 46.8% 11.3%
59. Reason abstractly. 4.7% 33.2% 28.9% 30.2% 3.0%
60. Reason quantitatively. 4.3% 27.7% 31.6% 33.8% 2.6%
61. Critique the reasoning of others. 6.0% 35.9% 25.6% 29.1% 3.4%
62. Learn about careers related to the
instructional content. 6.9% 48.5% 20.4% 22.5% 1.7%
Table Q7
Year Two Elementary School Teacher Attitudes toward 21st Century Learning
I think it is important that students
have learning opportunities to…
Proportion of Respondents
(N=232)
Strongly
disagree Disagree
Neither
agree nor
disagree
Agree Strongly
agree
63. Lead others to accomplish a goal. 0.4% 0.0% 5.2% 60.8% 33.6%
64. Encourage others to do their best. 0.4% 0.0% 1.7% 47.8% 50.0%
65. Produce high quality work. 0.4% 0.0% 1.3% 45.7% 52.6%
66. Respect the differences of their
peers. 0.4% 0.0% 3.0% 40.1% 56.5%
67. Help their peers. 0.4% 0.0% 2.2% 51.7% 45.7%
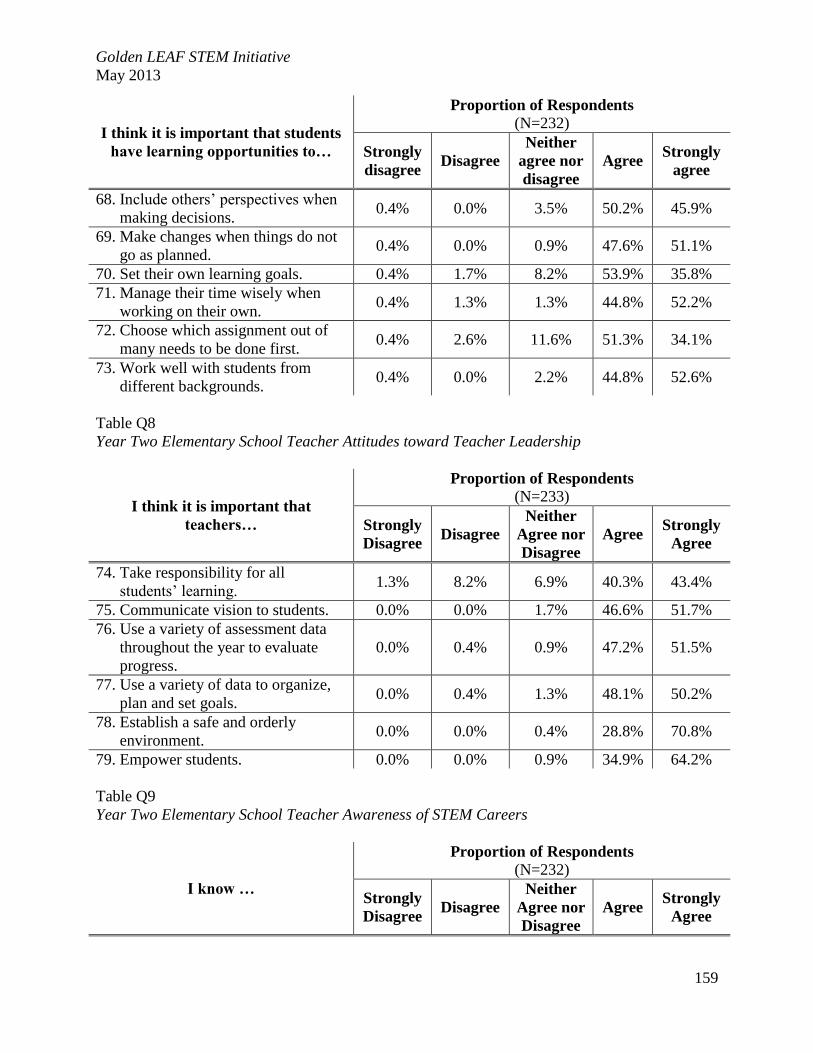
Golden LEAF STEM Initiative
May 2013
159
I think it is important that students
have learning opportunities to…
Proportion of Respondents
(N=232)
Strongly
disagree Disagree
Neither
agree nor
disagree
Agree Strongly
agree
68. Include others’ perspectives when
making decisions. 0.4% 0.0% 3.5% 50.2% 45.9%
69. Make changes when things do not
go as planned. 0.4% 0.0% 0.9% 47.6% 51.1%
70. Set their own learning goals. 0.4% 1.7% 8.2% 53.9% 35.8%
71. Manage their time wisely when
working on their own. 0.4% 1.3% 1.3% 44.8% 52.2%
72. Choose which assignment out of
many needs to be done first. 0.4% 2.6% 11.6% 51.3% 34.1%
73. Work well with students from
different backgrounds. 0.4% 0.0% 2.2% 44.8% 52.6%
Table Q8
Year Two Elementary School Teacher Attitudes toward Teacher Leadership
I think it is important that
teachers…
Proportion of Respondents
(N=233)
Strongly
Disagree Disagree
Neither
Agree nor
Disagree
Agree Strongly
Agree
74. Take responsibility for all
students’ learning. 1.3% 8.2% 6.9% 40.3% 43.4%
75. Communicate vision to students. 0.0% 0.0% 1.7% 46.6% 51.7%
76. Use a variety of assessment data
throughout the year to evaluate
progress.
0.0% 0.4% 0.9% 47.2% 51.5%
77. Use a variety of data to organize,
plan and set goals. 0.0% 0.4% 1.3% 48.1% 50.2%
78. Establish a safe and orderly
environment. 0.0% 0.0% 0.4% 28.8% 70.8%
79. Empower students. 0.0% 0.0% 0.9% 34.9% 64.2%
Table Q9
Year Two Elementary School Teacher Awareness of STEM Careers
I know …
Proportion of Respondents
(N=232)
Strongly
Disagree Disagree
Neither
Agree nor
Disagree
Agree Strongly
Agree

Golden LEAF STEM Initiative
May 2013
160
I know …
Proportion of Respondents
(N=232)
Strongly
Disagree Disagree
Neither
Agree nor
Disagree
Agree Strongly
Agree
80. About current STEM careers. 4.4% 22.2% 32.6% 37.4% 3.5%
81. Where to go to learn more about
STEM careers. 3.5% 26.5% 30.9% 36.1% 3.0%
82. Where to find resources for
teaching students about STEM
careers.
3.9% 28.5% 31.0% 33.6% 3.0%
83. Where to direct students or parents
to find information about STEM
careers.
4.4% 32.6% 29.6% 31.3% 2.2%

Golden LEAF STEM Initiative
May 2013
161
Appendix R. Elementary/Middle and High School Golden LEAF STEM Initiative Rubric
Results
Table R1
Year Two Attribute 1, Implementation of Project-Based Learning, by School-Level
Project-based learning (PBL) with integrated
content across STEM subjects
Average Rubric Score
Elementary/
Middle High
n 76 20
Frequency of PBL 1.7 2.0
Frequency of STEM Integration 2.2 1.8
Collaborative PLCs 2.3 2.5
Physical Space 2.3 2.0
Average 2.1 2.1
Note: Responses were recorded on a four-point scale: “early” (1); “developing” (2); “prepared” (3); and “model” (4).
Table R2
Year Two Attribute 2, Connections to Effective In- and Out-of-School Programs, by School-Level
Connections to effective in- and out-of-school
programs
Average Rubric Score
Elementary/
Middle High
n 73 20
STEM Network 1.6 1.9
Students and STEM Professionals 1.7 1.6
Research and Development 2.0 2.0
Average 1.7 1.8
Note: Responses were recorded on a four-point scale: “early” (1); “developing” (2); “prepared” (3); and “model” (4).
Table R3
Year Two Attribute 3, Integration of Technology and Virtual Learning, by School-Level
Integration of technology and virtual learning
Average Rubric Score
Elementary/
Middle High
n 74 20
Instructional Technology for STEM 2.2 2.1
Instructional Tech Resources for STEM 2.3 2.2
Computer and Web-based Technology 2.2 2.3
Tech Support 2.6 2.6
Average 2.3 2.3

Golden LEAF STEM Initiative
May 2013
162
Note: Responses were recorded on a four-point scale: “early” (1); “developing” (2); “prepared” (3); and “model” (4).
Table R4
Year Two Attribute 4, Authentic Assessments and Exhibition of STEM Skills, by School-Level
Authentic assessments and exhibition of STEM
skills
Average Rubric Score
Elementary/
Middle High
n 74 20
Authentic Assessments 2.3 2.4
Teachers Collaboratively Develop Assessments 2.8 2.4
Celebrate STEM Work 1.7 1.6
Culture of Innovation 1.7 1.6
Average 2.2 2.0
Note: Responses were recorded on a four-point scale: “early” (1); “developing” (2); “prepared” (3); and “model” (4).
Table R5
Year Two Attribute 5, Professional Development for STEM, by School-Level
Professional development on integrated STEM
curriculum, community/industry partnerships and
connections with postsecondary education
Average Rubric Score
Elementary/
Middle High
n 74 20
Individualized PD 1.9 1.8
Job-embedded PD 1.6 1.4
Specific to Teachers and Students 2.0 1.9
Frequency of PD 1.5 1.4
Average 1.8 1.6
Note: Responses were recorded on a four-point scale: “early” (1); “developing” (2); “prepared” (3); and “model” (4).
Table R6
Year Two Attribute 6, Outreach to Underrepresented Students, by School-Level
Outreach, support and focus on underserved
students, especially females, minorities and
economically disadvantaged students
Average Rubric Score
Elementary/
Middle High
n 72 20
Culture of Inquiry 2.0 2.1
Recognize Under-represented Students 1.8 1.6
Average 1.9 1.9
Note: Responses were recorded on a four-point scale: “early” (1); “developing” (2); “prepared” (3); and “model” (4).
Table R7

Golden LEAF STEM Initiative
May 2013
163
Year Two Attribute 7, A STEM Plan is Communicated and Adopted, by School-Level
A communicated STEM plan is adopted across
education, communities and businesses
Average Rubric Score
Elementary/
Middle High
n 72 20
STEM Program Plan 1.7 1.3
Communicate STEM Program Plan 1.9 1.5
Program Data 1.7 1.7
Resource Allocation 1.9 1.6
Average 1.7 1.3
Note: Responses were recorded on a four-point scale: “early” (1); “developing” (2); “prepared” (3); and “model” (4).
Table R8
Year Two Attribute 8, STEM Work-Based Learning Experiences for Students and Teachers, by
School-Level
STEM work-based learning experiences to increase
interest and abilities in fields requiring STEM skills
for each student and teacher
Average Rubric Score
Elementary/
Middle High
n 73 20
Learning Connected to Industries 1.9 1.9
Students Work in Teams 2.3 2.5
Applied Learning for STEM Teachers 1.7 1.8
Students Interact with STEM Industries - 1.3
Average 2.0 1.9
Note: Responses were recorded on a four-point scale: “early” (1); “developing” (2); “prepared” (3); and “model” (4).
“-“ indicates a key element that was not measured on either the Elementary/Middle or High School Golden LEAF
STEM Program Implementation Rubric.
Table R9
Year Two Attribute 9, Business and Community Partnerships, by School-Level
Business and community partnerships for
mentorships, internships and other opportunities
extend the classroom walls
Average Rubric Score
Elementary/
Middle High
n 71 20
Collaboration in Network of Schools 1.9 1.6
Communication Tools 1.8 1.8
Stakeholders and Funding 1.9 1.8
Average 1.8 1.7
Note: Responses were recorded on a four-point scale: “early” (1); “developing” (2); “prepared” (3); and “model” (4).
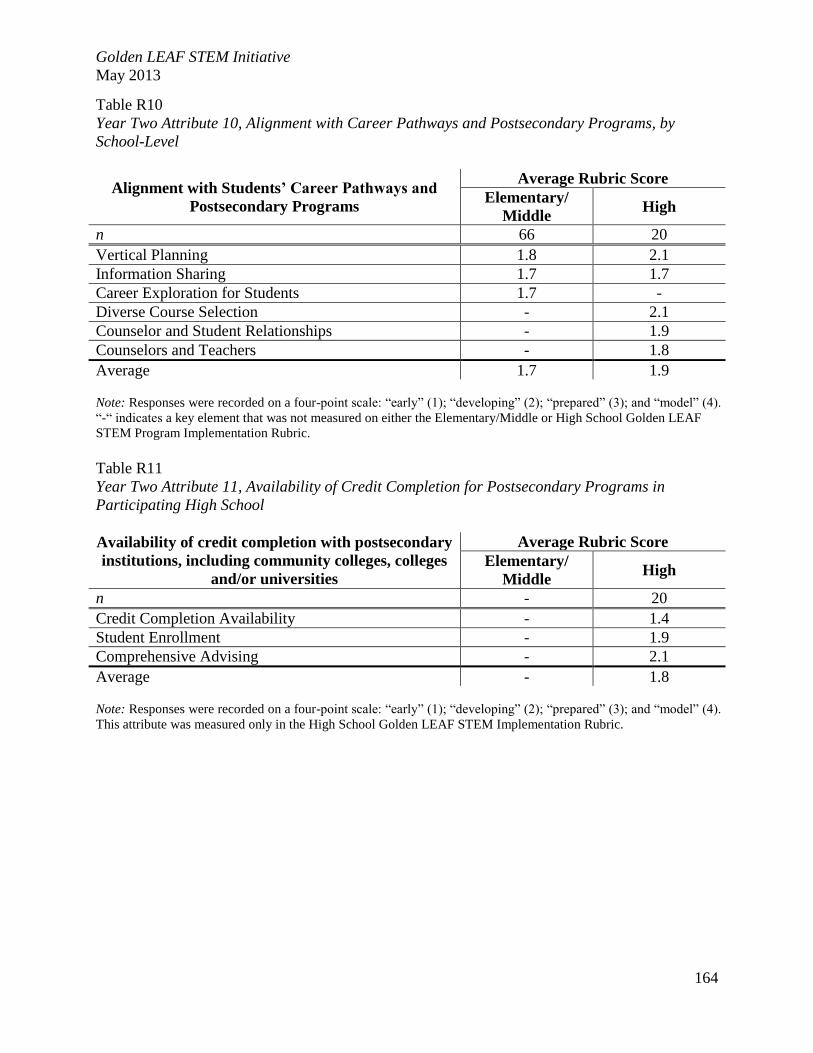
Golden LEAF STEM Initiative
May 2013
164
Table R10
Year Two Attribute 10, Alignment with Career Pathways and Postsecondary Programs, by
School-Level
Alignment with Students’ Career Pathways and
Postsecondary Programs
Average Rubric Score
Elementary/
Middle High
n 66 20
Vertical Planning 1.8 2.1
Information Sharing 1.7 1.7
Career Exploration for Students 1.7 -
Diverse Course Selection - 2.1
Counselor and Student Relationships - 1.9
Counselors and Teachers - 1.8
Average 1.7 1.9
Note: Responses were recorded on a four-point scale: “early” (1); “developing” (2); “prepared” (3); and “model” (4).
“-“ indicates a key element that was not measured on either the Elementary/Middle or High School Golden LEAF
STEM Program Implementation Rubric.
Table R11
Year Two Attribute 11, Availability of Credit Completion for Postsecondary Programs in
Participating High School
Availability of credit completion with postsecondary
institutions, including community colleges, colleges
and/or universities
Average Rubric Score
Elementary/
Middle High
n - 20
Credit Completion Availability - 1.4
Student Enrollment - 1.9
Comprehensive Advising - 2.1
Average - 1.8
Note: Responses were recorded on a four-point scale: “early” (1); “developing” (2); “prepared” (3); and “model” (4).
This attribute was measured only in the High School Golden LEAF STEM Implementation Rubric.

Golden LEAF STEM Initiative
May 2013
165
Appendix S. Pilot Leadership for STEM Self-Assessment Item-Level Results
Table S1
Year Two Principal Leadership for STEM – Vision
Regarding the Golden LEAF STEM
Project/Work at My School, I …
Proportion of Respondents
(N=107)
Strongly
Disagree Disagree
Neither
Agree
Nor
Disagree
Agree Strongly
Agree
1. I believe in the STEM efforts. 1.9% 0.0% 0.0% 41.1% 57.0%
2. I have articulated a vision for the
STEM efforts. 1.9% 2.8% 30.8% 51.4% 13.1%
3. I have established clear objectives
for the participants to meet. 0.9% 3.8% 31.1% 55.7% 8.5%
4. I communicate how the STEM
efforts support the larger strategic
plan for the school.
1.9% 2.8% 26.2% 58.9% 10.3%
5. I model effective STEM teaching. 1.9% 2.8% 52.3% 37.4% 5.6%
6. I model STEM learning. 1.9% 1.9% 43.9% 46.7% 5.6%
7. I model effective use of
technology. 0.9% 1.9% 14.0% 57.9% 25.2%
8. I encourage a culture of
innovation, among faculty,
students and others.
1.9% 0.0% 1.9% 54.2% 42.1%
9. I promote an inclusive culture of
trust that honors creativity. 0.9% 0.9% 1.9% 45.8% 50.5%
10. I promote the legal and ethical use
of technology and other STEM
resources (e.g., respect for
copyright, intellectual property).
0.9% 0.9% 0.9% 46.7% 50.5%
11. I believe in the STEM efforts. 1.9% 0.0% 0.0% 41.1% 57.0%
12. I have articulated a vision for the
STEM efforts. 1.9% 2.8% 30.8% 51.4% 13.1%
13. I have established clear objectives
for the participants to meet. 0.9% 3.8% 31.1% 55.7% 8.5%
Table S2
Year Two Principal Leadership for STEM – Infrastructure

Golden LEAF STEM Initiative
May 2013
166
Regarding the Golden LEAF STEM
Project/Work at My School, I …
Proportion of Respondents
(N=107)
Strongly
Disagree Disagree
Neither
Agree
Nor
Disagree
Agree Strongly
Agree
14. I make sure teachers have access to
digital technology tools that
facilitate their work (e.g.,
SmartBoards, virtual applications,
classroom management software).
0.9% 0.9% 3.8% 35.8% 58.5%
15. I make sure teachers have access to
resources for STEM teaching and
learning (e.g. lab facilities, lab
supplies, lab equipment, project
rooms, and exhibition spaces).
0.9% 4.7% 8.5% 52.8% 33.0%
16. I work to ensure an appropriate
technical infrastructure is
maintained (e.g. wireless
connection, IT support, server
space, extra laptops, power strips).
0.9% 0.9% 3.8% 48.1% 46.2%
17. I ensure technical support is
available for digital technology
tools.
1.0% 1.9% 8.6% 43.8% 44.8%
18. I ensure technical support is
available for lab equipment and
other resources for STEM teaching
and learing.
0.9% 2.8% 15.1% 50.9% 30.2%
19. I design policies for the
appropriate use of STEM
equipment and technology tools.
0.9% 5.7% 32.1% 43.4% 17.9%
Table S3
Year Two Principal Leadership for STEM – Professional Development
Regarding the Golden LEAF STEM
Project/Work at My School, I …
Proportion of Respondents
(N=107)
Strongly
Disagree Disagree
Neither
Agree
Nor
Disagree
Agree Strongly
Agree
20. I support professional development
by providing resources such as
substitutes, release time, etc.
0.9% 0.9% 3.8% 35.8% 58.5%

Golden LEAF STEM Initiative
May 2013
167
Regarding the Golden LEAF STEM
Project/Work at My School, I …
Proportion of Respondents
(N=107)
Strongly
Disagree Disagree
Neither
Agree
Nor
Disagree
Agree Strongly
Agree
21. I support the specific professional
development needs of STEM
teachers (e.g. real-world
experiences or externships).
0.9% 0.0% 1.9% 47.2% 50.0%
22. I participate in administrative
professional development. 0.9% 2.8% 14.2% 45.3% 36.8%
23. I share information about STEM
research and best practices with
faculty.
0.9% 2.8% 1.9% 50.0% 44.3%
24. I encourage teachers to incorporate
project-based learning with
integrated content.
0.9% 2.8% 18.9% 57.5% 19.8%
25. I understand that incorporating
project-based learning may take
more time for some people.
0.9% 0.0% 2.8% 53.8% 42.5%
26. I evaluate the effectiveness of
professional development. 0.9% 0.0% 0.0% 50.9% 48.1%
Table S4
Year Two Principal Leadership for STEM – Shared Decision-Making
Regarding the Golden LEAF STEM
Project/Work at My School, I …
Proportion of Respondents
(N=107)
Strongly
Disagree Disagree
Neither
Agree
Nor
Disagree
Agree Strongly
Agree
27. I request feedback from teachers
about the STEM efforts. 1.0% 8.6% 28.6% 47.6% 14.3%
28. I provide time to solve problems as
a team. 1.0% 0.0% 3.8% 65.7% 29.5%
29. I make others feel comfortable in
expressing their concerns or
opinions about the STEM efforts.
1.0% 1.0% 18.1% 56.2% 23.8%
30. I make others feel comfortable in
expressing their suggestions for the
STEM efforts.
1.0% 1.0% 14.3% 60.0% 23.8%

Golden LEAF STEM Initiative
May 2013
168
Regarding the Golden LEAF STEM
Project/Work at My School, I …
Proportion of Respondents
(N=107)
Strongly
Disagree Disagree
Neither
Agree
Nor
Disagree
Agree Strongly
Agree
31. I include teachers in decisions
about project policies on student
use of technology.
1.0% 1.0% 2.9% 51.4% 43.8%
32. I include teachers in decisions
about measuring STUDENT
success in STEM.
1.0% 1.9% 20.0% 45.7% 31.4%
33. I include teachers in decisions
about measuring TEACHER
success in STEM.
1.0% 1.0% 24.8% 46.7% 26.7%
Table S5
Year Two Principal Leadership for STEM – Advocacy
Regarding the Golden LEAF STEM
Project/Work at My School, I …
Proportion of Respondents
(N=107)
Strongly
Disagree Disagree
Neither
Agree
Nor
Disagree
Agree Strongly
Agree
34. I secure funding for the STEM
efforts. 0.0% 14.3% 35.2% 41.9% 8.6%
35. I take steps to ensure the
sustainability of the STEM efforts. 1.0% 4.8% 19.0% 65.7% 9.5%
36. I advocate for policies that support
the STEM efforts at the district
level.
1.0% 3.8% 16.2% 62.9% 16.2%
37. I participate in a STEM network in
which I communicate with peer
programs.
1.0% 28.6% 32.4% 28.6% 9.5%
38. I leverage strategic partnerships to
support the STEM efforts, such as
institutes of higher education and
businesses.
1.0% 20.0% 35.2% 33.3% 10.5%
Table S6
Year Two Principal Leadership for STEM – Evaluation

Golden LEAF STEM Initiative
May 2013
169
Regarding the Golden LEAF STEM
Project/Work at My School, I …
Proportion of Respondents
(N=107)
Strongly
Disagree Disagree
Neither
Agree
Nor
Disagree
Agree Strongly
Agree
39. I support a classroom learning
environment that uses a wide
variety of indicators of student
success (e.g. performance-based,
project-based and portfolio
assessments).
1.0% 0.0% 0.0% 50.0% 49.0%
40. I use clearly defined criteria for
assessing STEM teaching. 1.0% 8.7% 33.7% 45.2% 11.5%
41. I provide constructive feedback to
STEM teachers. 1.0% 2.9% 13.5% 63.5% 19.2%
42. I communicate clearly how teacher
performance will be assessed. 1.0% 1.0% 5.8% 59.6% 32.7%
43. I use multiple sources of data for
evaluating the overall impact of the
STEM project on students.
1.0% 4.8% 17.3% 61.5% 15.4%