the granite state poll - cola.unh.edu · 2020 democraˠc primary a large majority of likely democra...
TRANSCRIPT

TheGraniteStatePoll
April 25, 2018
SANDERS & BIDEN REMAIN FRONTRUNNERS; GOP PRIMARY VOTERS PREFER TRUMP OVER KASICH THREE TO ONE
By: Andrew E. Smith, Ph.D. [email protected] Zachary S. Azem, M.A. 603-862-2226 Sean P. McKinley, M.A. cola.unh.edu/survey-center
DURHAM, NH – Bernie Sanders and Joe Biden connue to be early frontrunners for the 2020 New Hampshire presidenal primary,although most Democrac primary voters are sll trying to make up their minds who to support. Most Republicans are also trying todecide who to support, but just over half say they plan to vote for Trump in the 2020 primary. Two-thirds of Republican primary voterswould vote for Trump in a hypothecal matchup with Ohio Governor John Kasich.
These findings are based on the latest Granite State Poll*, conducted by the University of New Hampshire Survey Center. Five hundredand forty-eight (548) randomly selected New Hampshire adults were interviewed in English by landline and cellular telephone betweenApril 13 and April 22, 2018. The margin of sampling error for the survey is +/- 4.2 percent. Included in the sample were 208 likely 2020Republican Primary voters (margin of sampling error +/- 6.8 percent) and 188 likely 2020 Democrac Primary voters (margin of samplingerror +/- 7.1 percent).
Interest in 2020 New Hampshire Presidenal Primary
With nearly two years unl the 2020 New Hampshire presidenal primary, just over half of Granite Staters (52%) say they are extremelyinterested in the primary, while just under a quarter (26%) are very interested, 13% are somewhat interested, and 8% are not veryinterested. Interest in the 2020 primary is largely unchanged since February (52% extremely interested) and is higher than in April 2014and April 2010, the last two similar points in the presidenal electoral cycle.
Democrats (63%) are slightly more likely than Republicans (54%) to say they are extremely interested while only one-third (33%) ofIndependents agree. The percentage of Democrats who are extremely interested is unchanged since February but interest amongRepublicans has slightly declined in that me.
* We ask that this copyrighted informaon be referred to as the Granite State Poll, conducted by the University of New Hampshire Survey Center.
Apr 2010 Apr 2014 Feb 2018 Apr 2018
0%
20%
40%
60%
80%
100%
48% 48% 46%51%
41%
34%
42%
50%55%
63%
40%
59%
52%
63%
33%
54%
Extremely Interested in Primary
OVERALL Democrat Independent Republican

2020 Democrac Primary
A large majority of likely Democrac primary voters (90%) say they are sll trying to decide who they will support in 2020, while 5%each say they are leaning towards someone or have definitely decided. Slightly more respondents than in February (87%) say they aresll trying to decide.
Apr 2010 Apr 2014 Feb 2018 Apr 2018
0%
20%
40%
60%
80%
100%
83%80%
83%86%
78% 79%
72%
81%76%
81%
58%
87%
73%77%
56%
82%
Will Definitely Vote in Primary - By Party ID
OVERALL Democrat Independent Republican
While respondents say they are more interested in the presidenal primary than at the same point in previous electoral cycles, slightlyfewer respondents currently say they will definitely vote in the 2020 New Hampshire presidenal primary compared to previous years.
Overall, 73% say they will definitely vote in the 2020 presidenal primary, 12% will vote unless there is an emergency, and 5% each saythey may vote or probably will not vote. Most Democrats (77%) and Republicans (82%) say they will definitely vote in the primary butonly 56% of Independents say they will definitely cast a primary ballot. This trend of Independents being far less willing to say they willdefinitely vote in the primary has connued since February and is unlike previous elecon cycles when Independents were about aslikely as Democrats and Republicans to say they would definitely vote in the forthcoming presidenal primary.
0% 10% 20% 30% 40% 50% 60% 70% 80% 90% 100%
October 2017
February 2018
April 2018
94%
87%
90%
4%
8%
5%
5%
5%
Definitely Decided on Candidate - Democrac Primary Voters
Definitely Decided Leaning Towards Someone Still Trying To Decide

Ruben Gallego
Nancy Pelosi
Michelle Obama
Joseph Kennedy IIIJeanne Shaheen
Eric Holder
Chuck Schumer
Martin O'Malley
Kamala HarrisJohn Hickenlooper Cory BookerHillary Clinton
Joe Biden
Elizabeth Warren
Bernie Sanders
Preferred Democrac 2020 Presidenal Nominaon Candidate - Open-ended
October 2017 February 2018 April 2018
0% 10% 20% 30% 40% 50%0% 10% 20% 30% 40% 50%0% 10% 20% 30% 40% 50%
Bernie Sanders
Joe Biden
Elizabeth Warren
Kamala Harris
Cory Booker
Joseph Kennedy III
Martin O'Malley
Kirsten Gillibrand
John Hickenlooper
Amy Klobuchar
Tim Ryan
John Delaney
Other
Undecided 11%
5%
0%
1%
1%
2%
1%
3%
6%
1%
13%
24%
31%
15%
4%
0%
0%
2%
1%
3%
1%
15%
35%
24%
26%
13%
2%
0%
1%
1%
1%
2%
3%
5%
6%
11%
28%
Preferred Democrac 2020 Presidenal Nominaon Candidate - List
When provided a list of potenal candidates to choose from for the 2020 nominaon, 28% of likely Democrac primary voters choosethe 2016 NH winner, Vermont Senator Bernie Sanders, 26% choose former Vice President Joe Biden, and 11% favor MassachusesSenator Elizabeth Warren. Fewer likely voters choose Kamala Harris (6%), Cory Booker (5%), Joseph Kennedy III (3%), Marn O'Malley(2%), Kirsten Gillibrand (1%), John Hickenlooper (1%), Amy Klobuchar (1%), or Tim Ryan (<1%). Two percent of respondents menonedanother candidate while 13% remain undecided.
Support for Sanders (28%) has slightly increased since February (24%), while support for Biden (26%) has fallen since February (35%).Support for Warren (11%) has slightly declined since February while Kamala Harris (6%) now garners the fourth highest support in thefield.
Likely Democrac primary voters who live in the Conneccut Valley or Manchester Area, and those aged 18 to 34 are more likely thanothers to support Sanders.
Most Democrac primary voters (59%) remain undecided or cannot provide a name when asked an open-ended queson about whomthey would support. Democrac primary voters most frequently menon Bernie Sanders (14%), Joe Biden (11%), Elizabeth Warren (3%),Cory Booker (3%), and Hillary Clinton (2%). Results were similar to those in February as well as October 2017.

2020 Republican Primary
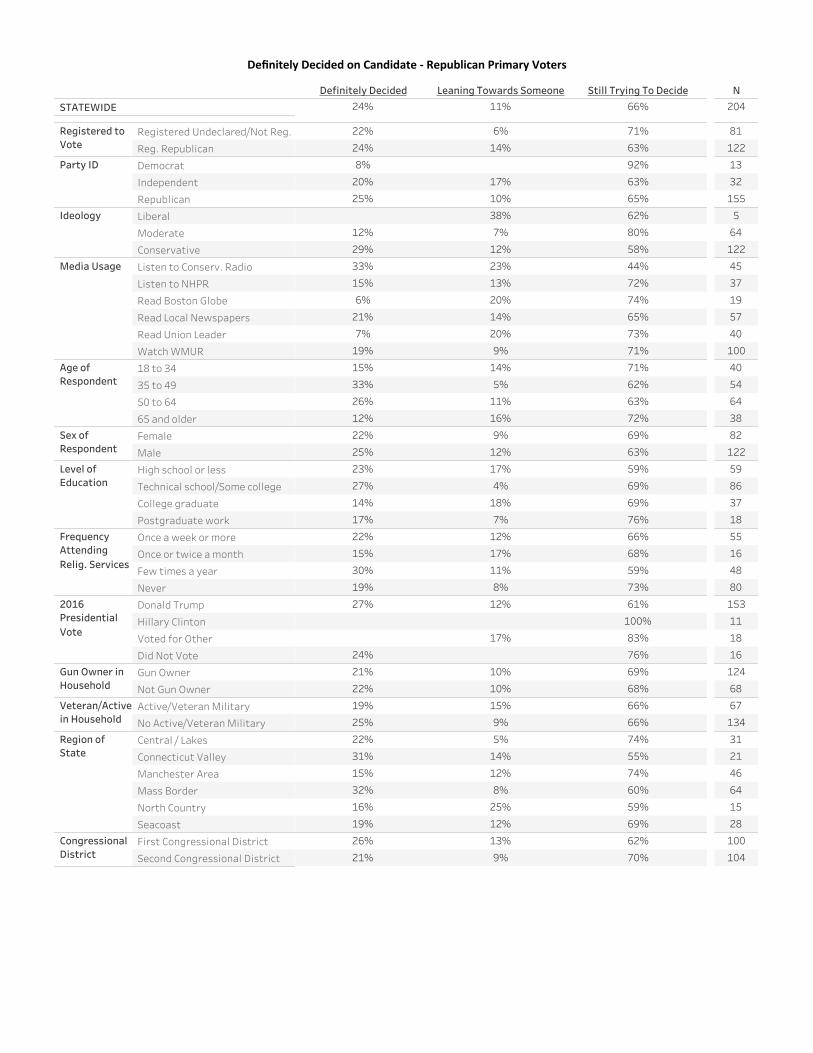
Only one quarter (24%) of Republican primary voters say they have definitely decided whom they will support for the 2020 Republicanpresidenal primary, a slight decrease since February (30%). Eleven percent of Republican primary voters say they are leaning towardsomeone while two-thirds (66%) are sll trying to decide.
0% 10% 20% 30% 40% 50% 60% 70% 80% 90% 100%
October 2017
February 2018
April 2018 24%
30%
18%
11%
8%
5%
66%
63%
77%
Definitely Decided on Candidate - Republican Primary Voters
Definitely Decided Leaning Towards Someone Still Trying To Decide
0% 10% 20% 30% 40% 50% 60% 70% 80% 90% 100%
October 2017
February 2018
April 2018 55%
60%
47%
19%
18%
23%
27%
23%
30%
Plan on Vong for Trump or Other Republican Candidate?
Vote For Trump Vote For Other Candidate DK/Not Sure
Fiy-five percent of likely Republican primary voters say they plan on vong for Donald Trump in the 2020 New Hampshire Republicanpresidenal primary, slightly lower than said so in February (60%). Nineteen percent say they plan on vong for another candidate,while 27% don't know or are unsure.
Likely Republican primary voters who listen to conservave talk radio, those who aend religious services once or twice a month,self-described conservaves, those aged 65 and older, and those who voted for Trump in 2016 are more likely than others to say theyplan on vong for Trump in the 2020 Republican primary while Republican primary voters aged 18 to 34 and self-described moderatesare more likely to say they plan on vong for another candidate.

Support for Trump among Republican primary voters is weaker than the support President Obama enjoyed among Democrats at thesame point in the electoral cycle; 68% of Democrats in April 2010 planned to vote for Obama in the 2012 Democrac presidenalprimary, while 55% of Republicans now say they plan to vote for Trump in the 2020 Republican presidenal primary.
0% 10% 20% 30% 40% 50% 60% 70% 80% 90% 100%
October2009
Vote for Obama
Vote For Other Candidate
Don't Know/Not Sure
February2010
Vote for Obama
Vote For Other Candidate
Don't Know/Not Sure
April 2010 Vote for Obama
Vote For Other Candidate
Don't Know/Not Sure
October2017
Vote For Trump
Vote For Other Candidate
DK/Not Sure
February2018
Vote For Trump
Vote For Other Candidate
DK/Not Sure
April 2018 Vote For Trump
Vote For Other Candidate
DK/Not Sure
30%
5%
64%
36%
8%
56%
26%
6%
68%
30%
23%
47%
23%
18%
60%
27%
19%
55%
Plan on Vong for Incumbent President in Primary
14%
67%
19%
0%
Vote For Trump
Vote For Kasich
Vote For Other Candidate
DK/Not Sure
Prospecve 2020 NH Republican Presidenal Primary Matchup
Ohio Governor John Kasich recently visited New Hampshire where he hinted at a challenge to Trump. In a hypothecal matchupbetween Trump and Kasich, two-thirds (67%) of likely Republican primary voters say they would vote for Trump, 19% would vote forKasich, less than 1% would vote for another candidate, and 14% don't know or are unsure.
Likely Republican primary voters who listen to conservave talk radio, self-idenfied Independents, those who aend religious servicesonce or twice a month, Massachuses Border residents, those who voted for Donald Trump in 2016, and self-described conservavesare more likely than others to say they would vote for Trump in a Republican primary between Trump and Kasich. College graduatesand self-described moderates are more likely than others to say they would vote for Kasich in this matchup.
Trump vs. Kasich

Granite State Poll MethodologyThese findings are based on the latest Granite State Poll, conducted by the University of New Hampshire Survey Center. Five hundredand forty-eight (548) randomly selected New Hampshire adults were interviewed in English by landline and cellular telephone betweenApril 13 and April 22, 2018. The margin of sampling error for the survey is +/- 4.2 percent. Included in the sample were 208 likely 2020Republican Primary voters (margin of sampling error +/- 6.8 percent) and 188 likely 2020 Democrac Primary voters (margin of samplingerror +/- 7.1 percent). The design effect for the survey is 1.2%.
The random sample used in the Granite State Poll was purchased from Markeng Systems Group (MSG), Horsham, PA. MSG screenseach selected telephone number to eliminate non-working numbers, disconnected numbers, and business numbers to improve theefficiency of the sample, reducing the amount of me interviewers spend calling non-usable numbers. When a landline number isreached, the interviewer randomly selects a member of the household by asking to speak with the adult currently living in thehousehold who has had the most recent birthday. This selecon process ensures that every adult (18 years of age or older) in thehousehold has an equal chance of being included in the survey.
The data have been weighted to adjust for numbers of adults and telephone lines within households. Addionally, data were weightedby respondent sex, age, educaon, and region of the state to targets from the most recent American Community Survey (ACS)conducted by the U.S. Census Bureau. In addion to potenal sampling error, all surveys have other potenal sources of non-samplingerror including queson order effects, queson wording effects, and non-response. Due to rounding, percentages may not sum to100%. The number of respondents in each demographic below may not equal the number reported in cross-tabulaon tables as somerespondents choose not to answer some quesons.
For more informaon about the methodology used in the Granite State Poll, contact Dr. Andrew Smith at (603) 862-2226 or by email [email protected].
Granite State Poll, Spring 2018 Demographics
N
Sex of Respondent Female
Male
Age of Respondent 18 to 34
35 to 49
50 to 64
65 and older
Level of Education High school or less
Technical school/Some college
College graduate
Postgraduate work
Region of State Central / Lakes
Connecticut Valley
Manchester Area
Mass Border
North Country
Seacoast
Registered to Vote Reg. Democrat
Registered Undeclared/Not Reg.
Reg. Republican
Party ID Democrat
Independent
Republican
269
279
104
148
132
142
69
106
207
158
91
41
142
103
84
86
128
300
116
185
131
218
%
49%
51%
20%
28%
25%
27%
13%
20%
38%
29%
17%
8%
26%
19%
15%
16%
23%
55%
21%
35%
24%
41%

Definitely Decided Leaning Towards Someone Still Trying To Decide
October 2017
February 2018
April 2018 90%
87%
94%
5%
8%
4%
5%
5%
2%
Definitely Decided on Candidate - Democrac Primary Voters
Have you definitely decided who you will vote for in the New Hampshire primary, are you leaning toward someone, or have youconsidered some candidates but are sll trying to decide?
N
185
219
196
AmyKlobuchar
BernieSanders Cory Booker
ElizabethWarren Joe Biden
JosephKennedy III John Delaney
JohnHickenlooper
October 2017
February 2018
April 2018 1%
2%
0%
0%
3%26%
35%
24%
11%
15%
13%
5%
3%
6%
28%
24%
31%
1%
0%
1%
Preferred Democrac 2020 Presidenal Nominaon Candidate - List
Now, I'm going to read you a list of some candidates who are running or could run for the Democrac nominaon. If the Democracprimary for president were held today, which of the following would you support for the Democrac nominaon: Joe Biden, Cory Booker,John Delaney, Eric Garce , Kirsten Gillibrand, Kamala Harris, John Hickenlooper, Joseph Kennedy III, Amy Klobuchar, Marn O'Malley,Tim Ryan, Bernie Sanders, Elizabeth Warren, or someone else? (Candidates rotated)
N
184
223
211
Kamala HarrisKirstenGillibrand
MarkZuckerberg
MartinO'Malley Tim Ryan Other Undecided
October 2017
February 2018
April 2018 13%
15%
11%
2%
4%
5%
0%
1%
2%
1%
3%2%
1%
2%
1%
6%
1%
1%
Interest in Primary
I know it is a long way away, but as you know, the New Hampshire Presidenal Primary is being held in 2020. How interested would yousay you are in the 2020 New Hampshire Presidenal Primary elecon?
Somewhat Interested Not Very Interested DK/Not Sure Extremely interested Very interested
October 2017
February 2018
April 2018 26%
24%
27%
52%
55%
47%
1%
1%
0%
8%
7%
8%
13%
13%
18%
N
548
523
570
Likelihood of Vong in 2020 Presidenal Primary
Which of the following statements best describes you?
Definitely vote inPrimary
Will vote in Primaryunless emergency May vote in Primary
Probably not vote inPrimary Unsure
October 2017
February 2018
April 2018 5%
6%
7%
5%
5%
2%
5%
4%
5%
12%
9%
11%
73%
76%
74%
N
546
517
567

Plan on Vong for Trump in 2020 Republican Primary or Another Candidate - Republican Primary Voters
Do you plan on vong for Donald Trump in the 2020 New Hampshire Republican primary or do you plan to vote for another Republicancandidate?
Vote For Trump Vote For Other Candidate DK/Not Sure
October 2017
February 2018
April 2018 27%
23%
30%
19%
18%
23%
55%
60%
47%
N
204
157
183
Definitely Decided on Candidate - Republican Primary Voters
Have you definitely decided who you will vote for in the New Hampshire primary, are you leaning toward someone...or have youconsidered some candidates but are sll trying to decide?
Definitely Decided Leaning Towards Someone Still Trying To Decide
October 2017
February 2018
April 2018 66%
63%
77%
11%
8%
5%
24%
30%
18%
N
204
157
183
Prospecve 2020 NH Republican Presidenal Primary Matchup - Trump vs. Kasich
If the Republican primary for president were held today, and the candidates were Donald Trump and John Kasich, who would yousupport for the Republican nominaon? (Candidates rotated)
Vote For Trump Vote For Kasich Vote For Other Candidate DK/Not Sure
April 2018 14%0%19%67%
N
208

ExtremelyInterested Very Interested
SomewhatInterested
Not VeryInterested
Don't Know/NotSure
STATEWIDE 1%8%13%26%52%
Interest in Primary
N
548
Registered toVote
Reg. Democrat
Registered Undeclared/Not Reg.
Reg. Republican
Party ID Democrat
Independent
Republican
Ideology Liberal
Moderate
Conservative
Media Usage Listen to Conserv. Radio
Listen to NHPR
Read Boston Globe
Read Local Newspapers
Read Union Leader
Watch WMUR
Age ofRespondent
18 to 34
35 to 49
50 to 64
65 and older
Sex ofRespondent
Female
Male
Level ofEducation
High school or less
Technical school/Some college
College graduate
Postgraduate work
FrequencyAttendingRelig. Services
Once a week or more
Once or twice a month
Few times a year
Never
2016PresidentialVote
Donald Trump
Hillary Clinton
Voted for Other
Did Not Vote
Gun Owner inHousehold
Gun Owner
Not Gun Owner
Veteran/Activein Household
Active/Veteran Military
No Active/Veteran Military
Region ofState
Central / Lakes
Connecticut Valley
Manchester Area
Mass Border
North Country
Seacoast
CongressionalDistrict
First Congressional District
Second Congressional District
22%
28%
25%
59%
43%
70%
1%
7%
11%
13%
17%
4%
25%
28%
26%
54%
33%
63%
2%
1%
7%
13%
5%
14%
25%
5%
24%
35%
14%
55%
43%
78%
1%
1%
8%
8%
3%
13%
12%
4%
27%
33%
26%
24%
26%
18%
53%
50%
60%
65%
60%
68%
0%
1%
8%
7%
7%
3%
6%
3%
12%
10%
7%
8%
7%
11%
25%
27%
23%
31%
58%
53%
58%
39%
0%
2%
4%
7%
9%
9%
13%
10%
9%
21%
27%
25%
49%
55%
0%
1%
9%
7%
15%
12%
14%
19%
31%
30%
75%
66%
42%
46%
1%
1%
1%
5%
4%
10%
10%
5%
11%
17%
13%
26%
27%
32%
23%
50%
54%
43%
58%
0%
1%
2%
9%
6%
8%
9%
15%
11%
15%
10%
30%
20%
26%
26%
22%
50%
67%
51%
1%
3%
1%
19%
13%
1%
9%
28%
15%
6%
14%
28%
25%
52%
51%
1%
0%
6%
10%
13%
13%
27%
24%
54%
47%
1%5%
16%
13%
13%
24%
28%
30%
15%
29%
27%
52%
38%
43%
61%
59%
58%
1%
1%
2%
10%
18%
8%
5%
3%
9%
14%
16%
17%
18%
7%
6%
27%
25%
50%
54%
1%
0%
8%
8%
14%
12%
128
300
116
185
131
218
166
206
120
275
84
169
58
138
58
104
148
132
142
269
279
69
106
207
158
250
138
48
97
78
54
188
206
268
260
396
145
91
41
142
103
84
86
270
278

Definitely votein Primary
Will vote inPrimary unlessemergency
May vote inPrimary
Probably notvote in Primary Unsure
STATEWIDE 5%5%5%12%73%
Likelihood of Vong in 2020 Presidenal Primary
N
546
Registered toVote
Reg. Democrat
Registered Undeclared/Not Reg.
Reg. Republican
Party ID Democrat
Independent
Republican
Ideology Liberal
Moderate
Conservative
Media Usage Listen to Conserv. Radio
Listen to NHPR
Read Boston Globe
Read Local Newspapers
Read Union Leader
Watch WMUR
Age ofRespondent
18 to 34
35 to 49
50 to 64
65 and older
Sex ofRespondent
Female
Male
Level ofEducation
High school or less
Technical school/Some college
College graduate
Postgraduate work
FrequencyAttendingRelig. Services
Once a week or more
Once or twice a month
Few times a year
Never
2016PresidentialVote
Donald Trump
Hillary Clinton
Voted for Other
Did Not Vote
Gun Owner inHousehold
Gun Owner
Not Gun Owner
Veteran/Activein Household
Active/Veteran Military
No Active/Veteran Military
Region ofState
Central / Lakes
Connecticut Valley
Manchester Area
Mass Border
North Country
Seacoast
CongressionalDistrict
First Congressional District
Second Congressional District
1%
8%
2%
0%
7%
3%
2%
7%
3%
14%
13%
9%
83%
65%
83%
1%
11%
4%
3%
7%
5%
3%
9%
3%
12%
16%
12%
82%
56%
77%
4%
4%
4%
2%
6%
4%
2%
6%
3%
12%
16%
5%
80%
69%
84%
4%
3%
3%
0%
2%
5%
4%
4%
3%
4%
2%
5%
1%
4%
4%
2%
4%
13%
12%
16%
15%
12%
15%
73%
81%
73%
78%
81%
77%
3%
6%
3%
5%
2%
6%
5%
5%
3%
1%
5%
10%
16%
11%
10%
16%
76%
76%
78%
63%
6%
4%
4%
6%
4%
6%
12%
13%
74%
72%
1%
5%
7%
4%
6%
7%
4%
5%
5%
5%
8%
8%
14%
16%
88%
82%
70%
64%
7%
2%
5%
5%
6%
4%
4%
7%
3%
1%
6%
11%
13%
20%
14%
71%
75%
71%
76%
17%
2%
1%
3%
18%
5%
2%
3%
19%
5%
2%
2%
13%
19%
11%
13%
32%
69%
84%
78%
6%
3%
6%
5%
6%
4%
13%
12%
69%
77%
4%
6%
4%
9%
6%
3%
13%
12%
74%
71%
2%
9%
9%
4%
1%
5%
8%
6%
3%
1%
7%
6%
8%
3%
7%
4%
3%
1%
14%
15%
8%
5%
22%
16%
67%
67%
73%
85%
68%
73%
5%
4%
5%
5%
4%
6%
14%
11%
72%
74%
128
298
116
185
131
216
166
205
119
273
84
169
57
138
58
104
147
131
142
269
277
68
105
207
158
248
138
48
97
76
54
188
206
266
260
394
145
91
41
141
102
84
86
268
278

Definitely Decided Leaning Towards Someone Still Trying To Decide
STATEWIDE 90%5%5%
Definitely Decided on Candidate - Democrac Primary Voters
N
185
Registered toVote
Reg. Democrat
Registered Undeclared/Not Reg.
Party ID Democrat
Independent
Republican
Ideology Liberal
Moderate
Conservative
Media Usage Listen to Conserv. Radio
Listen to NHPR
Read Boston Globe
Read Local Newspapers
Read Union Leader
Watch WMUR
Age ofRespondent
18 to 34
35 to 49
50 to 64
65 and older
Sex ofRespondent
Female
Male
Level ofEducation
High school or less
Technical school/Some college
College graduate
Postgraduate work
FrequencyAttendingRelig. Services
Once a week or more
Once or twice a month
Few times a year
Never
2016PresidentialVote
Donald Trump
Hillary Clinton
Voted for Other
Did Not Vote
Gun Owner inHousehold
Gun Owner
Not Gun Owner
Veteran/Activein Household
Active/Veteran Military
No Active/Veteran Military
Region ofState
Central / Lakes
Connecticut Valley
Manchester Area
Mass Border
North Country
Seacoast
CongressionalDistrict
First Congressional District
Second Congressional District
94%
87%
3%
6%
3%
7%
100%
100%
88%6%
0%
6%
100%
94%
86%
6%
5%
0%
10%
95%
91%
93%
80%
92%
100%
4%
9%
5%
10%
4%
2%
2%
11%
4%
92%
92%
87%
88%
4%
3%
1%
10%
4%
5%
11%
1%
89%
91%
9%
2%
3%
7%
88%
88%
93%
90%
5%
6%
10%
8%
6%
7%
84%
95%
100%
97%
7%
3%
2%
9%
3%
1%
88%
80%
91%
100%
10%
4%
12%
10%
5%
90%
89%
4%
6%
6%
5%
90%
90%
4%
6%
6%
4%
93%
96%
85%
79%
94%
92%
4%
4%
10%
2%
6%
1%
2%
5%
19%
6%
90%
90%
7%
3%
3%
7%
79
106
3
26
155
13
76
91
98
20
75
25
74
1
44
39
47
50
72
114
37
47
56
44
94
48
15
25
5
19
150
7
110
73
148
36
38
15
28
28
40
35
94
91

Amy Klobuchar Bernie Sanders Cory Booker Elizabeth Warren Joe Biden
STATEWIDE 26%11%5%28%1%
Preferred Democrac 2020 Presidenal Nominaon Candidate - List
Registered toVote
Reg. Democrat
Registered Undeclared/Not Reg.
Party ID Democrat
Independent
Republican
Ideology Liberal
Moderate
Conservative
Media Usage Listen to Conserv. Radio
Listen to NHPR
Read Boston Globe
Read Local Newspapers
Read Union Leader
Watch WMUR
Age ofRespondent
18 to 34
35 to 49
50 to 64
65 and older
Sex ofRespondent
Female
Male
Level ofEducation
High school or less
Technical school/Some college
College graduate
Postgraduate work
FrequencyAttendingRelig. Services
Once a week or more
Once or twice a month
Few times a year
Never
2016PresidentialVote
Donald Trump
Hillary Clinton
Voted for Other
Did Not Vote
Gun Owner inHousehold
Gun Owner
Not Gun Owner
Veteran/Activein Household
Active/Veteran Military
No Active/Veteran Military
Region ofState
Central / Lakes
Connecticut Valley
Manchester Area
Mass Border
North Country
Seacoast
CongressionalDistrict
First Congressional District
Second Congressional District
28%
25%
6%
16%
7%
4%
30%
27%
0%
1%
19%
23%
27%
3%
13%
1%
6%
32%
29%1%
18%
25%
28%
8%
16%
8%
3%
38%
34%
22%
1%
0%
32%
29%
26%
25%
25%
43%
11%
13%
12%
5%
16%
7%
3%
8%
16%
8%
23%
27%
25%
18%
18%
1%
1%
1%
1%
30%
29%
17%
29%
16%
9%
12%
9%
10%
6%
4%
1%
23%
21%
27%
42%
1%
2%
27%
26%
12%
11%
4%
6%
29%
28%
2%
23%
28%
31%
22%
13%
13%
11%
8%
8%
6%
3%
4%
13%
19%
40%
37%
4%
23%
23%
39%
33%
14%
11%
8%
7%
4%
8%
3%
3%
35%
24%
19%
21%
1%
3%
38%
23%
28%
13%
12%
2%
14%6%
66%
26%
8%
1%
28%
24%
11%
13%
5%
5%
27%
30%
1%
1%
28%
18%
11%
13%
4%
9%
27%
37%
0%
2%
34%
21%
19%
20%
29%
29%
1%
17%
18%
11%
7%
21%
6%
10%
2%
5%
2%
7%
13%
18%
22%
41%
45%
26%
1%
2%
1%
29%
24%
10%
13%
2%
8%
32%
25%
0%
1%

Joseph Kennedy III John Hickenlooper Kamala Harris Kirsten Gillibrand
STATEWIDE 1%6%1%3%
Preferred Democrac 2020 Presidenal Nominaon Candidate - List
Registered toVote
Reg. Democrat
Registered Undeclared/Not Reg.
Party ID Democrat
Independent
Republican
Ideology Liberal
Moderate
Conservative
Media Usage Listen to Conserv. Radio
Listen to NHPR
Read Boston Globe
Read Local Newspapers
Read Union Leader
Watch WMUR
Age ofRespondent
18 to 34
35 to 49
50 to 64
65 and older
Sex ofRespondent
Female
Male
Level ofEducation
High school or less
Technical school/Some college
College graduate
Postgraduate work
FrequencyAttendingRelig. Services
Once a week or more
Once or twice a month
Few times a year
Never
2016PresidentialVote
Donald Trump
Hillary Clinton
Voted for Other
Did Not Vote
Gun Owner inHousehold
Gun Owner
Not Gun Owner
Veteran/Activein Household
Active/Veteran Military
No Active/Veteran Military
Region ofState
Central / Lakes
Connecticut Valley
Manchester Area
Mass Border
North Country
Seacoast
CongressionalDistrict
First Congressional District
Second Congressional District
1%
2%
7%
6%
1%
1%
2%
4%
58%
1%
12%
5%1%4%
2%
1%
23%
9%2%
16%
4%
1%
2%
2%
1%
8%
14%
4%
4%
5%
2%
1%
2%
3%
4%
5%
9%
6%
4%
2%
3%
4%
17%
5%
2%
5%
6%
2%
3%
8%
1%
1%
5%
2%
3%
3%
11%
5%
3%
7%
4%
1%6%
2%
5%
1%
6%
6%
9%
6%
2%1%
8%
9%
1%6%
40%
1%4%
2%7%
5%
2%2%
4%
2%5%
10%
1%
1%
3%
3%
3%
5%
8%
10%
10%
5%
1%
2%
3%
4%
11%
2%
3%6%
6%
2%
1%
4%
2%

Martin O'Malley Tim Ryan Other Undecided
STATEWIDE 13%2%0%2%
Preferred Democrac 2020 Presidenal Nominaon Candidate - List
N
184
Registered toVote
Reg. Democrat
Registered Undeclared/Not Reg.
Party ID Democrat
Independent
Republican
Ideology Liberal
Moderate
Conservative
Media Usage Listen to Conserv. Radio
Listen to NHPR
Read Boston Globe
Read Local Newspapers
Read Union Leader
Watch WMUR
Age ofRespondent
18 to 34
35 to 49
50 to 64
65 and older
Sex ofRespondent
Female
Male
Level ofEducation
High school or less
Technical school/Some college
College graduate
Postgraduate work
FrequencyAttendingRelig. Services
Once a week or more
Once or twice a month
Few times a year
Never
2016PresidentialVote
Donald Trump
Hillary Clinton
Voted for Other
Did Not Vote
Gun Owner inHousehold
Gun Owner
Not Gun Owner
Veteran/Activein Household
Active/Veteran Military
No Active/Veteran Military
Region ofState
Central / Lakes
Connecticut Valley
Manchester Area
Mass Border
North Country
Seacoast
CongressionalDistrict
First Congressional District
Second Congressional District
12%
13%
4%
0%
2%
2%
23%
18%
11%
9%
1%0%
2%
2%
5%
14%
13%
2%
2%
0%1%
2%
8%
11%
11%
16%
10%
3%
4%0%
2%
3%
2%
4%
3%
57%
10%
12%
12%
16%
4%
2%
0%2%
3%
3%
11%
14%
1%
2%
0%4%
0%
15%
18%
5%
14%
1%
3%
2%
0%
6%
2%
11%
12%
14%
18%
2%
2%
5%
0%1%
2%
3%
2%
30%
9%
12%
29%
20%
10%
0%2%
13%
12%
1%
3%0%
2%
2%
14%
7%
2%0%2%
24%
29%
16%
8%
3%
7%
6%
3%
1%
3%
6%
1%
2%
10%
16%
1%
2%
0%2%
2%
78
107
3
25
155
13
75
90
97
20
75
25
72
1
45
39
48
48
72
112
37
48
56
42
95
46
16
25
5
19
149
8
108
75
150
34
38
15
29
28
40
34
92
92
Definitely Decided Leaning Towards Someone Still Trying To Decide
STATEWIDE 66%11%24%
Definitely Decided on Candidate - Republican Primary Voters
N
204
Registered toVote
Registered Undeclared/Not Reg.
Reg. Republican
Party ID Democrat
Independent
Republican
Ideology Liberal
Moderate
Conservative
Media Usage Listen to Conserv. Radio
Listen to NHPR
Read Boston Globe
Read Local Newspapers
Read Union Leader
Watch WMUR
Age ofRespondent
18 to 34
35 to 49
50 to 64
65 and older
Sex ofRespondent
Female
Male
Level ofEducation
High school or less
Technical school/Some college
College graduate
Postgraduate work
FrequencyAttendingRelig. Services
Once a week or more
Once or twice a month
Few times a year
Never
2016PresidentialVote
Donald Trump
Hillary Clinton
Voted for Other
Did Not Vote
Gun Owner inHousehold
Gun Owner
Not Gun Owner
Veteran/Activein Household
Active/Veteran Military
No Active/Veteran Military
Region ofState
Central / Lakes
Connecticut Valley
Manchester Area
Mass Border
North Country
Seacoast
CongressionalDistrict
First Congressional District
Second Congressional District
63%
71%
14%
6%
24%
22%
65%
63%
92%
10%
17%
25%
20%
8%
58%
80%
62%
12%
7%
38%
29%
12%
71%
73%
65%
74%
72%
44%
9%
20%
14%
20%
13%
23%
19%
7%
21%
6%
15%
33%
72%
63%
62%
71%
16%
11%
5%
14%
12%
26%
33%
15%
63%
69%
12%
9%
25%
22%
76%
69%
69%
59%
7%
18%
4%
17%
17%
14%
27%
23%
73%
59%
68%
66%
8%
11%
17%
12%
19%
30%
15%
22%
76%
83%
100%
61%
17%
12%
24%
27%
68%
69%
10%
10%
22%
21%
66%
66%
9%
15%
25%
19%
69%
59%
60%
74%
55%
74%
12%
25%
8%
12%
14%
5%
19%
16%
32%
15%
31%
22%
70%
62%
9%
13%
21%
26%
122
81
155
32
13
122
64
5
100
40
57
19
37
45
38
64
54
40
122
82
18
37
86
59
80
48
16
55
16
18
11
153
68
124
134
67
28
15
64
46
21
31
104
100

Vote For Trump Vote For Other Candidate DK/Not Sure
STATEWIDE 27%19%55%
Plan on Vong for Trump in 2020 Republican Primary or Another Candidate - Republican Primary Voters
N
205
Registered toVote
Registered Undeclared/Not Reg.
Reg. Republican
Party ID Democrat
Independent
Republican
Ideology Liberal
Moderate
Conservative
Media Usage Listen to Conserv. Radio
Listen to NHPR
Read Boston Globe
Read Local Newspapers
Read Union Leader
Watch WMUR
Age ofRespondent
18 to 34
35 to 49
50 to 64
65 and older
Sex ofRespondent
Female
Male
Level ofEducation
High school or less
Technical school/Some college
College graduate
Postgraduate work
FrequencyAttendingRelig. Services
Once a week or more
Once or twice a month
Few times a year
Never
2016PresidentialVote
Donald Trump
Hillary Clinton
Voted for Other
Did Not Vote
Gun Owner inHousehold
Gun Owner
Not Gun Owner
Veteran/Activein Household
Active/Veteran Military
No Active/Veteran Military
Region ofState
Central / Lakes
Connecticut Valley
Manchester Area
Mass Border
North Country
Seacoast
CongressionalDistrict
First Congressional District
Second Congressional District
32%
19%
10%
32%
58%
49%
25%
28%
42%
18%
13%
45%
57%
58%
14%
22%
41%
29%
8%
27%
52%
70%
32%
19%
34%
35%
21%
25%
27%
9%
15%
21%
19%
31%
23%
4%
52%
44%
60%
44%
51%
87%
19%
32%
30%
18%
11%
8%
23%
39%
70%
61%
48%
43%
22%
33%
18%
20%
60%
46%
42%
28%
22%
28%
19%
25%
17%
18%
39%
47%
61%
54%
32%
28%
16%
22%
19%
19%
13%
21%
49%
53%
71%
57%
29%
17%
39%
27%
36%
72%
61%
5%
35%
10%
68%
34%
22%
24%
17%
42%
61%
24%
31%
22%
13%
54%
55%
42%
29%
23%
22%
22%
29%
15%
18%
13%
30%
21%
18%
43%
53%
64%
48%
57%
54%
22%
32%
19%
19%
59%
50%
121
83
156
31
14
122
63
5
97
38
56
19
37
45
35
64
55
43
122
82
18
37
87
60
79
50
16
53
16
17
12
151
70
123
136
65
29
15
65
45
21
30
104
101

Vote For Trump Vote For KasichVote For OtherCandidate DK/Not Sure
STATEWIDE 14%0%19%67%
Prospecve 2020 NH Republican Presidenal Primary Matchup - Trump vs. Kasich
N
208
Registered toVote
Registered Undeclared/Not Reg.
Reg. Republican
Party ID Democrat
Independent
Republican
Ideology Liberal
Moderate
Conservative
Media Usage Listen to Conserv. Radio
Listen to NHPR
Read Boston Globe
Read Local Newspapers
Read Union Leader
Watch WMUR
Age ofRespondent
18 to 34
35 to 49
50 to 64
65 and older
Sex ofRespondent
Female
Male
Level ofEducation
High school or less
Technical school/Some college
College graduate
Postgraduate work
FrequencyAttendingRelig. Services
Once a week or more
Once or twice a month
Few times a year
Never
2016PresidentialVote
Donald Trump
Hillary Clinton
Voted for Other
Did Not Vote
Gun Owner inHousehold
Gun Owner
Not Gun Owner
Veteran/Activein Household
Active/Veteran Military
No Active/Veteran Military
Region ofState
Central / Lakes
Connecticut Valley
Manchester Area
Mass Border
North Country
Seacoast
CongressionalDistrict
First Congressional District
Second Congressional District
11%
18%0%
17%
21%
72%
60%
17%
7%
3%
18%
5%
57%
65%
88%
40%
9%
22%
6%
10%
32%
23%
81%
46%
71%
15%
7%
7%
12%
14%
0%
1%
1%
19%
27%
17%
9%
23%
4%
66%
67%
75%
79%
62%
96%
5%
7%
23%
22%
26%
17%
16%
14%
70%
76%
62%
64%
9%
22%
0%18%
20%
73%
58%
16%
8%
14%
18%
25%
30%
13%
19%
59%
63%
74%
63%
22%
9%
3%
12%
14%
26%
10%
22%
65%
65%
87%
66%
28%
25%
26%
9%
2%
15%
59%
74%
9%
57%
15%
82%
22%
9%
26%
16%
52%
76%
15%
13%
21%
13%
64%
74%
23%
14%
5%
22%
10%
17%
0%
16%
25%
9%
18%
23%
35%
61%
61%
86%
60%
67%
48%
11%
17%0%
18%
19%
70%
64%
122
84
157
32
14
122
66
5
100
39
57
19
37
45
38
64
54
43
124
83
17
38
88
62
82
50
16
54
16
18
12
153
70
127
137
67
29
15
65
46
23
30
105
103