the great eastern shipping company limited corporate presentation & financial announcement fy...
TRANSCRIPT
The Great Eastern Shipping Company Limited
Corporate Presentation &
Financial Announcement FY 2001
8 May 2001

2
Corporate mission
“To be a leading service provider of marine logistics involving shipping
and offshore services with a focus on the energy sector.”
3
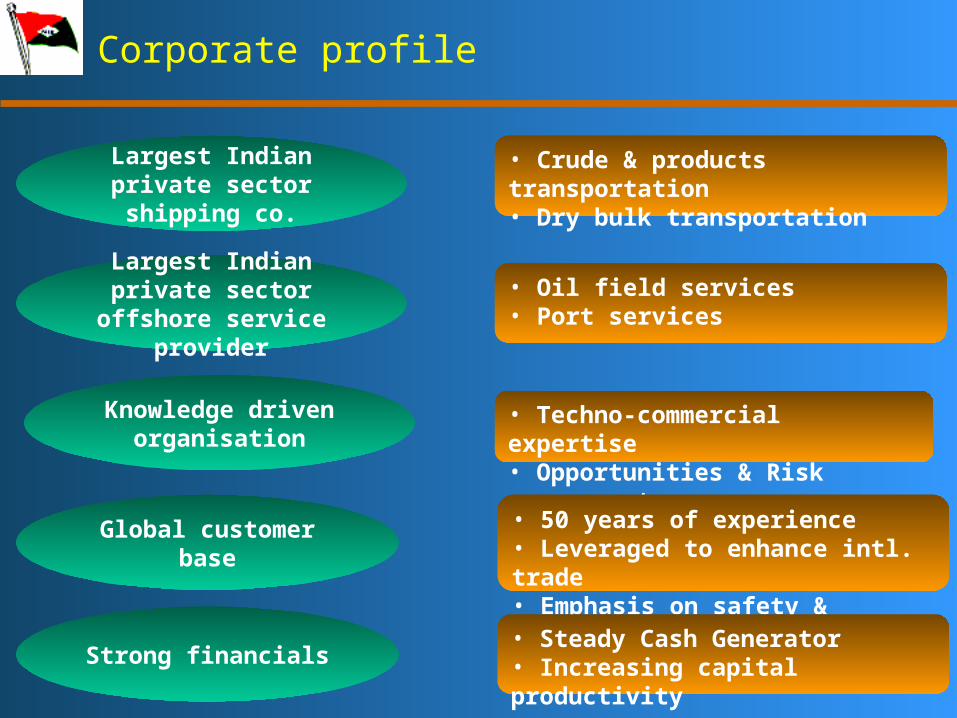
Corporate profile
Largest Indian private sector shipping co.
• Crude & products transportation• Dry bulk transportation
Largest Indian private sector offshore service provider
• Oil field services• Port services
Global customer base
• Techno-commercial expertise• Opportunities & Risk assessment
Knowledge driven organisation
• 50 years of experience• Leveraged to enhance intl. trade • Emphasis on safety & quality
Strong financials• Steady Cash Generator • Increasing capital productivity
4
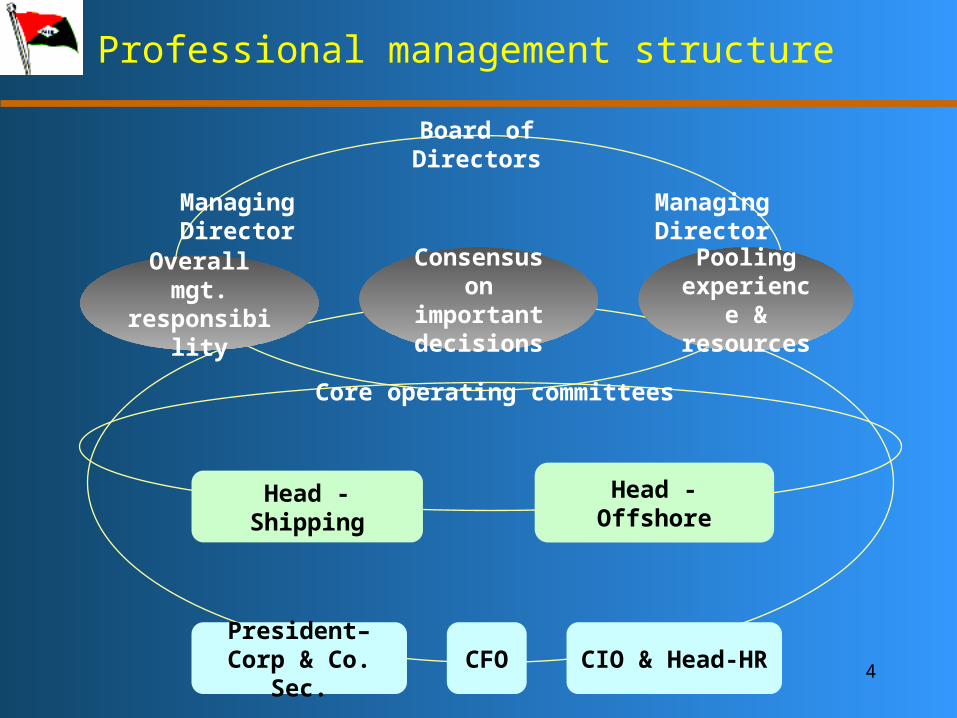
Professional management structure
Board of Directors
Managing Director Managing Director
Core operating committees
Overall mgt. responsibilit
y
Consensus on important
decisions
Pooling experience
& resources
Head - Shipping Head - Offshore
President–Corp & Co. Sec.
CFO CIO & Head-HR

5
Corporate objectives
Preferred service provider
•Focus on customer
and quality ofservice
•Constantmodernisation /upgradation ofassets
Stability & visibility of earnings
Long-term growth
•Diversified portfolio
of relatedbusinesses
•Exposure tomultiplegeographies,
tradesand customers
•Period covers:revenue visibility
•Asset expansion: supporting growthopportunities
•Stronger operatingmodel
•Inorganicopportunities
Total organisational focus on enhancing human capital contribution

6
Business segments
G.E. Shipping
SHIPPING OFFSHORE
Crude Product Dry bulk Gas Offshore services
Port support / Terminal services
• Suezmax• Aframax
• Medium range• General purpose
• Handymax• Handysize
Drilling services
Marine const. Proj & serv.
Offshore support / logistics
• Drilling rigs
• Construction barge
• Anchor handling tugs (AHT)• AHT supply vessels (AHTSV)• Dive support/supply vessels
• Harbour / terminal tugs
•

7
Shipping Business

8
Global overview
Earnings drivers
Demand drivers Supply drivers
World GDP growth
OPEC prodn
Inventory levels
Steel prodn
Ordering Scrapping
New building prices
Shipyard capacity
Replacement demand
•
Wet/dry
Wet Dry
Crude sourcing areas
Refinery location
Regional grain prodn
Wet Wet
Wet/dry
Wet/dry
Wet/dry
Age Market conditions
Regulatory parameters
Wet/dry
Wet/dry
Wet
Trade growth Trade patterns
Wet
Dry

9
Techno-commercial Capabilities
• Ability to participate in premium international trades• CAP rating initiative: 4 product tankers certified• All oil major approvals on 3 crude oil carriers• All oil major approvals on 7 MR product tankers
Fleet age
19.3
14.3
4.9
12.815
12.5
05
10152025
Dry Bulk Product Crude
No.o
f years
GES World

10
Redefining asset allocation
Details No. Aggr. DWT Avg age (yrs)
2001 1997 2001 1997 2001 1997
Crude oil tankers 3 1 355,000 150,000 5 5
Product tankers-GP 6 9 173,000 259,000 15 14
Product tankers-MR 7 6 335,000 280,000 15 14
Gas carrier 1 1 28,400 28,400 23 19
Bulk carriers 15* 17 410,000 610,000 19 17
Total 32 34 1,301,400 1,327,400
Capital employed
10640
2146
8159
4199
0
5000
10000
15000
Tankers Bulkers
2001 1997
* Includes 4 MBCs
Committed capex of US$ 136 million for 3 Aframax tankers and one product tanker
Rs
mln

11
Global customer acceptability
N America14%
Europe20%
India (Pvt)18%
India (Pub)27%
Others3%
Asia-Pacific18%India
95%
Intl.5%
FY01FY97

12
Risk Management: optimising opportunities
Market• Multiple sector exposure• Cross geo asset deployment• Period cover• Favourable value asset acquisition
Environment
• Quality assets – intl. certifications• Stringent safety practices• Global oil pollution response contract
Commercial
• Pre-purchase inspection process• Ongoing maintenance & inspection
Technical
• Operational• Credibility assessment
RISK MANAGEMENT
13
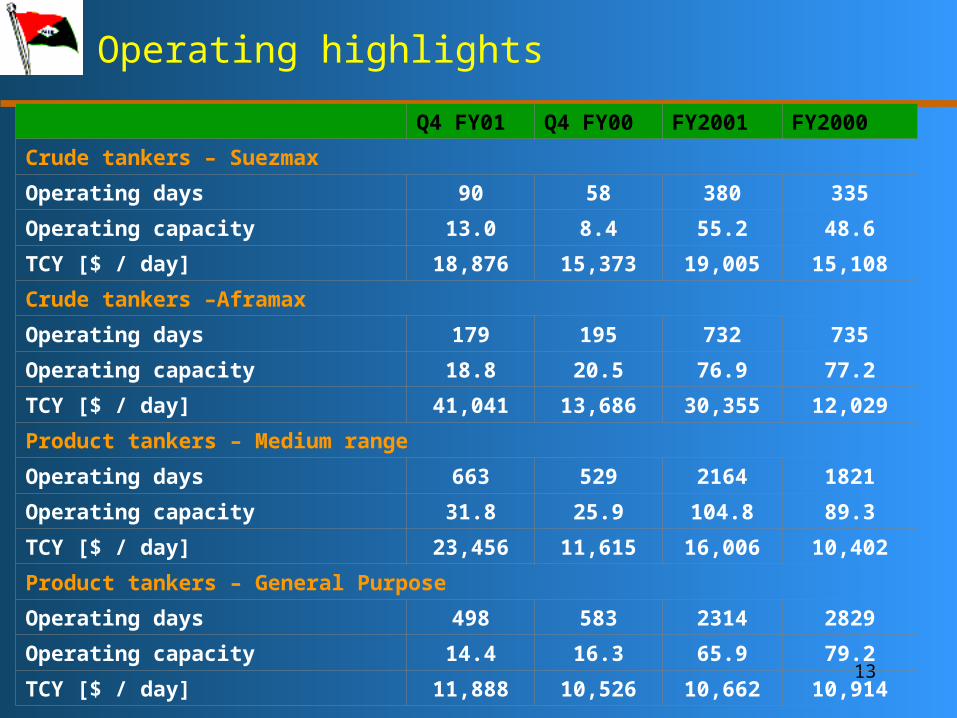
Operating highlights
Q4 FY01 Q4 FY00 FY2001 FY2000
Crude tankers – Suezmax
Operating days 90 58 380 335
Operating capacity 13.0 8.4 55.2 48.6
TCY [$ / day] 18,876 15,373 19,005 15,108
Crude tankers –Aframax
Operating days 179 195 732 735
Operating capacity 18.8 20.5 76.9 77.2
TCY [$ / day] 41,041 13,686 30,355 12,029
Product tankers – Medium range
Operating days 663 529 2164 1821
Operating capacity 31.8 25.9 104.8 89.3
TCY [$ / day] 23,456 11,615 16,006 10,402
Product tankers – General Purpose
Operating days 498 583 2314 2829
Operating capacity 14.4 16.3 65.9 79.2
TCY [$ / day] 11,888 10,526 10,662 10,914

14
Operating highlights
Q4 FY01 Q4 FY00 FY2001 FY2000
Bulk carriers – Handymax
Operating days 827 940 3485 3398
Operating capacity 32.2 36.2 137.9 130.8
TCY [$ / day] 7,678 6,596 8,095 6,569
Bulk carriers – Handysize
Operating days 258 245 1044 1221
Operating capacity 7.0 6.6 28.4 33.0
TCY [$ / day] 5,512 5,832 6,715 5,095
Operating capacity in million DWT-days

15
Freight rates: current perspective
52,000
40,000
25,00020,000
13,0009,400
10,700 10,100 8,700 7,000 6,000 5,7000
15,000
30,000
45,000
60,000
Suez Afra MR GP H-max H-Size
10 year H / L
US$ p
er d
ay
High Low
30,000 25,00
019,00
09,000 6,000
Current
14,000

16
Future outlook
Freight rates off Q4 peaks
• OPEC supply cut• Slowdown in U.S. economy
Positive outlook through FY 2002
• IEA estimated oil demand increase by 1.8%• Marginal fleet accretion – 4% of current fleet to be delivered in 2001
Weakness expected in FY 2002
• Aggressive fleet additions: 12% of existing fleet on order• 30m DWT additions by 2002• Reduced scrapping trends: <6m DWT in 2000 & YTD 2001
Supply overhang expected over next year
• Weakening global economic prospects• 6% demand growth required to maintain existing freight rates
DRY BULK
TANKERS

17
Revenue visibility
• 35% of FY 2001 revenues already covered• Targeting enhanced crude coverage• Limited risk management in dry bulk• Monthly trend assessment & cover reviewed by mgt
Dry Bulk
Open94%
Covered6%
FY02 operating capacity covered
Crude
Open61%
Covered39%
Product
Open65%
Covered35%
Rs 674 million covered
Rs 1057 million covered
Rs 93 million covered

18
Future direction
Enhanced focus on tankers
Modernisation of asset base: greater intl.
exposure
Dry bulk expansion linked with
attractive market opportunities
De-risking strategies
Enhanced customer focus
Creation of a sustainable brand

19
Offshore Business

20
Offshore business matrix
Drilling service
s
Port services
Marine construction
Air logistics
Marine logistics

21
Global sector outlook
Trend of range-bound oil prices
• Brent crude: FY2001 US$ 22-28 / barrel
Enhanced exploration activity
• Increased demand for offshore services
Buoyant gas prices
• Emergence of limited number of strong players
• Indications of US exploring gas production indigenously
Offshore industry in consolidation phase
22
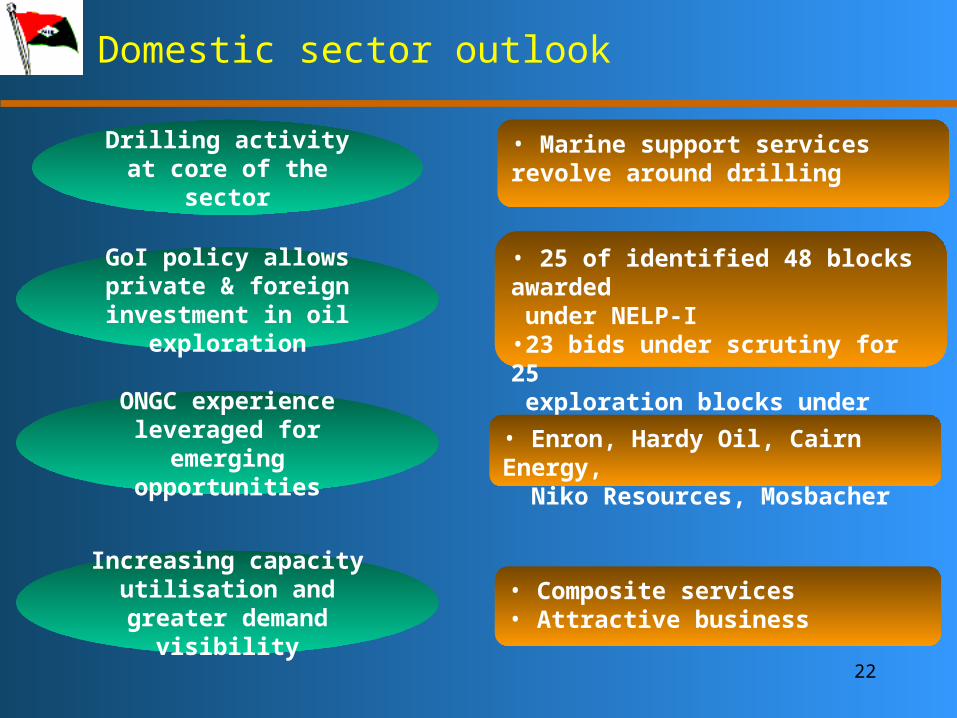
Domestic sector outlook
Drilling activity at core of the sector
• Marine support services revolve around drilling
GoI policy allows private & foreign investment in oil
exploration
• 25 of identified 48 blocks awarded under NELP-I•23 bids under scrutiny for 25 exploration blocks under NELP-2
Increasing capacity utilisation and greater
demand visibility
• Composite services• Attractive business
ONGC experience leveraged for emerging
opportunities
• Enron, Hardy Oil, Cairn Energy, Niko Resources, Mosbacher

23
Company position
Initial investment focused on
ONGC operations
Leading service
provider within the sector
Developed long experience & productive
relationships
Improving profitability
Poised to capitalise on
emerging opportunities
Increasing E&P
operations

24
Offshore fleet profile
Details No. Avg age (yrs)
2001 1997 2001 1997
Oil drilling rigs 2 2 27 23
Offshore support vessels 14 10 16 15
Harbour tugs 10 2 6 11
Construction barge 1 1 23 19
Capital employed
2068
2817
0
1000
2000
3000
Offshore
1997 2001
Rs mln

25
Offshore Support Vessels
Leading service provider in the
sector
Main competition from foreign contractors
Servicing all E&P operators
in India
Further demand from NELP and E&P
expansion programmes
Foray into specialised
services: deep water drilling

26
Port services
Servicing public & private sector
port trusts
Competition from port authority-owned
infrastructure & further acquisition
Focused on market led
growth
Corporatisation of major ports / devlpt
of minor open greater opportunities
Further demand from upcoming LNG / chemical
terminals
27
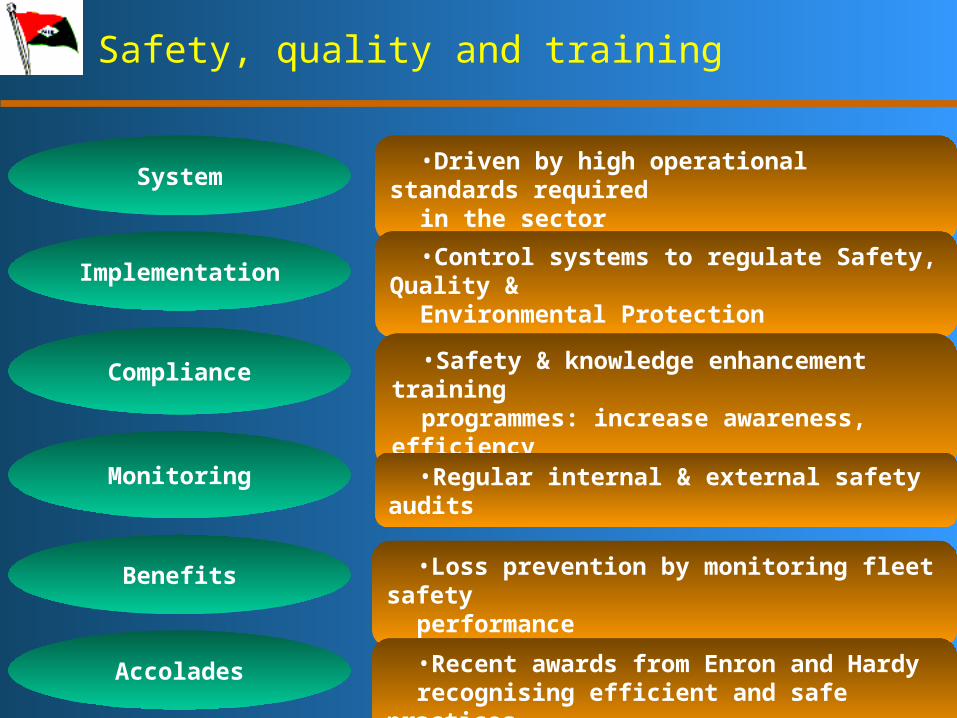
Safety, quality and training
System•Driven by high operational standards
requiredin the sector
Implementation
Compliance
Monitoring
Accolades
Benefits
•Control systems to regulate Safety, Quality &Environmental Protection
•Safety & knowledge enhancement trainingprogrammes: increase awareness, efficiency
•Regular internal & external safety audits
•Loss prevention by monitoring fleet safetyperformance
•Recent awards from Enron and Hardyrecognising efficient and safe practices

28
Operating highlights
Q4 FY01 Q4 FY00 FY2001 FY2000
Drilling rigs
Operating days 102 138 652 607
Operating rate [$ / day] 22,674 27,474 22,179 30,306
Support vessels
Operating days 1072 1186 3,790 3,621
Operating rate [$ / day] 4,581 4,018 4,271 4,130
Harbour tugs
Operating days 922 721 3,272 2,449
Operating rate [$ / day] 130,063 152,397 146,912 139,614
Construction barges
Project revenues [Rs mln] N/A N/A 263 758

29
Revenue visibility
Rigs
Open39%
Covered61%
FY02 operating capacity coveredOSV
Open44%
Covered56%
Harbour Tugs
Open59%
Covered41%
Construction barges
Open90%
Covered10%
• 57% of FY2001 revenues covered
Rs.500 million covered Rs.198 million covered
Rs.543 million covered Rs.10 million covered

30
Revenue visibility
FY97-98
ONGC45%
Hardy19%
Mosbachor
20%
Others11%
L&T5%
FY97-98
ONGC30%
Enron15%
Cairn8%
Ports16%
Others17%
Hardy14%
FY00-01ONGC18%
Enron18%
Cairn16%
Ports33%
Others9%
Hardy6%
FY00-01
ONGC79%L&T
4%
Others17%
OSVs / Tugs
Rig / Construction

31
The Future
• Commitment to deepwater drilling services - enhanced business prospects– Acquisition of Malaviya Ten (US$20 m)– 2 PSVs ordered - US$26 m - delivery 2002
• Future expansion linked to E&P activity in India– Mumbai High redevelopment programme– Ravva Phase II - KG basin– Lakshmi Field – Enron’s Panna-Mukta field programme
• Potential opportunities from NELP

32
Financial performance

33
Financial overview
• Market capitalisation: Rs. 7,178 million*• Cash generation of Rs. 3,782 million in FY2001• Net Worth Rs. 10,910 million• Capital employed Rs. 20,124 million - Debt:Equity 0.84:1• Book Value per share: Rs. 50 per share• NAV of Assets: Rs.67 per share*• AAA rating by CRISIL since 1995• Uninterrupted 15-year dividend record
*As on 7 May 2001

34
Financial performance
87819641 9808 9945
10813
35304206
3836 3685
4740
1364 16421264 1068
1774
4.74
5.71
4.39 4.1
8
0
2000
4000
6000
8000
10000
12000
1996-97 1997-98 1998-99 1999-00 2000-01
Rs
mln
0
2.5
5
7.5
10
Rs
Total income
EBITDA
PAT
EPS

35
Capital employed
11586 11990 12109 11281 10910
8358 8317 9348 100549214
0
5000
10000
15000
20000
25000
1996-97 1997-98 1998-99 1999-00 2000-01
Rs m
ln Debt
Equity
19,944 20,307 21,457 21,33520,124

36
Operating highlights
Q4 FY01 Q4 FY00 FY2001 FY2000
TCE Income 2783 2040 9167 8115
Operating profit 1335 1035 4740 3684
Cash profit 1037 818 3782 2916
PAT 546 323 1774 1067
EPS (Rs.) 2.3 1.2 8.0 4.1
21552002
2228
2783
485328 415
546
0
500
1000
1500
2000
2500
3000
Q1 FY2001 Q2 FY2001 Q3 FY2001 Q4 FY2001
Rs
mln TCE Income
PAT

37
Business distribution
2000-01
64% 76%
14% 20%
Others22% 4%
Composition of capital employed
Rs.20,124 mn
Composition of Operating Profit
(PBDIT)
Rs.4,740 mn*
* - incl.profit on sale
Shipping
Offshore

38
Financial analysis
FY01 FY00
OPM 42% 32%
NPM 16% 11%
RONW 16% 9.5%
EPS 8.00 4.10
CEPS 17.2 11.3
Debt/Equity 0.84 0.89
Interest cover 6.6 6.1

39
Value initiatives
Optimisation of Capital structure
•Buyback of equity shares•Prepayment of high cost debt
Cost Reduction initiatives
Reduced non-operating assets
•Appointed Accenture to advise•Cost savings in FY 2001: Rs.195 million•Expected savings in FY 2002: Rs.250 million
Enhancing decision support
systems
•Aggressive divestment of properties •Reduced portfolio of equities / commodities
•Accenture implementation of integrated IT package in shipping division

40
Buyback objectives
Strong cash generation expected• Positive operating outlook• Sale of non-core assets
Value enhancement• Book Value per share: Rs.50• NAV per share: Rs.67• Optimal Debt / Equity balance
Buy back II – Rs 1,000 million – maximum Rs 42 per share
Adequate fund availability for near-term capital expenditure
• To be funded from internal accruals and
higher leveraging

41
Concerns: pro-active redressal
Equities trading •No investments, liquidating existing portfolio•Current exposure: Rs. 20 million
Commodities trading
Property exposure
Forex exposure
Promoter participation
High Equity base
•Reduced substantially over last 3 years•Close positions by FY 2002
•Demerged property division•Pro-active liquidation of assets
•Cautious approach•Exposure on operations driven forward cover
•Buyback I: Rs. 1.5 billion; Equity base 16% •Second tranche to be cleared at AGM
•Current shareholding 20%•Creeping acquisition

42
Sector position
Global acceptability
De-risking business
Focusing on Returns
Creation of brand identity
Modernising infrastructure
Sector leadership: global focus
Enhancing stakeholder
value

43
Visit us at www.greatship.com