the great lakes fisheries leadership institute introduction to fisheries management daniel hayes...
TRANSCRIPT

The Great Lakes Fisheries Leadership Institute
Introduction to Fisheries Management
Daniel Hayes
Department of Fisheries and Wildlife
Michigan State University

What is Fisheries Management?
The manipulation of aquatic organisms (POPULATIONS), aquatic environments (HABITAT), and human users (PEOPLE) to produce sustained benefits for humanity (Nielsen 1999 in “Inland Fisheries Management in North America, edited by Kohler and Hubert)

• Because we are managing for human benefits, we need to decide what is “beneficial”

1. Set Goals
2. Examine the Resource
3. Analyze the Situation and Set Objectives
4. Prescribe Treatment
5. Organize Personnel and Resources
6. Implement
7. Evaluate
8. Maintain
9. Publish
The Eight (Nine) Steps of Management

The Eight Steps of Management
1. Set Goals
2. Examine the Resource
3. Analyze the Situation and Set Objectives
4. Prescribe Treatment
5. Organize Personnel and Resources
6. Implement
7. Evaluate
8. Maintain
9. Publish
Critical P
oints For P
ublic Involvement

The Eight Steps of Management
What is “the” most critical step?

The Eight Steps of Management
What is “the” most critical step?
Setting Goals and Objectives

The Eight Steps of Management
Goals: Broad statement of desired outcome of management
Healthy ecosystemGood fishingProductive forestSafe water

Evolution of Fishery Management Goals
Maximum utilization (fisheries are unlimited)
Maximum sustainable yield (MSY)
Optimum sustainable yield (OSY)
OSY + Healthy ecosystem/Biotic Integrity

The Public Trust Doctrine is a common law doctrine. The essence of the Doctrine is the legal right of the public to use certain lands and waters. The right may be concurrent with private ownership. The legal interest of the public is not absolute; it is determined by a balancing of interests.
The rights of the public are vested in each STATE as owner and trustee of Trust lands. The Public Trust Doctrine arises from the fact that Trust lands are special in nature physically and legally. Historically, the public use of these waters and lands was crucial for sustenance, travel, and commerce.
B. Black’s Law Dictionary defines the public trust doctrine as a doctrine which, "Provides that submerged and submersible lands are preserved for public use in navigation, fishing, and recreation and the state, as trustee for the people, bears responsibility of preserving and protecting the right of the public to the use of the these lands and the waters above them for those purposes."
Public Trust Doctrine

Fishery Management Objectives
• Specific
•Measurable
•Achievable
•Related to goal
• Time-constrained

Fishery Management Objectives
• “Better Fishing”– Not S, Marginally M, A, R, Not T
• Increase catch rates of Chinook salmon– Marginally S, M, A, R, not T
• Increase average catch rates of Chinook salmon to 0.5 fish/hour or more by 2007– S, M, maybe A, R, T

Fishery Management Objectives
• Increase average catch rates of Chinook salmon to 0.5 fish/hour or more by 2007 by implementing bag limits– By adding the phrase “by implementing bag
limits”, we are mixing an objective with a method to achieve the objective
– We don’t want to do this because it constrains the way we think about achieving the objective

Fishery Management Tools
• Populations– Stocking– Fish Community Manipulation
• People– Fishing Regulations– Allocation issues
• Habitat– Wetland preservation– River restoration– Water quality management

Population Dynamics

Time
Time
Steady
Irregular
Num
bers
Num
bers

Irruption
Time
Time
Spasmodic
Cyclical
Num
bers
Num
bers
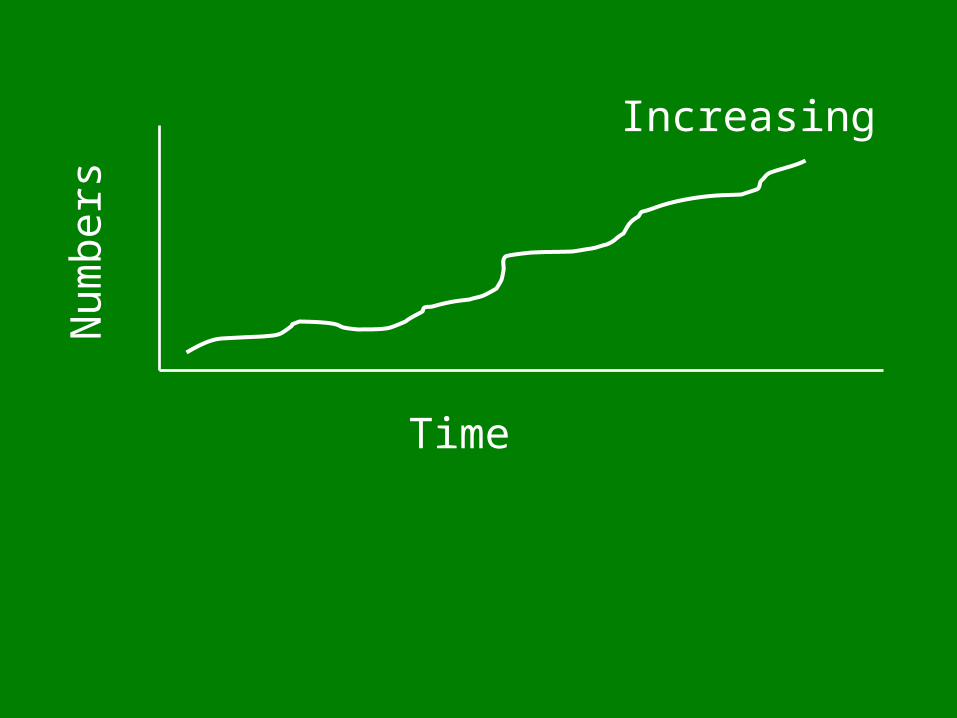
Time
Num
bers
Increasing

Thought Question
You stock a pond with 10 fish.
What factors would influence the population dynamics of this new population?

Factors affecting population
• Birth rate
• Death rate
• Immigration/Emigration

Time
Num
bers
B = D B > D B < D

Factors affecting population
• Birth rate– Sex Ratio– Fecundity (number of eggs)– Age structure– Spawning habitat
• Death rate– Predators (including people!)– Environment– Food Resources– Age structure

A
B
A
B
C

Key Points
• What is the rate of increase when population is reduced
• What is the eventual number that is achieved
• How does the rate of increase and number achieved vary in response to the fishery, habitat changes, or changes in other aquatic populations?

Birth Rates
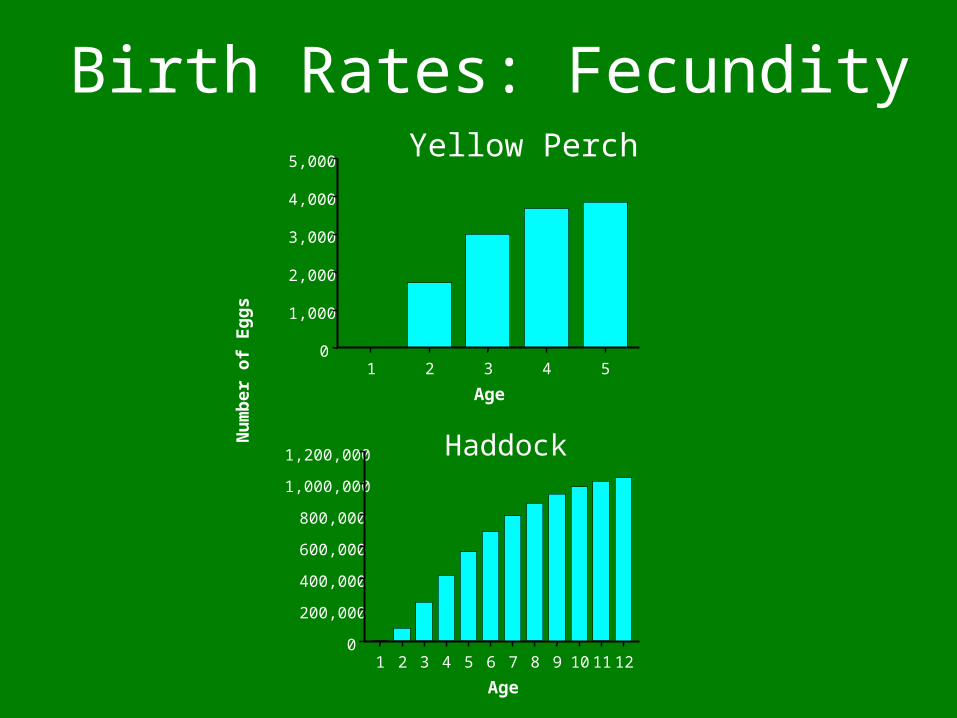
Birth Rates: FecundityYellow Perch
1 2 3 4 50
1,000
2,000
3,000
4,000
5,000
Age
1 2 3 4 5 6 7 8 9 10 11 120
200,000
400,000
600,000
800,000
1,000,000
1,200,000
Age
Nu
mb
er o
f E
gg
s
Haddock

Reproductive Guilds
A. Nonguarders -open substrate spawners -brood hiders - lots of small eggs
B. Guarders -substrate choosers -nest spawners -larger eggs
C. Bearers -external bearers -internal bearers -larger offspring

Hermaphroditism•Protandry
•Start life as a male, then become female•Sea basses and groupers
•Protogyny•Start life as a female, then become male•Wrasses, parrot fish
•Self-fertilizing•Simultaneously male and female•Sea basses and grouper
•Parthenogenesis•Female only•Some mollies – in this case, male is needed to initiate egg development but no gene transfer•Very common in Cladocerans (Daphnia, or “water fleas”)

Survival Rate

Survival Curves
Time
Num
bers
in C
ohor
t
Mammals
Birds
Fish

Lifetime Changes in Size
Birth Weight
Adult Weight
Ratio
Mammals
(Humans)
3,000 g 68,000 g 23
Birds
(Mallard)
50 g 1,100 g 22
Fish
(Yellow Perch)
0.001 g 300 g 300,000

Time
Nu
mb
er
in C
oh
ort
Chinook SalmonYellow Perch
Chinook Salmon - Semelparous
Yellow Perch - Iterparous

0.0001 0.01 1 100 10,000 1,000,0000
20
40
60
80
100
Weight (grams)
Pe
rce
nt
Su
rviv
al
0.0001 0.01 1 100 10,000 1,000,0000
2
4
6
8
10
12
14
Weight (grams)
Mo
rta
lity
Ra
te

Longevity: Age 20 Age 8 Age 4
Age
Nu
mb
er i
n C
oh
ort
0 2 4 6 8 10 12 14 16
0
200
400
600
800
1,000
1,200
20% mortality 50% mortality 80% mortality

Natural Mortality=20%Fishing Mortality=10%
Natural Weight (g) Yield (kg)Age Population Catch MortalityTotal Deaths
1 1000 86 173 259 67 5.82 741 64 128 192 483 30.93 549 47 95 142 1177 55.84 407 35 70 105 1968 69.15 301 26 52 78 2714 70.66 223 19 39 58 3354 64.77 165 14 29 43 3861 55.18 122 11 21 32 4269 45.29 91 8 16 24 4569 35.8
10 67 6 12 17 4803 27.9
460.9

1 2 3 4 5 6 7 8 9 100
100
200
300
400
500
600
Age
Nu
mb
er
Fishing Mortality=10%
1 2 3 4 5 6 7 8 9 100
100
200
300
400
500
600
Age
Nu
mb
er
Catch Natural Deaths
Natural Mortality=20%
Fishing Mortality=50%Natural Mortality=20%

Natural Mortality=20%Fishing Mortality=50%
Natural Weight (g) Yield (kg)Age Population Catch Mortality Total Deaths
1 1000 360 144 503 67 24.12 497 179 71 250 483 86.23 247 89 35 124 1177 104.44 122 44 18 62 1968 86.75 61 22 9 31 2714 59.36 30 11 4 15 3354 36.47 15 5 2 8 3861 20.88 7 3 1 4 4269 11.49 4 1 1 2 4569 6.1
10 2 1 0 1 4803 3.2
438.6Natural Mortality=20%Fishing Mortality=20%
Natural Weight (g) Yield (kg)Age Population Catch Mortality Total Deaths
1 1000 165 165 330 67 11.02 670 110 110 221 483 53.33 449 74 74 148 1177 87.24 301 50 50 99 1968 97.75 202 33 33 67 2714 90.36 135 22 22 45 3354 74.87 91 15 15 30 3861 57.78 61 10 10 20 4269 42.89 41 7 7 13 4569 30.7
10 27 5 5 9 4803 21.6
567.3

Natural Mortality=20%Fishing Mortality=50% beginning at age 3
Natural Weight (g) Yield (kg)Age Population Catch Mortality Total Deaths
1 1000 0 181 181 67 0.02 819 0 148 148 483 0.03 670 241 96 337 1177 283.84 333 120 48 168 1968 235.65 165 59 24 83 2714 161.36 82 30 12 41 3354 99.07 41 15 6 21 3861 56.68 20 7 3 10 4269 31.19 10 4 1 5 4569 16.5
10 5 2 1 3 4803 8.6
892.5Fishing Mortality=50% beginning at age 7
Natural Weight (g) Yield (kg)Age Population Catch Mortality Total Deaths
1 1000 0 181 181 67 0.02 819 0 148 148 483 0.03 670 0 122 122 1177 0.04 549 0 99 99 1968 0.05 449 0 81 81 2714 0.06 368 0 67 67 3354 0.07 301 108 43 152 3861 418.28 150 54 22 75 4269 229.69 74 27 11 37 4569 122.0
10 37 13 5 19 4803 63.7
833.5

Surplus Production
Fishing Effort
Yie
ld p
er n
ewbo
rnGrowth > Mortality Growth < Mortality

Yie
ld
Effort
Age 1Age 2
Age 3
Surplus Production

Adults
AdultsNum
ber
of Y
oung
Adults
Reproduction Revisited: Stock and Recruitment

Integrating Population Dynamics with Fishery Management Tools
• Populations– Stocking increases births– Fish Community Manipulation alters survival rate and age structure
• People– Fishing Regulations alters survival rate and age structure– Allocation issues * Primarily a human issue*
• Habitat– Wetland preservation alters birth rate– River restoration alters birth rate– Water quality management alters birth rate and survival rate