the great recession and the changing distribution of … great recession and the changing...
TRANSCRIPT

UCD GEARY INSTITUTE
DISCUSSION PAPER SERIES
The great recession and the changing distribution
of economic vulnerability by social class: the Irish
case
Bertrand Maître
Economic and Social Research Institute, Dublin
Christopher T Whelan
School of Sociology and Social Policy, Queen’s University Belfast
School of Sociology and Geary Institute, University College Dublin
Geary WP2013/12
July 2013
UCD Geary Institute Discussion Papers often represent preliminary work and are circulated to encourage
discussion. Citation of such a paper should account for its provisional character. A revised version may be
available directly from the author.
Any opinions expressed here are those of the author(s) and not those of UCD Geary Institute. Research
published in this series may include views on policy, but the institute itself takes no institutional policy
positions.

2
The Great Recession and the Changing Distribution of Economic
Vulnerability by Social Class: The Irish Case
Christopher T. Whelan* and Bertrand Maítre **
School of Sociology & Sociology Policy, Queen’s University Belfast & School of Sociology
& Geary Institute, University College Dublin,** Economic & Social Research Institute,
Dublin
JEL Classification
I32 - Measurement and Analysis of Poverty I38 - Government Policy; Provision and Effects of Welfare Programs

Abstract Ireland provides an interesting case study of the distributional consequences of the Great
Recession. To explore such effects we develop a measure of economic vulnerability based on
a multidimensional risk profile for income poverty, material deprivation and economic stress.
In the context of conflicting expectations of trends in social class differentials, we provide a
comparison of pre and post-recession periods. Our analysis reveals a doubling of levels of
economic vulnerability and a significant change in multidimensional profiles. Income
poverty became less closely associated with material deprivation and economic stress and the
degree of polarization between vulnerable and non-vulnerable classes was significantly
reduced. Economic vulnerability is highly stratified by social class for both pre and post-
recession periods. Focusing on absolute change, the main contrast is between the salariat and
the non-agricultural self-employed and the remaining classes; providing some support for
notions of polarization. In terms of relative change the higher salariat, the non-agricultural
self-employed, the semi-unskilled manual and those who never worked gained relative to the
remaining classes. This provides support the notion of ‘middle class squeeze’. The changing
relationship between social class and household work intensity reflected a similar pattern.
The impact of the latter on economic vulnerability declined sharply, while it came to play an
increasing role in mediating the impact of membership of the non-agricultural middle classes.
Responding to the political pressures likely to be associated with ‘middle class squeeze’
while sustaining the social welfare arrangements that have traditionally protected the
economically vulnerable presents formidable challenges in terms of maintaining social
cohesion and political legitimacy.
Key words Great recession, economic vulnerability, social class, middle class squeeze,
household work intensity.

Ireland’s Macroeconomic Roller Coaster Ireland represents a particularly interesting case study of the distributional impact of
pronounced macroeconomic fluctuations and the consequences for levels and distribution of
poverty and social exclusion. Evaluating the consequences of the Great Recession in Ireland
is significantly influenced by the outcome indicator on which one focuses.i In this paper we
explore the extent to which going beyond manifest indicators to develop a multidimensional
understanding of latent economic vulnerability, provides further insight into the manner in
which its consequences are distributed across social classes and mediated by household work
intensity.
Ireland has seen quite remarkable macroeconomic fluctuations over the past two decades,
with the fastest economic growth rates in the OECD during the so-called ‘Celtic Tiger’ boom
being followed by a recession which had a more negative impact on national output in Ireland
than in any other OECD country. The decade of exceptionally rapid growth from the mid-
1990s saw the numbers employed expand dramatically and unemployment reduced to 4%,
but included an unsustainable credit-fuelled expansion in the construction sector and
unbridled property price boom. Recession from 2008 onwards went together with a bursting
of the property bubble and related tax revenues, a collapse in asset values, a banking crisis of
unprecedented proportions and a ballooning fiscal deficit. This toxic combination meant that
by late 2010, despite substantial increases in taxation and expenditure cuts, the Irish
government had to avail of a ‘bail-out’ from the Trokia (Whelan, 2010).
The high water mark of Ireland’s economic boom was in 2007, with the global financial crisis
and the bursting of the domestic property bubble leading to an unprecedented contraction in
GDP in 2008-2009. The economy then ‘flatlined’ in 2010 and 2011. The impact of the
recession was to raise unemployment to 14% by 2011, despite substantial net emigration. The

3
number of individuals in households characterised by very low work intensity, employing the
measure incorporated in the EU poverty and social exclusion target, rose from 16% in 2008
to 34% in 2011.
The Distributional Consequences of the Great Recession in Ireland A frequent refrain during recent debates on welfare cuts and tax increases has related to the
need to “protect the vulnerable”. However, it is far from clear that a consensus exists on who
is to be included under this heading. Our main focus will be on the distribution of economic
vulnerability by social class, employing a version of the European Socio-economic
Classification (ESeC). This schema is based on Goldthorpe’s (2006) theoretical conception of
social class, focusing on differentiation in employment status and regulation of employment
as viable responses to issues of monitoring and asset specificity (Rose and Harrison, 2006).
Use of this schema allows us to take into account not only the hierarchical aspect of class but
also the impact of different forms of employment.ii
One of the primary objectives of schemas such as ESeC is to bring out the constraints and
opportunities typical of different class positions. Use of the schema facilitates evaluation of
competing claims relating to trends in the strength of class relationships. In the Irish case the
polarisation claim is implicit in the arguments of a variety of social critics and the trade union
movement that the response of the state to the economic crisis has been deeply flawed,
involving not only a failure to protect the vulnerable but the imposition of major sacrifices on
those on low and middle incomes (Social Justice Ireland, 2013, TASC, 2012). In contrast, the
argument for the diminishing importance of class relationships emerges from the proponents
of the ‘individualization’ thesis who emphasise the impact of globalization, the erosion of
traditional career patterns and the undermining of the buffering capacity of the welfare state
(Beck, 2007). From this perspective, the context provided by the crisis in an economy as open
as Ireland faced by demands for extreme fiscal austerity could provide a particularly

4
favourable environment for the emergence of such tendencies. An alternative perspective
argues not for the ‘death of social class’ but for important changes in the traditional
distribution of life chances across such classes. The term ‘middle class squeeze’ originates
from the US discussion. iii
There it refers to the relative decline in earnings of middling
groups and to the depletion of their wealth as a result of ‘overspending’ in order to maintain
established standards of living (PRC, 2012). Such overspending is seen to be closely
associated with easier access to credit. It is indeed the case that a distinctive feature of the
recession in Ireland has been the scale of debt problems (Russell et al 2012). Increasing debt
levels, public sector pay cuts and pension levies, increasing progressivity in taxation and the
difficulties being experienced by the self-employed have resulted in the notion of ‘middle
class squeeze’ coming to have considerable resonance in popular debate in Ireland. This was
reflected in the devotion of a special series in the influential Irish Times to the topic.iv
In a context where demands to “protect the vulnerable” increasingly co-existed with claims of
“can’t pay won’t pay”, the government sought to reconcile the imperatives of reducing the
fiscal deficit and dealing with a legacy of sovereign bank debt while retaining political
legitimacy in relation to the distribution of the burden of adjustment. Tripartite social
partnership agreements were regularly negotiated in Ireland between 1987 and 2009 in the
context of a catch all party political system with weak ideological divisions. These
relationships did not survive the introduction of a wide range of austerity measures. However,
the government still sought to bring the public sector unions on board. In mid-2010 these
unions accepted a deal that offered assurances that there would be no further pay cuts or
compulsory redundancies in return for the active implementation of public sector reform –
the “Croke Park Agreement” (Dellepiane & Hardiman, 2012 a & b ).
Nolan et al (2013) concluded that while Ireland was one of the counties most affected by the
downturn in relation to household income, in relative terms the principal part of the burden in
5
relation to net income was borne by higher income groups. However, considerable
disagreement continues to exist regarding the degree to which government policies have
succeeded in distributing the burden in an equitable manner. In what follows we seek to
develop an appropriate multidimensional indicator that goes beyond income in order to
document the consequences of the Great Recession for the distribution of economic
vulnerability across social classes.
We also seek to seek to establish the extent to which changing class patterns are mediated by
household work intensity. The EU measure was developed in the context of an increasing
European emphasis on work as a route out of poverty and vulnerability and an emphasis on
the social investment approach to making efficient use of social capital and facilitating access
to the labour market (Morel, Palier and Palme, 2012). However, the extent to which this
approach does reduce poverty and social exclusion remains a matter of debate (Cantilllon,
2011).
Data and Measures
Data Our analysis focuses on the period 2004-2011 for which comparable data are available from
the Irish component of the European Survey of Income and Living Conditions (EU-SILC).
This information is obtained via a dedicated household survey, conducted by the Central
Statistics Office. This has been carried out annually since 2003 with a total completed sample
size of the order of 5,000 to 6,000 households and 13,000-14,000 adult individuals in each
year (except for the first year when the sample was about half this large).
The analysis reported here is focused at the individual level. Where household or household
reference person (HRP) characteristics are involved these have been allocated to each
individual.

6
Income Poverty Income poverty is defined in terms of median disposable income adjusted for household size
employing the Irish national equivalence scale. Our analysis of trends in income poverty
focuses on those below 60% of median income. In our subsequent analysis of economic
vulnerability we employ a 4-category income variable that distinguishes those below 50%,
between 50-60%, between 60-70% and above 70%.
Material Deprivation The limitations of income in capturing inability to participate due to inadequate resources and
the value of incorporating measures of material deprivation have been increasingly
recognised and the values (Nolan and Whelan, 2011). The measure we employ is labelled
“basic deprivation”. It comprises household and HRP items, as set below, relating to enforced
absence of life-style items.
Two pairs of strong shoes
A warm waterproof overcoat
Buy new rather than second hand clothes
Eat meals with meat, chicken or fish (or vegetarian equivalent) every second day
Have a roast joint (or its equivalent) one a week.
Go without heating during the past twelve months
Keeping the home adequately warm
Replace any worn out furniture
Buy presents for family or friends once a year
Have family or friends for a drink or meal once a month
Have a morning, afternoon or evening out in the past fortnight for entertainment
Across the Irish SILC 2004-2011 waves it has a Cronbach alpha reliability of 0.821. In the
analysis that follows we distinguish between those experiencing enforced deprivation on two
or more items and all others.
Economic Stress This indicator is constructed from a set of items relating to difficulty in making ends meet,
inability to cope with unanticipated expenses, structural arrears and housing costs being a

7
burden. Since the items had variable numbers of categories which have dichotomized the
categories before aggregating them.
The first item relating to ability to make ends meet is based on the following question.
“A household may have different sources of income and more than one household member
may contribute to it. Thinking of your household's total income, is your household able to
make ends meet, namely, to pay for its usual necessary expenses?” Reponses indicating
“great difficulty” or “difficulty” have been given a value of 1 while the remaining categories
have been scored as zero.
Household were define as having a problem with arrears (in the past 12 months) where they
were unable to avoid arrears relating to mortgage or rent, utility bills or hire purchase
instalments. Those households experiencing such problems were given values of 1 while the
remainder were scored as 0.
Those households reporting that they were unable to cope with unexpected expenses were
allocated scores of 1 while the remainder were allocated values of 0.
The indicator relating to the financial burden of total housing cost was based on the question
set out below.
Think of your total housing costs including mortgage repayment or rent, insurance and
service charges. To what extent are these costs a financial burden to you? Responses
indicating a “heavy” or “slight” burden were scored as 1 while the remaining category was
assigned a value of 0.
We have defined those experiencing difficulties in relation to 3+ of the four items as
experiencing economic stress. The measure has an alpha of 0.738

8
Between 2004 and 2011 16 % of individuals fell below the 60% income line, 15 % were
above the deprivation threshold and 17 % above the stress threshold. The choice of thresholds
ensures that comparison across variables are largely unaffected by differences in marginal
distributions.
Work Intensity Work intensity is measured at the household level and shows the proportion of possible
working time in the previous year that the working-age household members spent at work. It
can range from 0 (no working-age adult at work) to 100 per cent (all working-age adults
worked full-time, full-year). Working-age, for this purpose, is defined as being between the
ages of 18 and 59, excluding students under age 25. Adults age 60 and over are excluded
from consideration entirely. Children are assigned a work intensity score based on the
working-age adults in the household.
Economic Vulnerability Analysis of trends for 2004-2011 reveals that while there was no clear trend in income
poverty a steady increase was observed in levels of basic deprivation and economic stress
(Nolan et al forthcoming). In this paper we go beyond these individual indicators to develop a
multidimensional indicator of economic vulnerability relating to individuals characterised by
a distinctive risk profile in terms of income poverty, material deprivation and economicstress
In the academic and policy literature, concern with vulnerability has been linked to a shift of
focus from current deprivation to insecurity and exposure to risk and shock. The IMF (2003),
the UN (2003) and the World Bank (2000) have developed a range of approaches to
measuring vulnerability at the macro level..
We make use of latent class analysis which hypothesizes underling processes that result in
distinct clusters of individuals. Within these groups outcomes are independent of each other
because the factors that lead to individuals being located there are those that accounted for

9
the original correlations. The question is then whether such simplifying assumptions allow us
to identify clusters of individuals with distinct multidimensional profiles, while at the same
time producing an allocation of individuals to the cells of the relevant multidimensional table
that comes sufficiently close to the observed patterns (McCutheon and Mills, 1998). Our
focus in on the 4*2*2 table formed by the cross-classification of the 4-category income
poverty variable with the basic deprivation and economic stress dichotomies.
Comparing Pre and Post Recession Levels and Patterns of Economic
Vulnerability Our focus is on the contrast between 2004-2008 and 2009-2011. Economic circumstances
had begun to deteriorate significantly in 2008. However, income figures from EU-SILC refer
to the previous twelve months and there is likely to have been a lag in the effect of changing
economic conditions .Consequently, we have allocated 2008 to the earlier period.
In Table 1 we show model fit statistics for four latent class models. The benchmark model is
the conditional independence model. This allows for variation in the three indicators across
time but for no association between the indicators. This model misclassifies 19.0% of cases.
A model that assumes homogeneity of cluster sizes reduces the conditional independence G2
likelihood ratio figure by 92.3% but still misclassifies 5.4% of cases. Allowing the size of the
vulnerable class to vary over time reduces the deviance by 96% and misclassifies 3.5% of
cases. Finally, allowing cluster size and the profile of conditional probabilities to vary
reduces the benchmark deviance by 99.9% and misclassifies only 0.1% of cases. A
satisfactory fit requires that we allow for heterogeneity in relation to both size and profile.
The fully heterogeneous model identifies 15.8% of the population as economically vulnerable
for the period 2004-2008. The figure then rises to 26% for the period 2008-2011.

10
Table 1: Latent Class Model for Trends in Economic Vulnerability over Time (2004-2008 v 2009-2011)
G2
Degrees of
Freedom
Dissimilarity
Index
% Reduction on
Conditional
Independence
Model
Conditional independence Model 36,439.1 20 0.190
LCA Homogeneous over time 2,811.8 19 0.054 92.3
LCA Heterogeneous Class Size 1,439.5 18 0.035 96.0
LCA Heterogeneous Class Size &
Profiles
40.3 8 0.003 99.9
In Table 2 we set out the probabilities conditional on class membership for the fully
heterogeneous model. For the period 2004-2008 the conditional probability of being above
the basic deprivation threshold rises from 0.0210 for the non-vulnerable to 0.755 for the
vulnerable. For 2009-2011 little change is observed with the respective figures being 0.028
and 0.738. For the earlier period the contrast relating to economic stress is slightly less sharp
with respective probabilities of 0.028 and 0.071. However, in this case the contrast for the
later period is somewhat different with economic stress levels increasing for both clusters
with the respective probabilities being 0.055 and 0.749. The absolute change is greater for the
vulnerable group involving an increase of 0.048 compared to 0.029 for the non-vulnerable.
However, the proportionate increase is greater for the latter with the level doubling compared
to a six per cent increase for the latter. Finally, when we focus on income poverty, we find
that 0.481 of individuals in the vulnerable cluster were below 60% of median income
compared to 0.115 of the non-vulnerable. Once again we observe a rather different pattern for
2009-2011 but on this occasion poverty rates decline for both groups with the corresponding
rates being 0.093 and 0.310
In this case both absolute and relative changes are greater for the vulnerable group.
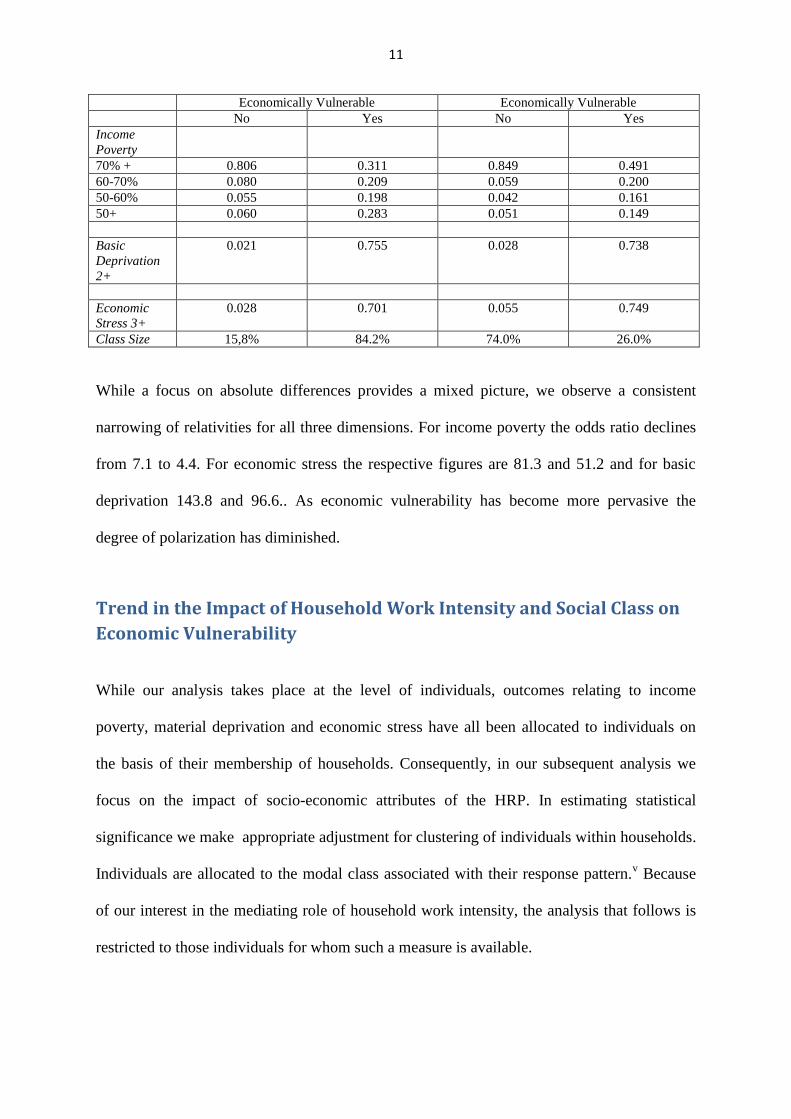
Table 2: Conditional Probabilities for Latent Class Model with Heterogeneous Class Size & Profiles
2004-2008 2009-2011
Conditional Probabilities Conditional Probabilities
11
Economically Vulnerable Economically Vulnerable
No Yes No Yes
Income
Poverty
70% + 0.806 0.311 0.849 0.491
60-70% 0.080 0.209 0.059 0.200
50-60% 0.055 0.198 0.042 0.161
50+ 0.060 0.283 0.051 0.149
Basic
Deprivation
2+
0.021 0.755 0.028 0.738
Economic
Stress 3+
0.028 0.701 0.055 0.749
Class Size 15,8% 84.2% 74.0% 26.0%
While a focus on absolute differences provides a mixed picture, we observe a consistent
narrowing of relativities for all three dimensions. For income poverty the odds ratio declines
from 7.1 to 4.4. For economic stress the respective figures are 81.3 and 51.2 and for basic
deprivation 143.8 and 96.6.. As economic vulnerability has become more pervasive the
degree of polarization has diminished.
Trend in the Impact of Household Work Intensity and Social Class on
Economic Vulnerability
While our analysis takes place at the level of individuals, outcomes relating to income
poverty, material deprivation and economic stress have all been allocated to individuals on
the basis of their membership of households. Consequently, in our subsequent analysis we
focus on the impact of socio-economic attributes of the HRP. In estimating statistical
significance we make appropriate adjustment for clustering of individuals within households.
Individuals are allocated to the modal class associated with their response pattern.v Because
of our interest in the mediating role of household work intensity, the analysis that follows is
restricted to those individuals for whom such a measure is available.

12
In Table 3 employing an 8 category version of the EseC class schema, we show the
breakdown of vulnerability by class and time period. In the pre-recession period a clear
pattern of class differentiation is observed. For both salariat classes the rate is 3%. It
increases to 6% and 8% respectively for the self-employed in agriculture and the petit
bourgeoisie and the higher grade white & blue collar classes. It then climbs sharply for the
lower social classes. For the lower white collar & skilled manual it rises to 14% before
increasing to 21% for the semi-unskilled manual and finally to 45% for those who had never
worked.
The risk of vulnerability increases over time for all eight classes. Modest increases in risk
levels are observed for the higher and lower salariat with respective figures of 1.9% and
4.9%. The increase for farmers of 6.4% is only marginal higher than for the latter which is
consistent with recent trends in relation to farm household income. vi
However, for the
remaining categories the level of increase shows no clear pattern of hierarchical
differentiation. In fact, the most modest increase of 10% is observed for those who had never
worked. The increase for the higher grade white & blue collar is marginally higher and for
thee semi-unskilled manual it rises to 11%. Finally, the largest increases of 13% and 18%
relate respectively to the petit bourgeoisie and the lower white collar & skilled manual.
Table 3: Economic Vulnerability by HRP Social Class and Time Period
2004-2008 2009-2011 Difference
% Vulnerable % Vulnerable %
ESeC Social Class
Higher Salariat (ESeC Class 1) 2.9 4.8 1.9
Lower Salariat (ESeC Class 1 3.2 8.1 4.9
Self-employed Agriculture (ESeC Class 5) 5.6 12.0 6.4
Petit Bourgeoisie’(ESeC Class 4 8.4 21.1 12.7
Higher Grade White & Blue Collar (ESeC Classes 3 & 6) 8.1 18.8 10.7
Lower White Collar & Skilled Manual (ESeC Classes 7 & 14.4 32.0 17.6

13
8)
Semi-Unskilled Manual (ESeC Class 9) 21.1 32.0 10.9
Never Worked 45.0 54.7 9.7
N 57,204 27,658
Shifting our attention to class relativities, because our dependent variable is a dichotomy,
particular statistical issues arise in relation to interpretation of change over time. As Breen et
al (2011) emphasise, when we use non-linear probability models, such as the logit to make
such comparisons, we cannot be sure that differences in coefficients represent real differences
in effects across groups. The difficulties arise because the coefficients of such models are
identified only up to scale: they depend not only on the effects of predictor variables but also
on the conditional error variance of the underlying model. This means that when we compare
the coefficient for a variable x in the same non-linear probability model fitted to two or more
groups we cannot know whether differences in coefficients are caused by real differences in
the effect of x or by differences in residual variation. To deal with this problem, Breen et al
(2011) demonstrate that differences in logit coefficients across groups result from a
combination of differences in correlations between the latent dependent y* and the
independent variable x (the square root of the ratio of the explained to unexplained variance
of y*) and in the standard deviations of x. The correlation part is invariant to differences in
the marginal distributions of x and y* across groups, while the standard deviations of x reflect
group differences in the marginal distribution of x. Focusing on the correlation is appropriate
when we want to compare the variation in y* the latent dependent variable between and
within values of x the independent variable. This is particularly the case when x is
categorical. In our analysis of trends over time the correlation captures the degree of variation
between social class and work intensity categories relative to the variation within and allows
us to test for the significance of changes in the degree of association over time. The
correlations are estimated using a STATA programme nlcorr.

14
In Table 4 we show the correlations between economic vulnerability and social class for both
time periods. The contrast in each case is with higher salariat. The highest level of correlation
for the first time period of approximately 0.3 is observed for the semi-unskilled and never
worked classes and no significant change is observed over time. For the self-employed in
agriculture a modest but statistically significant increase is observed from 0.07 to 0.09. For
the remaining classes the magnitude of the increase is considerably greater and lies between
0.06 and 0.07 and in each case is highly significant. There is clear evidence of a pattern of
change in class effects reflecting a ‘middle class squeeze’.
Table 4: Correlation of Economic Vulnerability with Social Class By Time Period
2009-2011 2004-2008 Difference Z
ESeC Social Class
Higher Salariat (ESeC Class 1) Reference Reference
Lower Salariat (ESeC Class 1 0.079 0.018 0.061 7.96
Self-employed Agriculture (ESeC
Class 5)
0.090 0.071 0.019 2.48
Petit Bourgeoisie’(ESeC Class 4 0.216 0.150 0.063 8.89
Higher Grade White & Blue
Collar (ESeC Classes 3 & 6)
0.219 0.154 0.065 8..82
Lower White Collar & Skilled
Manual (ESeC Classes 7 & 8)
0.330 .0.260 0.070 10.03
Semi-Unskilled Manual (ESeC
Class 9)
0.330 0.330 0.000 0.00
Never Worked 0.297 0.294 0.003 0.43
Trends in the Relationships between Household Work Intensity and
Social Class and Economic Vulnerability
In Table 5 we set out the changing distribution of household work intensity. The percentage
experiencing either VLWI or LWI increased from 22% to 34% while the figure for HI or VHI
fell from 57% to 47%.
Table 5: Household Work Intensity by Time Period

15
% %
Work Intensity
Very Low (0-0,2) (VLWI) 13.9 21.4
Low (0.2-0.45) (LWI) 8.4 12.6
Medium (0.45-).55) (MWI) 20.4 19.4
High (0.55-0.85) (HWI) 27.0 21.5
Very High (0.85-1) (VHWI) 30.4 25.0
N 59,175 29,518
Before seeking to establish the role which household work intensity plays in mediating the
impact of social class, in Tables 6 and 7 we examine its relationships to social class and
economic vulnerability.
In Table 6 we focus on the changing relationship between work intensity and social class.
The relevant correlations were derived from an ordered logit analysis using the STATA
lncorr programme. The ordering of the classes remains uniform over time. For the first
period, with the higher salariat as the reference category, the difference between the
correlations for the lower salariat and the never worked category is .275 while in the second
period it is .267 However, it is clear that that, with the exception of the self-employed in
agriculture and the never worked classes, the correlation of economic vulnerability with
social class increases over time. The largest differences of respectively 0.070 and 0.045 and
0.040 are observed for the petit bourgeoise, the lower white collar & skilled manual class and
the lower salariat. Smaller increases of 0.031 are observed for the higher grade white & blue
collar and semi-unskilled manual classes. Thus a pattern of ‘middle class squeeze’ emerges
that broadly corresponds to that observed for the relationship between social class and
economic vulnerability.
Table 6: Correlation of Household Work Intensity with Social Class By Time Period
2009-2011 2004-2008 Difference Z
ESeC Social Class
Higher Salariat (ESeC Class 1) Reference Reference
Lower Salariat (ESeC Class 1 0.033 -0.006 0.039 5.07
Self-employed Agriculture (ESeC
Class 5)
-0.009 0.005 -0.013 --1.74

16
Petit Bourgeoisie’(ESeC Class 4 0.109 0.039 0.070 9.21
Higher Grade White & Blue
Collar (ESeC Classes 3 & 6)
0.084 0.053 0.031 4.00
Lower White Collar & Skilled
Manual (ESeC Classes
0.198 0.153 0.045 6.04
Semi-Unskilled Manual (ESeC
Class 9)
0.230 0.199 0.031 4.27
Never Worked 0.300 0.269 0.031 4.38
From Table 7 we can see that the degree of differentiation of economic vulnerability by
categories of work intensity declines significantly. With VHWI as the benchmark the
correlation for V declines from .580 to .518. For LWI the respective figures are .382 and
.355. For MWI the corresponding correlations are .303 and .281. Finally for HWI we see a
fall from .144 to .114. Thus, while the extent of low and very low work intensity increased
substantially between the two time periods, consistent with the changing pattern of class
correlations, work intensity became a much less powerful predictor of economic
vulnerability.
Table 7: Correlation of Economic Vulnerability with Household Work Intensity By Time Period
2009-2011 2004-2008 Difference Z
Work Intensity
Very Low (0-0,2) (VLWI) 0.519 0.580 -0.061 11.6
Low (0.2-0.45) (VLI) 0.355 0.382 -0.028 4.25
Medium (0.45-).55) (MWI) 0.281 0.303 -0.022 11.00
High (0.55-0.85) (HWI) 0.114 0.144 -0030 4.07
Very High (0.85-1) (VHWI) Reference Reference
The Mediating Role of Household Work Intensity Here we seek to explore that manner in which work intensity mediates the impact of social
class and to distinguish between the direct and indirect effects. An analysis of such effects
requires nested models in which the impact of an independent variable can be observed both
before and after a hypothesised mediating variable has been entered. However, as Kohler et al
(2011) observe, comparing the effects of nested models for nonlinear models is not
straightforward. Kohler et al (2011: 421) note that in such models, direct and indirect effects

17
can differ not only because of the mediating role of an added variable but also because of a
rescaling of the model that arises whenever the mediator variable has an independent effect
on the dependent variable. Crucially, for the rescaling to occur, it is not necessary for the
mediating variable to be correlated with the independent variable whose impact we wish to
assess.
To address these issues Karlson et al (2012) have developed the KHB method which extends
the decomposability properties of linear models to non-linear probability models. The
fundamental idea underlying the method is to extract from the mediating variable the
information that is not contained in the independent variable, the direct and indirect effects of
which we seek to capture. vii
We estimate these effects using the STATA khb programme developed by Kohler et al
(2011). In Table 8 we show the decomposition of the effect of social class on economic
vulnerability. For the period 2004-2008 the additive logit coefficient capturing the total effect
of social class on economic vulnerability ranges from 0.074 for the lower salariat to 3.739 for
the never worked class. At that point the indirect effects for the lower salariat and self-
employed agricultural class were not significant and that for the petit bourgeoise was modest.
However, for the remaining classes the mediating role of work intensity was substantial with
the indirect effect gradually rising from 0.226 for the higher grade white collar & blue collar
classes to 2.107 for the never worked category. Thus the importance of work intensity as a
mediating factor was largely concentrated at the lower end of the class structure. The size of
the direct effect of social class independent of work intensity went from 0.076 for the lower
salariat to 1.632 for the never worked class with the pattern of effects being very similar to
that observed for the total effect.

18
For the period 2009-2011 the magnitude of the total class effect increased substantially for all
classes other than the semi-unskilled class, where the increase was modest, and the never
worked class where the effect fell from 3.739 to 3.476. The gap between the lower salariat
and the never worked category fell from 3.665 to 2.97. Similar reductions were observed for
the remaining classes. Comparable but slightly smaller effects are observed in relation to the
semi-unskilled class. Unlike the previous time period, the only class for which the indirect
effect was not significant was the self-employed in agriculture. For the remaining classes the
size of this effect ranged from 0.162 for the lower salariat to 1.712 for then never worked
group. The size of this effect increased over time for all classes other than the never worked
class where it fell from 2.107 to 1.712, but only modestly so for the semi-unskilled manual.
The outcome again involved a narrowing of differentials between the non-agricultural middle
classes and the semi-unskilled manual and the never worked classes. The size of the direct
effect also increased for all classes but the pattern of change over time involved modest
variation across classes.
Table 8: Decomposition of Social Class Effect on Economic Vulnerability with Work Intensity as a Mediating
Factor by Time Period
2004-2008 2009-20111
Logit
Coefficient
Z Logit
Coefficient
Z
HRP ESeC Social Class
Lower Salariat (ESeC Class 1
Total 0.074 0.58 0.501 3.88
Direct 0.076 0.60 0.339 2.62

19
Indirect -0.002 -0.03 0.162 1.73
Self-employed Agriculture (ESeC
Class 5)
Total 0.830 4.87 1.032 4,61
Direct 0.838 4.92 1.024 4.60
Indirect -0.008 -0.11 0.008 0.08
Petit Bourgeoisie’(ESeC Class 4
Total 1.291 10.16 1.743 13.85
Direct 1.148 9.03 1.262 9.95
Indirect 0.143 1.84 0.481 5.06
Higher Grade White & Blue Collar
(ESeC Classes 3 & 6)
Total 1.114 9.07 1.578 13.48
Direct 0.888 7.15 1.237 10.59
Indirect 0.226 2.91 0.341 3.61
Lower White Collar & Skilled
Manual (ESeC Classes
Total 1.756 16.05 2.348 21.10
Direct 1.061 9.67 1.549 13.96
Indirect 0.696 8.68 0.799 8.32
Semi-Unskilled Manual (ESeC
Class 9)
Total 2.286 21.13 2.404 21.67
Direct 1.359 12.38 1.463 13.08
Indirect 0.927 11.47 0.942 9.70
Never Worked
Total 3.739 31.01 3.476 24.92
Direct 1.632 13.22 1.764 12.62
Indirect 2.107 23.94 1.712 16.66
N 50,834 25,041
R2
0.32 0.24
Karlson et al (2010) propose the confounding percentage, i.e. the percentage of the total
effect accounted for by the mediating variable, as an aid to interpreting the output from the
KHB method and in Table 9 we report this summary index for the findings set out in Table 8.
In the pre-recession period the effect was negative for the lower salariat and the self-
employed agricultural classes. For the petit bourgeoisie this rose to 11% and for the higher
grade white & blue collar class to 20%. It then increased 40% for both the lower white collar
& skilled manual and semi-skilled manual classes. It peaked at 56% for the never worked
class. For the post-recession period a very different pattern was observed. For the lower
salariat the figure rose to 32% and for the petit-bourgeoisie to 28%. Little change was
observed for the higher grade white & blue collar class. For the remaining classes we observe

20
a reduction in the percentage of the total effect accounted for by the mediating role of work
intensity. With the exception of the self-employed in agricultural, variation in the percentage
of the total effect of social class accounted for by work intensity is a great deal more modest
in the post-recession period.
Table 9 Confounding Percentages for the Mediating Role of Household Intensity for Social Effects on Economic
Vulnerability by Time Period
2004-2008 2009-2011
Confounding % Confounding % ESeC Social Class Lower Salariat (ESeC Class 1 -3.47 32.3
Self-employed Agriculture (ESeC
Class 5)
-1.01 0.75
Petit Bourgeoisie’(ESeC Class 4 11.07 27.6
Higher Grade White & Blue
Collar (ESeC Classes 3 & 6)
20.31 21.62
Lower White Collar & Skilled
Manual (ESeC Classes
39.61 34.03
Semi-Unskilled Manual (ESeC
Class 9)
40.55 39.17
Never Worked 56.35 49.25
Finally in Table 10, employing the khb method, we look at total, direct and indirect average
partial effects (APE)viii
estimated across individuals by class for both time periods. In the
first time period being in the never worked class rather than the higher salariat on average
increased the probability of being vulnerable by 0.269. This total effect can be partitioned
into an indirect effect of 0.152 mediated through work intensity and a direct effect of 0.117.
In the second time period the corresponding figures were 0.444, 0.225 and 0.218. The
reduced role of work intensity is reflected in the fact that for the later period direct and
indirect effects are of almost equal magnitude.
For the semi-unskilled manual class and the lower and higher white collar and skilled
manual classes we observe a doubling of effects across time with little change in the
mediating role of work intensity. However, for the petit bourgeoisie and the lower salariat the
mediating role of work intensity is extremely modest for the first period, with respective

21
direct effect of 0.083 and 0.005 and indirect effects of 0.010 and 0.000. For the second
period, on the other hand, the respective direct effect figures are 0.161 and 0.043 and the
indirect probabilities are 0.063 and 0.021 capturing both the rise in risk levels and a
significant increase in the role of work intensity for both cases. For farmers on the other hand
indirect effects through work intensity were effectively zero at both points in time while the
direct more than doubled from 0.061 to 0.131.
Table 10: Decomposition of Social Class Effect on Economic Vulnerability with Work Intensity as a Mediating
Factor8by Time Period
2004-2008 2009-20111
Average Partial
Effect
Z Average Partial
Effect
Z
HRP ESeC Social Class
Lower Salariat (ESeC Class 1 0.005 0.58 0.064 3.88
Total 0.005 0.60 0.043 2.62
Direct -0.000 0.021

22
Indirect
Self-employed Agriculture (ESeC
Class 5)
Total 0.050 4.85 0.132 4.58
Direct 0.060 4.90 0.131 4.56
Indirect -0.000 0.001
Petit Bourgeoisie’(ESeC Class 4
Total 0.095 10.02 0.223 13.77
Direct 0.085 8.92 0.161 9.88
Indirect 0,010 0.062
Higher Grade White & Blue Collar
(ESeC Classes 3 & 6)
Total 0.080 8.94 0.202 13.55
Direct 0.064 7.03 0.158 10.60
Indirect 0.016 0.044
Lower White Collar & Skilled
Manual (ESeC Classes
Total 0.126 16.01 0.300 21.58
Direct 0.076 9.62 0.198 14.00
Indirect 0.050 0.102
Semi-Unskilled Manual (ESeC
Class 9)
Total 0.164 20.95 0.307 22.14
Direct 0.098 12.23 0.187 13.09
Indirect 0.066 0.120
Never Worked
Total 0.269 31.93 0.444 26.45
Direct 0.117 13.19 0.225 12.73
Indirect 0.152 0.119
N
R2
Conclusions The impact of the Great Recession in Ireland was reflected in a doubling of the rate of
economic vulnerability. Not only has the level of economic vulnerability increased
dramatically over time but the profile of vulnerability has changed. Deprivation and
economic stress have become more loosely associated with income poverty and the degree of
polarization in terms of the odds of being above the threshold on each of the three component
indicators is significantly reduced over time. In turn, vulnerability became more widely
distributed across the class spectrum.
At both points in time economic vulnerability is highly stratified by social class. There is no
evidence that class differences in vulnerability have been substantially eroded by processes of

23
individualization of risk. Focusing on absolute increases in the probability of vulnerability
over time provides some support for the notion of a restricted degree of polarization between
the salariat and farmers on the one hand and the remaining classes. A focus on relativities
provides a somewhat different picture. Over time the pattern of increase in the level of
association between class position and economic vulnerability provided significant support
for the notion of middle class squeeze. The higher salariat and the self-employed in
agriculture have succeeded in maintaining their relative advantages over time. No change was
observed in the situation of the semi-unskilled and never worked classes. All of the remaining
classes experienced a significant deterioration in their position.
Those towards the bottom of the class distribution were already heavily reliant on social
transfers in the pre-recession period. The increase in unemployment and corresponding
decline in income from employment will thus have left many of them relatively unaffected.
The evolution of income support rates for those relying on social protection is also important.
Support rates provided were actually increased in 2009. These increases took place at a time
when, most unusually, poverty thresholds framed in purely relative terms were going down
since average/median incomes across all households were declining. So the relative position
of those relying on social transfers improved considerably (Callan et al 2013).
For the middle classes the impact of additional and progressive taxes in combination with
unemployment, wage cuts and the collapse in consumer demand can be seen to be reflected in
their changing risk profile. In that sense there has been a ‘middle class squeeze’ in that
classes that had previously been substantially insulated from exposure economic vulnerability
experienced the sharpest increases in their odds of being vulnerable and came to constitute an
increasing segment of the this group.

24
Focusing on the mediating role of household work intensity we found that its changing
relationship to social class also reflected a ‘middle class squeeze’. Consistent with this, a
substantial weakening of the impact of work intensity on economic vulnerability was
observed, although other factors also played a significant role. Over time the mediating role
of work intensity changed significantly and in the post-recession period indirect class effects
of this kind became highly significant for a range of middle classes. Cantillon (2011) notes
social investment policies including increasing focus on work intensity can have somewhat
different distributional consequences than anticipated where job growth benefits households
where there is already someone at work. Here we see the reverse side of that picture. As
levels of work intensity declined, the pattern of association with social class deviated from a
straightforward hierarchical pattern and the impact of work intensity on economic
vulnerability declined sharply.
The implications of these changing patterns of relative risk will depend on the manner in
which they are experienced. It seems plausible that the experience of vulnerability is likely to
be more traumatic for groups for whom it is something of a novelty. The political
implications of the redistribution of relative risk may differ from those associated with
previous pattern of vulnerability in the boom period. If Ireland has not shown a whole-
hearted commitment to a highly egalitarian society, social partnership and a catch-all party
political system have maintained a welfare floor through protection of core welfare provision
(Nolan et al forthcoming). During the boom the trade union movement found it easier to
engage with government on deals supporting welfare expansion accompanied by tax cuts and
disposable income than to address distributional issues (Dellepiane and Hardiman, 2012 a &
b). However, recent efforts by the government to revise the Croke Park Agreement relating to
public sector accommodate a further set of public sector pay cuts and reforms, involving

25
substantial protection for the low paid, but with significant cuts in allowances for front line
workers were initially resoundingly rejected by the unions.
Although subsequently a significant number of unions changed their votes and accepted the
revised Haddington Road agreement the underlying tensions within the trade union
movement remained evident.+ Among the most vocal critics of the proposed revisions to the
agreement were middle range civil servants, such as teachers and nurses, whose ballots
produced huge majorities in favour of rejection. These constitute precisely the kind of groups,
who, as a consequence of substantial real cuts in salaries, the imposition of pension levies,
and in many cases a significant burden in relation to negative equity and substantial
mortgages undertaken during the boom, are likely to have been drawn into the economic
vulnerability net in a manner that they unlikely to have anticipated.
Ireland has been quite distinctive in that an unprecedented economic contraction and austerity
has provoked little in the way of social disruption or conflict. There is still some way to travel
on the austerity path and a commitment to an export oriented growth model has led to the
rejection of the options of tax increases or corporation taxes. In such circumstances, dealing
with the pressures arising from a ‘middle class squeeze’ while sustaining the social welfare
arrangements that have traditionally protected the economically vulnerable presents
formidable challenges in terms of maintaining social cohesion and political legitimacy.
References Beck, U. (2007) ‘Beyond Class and Nation: Reframing Social Inequalities in a Globalizing
World’, The British Journal of Sociology 58(4): 679–705.

26
Breen, R., Karlson, K. B., Holm, A. (2011), ‘A Reinterpretation of Coefficients from Logot,
Probit and other Nonlinear Probability Models: Consequences for Comparative Research’,
http://papers.ssrn.com/sol3/papers.cfm?abstract_id=1857431
Breen, R., Karlson, K. B., Holm, A. (2012), ‘Comparing Regression Coefficients Between
Same-sample Nested Models Using Logit and Probit’, Sociological Methodology, 42, 1: 286-
313
Callan, T., B. Nolan, C. Keane, M. Savage and J. Walsh, (2013): “Crisis, Response and
Distributional Impact: The Case of Ireland”, Dublin: Economic and Social Research
Institute Working Paper, No. 456.
Cantillon, B. (2011), ‘The Paradox of the Social Investment State: Growth, Employment and
Poverty in the Lisbon era, Journal of European Social Policy, 21, 5: 432-449
Dellepiane S. and Hardiman, N. (2012a). ‘Governing the Irish Economy: A Triple Crisis’, in
Hardiman N (ed) Irish Governance In Crisis. Manchester: Manchester University Press
Dellepiane S. and Hardiman, N. (2012b), The New Politics of Austerity: Fiscal Responses to
the Economic Crisis in Ireland and Spain, Geary Discussion Paper 201207, University
College Dublin
Dillinger, U. (2013), ‘The Endangered Middle Class? ; A Comparative Analysis of the Role
Played by Income Redistribution, Journal of European Social Policy, 23,1: 83-101
European Commission (2011). Employment and Social Developments in Europe 2011, DG
Employment, Social Affairs and Equal Opportunities.

27
Goldthorpe, J. H. (2006), ‘Social Class and the Differentiation of Employment Contracts’, in
J. H. Goldthorpe, On Sociology Second Edition, Volume Two: Illustration and Retrospect,
Stanford University Press, Stanford, California
International Monetary Fund, (2003), Vulnerability Indicators: A Factsheet
http://www.imf.org/external/np/facts/vul.html
Kohler, U., Karlson, B, and Holm, A. (2011), ‘Comparing Coefficients of Nested Nonlinear
probability Models, The Stata Journal, 11, 3: 420-438
McCutcheon, A. and Mills, A. (1998) ‘Categorical data analysis; log-linear and latent class
models’, in E. Scarborough and E. Tannenbauum (eds), Research Strategies in the Social
Sciences, Oxford: Oxford University Press.
Morel, N., Palier, B, and Palme, J. (2012), ‘Beyond the Welfare State as we Know It’, in N.
Morel, N., B. Palier, B, and J. Palme (eds), Towards a Social Investment Welfare Stat? Ideas,
Policies and Challenges, Bristol: Policy Press
Nolan, B., Callan, T. and Maître, B. (2013), ‘Country Cases Studies – Ireland’, in S. P.
Jenkins, Brandolini, A., Micklewright, Nolan, B. (eds), The Great Recession and the
Distribution of Household Income, Oxford: Oxford University Press
Nolan, B et al. (forthcoming), Ireland: Inequality and Its Impact in Boom and Bust, GINI, in
W. Salverda, B., Nolan, D. Checci, I. Marx, A. McKnight, I. G. Töth, H. G van der
Werfhorst, Changing Inequalities and Societal Impacts in Thirty Rich Counties, Oxford:
Oxford University Press
Nolan, B, and Whelan, C, T (2011), Poverty and Deprivation in Europe, Oxford: Oxford
University Press

28
Pew Research Center (PRC) (2012): Fewer, Poorer, Gloomier: The Lost Decade of the
Middle Class. Pew Social & Demographic Trends, Washington, D.C., August 2012
Rose, D. and Harrison, E. (2006), The European Socio-economic Classification: A New
Social Class Schema for Comparative European Research. European Societies, 9, 3: 459–90.
Russell, H, Whelan, C. T and Maître, B. (2012), ‘Economic Vulnerability and the Severity of
Debt Problems: An Analysis of the Irish EU-SILC 2008’, European Sociological Review,
doi: 10.1093/esr/jcs048
Social Justice Ireland (2013), What Would Real Recovery Look Like?, Socio-economic review
2013
TASC (2012), TASC’s Proposal for a More Equitable Budget, Dublin
UN (2003). Report on the World Social Situation: Social Vulnerability: Sources and
Challenges, New York: United Nations Department of Economic and Social Affairs.
Whelan, K. (2010), ‘Policy Lessons for Ireland’s Latest Depression’, Economic and Social
Review, 41, 2: 225-254
World Bank (2000). World Development Report 2000–01: Attacking Poverty. New York:
Oxford University Press

29
30
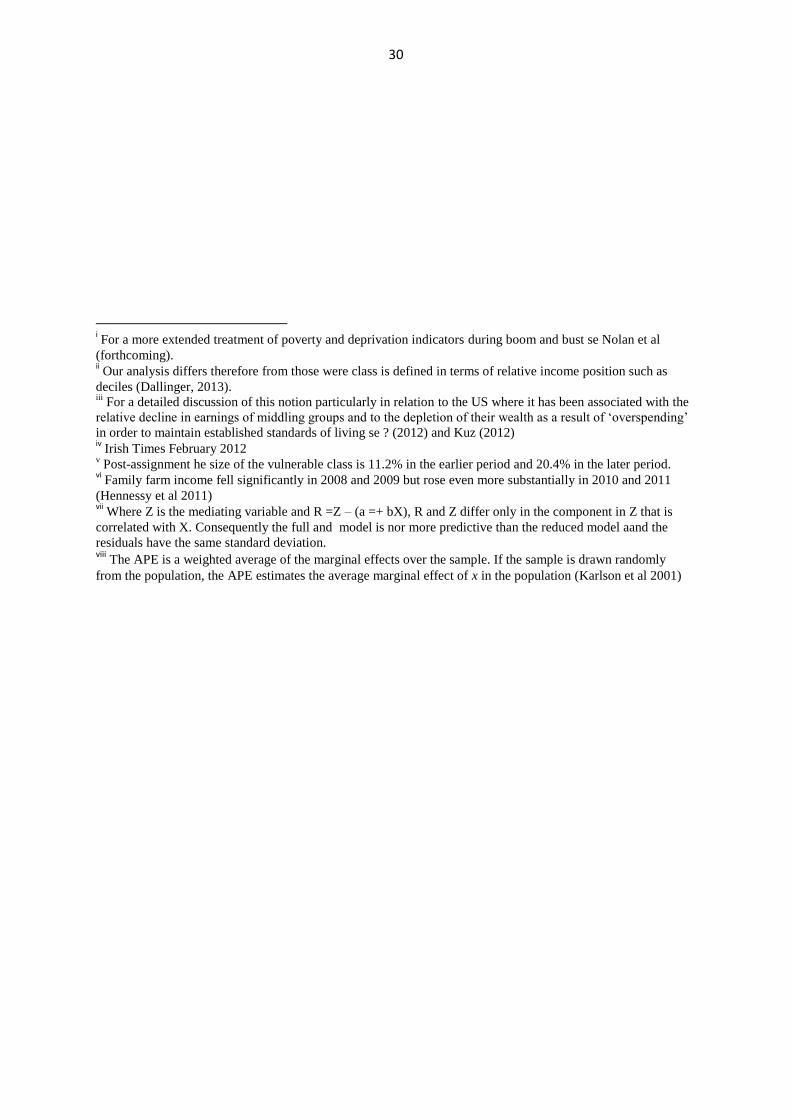
i For a more extended treatment of poverty and deprivation indicators during boom and bust se Nolan et al
(forthcoming). ii Our analysis differs therefore from those were class is defined in terms of relative income position such as
deciles (Dallinger, 2013). iii
For a detailed discussion of this notion particularly in relation to the US where it has been associated with the
relative decline in earnings of middling groups and to the depletion of their wealth as a result of ‘overspending’
in order to maintain established standards of living se ? (2012) and Kuz (2012) iv Irish Times February 2012
v Post-assignment he size of the vulnerable class is 11.2% in the earlier period and 20.4% in the later period.
vi Family farm income fell significantly in 2008 and 2009 but rose even more substantially in 2010 and 2011
(Hennessy et al 2011) vii
Where Z is the mediating variable and R =Z – (a =+ bX), R and Z differ only in the component in Z that is
correlated with X. Consequently the full and model is nor more predictive than the reduced model aand the
residuals have the same standard deviation. viii The APE is a weighted average of the marginal effects over the sample. If the sample is drawn randomly
from the population, the APE estimates the average marginal effect of x in the population (Karlson et al 2001)