the growth of a shadow banking system in emerging … · the growth of a shadow banking system in...
TRANSCRIPT
The Growth of a Shadow Banking System in Emerging Markets: Evidence from India1
Viral V. Acharya2 New York University Stern School of Business, CEPR and NBER
Hemal Khandwala3
Centre for Advanced Financial Research and Learning, Reserve Bank of India
T. Sabri Öncü4 Centre for Advanced Financial Research and Learning, Reserve Bank of India
First draft: December 2012; This draft: May 2013
Abstract
We study the determinants of the growth of those non-deposit taking non-bank financial corporations (NBFCs) which are regarded by the Reserve Bank of India as being systemically important and have grown substantially in India over the past decade. We document that bank lending to NBFCs (i) forms a significant proportion of the NBFC liabilities; (ii) fluctuates in line with bank allocation to priority lending sectors; (iii) decreases as the banks expand in the rural areas relative to urban areas; but, (iv) is virtually non-existent for the largest state-owned bank, namely State Bank of India (SBI) and its affiliates which have significant rural branch network. Starting with the financial crisis of Fall 2008, bank lending to NBFCs experienced a permanent contraction shock related to the shift of term deposits towards SBI away from other banks. These bank-NBFC linkages are present primarily for, and affect the credit growth of, those NBFCs that do loans or asset financing but not the investment companies. Overall, the findings suggest that in contrast to the prevailing views of shadow banking in the Western economies, lending to NBFCs in India is viewed by banks as a substitute for direct lending in the non-urban areas of the Indian economy, but this substitution is constrained by distortions in bank deposit flows due to the perceived differential government support of different banking groups.
JEL: G01, G21, G23, G28 Keywords: shadow banking, non-bank financial corporations, crisis, systemic risk, government guarantees
1 Authors are grateful for comments and feedback from Stijn Claessens (discussant), Joshua Aizenman and Ajay Shah (editors), Usha Thorat, and seminar participants at the 10th Research Meeting of NIPFP-DEA-JIMF conference (Neemrana Fort Palace, India, 12-13 December 2012). We are also grateful to the Reserve Bank of India for providing us the dataset on the systemically important non-bank financial corporations (NBFCs) of India. All errors remain our own. 2 E-mail: [email protected] 3 E-mail: [email protected] 4 E-mail: [email protected]
2
1. Introduction
We investigate the rapid growth of the non-bank finance corporations (NBFCs) in
India as a laboratory to understand incentives underlying the growth of shadow
banking institutions in emerging markets. Our main finding is that unlike the
prevailing views on shadow banking5 in the Western economies, which concern
desire to provide “safe” collateral for financial transactions and mitigate
counterparty risk 6 or simply to arbitrage bank regulations such as capital
requirements7, the NBFCs in India appear to be substitutes for direct lending by
banks in the non-urban parts of the Indian economy. Indeed, and consistent with
the prevailing views of shadow banking, NBFCs in India are also linked to the banking
sector, in particular, through bank lending to NBFCs which forms a significant
proportion of NBFC liabilities. We study how these bank-NBFC linkages affect NBFC
credit growth, how the linkages vary across types of banks in their ownership
structure (state-owned versus private in case of banks), rural bank branching
network relative to urban branching, and function of the NBFC (Financing versus
Investment), and finally, what impact did the financial crisis in Fall 2008 have on
these linkages given the relative shift of term deposits into state-owned banks due
to their stronger perceived guarantees.
Exploiting a special dataset8 of individual NBFCs over the period 2006-2011
that we collected from the Reserve Bank of India (RBI), we examine the following
questions.
1) Does bank lending to the priority sectors9 influence bank lending to the
5 We discuss the prevailing views on shadow banking in Appendix I.
6 See, in particular, Claessens, Pozsar, Ratnovski and Singh (2013), who survey the academic literature
focused on the role of shadow banking in creating “safe” collateral to reduce counterparty risk, facilitate financial transactions, and satisfy the global demand for relatively safe assets for liquidity and hedging purposes. 7 Acharya, Schnabl and Suarez (2013), for example, illustrate how commercial banks engaged in
regulatory arbitrage of Basel capital requirements by setting up asset-backed commercial paper (ABCP) conduits, which experienced the first (shadow-banking) “run” of the financial crisis of 2007-08. 8 Described in detail is Section 3.
9 As per the RBI definition, priority sector refers to those sectors of the Indian economy, which may not get timely and adequate credit in the absence of this special dispensation. Typically, these are small value loans to farmers for agriculture and allied activities, micro and small enterprises, poor people for housing, students for education and other low-income groups and weaker sections. The
3
NBFCs and, in turn, how does NBFC lending itself gets affected?
2) Does bank branch expansion in rural areas relative to urban areas influence
bank lending to the NBFCs and, in turn, how does NBFC lending itself gets
affected?
3) Do term deposits (the more stable or less fragile form of deposits) at banks
influence bank lending to the NBFCs and, in turn, how does NBFC lending
itself gets affected?
4) Did the crisis have a long-term effect on the bank lending to the NBFCs and,
in turn, how did NBFC lending itself get affected?
5) Do these channels influence the Investment Company and Financing
Company NBFCs similarly or differentially?
Our results provide four interesting properties of bank lending to NBFCs in
India over the period 2006-2011.
One, bank lending to NBFCs fluctuates in line with bank allocation to
priority lending sectors; and second, this lending decreases as the banks expand in
the rural areas relative to urban areas but this relationship is virtually non-existent
for the largest state-owned bank, namely the State Bank of India (SBI) and its
affiliates which have significant rural branch network of their own. Third,
these bank-NBFC linkages are present primarily for, and affect the credit growth of,
those NBFCs that do loans or asset financing but not the investment companies
(whose activities are focused on acquiring securities, and not on lending). All of
these findings suggest that the banks view the NBFCs as a substitute for direct
lending in the non-urban areas of the Indian economy. This view of the NBFCs is
consistent with the current explanations of their recent growth in India (Duggal and
Kapali, 2012, and Deosthalee, 2012) which focus on NBFC’s greater ability compared
to banks in reaching out to small borrowers in far-flung rural areas, upcoming small-
and medium-sized enterprises, enterprising self-employed service providers, mid-
RBI classifies the priority sectors into the following categories: a) Agriculture; b) Micro and Small Enterprises; c) Education; d) Housing; e) Export Credit and f) Others.

4
market corporates and emerging infrastructure developers.
Fourth, starting with the financial crisis of Fall 2008, bank lending to NBFCs
experienced a permanent contraction shock related to the shift of term deposits
(relative to demand deposits) towards the SBI – and then to other state-owned
banks – away from other banks. Acharya and Kulkarni (2012, 2013) show empirically
that this shift of deposits – and the relative out-performance – of state-owned banks
during 2008 appeared to be unrelated to measures of their vulnerability to market
downturns, whereas private banks experienced deposit withdrawals and shortening
that were correlated to their vulnerability to market downturns. They further show
that state-owned banks increased their loan advances, at cheaper rates, and
especially to public-sector firms and priority lending sectors. Consistent with their
findings, we document that the deposit shift across bank types in Fall 2008 reduced
bank lending to the NBFCs.
Overall, our findings suggest that in contrast to the prevailing views of
shadow banking in the Western economies, the NBFCs in India appear to provide a
completeness of credit spectrum in the economy, with banks lending to the NBFCs as
a substitute for direct lending to non-urban parts of the economy. While this
economic function and its financing by banks help understand the recent growth of
the NBFCs, this growth and its financing by banks has been affected over time due to
deposit shifts attributable to perceived government guarantees between banks with
and without significant non-urban reach in their branch networks.
We organize the rest of the paper as follows. Section 2 introduces the NBFC
and bank groupings we employ in the paper. Section 3 presents the datasets we
employ on NBFCs and banks. Section 4 presents our primary questions of interest
and the leading econometric specifications we employ. Section 5 presents the
results. Section 6 concludes.
2. Background on the Indian Non-Bank Financial Corporations (NBFCs)
2.a Indian NBFCs
India has a rather complex credit system. It consists not only of formal
5
networks of public and private commercial banks, regional rural banks, cooperative
banks, public financial institutions such as National Bank for Agricultural and Rural
Development (NABARD), National Housing Bank (NHB) and Small Industries
Development Bank of India (SIDBI), and NBFCs, but also of quasi-formal and informal
(even illegal, but socially accepted) networks of Nidhis10, Chit Funds11, Badla
Financiers12 , Commodity Trade Financiers, Gold Saving Companies, Gold Loan
Companies, Pawnbrokers, Plantation Companies, Money Lenders and many others.
Although shadow banking systems can develop in any section of this complex credit
system, because of data availability, our focus is on those non-deposit taking NBFCs
which are regarded by the Reserve Bank of India (RBI) as being systemically
important. We exploit a special data set given to us by the Reserve Bank of India
covering these NBFCs over the period 2006-2011.
Although some forms of non-bank money lending institutions had existed in
India even before the Indian independence of 1947, the emergence of Indian NBFCs
as we know them can be traced back to the 1950s. For example, one of the earliest
after independence Indian NBFCs, Sundaram Finance, was incorporated in 1954 with
the objective of financing the purchase of commercial vehicles and passenger cars.13
Since most, if not all, of the early Indian NBFCs mobilized deposits to fund their
financing, they were shadow banks in the sense we described above.
Emergence of some fly-by-night NBFCs in this early period (Deosthalee, 2010)
created concerns among the regulators and the NBFC regulation in India began in
1963 with the insertion of a new chapter, IIIB, in the RBI Act, 1934 to enable the
central bank to effectively supervise, regulate and control these institutions (Nisar
and Aziz, 2004). The initial focus was on moderating the deposit mobilization of the
NBFCs to safeguard depositors’ interest and ensure healthy functioning of the NBFC
sector. Since then, many attempts have been made to enhance the extant regulatory
10 Companies registered under Companies Act of India and notified as Nidhi companies by the Indian Central Government under Section 620-A of Companies Act of India. They are non-bank finance companies that collect funds from and lend to its members or shareholders. 11
Same as Nidhis, except that their members or shareholders are individuals only. 12
Stock Trade Financiers 13
http://www.sundaramfinance.in/companyinfo/history.aspx
6
framework and several amendments to the RBI Act, 1934 had been made until 1998
(see, Deosthalee, 2010, Nisar and Aziz, 2004 and the references therein for detailed
historical accounts).
In 1998, the RBI introduced an entirely new set of NBFC regulations and
supervision (announced in January and further amended in December). In this new
set of regulations, the NBFCs were broadly classified into three categories:
1) Deposit taking NBFCs;
2) Non-deposit taking NBFCs;
3) Core Investment Companies.
The new regulatory framework involved a prescription of prudential norms for
deposit taking NBFCs to ensure that these NBFCs function on sound and healthy
lines. However, the regulatory and supervisory attention was focused mainly on the
deposit taking NBFCs to protect the interests of the depositors. The non-deposit
taking NBFCs were kept subject to minimal regulation and, practically, Core
Investment Companies were left out altogether.
Nevertheless, the 1998 NBFC regulations made a major impact on the growth
of the NBFCs, and the number of NBFCs dropped to 7,855 in March 1999 from
55,995 in March 1995 (Nisar and Aziz, 2004). For the deposit taking NBFCs, the
number of companies dropped from 1,429 in March 1998 to 624 in March 1999 in a
single year, and although the number of deposit taking NBFCs increased gradually
from 624 in March 1999 to a peak of 784 in March 2001, it started to decline
thereafter and stood at 297 in March 2011. As for the deposits held by these
companies, the deposits decreased from 237.7 billion rupees, comprising 52.3
percent of their total assets, in March 1998 to 172,7 billion rupees, comprising 15.7
percent of their total assets, in March 2010. Table I compares the deposit taking
NBFC deposits to the bank deposits for the fiscal years 2006, 2010 and 2011,
highlighting the substantial decline of NBFC deposits.
In 2006, the RBI introduced its next important set of NBFC regulations by
revising the 1998 regulations to create a new NBFC category, the systemically
7
important non-deposit taking NBFCs. The systemically important non-deposit taking
NBFCs were defined as those non-deposit taking NBFCs with asset size of 1 billion
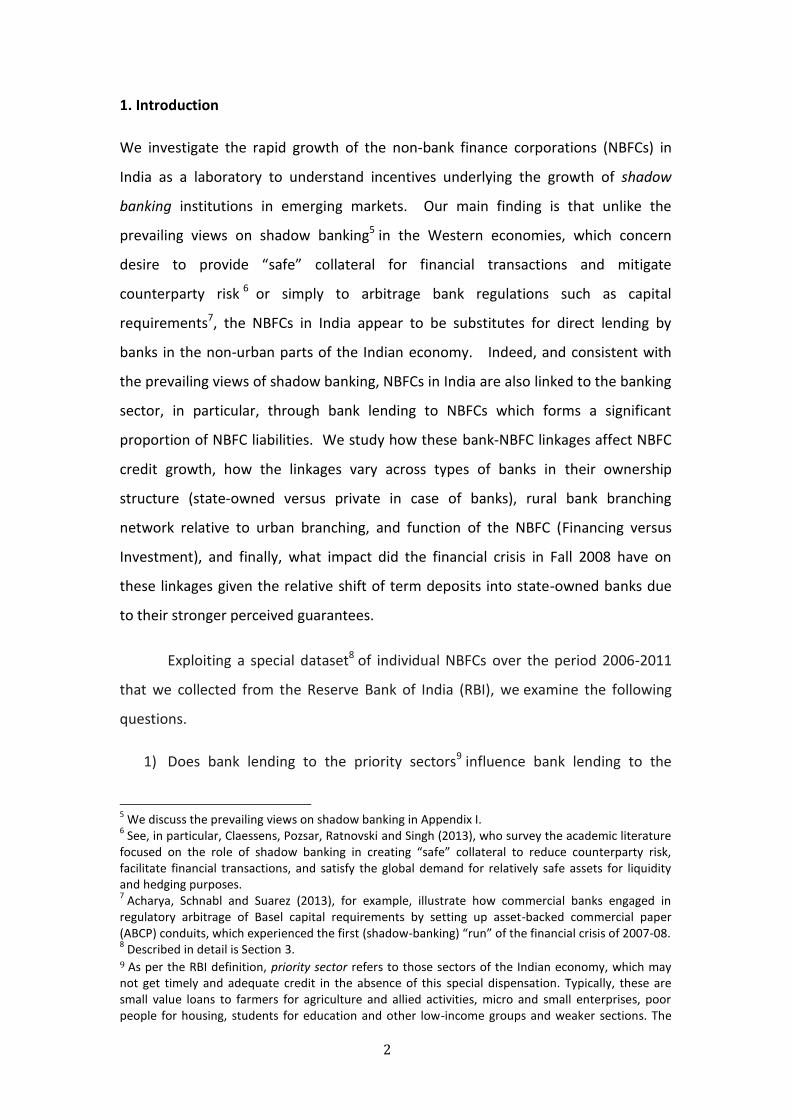
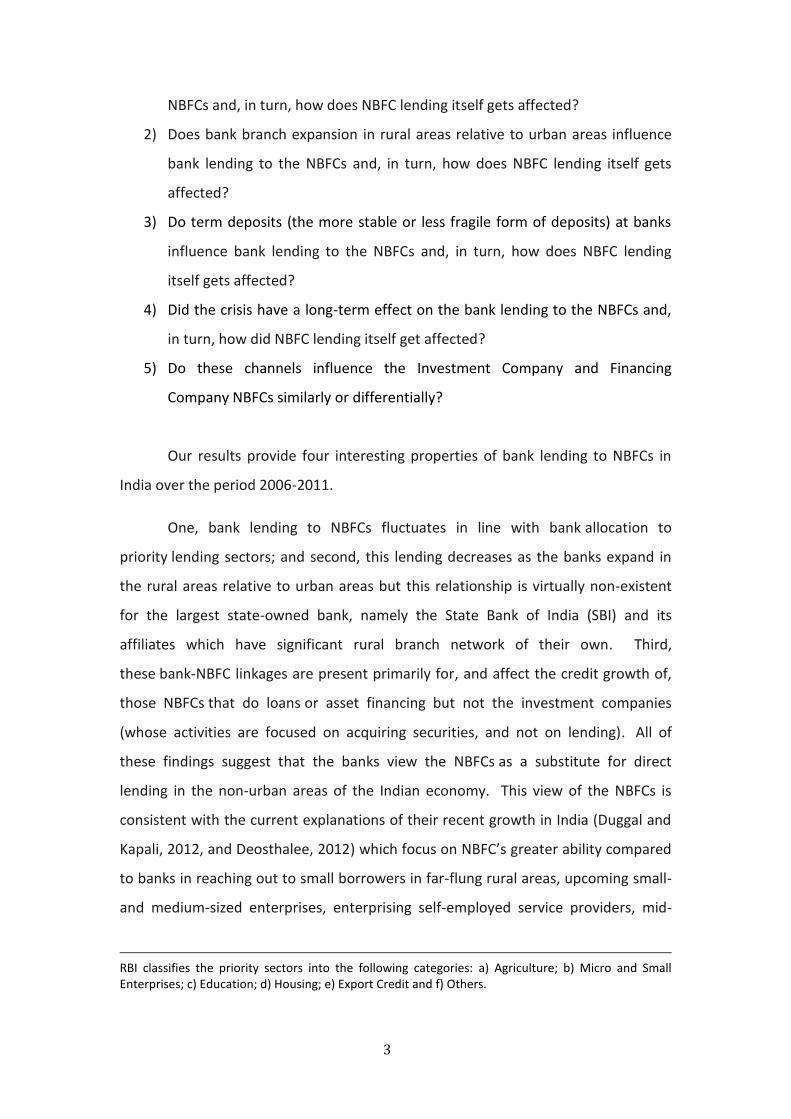
rupees or more. Figures 1 and 2 plot the growth of the systemically important non-
deposit taking NBFCs – as well as deposit taking NBFCs – both in number and asset
size from their introduction in 2006 until 2011. As is well known, the concept of
systemically important financial institutions became popular after the onset of
ongoing global financial crisis in the summer of 2007 and a financial institution is
considered systemically important if its failure poses a systemic risk to the financial
system (Acharya and Öncü, 2013). The RBI definition of systemically important non-
deposit taking NBFCs predates the ongoing financial crisis and is solely based on size.
Therefore, on the one hand, it may be argued that considering the non-
deposit taking NBFCs with asset size of 1 billion rupees or more as systemically
important might not be appropriate, since it is not clear if the individual failure of
any of these NBFCs poses a systemic risk to the financial system. On the other hand,
since the total assets of the Indian NBFCs exceed 8 trillion Rupees as of 2011 – which
is about 12% of the total assets of the Indian commercial banks – it can be argued
that their collective failure may pose a systemic risk to the financial system.14 At a
minimum, it may be more appropriate to consider the financial sector of the NBFCs –
or subsectors of it, such as the sector of gold loan NBFCs as the current events in the
gold market unfold – systemically important, although none of these NBFCs may be
large enough on their own to cause a systemic collapse. Nevertheless, we will follow
the RBI naming convention and refer to those non-deposit taking NBFCs with asset
size of 1 billion rupees or more as systemically important non-deposit taking NBFCs
14 Following the Lehman collapse of September 15, 2008, one of the largest money market mutual
funds (MMMFs), the Reserve Primary Fund, which was highly exposed to Lehman Brothers' collapsing short-term debt, had on the next day its net asset value (NAV) fall below par. Since MMMFs offer stable NAV and investors can redeem anytime at par, an immediate run on the Reserve Primary Fund occurred, causing it to shut down. This failure opened up the possibility that other MMMFs were similarly exposed and a run on the MMMFs started. Since MMMFs are a primary source for the commercial paper market, this run opened up the possibility of capital shortfalls at many financial institutions that needed to roll over commercial paper. Only after the US government guaranteed the MMMF deposits 100% the run came to a halt and the slide was stopped. Neither was the Reserve Primary Fund “too-big-to-fail” despite its $64.8 billion worth of assets prior to its shut down, nor was it even a systemically important on its own right. What was systemically important in September 2008 was the $3.5 trillion shadow-banking financial sector of MMMFs and the intervention had to be done at the sector level (Acharya and Öncü, 2013).

8
as per the RBI convention.
As of writing (April 2013), the deposit taking and non-deposit taking NBFCs
are classified by the RBI into the following seven categories by function:
1) Investment Companies;
2) Core Investment Companies;
3) Asset Finance Companies;
4) Loan Companies;
5) Infrastructure Finance Companies;
6) Factoring Companies;
7) Micro Finance Institutions.
The last two categories are recent and were formerly Loan Company NBFCs. Our
systemically important non-deposit taking NBFC dataset contains all of the above
types, except the Core Investment Companies. We have no information in our
dataset regarding which ones are Micro Finance Institutions and which ones are
Factoring Companies.15
Since the main business of all types of the NBFCs from type 3 to type 7 is
extending credit, we lump them into a super-category that we call the “Financing
Companies”. Therefore, our systemically important non-deposit taking NBFC dataset
comprises two NBFC types:
1) Investment Companies;
2) Financing Companies.
One important aspect of the Financing Company NBFCs is that many of them have
sectoral focus16. However, since the names of the NBFCs are not available in our
dataset, we are not able to map the NBFCs in our dataset to sectors. On the other
hand, the city of incorporation of the NBFCs is known, allowing us to incorporate
15
For definitions of the NBFC types, for example, see: http://www.rbi.org.in/scripts/FAQView.aspx?Id=71 16
For example, see: http://india-financing.com/An%20overview%20of%20the%20Indian%20NBFC%20Sector-%20Nidhi%20&%20Kamil.pdf
9
regional heterogeneity in demand for bank loans by the NBFCs, as well as for NBFC
credit by the borrowers into our models. In India, there are six geographical regions:
North, Northeast, East, Central, South and West. Because of economic similarities,
we lump Northeast, East and Central regions into one region, that is, the East region
and work with the following regions: East, North, South and West. We describe the
regions in more detail in the next section when we describe our data.
2.b Bank – NBFC Linkages in India
The RBI classifies the commercial banks in India into five categories:
1) The SBI Group;
2) Nationalized Banks;
3) New Private Banks;
4) Old Private Banks;
5) Foreign Banks.
As of 2012 year-end, the size of the total assets of the Indian commercial banks was
above 80 Trillion Rupees. The Nationalized Bank Group is the largest bank group by
assets (about 50% of total bank assets), followed by the SBI Group (about 21%), New
Private Bank Group (about 15%), Foreign Bank Group (about 8%) and Old Private
Bank Group (about 5%), in that order. The SBI Groups consists of the State Bank of
India (SBI) and its current five associates. The Nationalized Bank Group consists of 20
formerly private commercial banks, 14 of which were nationalized during the first
bank nationalization of 1969 while the remaining 6 of which were nationalized
during the second bank nationalization of 1980. The Old Private Bank Group consists
of 14 private banks, which were not nationalized at the time of bank nationalizations
of 1969 and 1980, while the New Private Bank Group consists of 7 banks, which were
established after the 1993 amendment – which followed the 1991 Indian economic
liberalization reforms – to the Indian Banking Act, which permitted the entry of new
private banks into Indian banking sector. Lastly, the Foreign Bank Group currently
consists of 36 foreign banks either operating themselves or having their branches in
India. Both domestic and foreign banks are subject to priority sector lending
10
requirements, and the priority sector-lending requirement is 40% for domestic banks
and 32% for foreign banks of their adjusted net credit17 as of December 2012.18
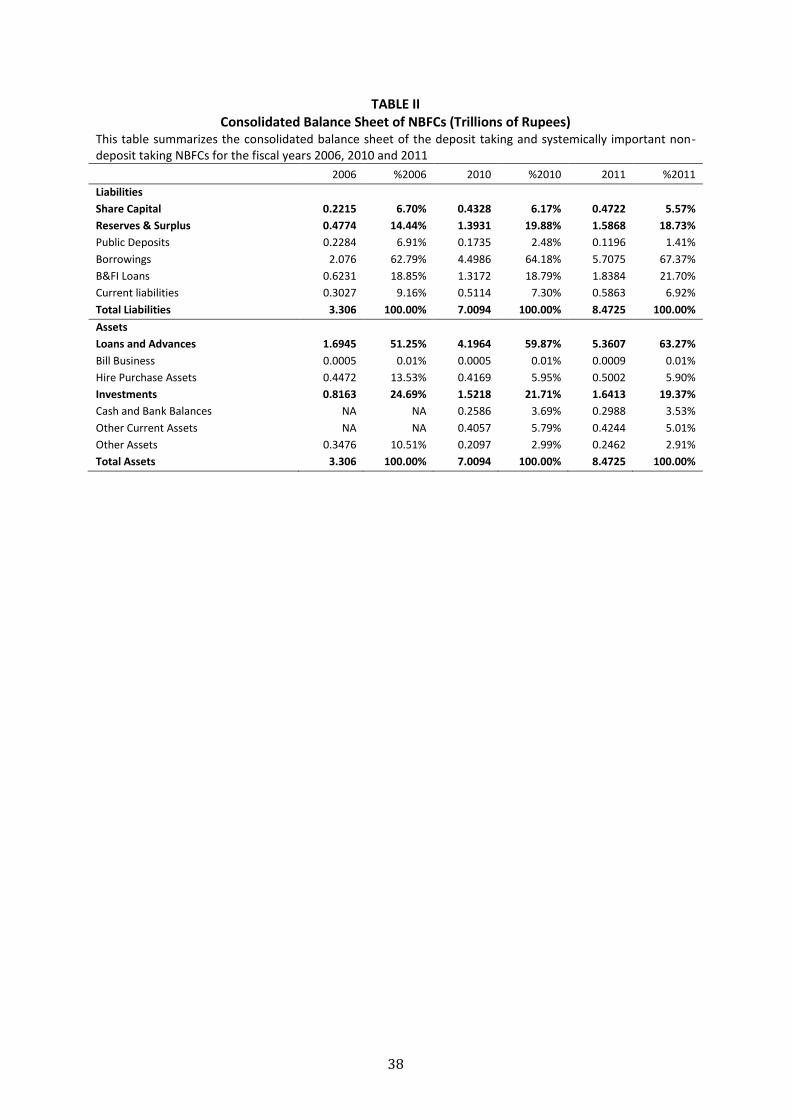
Table II summarizes the consolidated balance sheet of the deposit taking and
systemically important non-deposit taking NBFCs for the fiscal years 2006, 2010 and
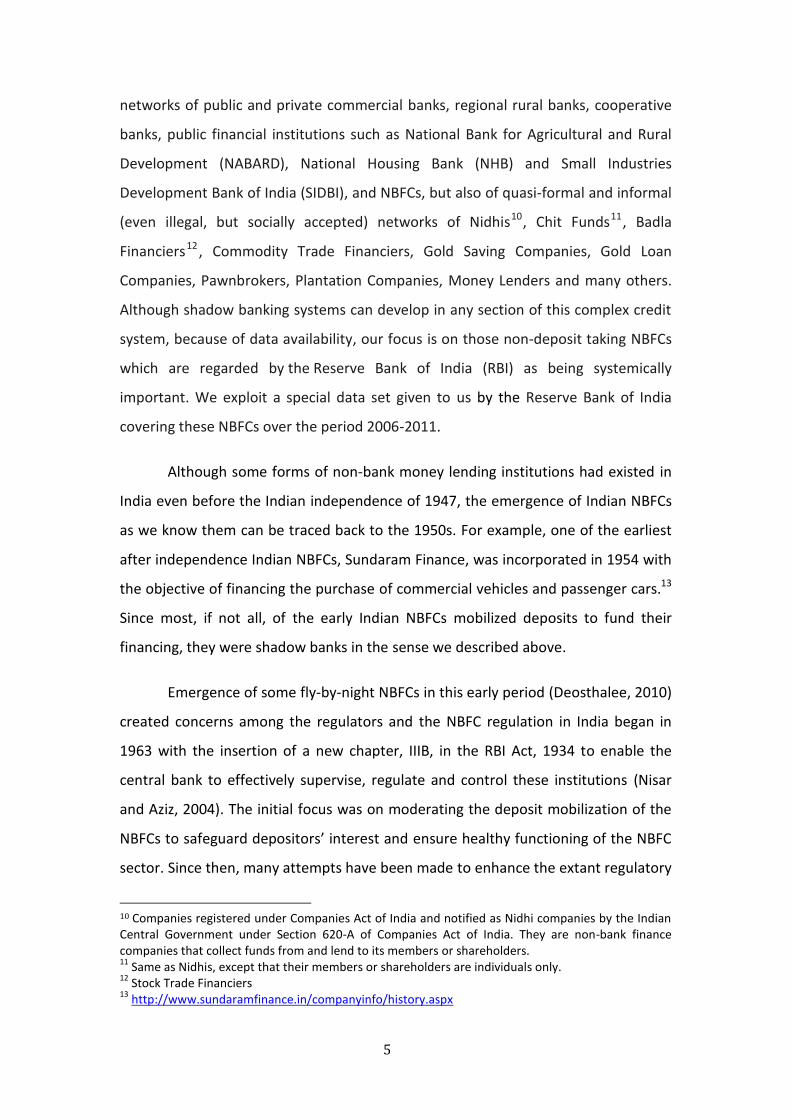
2011, whereas Figure 3 depicts the debt structures of the deposit taking and
systemically important non-deposit taking NBFCs from 2007 until 2011. Notable in
these summary data are two facts: one, that loans to NBFCs from banks and financial
institutions form a significant proportion of their liabilities, inducing a potential two-
way linkage between the banking sector and the NBFCs; and, second that there is a
steady decline in their public deposits (as stressed above), as well as in their current
liabilities. Also notable from Figure 3 is that the financial crisis that hit India in the fall
of 2008 reduced the ability of systemically important non-deposit taking NBFCs to
borrow from the banks more than the deposit taking NBFCs, whereas it is the other
way around as far as their ability in issuing debentures is concerned.
One of the important aspects of the 2006 NBFC supervisory framework was
the introduced capital adequacy requirement. The systemically important non-
deposit taking NBFCs were required to maintain a capital to risk-weighted asset ratio
(CRAR) of 10% while the CRAR requirement for the deposit taking NBFCs was left at
12% or 15%, as the case may be, depending on their types by function. This CRAR
requirement was later increased to 12% to be effective as of March 2011 and to 15%
to be effective as of March 2012. Hence, in terms of capital requirements, unlike the
typical shadow banks in other parts of the world, the Indian NBFCs are tightly
regulated. This fact alone calls into question, whether it is appropriate to consider
the Indian NBFCs as shadow banks or not. Nevertheless, the fact that these NBFCs
are non-banks as far as investor perceptions are concerned (for example, concerning
the extent of central bank support and government guarantees), but that they
17 Adjusted net bank credit is net bank credit plus the investments made by banks in held-to-maturity bonds which are not to meet the RBI liquidity requirements or it is the credit equivalent of off-balance-sheet exposures, whichever is higher. 18
For definitions of the priority sectors and priority sector lending requirements, for example, see: http://www.rbi.org.in/scripts/FAQView.aspx?Id=87
11
borrow heavily from banks makes them interesting for studying what economic
purpose are they fulfilling and how shadow banking and banking in emerging
markets are potentially intertwined.
3. The Data
First, we collect individual NBFC data over the period from March 2006 to
June 2011 from the RBI, consisting of NBFC-level balance sheet and non-performing
asset data on those non-deposit taking NBFCs that are regarded systemically
important by the RBI. The observation frequency is quarterly and the initial dataset
is an imbalanced panel consisting of 383 NBFCs and 3629 NBFC-Quarters. We collect
this data from the RBI without the names of the NBFCs. This dataset is private.
From this data set, we construct a quarterly dataset of the NBFC variables –
defined in Appendix II – using the following selection criteria.
1) In each quarter, there is no missing/erroneous balance sheet data;
2) In each quarter, total assets should match total liabilities within 0.01%
error;
3) The previous quarter balance sheet data exist and are as above.
By applying the above selection criteria, we get an imbalanced panel dataset of 257
NBFCs and 2374 NBFC-Quarters.
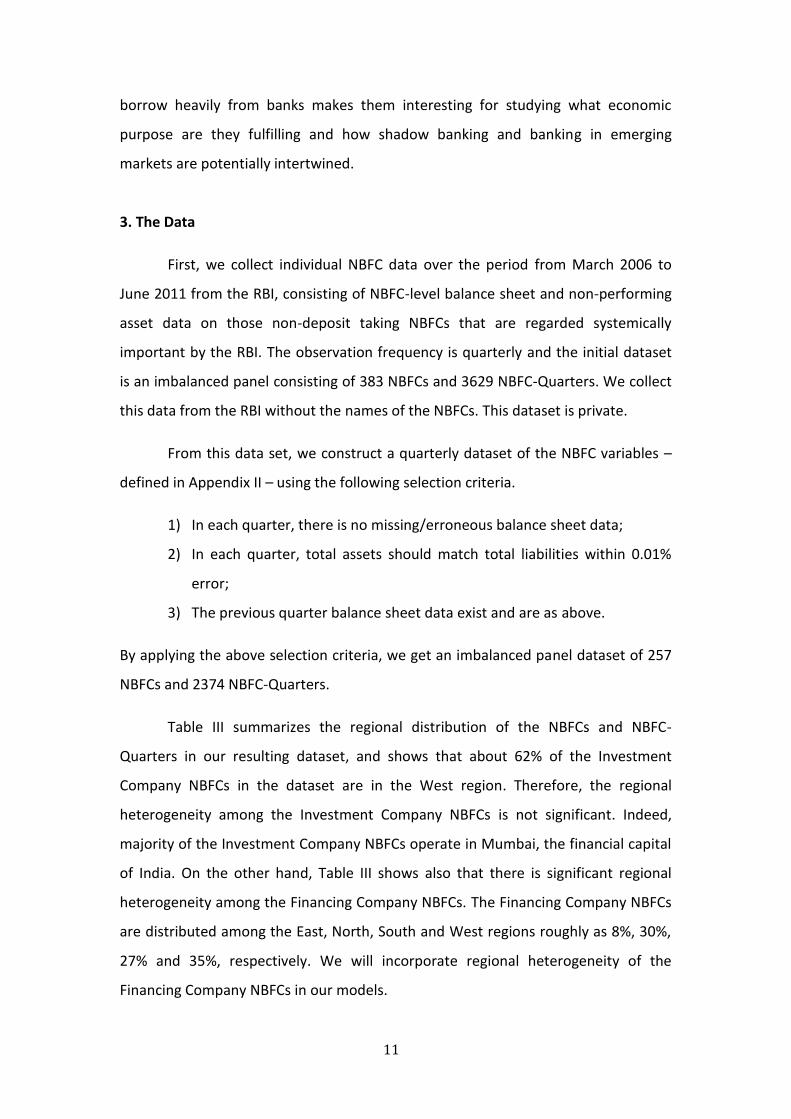
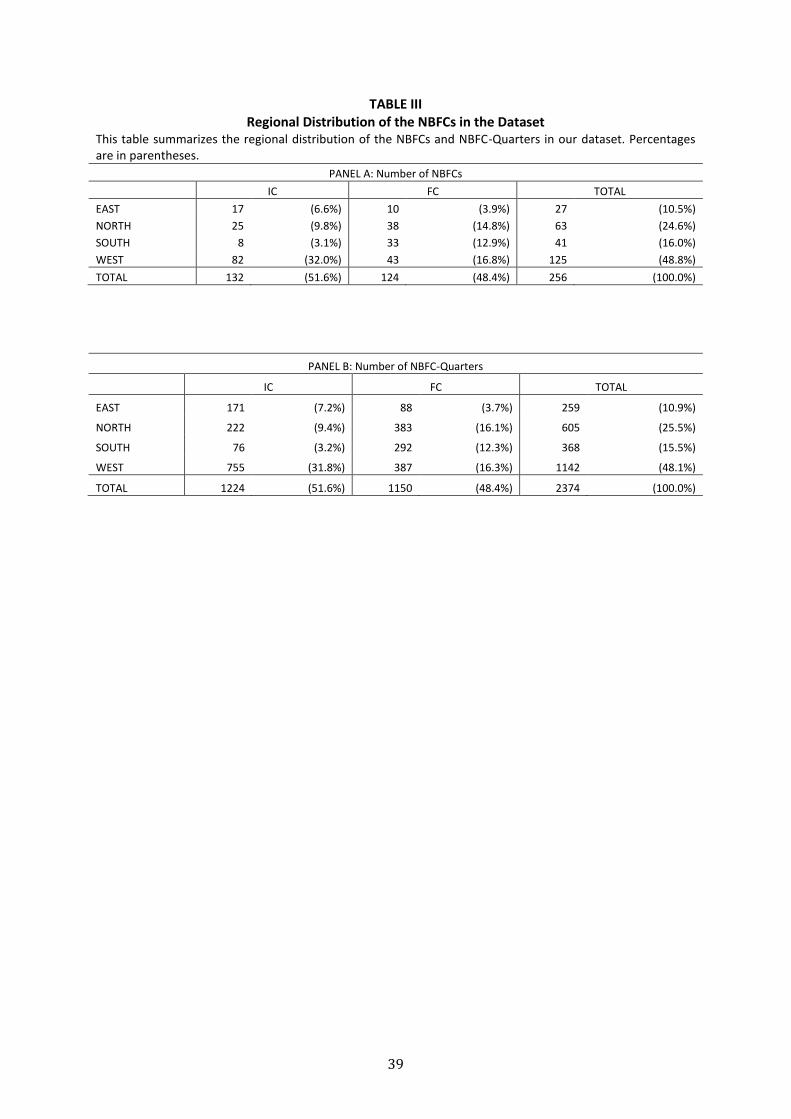
Table III summarizes the regional distribution of the NBFCs and NBFC-
Quarters in our resulting dataset, and shows that about 62% of the Investment
Company NBFCs in the dataset are in the West region. Therefore, the regional
heterogeneity among the Investment Company NBFCs is not significant. Indeed,
majority of the Investment Company NBFCs operate in Mumbai, the financial capital
of India. On the other hand, Table III shows also that there is significant regional
heterogeneity among the Financing Company NBFCs. The Financing Company NBFCs
are distributed among the East, North, South and West regions roughly as 8%, 30%,
27% and 35%, respectively. We will incorporate regional heterogeneity of the
Financing Company NBFCs in our models.
12
Second, we collect aggregate bank data from the RBI on the bank groups,
namely, the SBI Group, the Nationalized Bank Group, the New Private Bank Group,
the Old Private Bank Group and the Foreign Bank Group. This dataset is also
quarterly – from March 2001 to June 2012 – and consists of bank group-level
balance sheet and priority sector lending data on bank groups listed above. This
dataset is private, also.
Thirdly, we collect aggregate bank branch data on bank groups, namely, the
SBI Group, the Nationalized Bank Group, the New Private Bank Group, the Old
Private Bank Group and the Foreign Bank Group from the RBI website. The
observations are quarterly and the first observation is of March 2006. The data get
updated at the RBI website on a quarterly basis. This dataset is publicly available.
Fourthly, we collect economic data on Indian 3 month and 10 year yields,
gross domestic product and wholesale price index from the Economic and Political
Weekly Research Database. This dataset is publicly available also, although
subscription is required.
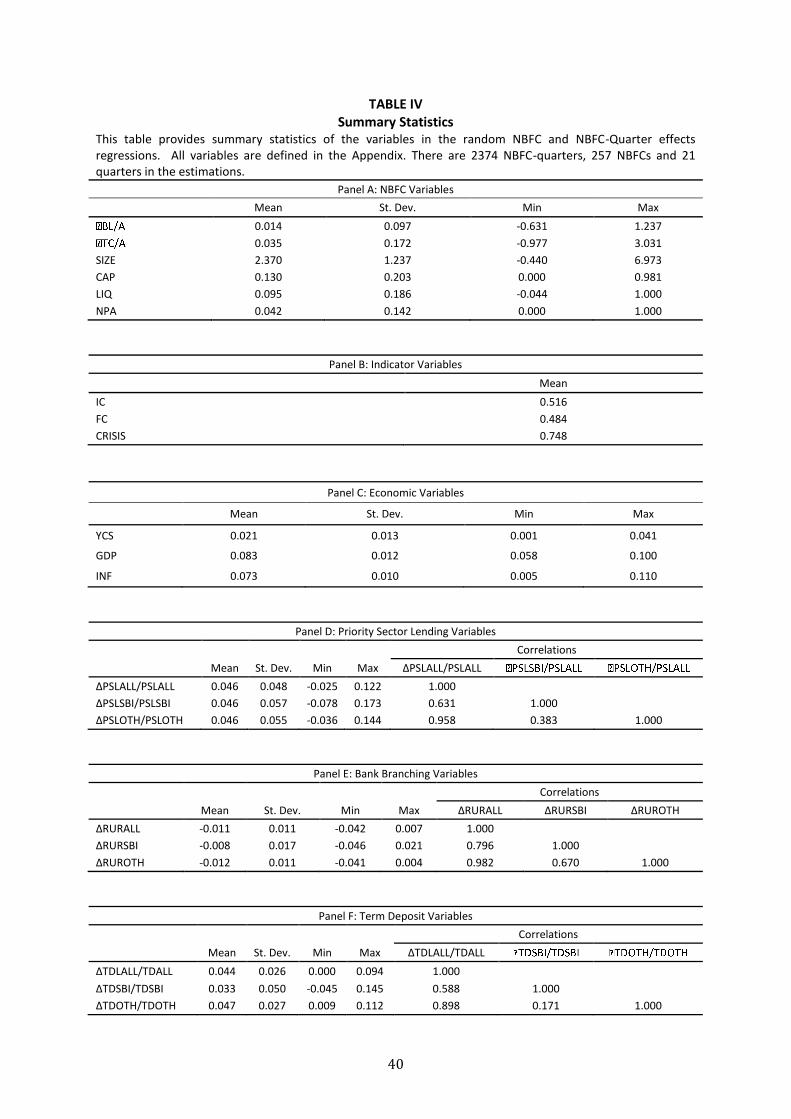
Lastly, we merge all of these datasets to construct our final dataset. Summary
statistics of the data are given in Table IV and all variables are defined in Appendix II.
4. Empirical Design
To examine the questions we posed in the Introduction, we start by analyzing
how bank lending to and credit extension by the NBFCs are affected by NBFC type, as
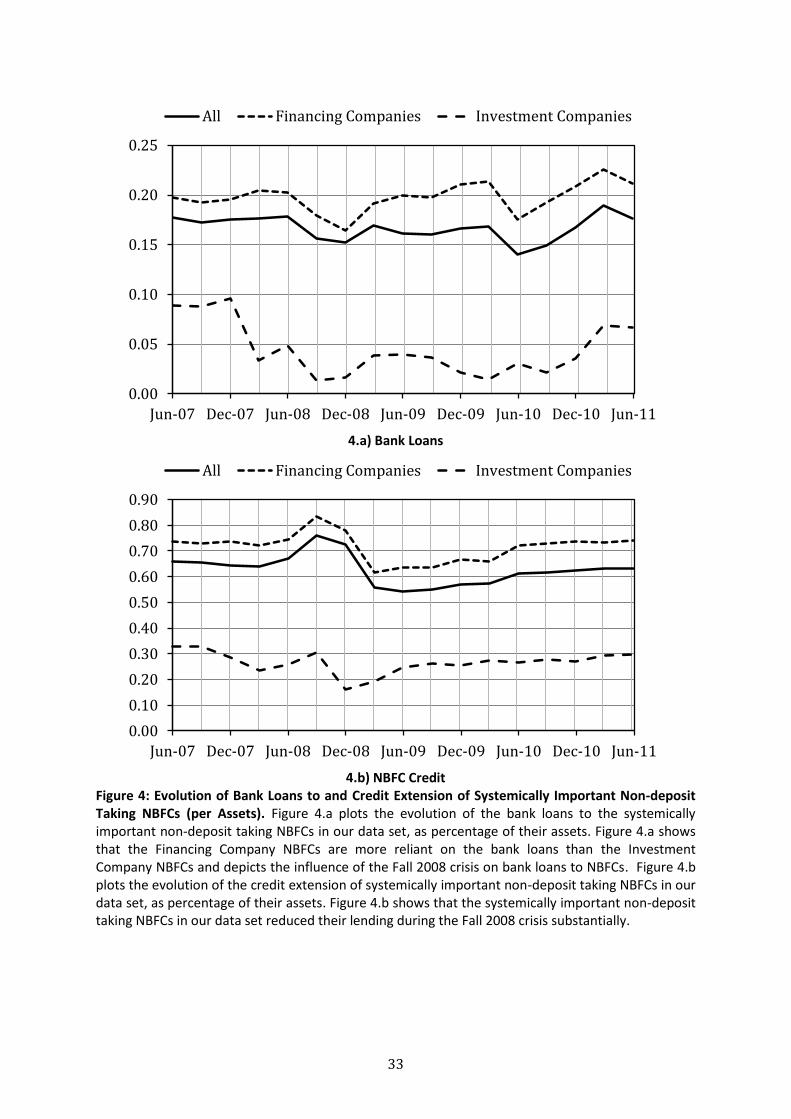
well as by the crisis of Fall 2008. In Figures 4.a and 4.b we plot respectively the
evolution of the bank loans to NBFCs and credit extension by NBFCs as percentage of
their assets for the systemically important non-deposit taking NBFCs. Figure 4.a also
depicts the effect of the Fall 2008 crisis, in particular, that banks decreased their
lending to the NBFCs during the crisis. Similarly, Figure 4.b shows that the
systemically important non-deposit taking NBFCs in our dataset reduced their
lending during the Fall 2008 crisis substantially, although the reduction in bank credit
extension during the crisis has been less severe.
13
Recall from the previous section that our dataset of individual NBFCs consists
of Investment Company and Financing Company systemically important non-deposit
taking NBFCs. While the main business of Financing Company NBFCs is extending
credit, the main business of Investment Company NBFCs is the acquisition of
securities. Indeed, Figure 4.b shows for our dataset that while the credit extended by
Financing Company NBFCs is about 70% of their total assets, the credit extended by
Investment Company NBFCs is only about 25% of their total assets, on the average.
The credit extended by all NBFCs is about 60%, on the average. More importantly,
Figure 4.a shows for our dataset that while Financing Company bank loans constitute
about 20% of their total liabilities, Investment Company bank loans constitute only
about 5% of their total liabilities, on the average. The banks loans to all NBFCs are
about 17% of their total liabilities, which is a sizeable amount.19
The significance of the above observations is that this sizeable bank lending
to the NBFCs provides a direct link between the banks and NBFCs, creating a
transmission mechanism of shocks between the banking and shadow banking
systems. Indeed, when the 2008 Global Financial Crisis hit the Indian economy and
the financial system, some of the worst liquidity conditions were experienced by the
NBFCs. This withdrawal of liquidity appears to be a “shadow bank run” on the NBFCs,
resulting from a “run” on the private sector banks20 (transmitted to the NBFCs
19
Indeed, since bank loans are an important source of funds of the systemically important non-deposit taking NBFCs – particularly of the Financing Company NBFCs –, the RBI issued a separate circular to the banks on banks' exposures to systemically Important NBFCs in conjunction with the 2006 NBFC supervisory framework. In this circular, the exposure (both lending and investment, including off balance sheet exposures) of a bank to a single NBFC was restricted to a 15% or 10% maximum of the bank’s capital funds as per its last audited balance sheet, depending on whether the NBFC was an Asset Finance Company or not, respectively. These maxima were increased by 5%, if this excess amount is on account of funds on-lent by the NBFC to infrastructure sectors. 20 In an interview we conducted, the then RBI Deputy Governor Usha Thorat described the situation as follows. “Especially the public sector bank deposits went up and the private sector bank deposits took a knock. So, the private sector banks were quite resource constrained. Also, the RBI facilities were mostly collateralized ones against government securities and private sector banks did not have sufficient securities above the statutory requirements to be able to take RBI liquidity – which meant they were constrained on liquidity at the same time that lending by banks to NBFCs decelerated. In Aug 2008, some NBFCs faced a liquidity problem. Many of them were even doubtful whether their CPs would be rolled over. Some of them had to have liquidity infusion from their sponsors. Bank credit lines started choking. The mutual funds, which had invested in the NBFCs’ short term paper, withdrew or started selling these. In fact, the vulnerability of this sector to liquidity risk got exposed. There was huge pressure on the RBI to open a liquidity window special for NBFCs. The RBI Act prohibits lending to non-banks (except for some very few categories) and so we did open a window through banks. But banks were quite reluctant to use it as they had to take credit risk of NBFCs, which they started getting
14
through bank loans) and mutual funds 21 (transmitted to the NBFCs through
commercial paper).
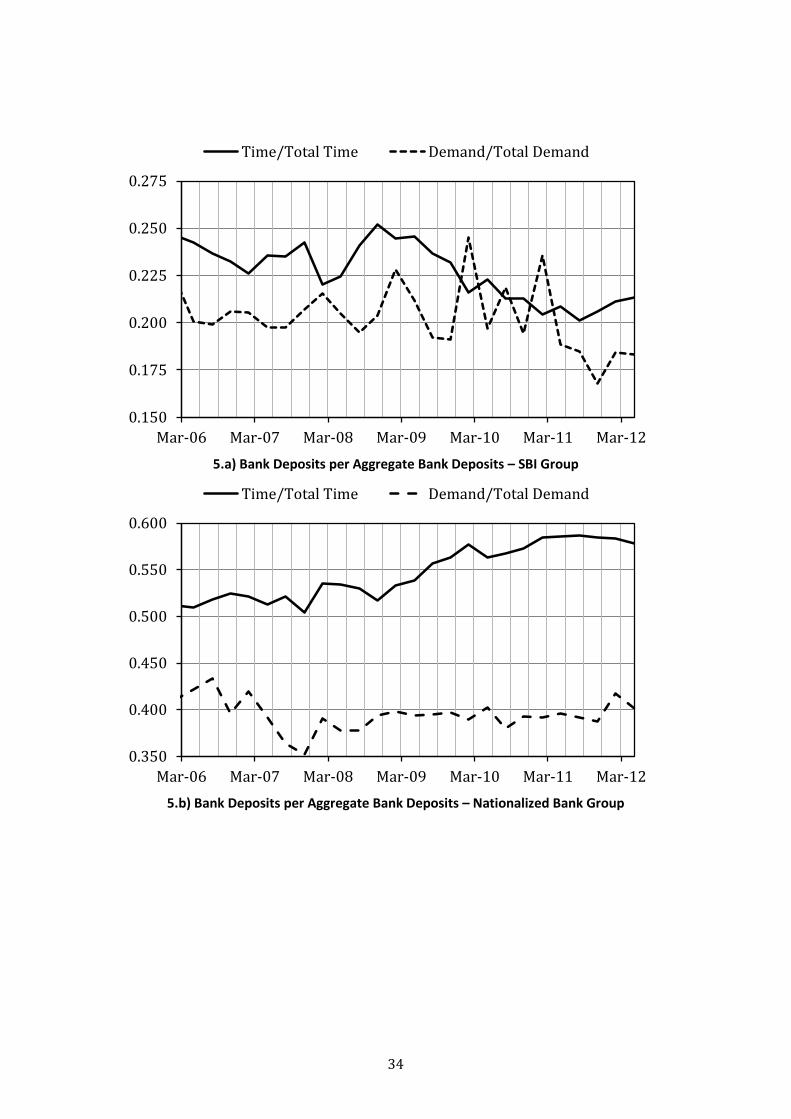
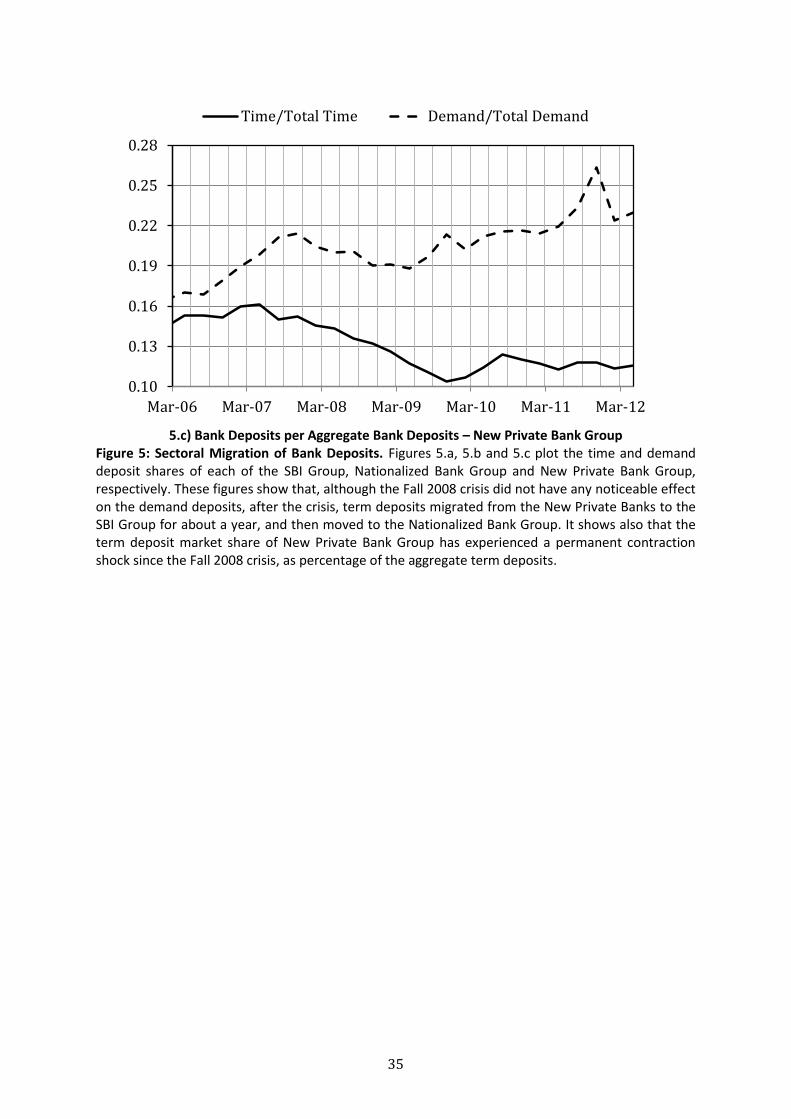
Second, we analyze how bank lending to NBFCs was related to the deposit
shifts across bank types in Fall 2008. Figures 5.a, 5.b and 5.c plot the time and
demand deposit shares of each of the SBI Group, Nationalized Bank Group and New
Private Bank Group, respectively. These figures show that although the Fall 2008
crisis did not have any noticeable effect on the demand deposits, term deposits
migrated after the crisis from the New Private Banks to the SBI Group for about a
year, and then moved also to the Nationalized Bank Group. As seen in Figure 4.a, this
sectoral migration corresponds with the withdrawal of banks loans from the NBFCs.
Figure 5.c shows also that the term deposit market share of New Private Bank
Group has experienced a permanent contraction shock since the Fall 2008 crisis, as
percentage of the aggregate term deposits at all banks. It should be mentioned that,
in addition to this sectoral migration, a maturity transformation from demand
deposits to term deposits for the SBI and the Nationalized Bank Group (and reverse
transformation for the New Private Bank Group) also took place during the Fall 2008
crisis (Acharya and Kulkarni, 2013). This maturity transformation, together with the
sectoral migration, indicates that the overall deposit base during the Fall 2008 crisis
of the New Private Banks contracted more than the term deposit migration from the
New Private Banks indicates.
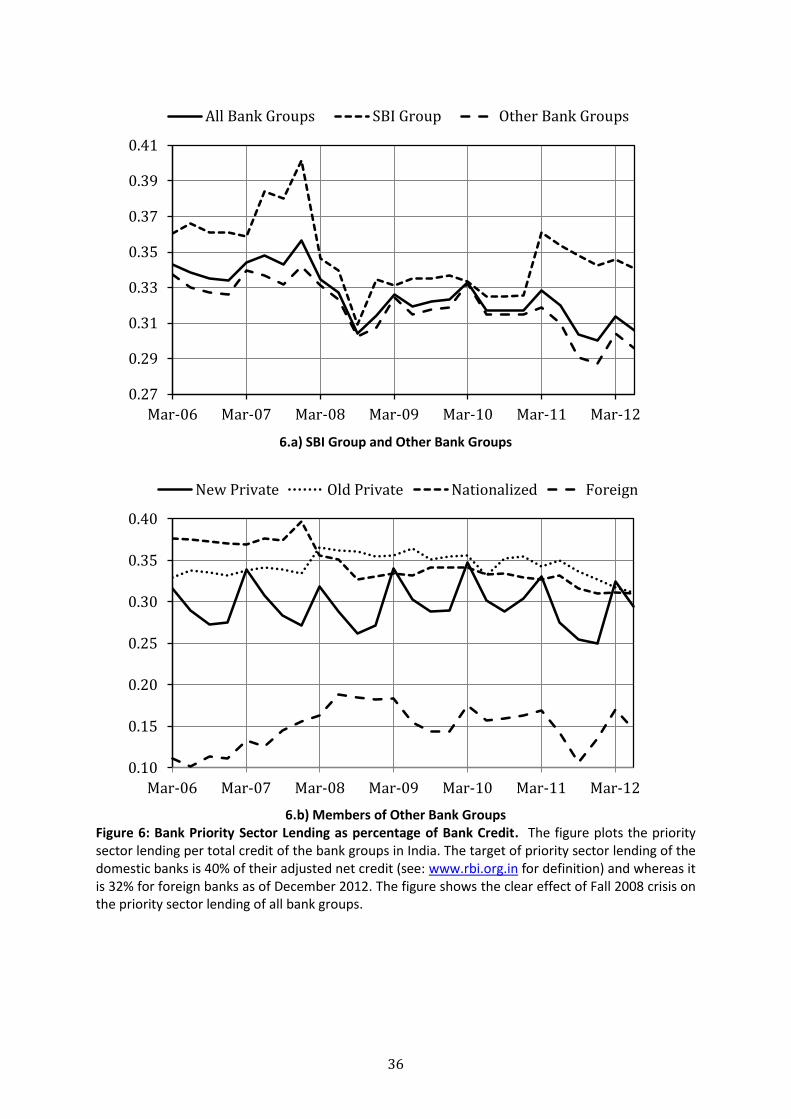
Third, we analyze the impact of the Fall 2008 crisis on the priority sector
lending of the bank groups in India. Figures 6.a and 6.b plot the per total credit
priority sector lending of the bank groups and show that this withdrawal of bank
loans from the NBFCs corresponds with a massive contraction in bank lending to the
priority sectors in the summer of 2008. As is well known, bank loans on accounts of
funds on-lent by the NBFCs to priority sectors had been classified as priority sector
very wary about. When banks were unwilling to finance NBFCs, the RBI opened a special facility through a structured vehicle, which was already located in the IDBI.” 21
Aziz, Patnaik and Shah (2008) describe the run on mutual funds as follows. “Traditionally, local firms placed a significant amount of short-term funds with mutual funds (both debt and equity) because these are tax-advantaged. When the Indian money market became tight, these firms redeemed their investments in mutual funds to finance their own funding needs. This set off a wave of redemptions for mutual funds.”
15
lending until the April 2011 RBI intervention, declassifying such loans from priority
sector lending. 22 However, with the exception of the last quarter in our observation
period, bank loans on accounts of funds on-lent by the NBFCs to priority sectors had
been considered as priority sector lending by the RBI.
Our last observation is related with the rural bank branch presence of the
Indian bank groups relative to their urban bank branch presence. The SBI Group has
the largest rural presence relative to urban presence and the Nationalized Bank
Group, Old Private Bank Group, New Private Bank Group and Foreign Bank Group
follow the SBI Group, in that order. The rural presence of the foreign banks is
virtually nonexistent. The significance of this is that much of the priority sector
lending takes place in the rural areas. Furthermore, much of the NBFC lending takes
place in rural areas. Therefore, banks that have lower branching in rural areas
relative to urban areas may have higher incentives to lend to the NBFCs that on-lend
the funds to the priority sectors to meet their priority sector lending targets (at least,
until the April 2011 RBI declassification of such loans from priority sector lending,
and there are rumors as of April 2013 that the situation may change, and the RBI
may allow the banks to do their priority sector lending through lending to the NBFCs
again).
Motivated by these observations, we now seek to answer the five questions
posed in the Introduction concerning how bank lending to the NBFCs is affected by
bank and NBFC type or heterogeneity, and how this lending was affected by the
deposit shifts across bank types in Fall 2008. Had we known the direct lending
linkages between the banks and NBFCs at the institution level, these questions could
have been addressed in a relatively straightforward manner. Given the absence of
such data, we try to address this question using the bank group-level data as follows:
we separate the SBI Group from the rest and collect the rest of the groups in a
category we call the Other Bank Groups. We then look at how the priority sector
lending, bank branching and term deposits of the SBI Group and the Other Bank
Groups influence aggregate bank lending to the NBFCs and, in turn, overall NBFC
credit extension. The rationale for this grouping arises from the fact the SBI Group 22
Two months before the end of our observation period.
16
has the strongest non-urban branching network and it enjoyed the greatest term
deposit migration in Fall 2008 due to it being the strongest set of banks in terms of
perceived government guarantees.
Prior to describing our empirical specifications, we emphasize that although
we work with individual NBFC data, neither there are any individual bank data, nor
any individual bank to individual NBFC linkage data, nor any other micro-level data
on corporate and retail NBFC as well as bank borrowers in our dataset23, so as to
control for varying demand conditions for the NBFC and/or bank credit. Since all of
the questions we seek to answer are concerned with the credit supply from banks to
NBFCs as well as from NBFCs to their clients, identification in our tests could be in
question without some control on demand for credit, particularly for the Financing
Company NBFCs. We address this issue at three levels as follows.
First, we exploit the fact that most of the Financing Company NBFCs operate
locally. In the presence of sufficiently granular data, a good approach to controlling
for variations in credit demand would have been incorporating some regional
activity measures into the models. This would have allowed us to control not only for
regional, but also for temporal variations in credit demand conditions. However,
quarterly regional activity measures are not available in India and, therefore, we
introduce Financing Company Regional dummies for the East ( ), North ( ), South
( ) and West ( ) regions described in the previous section into our regressions as
a second-best approach.
Second, since many Financing Company NBFCs have sectoral focus and
changing economic conditions influence different sectors differently, controlling for
variations in sectoral credit demand is also desirable. In the absence of such sectoral
information, we incorporate region-specific NBFC random effects into our models to
address sectoral variations in credit demand.
And, third, we introduce region-specific NBFC-Quarter random effects to
23
Such data are not available not only in India, but also in most emerging market countries with quarterly frequency. In most cases, such data are not available even with annual frequency.
17
account for temporal variations in credit demand conditions.
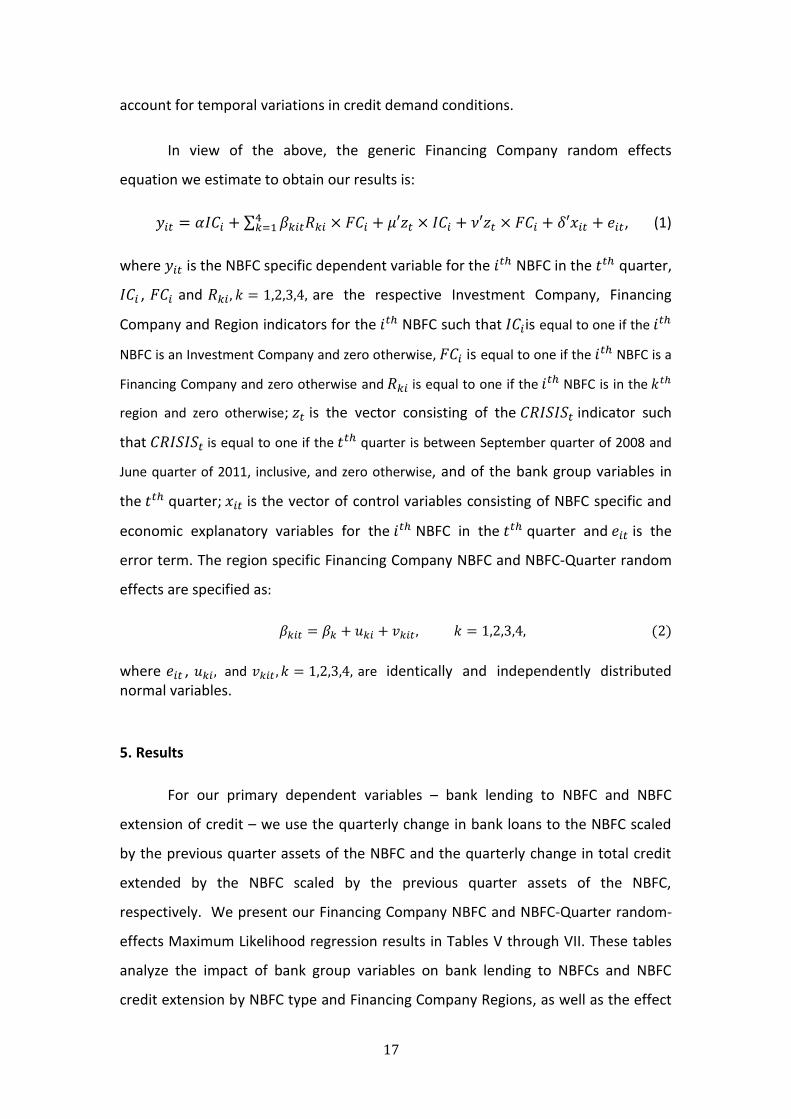
In view of the above, the generic Financing Company random effects
equation we estimate to obtain our results is:
∑ , (1)
where is the NBFC specific dependent variable for the NBFC in the quarter,
, and are the respective Investment Company, Financing
Company and Region indicators for the NBFC such that is equal to one if the
NBFC is an Investment Company and zero otherwise, is equal to one if the NBFC is a
Financing Company and zero otherwise and is equal to one if the NBFC is in the
region and zero otherwise; is the vector consisting of the indicator such
that is equal to one if the quarter is between September quarter of 2008 and
June quarter of 2011, inclusive, and zero otherwise, and of the bank group variables in
the quarter; is the vector of control variables consisting of NBFC specific and
economic explanatory variables for the NBFC in the quarter and is the
error term. The region specific Financing Company NBFC and NBFC-Quarter random
effects are specified as:
where , and are identically and independently distributed normal variables.
5. Results
For our primary dependent variables – bank lending to NBFC and NBFC
extension of credit – we use the quarterly change in bank loans to the NBFC scaled
by the previous quarter assets of the NBFC and the quarterly change in total credit
extended by the NBFC scaled by the previous quarter assets of the NBFC,
respectively. We present our Financing Company NBFC and NBFC-Quarter random-
effects Maximum Likelihood regression results in Tables V through VII. These tables
analyze the impact of bank group variables on bank lending to NBFCs and NBFC
credit extension by NBFC type and Financing Company Regions, as well as the effect
18
of the Fall 2008. In all of the regressions, we use the NBFC size, capitalization,
liquidity and non-performing asset variables as the NBFC-specific, and yield curve
slope, GDP growth and inflation variables as the economy-specific control variables.
All variables are defined in Appendix II.
In Table V, the bank group variables we consider are percentage quarterly
changes in priority sector lending of All Banks, the SBI Group and Other Bank Groups.
In Table VI, our bank group variables are the quarterly changes in the rural to urban
branch ratios of All Banks, the SBI Group and Other Bank Groups. And, lastly, in Table
VII, our bank group variables are the percentage quarterly changes in term deposits
at All Banks, the SBI Group and Other Bank Groups.
An important result from Tables V-VII is that bank variables have no impact
on the ability of the Investment Company NBFCs – neither to borrow from banks nor
to lend to their borrowers during our observation period. This result comes as no
surprise because the main business of the Investment Company NBFCs is the
acquisition of securities. Unlike the Financing Company NBFCs, the Investment
Company NBFCs in India are not in the credit intermediation business. It is the
Financing Company NBFCs that are in the credit intermediation business and are
affected by the extent of bank lending to them.
A second important result from Tables V-VII is that both the bank lending to
Financing Company NBFCs and the Financing Company NBFC credit expansion
experienced a permanent contraction shock with the Fall 2008 crisis, even after
controlling for Financing Company specific regional, sectoral and temporal
variations. Yet, the crisis had no noticeable impact on the ability of the Investment
Company NBFCs, neither to borrow from banks nor to lend to their borrowers.
A third important result from Tables V-VII is two-fold:
1) As far as borrowing from the banks is concerned, the Financing Company
NBFCs in the East rely on the banks the most (per assets), whereas the
Financing Company NBFCs in the West rely on the banks the least (per
assets), as can be seen from the first panels (Panel A) of all of the above
19
tables. Given it is well-known that the West is the most (and the East is the
least) financially developed region of India, this result is consistent with the
expected regional variation in bank lending to NBFCs.
2) As far as NBFC credit extension is concerned, the Financing Company NBFCs
in the North lend the most (per assets), whereas the Financing Company
NBFCs in the West lend the least (per assets), as can be seen from the second
panels (Panel B) of all of the above tables. The result that the Financing
Company NBFCs in the West lend the least is expected also, because – West
being the most financially developed region of India – in the West, there are
many outlets to borrow from, both for the corporate and retail clients. We
conjecture that the greater lending by the NBFCs in the North may be
attributable to their greater focus on infrastructure where financing needs
tend to be greater in magnitude. Further, it is possible also that some of the
Northern NBFCs are state-owned NBFCs, lending to infrastructure projects
around to country (so that their lending is not regional), but reporting their
lending in Delhi.
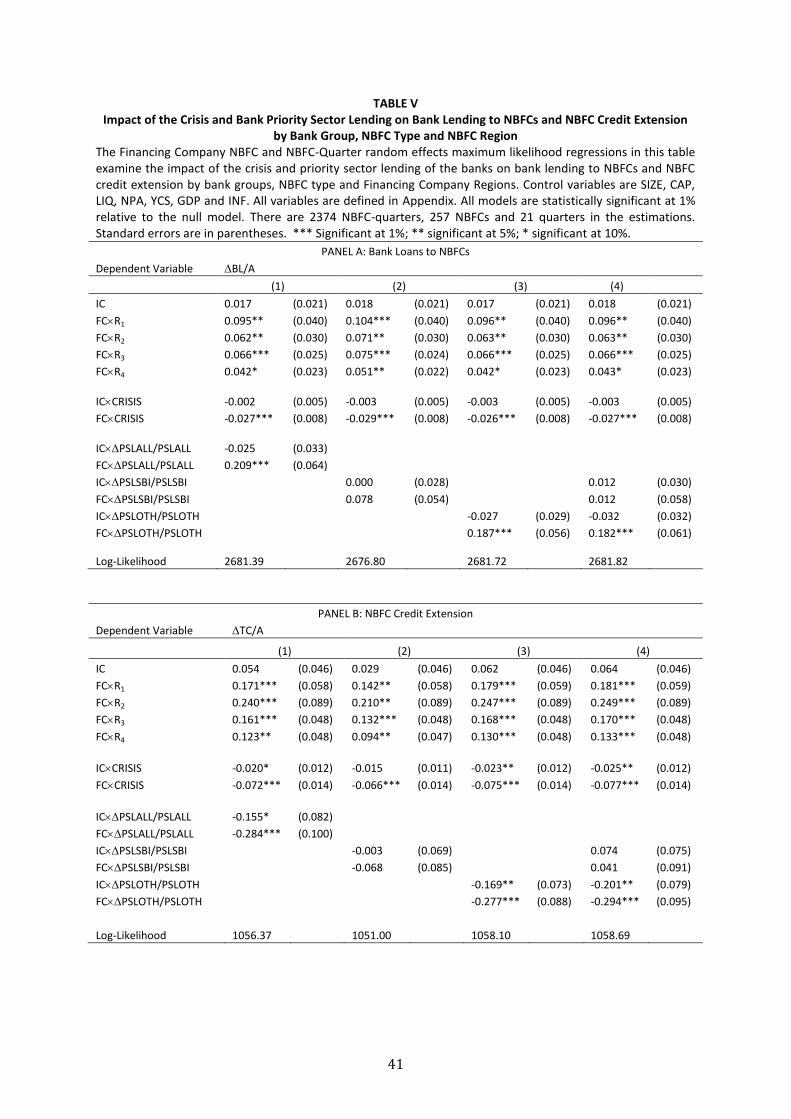
Turning our attention to the bank group variables, let us now consider Table
V in which we investigate impact of bank priority sector lending on bank lending to
the NBFCs and the NBFC credit extension. It is evident from Panel A that while the
priority sector lending of the SBI Group has no relation with the Financing Company
NBFC borrowing from the banks, an increase in the priority sector lending of the
Other Bank Groups indicates an increase in the Financing Company NBFC borrowing
from the banks. The relationship between the Financing Company NBFC borrowing
from the banks and the Other Bank Groups is statistically significant at 1% level. As a
check on economic significance we run the following experiment.
Since the Financing Company NBFCs in the East rely on the banks most
heavily, we consider a Financing Company NBFC in the East and evaluate our
dependent bank lending to NBFC variable, that is, the quarterly change in bank loans
to the NBFC scaled by the previous quarter assets of the NBFC, at the sample means
of all of the explanatory variables for Model (3) in Panel A of Table V. We set the
crisis dummy, that is, the explanatory variable , to one, so we are looking at
20
the period after the onset of the crisis. We then reevaluate the dependent variable
by shocking up the percentage quarterly change (i.e., change from previous quarter
to the current quarter scaled by that of the previous quarter) in priority sector
lending of the Other Bank Groups. The pre and post values – in percentage terms –
are 7.59% and 8.62%, respectively. Therefore, a one standard deviation shock to the
percentage change in priority sector lending of the Other Bank Groups corresponds
to a 1.03% increase in the bank loans to the NBFC (scaled by the previous quarter
assets of the NBFC over a quarter).24
In Table VI, we investigate the impact of quarterly changes in bank branching
in rural areas relative to urban areas on bank lending to the NBFCs and the NBFC
credit extension. Our results indicate that the relationship between the changes in
bank branching in rural areas relative to urban areas on bank lending to the NBFCs
and the NBFC credit extension is marginally significant.25 In particular, an increase in
the rural bank branches relative to urban bank branches of the Other Bank Groups
indicate a decrease in the bank loans to Financing Company NBFCs and increase in
the NBFCs credit extension (though this latter effect is statistically insignificant). It is
evident, however, that changes in the SBI Groups bank branching in rural areas
relative to urban areas have no impact on bank lending to the NBFCs and the NBFC
credit extension.
Lastly, in Table VII, we study the effect of term deposits at the banks on bank
lending to NBFCs and NBFC credit extension. Panel A shows that as deposits build up
at the SBI Group, bank lending to the NBFCs decreases whereas deposit build-up at
24
A similar experiment with the NBFC credit extension led to a similar conclusion. Tests of the same nature indicate economic significance for the term deposit build up at the banks but not for bank branching of the banks, both for the bank lending to NBFCs and NBFC credit extension. 25
This picture changes, if we exclude the CRISIS dummy. The results still indicate that quarterly changes in none of the bank branch ratios have any influence on Investment Company NBFCs. However, quarterly changes in the bank branch ratios influence Financing Company NBFCs. As the bank groups increase their rural presence, the bank lending to the NBFC and the NBFC credit extension decrease. However, when we re-estimate the models in Table VI by restricting the parameters of the bank ratio variables to zero, we are unable to reject the restrictions for seven of the eight models, indicating that bank branch variables do not add much beyond and above the effect of the crisis.
21
neither the Other Bank Groups nor the entire sector has any influence on bank
lending to the NBFCs. This is consistent with our earlier results that the SBI Group’s
priority-sector lending does not affect bank lending to the NBFCs, so that a shift of
deposits into the SBI Group would increase the SBI Group’s priority-sector lending
(as documented by Acharya and Kulkarni, 2013, starting the Fall of 2008), but this
would not translate into greater lending to the NBFCs as the SBI Group has a deep
rural branch network of its own. However, since shift into the SBI Group is a flight of
deposits away from other groups, bank lending to NBFCs falls in the term deposits of
the SBI Group.
An interesting result from Panel B is that while an increase in term deposits
at the SBI Group corresponds with an increase, an increase in term deposits at the
Other Bank Groups corresponds with a decrease in the credit extension of the
Financing Company NBFCs. One explanation for this result – based on the
observation from Figure 3.b – is that when the ability of the non‐deposit taking
NBFCs to borrow from the banks went down with the crisis, they started to borrow
in the debt market to compensate for this loss of bank funding. However, this switch
from bank borrowing to debenture issuance corresponds with the migration of term
deposits to the SBI Group. Hence, it may be difficult to disentangle the effects of the
crisis and term deposit migration on the NBFC credit extension without controlling
for other sources of funding to the non‐deposit taking NBFCs.
We also address some robustness issues. It is believed by many that the crisis
that started in September 2008 ended a year later. To address this issue, we define
a post-crisis variable we label POSTCRISIS and add this variable to the regressions in
Tables V, VI and VII to investigate the robustness of our conclusion that the crisis
that started in September 2008 had a permanent contraction effect on both bank
the lending to and credit extension of Financing Company NBFCs. POSTCRISIS is the
indicator variable equal to one if the current quarter is between December quarter
of 2009 and June quarter of 2011, inclusive, and zero otherwise. Our unreported
results indicate that the post-crisis indicator is never significant and, therefore, our
conclusion is robust to the possibility that the crisis and its influence ended in
December 2009.
22
The second potential concern is that the bank and financial institution
sponsored NBFCs may be driving our conclusions, that is, bank lending to NBFCs is
simply an “internal capital-market” reallocation of banks to their NBFC affiliates.
There are currently 28 bank and financial institution-sponsored NBFCs in India and
25 of them are in our dataset.26 As a second robustness check on our results, we re-
estimate our models by dropping these 25 NBFCs from our dataset. The resulting
data set consists of 232 NBFCs and 2010 NBFC-Quarters. Our unreported results
show that our conclusions from the full dataset remain unaltered.
6. Conclusions
We study in this paper the determinants of the growth of those non-deposit
taking non-bank financial corporations (NBFCs) which are regarded by the Reserve
Bank of India as being systemically important and have grown substantially in India
over the past decade.
We document that bank lending to these NBFCs forms a significant proportion of
their liabilities, and fluctuates in line with bank allocation to priority lending sectors.
Bank lending to NBFCs in turn affects their credit growth, so that the recent growth
in assets of the NBFCs can be understood as being increasingly financed by funding
from banks. Bank lending to these NBFCs also appears to be greater for banks that
have lower branching in non-urban areas relative to urban areas. However, this
bank-NBFC linkage is virtually non-existent for the largest state-owned bank, the
State Bank of India (SBI), and its affiliates, which have a deep rural branching
network of their own. Interestingly, these bank-NBFC linkages are present primarily
for those NBFCs that do loans or asset financing and not for investment
companies. Overall, the findings suggest that NBFCs are seen by banks with less
than fully-developed branching networks as a completeness of credit allocation in
non-urban areas of the Indian economy, but that this economic role played by the
NBFCs has been potentially constrained since Fall 2008 by distortions in bank deposit
base arising from a lack of level-playing field in the perceived government support of
different banking groups.
26
This information was available in our dataset.
23
Since the NBFCs are relatively well-regulated on the capital front, it is
primarily their linkage to the banking sector that stands out as a potential concern
for systemic risk considerations. This concern complements the issues regarding
potential systemic risk of the NBFCs raised in the Thorat report (2011) relating to
their concentration in specific asset markets. Furthermore, our results highlight that
shadow banking in emerging markets may look quite different from that in
developed economies: well-capitalized, potentially filling in gaps of inadequate
intermediation (as explained also in the Indian NBFC summaries by Deosthalee,
2012, and Duggal and Kapali, 2012), and affected during crises by the flight of
deposits to state-owned banks in such economies. Micro- and macro-prudential
considerations of such shadow banks or non-bank finance companies may not
necessarily resemble those in the developed economies, and is a worthy topic for
future research. For instance, regulators may wish to remove or at least reduce
restrictions on bank branching networks to enable banks to have the reach and
specialization of lending in non-urban areas that NBFCs appear to be providing.
However, if such restrictions are not removed, then attempts to regulate the credit
growth of NBFCs may end up under-serving the relatively unbanked parts of the
economy even further.
References
Acharya, V. V., 2012, “Governments as Shadow Banks: The Looming Threat to
Financial Stability”, Texas Law Review, 90(7), 1745-1774.
Acharya, V. V. and Nirupama Kulkarni, 2012, “What Saved the Indian Banking
System: State Ownership or State Guarantees?” The World Economy, 35(1).
Acharya, V. V. and Nirupama Kulkarni, 2013, “Government Guarantees and Bank
Vulnerability during the Financial Crisis of 2007-08: Evidence from an Emerging
Market”, Working Paper, NYU Stern School of Business.
Acharya, V. V. and T. S. Öncü, 2010, “The Repurchase Agreement (Repo) Market”,
Chapter 11 in Viral V. Acharya, Thomas F. Cooley, Matthew Richardson and Ingo
24
Walter (editors), Regulating Wall Street, The Dodd-Frank Act and the New
Architecture of Global Finance, New York University Stern School of Business and
John Wiley & Sons.
Acharya, V. V. and T. S. Öncü, 2013, “A Proposal for the Resolution of Systemically
Important Assets and Liabilities”, International Journal of Central Banking, 9(1), 291-
350.
Acharya, V. V., Philipp Schnabl and Gustavo Suarez, 2013, “Securitization without
Risk Transfer”, Journal of Financial Economics, 107, 515-536.
Aziz, J., I. Patnaik and A. Shah, 2008, “The Current Liquidity Crunch in India: Diagnosis
and Policy Response”, NIPFP-DEA Research Program on Capital Flows and Their
Consequences, October 10-14, 2008.
Claessens, Stijn, Zoltan Pozsar, Lev Ratnovski and Manmohan Singh, 2013, “Shadow
Banking: Economics and Policy”, Working Paper, International Monetary Fund.
D’Arista J. W. and T. Schlesinger, 1993, “The Parallel Banking System”, Washington
DC: Economic Policy Institute Briefing Paper 200, 1-45.
Duggal, Arun and T. B. Kapali, 2012, “The Role of NBFCs in Providing Financial
Services” in Naina Lal Kidwai (editor), Contemporary Banking in India, Businessworld
Books, 304-311.
Deosthalee, Y. M., 2010, “Integral to the System: NBFCs” in Naina Lal Kidwai (editor),
Contemporary Banking in India, Businessworld Books, 294-303.
Ghosh, S., G. del Mazo, Ines and İ. Ötker-Robe, 2012, "Chasing the Shadows: How
Significant Is Shadow Banking in Emerging Markets?", World Bank - Economic
Premise, The World Bank, issue 88, 1-7.
Nisar, S and M. Aziz, 2004, “Islamic Non-Banking Financial Institutions in India:
Special Focus on Regulation”, Seminar on Non-Bank Financial Institutions: Islamic
Alternatives, March 1-3, 2004, Kuala Lumpur

25
Pozsar, Z., T. Adrian, A. Ashcraft and H. Boesky, 2010, "Shadow banking," Staff
Reports 458, Federal Reserve Bank of New York.
Thorat, Usha, 2011, Report of the Working Group on the Issues and Concerns in the NBFC Sector, the Reserve Bank of India.
26
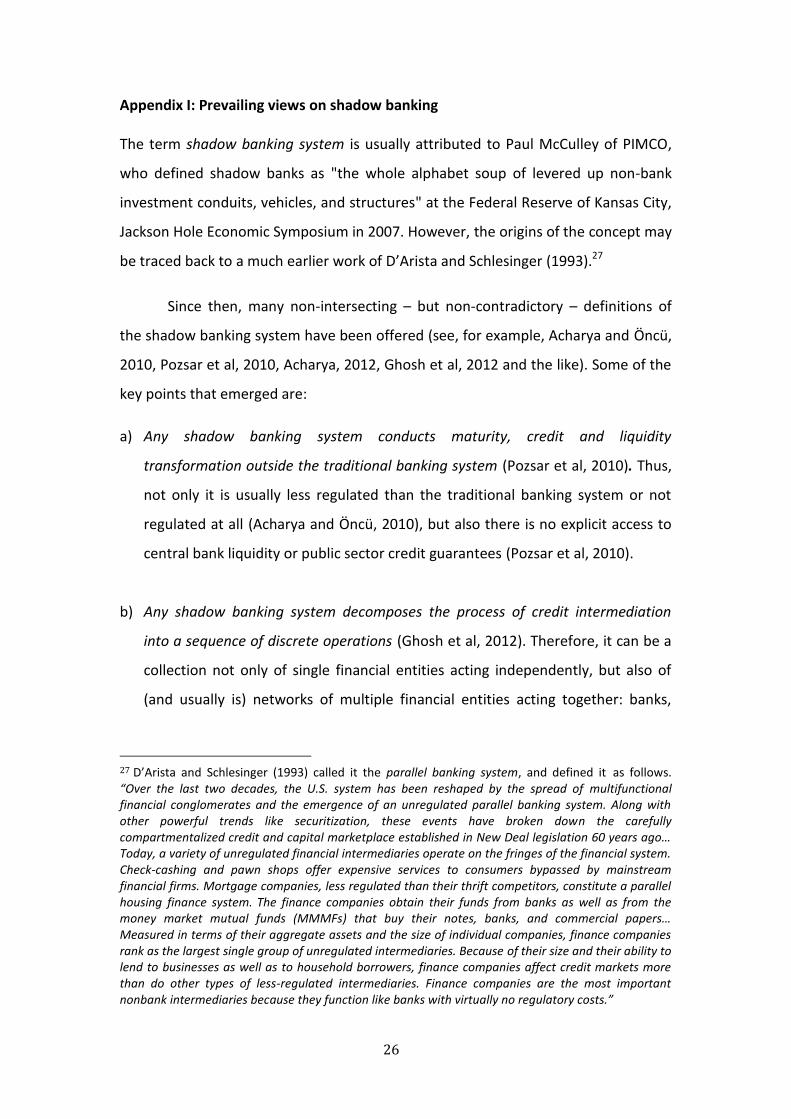
Appendix I: Prevailing views on shadow banking The term shadow banking system is usually attributed to Paul McCulley of PIMCO,
who defined shadow banks as "the whole alphabet soup of levered up non-bank
investment conduits, vehicles, and structures" at the Federal Reserve of Kansas City,
Jackson Hole Economic Symposium in 2007. However, the origins of the concept may
be traced back to a much earlier work of D’Arista and Schlesinger (1993).27
Since then, many non-intersecting – but non-contradictory – definitions of
the shadow banking system have been offered (see, for example, Acharya and Öncü,
2010, Pozsar et al, 2010, Acharya, 2012, Ghosh et al, 2012 and the like). Some of the
key points that emerged are:
a) Any shadow banking system conducts maturity, credit and liquidity
transformation outside the traditional banking system (Pozsar et al, 2010). Thus,
not only it is usually less regulated than the traditional banking system or not
regulated at all (Acharya and Öncü, 2010), but also there is no explicit access to
central bank liquidity or public sector credit guarantees (Pozsar et al, 2010).
b) Any shadow banking system decomposes the process of credit intermediation
into a sequence of discrete operations (Ghosh et al, 2012). Therefore, it can be a
collection not only of single financial entities acting independently, but also of
(and usually is) networks of multiple financial entities acting together: banks,
27 D’Arista and Schlesinger (1993) called it the parallel banking system, and defined it as follows. “Over the last two decades, the U.S. system has been reshaped by the spread of multifunctional financial conglomerates and the emergence of an unregulated parallel banking system. Along with other powerful trends like securitization, these events have broken down the carefully compartmentalized credit and capital marketplace established in New Deal legislation 60 years ago… Today, a variety of unregulated financial intermediaries operate on the fringes of the financial system. Check-cashing and pawn shops offer expensive services to consumers bypassed by mainstream financial firms. Mortgage companies, less regulated than their thrift competitors, constitute a parallel housing finance system. The finance companies obtain their funds from banks as well as from the money market mutual funds (MMMFs) that buy their notes, banks, and commercial papers… Measured in terms of their aggregate assets and the size of individual companies, finance companies rank as the largest single group of unregulated intermediaries. Because of their size and their ability to lend to businesses as well as to household borrowers, finance companies affect credit markets more than do other types of less-regulated intermediaries. Finance companies are the most important nonbank intermediaries because they function like banks with virtually no regulatory costs.”

27
formal and informal non-bank financial institutions, and even credit rating
agencies, regulators and governments (Acharya, 2012).
c) Any shadow banking system is highly levered. Further, while its assets are risky
and illiquid, its liabilities are prone to “bank runs” (Acharya and Öncü, 2010,
2013).
The significance of any shadow banking system is in its potential for creating
systemic risk, which “can be defined broadly as the expected losses from the risk that
the failure of a significant part of the financial sector leads to a reduction in credit
availability with the potential for adversely affecting the real economy (Acharya and
Öncü, 2013)”. It is with this concern of systemic risk that we are interested in
investigating the growth of shadow banking institutions in emerging markets, in
general, and in India, in particular, with a focus on how banking and non-banking
institutions are linked and how these linkages affect and help understand the role of
the non-banking institutions in the economy. 28
28
In a recent speech in Mumbai in early 2013, the Reserve Bank of India (RBI) Deputy Governor Anand Sinha observed: “In India, [non-bank financial corporations] NBFCs constitute a major segment of shadow banking system alongside other entities such as Insurance companies and Mutual Funds …” In the same speech – referring to a Financial Stability Board adopted definition – Sinha defined the shadow banking system as “credit intermediation involving entities and activities (fully or partially) outside the regular banking system”. http://www.bis.org/review/r130204g.pdf
28
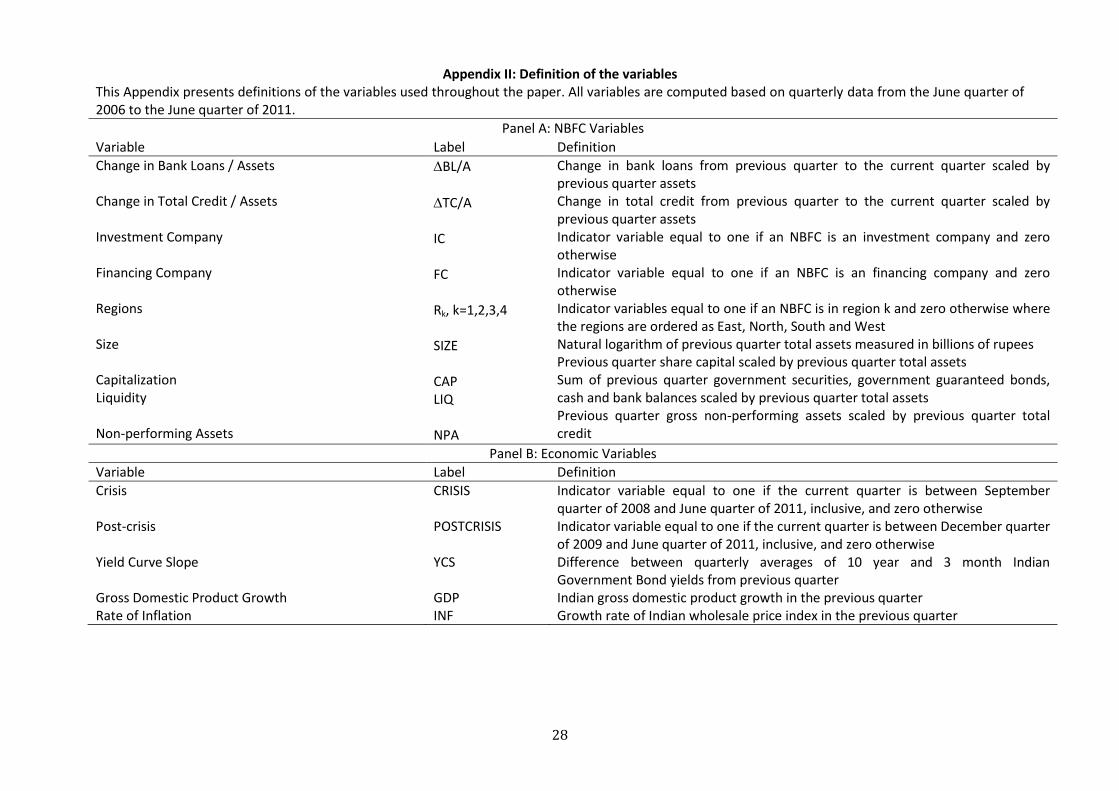
Appendix II: Definition of the variables This Appendix presents definitions of the variables used throughout the paper. All variables are computed based on quarterly data from the June quarter of 2006 to the June quarter of 2011.
Panel A: NBFC Variables
Variable Label Definition
Change in Bank Loans / Assets Change in Total Credit / Assets Investment Company Financing Company Regions Size Capitalization Liquidity Non-performing Assets
BL/A
TC/A IC FC Rk, k=1,2,3,4 SIZE CAP LIQ NPA
Change in bank loans from previous quarter to the current quarter scaled by previous quarter assets Change in total credit from previous quarter to the current quarter scaled by previous quarter assets Indicator variable equal to one if an NBFC is an investment company and zero otherwise Indicator variable equal to one if an NBFC is an financing company and zero otherwise Indicator variables equal to one if an NBFC is in region k and zero otherwise where the regions are ordered as East, North, South and West Natural logarithm of previous quarter total assets measured in billions of rupees Previous quarter share capital scaled by previous quarter total assets Sum of previous quarter government securities, government guaranteed bonds, cash and bank balances scaled by previous quarter total assets Previous quarter gross non-performing assets scaled by previous quarter total credit
Panel B: Economic Variables
Variable Label Definition
Crisis Post-crisis Yield Curve Slope Gross Domestic Product Growth Rate of Inflation
CRISIS POSTCRISIS YCS GDP INF
Indicator variable equal to one if the current quarter is between September quarter of 2008 and June quarter of 2011, inclusive, and zero otherwise Indicator variable equal to one if the current quarter is between December quarter of 2009 and June quarter of 2011, inclusive, and zero otherwise Difference between quarterly averages of 10 year and 3 month Indian Government Bond yields from previous quarter Indian gross domestic product growth in the previous quarter Growth rate of Indian wholesale price index in the previous quarter
29
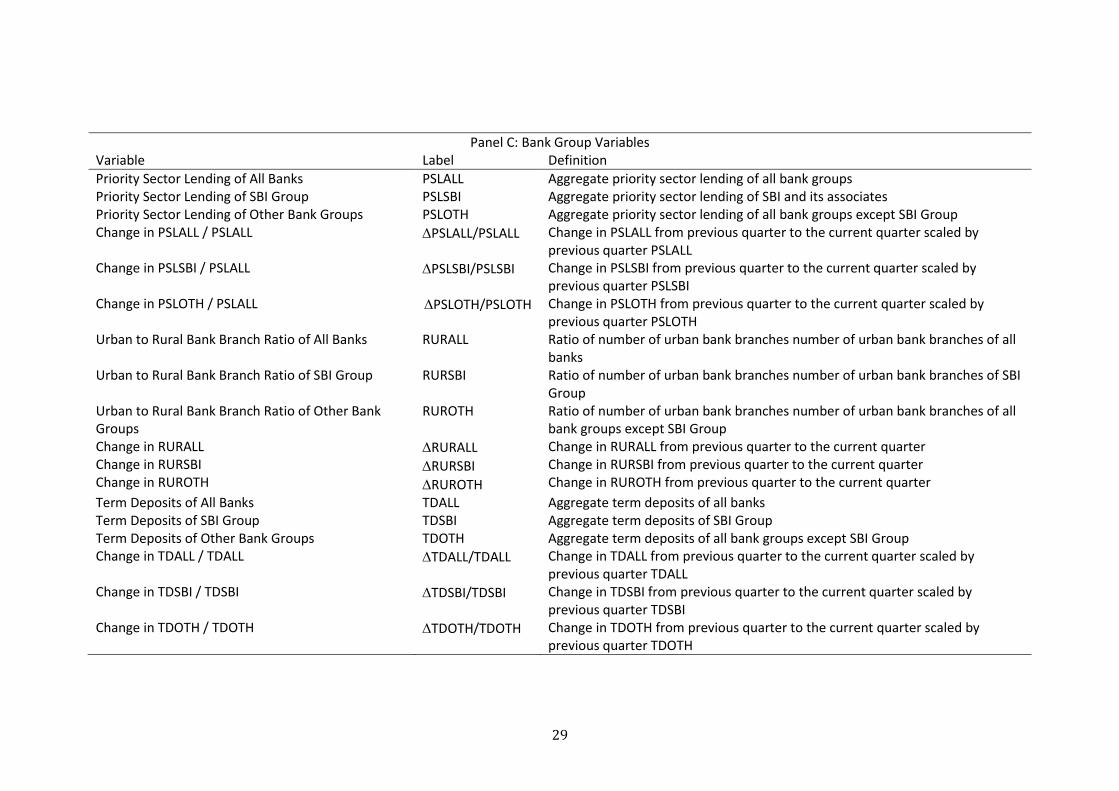
Panel C: Bank Group Variables Variable Label Definition
Priority Sector Lending of All Banks PSLALL Aggregate priority sector lending of all bank groups Priority Sector Lending of SBI Group PSLSBI Aggregate priority sector lending of SBI and its associates Priority Sector Lending of Other Bank Groups PSLOTH Aggregate priority sector lending of all bank groups except SBI Group Change in PSLALL / PSLALL PSLALL/PSLALL Change in PSLALL from previous quarter to the current quarter scaled by
previous quarter PSLALL Change in PSLSBI / PSLALL PSLSBI/PSLSBI Change in PSLSBI from previous quarter to the current quarter scaled by
previous quarter PSLSBI Change in PSLOTH / PSLALL PSLOTH/PSLOTH Change in PSLOTH from previous quarter to the current quarter scaled by
previous quarter PSLOTH Urban to Rural Bank Branch Ratio of All Banks RURALL
Ratio of number of urban bank branches number of urban bank branches of all banks
Urban to Rural Bank Branch Ratio of SBI Group RURSBI Ratio of number of urban bank branches number of urban bank branches of SBI Group
Urban to Rural Bank Branch Ratio of Other Bank Groups Change in RURALL Change in RURSBI Change in RUROTH
RUROTH
RURALL
RURSBI
RUROTH
Ratio of number of urban bank branches number of urban bank branches of all bank groups except SBI Group Change in RURALL from previous quarter to the current quarter Change in RURSBI from previous quarter to the current quarter Change in RUROTH from previous quarter to the current quarter
Term Deposits of All Banks TDALL Aggregate term deposits of all banks Term Deposits of SBI Group TDSBI Aggregate term deposits of SBI Group Term Deposits of Other Bank Groups TDOTH Aggregate term deposits of all bank groups except SBI Group Change in TDALL / TDALL TDALL/TDALL Change in TDALL from previous quarter to the current quarter scaled by
previous quarter TDALL Change in TDSBI / TDSBI TDSBI/TDSBI Change in TDSBI from previous quarter to the current quarter scaled by
previous quarter TDSBI Change in TDOTH / TDOTH TDOTH/TDOTH Change in TDOTH from previous quarter to the current quarter scaled by
previous quarter TDOTH
30
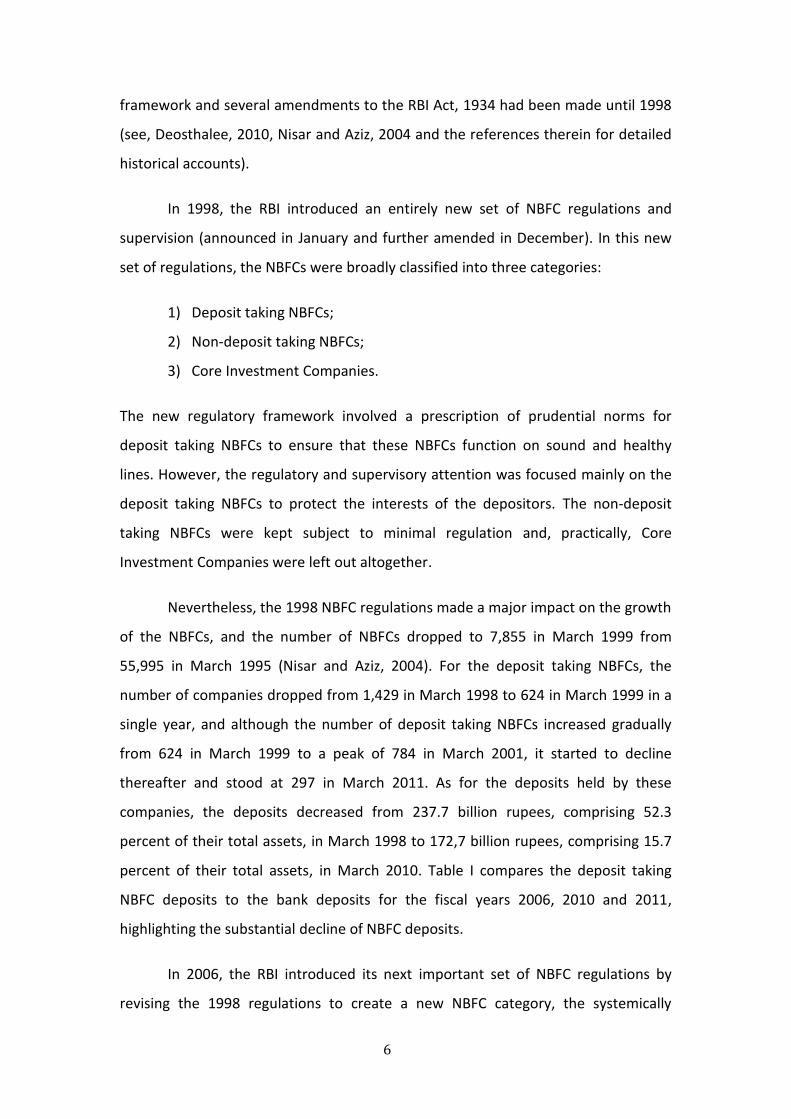
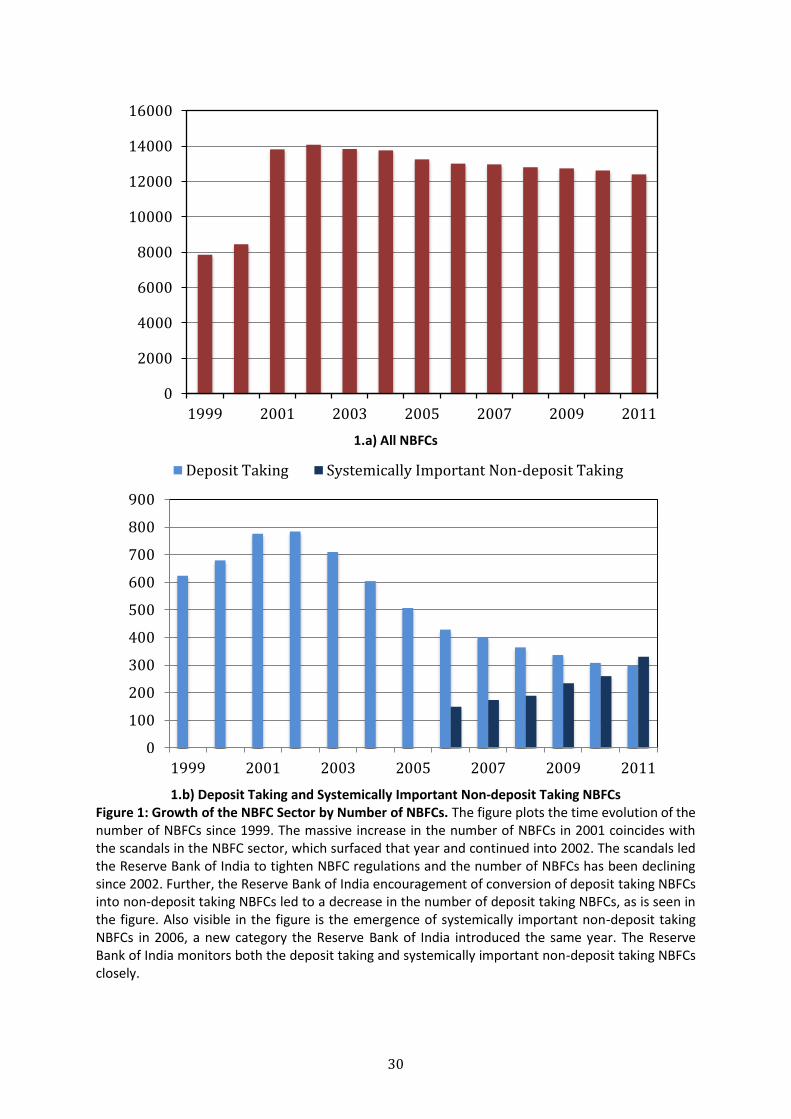
1.a) All NBFCs
1.b) Deposit Taking and Systemically Important Non-deposit Taking NBFCs
Figure 1: Growth of the NBFC Sector by Number of NBFCs. The figure plots the time evolution of the number of NBFCs since 1999. The massive increase in the number of NBFCs in 2001 coincides with the scandals in the NBFC sector, which surfaced that year and continued into 2002. The scandals led the Reserve Bank of India to tighten NBFC regulations and the number of NBFCs has been declining since 2002. Further, the Reserve Bank of India encouragement of conversion of deposit taking NBFCs into non-deposit taking NBFCs led to a decrease in the number of deposit taking NBFCs, as is seen in the figure. Also visible in the figure is the emergence of systemically important non-deposit taking NBFCs in 2006, a new category the Reserve Bank of India introduced the same year. The Reserve Bank of India monitors both the deposit taking and systemically important non-deposit taking NBFCs closely.
0
2000
4000
6000
8000
10000
12000
14000
16000
1999 2001 2003 2005 2007 2009 2011
0
100
200
300
400
500
600
700
800
900
1999 2001 2003 2005 2007 2009 2011
Deposit Taking Systemically Important Non-deposit Taking
31
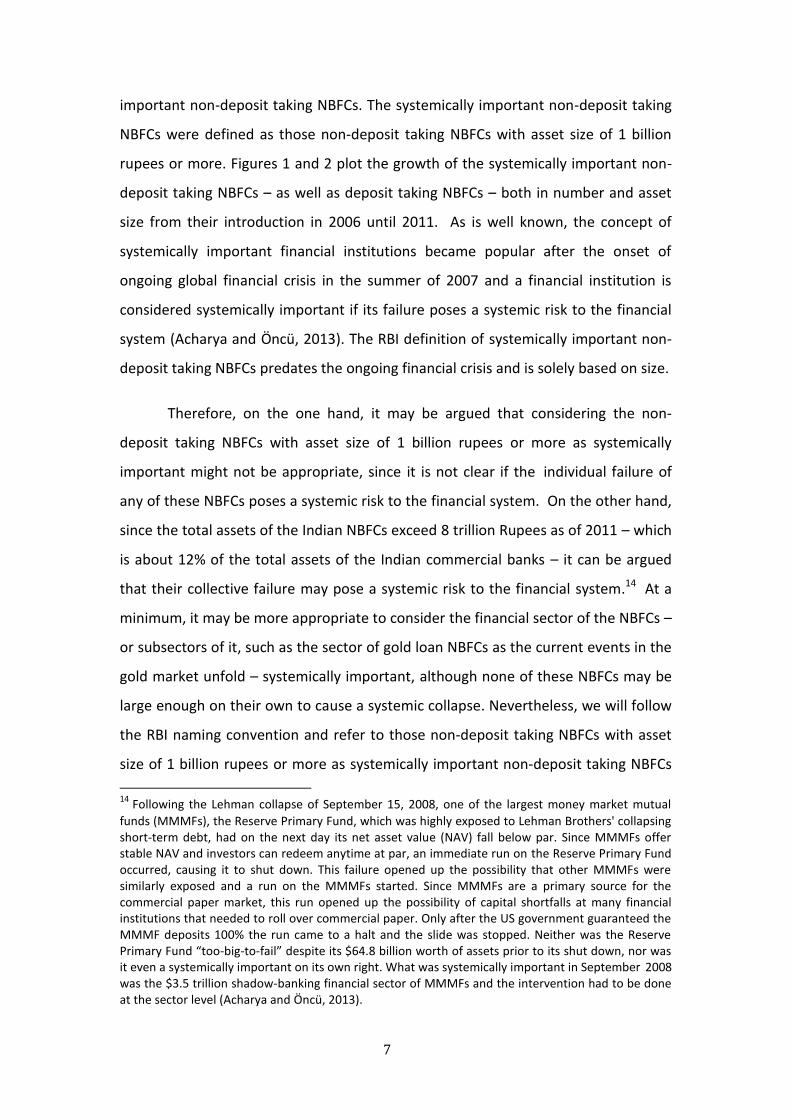
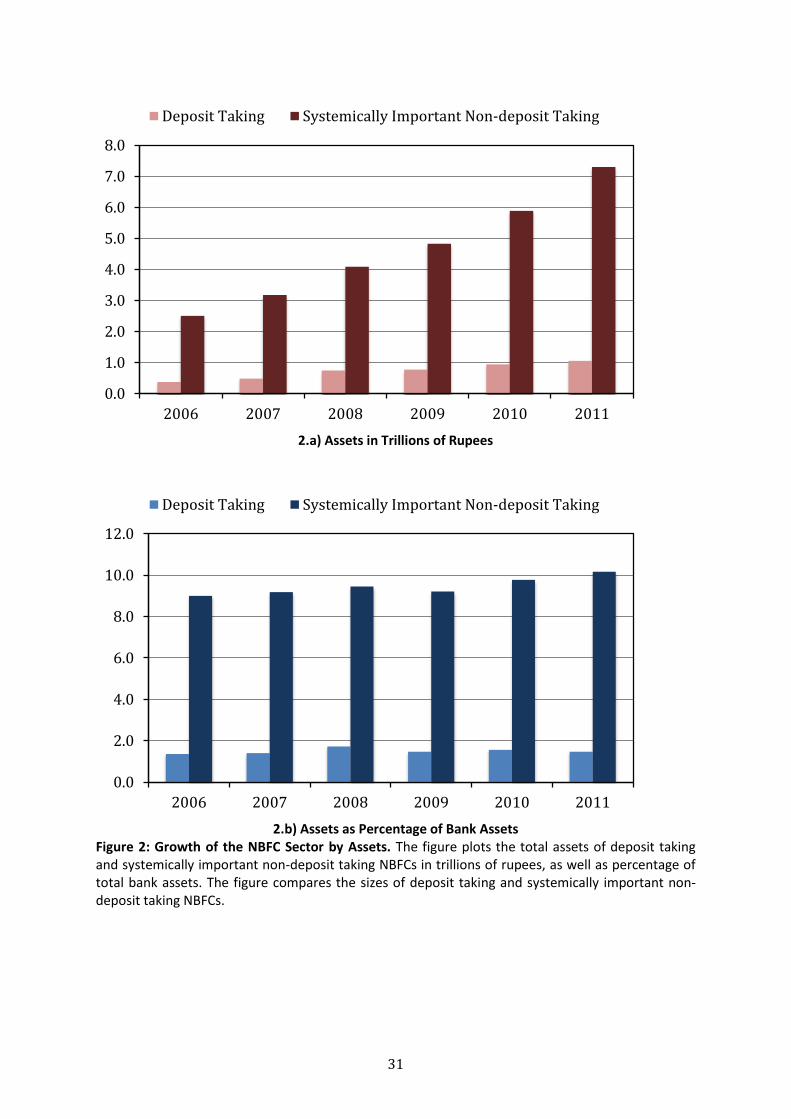
2.a) Assets in Trillions of Rupees
2.b) Assets as Percentage of Bank Assets
Figure 2: Growth of the NBFC Sector by Assets. The figure plots the total assets of deposit taking and systemically important non-deposit taking NBFCs in trillions of rupees, as well as percentage of total bank assets. The figure compares the sizes of deposit taking and systemically important non-deposit taking NBFCs.
0.0
1.0
2.0
3.0
4.0
5.0
6.0
7.0
8.0
2006 2007 2008 2009 2010 2011
Deposit Taking Systemically Important Non-deposit Taking
0.0
2.0
4.0
6.0
8.0
10.0
12.0
2006 2007 2008 2009 2010 2011
Deposit Taking Systemically Important Non-deposit Taking
32
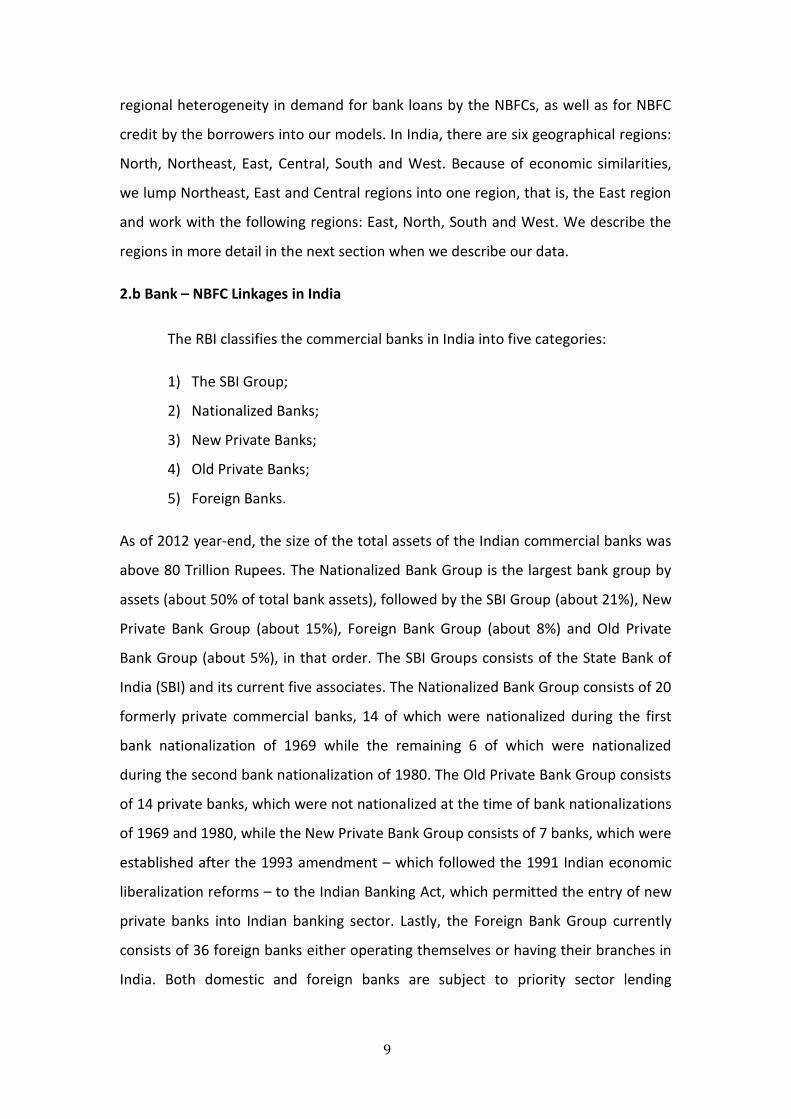
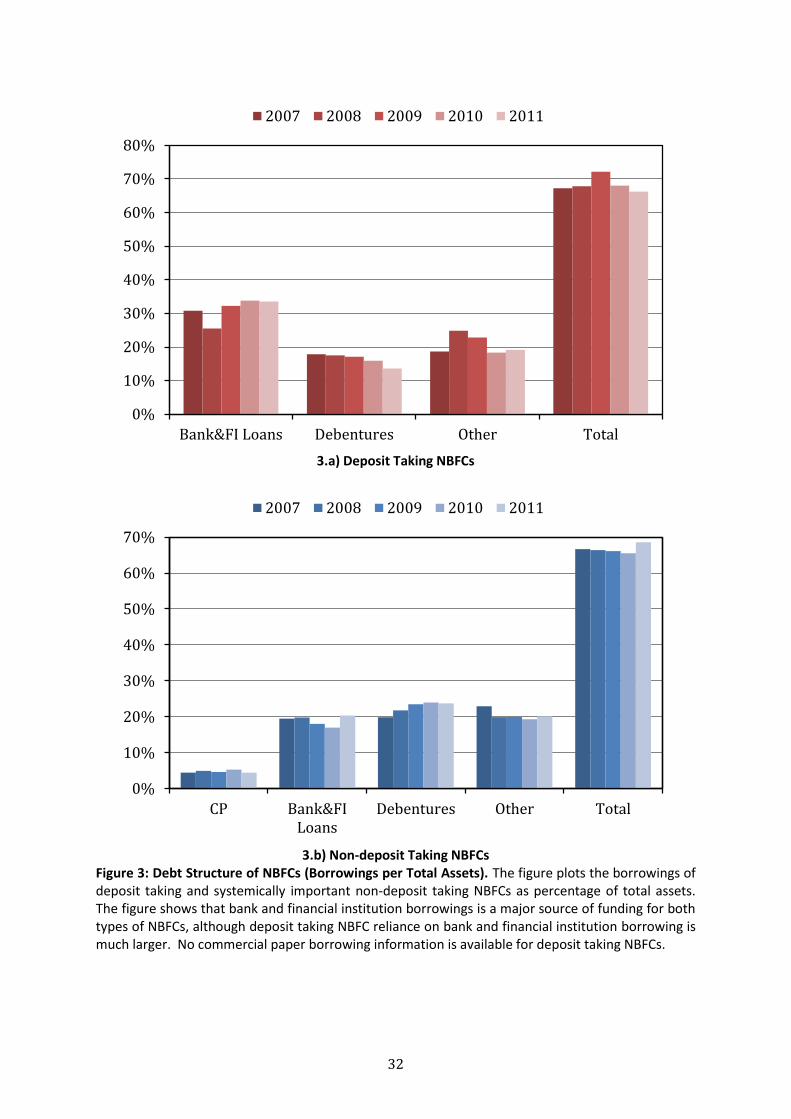
3.a) Deposit Taking NBFCs
3.b) Non-deposit Taking NBFCs
Figure 3: Debt Structure of NBFCs (Borrowings per Total Assets). The figure plots the borrowings of deposit taking and systemically important non-deposit taking NBFCs as percentage of total assets. The figure shows that bank and financial institution borrowings is a major source of funding for both types of NBFCs, although deposit taking NBFC reliance on bank and financial institution borrowing is much larger. No commercial paper borrowing information is available for deposit taking NBFCs.
0%
10%
20%
30%
40%
50%
60%
70%
80%
Bank&FI Loans Debentures Other Total
2007 2008 2009 2010 2011
0%
10%
20%
30%
40%
50%
60%
70%
CP Bank&FILoans
Debentures Other Total
2007 2008 2009 2010 2011
33
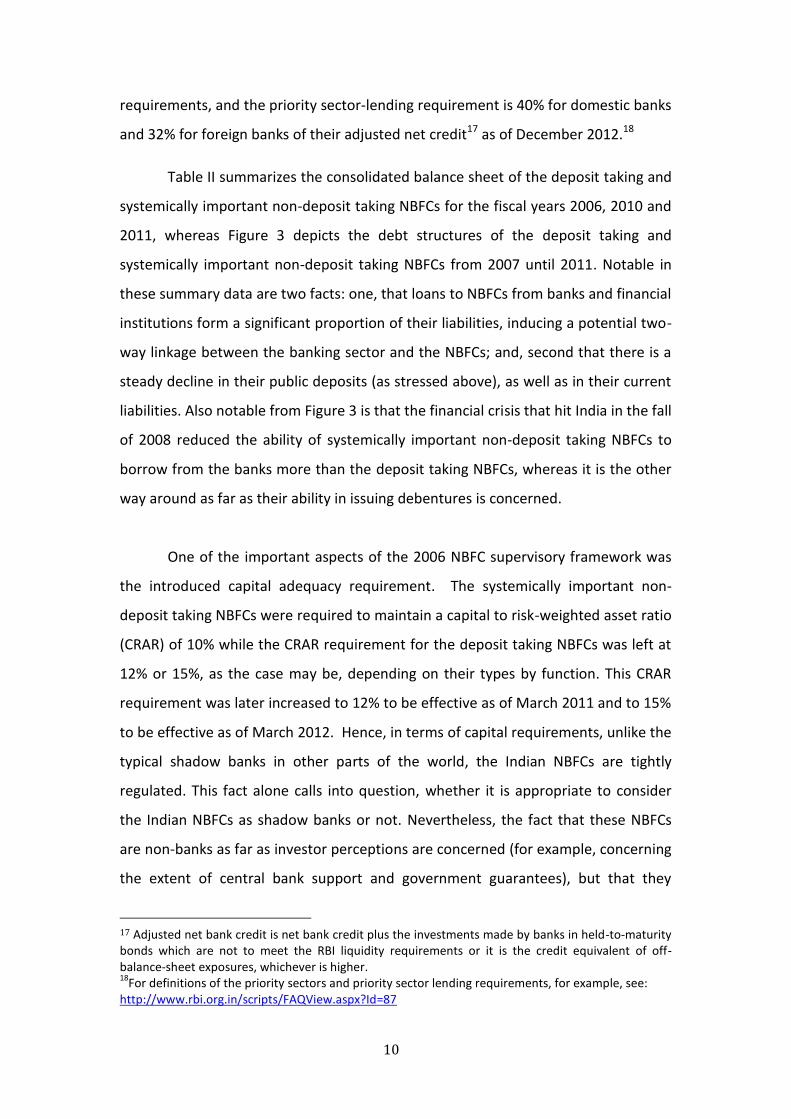
4.a) Bank Loans
4.b) NBFC Credit
Figure 4: Evolution of Bank Loans to and Credit Extension of Systemically Important Non-deposit Taking NBFCs (per Assets). Figure 4.a plots the evolution of the bank loans to the systemically important non-deposit taking NBFCs in our data set, as percentage of their assets. Figure 4.a shows that the Financing Company NBFCs are more reliant on the bank loans than the Investment Company NBFCs and depicts the influence of the Fall 2008 crisis on bank loans to NBFCs. Figure 4.b plots the evolution of the credit extension of systemically important non-deposit taking NBFCs in our data set, as percentage of their assets. Figure 4.b shows that the systemically important non-deposit taking NBFCs in our data set reduced their lending during the Fall 2008 crisis substantially.
0.00
0.05
0.10
0.15
0.20
0.25
Jun-07 Dec-07 Jun-08 Dec-08 Jun-09 Dec-09 Jun-10 Dec-10 Jun-11
All Financing Companies Investment Companies
0.00
0.10
0.20
0.30
0.40
0.50
0.60
0.70
0.80
0.90
Jun-07 Dec-07 Jun-08 Dec-08 Jun-09 Dec-09 Jun-10 Dec-10 Jun-11
All Financing Companies Investment Companies
34
5.a) Bank Deposits per Aggregate Bank Deposits – SBI Group
5.b) Bank Deposits per Aggregate Bank Deposits – Nationalized Bank Group
0.150
0.175
0.200
0.225
0.250
0.275
Mar-06 Mar-07 Mar-08 Mar-09 Mar-10 Mar-11 Mar-12
Time/Total Time Demand/Total Demand
0.350
0.400
0.450
0.500
0.550
0.600
Mar-06 Mar-07 Mar-08 Mar-09 Mar-10 Mar-11 Mar-12
Time/Total Time Demand/Total Demand
35
5.c) Bank Deposits per Aggregate Bank Deposits – New Private Bank Group
Figure 5: Sectoral Migration of Bank Deposits. Figures 5.a, 5.b and 5.c plot the time and demand deposit shares of each of the SBI Group, Nationalized Bank Group and New Private Bank Group, respectively. These figures show that, although the Fall 2008 crisis did not have any noticeable effect on the demand deposits, after the crisis, term deposits migrated from the New Private Banks to the SBI Group for about a year, and then moved to the Nationalized Bank Group. It shows also that the term deposit market share of New Private Bank Group has experienced a permanent contraction shock since the Fall 2008 crisis, as percentage of the aggregate term deposits.
0.10
0.13
0.16
0.19
0.22
0.25
0.28
Mar-06 Mar-07 Mar-08 Mar-09 Mar-10 Mar-11 Mar-12
Time/Total Time Demand/Total Demand
36
6.a) SBI Group and Other Bank Groups
6.b) Members of Other Bank Groups
Figure 6: Bank Priority Sector Lending as percentage of Bank Credit. The figure plots the priority sector lending per total credit of the bank groups in India. The target of priority sector lending of the domestic banks is 40% of their adjusted net credit (see: www.rbi.org.in for definition) and whereas it is 32% for foreign banks as of December 2012. The figure shows the clear effect of Fall 2008 crisis on the priority sector lending of all bank groups.
0.27
0.29
0.31
0.33
0.35
0.37
0.39
0.41
Mar-06 Mar-07 Mar-08 Mar-09 Mar-10 Mar-11 Mar-12
All Bank Groups SBI Group Other Bank Groups
0.10
0.15
0.20
0.25
0.30
0.35
0.40
Mar-06 Mar-07 Mar-08 Mar-09 Mar-10 Mar-11 Mar-12
New Private Old Private Nationalized Foreign

37
TABLE I Comparison of Bank and Deposit Taking NBFC Deposits
This table compares the deposit taking NBFC deposits to the bank deposits for the fiscal years 2006, 2010 and 2011. 2006 2010 2011
Number of Deposit Taking NBFCs 428 308 297
Bank Deposits of all Banks (Trillions of Rupees) 21.858 46.352 53.552
NBFC Public Deposits as percentage of Bank Deposits 1.05% 0.37% 0.22%
38
TABLE II Consolidated Balance Sheet of NBFCs (Trillions of Rupees)
This table summarizes the consolidated balance sheet of the deposit taking and systemically important non-deposit taking NBFCs for the fiscal years 2006, 2010 and 2011
2006 %2006 2010 %2010 2011 %2011
Liabilities
Share Capital 0.2215 6.70% 0.4328 6.17% 0.4722 5.57%
Reserves & Surplus 0.4774 14.44% 1.3931 19.88% 1.5868 18.73%
Public Deposits 0.2284 6.91% 0.1735 2.48% 0.1196 1.41%
Borrowings 2.076 62.79% 4.4986 64.18% 5.7075 67.37%
B&FI Loans 0.6231 18.85% 1.3172 18.79% 1.8384 21.70%
Current liabilities 0.3027 9.16% 0.5114 7.30% 0.5863 6.92%
Total Liabilities 3.306 100.00% 7.0094 100.00% 8.4725 100.00%
Assets
Loans and Advances 1.6945 51.25% 4.1964 59.87% 5.3607 63.27%
Bill Business 0.0005 0.01% 0.0005 0.01% 0.0009 0.01%
Hire Purchase Assets 0.4472 13.53% 0.4169 5.95% 0.5002 5.90%
Investments 0.8163 24.69% 1.5218 21.71% 1.6413 19.37%
Cash and Bank Balances NA NA 0.2586 3.69% 0.2988 3.53%
Other Current Assets NA NA 0.4057 5.79% 0.4244 5.01%
Other Assets 0.3476 10.51% 0.2097 2.99% 0.2462 2.91%
Total Assets 3.306 100.00% 7.0094 100.00% 8.4725 100.00%
39
TABLE III Regional Distribution of the NBFCs in the Dataset
This table summarizes the regional distribution of the NBFCs and NBFC-Quarters in our dataset. Percentages are in parentheses.
PANEL A: Number of NBFCs
IC FC TOTAL
EAST 17 (6.6%) 10 (3.9%) 27 (10.5%)
NORTH 25 (9.8%) 38 (14.8%) 63 (24.6%)
SOUTH 8 (3.1%) 33 (12.9%) 41 (16.0%)
WEST 82 (32.0%) 43 (16.8%) 125 (48.8%)
TOTAL 132 (51.6%) 124 (48.4%) 256 (100.0%)
PANEL B: Number of NBFC-Quarters
IC FC TOTAL
EAST 171 (7.2%) 88 (3.7%) 259 (10.9%)
NORTH 222 (9.4%) 383 (16.1%) 605 (25.5%)
SOUTH 76 (3.2%) 292 (12.3%) 368 (15.5%)
WEST 755 (31.8%) 387 (16.3%) 1142 (48.1%)
TOTAL 1224 (51.6%) 1150 (48.4%) 2374 (100.0%)
40
TABLE IV Summary Statistics
This table provides summary statistics of the variables in the random NBFC and NBFC-Quarter effects regressions. All variables are defined in the Appendix. There are 2374 NBFC-quarters, 257 NBFCs and 21 quarters in the estimations.
Panel A: NBFC Variables
Mean St. Dev. Min Max
0.014 0.097 -0.631 1.237
0.035 0.172 -0.977 3.031
SIZE 2.370 1.237 -0.440 6.973
CAP 0.130 0.203 0.000 0.981
LIQ 0.095 0.186 -0.044 1.000
NPA 0.042 0.142 0.000 1.000
Panel B: Indicator Variables
Mean
IC 0.516
FC 0.484
CRISIS 0.748
Panel C: Economic Variables
Mean St. Dev. Min Max
YCS 0.021 0.013 0.001 0.041
GDP 0.083 0.012 0.058 0.100
INF 0.073 0.010 0.005 0.110
Panel D: Priority Sector Lending Variables
Correlations
Mean St. Dev. Min Max ΔPSLALL/PSLALL
ΔPSLALL/PSLALL 0.046 0.048 -0.025 0.122 1.000
ΔPSLSBI/PSLSBI 0.046 0.057 -0.078 0.173 0.631 1.000
ΔPSLOTH/PSLOTH 0.046 0.055 -0.036 0.144 0.958 0.383 1.000
Panel E: Bank Branching Variables
Correlations
Mean St. Dev. Min Max ΔRURALL ΔRURSBI ΔRUROTH
ΔRURALL -0.011 0.011 -0.042 0.007 1.000
ΔRURSBI -0.008 0.017 -0.046 0.021 0.796 1.000
ΔRUROTH -0.012 0.011 -0.041 0.004 0.982 0.670 1.000
Panel F: Term Deposit Variables
Correlations
Mean St. Dev. Min Max ΔTDLALL/TDALL
ΔTDLALL/TDALL 0.044 0.026 0.000 0.094 1.000
ΔTDSBI/TDSBI 0.033 0.050 -0.045 0.145 0.588 1.000
ΔTDOTH/TDOTH 0.047 0.027 0.009 0.112 0.898 0.171 1.000
41
TABLE V Impact of the Crisis and Bank Priority Sector Lending on Bank Lending to NBFCs and NBFC Credit Extension
by Bank Group, NBFC Type and NBFC Region The Financing Company NBFC and NBFC-Quarter random effects maximum likelihood regressions in this table examine the impact of the crisis and priority sector lending of the banks on bank lending to NBFCs and NBFC credit extension by bank groups, NBFC type and Financing Company Regions. Control variables are SIZE, CAP, LIQ, NPA, YCS, GDP and INF. All variables are defined in Appendix. All models are statistically significant at 1% relative to the null model. There are 2374 NBFC-quarters, 257 NBFCs and 21 quarters in the estimations. Standard errors are in parentheses. *** Significant at 1%; ** significant at 5%; * significant at 10%.
PANEL A: Bank Loans to NBFCs
Dependent Variable BL/A
(1) (2) (3) (4)
IC 0.017 (0.021) 0.018 (0.021) 0.017 (0.021) 0.018 (0.021)
FCR1 0.095** (0.040) 0.104*** (0.040) 0.096** (0.040) 0.096** (0.040)
FCR2 0.062** (0.030) 0.071** (0.030) 0.063** (0.030) 0.063** (0.030)
FCR3 0.066*** (0.025) 0.075*** (0.024) 0.066*** (0.025) 0.066*** (0.025)
FCR4 0.042* (0.023) 0.051** (0.022) 0.042* (0.023) 0.043* (0.023)
ICCRISIS -0.002 (0.005) -0.003 (0.005) -0.003 (0.005) -0.003 (0.005)
FCCRISIS -0.027*** (0.008) -0.029*** (0.008) -0.026*** (0.008) -0.027*** (0.008)
ICPSLALL/PSLALL -0.025 (0.033) FCPSLALL/PSLALL 0.209*** (0.064) ICPSLSBI/PSLSBI
0.000 (0.028)
0.012 (0.030)
FCPSLSBI/PSLSBI
0.078 (0.054)
0.012 (0.058)
ICPSLOTH/PSLOTH
-0.027 (0.029) -0.032 (0.032)
FCPSLOTH/PSLOTH
0.187*** (0.056) 0.182*** (0.061)
Log-Likelihood 2681.39
2676.80
2681.72
2681.82
PANEL B: NBFC Credit Extension
Dependent Variable TC/A
(1) (2) (3) (4)
IC 0.054 (0.046) 0.029 (0.046) 0.062 (0.046) 0.064 (0.046)
FCR1 0.171*** (0.058) 0.142** (0.058) 0.179*** (0.059) 0.181*** (0.059)
FCR2 0.240*** (0.089) 0.210** (0.089) 0.247*** (0.089) 0.249*** (0.089)
FCR3 0.161*** (0.048) 0.132*** (0.048) 0.168*** (0.048) 0.170*** (0.048)
FCR4 0.123** (0.048) 0.094** (0.047) 0.130*** (0.048) 0.133*** (0.048)
ICCRISIS -0.020* (0.012) -0.015 (0.011) -0.023** (0.012) -0.025** (0.012)
FCCRISIS -0.072*** (0.014) -0.066*** (0.014) -0.075*** (0.014) -0.077*** (0.014)
ICPSLALL/PSLALL -0.155* (0.082) FCPSLALL/PSLALL -0.284*** (0.100) ICPSLSBI/PSLSBI
-0.003 (0.069)
0.074 (0.075)
FCPSLSBI/PSLSBI
-0.068 (0.085)
0.041 (0.091)
ICPSLOTH/PSLOTH
-0.169** (0.073) -0.201** (0.079)
FCPSLOTH/PSLOTH
-0.277*** (0.088) -0.294*** (0.095)
Log-Likelihood 1056.37
1051.00
1058.10
1058.69
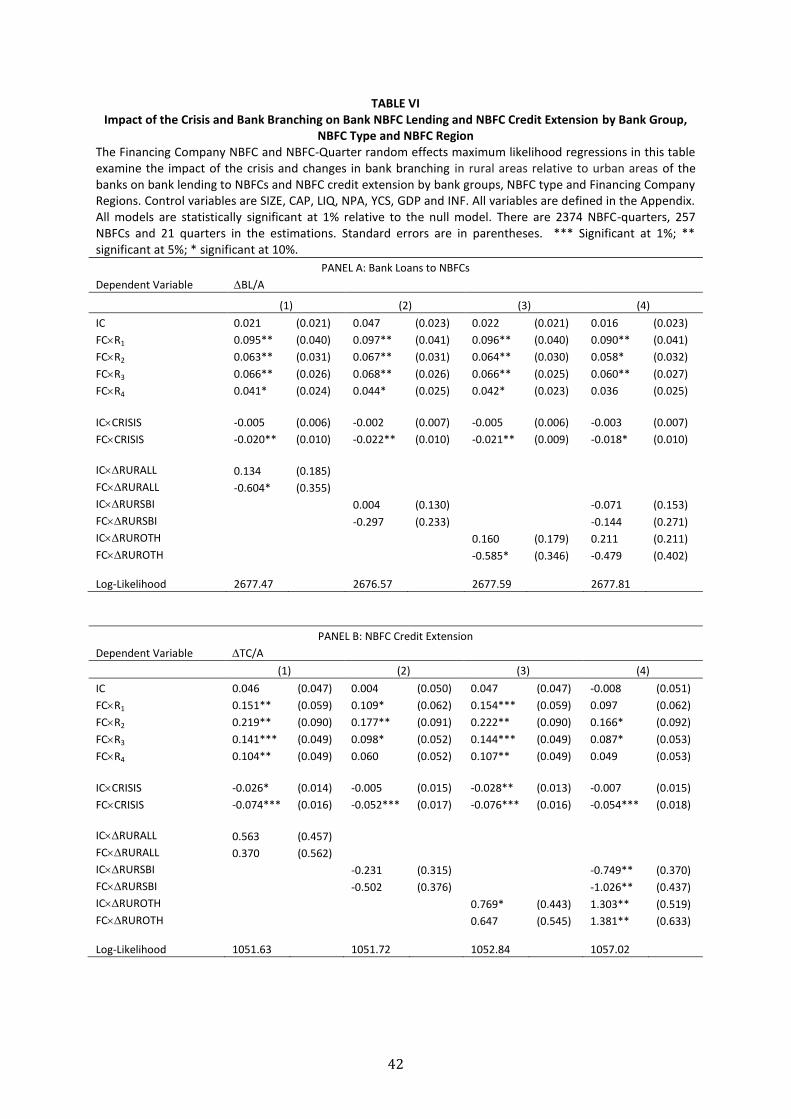
42
TABLE VI Impact of the Crisis and Bank Branching on Bank NBFC Lending and NBFC Credit Extension by Bank Group,
NBFC Type and NBFC Region The Financing Company NBFC and NBFC-Quarter random effects maximum likelihood regressions in this table examine the impact of the crisis and changes in bank branching in rural areas relative to urban areas of the banks on bank lending to NBFCs and NBFC credit extension by bank groups, NBFC type and Financing Company Regions. Control variables are SIZE, CAP, LIQ, NPA, YCS, GDP and INF. All variables are defined in the Appendix. All models are statistically significant at 1% relative to the null model. There are 2374 NBFC-quarters, 257 NBFCs and 21 quarters in the estimations. Standard errors are in parentheses. *** Significant at 1%; ** significant at 5%; * significant at 10%.
PANEL A: Bank Loans to NBFCs
Dependent Variable BL/A
(1) (2) (3) (4)
IC 0.021 (0.021) 0.047 (0.023) 0.022 (0.021) 0.016 (0.023)
FCR1 0.095** (0.040) 0.097** (0.041) 0.096** (0.040) 0.090** (0.041)
FCR2 0.063** (0.031) 0.067** (0.031) 0.064** (0.030) 0.058* (0.032)
FCR3 0.066** (0.026) 0.068** (0.026) 0.066** (0.025) 0.060** (0.027)
FCR4 0.041* (0.024) 0.044* (0.025) 0.042* (0.023) 0.036 (0.025)
ICCRISIS -0.005 (0.006) -0.002 (0.007) -0.005 (0.006) -0.003 (0.007)
FCCRISIS -0.020** (0.010) -0.022** (0.010) -0.021** (0.009) -0.018* (0.010)
ICRURALL 0.134 (0.185) FCRURALL -0.604* (0.355) ICRURSBI
0.004 (0.130)
-0.071 (0.153)
FCRURSBI
-0.297 (0.233)
-0.144 (0.271)
ICRUROTH
0.160 (0.179) 0.211 (0.211)
FCRUROTH
-0.585* (0.346) -0.479 (0.402)
Log-Likelihood 2677.47
2676.57
2677.59
2677.81
PANEL B: NBFC Credit Extension
Dependent Variable TC/A
(1) (2) (3) (4)
IC 0.046 (0.047) 0.004 (0.050) 0.047 (0.047) -0.008 (0.051)
FCR1 0.151** (0.059) 0.109* (0.062) 0.154*** (0.059) 0.097 (0.062)
FCR2 0.219** (0.090) 0.177** (0.091) 0.222** (0.090) 0.166* (0.092)
FCR3 0.141*** (0.049) 0.098* (0.052) 0.144*** (0.049) 0.087* (0.053)
FCR4 0.104** (0.049) 0.060 (0.052) 0.107** (0.049) 0.049 (0.053)
ICCRISIS -0.026* (0.014) -0.005 (0.015) -0.028** (0.013) -0.007 (0.015)
FCCRISIS -0.074*** (0.016) -0.052*** (0.017) -0.076*** (0.016) -0.054*** (0.018)
ICRURALL 0.563 (0.457) FCRURALL 0.370 (0.562) ICRURSBI
-0.231 (0.315)
-0.749** (0.370)
FCRURSBI
-0.502 (0.376)
-1.026** (0.437)
ICRUROTH
0.769* (0.443) 1.303** (0.519)
FCRUROTH
0.647 (0.545) 1.381** (0.633)
Log-Likelihood 1051.63
1051.72
1052.84
1057.02
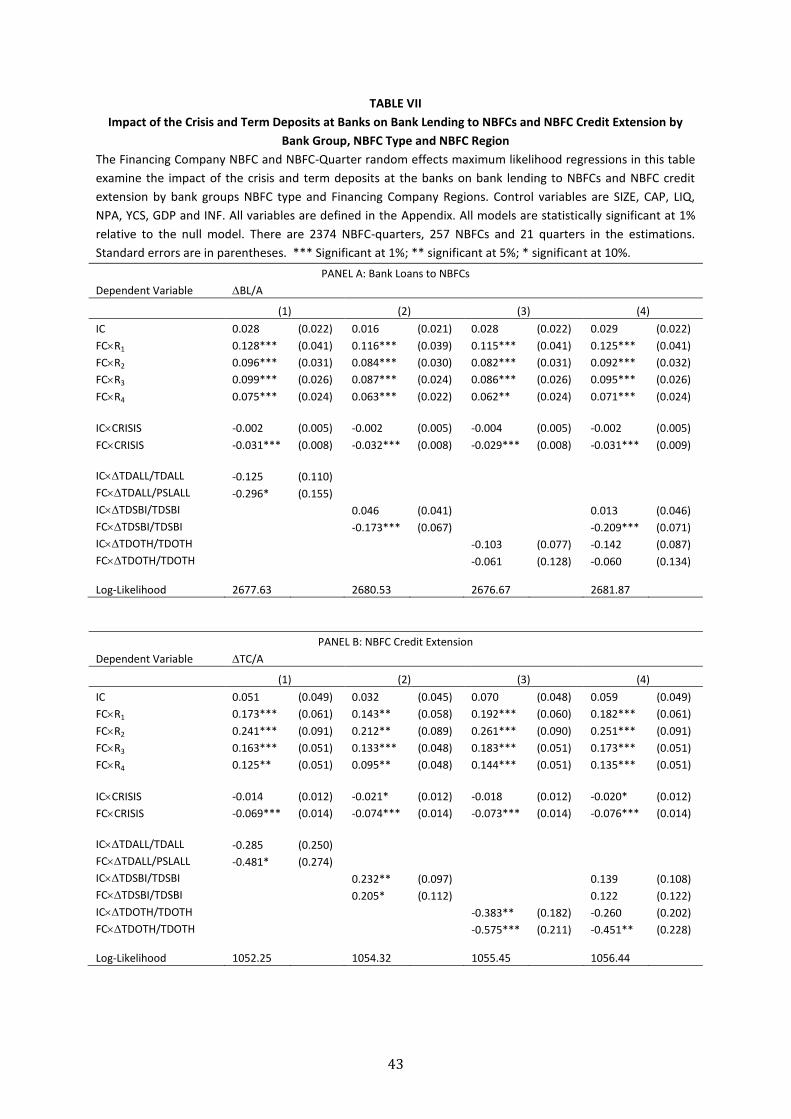
43
TABLE VII
Impact of the Crisis and Term Deposits at Banks on Bank Lending to NBFCs and NBFC Credit Extension by
Bank Group, NBFC Type and NBFC Region
The Financing Company NBFC and NBFC-Quarter random effects maximum likelihood regressions in this table
examine the impact of the crisis and term deposits at the banks on bank lending to NBFCs and NBFC credit
extension by bank groups NBFC type and Financing Company Regions. Control variables are SIZE, CAP, LIQ,
NPA, YCS, GDP and INF. All variables are defined in the Appendix. All models are statistically significant at 1%
relative to the null model. There are 2374 NBFC-quarters, 257 NBFCs and 21 quarters in the estimations.
Standard errors are in parentheses. *** Significant at 1%; ** significant at 5%; * significant at 10%.
PANEL A: Bank Loans to NBFCs
Dependent Variable BL/A
(1) (2) (3) (4)
IC 0.028 (0.022) 0.016 (0.021) 0.028 (0.022) 0.029 (0.022)
FCR1 0.128*** (0.041) 0.116*** (0.039) 0.115*** (0.041) 0.125*** (0.041)
FCR2 0.096*** (0.031) 0.084*** (0.030) 0.082*** (0.031) 0.092*** (0.032)
FCR3 0.099*** (0.026) 0.087*** (0.024) 0.086*** (0.026) 0.095*** (0.026)
FCR4 0.075*** (0.024) 0.063*** (0.022) 0.062** (0.024) 0.071*** (0.024)
ICCRISIS -0.002 (0.005) -0.002 (0.005) -0.004 (0.005) -0.002 (0.005)
FCCRISIS -0.031*** (0.008) -0.032*** (0.008) -0.029*** (0.008) -0.031*** (0.009)
ICTDALL/TDALL -0.125 (0.110) FCTDALL/PSLALL -0.296* (0.155) ICTDSBI/TDSBI
0.046 (0.041)
0.013 (0.046)
FCTDSBI/TDSBI
-0.173*** (0.067)
-0.209*** (0.071)
ICTDOTH/TDOTH
-0.103 (0.077) -0.142 (0.087)
FCTDOTH/TDOTH
-0.061 (0.128) -0.060 (0.134)
Log-Likelihood 2677.63
2680.53
2676.67
2681.87
PANEL B: NBFC Credit Extension
Dependent Variable TC/A
(1) (2) (3) (4)
IC 0.051 (0.049) 0.032 (0.045) 0.070 (0.048) 0.059 (0.049)
FCR1 0.173*** (0.061) 0.143** (0.058) 0.192*** (0.060) 0.182*** (0.061)
FCR2 0.241*** (0.091) 0.212** (0.089) 0.261*** (0.090) 0.251*** (0.091)
FCR3 0.163*** (0.051) 0.133*** (0.048) 0.183*** (0.051) 0.173*** (0.051)
FCR4 0.125** (0.051) 0.095** (0.048) 0.144*** (0.051) 0.135*** (0.051)
ICCRISIS -0.014 (0.012) -0.021* (0.012) -0.018 (0.012) -0.020* (0.012)
FCCRISIS -0.069*** (0.014) -0.074*** (0.014) -0.073*** (0.014) -0.076*** (0.014)
ICTDALL/TDALL -0.285 (0.250) FCTDALL/PSLALL -0.481* (0.274) ICTDSBI/TDSBI
0.232** (0.097)
0.139 (0.108)
FCTDSBI/TDSBI
0.205* (0.112)
0.122 (0.122)
ICTDOTH/TDOTH
-0.383** (0.182) -0.260 (0.202)
FCTDOTH/TDOTH
-0.575*** (0.211) -0.451** (0.228)
Log-Likelihood 1052.25
1054.32
1055.45
1056.44