the growth of china’s services sector and associated … administration of foreign exchange...
TRANSCRIPT
2
© 2008 International Institute for Sustainable Development (IISD) Published by the International Institute for Sustainable Development The International Institute for Sustainable Development contributes to sustainable development by advancing policy recommendations on international trade and investment, economic policy, climate change, measurement and assessment, and natural resources management. Through the Internet, we report on international negotiations and share knowledge gained through collaborative projects with global partners, resulting in more rigorous research, capacity building in developing countries and better dialogue between North and South. IISD’s vision is better living for all—sustainably; its mission is to champion innovation, enabling societies to live sustainably. IISD is registered as a charitable organization in Canada and has 501(c)(3) status in the United States. IISD receives core operating support from the Government of Canada, provided through the Canadian International Development Agency (CIDA), the International Development Research Centre (IDRC) and Environment Canada; and from the Province of Manitoba. The institute receives project funding from numerous governments inside and outside Canada, United Nations agencies, foundations and the priate sector. International Institute for Sustainable Development 161 Portage Avenue East, 6th Floor Winnipeg, Manitoba Canada R3B 0Y4 Tel: +1 (204) 958–7700 Fax: +1 (204) 958–7710
E-mail: [email protected]
Click here to enter text.
The Growth of China’s Services Sector
and Associated Trade:
Complementarities between
Structural Change and Sustainability
Zhang Liping
Development Research Center,
State Council, China
Simon J. Evenett
University of St. Gallen and
International Trade and Regional
Economics Programme, Centre for
Economic Policy Research
July 2010
The Growth of China’s Services Sector and Associated Trade: Complementarities between Structural Change and Sustainability
i
© 2010 International Institute for Sustainable Development (IISD) Published by the International Institute for Sustainable Development IISD contributes to sustainable development by advancing policy recommendations on international trade and investment, economic policy, climate change and energy, measurement and assessment, and natural resources management, and the enabling role of communication technologies in these areas. We report on international negotiations and disseminate knowledge gained through collaborative projects, resulting in more rigorous research, capacity building in developing countries, better networks spanning the North and the South, and better global connections among researchers, practitioners, citizens and policy-makers. IISD’s vision is better living for all—sustainably; its mission is to champion innovation, enabling societies to live sustainably. IISD is registered as a charitable organization in Canada and has 501(c)(3) status in the United States. IISD receives core operating support from the Government of Canada, provided through the Canadian International Development Agency (CIDA), the International Development Research Centre (IDRC) and Environment Canada, and from the Province of Manitoba. The Institute receives project funding from numerous governments inside and outside Canada, United Nations agencies, foundations and the private sector. International Institute for Sustainable Development 161 Portage Avenue East, 6th Floor Winnipeg, Manitoba Canada R3B 0Y4 Tel: +1 (204) 958–7700 Fax: +1 (204) 958–7710
Email: [email protected]
Website: www.iisd.org
The Growth of China’s Services Sector and Associated Trade: Complementarities between Structural Change and Sustainability
Zhang Liping
Development Research Center,
State Council, China
Simon J. Evenett
University of St. Gallen and
International Trade and Regional
Economics Programme, Centre for
Economic Policy Research
July 2010
This paper is produced as part of the Sustainable
China Trade Project. The project is a joint effort
of IISD and the Development Research Centre
of the State Council of China, with research
jointly conducted by Chinese and international
experts. It seeks to help define the characteristics
of a sustainable trade strategy for China—a
strategy that helps contribute to environmental,
social and economic improvements, primarily in
China but also globally. Such an outcome is in
line with the scientific concept of development
first put forward at the 16th National Congress
of the Communist Party of China in 2003, and
with many of the goals of the 11th Five-Year
Plan. The project will produce a series of eight
working papers focusing on specific aspects of a
sustainable trade strategy for China and a
synthesized volume covering the body of work.
The Sustainable China Trade Project is generously supported by the Swiss Agency for
Development Cooperation.

The Growth of China’s Services Sector and Associated Trade: Complementarities between Structural Change and Sustainability
ii
Table of contents
1.0 Introduction ............................................................................................................................................... 1
2.0 The service sector, economic transformation and a sustainable trade strategy................................ 3
3.0 China’s service industry and trade: The facts ........................................................................................ 9
3.1 Service industry ...................................................................................................................................................................... 9
3.2 Trade in services .................................................................................................................................................................. 12
3.3 Foreign direct investment flowing into China’s service industry ................................................................................ 14
3.4 China’s policies and measures for promoting the development of service industries and trade .......................... 16
3.4.1 Industrial policies ......................................................................................................................................................... 16
3.4.2 Finance and taxation policies ....................................................................................................................................... 17
3.4.3 Foreign trade policy ...................................................................................................................................................... 19
3.4.4 Foreign investment policy .............................................................................................................................................. 19
3.4.5 Policies related to environmental services ....................................................................................................................... 22
4.0 Imperatives and challenges for the sustainable development of Chinese trade in services ......... 24
4.1 Imperatives ........................................................................................................................................................................... 24
4.1.1 The 11th Five-Year Guidelines: Benign internal policy environment............................................................................. 24
4.1.2 Rapid development of the service industry and trade: Positive internal economic conditions ............................................. 25
4.1.3 Liberalization of global trade in services is deepening .................................................................................................... 27
4.1.4 The international relocation of the service industry continues apace ................................................................................ 28
4.2 Challenges ............................................................................................................................................................................. 28
4.2.1 The development of China’s service industry has lagged behind ...................................................................................... 28
4.2.2 China’s trade in services needs to further liberalize ....................................................................................................... 29
4.2.3 The international competitiveness of China’s trade in services is weak ........................................................................... 31
4.2.4 The foreign direct investment flowing into China’s service industry mainly aims at the domestic market ......................... 33
4.2.5 Offshoring and outsourcing in China is underdeveloped ................................................................................................. 33
5.0 Lessons from comparative analyses and international experience ................................................... 34
6.0 Options for Chinese policy-makers ...................................................................................................... 39
References ......................................................................................................................................................... 41

The Growth of China’s Services Sector and Associated Trade: Complementarities between Structural Change and Sustainability
iii
List of tables
Table 3.1 GDP and value added of the tertiary industry. Data in this table are calculated at current prices. Source of data: China Statistical Yearbook 2008, National Bureau of Statistics of China ................................................................................................................... 9
Table 3.2 China’s employment, total and tertiary industry (end of year data). For 1990 to 2000
the total number of employed persons (overall and in the tertiary sector) have been adjusted in accordance with the data obtained from the 5th National Population Census. For 2001 onward these data have been derived from the annual sample survey on population changes. Source of data: China Statistical Yearbook 2008, National Bureau of Statistics of China .............................................................................. 10
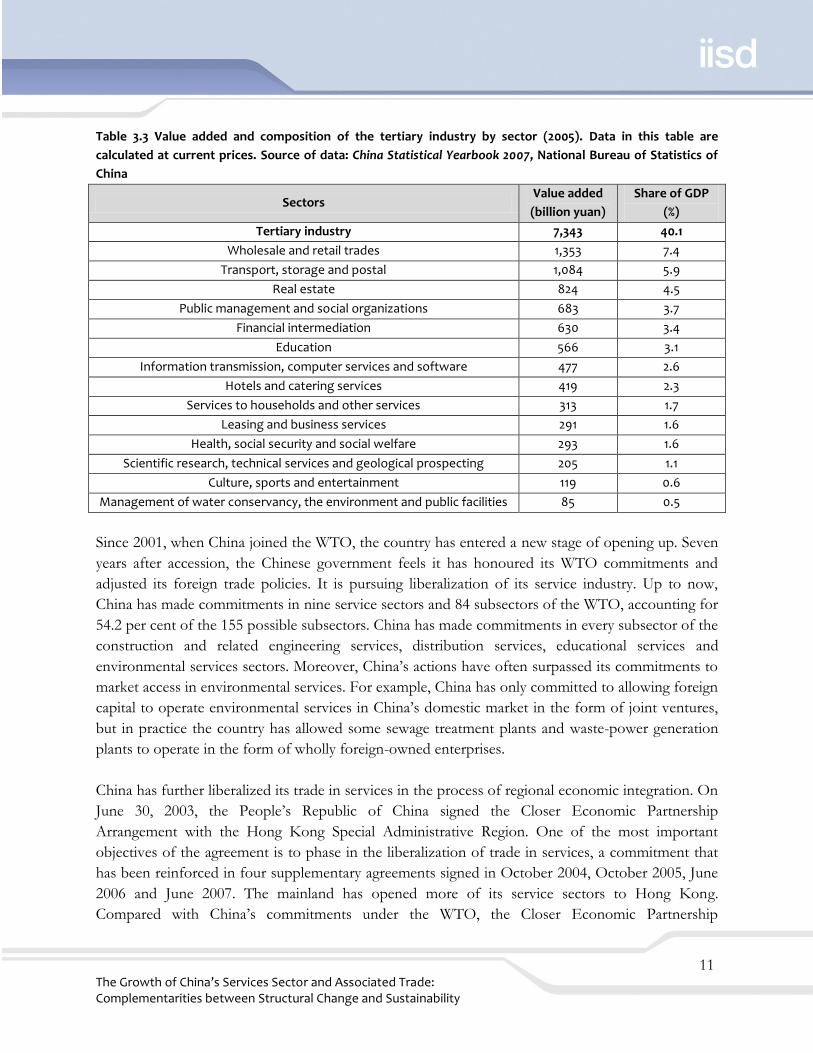
Table 3.3 Value added and composition of the tertiary industry by sector (2005). Data in this
table are calculated at current prices. Source of data: China Statistical Yearbook 2007, National Bureau of Statistics of China .............................................................................. 11
Table 3.4 Rank of China as exporter and importer of commercial services among WTO
members in 2001, 2003 and 2006. ―Annual percentage change‖ refers to change from the previous year. Source of data: WTO ................................................................. 13
Table 3.5 China’s trade in services in 2001 and 2006, in billions of US dollars. Source: China’s
State Administration of Foreign Exchange ...................................................................... 13 Table 3.6 Foreign direct investment in China’s service sectors in 2006, in millions of US
dollars. The sectoral classification used here is that used by the WTO since 2007. Source of data: Ministry of Commerce of the People’s Republic of China (MOFCOM, n.d.) ................................................................................................................. 15
Table 3.7 Types and rates of business taxes in China. Table adapted from State Administration
of Taxation (2007) ................................................................................................................ 18 Table 3.8 Catalogue of service industries in which foreign investment is encouraged. Data
source: National Development and Reform Commission and Ministry of Commerce (2007) ...................................................................................................................................... 20
Table 3.9 Supporting policies related to the development of environmental services ................ 23 Table 4.1 Major environmental protection indicators during the 11th Five-Year Plan period.
Source: The National 11th Five-year Plan for Environmental Protection (2006–2010) ................................................................................................................................................. 25

The Growth of China’s Services Sector and Associated Trade: Complementarities between Structural Change and Sustainability
iv
Table 4.2 Estimated annual average growth rates of the service industry (%). Source: Calculated by the authors .................................................................................................... 26
Table 4.3 Investment in the treatment of environmental pollution, 2001 to 2006 (billion yuan).
Source of date: China Statistical Yearbook of the Tertiary Industry 2007, compiled by the National Bureau of Statistics of China .............................................................................. 27
Table 4.4 Predicted demand for environmental services during the period of the 11th Five-
Year Plan ................................................................................................................................ 27 Table 4.5 Sector coverage rate of China’s commitments under GATS, and the liberalization
index for each sector. Source: Calculated by the authors based on the schedule of China’s specific commitments in services ......................................................................... 30
Table 4.6 RCA indexes of China and major advanced countries, 2004. Source: Calculated by
the authors using IMF statistics .......................................................................................... 31 Table 4.7 RCA indexes of China’s trade in services, various years. Source: Calculated by the
authors using IMF statistics ................................................................................................ 32 Table 4.8 TSIs of the various trades in services sectors in China, various years. Source:
Calculated by the authors using IMF statistics ................................................................. 32
List of acronyms
FIE foreign-invested enterprise
GATS General Agreement on Trade in Services
GDP gross domestic product
RCA revealed comparative advantage
R&D research and development
TSI trade specialization index
WTO World Trade Organization

The Growth of China’s Services Sector and Associated Trade: Complementarities between Structural Change and Sustainability
1
1.0 Introduction
Although China’s prowess in manufacturing and exporting goods is well-established, it is perhaps
not so well-known that China’s service sector has been growing even faster for the past 30 years.
Moreover, while it may be the case that, for the moment, China’s service sector accounts for a
smaller share of national income than in many other developing countries, since the reform period
began, that share has risen from one-quarter to two-fifths. This represents profound structural
change in the Chinese economy and raises the question of what this sector can contribute to a
sustainable trade strategy for China.
Given that this paper is part of a larger project that seeks to flesh out a so-called sustainable trade
strategy for China, it is worth recalling what the five objectives of that strategy are:
1. Promote the rebalancing of the Chinese economy away from its currently unsustainable
path.
2. Promote added value, not just sales, in economic activities.
3. Promote services, not just manufacturing.
4. Promote Chinese firms (including multinationals), brands and intellectual property rights.
(Nationality matters.)
5. Support a harmonious, sustainable architecture for international trade.
In addition to these broader objectives, some have inquired as to what reforms would create jobs
more quickly in the service sector and could narrow China’s trade deficit in services.
Drawing on national and international experience, the goal of this paper is to shed light on what
reform of the Chinese service sector might entail and whether the objectives of the sustainable trade
strategy can be met. It would be difficult to overestimate the challenge for policy-making here. Not
only is the service sector very large, placing much at stake, but to the best of our knowledge, no
major economy has ever put its service sector at the core of its development strategy, though
certainly some service sectors, such as tourism and financial services, have been promoted. In
contrast, the service sector has often been treated as a ―residual.‖ Worse, if the experience of many
industrialized economies is anything to go by, government policies have done much to sacrifice
productivity growth in favour of other national objectives, such as creating employment
opportunities for the lower skilled. The lessons from international experience are by no means all
positive, and China should not repeat the mistakes of others.

The Growth of China’s Services Sector and Associated Trade: Complementarities between Structural Change and Sustainability
2
The rest of this paper is organized as follows: to set the discussion in its appropriate developmental
context, Section 2 describes the various linkages between the service sector (or, to be precise, the
different service sectors), the traditional structural and spatial transformation of economies, and
international commerce. This discussion emphasizes the need for an economy-wide perspective on
reform toward the service sector, rather than a sectoral perspective. Section 3 describes the current
state of China’s service sector, making specific reference to service sector performance and the
various relevant laws and regulations that are in force. Three imperatives for and challenges facing
the Chinese service sector are then described in the fourth section. Section 5 gives lessons from
comparative analyses and international experience with reform and growth of the service sector and
discusses the relevance of those lessons to China. Policy options for the Chinese government are
discussed in Section 6.

The Growth of China’s Services Sector and Associated Trade: Complementarities between Structural Change and Sustainability
3
2.0 The service sector, economic transformation and a sustainable
trade strategy
Perhaps it is best to start with the very notion of the service sector, or tertiary sector, as literature on
China often calls it. Services are distinguished from other economic activities, specifically,
agricultural production and resource extraction (together typically called the primary sector) and
from the manufacture of goods and production of energy (typically referred to as the industrial or
secondary sector). Services are often thought of as intangible or, as one observer put it, not
something that will hurt you if drop it on your feet.
The attention given to the service sector arises because of its size, as measured by either
employment or value added, compared to the primary and secondary sectors. As Francois and
Hoekman (2009, p. 2) note in their recent survey article, ―modern economies are increasingly
dominated by services.‖ Indeed, economic development has typically been associated with structural
transformations, and one of the most important manifestations of this has been the growing share
of services in national economies. Initially, analysts debated whether this growth was due to
demand-side phenomena, since the cost of food and essentials was thought to grow less slowly than
income, allowing for greater funds to be spent on services, or supply-side factors, such as slower
growth in labour productivity in the service sector relative to manufacturing and agriculture―so-
called Baumol’s disease.
In recent years, however, our understanding of the contribution of the service sector to economic
development has been refined. No longer are services implicitly or explicitly treated as being
purchased by final consumers. Instead, consideration is given to the role of producer and business
services as important determinants of the level of productivity in the secondary or manufacturing
sector. Moreover, the factors determining the productivity and variety of services (so-called supply-
side considerations) have received greater attention that also emphasizes, as we will argue below,
degrees of specialization as well as spatial considerations. Indeed, while the service sector is viewed
as part of the structural transformation of economies, that transformation is also taken to include
spatial components (in particular the organization of economic activity in cities) as well as the
organization of manufacturing processes. The purpose of this section is to sketch out a view of the
importance of services to economic development, then describe the implications for international
trade flows and the objectives of a sustainable trade strategy.
The service sector covers a wide range of economic activities. As Francois and Hoekman (2009, p.
3) argue:

The Growth of China’s Services Sector and Associated Trade: Complementarities between Structural Change and Sustainability
4
Services are very heterogeneous, and span a wide range of economic activities.
Conceptually, this diversity masks a fundamental function that many services
perform in relation to overall economic growth and economic development: they are
inputs into production. One dimension of this ―input function‖ is that services
facilitate transactions through space (transport, telecommunications) or time
(financial services). Another dimension is that services are frequently direct inputs
into economic activities, and thus determinants of the ―fundamental‖ factors of
production—labor and capital—that generate knowledge, goods, and other services.
Education, R&D and health services are examples in the production of human
capital.
This perspective leaves out those services that are bought by individuals and are not transformed
before being ―consumed.‖ Haircuts, watching a film at a cinema, housecleaning and cooking are
examples of these types of services. Still, many services are inputs for other economic and non-
economic processes, and this implies that the demand for services is not confined to demand from
private consumers. Moreover, the determinants of the service sector are not independent of
developments in other sectors, especially the manufacturing sector. Knock-on effects are important.
The sheer heterogeneity of services also makes generalizing about the service sector especially
hazardous.
Perhaps it is the economic geography literature that has most emphasized the knock-on effects of
developments in the services and manufacturing sectors (see Burgess and Venables (2004) for an
accessible survey that examines the development dimension in some detail). Structural
transformation, the generalized process through which economies reallocate labour to more and
more productive uses, has tended to have both a spatial and organizational dimension.
The spatial dimension has involved the concentration of economic resources (labour, capital, and so
on) and the creation of added value in cities. The organizational dimension reflects the tendency of
firms to specialize only in those functions at which they are particularly effective and buy the
remaining goods and services from other firms. Over time, then, firms specialize in different
elements of the value chain. Moreover, as the quality and variety of available goods and services
increases, so does the productivity of the purchaser, thereby linking the downstream firm’s
productivity to the performance of firms upstream.
Both the spatial and organizational dimensions of structural transformation interact in a way that is
important for understanding the evolution of producer services. The vast literature on economic
geography emphasizes the cumulative linkages between the manufacturing sector, producer services
and the location of production. Expansion of the manufacturing sector in a given location will
The Growth of China’s Services Sector and Associated Trade: Complementarities between Structural Change and Sustainability
5
increase demand for business services, which in turn increases the incentive for entrepreneurs to set
up specialized service sector firms in that location. To differentiate their services from others, new
service sector firms try to find business services that give even more value to their buyers. This often
requires hiring more specialized labour, which in turn increases the incentive for trained personnel
to move to cities. The resulting pools of labour also attract firms, since managers know that there is
enough talent to hire. Expansion in city size is therefore associated with more specialized
manufacturing and service sector output and higher levels of productivity.
The proximity of specialized service sector suppliers, labour and purchasers also creates faster
growth. Ideas and innovations dissipate faster when there are large pools of talent close to each
other. Concentrations of economic activity stimulate competition among firms (both manufacturing
and service) and talent, all of which spurs innovation. The growth dynamics associated with cities,
however, are not all one-sided. Larger city sizes without commensurate investments in infrastructure
lead to overcrowding, longer travel times, pollution and the like. No individual or firm takes into
account the negative impact on others that their movement to a city generates, just like they don’t
take account of the positive impact. As a result, government has a role in encouraging service sector
development through liberalizing unnecessary entry restrictions for such firms and their customers,
as well as improving amenities—including environmental amenities—to optimize the benefits of
proximity (or co-location). In short, many discussions of economic development and the
environment point to the need to identify win-win solutions. Arguably the research on economic
geography that emphasizes spatial and organizational transformation identifies an important win-win
policy prescription: improving amenities and intra-city and suburban infrastructure so as to
encourage greater concentrations of labour and higher levels of productivity and innovation. Later in
this paper we return to the relevance of these observations for China.
From the perspective of social sustainability it is also worth recalling that some services used by
individuals directly affect standards of living as well as having, in some cases, economic payoffs.
Education, social services and health services are important examples. Here the challenge for policy-
makers in both developing and industrialized economies is to develop mechanisms that deliver high-
quality services at the lowest possible cost, bearing in mind that the delivery of a service need not be
undertaken by the party that finances the service. (In other words, state funding with private delivery
of services is an alternative to either purely private or purely state financing and provision.) To the
extent that the variety and quality of health, education and other social services influences the
location decisions of firms and employees, improving amenities and standards of living through
better personal services may have economic payoffs by triggering the cumulative processes outlined
earlier.

The Growth of China’s Services Sector and Associated Trade: Complementarities between Structural Change and Sustainability
6
The relationship between service sector development and the trade balance is not straightforward.
Some service sector firms sell to customers located abroad, and so directly contribute toward
exports. Other service sector firms provide business services to domestic firms and foreign
subsidiaries that are located within the same jurisdiction and that ultimately export. In this case, the
service sector firms indirectly and positively contribute to the national trade balance. To the extent
that foreign transportation and logistics firms are used to ship manufactured goods (including parts
and components) out of a country, it is possible that an expansion in manufactured exports could be
associated with a corresponding worsening in the trade deficit in services.
Furthermore, to the extent that a generalized expansion of the service sector occurs, it will increase
the demand for labour generally within the economy (and probably in certain segments of the labour
market), increasing wages and reducing the size of the other sectors of the economy. To the extent
that exporting firms reduce their employment without an offsetting increase in productivity, total
manufacturing exports are likely to fall and the trade balance in goods worsen. In turn this may
reduce demand for producer services, which may induce the latter firms to seek foreign customers,
with implications for the balance of trade in services.
Since the demand for many services arises from the manufacturing sector and since the service
sector and manufacturing firms can find themselves competing for the same types of labour, it
makes little sense to discuss the ―service sector trade balance‖ and ―services trade deficit‖ in
isolation from developments in the manufacturing sector. Worse, attempts to correct one perceived
problem in trade in services may actually do greater harm to the overall trade balance, once the
impact on manufacturing is taken into account.1
The relationship between the development of the service sector and the physical environment is also
far from straightforward. As one recent survey put it:
The perception that the services economy has no significant impact on the
environment is increasingly called into question as high income, service-based
economies still account for most of the world’s natural resource consumption,
polluting emissions and impacts on biodiversity. (Mayrand & Paquin, 2007, p. 1)
Every activity in an economy tends to involve both the purchases of goods and services produced
somewhere else in the economy or abroad and the hiring of labour. Therefore, the expansion of any
given activity will have direct and indirect implications on demand for a nation’s resources. The
indirect demands may be very resource intensive—and a threat to sustainability—even if the direct
demands appear small. To use data (or worse, to make assumptions) about the latter to infer
anything about the overall impact of an expansion of activities on national resources is risky. Input-
1 Large-scale expansion of China’s service sector will almost certainly require significant changes to the expenditure

The Growth of China’s Services Sector and Associated Trade: Complementarities between Structural Change and Sustainability
7
output tables were designed precisely for this purpose, and it would be advisable to check whether
any service sectors are particularly intensive in natural resource use. When one considers that there is
likely to be variation across manufacturing and service sectors in the degree of natural resource use
per unit of output, the proposition that expanding the latter sector at the expense of the former
must reduce overall Chinese demands for resources is doubtful. Likewise, given that the expansion
of an activity may generate waste and pollution directly and indirectly (indirectly through increasing
the demand for other goods and services), it is possible that some service sector activities are not
quite as ―clean‖ as they initially appear.
Again, as this survey notes, the tendency has been to examine these matters on a sector-by-sector
basis rather than take into account the many different ways in which services are used by private
consumers, governments and firms. Moreover, the knock-on effects across sectors need to be
considered. Improvements in the productivity of certain types of business services may result in
increases in the productivity of a heavily pollution-intensive manufacturing sector and ultimately in
greater environmental damage. This is not to imply that the productivity improvement is bad, rather
that economy-wide evaluations are called for. Yet Mayrand & Paquin (2007, p. 2) also argued that
our knowledge of ―the service sector’s environmental impacts remains incomplete and fragmentary
at best.‖ This conclusion is not an excuse to stop thinking about environmental impacts. Rather, it is
a warning that as far as economy-wide assessments are concerned, there is less to guide policy-
making than many might like.
Still, some sectors stand out in terms of their potential environmental impact, and it is not surprising
that analysts and policy-makers have wanted to understand the dynamics involved and policy
options available. Certain transportation sectors, which link national as well as international markets,
have long been a source of concern. Meanwhile, those promoting win-win-win solutions such as
higher sectoral employment, higher sectoral exports and an improved physical environment have
long focused on developing environmental services. Without denying that such solutions are
possible—indeed, from an economy-wide point of view the spatial and organizational reorganization
of economic activity emphasized by the economic geography perspective is perhaps the largest win-
win-win alternative around—it is still important to evaluate any such claims at the national and
sector levels.
The sustainability of the structural transformation of an economy over time has an international
dimension, too. Some might rightfully question, for example, a country’s commitment to
environmental sustainability if its firms reorganize their corporate activities to move or outsource
the ―dirty‖ stages of production and processing to trading partners. In other words, it is difficult to
reconcile the objective of promoting sustainable development with the cross-border displacement—
rather than worldwide reduction—of environmental impacts such as pollution.

The Growth of China’s Services Sector and Associated Trade: Complementarities between Structural Change and Sustainability
8
The purpose of this section has been to highlight the potential relationships between development
of the service sector and the aspects of a Chinese sustainable trade strategy that are related to
growth, employment and the environment. We argued that the development of China’s service
sector should be seen as part of the structural transformation of the Chinese economy, a
transformation that goes well beyond the service sector and involves spatial and organizational
reallocations of economic activity. This approach sheds light on the many different contributions of
services to economic development—and highlights the need for a cross-sectoral evaluation of any
policy that seeks to promote a service sector or services in general. On a positive note, we described
the potential win-win-win outcome in the development of livable, productive cities with high-end
services, which is implied in the economic geography literature.
We also showed the linkages between service sector development and China’s trade balance. Of
course, one can question why the trade balance is a legitimate indicator of national economic well-
being. Here, however, we pointed out that improving the service sector trade balance might come at
the expense of worsening the trade balance in goods. With respect to the impact of Chinese service
sector development and environmental degradation, the fact that so many services are inputs to the
production of other goods and services complicates assessments of the impact of changing policies
toward any one sector. We also repeated a warning from the literature that relatively little is known
about the economy-wide effects of service sector liberalization and growth.
The Growth of China’s Services Sector and Associated Trade: Complementarities between Structural Change and Sustainability
9
3.0 China’s service industry and trade: The facts
This section provides information on the pace of the structural transformation of the Chinese
economy that has occurred as the tertiary sector has expanded over time. It also provides a review of
the factual record concerning Chinese trade in services.
3.1 Service industry
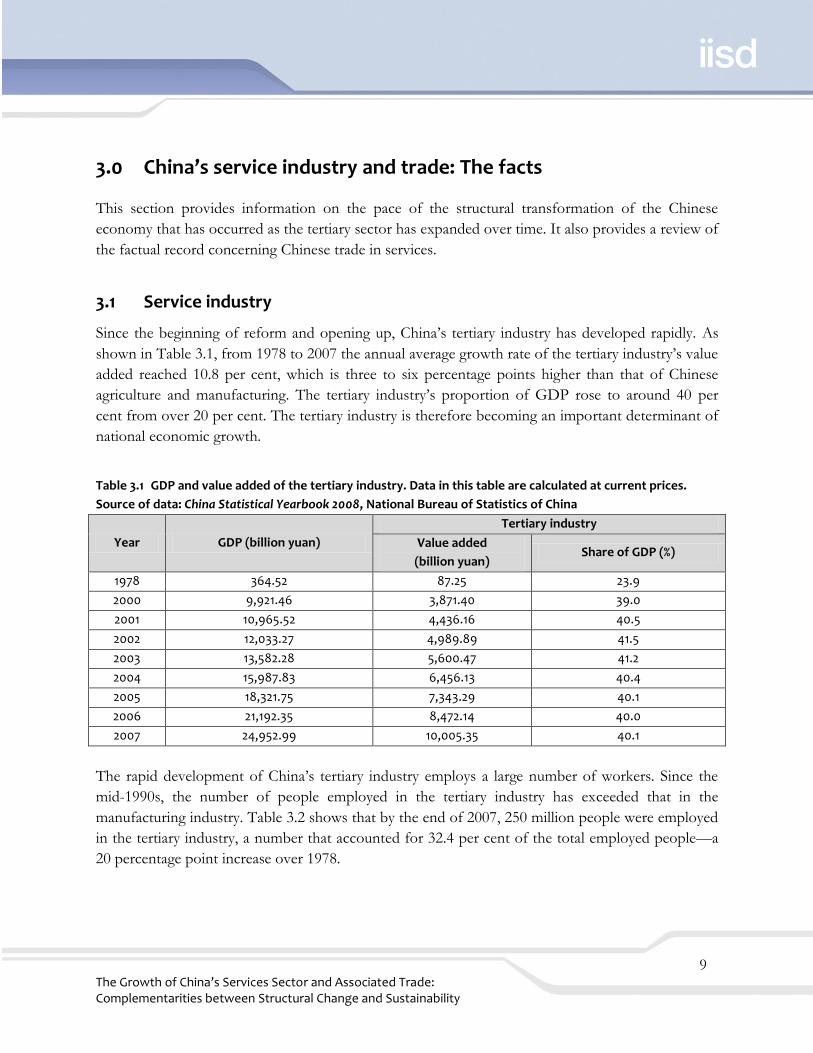
Since the beginning of reform and opening up, China’s tertiary industry has developed rapidly. As
shown in Table 3.1, from 1978 to 2007 the annual average growth rate of the tertiary industry’s value
added reached 10.8 per cent, which is three to six percentage points higher than that of Chinese
agriculture and manufacturing. The tertiary industry’s proportion of GDP rose to around 40 per
cent from over 20 per cent. The tertiary industry is therefore becoming an important determinant of
national economic growth.
Table 3.1 GDP and value added of the tertiary industry. Data in this table are calculated at current prices.
Source of data: China Statistical Yearbook 2008, National Bureau of Statistics of China
Year GDP (billion yuan)
Tertiary industry
Value added
(billion yuan) Share of GDP (%)
1978 364.52 87.25 23.9
2000 9,921.46 3,871.40 39.0
2001 10,965.52 4,436.16 40.5
2002 12,033.27 4,989.89 41.5
2003 13,582.28 5,600.47 41.2
2004 15,987.83 6,456.13 40.4
2005 18,321.75 7,343.29 40.1
2006 21,192.35 8,472.14 40.0
2007 24,952.99 10,005.35 40.1
The rapid development of China’s tertiary industry employs a large number of workers. Since the
mid-1990s, the number of people employed in the tertiary industry has exceeded that in the
manufacturing industry. Table 3.2 shows that by the end of 2007, 250 million people were employed
in the tertiary industry, a number that accounted for 32.4 per cent of the total employed people—a
20 percentage point increase over 1978.

The Growth of China’s Services Sector and Associated Trade: Complementarities between Structural Change and Sustainability
10
Table 3.2 China’s employment, total and tertiary industry (end of year data). For 1990 to 2000 the total
number of employed persons (overall and in the tertiary sector) have been adjusted in accordance with the
data obtained from the 5th National Population Census. For 2001 onward these data have been derived from
the annual sample survey on population changes. Source of data: China Statistical Yearbook 2008, National
Bureau of Statistics of China
Year Total number of employed persons
(millions)
Tertiary Industry
Number of employed persons
(millions)
Share of total
(%)
1978 401.52 48.90 12.2
1994 674.55 155.15 23.0
2004 752.00 230.11 30.6
2005 758.25 237.71 31.3
2006 764.00 246.14 32.2
2007 769.90 249.17 32.4
Among the sectors in the tertiary industry, the wholesale and retail trades sector and the transport,
storage and postal sectors ranked as the top two, accounting for 7.4 and 5.9 per cent of GDP,
respectively (Table 3.3). These two sectors comprise producer services that are principally bought by
manufacturing industries. The fast development of these two sectors mostly reflects China’s export
drive. In contrast, the sectors closely related to social and environmental development, including
health, social security and social welfare; scientific research, technical services and geological
prospecting; culture, sports and entertainment; and management of water conservancy, the
environment and public facilities, lag behind, with their combined value added accounting for only
3.8 per cent of GDP.
The Growth of China’s Services Sector and Associated Trade: Complementarities between Structural Change and Sustainability
11
Table 3.3 Value added and composition of the tertiary industry by sector (2005). Data in this table are
calculated at current prices. Source of data: China Statistical Yearbook 2007, National Bureau of Statistics of
China
Sectors Value added
(billion yuan)
Share of GDP
(%)
Tertiary industry 7,343 40.1
Wholesale and retail trades 1,353 7.4
Transport, storage and postal 1,084 5.9
Real estate 824 4.5
Public management and social organizations 683 3.7
Financial intermediation 630 3.4
Education 566 3.1
Information transmission, computer services and software 477 2.6
Hotels and catering services 419 2.3
Services to households and other services 313 1.7
Leasing and business services 291 1.6
Health, social security and social welfare 293 1.6
Scientific research, technical services and geological prospecting 205 1.1
Culture, sports and entertainment 119 0.6
Management of water conservancy, the environment and public facilities 85 0.5
Since 2001, when China joined the WTO, the country has entered a new stage of opening up. Seven
years after accession, the Chinese government feels it has honoured its WTO commitments and
adjusted its foreign trade policies. It is pursuing liberalization of its service industry. Up to now,
China has made commitments in nine service sectors and 84 subsectors of the WTO, accounting for
54.2 per cent of the 155 possible subsectors. China has made commitments in every subsector of the
construction and related engineering services, distribution services, educational services and
environmental services sectors. Moreover, China’s actions have often surpassed its commitments to
market access in environmental services. For example, China has only committed to allowing foreign
capital to operate environmental services in China’s domestic market in the form of joint ventures,
but in practice the country has allowed some sewage treatment plants and waste-power generation
plants to operate in the form of wholly foreign-owned enterprises.
China has further liberalized its trade in services in the process of regional economic integration. On
June 30, 2003, the People’s Republic of China signed the Closer Economic Partnership
Arrangement with the Hong Kong Special Administrative Region. One of the most important
objectives of the agreement is to phase in the liberalization of trade in services, a commitment that
has been reinforced in four supplementary agreements signed in October 2004, October 2005, June
2006 and June 2007. The mainland has opened more of its service sectors to Hong Kong.
Compared with China’s commitments under the WTO, the Closer Economic Partnership

The Growth of China’s Services Sector and Associated Trade: Complementarities between Structural Change and Sustainability
12
Arrangement has relaxed practitioner qualifications and business limitations to varying degrees
across the sectors, including legal, medical, computer and related services; real estate; market
research; services related to management consulting; public utilities; temporary employment;
building cleaning; photography, printing, translation and interpretation; conventions and exhibitions;
telecommunications; audiovisual services; distribution; environmental services; insurance; banking;
securities; social services; tourism; culture; sports; maritime transport; air transport; road transport
and individually owned stores. For example, in the case of legal services, China committed at WTO
accession to allowing foreign law firms to provide legal services only in the form of representative
offices. But under the Closer Economic Partnership Arrangement, a Hong Kong law firm is allowed
to set up a representative office on the mainland to operate in association with a mainland law firm.
In January 2007 China signed an agreement on trade in services with the Association of Southeast
Asian Nations. According to the agreement, investors from member countries could set up wholly
foreign-owned enterprises to operate in the sectors of software implementation, data processing, real
estate, translation and interpretation, environmental, computer reservation systems and freight
transport agency services. In addition, China has also expanded its commitments to sectors such as
market research services; project management services other than for construction; personnel
placement and supply services; building cleaning services; printing of packaging materials on a fee or
contract basis; recreational, cultural and sporting services; maintenance and repair services of motor
vehicles; and passenger transportation.
3.2 Trade in services
China’s trade in services is developing very rapidly and is becoming more and more important
worldwide. According to WTO statistics, China’s service trade exceeded US$190 billion in 2006, 2.7
times its size in 2001 (Table 3.4). The sector’s exports reached US$91.4 billion, accounting for 3.3
per cent of the total exports of international commercial services and ranking eighth among WTO
members. Its imports reached US$100.3 billion, accounting for 3.8 per cent of total worldwide
imports and ranking seventh among WTO members.

The Growth of China’s Services Sector and Associated Trade: Complementarities between Structural Change and Sustainability
13
Table 3.4 Rank of China as exporter and importer of commercial services among WTO members in 2001, 2003
and 2006. “Annual percentage change” refers to change from the previous year. Source of data: WTO
Year
Exports Imports
Rank Value
(US$1 billion)
Share of
world (%)
Annual
percentage
change
Rank Value
(US$1 billion)
Share of
world (%)
Annual
percentage
change
2001 12 32.9 2.2 3.1 10 39.0 2.6 8.9
2003 9 46.4 2.5 18.0 8 54.9 3.1 19.0
2006 8 91.5 3.3 23.7 7 100.3 3.8 20.6
China is a net importer of service products, and its deficit has been expanding. In 2006 the deficit in
China’s service trade exceeded US$8.8 billion, nearly US$3 billion higher than in 2001. (Even so,
some perspective is needed here, as the trade deficit in services represents approximately 4 per cent
of China’s total services trade.) The deficit is mainly attributable to the sectors of transportation,
insurance services, and royalties and license fees (Table 3.5), which is perhaps not terribly surprising
given that these are non-labour-intensive activities taking place in a relatively labour-abundant
country. In comparison, tourism and other business services generated large surpluses.
Table 3.5 China’s trade in services in 2001 and 2006, in billions of US dollars. Source: China’s State
Administration of Foreign Exchange
Sector 2001 2001
Total Export Import Balance Total Export Import Balance
Total 72.60 33.34 39.27 –5.93 192.83 92.00 100.83 –8.83
Transportation 15.96 4.64 11.32 –6.68 55.40 21.02 34.37 –13.35
Tourism 31.70 17.79 13.91 3.88 58.27 33.95 24.32 9.63
Telecommunications 0.60 0.27 0.33 –0.06 1.50 0.74 0.76 –0.03
Construction 1.68 0.83 0.85 –0.02 4.80 2.75 2.05 0.70
Insurance 2.94 0.23 2.71 –2.48 9.38 0.55 8.83 –8.28
Finance 0.18 0.10 0.08 0.02 1.04 0.15 0.89 –0.74
Computer and information
0.81 0.46 0.34 0.12 4.70 2.96 1.74 1.22
Royalties and license fees
2.05 0.11 1.94 –1.83 6.83 0.20 6.63 –6.43
Consultancy services 2.39 0.89 1.50 –0.61 16.22 7.83 8.39 –0.56
Advertising and publicizing
0.54 0.28 0.26 0.02 2.40 1.45 0.95 0.50
Movies and audiovisual services
0.08 0.03 0.05 –0.02 0.26 0.14 0.12 0.02
Other business services
13.03 7.28 5.74 1.54 30.95 19.69 11.26 8.43
Government services, n.i.e
0.67 0.43 0.24 0.19 1.09 0.58 0.51 0.07
The Growth of China’s Services Sector and Associated Trade: Complementarities between Structural Change and Sustainability
14
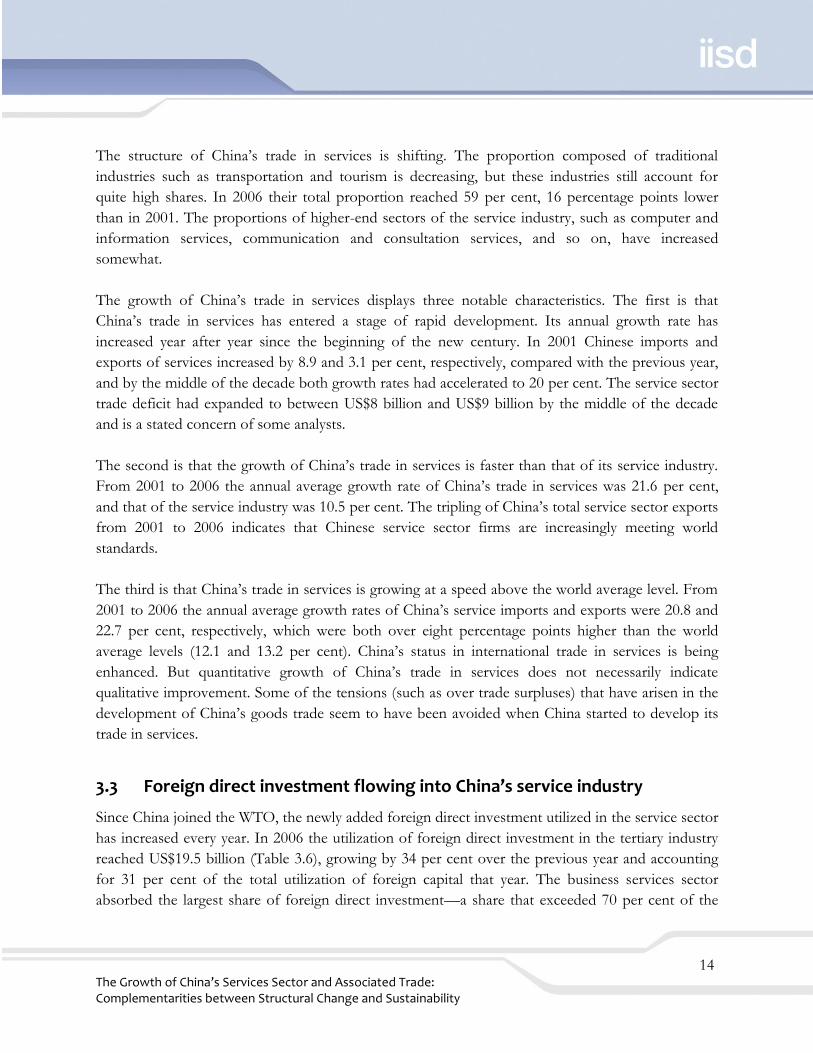
The structure of China’s trade in services is shifting. The proportion composed of traditional
industries such as transportation and tourism is decreasing, but these industries still account for
quite high shares. In 2006 their total proportion reached 59 per cent, 16 percentage points lower
than in 2001. The proportions of higher-end sectors of the service industry, such as computer and
information services, communication and consultation services, and so on, have increased
somewhat.
The growth of China’s trade in services displays three notable characteristics. The first is that
China’s trade in services has entered a stage of rapid development. Its annual growth rate has
increased year after year since the beginning of the new century. In 2001 Chinese imports and
exports of services increased by 8.9 and 3.1 per cent, respectively, compared with the previous year,
and by the middle of the decade both growth rates had accelerated to 20 per cent. The service sector
trade deficit had expanded to between US$8 billion and US$9 billion by the middle of the decade
and is a stated concern of some analysts.
The second is that the growth of China’s trade in services is faster than that of its service industry.
From 2001 to 2006 the annual average growth rate of China’s trade in services was 21.6 per cent,
and that of the service industry was 10.5 per cent. The tripling of China’s total service sector exports
from 2001 to 2006 indicates that Chinese service sector firms are increasingly meeting world
standards.
The third is that China’s trade in services is growing at a speed above the world average level. From
2001 to 2006 the annual average growth rates of China’s service imports and exports were 20.8 and
22.7 per cent, respectively, which were both over eight percentage points higher than the world
average levels (12.1 and 13.2 per cent). China’s status in international trade in services is being
enhanced. But quantitative growth of China’s trade in services does not necessarily indicate
qualitative improvement. Some of the tensions (such as over trade surpluses) that have arisen in the
development of China’s goods trade seem to have been avoided when China started to develop its
trade in services.
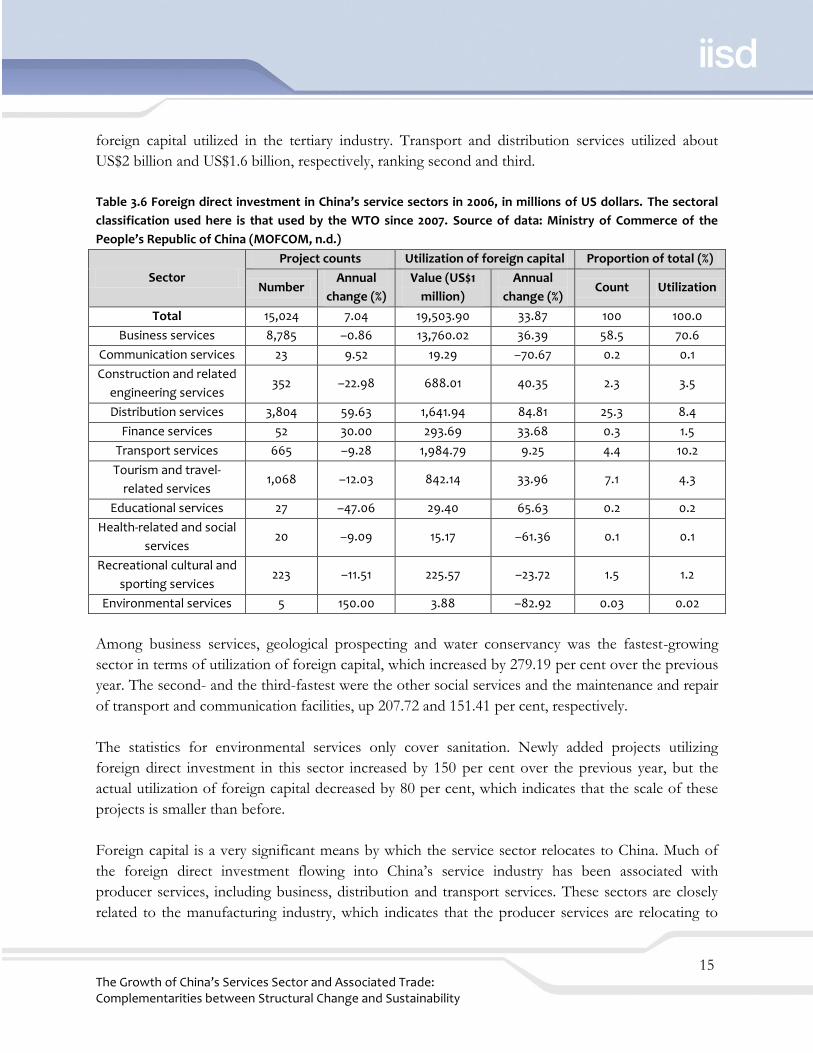
3.3 Foreign direct investment flowing into China’s service industry
Since China joined the WTO, the newly added foreign direct investment utilized in the service sector
has increased every year. In 2006 the utilization of foreign direct investment in the tertiary industry
reached US$19.5 billion (Table 3.6), growing by 34 per cent over the previous year and accounting
for 31 per cent of the total utilization of foreign capital that year. The business services sector
absorbed the largest share of foreign direct investment—a share that exceeded 70 per cent of the
The Growth of China’s Services Sector and Associated Trade: Complementarities between Structural Change and Sustainability
15
foreign capital utilized in the tertiary industry. Transport and distribution services utilized about
US$2 billion and US$1.6 billion, respectively, ranking second and third.
Table 3.6 Foreign direct investment in China’s service sectors in 2006, in millions of US dollars. The sectoral
classification used here is that used by the WTO since 2007. Source of data: Ministry of Commerce of the
People’s Republic of China (MOFCOM, n.d.)
Sector
Project counts Utilization of foreign capital Proportion of total (%)
Number Annual
change (%)
Value (US$1
million)
Annual
change (%) Count Utilization
Total 15,024 7.04 19,503.90 33.87 100 100.0
Business services 8,785 –0.86 13,760.02 36.39 58.5 70.6
Communication services 23 9.52 19.29 –70.67 0.2 0.1
Construction and related
engineering services 352 –22.98 688.01 40.35 2.3 3.5
Distribution services 3,804 59.63 1,641.94 84.81 25.3 8.4
Finance services 52 30.00 293.69 33.68 0.3 1.5
Transport services 665 –9.28 1,984.79 9.25 4.4 10.2
Tourism and travel-
related services 1,068 –12.03 842.14 33.96 7.1 4.3
Educational services 27 –47.06 29.40 65.63 0.2 0.2
Health-related and social
services 20 –9.09 15.17 –61.36 0.1 0.1
Recreational cultural and
sporting services 223 –11.51 225.57 –23.72 1.5 1.2
Environmental services 5 150.00 3.88 –82.92 0.03 0.02
Among business services, geological prospecting and water conservancy was the fastest-growing
sector in terms of utilization of foreign capital, which increased by 279.19 per cent over the previous
year. The second- and the third-fastest were the other social services and the maintenance and repair
of transport and communication facilities, up 207.72 and 151.41 per cent, respectively.
The statistics for environmental services only cover sanitation. Newly added projects utilizing
foreign direct investment in this sector increased by 150 per cent over the previous year, but the
actual utilization of foreign capital decreased by 80 per cent, which indicates that the scale of these
projects is smaller than before.
Foreign capital is a very significant means by which the service sector relocates to China. Much of
the foreign direct investment flowing into China’s service industry has been associated with
producer services, including business, distribution and transport services. These sectors are closely
related to the manufacturing industry, which indicates that the producer services are relocating to

The Growth of China’s Services Sector and Associated Trade: Complementarities between Structural Change and Sustainability
16
China alongside the labour-intensive manufacturing industries or sectors transferring from advanced
economies.
According to statistics from the Chinese Ministry of Commerce, the foreign-invested enterprises
(FIEs) in the transport, storage and postal industry and the manufacturing industry are the main
bodies on the balance sheet of FIEs’ trade in services. From 2001 to 2006 the services trade income
of the FIEs in the two major industries rose from US$2.4 billion to US$15.2 billion, accounting for
over half of the total income of FIEs’ trade in services (MOFCOM, 2007).
At present, the service sectors that have relocated to China by means of foreign direct investment
have not satisfied China’s demands for developing its service sector and trade in services. With the
growing international relocation of services, in which outsourcing is becoming more and more
important, one of the main directions of China’s foreign investment policies is to develop its
international outsourcing business by taking advantage of foreign capital.
3.4 China’s policies and measures for promoting the development of
service industries and trade
A range of existing government policies bear upon the Chinese service sector and upon the amount
of trade conducted. In this section the principal policies and their effects are discussed.
3.4.1 Industrial policies
In order to promote the optimization and upgrading of the industrial structure, the State Council of
the People’s Republic of China promulgated the Provisional Regulations on Promoting Industry
Restructuring in 2005, which set out the following goals:
Increasing the service industry’s share of the national economy, optimizing its structure, and
promoting its complete and rapid development.
Vigorously developing the environmental protection industry and strengthening the
protection of water resources, land, forests, grasslands, oceans and so on, with an emphasis
on controlling the unreasonable exploitation of resources.
Vigorously developing the trade in services, continuing to open the services market and
accepting the international relocation of the modern services industry.
Enhancing the quality and level of utilization of foreign funds, with an emphasis on
introducing advanced technology, management experience and high-quality talent as well as
assimilation and innovation of the introduced technology.
Enhancing the production and manufacturing hierarchy, as well as actively exploring the

The Growth of China’s Services Sector and Associated Trade: Complementarities between Structural Change and Sustainability
17
sectors of research and development and logistics, etc., in the regions and development
zones hat have a strong capacity to attract foreign funds.
Meanwhile, the State Council publicized the 2005 Guiding Catalogue of Industrial Structure
Regulation, which provided an important basis for directing investments as well as government
managing investment projects, thereby establishing and implementing policies covering areas such as
finance and taxation, credit, land, and imports and exports. With the rapid economic development
of recent years, the National Development and Reform Commission started amending the catalogue
and widely solicited opinions for the draft in 2007. At present, the new catalogue is being revised to
incorporate those opinions. It will further detail the service industries encouraged for investment
and add six new categories of industry, including ―modern services,‖ financial services, science and
technology services, business services and commercial trade services as well as educational, cultural,
health and sporting services. Environmental protection and the conservation and comprehensive
utilization of resources will be catalogued separately.2
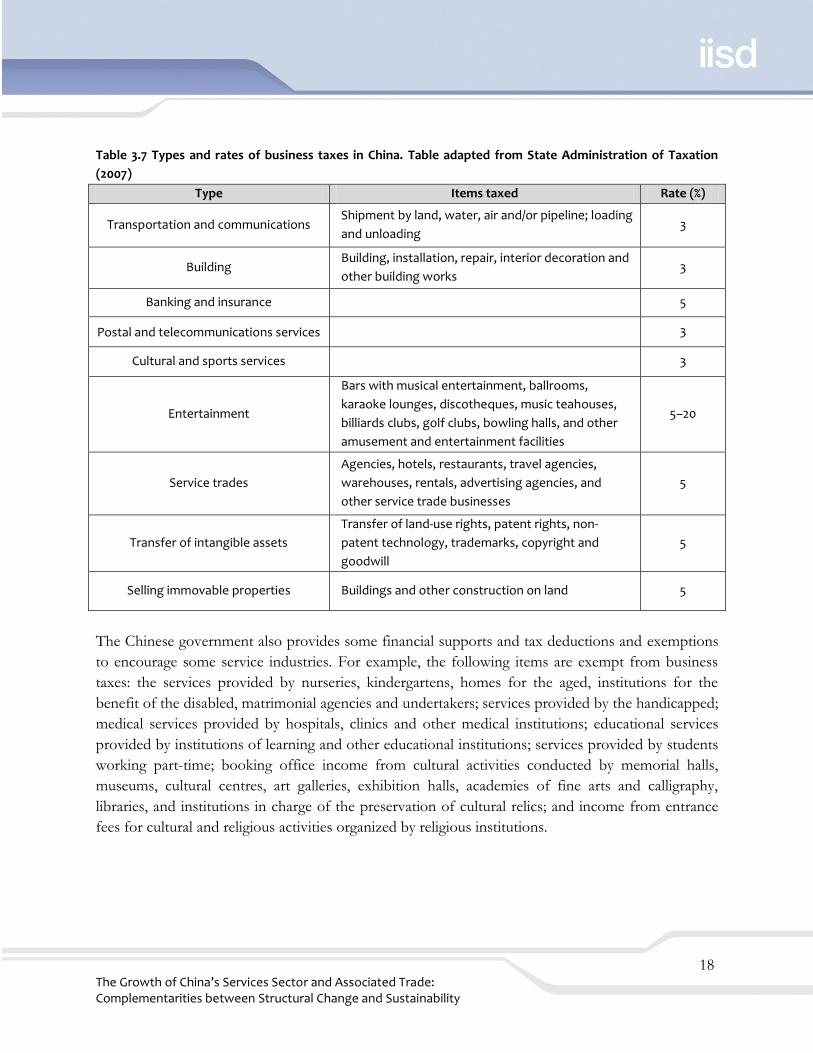
3.4.2 Finance and taxation policies
Table 3.7 lists taxes on service enterprises operating in China, which include business taxes, taxes on
city maintenance and construction, surcharges for education, stamp taxes, land-use taxes, property
taxes, taxes for the use of vehicles and ships, and business income taxes. Enterprises also deduct and
pay personal income taxes when paying their employees’ salaries.
2 Compared with the 2005 catalogue, the new one will list 72 more service sectors that are to be encouraged, including the technical development and application of heating balance and energy-saving control systems in urban buildings, vehicle refuelling stations using new-energy resources, ATMs, data processing and database services, third-party logistics services, public information platforms for logistical services, social and professional rehabilitation services, rural medical services, subcontracting of international service outsourcing, eco-tourism, environmental protection and recycling technology, and development of batteries such as lead-acid batteries, nickel-hydrogen batteries, nickel-cadmium batteries and lithium batteries, as well as the construction of recycling centres for waste electronics.
The Growth of China’s Services Sector and Associated Trade: Complementarities between Structural Change and Sustainability
18
Table 3.7 Types and rates of business taxes in China. Table adapted from State Administration of Taxation
(2007)
Type Items taxed Rate (%)
Transportation and communications Shipment by land, water, air and/or pipeline; loading
and unloading 3
Building Building, installation, repair, interior decoration and
other building works 3
Banking and insurance 5
Postal and telecommunications services 3
Cultural and sports services 3
Entertainment
Bars with musical entertainment, ballrooms,
karaoke lounges, discotheques, music teahouses,
billiards clubs, golf clubs, bowling halls, and other
amusement and entertainment facilities
5–20
Service trades
Agencies, hotels, restaurants, travel agencies,
warehouses, rentals, advertising agencies, and
other service trade businesses
5
Transfer of intangible assets
Transfer of land-use rights, patent rights, non-
patent technology, trademarks, copyright and
goodwill
5
Selling immovable properties Buildings and other construction on land 5
The Chinese government also provides some financial supports and tax deductions and exemptions
to encourage some service industries. For example, the following items are exempt from business
taxes: the services provided by nurseries, kindergartens, homes for the aged, institutions for the
benefit of the disabled, matrimonial agencies and undertakers; services provided by the handicapped;
medical services provided by hospitals, clinics and other medical institutions; educational services
provided by institutions of learning and other educational institutions; services provided by students
working part-time; booking office income from cultural activities conducted by memorial halls,
museums, cultural centres, art galleries, exhibition halls, academies of fine arts and calligraphy,
libraries, and institutions in charge of the preservation of cultural relics; and income from entrance
fees for cultural and religious activities organized by religious institutions.

The Growth of China’s Services Sector and Associated Trade: Complementarities between Structural Change and Sustainability
19
3.4.3 Foreign trade policy
The Chinese government has always actively supported the development of China’s external trade in
services. The Foreign Trade Law of the People’s Republic of China (2004) obligates China to grant
market access and national treatment to other signatories and participants in the international
treaties and agreements to which China is a party. The law lists the reasons that restrictions or bans
may be imposed on the international service trade, including:
They are necessary because of national security, the public interest or public morals.
They are necessary to protect the health or safety of the people or the life or health of
animals, plants and the environment.
They are necessary in order to establish or accelerate the establishment of certain domestic
service industries.
They are necessary to maintain the balance of foreign exchange payments.
They are necessary due to other reasons in accordance with laws and administrative rules.
They are provided for by the international treaties or agreements to which China is a party.
3.4.4 Foreign investment policy
In November 2007 China’s National Development and Reform Commission and Ministry of
Commerce jointly revised the Catalogue of Industries for Guiding Foreign Investment. The new catalogue
expanded the restriction on foreign investment in the real estate industry and relaxed the restriction
on finance services. Besides continuing to only allow foreign capital to develop tracts of land and to
construct and operate villas, international exhibition centers, and high-end hotels and office
buildings in the form of equity joint ventures and cooperative joint ventures, in real estate the new
catalogue restricts foreign capital to secondary market transactions and intermediate or brokerage
companies. In addition, ordinary housing development was deleted from the list of encouraged
services.
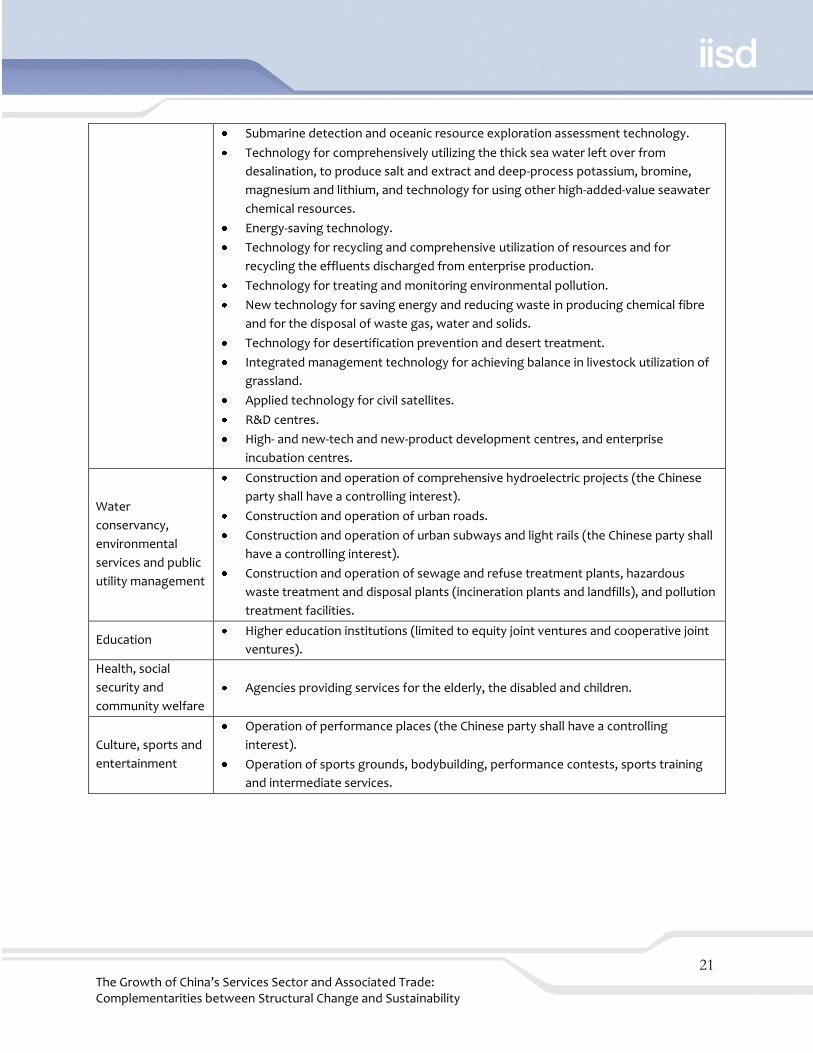
In total, the catalogue of services where foreign investment is encouraged mainly includes eight
sectors and 41 sub-sectors (Table 3.8). The new catalogue no longer encourages the use of foreign
capital in development of rare or non-renewable mineral resources, and restricts or even forbids
foreign capital from investing in projects with high material and energy consumption and high
pollution. To deal with the huge trade surplus and foreign exchange reserves, the new catalogue no
longer implements policies that purely encourage exports.

The Growth of China’s Services Sector and Associated Trade: Complementarities between Structural Change and Sustainability
20
Table 3.8 Catalogue of service industries in which foreign investment is encouraged. Data source: National
Development and Reform Commission and Ministry of Commerce (2007)
Sector Subsectors
Transportation,
warehouse
management and
postal services
Construction and operation of main railway lines (the Chinese party shall have a
controlling interest).
Construction and operation of branch line railways, local railways, and related
bridges, tunnels, ferries and station facilities (limited to equity joint ventures and
cooperative joint ventures).
Comprehensive maintenance of infrastructure for high-speed railways, railway lines
specially for passenger traffic and intercity railways (the Chinese party shall have a
controlling interest).
Construction and operation of highways, independent bridges and tunnels.
Highway freight companies.
Construction and operation of public dock facilities of ports.
Construction and management of civil airports (the Chinese party shall have a
controlling interest).
Air freight companies (the Chinese party shall have a controlling interest).
General aviation companies for agriculture, forestry and fishery (limited to equity
joint ventures and cooperative joint ventures).
International marine transport (the Chinese party shall have a controlling interest).
International container multi-modal transportation.
Construction and management of oil and gas delivery pipes as well as oil depots.
Construction and management of coal pipeline transportation facilities.
Construction and management of storage facilities related to transportation
businesses.
Wholesale and
retail
Delivery of general commodities.
Modern logistics.
Leasing and
commercial
services
Accounting and auditing (limited to equity joint ventures and cooperative joint
ventures).
International economic, scientific and technical, and environmental protection
information consultancy services.
Contract information technology and operation flow services, such as systems
application management and maintenance, information technology support
management, bank back-office services, financial settlement, human resource
services, software development, call centres and data processing.
Scientific research,
technical services
and geological
exploration
Biological engineering and biomedical engineering technology.
Biomass energy development technology.
Isotope, radiation and laser technology.
Ocean and ocean energy development technology, comprehensive utilization
technology for marine chemical resources, marine medicine and biochemical
product development technology.
Ocean-monitoring technology (monitoring tides, waves, weather and the
environment).
The Growth of China’s Services Sector and Associated Trade: Complementarities between Structural Change and Sustainability
21
Submarine detection and oceanic resource exploration assessment technology.
Technology for comprehensively utilizing the thick sea water left over from
desalination, to produce salt and extract and deep-process potassium, bromine,
magnesium and lithium, and technology for using other high-added-value seawater
chemical resources.
Energy-saving technology.
Technology for recycling and comprehensive utilization of resources and for
recycling the effluents discharged from enterprise production.
Technology for treating and monitoring environmental pollution.
New technology for saving energy and reducing waste in producing chemical fibre
and for the disposal of waste gas, water and solids.
Technology for desertification prevention and desert treatment.
Integrated management technology for achieving balance in livestock utilization of
grassland.
Applied technology for civil satellites.
R&D centres.
High- and new-tech and new-product development centres, and enterprise
incubation centres.
Water
conservancy,
environmental
services and public
utility management
Construction and operation of comprehensive hydroelectric projects (the Chinese
party shall have a controlling interest).
Construction and operation of urban roads.
Construction and operation of urban subways and light rails (the Chinese party shall
have a controlling interest).
Construction and operation of sewage and refuse treatment plants, hazardous
waste treatment and disposal plants (incineration plants and landfills), and pollution
treatment facilities.
Education Higher education institutions (limited to equity joint ventures and cooperative joint
ventures).
Health, social
security and
community welfare
Agencies providing services for the elderly, the disabled and children.
Culture, sports and
entertainment
Operation of performance places (the Chinese party shall have a controlling
interest).
Operation of sports grounds, bodybuilding, performance contests, sports training
and intermediate services.

The Growth of China’s Services Sector and Associated Trade: Complementarities between Structural Change and Sustainability
22
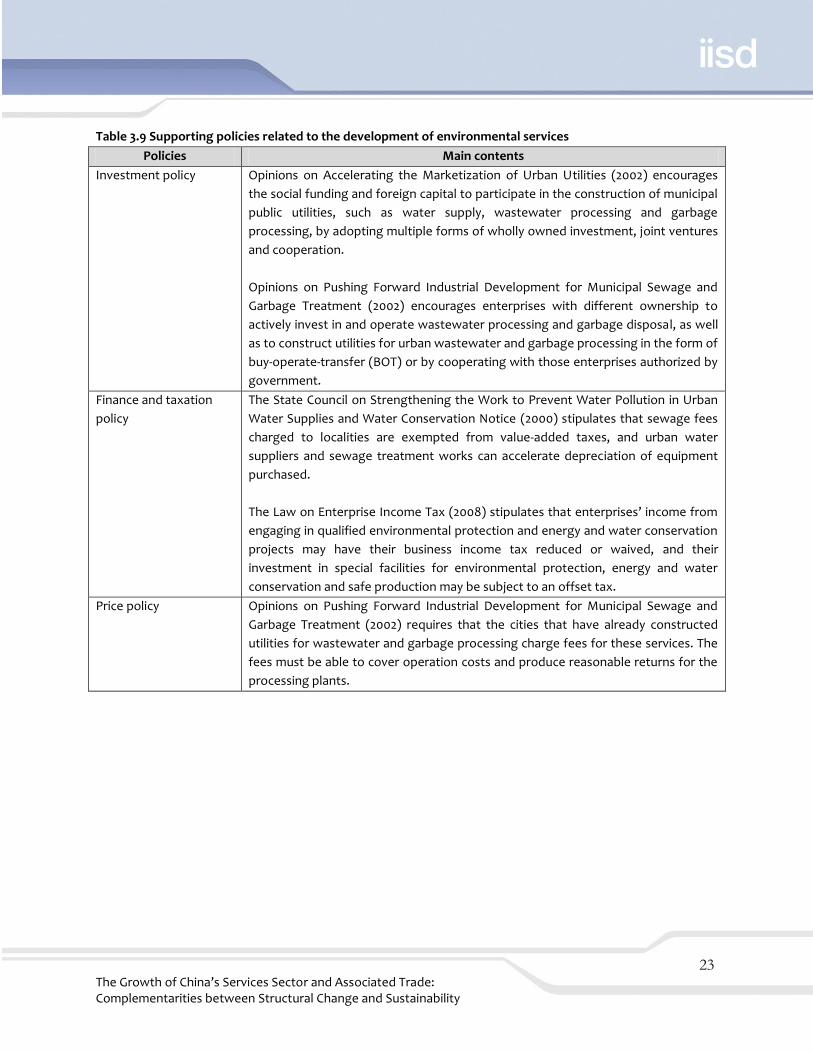
3.4.5 Policies related to environmental services
In order to realize sustainable development as the country enters the 21st century, the Chinese
government has adopted various policies covering such areas as industry, foreign investment,
finance and taxation, and pricing, so as to vigorously support the development of the environmental
protection industry (Table 3.9). Besides the above-mentioned Guiding Catalogue of Industrial
Structure Regulation and Catalogue of Industries for Guiding Foreign Investment, the country has
implemented a series of important regulations and policies, including the Law on Promotion of
Cleaner Production, Law on Environmental Impact Assessment, Program of Action for Sustainable
Development in China in the Early 21st Century, Ordinance of Pollutant Discharge Fee Collection,
Opinions on Accelerating the Marketization of Urban Utilities, Opinions on Pushing Forward
Industrial Development for Municipal Sewage and Garbage Treatment, and the State Council on
Strengthening the Work to Prevent Water Pollution in Urban Water Supplies and Water
Conservation Notice. All these regulations and policies form a preliminary policy system to protect
the environment, and have provided the basis for the treatment of municipal wastes and the
prevention of pollution.
The Growth of China’s Services Sector and Associated Trade: Complementarities between Structural Change and Sustainability
23
Table 3.9 Supporting policies related to the development of environmental services
Policies Main contents
Investment policy Opinions on Accelerating the Marketization of Urban Utilities (2002) encourages
the social funding and foreign capital to participate in the construction of municipal
public utilities, such as water supply, wastewater processing and garbage
processing, by adopting multiple forms of wholly owned investment, joint ventures
and cooperation.
Opinions on Pushing Forward Industrial Development for Municipal Sewage and
Garbage Treatment (2002) encourages enterprises with different ownership to
actively invest in and operate wastewater processing and garbage disposal, as well
as to construct utilities for urban wastewater and garbage processing in the form of
buy-operate-transfer (BOT) or by cooperating with those enterprises authorized by
government.
Finance and taxation
policy
The State Council on Strengthening the Work to Prevent Water Pollution in Urban
Water Supplies and Water Conservation Notice (2000) stipulates that sewage fees
charged to localities are exempted from value-added taxes, and urban water
suppliers and sewage treatment works can accelerate depreciation of equipment
purchased.
The Law on Enterprise Income Tax (2008) stipulates that enterprises’ income from
engaging in qualified environmental protection and energy and water conservation
projects may have their business income tax reduced or waived, and their
investment in special facilities for environmental protection, energy and water
conservation and safe production may be subject to an offset tax.
Price policy Opinions on Pushing Forward Industrial Development for Municipal Sewage and
Garbage Treatment (2002) requires that the cities that have already constructed
utilities for wastewater and garbage processing charge fees for these services. The
fees must be able to cover operation costs and produce reasonable returns for the
processing plants.

The Growth of China’s Services Sector and Associated Trade: Complementarities between Structural Change and Sustainability
24
4.0 Imperatives and challenges for the sustainable development of
Chinese trade in services
The future growth of the Chinese service sector will not happen in a vacuum; other domestic and
international developments will condition the business environment and ought to shape the advice
that analysts provide policy-makers. Looking a little forward as well as at current developments, this
section seeks to do this.
4.1 Imperatives
This section describes the 11th Five-Year Guidelines and establishes their centrality in shaping
policy initiatives towards the Chinese service sector.
4.1.1 The 11th Five-Year Guidelines: Benign internal policy environment
The 11th Five-Year Guidelines state that China should accelerate the development of its service
sectors and trade in services, build a resource-saving and environmentally friendly society, and
realize sustainable development, in so doing constructing a better-off society.
The major targets in developing the service sector and trade in services during the period of the 11th
Five-Year Guidelines are that, by the year 2010, the service industry’s share of GDP should have
grown by 3 per cent compared with 2005, the percentage of workers engaging in the service sector
should have grown by 4 per cent, and the total trade in services should have reached US$400 billion.
In addition, an industrial structure giving priority to the service economy should have been formed
in qualified large- and medium-sized cities, and the growth rate of the service sector’s added value
should have exceeded those growth rates of GDP and the secondary industry.
By 2020 the transition to an economic structure that gives priority to the service economy should
have been accomplished, meaning in practical terms that the service sector’s added value as a
proportion of GDP should exceed 50 per cent, the sector’s employment capacity should be notably
augmented, market competitiveness should be markedly strengthened and the overall level of
development should basically satisfy the requirements for the full construction of a better-off
society.
The major targets in developing a recycling economy and strengthening environmental protection
are that by the year 2010, both sulphur dioxide and carbon dioxide emissions will decrease by 10 per
cent; all cities in China will have sewage treatment facilities, with at least 70 per cent of urban sewage
The Growth of China’s Services Sector and Associated Trade: Complementarities between Structural Change and Sustainability
25
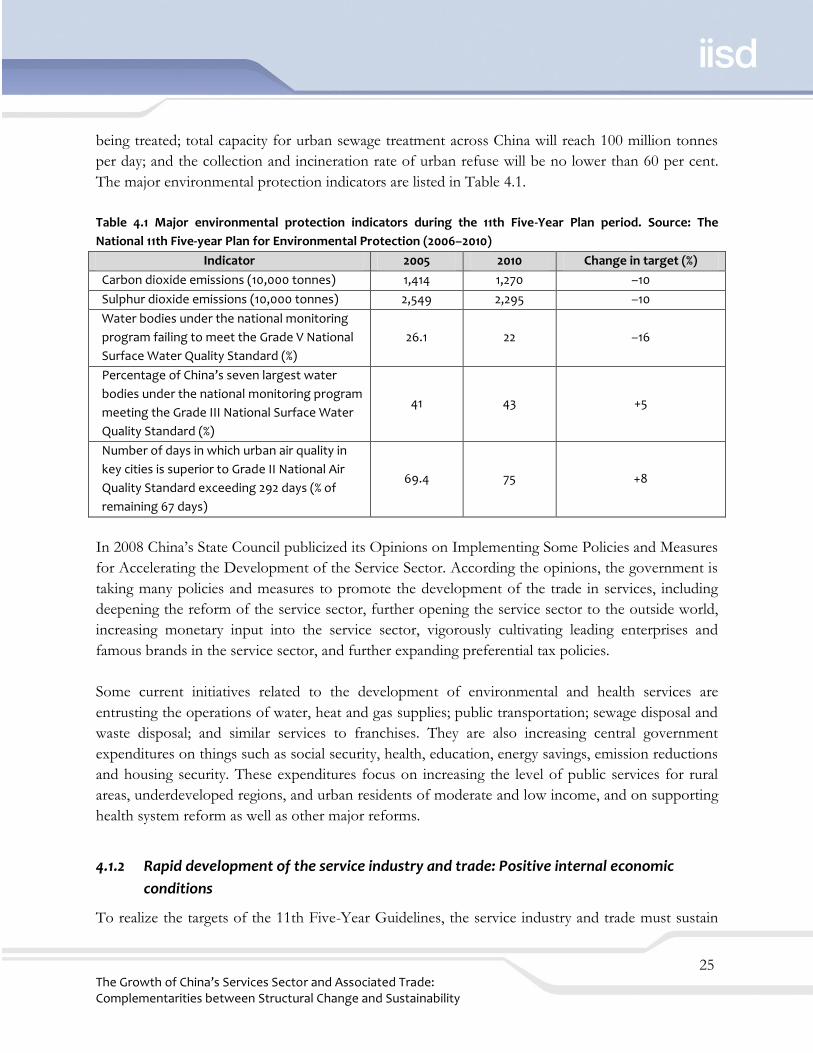
being treated; total capacity for urban sewage treatment across China will reach 100 million tonnes
per day; and the collection and incineration rate of urban refuse will be no lower than 60 per cent.
The major environmental protection indicators are listed in Table 4.1.
Table 4.1 Major environmental protection indicators during the 11th Five-Year Plan period. Source: The
National 11th Five-year Plan for Environmental Protection (2006–2010)
Indicator 2005 2010 Change in target (%)
Carbon dioxide emissions (10,000 tonnes) 1,414 1,270 –10
Sulphur dioxide emissions (10,000 tonnes) 2,549 2,295 –10
Water bodies under the national monitoring
program failing to meet the Grade V National
Surface Water Quality Standard (%)
26.1 22 –16
Percentage of China’s seven largest water
bodies under the national monitoring program
meeting the Grade III National Surface Water
Quality Standard (%)
41 43 +5
Number of days in which urban air quality in
key cities is superior to Grade II National Air
Quality Standard exceeding 292 days (% of
remaining 67 days)
69.4 75 +8
In 2008 China’s State Council publicized its Opinions on Implementing Some Policies and Measures
for Accelerating the Development of the Service Sector. According the opinions, the government is
taking many policies and measures to promote the development of the trade in services, including
deepening the reform of the service sector, further opening the service sector to the outside world,
increasing monetary input into the service sector, vigorously cultivating leading enterprises and
famous brands in the service sector, and further expanding preferential tax policies.
Some current initiatives related to the development of environmental and health services are
entrusting the operations of water, heat and gas supplies; public transportation; sewage disposal and
waste disposal; and similar services to franchises. They are also increasing central government
expenditures on things such as social security, health, education, energy savings, emission reductions
and housing security. These expenditures focus on increasing the level of public services for rural
areas, underdeveloped regions, and urban residents of moderate and low income, and on supporting
health system reform as well as other major reforms.
4.1.2 Rapid development of the service industry and trade: Positive internal economic
conditions
To realize the targets of the 11th Five-Year Guidelines, the service industry and trade must sustain

The Growth of China’s Services Sector and Associated Trade: Complementarities between Structural Change and Sustainability
26
rapid development in the future. If the service industry’s share of GDP is to reach 43 per cent in
2010, its annual average growth rate must be about 1.7 percentage points higher than that of GDP
during the period of the 11th Five-Year Plan (see Table 4.2). And if the total volume of trade in
services is to reach US$400 billion, its annual average growth rate must reach 20 per cent. The rapid
development of the service sector and trade would guarantee sustainable development in China’s
economic model. And in the process of this rapid development, the social and environmental issues
with which the sustainable development of trade in services is confronted can be dealt with more
easily.
Table 4.2 Estimated annual average growth rates of the service industry (%). Source: Calculated by the
authors
Possible nominal annual
average growth rate of
GDP
11.00 12.00 13.00 14.00 15.00
Required annual average
growth rate of the
service industry to meet
Five-Year Plan goals
12.65 13.67 14.68 15.70 16.71
The market scale of environmental services is constantly enlarging, and the development of
environmental services has a promising future. The statistics show that investment in anti-pollution
projects increased continuously during the 10th Five-Year Plan period, rising from over 110 billion
yuan in 2001 to over 238 billion in 2005, for an annual average growth rate of 21 per cent (see Table
4.3). Investment will keep increasing during the period of the 11th Five-Year Guidelines, allowing
environmental services to grow faster. Some studies predict that environmental services will grow at
a rate of 15 to 20 per cent a year in China during the period of the 11th Five-Year Guidelines. In
2010 the total income of environmental services will be about 100 billion yuan (see Table 4.4).

The Growth of China’s Services Sector and Associated Trade: Complementarities between Structural Change and Sustainability
27
Table 4.3 Investment in the treatment of environmental pollution, 2001 to 2006 (billion yuan). Source of date:
China Statistical Yearbook of the Tertiary Industry 2007, compiled by the National Bureau of Statistics of China
Total Urban environmental
infrastructure
Industrial pollution
source treatment
Investment in environmental
protection components of
“three-simultaneity”
construction projects3
2001 110.66 59.57 17.45 33.64
2002 136.72 78.97 18.84 38.97
2003 162.77 107.24 22.18 33.35
2004 190.98 114.12 30.81 46.05
2005 238.80 128.97 45.82 64.01
2006 256.60 131.49 48.39 76.72
Table 4.4 Predicted demand for environmental services during the period of the 11th Five-Year Plan
Sectors Total income in 2004
(million yuan)
Predicted annual
growth rate (%)
Predicted total income in
2010 (million yuan)
Research and development
of environmental
technology
130 5–10 174–230
Design and construction of
environmental projects 1,437 15–25 3,324–5,482
Operation of pollution
treatment infrastructure 727 25–35 2,774–4,401
Environmental monitoring 169 15–20 391–505
Environmental consultation 178 20–30 532–859
Total 2,641 15–20 7,195–11,477
4.1.3 Liberalization of global trade in services is deepening
The liberalization of trade in services is strengthening, principally in bilateral and regional
agreements. Trade in services is one of the key parts of the Doha Round negotiations. Although
these negotiations have met unexpected difficulties and the deadline to close the negotiations has
been postponed again and again, some improvements have occurred. Since the end of March 2003,
69 countries and regions have submitted ―offers‖ to liberalize their measures, and 30 countries and
regions have submitted their revised offers since May 19, 2005. Whether the Doha Round will reach
a successful conclusion in the near term is unclear.
3 According to the Environmental Protection Law of the People’s Republic of China, installations for the prevention and control of pollution at a construction project must be designed, built and commissioned together with the principal part of the project. This requirement is referred to as ―three-simultaneity.‖

The Growth of China’s Services Sector and Associated Trade: Complementarities between Structural Change and Sustainability
28
In the area of regional integration, it’s relatively clear there is considerable scope for improvement in
the liberalization of trade in services. With the trade in services playing more and more important
roles in the global economy, more and more regional economic groups regard agreement on trade in
services as key and wish to mutually open the service industry so as to extend the intra-trade in
services. As of April 15, 2008, there were 51 regional trade agreements related to Article V of the
General Agreement on Trade in Services (GATS).
4.1.4 The international relocation of the service industry continues apace
The international relocation of the service industry—in the principal form of outsourcing—is
developing very fast. Although at present, no comprehensive statistics for international outsourcing
of services exist, all the available evaluations suggest that this area has enormous potential for
development. McCarthy estimated that, in 2007, the value of global services that could be
outsourced offshore might be US$465 billion. Of these, the information technology applications,
business processing, information technology infrastructure, and design and research and
development could be US$90 billion, US$170 billion, US$85 billion and US$120 billion, respectively.
And the Chinese Ministry of Commerce has estimated that the total potential market will hopefully
increase up to US$600 billion by 2010, while less than 10 per cent of services have been offshored at
present (MOFCOM, 2007). UNCTAD has predicted that the outsourcing of international services
will keep on growing at a rate of 30 to 40 per cent in the future.
The international relocation of the service industry is directly influencing the service trade in the
modes of cross-border supply and commercial presence. Developing economies, as the main
receivers of the offshoring of services, can expand their service exports by taking an active part in
the relocation of the service industry. Even that part of the service industry that has relocated to
target the domestic market also plays a role in promoting the service exports of the host country by
improving the competitiveness of local service firms.
4.2 Challenges
While expectations are high as to the potential contribution of the service sector to China’s future
economic performance, that contribution is by no means assured. Specific hurdles need to be
overcome, and this section describes them.
4.2.1 The development of China’s service industry has lagged behind
Compared with countries with similar development levels, much room exists for the development of
China’s tertiary industry. According to country-wide statistics, the tertiary industry’s average share of

The Growth of China’s Services Sector and Associated Trade: Complementarities between Structural Change and Sustainability
29
GDP of medium-income developing countries in 2005 was 53 per cent, while that in China was just
40 per cent.
In addition, concerns exist about the low quality and high price of the service sector in China.
According to one relevant study (Jian & Pei, 2004), it is common in China that the supply of services
cannot satisfy consumer demand in terms of both quantity and quality, and the prices of service
products on the domestic market are much higher than those on international markets. The
underdevelopment of the service industry probably undermines the prospects of China’s trade in
services.
4.2.2 China’s trade in services needs to further liberalize
China made commitments in nine service sectors and 84 subsectors when entering the WTO,
accounting for 54.2 per cent of the total 155 subsectors, lower than the commitments of Japan (73.5
per cent) and Korea (67.7 per cent). As far as the specific sectors are concerned, China has made
commitments in all the subsectors for construction and related engineering services, distribution
services, educational services and environmental services.
Table 4.5 lists the sector coverage rate of China’s commitments under the GATS (the percentage of
sectors in each industry for which China has made commitments), and the liberalization index for
each sector. The WTO’s sectoral classification for services lists 12 sectors and 155 subsectors.
According to the WTO, if a government commits itself to allow foreign investments to operate in its
domestic market, this is a market-access commitment. These commitments can be distinguished
from those that are not limited, those that are limited, and those that are unbound.

The Growth of China’s Services Sector and Associated Trade: Complementarities between Structural Change and Sustainability
30
Table 4.5 Sector coverage rate of China’s commitments under GATS, and the liberalization index for each
sector. Source: Calculated by the authors based on the schedule of China’s specific commitments in services
Sector Sector coverage rate
of commitments
Liberalization index
Mode 1 Mode 2 Mode 3 Mode 4
Average 54.2 0.36 0.54 0.28 0.06
Commercial business 60.9 0.55 0.60 0.32 0.06
Communication services 62.5 0.38 0.63 0.31 0.06
Construction and related engineering services 100.0 0.10 1.00 0.50 0.10
Distribution services 100.0 0.54 1.00 0.50 0.10
Educational services 100.0 0.10 1.00 0.50 0.10
Environmental services 100.0 0.50 1.00 0.50 0.10
Financial services 76.5 0.44 0.65 0.44 0.08
Health services 0.0 0.00 0.00 0.00 0.00
Tourism and travel-related services 50.0 0.50 0.50 0.25 0.05
Entertainment services 0.0 0.00 0.00 0.00 0.00
Transport services 20.0 0.19 0.26 0.12 0.05
Other services 0.0 0.00 0.00 0.00 0.00
The liberalization index is calculated by adding the sector coverage rate of non-limitation
commitments to one-half of the sector coverage rate of limitation commitments and one-tenth of
the sector coverage rate of unbound commitments. The index ranges between 0.1 and 1.0. The
larger the index, the more liberalized the sector. Mode 1 represents cross-border supply, mode 2
represents consumption abroad, mode 3 represents commercial presence and mode 4 represents the
cross-border movement and presence of persons.
A liberalization index is designed to reveal the extent of liberalization of China’s trade in services.
According to the index, China’s trade in services for modes 1 and 2 is more liberalized than for the
other two modes, indicating that China tends to take a more cautious attitude toward liberalization
of modes 3 and 4. Except for the sectors for which China has not made any commitments
(including health services, entertainment services and other services), the liberalization level of
producer services, including transport, communications and business, is relatively low, which is not
conducive to China’s developing its service industry by taking advantage of the international
relocation of the service industry.
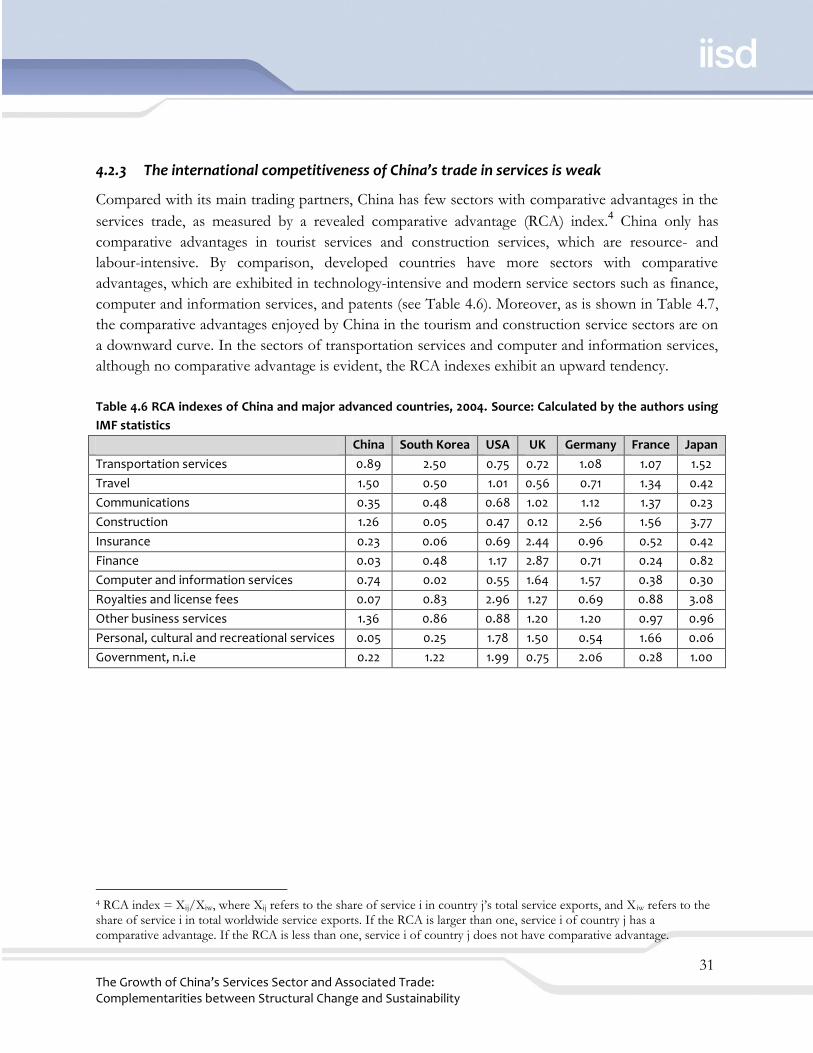
The Growth of China’s Services Sector and Associated Trade: Complementarities between Structural Change and Sustainability
31
4.2.3 The international competitiveness of China’s trade in services is weak
Compared with its main trading partners, China has few sectors with comparative advantages in the
services trade, as measured by a revealed comparative advantage (RCA) index.4 China only has
comparative advantages in tourist services and construction services, which are resource- and
labour-intensive. By comparison, developed countries have more sectors with comparative
advantages, which are exhibited in technology-intensive and modern service sectors such as finance,
computer and information services, and patents (see Table 4.6). Moreover, as is shown in Table 4.7,
the comparative advantages enjoyed by China in the tourism and construction service sectors are on
a downward curve. In the sectors of transportation services and computer and information services,
although no comparative advantage is evident, the RCA indexes exhibit an upward tendency.
Table 4.6 RCA indexes of China and major advanced countries, 2004. Source: Calculated by the authors using
IMF statistics
China South Korea USA UK Germany France Japan
Transportation services 0.89 2.50 0.75 0.72 1.08 1.07 1.52
Travel 1.50 0.50 1.01 0.56 0.71 1.34 0.42
Communications 0.35 0.48 0.68 1.02 1.12 1.37 0.23
Construction 1.26 0.05 0.47 0.12 2.56 1.56 3.77
Insurance 0.23 0.06 0.69 2.44 0.96 0.52 0.42
Finance 0.03 0.48 1.17 2.87 0.71 0.24 0.82
Computer and information services 0.74 0.02 0.55 1.64 1.57 0.38 0.30
Royalties and license fees 0.07 0.83 2.96 1.27 0.69 0.88 3.08
Other business services 1.36 0.86 0.88 1.20 1.20 0.97 0.96
Personal, cultural and recreational services 0.05 0.25 1.78 1.50 0.54 1.66 0.06
Government, n.i.e 0.22 1.22 1.99 0.75 2.06 0.28 1.00
4 RCA index = Xij/Xiw, where Xij refers to the share of service i in country j’s total service exports, and X iw refers to the share of service i in total worldwide service exports. If the RCA is larger than one, service i of country j has a comparative advantage. If the RCA is less than one, service i of country j does not have comparative advantage.
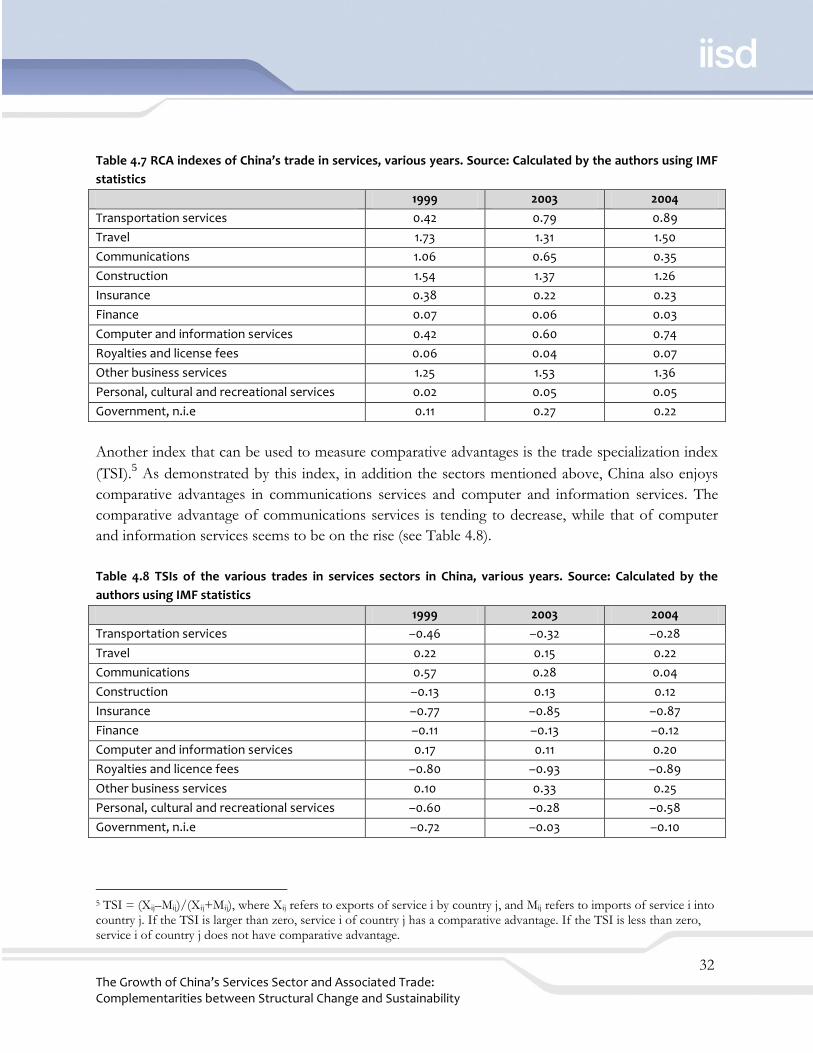
The Growth of China’s Services Sector and Associated Trade: Complementarities between Structural Change and Sustainability
32
Table 4.7 RCA indexes of China’s trade in services, various years. Source: Calculated by the authors using IMF
statistics
1999 2003 2004
Transportation services 0.42 0.79 0.89
Travel 1.73 1.31 1.50
Communications 1.06 0.65 0.35
Construction 1.54 1.37 1.26
Insurance 0.38 0.22 0.23
Finance 0.07 0.06 0.03
Computer and information services 0.42 0.60 0.74
Royalties and license fees 0.06 0.04 0.07
Other business services 1.25 1.53 1.36
Personal, cultural and recreational services 0.02 0.05 0.05
Government, n.i.e 0.11 0.27 0.22
Another index that can be used to measure comparative advantages is the trade specialization index
(TSI).5 As demonstrated by this index, in addition the sectors mentioned above, China also enjoys
comparative advantages in communications services and computer and information services. The
comparative advantage of communications services is tending to decrease, while that of computer
and information services seems to be on the rise (see Table 4.8).
Table 4.8 TSIs of the various trades in services sectors in China, various years. Source: Calculated by the
authors using IMF statistics
1999 2003 2004
Transportation services –0.46 –0.32 –0.28
Travel 0.22 0.15 0.22
Communications 0.57 0.28 0.04
Construction –0.13 0.13 0.12
Insurance –0.77 –0.85 –0.87
Finance –0.11 –0.13 –0.12
Computer and information services 0.17 0.11 0.20
Royalties and licence fees –0.80 –0.93 –0.89
Other business services 0.10 0.33 0.25
Personal, cultural and recreational services –0.60 –0.28 –0.58
Government, n.i.e –0.72 –0.03 –0.10
5 TSI = (Xij–Mij)/(Xij+Mij), where Xij refers to exports of service i by country j, and Mij refers to imports of service i into country j. If the TSI is larger than zero, service i of country j has a comparative advantage. If the TSI is less than zero, service i of country j does not have comparative advantage.

The Growth of China’s Services Sector and Associated Trade: Complementarities between Structural Change and Sustainability
33
Although the TSIs indicate that China enjoys comparative advantage in computer and information
services, the advantage actually exists more in the processing part of the service outsourcing of the
information technology industry, which is also labour-intensive. China does not enjoy many
advantages in research and development, where added value is relatively higher. Overall, the RCA
indexes and TSIs reveal that the competitiveness of China’s trade in services, especially that of
producer services, is weak.
4.2.4 The foreign direct investment flowing into China’s service industry mainly aims at the
domestic market
Most of the foreign direct investment that enters China’s service industry aims at occupying the
domestic market. Such investment can be helpful in improving the quality of the services in some
service sectors through competition, and the consumer’s welfare can be improved as well. However,
it has limited effects on China’s accepting the international relocation of the service industry or on
promoting the development of the service industry and exports when compared with foreign
investment aimed at developing offshored business.
4.2.5 Offshoring and outsourcing in China is underdeveloped
Business process outsourcing has afforded some developing countries substantial opportunities to
expand service exports. India figures prominently in this field, having experienced export growth
rates of 25 per cent per year from 1995 to 2005. Technological developments, most notably the
improvements in information technology and the reductions in international communications costs,
plus a shift in management thinking toward focusing on the activities that firms are supposed to be
best at, has created a large and growing demand for cheap suppliers of business process outsourcing.
Data entry and other back-office activities were first outsourced by industrialized country firms,
typically to developing countries that shared similar languages. Since then some companies in
developing countries have migrated up the value chain to providing direct customer care and
management, human resource management, certain analyses of medical evidence (such as x-rays)
and product development. Hoekman and Mattoo (2008) argue that India’s migration up this value
chain has allowed other developing countries (they specifically mention China) to establish
themselves in the lower-value-added stages of business process outsourcing.
The Growth of China’s Services Sector and Associated Trade: Complementarities between Structural Change and Sustainability
34
5.0 Lessons from comparative analyses and international
experience
Earlier we argued that the growth of China’s service sector should be seen as part of the structural
transformation of the Chinese economy. In this section we present comparative and international
evidence that sheds light on the relative performance of China’s service sector and, more
importantly, on the determinants of the service sector’s size and its impact on national economic
performance.
First it is useful to reflect further on Chinese and Indian service sector performance. Bosworth and
Collins (2008) compare, sector by sector, the performance of both China and India. They start by
noting that ―India has attracted considerable attention for the rapid expansion of its service sector;
however, the expansion of this sector has also been very strong in China‖ (p. 55). In fact, they report
that the average annual growth rate of the Chinese service sector’s output exceeded that of India
from 1987 to 2004, though the differences in the growth rate narrowed between 1993 and 2004 (see
their Table 3, p. 54). So if anything, the Indian service sector’s performance has only narrowed the
gap with China’s, rather than overtaking it. When it comes to generation of employment in services,
Bosworth and Collins report that China’s growth rate is at least one percentage point faster than
India’s. These findings may go some way in countering the pessimism concerning the Chinese
service sector.
In contrast, the contribution of total factor productivity growth to service sector growth is higher in
India than it is in China, especially for the period from 1993 to 2004 (the most recent period in the
Bosworth and Collins study). The comparable average annual growth rates are 3.0 and 0.9 per cent,
respectively. Even though capital per worker in the Chinese service sector grew more than three
times as fast as in India, output per worker in the Indian service sector still grew faster than in
China. In interpreting their results, Bosworth and Collins stated that they were suspicious about
their estimates of Indian total factor productivity growth. Even so, there may be a concern here for
Chinese policy-makers, especially as total factor productivity in Chinese agriculture and
manufacturing grew much faster than in the service sector.
Another comparative study of Indian and Chinese service sector performance was conducted by Wu
(2007). Wu presents evidence on the composition of the service sector in China, India and some
industrialized economies. The major difference between China and India and the industrialized
economies (that Wu fails to mention) is that the richer economies have real estate sectors that are
double the respective shares of total service sector output of China and India. In China, the share of
total service sector output accounted for by education, health and research is larger than that of

The Growth of China’s Services Sector and Associated Trade: Complementarities between Structural Change and Sustainability
35
India and the industrialized country counterparts (though the breakdown between education, health
and research was not presented for the rich countries). As a share of total service sector output,
finance and insurance is actually larger in China than in all of the other countries Wu examines—
including the United States and United Kingdom! So-called traditional services (wholesale, retail and
catering services) account for one-quarter of total Chinese service sector output, less than in India.
These statistics call into question whether Chinese services are really that hidebound.
Another contribution from Wu was to estimate, province by province for China and state by state
for India, the determinants of the share of services output in provincial (or state) total output. Wu
hypothesized that income per capita was correlated with a larger service sector share because richer
consumers spent more and more of their income on services. Moreover, he examined whether
urbanization was correlated with larger service sector shares. Interestingly, Wu found that the impact
of income-per-capita growth on the service sector’s share was similar in India and China, suggesting
that demand-related factors cannot account for differences in each country’s service sector
performance. Where a clear difference emerged was in the impact of urbanization on the service
sector’s share; in India a higher urbanization rate translates into a greater increase in the service
sector’s share than in China. Wu also presents evidence that greater service sector exports lead to a
higher share of total output accounted for by services. Interestingly, while Wu does comment on the
policy implications relating to service sector exports (greater openness), he does not discuss the
policy implications of his findings concerning urbanization. Fortunately, Au and Henderson (2005)
provide evidence that may help operationalize the link between urbanization and service sector size.
Au and Henderson were not interested in what factors determined the size of the Chinese service
sector. Instead, they asked the question, ―Are Chinese cities too small?‖ Drawing from the economic
geography literature, they hypothesized that there is an inverted-U relationship between real income
per worker in a city (a measure of productivity) and the number of employees in the city (a measure
of city size). At first as city size grows, the argument goes, the benefits of agglomeration, thick
labour markets, and increased specialization associated with the reorganization of firms and the
development of higher-end business services dominate and raise per capita incomes. Then at some
point the negative impacts of city size (congestion, environmental degradation and so on) reduce
productivity and welfare. Using data on Chinese city size and other variables, they seek to estimate
how large Chinese cities are compared with the size that would maximize per capita income.
Au and Henderson note that internal migration policies in China effectively constrain city size. In
2000 China only had nine cities (metropolitan areas) with populations over 3 million. In contrast,
125 cities had populations of 1 million to 3 million. These proportions are substantially out of line
with international benchmarks, with fewer large Chinese cities than the international norm. Au and
Henderson assembled data on 225 prefecture-level cities and reported that the manufacturing-to-
The Growth of China’s Services Sector and Associated Trade: Complementarities between Structural Change and Sustainability
36
service ratio tended to decline over time, especially after market reforms were introduced in the early
to mid-1990s. Their econometric estimates imply that between one-half and two-thirds of Chinese
cities were undersized (p. 35), whereas no more than 6 per cent of cities were oversized (p. 36). For
the undersized cities the unweighted average loss in output per worker was 30 per cent. Au and
Henderson conclude their paper as follows:
Allowing migration to these cities, as is now starting to happen, will allow them to
operate in much more efficiently. But that of course is only the tip of the iceberg.
The gains to migrants relative to their current wages in the rural sector would be
enormous. (p. 36)
The Au and Henderson study is relevant to this paper for several reasons. First, one of the principal
mechanisms through which increased city populations translate into higher per capita income is
through the development of specialized, higher-quality producer services. This was an explicit
feature of their approach. Second, although they did not examine the impact of variations in the
infrastructure of the cities they studied, the logic they develop implies that greater infrastructure
investment will raise the threshold level of population above which increased city populations lead
to congestion, etc., and lower per capita incomes. Third, while Au and Henderson recommend
relaxing the migration restrictions, their results are consistent with a joint policy recommendation of
relaxing migration restrictions into China’s smaller cities and increasing investment in those cities to
stave off the point when congestion, environmental degradation and the like lower per capita
incomes. Evidence such as this points the way to expanding the service sector without
compromising environmental sustainability.
Turning from comparative studies to country-wide evidence, in recent years robust connections
between service sector development and economic growth have been established by researchers (see
Hoekman and Mattoo, 2008, for an overview). Different service sectors contribute to the growth
process in different ways, and not just through the direct exports of services. More elaborate
financial services can reduce transaction costs and risk and better allocate resources across
competing activities (Levine, 1997). Low cost and reliable telecommunications sectors can help
diffuse knowledge and are often a prerequisite for firm membership in global supply chains.
Transportation, retail and distribution services all affect the costs of shipping and supplying goods,
including exported goods (Francois, 1990). The availability of specialized service sectors facilitates
the further division of labour as well as generating better-paying jobs. Services, then, implicate
economic performance through a number of channels.
Moreover, given that the upgrading of the Chinese manufacturing industry and the search for cost
economies, including resource-based ones, are stated objectives of China’s sustainable trade strategy,
The Growth of China’s Services Sector and Associated Trade: Complementarities between Structural Change and Sustainability
37
it is noteworthy that a growing body of research advances evidence that supports the benefits of
intensifying competition in national service sectors (see, for example, Arnold, Javorcik & Mattoo,
2006a; 2006b). Such competition could come from domestic or foreign sources, foreign taken here
to include the subsidiaries of foreign firms operating in China. Taken at face value, these research
findings call for the removal of all impediments to competition in service sectors when there is no
compelling public policy rationale not to do so. Evidence from both developing and industrialized
economies suggests that many service sectors remain sheltered from the full force of competition
and that substantial rents are created for incumbents, highlighting the scale of both the potential
economy-wide benefits and the likely opposition to reform.
The links between openness, service sector performance and growth are now better understood too.
Mattoo, Rathindran and Subramanian (2001) present evidence that countries whose financial and
telecommunications sectors are more open to foreign competition experience faster rates of national
economic growth. These findings suggest that service sector development objectives need not come
at the expense of openness, and that commercial policy-making might be able to play a role in
service sector development. However, experience at the WTO and in accessions to the European
Union demonstrate a marked reluctance of governments to undertake liberalization of their service
sectors in trade agreements; at most they seem only willing to bind preexisting reforms (Eschenbach
and Hoekman, 2006). Even so, 25 of the regional trade agreements signed by governments in the
East Asian region contain non-trivial service sector provisions, a finding that may be of particular
interest to Chinese policy-makers (Fink and Molinuevo, 2007).
Developing a competitive service sector, though, is not easy. Much of the literature on the service
sector in the industrialized countries is concerned with its slow productivity growth, especially
compared with agriculture and manufacturing (Baumol, 1967; Oulton, 2001; and Pugno, 2006).
Worse still, government policy is thought to have often held back the development of more efficient
service sectors in certain developing and industrialized economies; here, employment objectives
have tended to take priority over competitiveness considerations. Indeed, in France, Germany and
India, restrictions on shop size and the entry of new shops are supported by incumbent firms
wanting to avoid further competition, especially from large-scale retailers, and by governments that
fear job losses will result. Such interventions may appear to save jobs, but only in sectors, such as
local retailing, that are shielded from international competition. The development of an
internationally competitive services sector must proceed on a different basis (Inklaar, Timmer & van
Ark, 2007; Baily, Remes & Farrell, 2006).
The comparative and international evidence has pointed to a number of findings. First, that service
sector development, especially as it relates to business or producer services, is intricately linked to
urbanization. Policies that restrict the size of national cities are likely to hold back the development
The Growth of China’s Services Sector and Associated Trade: Complementarities between Structural Change and Sustainability
38
of critical mass and complementarities between firms. Second, that steps to limit competition or the
exploitation of service sector capabilities (like restrictions on shop opening hours) or economies
(such as shop size) will likely constrain productivity growth in the service sector.
The Growth of China’s Services Sector and Associated Trade: Complementarities between Structural Change and Sustainability
39
6.0 Options for Chinese policy-makers
The service or tertiary sector is already the largest economic sector in the Chinese economy. The
sheer scale of this sector ensures that its trajectory will have significant implications for economy-
wide performance in the years to come. This fact alone should focus policy-makers’ minds.
However, in this paper the goal is not just better economic performance but also compatibility with
a Chinese sustainable trade strategy that incorporates several policy goals.
The starting point for formulating policy recommendations is to recognize that the development of
high-quality services that are internationally competitive has be associated with the spatial and
organizational transformation of national economies. The demand for high-quality business services
has to come from somewhere. Typically such demand is concentrated in urban areas, where firms
can afford to specialize in specific tasks and functions because they know they can hire external
expertise to perform the tasks that the firm does not have a competitive advantage in completing.
Moreover, once certain cities and locations are known for specific types of services, they attract
ambitious persons seeking to make a career supplying those services. This deepens the labour pool,
creating more options for firms and allowing for even greater specialization. Competition intensifies
not only in the labour market but also in the market for specialized talent; the result is greater
innovation and higher standards. This cumulative dynamic has been studied in depth by economic
geographers, and we presented some of the evidence relating to China in the last section.
While the forgoing argument links living standards to service sector development and employment
growth, the link to environmental sustainability may be unclear. Once it is appreciated that the
principal constraints on the size of urban and suburban areas are infrastructure- and amenities-
related, then the outlines of a win-win-win policy recommendation emerges. One option for Chinese
policy-makers would be to relax controls on migration to cities of skilled personnel likely to work in
manufacturing or the service sector. This would set off the employment and productivity growth
dynamics (one win) and ultimately lead to higher-quality business services that can be exported
(another win). Simultaneous investments in infrastructure that reduces congestion and transit times
and improvements to amenities will raise the threshold beyond which living standards in cities begin
to diminish. As environmental amenities are an important part of a livable city, this would be the
third win.
In addition to improving the productivity and quality of business services, policy-makers need to
give attention to the more traditional forms of services, namely transportation and distribution. If
anything, the lessons for Chinese policy-makers from foreign experience are negative, in the sense
that policy-makers would not be advised to pursue some of the policies undertaken elsewhere. Some

The Growth of China’s Services Sector and Associated Trade: Complementarities between Structural Change and Sustainability
40
countries have effectively used their retail sectors as the employers of last resort, thereby limiting
shop size and competition from larger stores and foreign investors. This has proved to be a recipe
for poor choices, slow service and, ultimately, relatively lower wages. In general, attempts to restrict
competition and to avoid using information technology have not been successful. Instead the policy
recommendation, even if it is accomplished slowly over time, is to increase competition from
domestic and foreign sources in the service sector.

The Growth of China’s Services Sector and Associated Trade: Complementarities between Structural Change and Sustainability
41
References
Arnold, J., Javorcik, B. S., & Mattoo, A. (2006a). The productivity effects of services liberalization: Evidence
from the Czech Republic. Policy Research Working Paper 4109. Washington, D.C.: World Bank.
Arnold, J., Javorcik, B. S., & Mattoo, A. (2006b). Does services liberalization benefit manufacturing firms?
CEPR Working Paper 5902.
Au, C. C., Henderson, J. V. (2005). How migration restrictions limit agglomeration and productivity
in China. Journal of Development Economics. Retrieved from
http://www.econ.brown.edu/faculty/henderson/papers/China402.pdf
Baily, M., Remes, J., & Farrell, D. (2006). The hidden key to growth: How local services stimulate
economic expansion. International Economy, Winter 2006, 48–55. Retrieved from
http://www.mckinsey.com/aboutus/mckinseynews/pressarchive/pdf/TIE_W06_Bailey.pdf
Baumol, W. J. (1967). Macroeconomics of unbalanced growth: The anatomy of urban crisis.
American Economic Review, 57(3), 415–426.
Bosworth, B., & Collins, S. M. (2008). Accounting for growth: Comparing China and India. The
Journal of Economic Perspectives, 22(1), 45–66.
Burgess, R., & Venables, A. (2004). Toward a microeconomics of growth. World Bank Policy Research
Working Paper 3257. Retrived from http://www-
wds.worldbank.org/servlet/WDSContentServer/WDSP/IB/2004/05/04/000009486_20040504112
402/Rendered/PDF/wps3257toward.pdf
Eschenbach, F., & Hoekman, B. (2006). Services policies in transition economies: On the EU and
WTO as commitment mechanisms. World Trade Review, 5(3), 415–443.
Fink, C., & Molinuevo, M. (2007). East Asian free trade agreements in services: Roaring tigers or
timid pandas? In Trade issues in East Asia: Liberalization of trade in services. Washington, D.C.: East Asia
and Pacific Region Poverty Reduction and Economic Management, World Bank.
Francois, J. (1990). Trade in producer services and returns due to specialization under monopolistic
competition. Canadian Journal of Economics / Revue canadienne d'Economique, 23(1), 109–124.
The Growth of China’s Services Sector and Associated Trade: Complementarities between Structural Change and Sustainability
42
Francois, J., & Hoekman, B. (2009). Services trade and policy. CEPR Discussion Paper 7616. retrieved
from http://www.iadb.org/intal/intalcdi/PE/2009/04504.pdf
Hoekman, B., & Mattoo, A. (2008). Services trade and growth. World Bank working paper 4461.
Retrived from http://www-
wds.worldbank.org/servlet/WDSContentServer/WDSP/IB/2008/01/02/000158349_20080102162
022/Rendered/PDF/wps4461.pdf
Inklaar, R., Timmer, M., & van Ark, B. (2007). Mind the gap! International comparisons of
productivity in services and goods production. German Economic Review, 8, 281–307.
Jian, X., & Pei, C. (Eds.). (2004). Annual report on China’s service industry (No. 3). Beijing: Social Sciences
Academic Press.
Levine, R. (1997). Financial development and economic growth: Views and agenda. Journal of
Economic Literature, 35(2), 688–726.
Mattoo, A., Rathindran, R., & Subramanian, A. (2001). Measuring services trade liberalization and its impact
on economic growth: An illustration. Policy Research Working Paper Series 2655. Washington, D.C.:
World Bank.
Mayrand, K., & Paquin, M. (2007). Environmental assessment of services trade liberalisation, literature review.
Retrived from http://unisfera.org/IMG/pdf/Unisfera_-_EAs_of_Services_Trade_Liberalisation_
-_Literature_Review_19_April_2007.pdf
Ministry of Commerce of the People’s Republic of China (MOFCOM). (n.d.). Report on foreign direct
investment in China 2007. Retrived from http://www.fdi.gov.cn/pub/FDI/wzyj/yjbg/default.jsp
Ministry of Commerce of the People’s Republic of China (MOFCOM). (2007). Report on trade in
services development in China 2007. China Commerce and Trade Press.
National Development and Reform Commission & Ministry of Commerce of the People’s Republic
of China. (2007). Catalogue of industries for guiding foreign investment.
Oulton, N. (2001). Must the growth rate decline? Baumol’s unbalanced growth revisited. Oxford
Economic Papers, 53(4), 605–27.

The Growth of China’s Services Sector and Associated Trade: Complementarities between Structural Change and Sustainability
43
Pugno, M. (2006). The service paradox and endogenous economic growth. Structural Change and
Economic Dynamics, 17(1), 99–115.
State Administration of Taxation. (2007). Provisional regulations on business tax of the People’s Republic of
China. Retrieved from http://www.chinatax.gov.cn/n6669073/n6669088/6888583.html
Wu, Y. (2007). Service sector growth in China and India: A comparison. China: An International
Journal, 5(1), 137–154.