the health care landscape bill evans university of notre dame 1
Post on 20-Dec-2015
215 views
TRANSCRIPT

The Health Care Landscape
Bill EvansUniversity of Notre Dame
1

Two Goals
• Four issues every health care reform proposal should confront
• Outline what the recently passed legislation does for each of these issues
2

What issues must health care reform address?
• Access
• Cost (both the level and rate of change)
• Medicare
• Tax equity
3

4

Uninsurance rates, 2007
• Overall 15.3%• By race
– White, NH 10.4%– Black, NH 19.5%– Asian, NH 16.8%– Hispanic
32.1%• Nativity
– Native 12.7%– Naturalized 17.6%– Not citizen 43.8%
• Age– <18 11.0%– 18-24 28.1%– 25-34 25.7%– 35-44 18.3%– 45-64 14.0%– 65+ 1.9%
• HH income– <$25K 24.5%– $25-$50K 21.1%– $50-$75K 14.5%– >$75K 7.8%
5

% Firms offering health insurance
Firm Size 1999 2004 20093-9 56% 52% 46%10-24 74% 74% 72%25-49 86% 87% 87%50-199 97% 92% 95%200+ 99% 99% 98%
6

Uninsured Non-Elderly Population by Work Status of Family Head, 2007
7
Full-year,full-time worker,
66.7%
Full-year,part-
time worker, 6.6%
Part-year, full-time worker, 11.5%
Part-year, part-time
worker, 4.1%
Non-worker, 11.0%

What issues must health care reform address?
• Access
• Cost (both the level and rate of inflation)
• Medicare
• Tax equity
8

Expenditures on Medical Care
• Data for 2007
• $2.2 trillion on HC
• $7,400 per capita
• 16.2% of GDP
• Projected, 2018
• $4.4 billion
• $13,100 per capita
• 20.3% of GDP
9
10
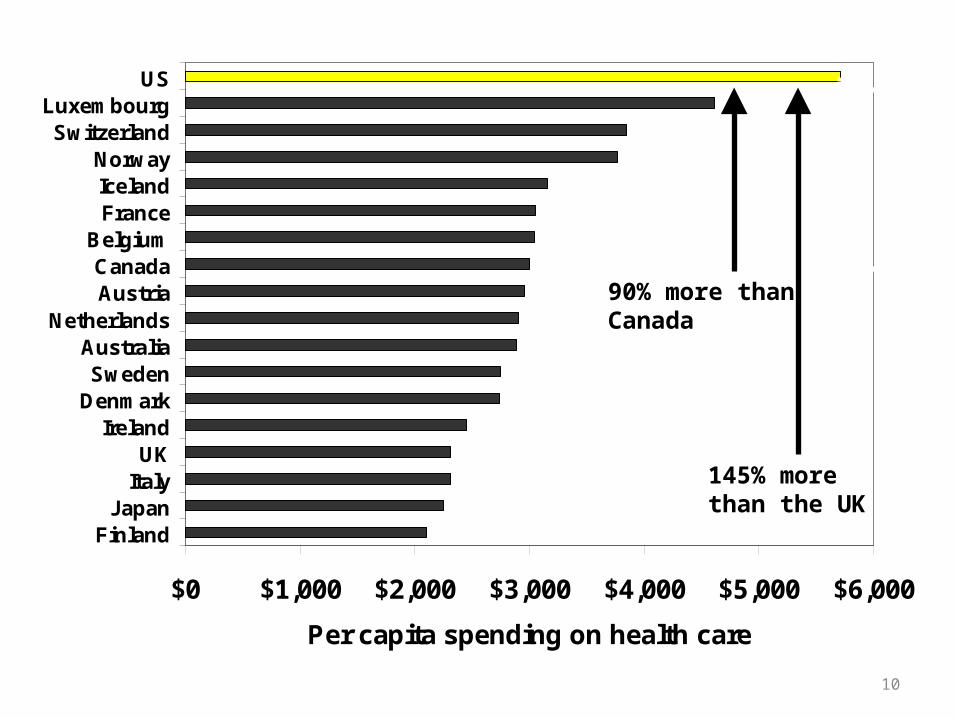
$0 $1,000 $2,000 $3,000 $4,000 $5,000 $6,000
FinlandJapan
ItalyUK
IrelandDenmarkSweden
AustraliaNetherlands
AustriaCanada
BelgiumFranceIcelandNorway
SwitzerlandLuxembourg
US
Per capita spending on health care
90% more thanCanada
145% morethan the UK

Average Annual PremiumsCovered Workers, 2008 (KFF)
• Individual plan– $4,704 total
• Family plan– $12,690
11

12
12.0%
18.0%
14.0%
12.2%
10.3%
8.5%
5.9%
4.0%
0.8%
3.0%
5.3%
8.2%
10.9%
12.9%13.9%
11.2%
9.2%
7.7%
6.1%5.5%
4.7%
0%
4%
8%
12%
16%
20%
1988 1990 1992 1994 1996 1998 2000 2002 2004 2006 2008
Perc
ent C
hang
e
Year
% Changes: Overall Inflation and Health Insurance Premiums
Overall Inflation Health Insurance Premiums

13
Price Changes, 1999 to 2008
29% 34%
119%
0%
40%
80%
120%
160%
Overall inflation Earnings Healthinsurancepremiums
Pri
ce C
han
ges

Bang per buck??
• US ranks 25 of 29 countries in life expectancy– 4.3 years shorter than Japan (highest)– 2.4 years shorter than Canada
• 24th worst of 28 countries in infant mortality– More than twice the rate of Japan (lowest)– 31% higher than Canada– 28% higher than UK
14

Are high expenditures a bad thing?
• A key driver of health care costs is technology
• MRIs/CT scans, angioplasty, anti-psychotropic drugs, hip/knee replacements, neo-natal intensive care, treatments for AIDS, statin drugs
• All not available 20-30 years ago. Now, commonplace
15

16
HIV/AIDS Drugs
• Early 1990s, 32% annual mortality rates for patients w/ AIDS
• 1995:4, 1996:1, three new ARVs
• Usage rates increase immediately
• Mortality falls 70% in 18 months

17
0%
20%
40%
60%
0%
3%
6%
9%
1994.1 1995.1 1996.1 1997.1 1998.1 1999.1 2000.1 2001.1
% U
sin
g E
piv
ir a
nd
/or P
I
% D
yin
g N
ex
t Qu
art
er
Year:Quarter
Quarterly Mortality Rate and Use of PI/Epivir
Epivir/PI
Mortality

18
• ARVs are expensive, $12K/year in some cases
• AIDS patients are expensive, $20K/year
• ARVs ↑ lifespan after diagnosis by 8 years
• Lifetime cost of treating an AIDS patient increases by about $256K

What is accurate picture of US?
• Innovator to the world – tremendous gains to new advances
• Wasteful spender of tremendous resources with little return
19

Fatality Rates 2000*
Homicide TrafficUnited States 7.3 15.3 Whites 3.2 Blacks 26.1Canada 1.4 9.3Germany 0.9 10.1Japan 0.6 8.3Sweden 1.2 4.9United Kingdom 0.7 6.0
20* Deaths per 100,000 people

Life Expectancy
Actual StandardizedUnited States 75.3 76.9Switzerland 77.6 76.6Norway 77.0 76.3Canada 77.3 76.2Germany 75.4 75.4Japan 78.7 76.0Sweden 77.7 76.1United Kingdom 75.6 75.7
21

5-year Cancer Survival Rates Country Breast
(Female)Cervical
(Female)Colon
(Male)Lung
(Male)Prostate
(Male)Thyroid
(Female)
US 82.8 69.0 61.7 12.0 81.2 95.9UK 66.7 62.6 51.0 7.0 44.3 74.4Dnmk. 70.6 64.2 39.2 5.6 41.0 71.7France 80.3 64.1 49.6 8.7 67.6 77.0Swed. 80.6 68.0 51.8 8.8 64.7 83.7Switz. 79.6 67.2 52.3 10.3 71.4 78.0
22

Heart Attack TreatmentCanada vs. US (2004)
• Category Canada US
• Angioplasty 11.4% 30.5%
• Bypass 4.0% 11.4%
• 5-year mortality 21.4% 19.6%
23

24

If you want to cut costs, where do you look?
• Administrative/overhead– 3% in Canada (single payer)– 1.5% in Medicare– 8-30% in US system
• Chronic conditions
• Unnecessary care
25

26
Percent of Total Health Care Expenses by Different Percentiles of Population, 2002
22%
49%
64%
80%
97%
0%
20%
40%
60%
80%
100%
1% 5% 10% 20% 50%
Percentiles of population
% o
f to
tal e
xp
end
itu
res

27
Per Capita Medicare Spending by Hospital Referral Region, 2006
$9,000 to 16,352 (57)8,000 to < 9,000 (79)
7,500 to < 8,000 (53)7,000 to < 7,500 (42)
5,310 to < 7,000 (75)Not Populated

What issues must health care reform address?
• Access
• Cost (both the level and rate of inflation)
• Medicare
• Tax equity
28

Medicare
• 2007
• 44.1 million recipients
• $432 bill. exp.
• 3.2% of GDP
• 16% of fed. budget
• 2040
• 87 million recipients
• 7.6% of GDP
• 30% of fed. budget
29
Future problems
• Rising number eligibles
• People are living longer– Older people spend a lot more on health care
• Rising costs
• Falling fraction of people to tax30

31
20.428.4
34.339.7
46.8
62.3
79.287.0
0
20
40
60
80
100
1970 1980 1990 2000 2010 2020 2030 2040
Mill
ions
of P
eopl
e
Year
Medicare Enrollment

32
13.9 14.315.2
16.417.2
18.018.7
10.410.9 11.0 11.2 11.3 11.4
12.0
6
8
10
12
14
16
18
20
1950 1960 1970 1980 1990 2000 2005
Rem
ain
ing
Yea
rs
Year
Remaining Life Years at Ages 65 and 75
At age 65
At age 75

Per Capita Health Care Spending by Age (2004)
Age GroupSpending
Per capitaO-18 $2,65019-44 $3,37045-54 $5,21055-64 $7,88764-75 $10,77875-84 $16,38985+ $25,691
33

34
5.5
4.7 4.5 4.3 4.0
3.22.6 2.5
0
1
2
3
4
5
6
1970 1980 1990 2000 2010 2020 2030 2040
Ratio
Year
Ratio: 20-64 Population/Medicare


What issues must health care reform address?
• Access
• Cost (both the level and rate of inflation)
• Medicare
• Tax equity
36

Tax System Equity
• EPHI a tax-free fringe benefit• WW II era program• Greatly reduces costs of HI to consumer
– Encourages more generous insurance
• Helps solve problem of adverse selection• Has encouraged the growth of EPHI
– 170 million have insurance through employers
37

Tax Benefit of EPHI
• A family w/ $70,000 in income• 36.4% marginal tax rate
– 25% federal– 3.4% state (Indiana)– ~8% Social Security and Medicare
• Want to purchase $12,000 policy in AFTER TAX DOLLARS
38

Without tax advantage:
• Receive $18,897 in income
• Pay 36.4% or $6,897 in taxes
• $12,000 left over for health insurance
• Net benefit of tax deduction is $6,897
39
Inequalities
• Costs Fed. Govt. over $243 billion/year• Tax break only available to people who
receive insurance from their firm– High income more likely to have insurance
• Higher income families have higher tax rates• Regressive tax
– Benefits much higher in upper income groups
40
41
Overview of Senate Bill
• Plan builds out from existing system• Tries to fill in the gaps in coverage• Large scale insurance industry reform
– Community rating– Eliminate pre-existing conditions
• Aggressive effort to reduce growth of Medicare fees
• Biggest unknown: controlling costs

Coverage Expansions
• Individual mandate (tax of 2.5% of AGI)• Pay or play: employer mandates• Expand Medicaid to 133% of FPL• Provide tax credits for the low income in
individual market• Establish health insurance exchange where
people can purchase insurance
42

Why is coverage mandatory?
• Insurance industry reform– Community rating– eliminate pre-existing condition clauses
• If adopted under current system– Costs for young would rise – exit system– Would not buy insurance until they needed it
• Forces low cost users into the system, drives down average cost
43

Impact on Uninsured
• Reduce uninsured by 32 mil. in 2019– 60% reduction in the uninsured– Leaves another 22 mil. uninsured– Uninsured will overwhelmingly be Hispanics
• Where coverage will come from
44

Pay or play
• Firms w/ >50 employees must offer qualified health insurance and pay $2000 tax/employee
• Tax incentives/credits for small firms to provide insurance
• Language is that firms must pay “fair share”• Economists believe workers pay for insurance
in the form of lower wages• Will firms pay or play?
45

CBO Estimates
• Fines will generate $20 bill per year
• @ $2000/head, 10 million not receiving health care from their firm
• There are roughly 16 million uninsured
workers
46
Financing
• New taxes: on insurance companies, drug makers, medical devices
• Increase Medicare tax on high income, tax unearned income for this group
• Revenues from firms paying and not playing• Tax on people without insurance• 40% tax on high-cost insurance• Reductions in Medicare reimbursements
47

• CLASS Act –long term care insurance program– Automatic enrollment– Starts in 2011. No benefits paid for 5 years
48

Balance Sheet – CBO 2010-2019(Billions of dollars)
• Expenditures
• Expand private $ 466
• Expand public $ 434
• Small firm TC $ 40
• Total $ 940
• Revenues
• Higher taxes$ 551• Reduced • Spending $ 507 • Total $1058
• Diff is $118 billion reduction in deficit
49

Revenues, 2010-2019(billions of $)
• Tax on high cost health care plans $ 32• Firm/individual taxes, no ins. $ 69• Expand taxes on Medicare $ 210• Reduce Medicare reimbursements $ 437• CLASS premiums $ 70• Tax on Rx/Med device/Ins. $ 107• Other taxes $ 133• Total $1,058
50

What is missing?
Cost controls
51

• No supply response at all– Catholic hospitals have become attractive
• Lots of studies – little guess of future
52

53

54
0%
10%
20%
30%
40%
50%
60%
1990 1993 1996 1999 2002 2005 2008
Per
cen
t
Year
Insurance rates, 1990-2009, Children 19 and Under< 200% of Federal Poverty Limit
Public

55
0%
10%
20%
30%
40%
50%
60%
1990 1993 1996 1999 2002 2005 2008
Per
cen
t
Year
Insurance rates, 1990-2009, Children 19 and Under< 200% of Federal Poverty Limit
Uninsured
Public

56
0%
10%
20%
30%
40%
50%
60%
1990 1993 1996 1999 2002 2005 2008
Per
cen
t
Year
Insurance rates, 1990-2009, Children 19 and Under< 200% of Federal Poverty Limit
Uninsured
Private
Public

57