the healthy, hunger-free kids act and high school obesity
TRANSCRIPT
Walden UniversityScholarWorks
Walden Dissertations and Doctoral Studies Walden Dissertations and Doctoral StudiesCollection
2015
The Healthy, Hunger-Free Kids Act and HighSchool ObesityDerek GrillsWalden University
Follow this and additional works at: https://scholarworks.waldenu.edu/dissertations
Part of the Public Health Education and Promotion Commons, and the Public Policy Commons
This Dissertation is brought to you for free and open access by the Walden Dissertations and Doctoral Studies Collection at ScholarWorks. It has beenaccepted for inclusion in Walden Dissertations and Doctoral Studies by an authorized administrator of ScholarWorks. For more information, pleasecontact [email protected].

Walden University
College of Social and Behavioral Sciences
This is to certify that the doctoral dissertation by
Derek Grills
has been found to be complete and satisfactory in all respects, and that any and all revisions required by the review committee have been made.
Review Committee Dr. Hilda Shepeard, Committee Chairperson,
Public Policy and Administration Faculty
Dr. Mi Young Lee, Committee Member, Public Policy and Administration Faculty
Dr. Joyce Haines, University Reviewer,
Public Policy and Administration Faculty
Chief Academic Officer Eric Riedel, Ph.D.
Walden University 2015

Abstract
The Healthy, Hunger-Free Kids Act and
High School Obesity
by
Derek K. Grills
Dissertation Submitted in Partial Fulfillment
Of the Requirements for the Degree of
Doctor of Philosophy
Public Policy and Administration
Walden University
August 2015

Abstract
United States high school student obesity rates have doubled in the past 30 years to 13%,
threatening the health of millions of adolescents. To mitigate the epidemic, Congress
passed the Healthy, Hunger-Free Kids Act (HHFKA) in 2010, which mandated
significant changes to school nutrition and physical education. From a public policy
perspective, the HHFKA changed school nutrition and exercise policy to affect obesity
rates by changing intake and energy expenditure at school, though no study using
national-level data examined this relationship. As such, the purpose of the study was to
examine whether HHFKA policy compliance had a statistically significant effect on high
school obesity rates. The theoretical framework for this study was the energy imbalance
theory (EIT), as developed by James Hill, Holly Wyatt, and John Peters. The research
questions focused on the relationship of HHFKA nutrition changes and childhood obesity
rates. The study used Pearson's Product-moment correlation to test for a simple
correlation between Compliance Scores and High School obesity rates. Findings
revealed no statistically significant correlation between state high school student obesity
rates and HHFKA compliance scores. Future research is needed to validate the findings
after more time has passed with the HHFKA mandates in effect. The implications for
social change include informing the debate over the efficacy of implementing the
HHFKA as currently written to mitigate childhood obesity.

The Healthy, Hunger-Free Kids Act and
High School Obesity
by
Derek K. Grills
Dissertation Submitted in Partial Fulfillment
of the Requirements for the Degree of
Doctor of Philosophy
Public Policy and Administration
Walden University
August 2015

Dedication
Although earning a Doctorate degree is an awesome personal triumph, my
children, Jourdan, Jalen, Jaide, Jaida, and Jewel, have made it one of the most worthwhile
accomplishments I could have ever achieved. I started this quest because I wanted to
show the world I was an exceptional person. I persevered through some of the most
difficult personal problems and finished only because of my desire to inspire and impart
in my children the confidence to do great things with their lives. I pray you are proud of
your Daddy and are encouraged to strive even higher.

Acknowledgments
I am so thankful for the people in my sphere of influence whose guidance,
encouragement, and wisdom enabled me to complete this dissertation and reach this
personal goal. First, I want to thank my Lord and Savior, Jesus Christ, without his
presence in my life, I could not do or become anything. Second, I want to thank my
mother, Carolyn Watson, who told me as a young boy that I came from greatness and I
had no choice but to be above average. Thank you for supporting me through my
toughest times and believing in my ability to do great things.
To my sister Dawn Carpenter, you and your life are an inspiration to me. I could
never thank you enough for being the perfect example I needed to see every day of my
life. For my Granny, Esther Cook, who always told me I worked too much and reminded
me to rest and take time for fun, thank you Granny. I would like to thank my committee
members, Dr. Shepeard, and Dr. Lee. I appreciate your time and commitment to
excellence throughout this process. Your questions, recommendations, and expertise
enabled me to develop and complete a quality research project. I would also like to thank
my friends, Dexter Williams and Jermaine Smith, who listened to me dream, never
doubted my capabilities, and encouraged me to finish no matter where life sent me.
Lastly, a sincere love, appreciation, and thanks goes to Catrina Grills. From the
very beginning, you encouraged me start a Doctoral program and always had the highest
confidence in my aptitude to finish. You saw this day before I did. When I was in doubt,
your confidence in me strengthened my desire to complete my coursework and this
dissertation.

i
Table of Contents
List of Tables ..................................................................................................................... iv
List of Figures ......................................................................................................................v
Chapter 1: Introduction to the Study ....................................................................................1
Introduction ....................................................................................................................1
Background ....................................................................................................................2
Problem Statement .........................................................................................................4
Purpose of the Study ......................................................................................................5
Research Question and Hypothesis ................................................................................6
Theoretical Framework ..................................................................................................6
Conceptual Framework ........................................................................................... 7
Nature of the Study ........................................................................................................8
Definitions......................................................................................................................9
Assumptions ...................................................................................................................9
Scope and Delimitations ..............................................................................................10
Limitations ...................................................................................................................10
Significance of the Study .............................................................................................11
Summary .....................................................................................................................11
Chapter 2: Literature Review .............................................................................................13
Introduction ..................................................................................................................13
Literature Search Strategy............................................................................................15
Theoretical Framework ................................................................................................17

ii
Energy Imbalance Theory ..................................................................................... 17
Rationale for Use of Energy Imbalance Theory ................................................... 23
Conceptual Framework ............................................................................................... 25
Childhood Obesity ................................................................................................ 26
Obesity Treatment Modalities ............................................................................... 32
Federal Government Intervention in School Nutrition ......................................... 33
Key Variables and Concepts ....................................................................................... 37
Dependent Variable – Childhood Obesity Rate .................................................... 38
Independent Variable – Compliance Score........................................................... 38
Childhood Obesity Intervention Research .................................................................. 42
Legislative-based Interventions ........................................................................... 44
School-based Interventions ................................................................................... 48
Summary .....................................................................................................................52
Chapter 3: Research Method ..............................................................................................54
Introduction ..................................................................................................................54
Research Design and Rationale ...................................................................................54
Population ............................................................................................................. 56
Sampling and Sampling Procedure ....................................................................... 56
Procedures for Data Collection ............................................................................. 57
Operationalization of Variables ............................................................................ 57
Data Analysis Plan ................................................................................................ 59
Threats to Validity .......................................................................................................60

iii
Chapter 4: Results ..............................................................................................................62
Introduction ..................................................................................................................62
Data Collection ............................................................................................................63
Results ......................................................................................................................... 64
Summary .....................................................................................................................73
Chapter 5: Discussion, Conclusions, and Recommendations ............................................74
Interpretation of Findings ............................................................................................75
No Significant Correlation between Compliance and Obesity ..............................74
Obesity Rate Correlated with Median Income and Rurality ................................. 75
Semi-compliant States had Higher Obesity Rates ................................................ 76
Limitations of the Study...............................................................................................77
Recommendations ........................................................................................................78
Implications and Conclusions ......................................................................................79
References ..........................................................................................................................80
Appendix A: Additional Key Search Terms ......................................................................91
Appendix B: Compliance Scoring Sheet ...........................................................................92
Appendix C: Compliance Score Tracking Spreadsheet .....................................................93
Appendix D: Study Variables by State ..............................................................................94
Curriculum Vitae ...............................................................................................................96

iv
List of Tables
Table 1. Variables, Scales of Measurement, Variable Type,
and Operationalization ................................................................................... 59
Table 2. Mean Obesity Rates and Compliance Scores ..................................................... 65
Table 3. Semicompliant States Data ................................................................................. 66
Table 4. Nationwide Grades 9-12 Breakfast Compliance ............................................... 67
Table 5. Nationwide Grades 9-12 Lunch Compliance...................................................... 68
Table 6. Study Variable Pearson Correlation Matrix ........................................................ 69
Table 7. Effect of Compliance Score on obesity after Controlling for
Median Income and Rurality ........................................................................ 70
v
List of Figures
Figure 1. 2011 High school student obesity rates by state ................................................29
Figure 2. Obesity prevalence rates by income, race and ethnicity .....................................30

1
Chapter 1: Introduction to the Study
Introduction
High school student obesity rates in the United States rose to epidemic
proportions between 1980 and 2011 (Ogden, Carroll, Curtin, Lamb, & Flegal, 2010;
Center for Disease Control [CDC], 2013). High School obesity rates more than doubled
from 5% in 1980 to 13% in 2011 (Anderson & Butcher, 2006; CDC, 2013). In an effort
to mitigate the epidemic, Congress passed federal school nutrition legislation called the
Healthy, Hunger-Free Kids Act (HHFKA) in 2010 (Federal Register, 2010). The HHFKA
significantly changed existing policy and created mandates for improving school nutrition
and exercise programs. The potential for using national school nutritional policy to
positively impact high school obesity is great. The National School Lunch Program
provides subsidized or free lunches to over 31 million schoolchildren each day attending
more than 100,000 public and private schools (United States Department of Agriculture
[USDA], 2011).
The HHFKA represents the first time the federal government has intervened in
school nutrition policy to influence childhood obesity rates. Pursuant to the HHFKA, the
USDA published the 2010 USDA Guidelines for Americans that created school nutrition
mandates (USDA, 2010a). This study tested for an association between compliance with
HHFKA regulations and high school obesity rates after controlling for median income
and population density (rurality). The study was needed because no broad-based studies
exist on the efficacy of using public policy to change high school obesity rates. The study
contributes to the body of knowledge on obesity interventions at time when obesity is an

2
epidemic. Chapter 1 defines the scope of the obesity epidemic, introduces energy balance
theory as a theoretical framework for understanding obesity interventions, and
summarizes the study methodology. Chapter 1 provides context for the study and
introduces the problem statement, research questions, theoretical framework,
significance, methodology, research design, assumptions, delimitations, and limitations.
Background
Childhood obesity is a complex phenomenon. United States obesity rates
dramatically increased nationwide despite the widespread recognition of the health risks
and related costs., Data from large-scale epidemiological studies have indicated that
obesity increases cardiovascular disease and diabetes, and reduces life expectancy
(Baker, Olsen & Sorensen, 2007; Burns, Letuchy & Witt, 2009; Owens, 2013). There is a
significant association between childhood obesity and race, income, home and school
environment, region of residence, socioeconomic status, ethnicity, certain states, and
regions of the country (CDC, 2013).
Research and theory regarding the causes of obesity suggest that obesity is related
to multiple interlinking factors (Skelton, Buehler, Irby & Grzywacz, 2010). Childhood
obesity was associated with biological factors such as genetics and metabolism (CDC,
2013); psychological factors such as mood, self-efficacy, coping and problem solving
skills; and environmental factors such as the increase in high calorie, low cost vegetable
oils and socio-economic status (Skelton et al., 2010). Furthermore, links between these
factors were investigated. For instance, research found an association between increased
stress levels and impaired metabolic functioning (Institute of Medicine [IOM], 2014).

3
Research on interventions to reduce childhood obesity was divided into three
categories: (a) individual behavioral (psyche-based), (b) parenting styles and family
dynamics (family-based), and (c) sociological (community-based), including schools. A
majority of the research utilized multifactor interventions in a school setting, including
changes in food intake, physical activity, sedentary behaviors, or combinations of these
(Gonzalez-Suarez, Worley, Grimmer-Somers, & Dones 2009; Katz, O’Connell, Njike,
Yeh, & Nawazet, 2009; Sobol-Goldberg, S., Rabinowitz, J., & Gross, R., 2013).
Treatment protocols included menu changes, physical education, skills building, behavior
modification, extracurricular activities, incentive schemes, and modification of the
overall food environment. Much of the research on school age obesity treatment included
parental involvement (Katz et al., 2009).
Gonzales-Suarez et al. (2009) conducted a meta-analysis of 26 quantitative
studies to evaluate the efficacy of school-based intervention programs on childhood
obesity. No significant reduction in childhood obesity was detected two years after the
interventions. The Gonzalez-Suarez et al. (2009) research design included only controlled
experiments, however a large number of confounding variables could not be controlled,
such as involvement of parents, school environment and culture, and after-school
compliance. Brown and Summerbell (2009) conducted a meta-analysis of 38 studies to
evaluate the effectiveness of school-based intervention programs on childhood obesity in
terms of BMI, absolute body weight, skin-fold thickness, and percentage of overweight.
The study concluded that school-based interventions to improve diet and increase
physical activity were inconsistent and short-term.

4
None of the studies included by Gonzalez-Suarez et al. (2009) and Brown and
Summerbell (2009) were large-scale, longitudinal studies. There was a gap in the
literature on the effectiveness of school-based nutrition programs to reduce childhood
obesity. This nationwide study was needed to evaluate the effectiveness of using school
nutrition policy to address the childhood obesity.
Problem Statement
The tripling of high school obesity rates threatens the health and welfare of U.S.
children and portends a future healthcare liability (Anderson & Butcher, 2006; CDC,
2013). High school obesity has a negative effect on morbidity and mortality in adult life
(Ogden et al., 2010) and 70% of obese high school students have one or more risk factors
for cardiovascular disease (CDC, 2013). The CDC, public policy makers, doctors, and
parents are vigorously searching for effective interventions to reduce obesity rates.
Obesity is a complex, multifaceted phenomenon with genetic, community,
family, and individual components (Burns et al., 2009; Owens, 2013). Obesity
researchers have found that ethnicity, race, SES, gender, and region of residence are
associated with obesity rates (Gonzales-Suarez et al., 2009). Causes of obesity included
genetics, energy imbalance, metabolic abnormalities, diet, and physical activity level. A
large number of small-scale, school-based obesity studies were conducted using
increased exercise, and improved dietary behaviors as interventions (Sobol-Goldberg, et
al., 2013). The study addressed a gap in the literature regarding the efficacy of using state
and federal school nutrition policy to affect high school obesity.

5
Purpose of the Study
The purpose of this quantitative study was to examine the relationship between
compliance with HHFKA regulations and state-level high school obesity rates. The
HHFKA represented the first attempt by the federal government to intervene legislatively
to address the growing obesity epidemic in the United States. The study was timely due
to the nationwide changes in school cafeteria menus during the 2013 - 2014 school year
and the widespread protest against those changes. The study used state school nutrition
policies in effect in 2007, measured their compliance with the HHFKA, and tested for a
correlation between compliance and state obesity rates. The supposition was that obesity
is a complex phenomenon and that changes in school cafeteria menus alone are unlikely
to affect high school obesity rates.
The study correlated state high school obesity rates with state policy compliance
with the HHFKA (compliance scores). The study dependent variable was state obesity
rates and the independent variable was compliance scores, as calculated by the
researcher. Covariates were median income and state population density, which were
shown in previous research to be predictive of obesity rates (Zhang, Zeng, Zhang, &
Wang, 2011).
Research Question and Hypothesis
RQ1: After controlling for median income and region of rural or urban residence,
is there an association between state high school student obesity rates and compliance
score?

6
H1o: There is no statistically significant correlation between state high school
student obesity rates and Compliance Scores, after controlling for median
income and degree of urbanization.
H1a: There is a statistically significant correlation between state high school
student obesity rates and Compliance Scores, after controlling for median
income and degree of urbanization.
Theoretical Framework
The study used Energy Imbalance Theory (EIT) as the theoretical framework for
understanding the phenomenon of obesity. Energy Imbalance Theory posits that
childhood and adult obesity is explained by a long-term, chronic imbalance between
individual energy intake and expenditure (Hill, Holly, Wyatt, & Peters, 2012). Human
energy intake comes from consuming protein, carbohydrates, fat, and alcohol. Humans
expend energy doing physical activity and in maintaining basic metabolic functions (i.e.
energy expended absorbing and metabolizing food). This study aimed to isolate the effect
of changing school lunch nutrition, or energy intake, and high school obesity rates. A
detailed examination of EIT and its potential to understand federal intervention in school
nutrition policy is conducted in Chapter 2.

7
Conceptual Framework
Obesity is a complex phenomenon. The rapid increase in U.S. obesity was
attributed to several emergent trends (Adair, Popkin, & Ng, 2012; Gonzales-Suarez et al.,
2009). First, changes in edible oil production led to cheap vegetable oils that were used in
inexpensive, fast food, which enabled low-income individuals to consume vastly more
energy at a very low cost. Second, technology reduced work-related energy expended
both labor-intensive and administrative occupations. Third, changes in transportation,
leisure, and home production (cooking, cleaning, childcare, etc.) also reduced physical
activity (Adair et al., 2012). These factors combined to create an energy imbalance in
favor of too much energy storage (Gonzales-Suarez et al., 2009). As a result, obesity
interventions were focused on increasing physical activity and modifying the quality and
quantity of energy to reduce intake (Shek, 2004).
The explicit goal of the HHFKA was to improve student nutrition and increase
physical activity to reduce nationwide childhood obesity rates (USDA, 2010). The study
aimed to test the efficacy of using federal public policy to reduce childhood obesity using
the EIT model. The supposition is that those states with school nutrition policy consistent
with 2010 USDA Guidelines (USDA, 2010), which mandates lower energy intake and
greater physical activity, have lower high school obesity rates. The research approach
was to test for differences in high school obesity rates after states adopted the 2010
USDA Guidelines.

8
Nature of the Study
The study used a quantitative methodology to address the research questions. In a
quantitative study, the hypotheses are either accepted or rejected based upon observable
results. There are many advantages to using a quantitative methodology: (a) there is a
clear identification of independent and dependent variables, (b) the research problem can
be clearly stated, and (c) there is the ability to achieve high levels of reliability because of
the controlled observations and the reduction in researcher bias (Leedy & Ormrod, 2012).
A causal research design and quantitative method are appropriate for examining the
research questions because the dependent and independent variables involve continuous
numeric data closely linked in time.
The study variables were compliance scores, degree of urbanization, high school
obesity rates, and median incomes. Compliance Scores were the actual number of
nutritional elements required by HHFKA present in each state’s nutrition policy
(NASBE, 2013). Compliance Scores were developed using the State School Health
Policy Database of the National Association of School Boards of Education (NASBE)
(NASBE, 2013). For the purposes of this study, degree of urbanization was the
percentage of the total state population that lives in urban areas, as defined by the Census
Bureau (Census Bureau, 2012). State high school obesity rates for 2011 were collected
from the Center for Disease Control website (CDC, 2012) and state median income and
rurality were collected from the Census Bureau website (Census Bureau, 2012).

9
Definitions
Compliance score: is the number of nutritional elements from the 2010 USDA
Guidelines present in 2007 state nutrition policy. Compliance score is the dependent
variable.
Degree of Urbanization: Degree of urbanization is defined as the percentage of
the total state population that lives in urban areas, using the Census Bureau definition of
urban (Census Bureau, 2012). Degree of urbanization is a mediating independent
variable.
High School Obesity Rate: High school obesity rate is the proportion of obese
high school students, by state, reported by the Center for Disease Control (CDC, 2012).
High school obesity rate is the independent variable.
Median Income: Median income is the amount reported by the Census Bureau for
each state (Census Bureau, 2012). Median income is a mediating independent variable.
Assumptions
The primary study assumptions were that state nutrition policy changes reflecting
2010 USDA Guidelines translate rapidly and accurately into actual changes in school
cafeteria breakfast and lunch menu choices. The study used a ceteris paribus assumption
for all unmeasured variables to isolate variance attributable to the independent variables.
It was assumed that there were no implementation delays at the school district level and
no variation in the degree of actual compliance. Potential variance from implementation
delays and regulation interpretation by individual school districts are topics for future
research.
10
Scope and Delimitations
The study tested for an association between compliance with HHFKA school
nutrition policy and high school obesity rates. Compliance scores, or degree of state
policy compliance with 2010 USDA Guidelines, were reflected in state policy
compliance. The compliance scores were based only on an analysis of state nutrition
policy, not school district policy, or actual school menu practices. The study was limited
to policy analysis, not actual menu nutrition compliance. The reason 2010 USDA
Guideline compliance was chosen was because school districts were required to meet
those requirements to receive their share of $11.7 billion of annual School Lunch
Program (USDA, 2012) subsidies. The magnitude of the economic incentive favored
compliance at the school district level and, as such, made it reasonable to assume school
districts would implement the guidelines.
The scope of the study was nationwide, which is consistent with the nationwide
impact of the 2010 USDA Guideline changes. The entire population of states nutrition
policies were tested using a standardized scoring system and the CDC definition of
obesity. The study findings might not be generalizable to other age groups, cultures, or
populations with differing ethnic composition (Leedy & Ormrod, 2012).
Limitations
The study was limited to one independent variable and two potential covariates.
Obesity is a complex phenomenon and studies have found SES, genetics, race, and a
number of psychosocial variables to be associated with obesity (Gonzales-Suarez et al.,
2009). Differences between states of these potential covariates had the potential to

11
confound the findings. Research showed considerable variation in nutritional content
between schools within a single district, and between school districts. Potential variance
in high school obesity rates not accounted for by the independent variables might limit
the validity of the results.
There was no potential for participant bias, and researcher bias was limited by the
use of factual data provided by reliable third parties, all of which are government
instrumentalities. The study’s nationwide scope and reliance on government data was
designed to maximize the usefulness of the findings.
Significance of the Study
The study aimed to evaluate the efficacy of the federal regulatory scheme to
address high school student obesity at a time when there are significant concerns about
the 2010 USDA Guidelines. The research results provided insights into the effectiveness
of using a federal school nutrition policy to effect obesity rates throughout all states. The
research was significant because it informed public policy makers at a time when high
school students were reducing their reliance on food provided under the 2010 USDA
Guidelines, and certain school districts were opting out of the guidelines and foregoing
federal subsidies because certain students were not willing to eat the food prescribed by
the legislation. The research suggested changes in nutrition policy for high school
students who had more flexibility than grade school students to eat outside food.

12
Summary
High school student obesity has become an epidemic over the past three decades.
The U.S. high school student obesity rate of 13% threatened adolescents’ health and
welfare, and portends rising healthcare costs (CDC, 2012). Congress passed the HHFKA
to reduce high school obesity by mandating improved student nutrition and increased
physical activity (USDA, 2010). The HHFKA represents the first time the federal
government has attempted to use school nutrition policy to affect obesity rates.
Obesity is a complex phenomenon with many potential causes and interventions.
Energy Imbalance Theory attributes the increase in obesity to a reduction in physical
activity and an increase in human energy intake (Hill et al. 2012). This quantitative study
tested for an association between compliance with state and federal nutrition regulations
and high school obesity rates, after accounting for the covariates of income and place of
residence. All 50 states were examined for compliance with the 2010 USDA Guidelines
and a correlation study was conducted to test the relationship with high school obesity.
Chapter 2 examines obesity research and theory, the legislative history of state and
federal nutrition regulation, and the efficacy of obesity interventions.

13
Chapter 2: Literature Review
Introduction
United States high school student obesity is an epidemic, reaching 13% in 2011
(Malik, Pan, Willett & Hu, 2013; CDC, 2013). High school obesity has a profoundly
negative effect on childhood health and welfare as well as adult morbidity and mortality
rates. Seventy percent of high school students diagnosed as obese have one or more risk
factors for cardiovascular disease (CDC, 2013). Congress passed the HHFKA in 2010 to
address the childhood obesity epidemic legislatively. Healthy, Hunger-Free Kids Act
increased minimum nutritional requirements for breakfast and lunch programs required
to qualify for federal funding under the National School Lunch Programs (SLP) (USDA,
2011). There is a gap in the literature reviewed for this study, on the relationship
between comprehensive school nutrition reform and high school obesity rates.
The purpose of this quantitative study was to examine the relationship between
compliance with HHFKA regulations and state-level high school obesity rates. The
research was significant because it examined the association between federal school
nutrition regulation and high school student obesity rates at a time while controversy
existed regarding implementation of the 2010 USDA Guidelines (CBS, 2014). The
controversy surrounded high school student complaints about the type and amount of
food available for breakfast and lunch under the 2010 USDA Guidelines (CBS, 2014).
The debate about the efficacy of the 2010 Guidelines was exacerbated by the lack of any
large-scale, longitudinal studies on the use of school nutrition policy to affect childhood
obesity rates. Existing studies on the use of school nutrition to affect obesity showed

14
mixed results and none found a significant treatment effect lasting two years (Brown &
Summerbell, 2009; Gonzalez-Suarez et al., 2009). The study findings informed inform
public policy makers at a time when some high school administrators are ignoring the
2010 USDA Guidelines because students are refusing to eat the food.
Childhood obesity threatens the health of America’s children and is a significant
driver in escalating healthcare costs (CDC, 2013: Malik et al., 2013; Thorpe, 2009). The
federal government passed the HHFKA to address the epidemic, representing an
enormous intervention affecting school meals for more than 45 million students each day
(USDA, 2011). The potential for using national school nutritional policy to address the
obesity epidemic is significant because of the large number of student meals served each
day under the SLP. However, research on the efficacy of using school nutrition policies
to address obesity problems is mixed (Brown & Summerbell, 2009). The literature
suggests school based interventions showed no improvement in obesity rates or students
who are overweight after two years (Brown & Summerbell, 2009). This research found
the most promising school nutrition intervention was the reduction of sugar-sweetened
drinks (James, Thomas & Kerr, 2007).
Chapter 2 reviews the literature on i) high school obesity, ii) government
intervention in nutrition, iii) federal, state, and local legislation and policy, iv) school
nutrition policy frameworks, and v) the historical effectiveness of school nutrition policy
to frame the analysis of the 2010 Healthy, Hunger-Free Kids Act (HHFKA). This
literature review traces the history of government intervention in nutrition, describes the
state and local regulatory environment affecting federal law, and evaluates theoretical

15
frameworks for nutrition policy. The goal of this study was to examine the association
between state school nutrition policy and high school obesity rates. Chapter 2 is
organized as follows: literature search strategy, the theoretical foundation, conceptual
framework, literature related to key variables and concepts, and a summary and
conclusion.
Literature Search Strategy
The following online databases were searched: Academic Search Premier,
EBSCOhost, ERIC, Google Scholar, ProQuest, and JSTOR. The following school
nutrition-related websites were searched: Action for Healthy Kids (AFHK), Center for
Disease Control and Prevention (CDC), Center for Science in the Public Interest (CSPI),
National Alliance for Nutrition and Activity (NANA), National Association of School
Board Executives, Robert Wood Johnson Foundation (RWJF), School Nutrition
Association (SNA), Trust for America’s Health (TAH), and United States Department of
Agriculture (USDA). Google search engine was used in all cases except when individual
sites or databases required the use of their internal search engine.
The development of keywords and key search terms was an iterative process.
Initially, databases and websites were searched using the following keywords: childhood
obesity, childhood obesity research, causes of childhood obesity, efficacy of school
nutrition intervention, federal nutrition laws and regulations, federal nutrition policy,
high school obesity, history of federal nutrition regulation, National School Lunch
Program, state nutrition policy, states’ rights, school nutrition policy, and USDA school

16
nutrition policy. Additional keywords and key search terms used later in the process are
listed in Appendix A.
The literature review included peer-reviewed journal articles, books, dissertations,
state and federal statutes, policies, and regulations, and related research. The period
reviewed was from 1990 to 2014, but drew on some earlier works in government
regulatory history, nutrition history, and nutrition theory. A total of 121 separate works
were reviewed, of which 76 were specifically referenced and 17 provided context.
Approximately 67 % of the studies were quantitative and the remaining 33% were
qualitative or theory. The research articles chosen for reference addressed childhood
obesity, obesity intervention studies, history of government nutrition regulation, nutrition
theory, and USDA regulation of school nutrition policy.
The 2010 USDA guidelines represent the first time in the nation’s history that
federal school nutrition legislation was used to influence childhood obesity. As such,
there is direct research on the relationship between federal school nutrition policy and
childhood obesity. Small scale, localized qualitative and quantitative research on school-
based nutrition intervention was summarized and analyzed in this literature review. In
the absence of recent large-scale research on the relationship between school-based
nutrition and obesity rates, this researcher chose to approach the analysis in two ways.
First, the current and historical federal and state interventions in school nutrition were
examined to provide context for the changes promulgated pursuant to the 2010 USDA
Guidelines. Second, an exhaustive examination was made of the research on school-
based interventions to effect change in obese and overweight schoolchildren.

17
Theoretical Framework
Energy Imbalance Theory
Energy Imbalance Theory (EIT) suggests that obesity is caused by a chronic
imbalance between energy intake and expenditure, over a period of years. The
relationship between energy intake, physical activity, and weight were first observed by
Mayer, Purnima, and Mitra (1956). Mayer and his colleagues hypothesized that human
physiology evolved during conditions wherein competitive advantage was conferred to
individuals for achieving energy balance at a relatively high, and sustained, level of
energy expenditure. The point at which human energy intake and expenditure achieved
balance occurred at high (but not excessive) levels of physical activity. Mayer observed
that energy intake seemed to be more consistently matched to energy expenditure for
those people who maintained relatively high levels of physical activity (Hill et al., 2012)
Propositions, hypotheses, and assumptions. The basic components of energy
balance include energy intake (food), energy expenditure (physical movement), and
energy storage. Given these assumptions, body weight changes occur when energy intake
and energy expenditure are not equal over some period of time. Human energy intake
comes in the form of protein, carbohydrates, fat, and alcohol. Humans expend energy to
maintain basic metabolic functions, which represents the quantity of energy expended
while the body is at rest, to fuel basic metabolic functions (i.e. the energy expended
absorbing and metabolizing food), and through physical activity. Resting Metabolic Rate
is a function of body mass, particularly the amount of muscle mass. The amount of
energy expended for the thermic effect of food is a function of total food consumed and

18
averages 8% to 10% of total energy intake. The quantity of energy expended by physical
activity equals the quantity of physical activity per unit of time multiplied by the energy
cost of that activity and the duration (Hill et al., 2012).
While there is a basic understanding of the physiological mechanisms involved in
achieving energy balance, research found the physiological control systems involved to
be quite complex (Lutes et al., 2012). Physical regulatory systems evaluate bodyweight
signals, energy stores, physical activity levels, and expected needs based on external
temperature and make changes to the amount of energy stored or expended as a counter-
weight if it senses an imbalance. The existence of a physiological regulatory system is
self-evident; absent such a system, body weight would be subject to wild short-term
swings. The stability of body weight from day to day is consistent with a physiological
control system governing energy balance (Hall et al. 2011).
The systems that regulate body weight modify metabolism to protect stored
energy and create relative long-term stability in body weight (Lutes et al., 2012). Hall et
al. (2011) found that the amount of energy necessary to lose one pound increases as body
mass decreases. In a sample of college students Hall et al. (2011) found that the standard
1 lb. of weight loss from each 3,500 kcal of negative energy balance did not hold as body
mass decreased body metabolism adjusts to the loss in body mass by slowing down to
restore equilibrium.
Because metabolism declines with loss of body mass (i.e. one component of
energy balance affects another), energy requirements are greatly reduced after significant
intentional weight loss. Metabolism, or RMR, can decrease 35% for a 10% weight loss

19
and 50% for a 20% weight loss. Therefore, rapid intentional weight loss requires
substantial and permanent behavioral change to maintain the loss. The dismal statistics
for individuals seeking long-term weight loss maintenance suggest that most people
cannot sustain the degree of behavior change necessary to keep weight off (Hill et al.,
2012).
Literature and research-based analysis. There is considerable debate in the
literature regarding the role that changes in physical activity play in the childhood obesity
epidemic (Swinburn, Sacks, & Ravussin, 2009). The timing of the rapid worldwide
increase in food availability and marketing coincides well with the dramatic increase in
body weight (CDC, 2012). Some research supports this view. The quantity of leisure-
time physical activity has not changed significantly, nor have measures of total energy
expenditure during the time period in which obesity rates increased (CDC, 2012). Critics
have suggested that the CDC (2012) analysis fails to account for the dramatic decrease in
activity due to rapid urbanization and industrialization during the first half of the 20th
century and immediately before the rapid increase in childhood obesity. The decline in
daily activity attributed to the advent of mechanized transportation, machinery to do
previously manual labor, and created the necessary conditions for a rapid increase of
obesity caused by an increase in food availability. In this view, it is not surprising that
total energy expenditure decreased in the early part of the century (Swinburn et al.,
2009).
Poor nutrition and physical inactivity are the leading causes of obesity and
represent the best opportunities for prevention and treatment (CDC, 2012c). Excessive

20
fast food, fewer homemade meals, and increased soda pop consumption are the key
factors contributing to childhood obesity. According to Shek (2004), individual weight
gain results from an imbalance between energy intake and energy expenditure. Obesity
occurs when the imbalance remains unchecked for a sustained period of time, frequently
decades. While the relationship seems obvious, there are important subtleties (IOM,
2014). First, research suggested that calorie intake and energy expenditure are linked, a
change in one tends to produce compensatory changes in the other. The compensatory
effect is important to understand in terms of designing interventions, it suggests that a
reduction in calorie intake does not necessarily lead to a reduction in obesity. Second,
due to the difficulty of accurately measuring energy expenditure, especially in children,
the relationship between dietary intake and energy expenditure (non-resting energy
expenditure) has not been demonstrated (IOM, 2014). Therefore, the relationship
between childhood obesity, diet, and exercise remains poorly understood. Since a
persistent energy imbalance is the endpoint in a process, interventions should consider all
biological and environmental factors that create an energy imbalance (IOM, 2014).
Approximately 5% of all obesity cases are attributable to genetics, specifically,
identifiable hormonal, syndromic, neurological, or single gene defects. Researchers have
suggested a significant genetic predisposition to obesity (Reilly, Ness, & Sheriff, 2007).
Twin studies have shown a high correlation of BMI in identical twins, in cases where the
siblings were reared apart. Certain prenatal exposures were also associated with
childhood obesity, such as maternal obesity, maternal gestational diabetes, and birth
weight. (Reilly et al., 2007). While the evidence for genetic factors play a role in

21
childhood obesity, it is clear that genetics are not responsible for the recent exponential
growth in obesity prevalence. After all, the human genome has not changed much in the
past 30 years. As a result, the focus of recent research is on interventions that concentrate
on behavioral, environmental, and societal factors. While genetics play a role in
childhood obesity, the gene pool does not change rapidly enough to account for the
global prevalence of overweight children. Much of the research reviewed for this study
sought to understand treatable causes for childhood obesity by investigating the
intersection of environment and behavior.
Energy intake. Excessive intake of energy nutrients was associated with an
increase of body fat depending on several factors, one of these factors being age.
(Wilborn et al., 2005). The common wisdom that a calorie is a calorie, and the
composition of nutrients being consumed had no effect on weight gain or loss, was as
been proven false. For example, a meal high in fat calories stimulates fat storage rather
than making nutrients available for consumption by activity. In addition, the
physiological process of depositing the fat into storage has a very low metabolic cost of
0% to 2% of calories deposited, whereas the thermic effect for carbohydrates and protein
is 6–8% and 25–30%, respectively (Wilborn et al., 2005). As such, protein requires the
greatest metabolic cost to be converted to, and stored as, fat. It follows that a diet high in
fat, holding calories constant, is associated with increasing both body weight and fat
deposits.
Significant research was conducted on the effects of the type of nutrients
consumed at identical energy intake levels and body weight. For example, Labayen, Diez,

22
and Gonzalez (2003) studied the effects of a high protein hypo-caloric diet versus a high
carbohydrate hypo-caloric diet in terms of subsequent weight loss. The authors concluded
that the replacement of carbohydrates with protein accelerated weight loss through fat
oxidation. Similar results were found when obese participants consumed either an ad
libitum high protein or high carbohydrate diet with fat intake kept constant in both
groups. Other researchers reported similar results regarding the efficacy and safety of a
high protein diet (Wilborn et al., 2005).
Research was conducted on the volume of energy intake per meal, satiation, and
subsequent energy intake. Hall et al. (2011) found that low-energy-dense foods like fruits
and vegetables increased satiety while simultaneously reducing energy intake. The study
suggested that diets emphasizing fruits and vegetables were more effective as a weight
loss strategy than fat reduction diets, or decreased portion size diets. Epstein, Gordy, and
Raynor (2009) found that obese individuals that increased the proportion of fruit and
vegetable intake lost significantly more weight than individuals on low fat/low sugar
diets.
Energy expenditure. The components of energy expenditure are metabolic rate,
the thermic effect of food, and physical activity. Physical activity is further divided into
two distinct sub-classes: (1) activity-related thermogenesis (volitional exercise); and (2)
non-activity related exercise thermogenesis (activity not related "sporting-like" exercise)
(Hill et al., 2012). Activity thermogenesis accounts for between 15% and 50% depending
on the overall level of sedentary activity. Castaneda, Jurgens, and Wiedmer (2009)
reported a close correlation between minimal amounts of spontaneous physical activity

23
and the accumulation of fat for both adults and children. Epidemiological studies found a
significant relationship between physical activity and weight (Hall et al., 2011). In
addition, a meta-analysis demonstrated that aerobic exercise was an effective method to
reduce body fat and increase lean muscle mass.
Physical activity changes body composition and promotes weight loss. Sedentary
lifestyle is the single best predictor of childhood obesity. A study conducted by Hill et al.
(2012) found that individuals who engaged in at least 30 minutes of physical activity at
least four days per week were less likely to be obese and had a myriad of other health
benefits as well. In a monozygotic twin study, Swinburn, Sacks and Ravussin (2009)
reported significant differences in BMI between sedentary and active twins, suggesting
that activity level is a more important determinant in body composition than genetics.
Increasing physical activity and total energy expenditure was shown to prevent and treat
obesity. Hill et al. (2012) found that 29% of all adults do not devote any time towards
leisure time physical activity.
Rationale for Use of Energy Imbalance Theory
The 2010 USDA Guidelines significantly changed the energy intake and energy
expenditure for nearly all U.S schoolchildren and represented a unique opportunity to
examine the relationship between childhood obesity rates and the EIT (Federal Register,
2010). While obesity is a complex multifaceted disease, the federal government
intervention is only changing energy intake and level of required physical activity at
school, both addressed by the EIT. This was the first time the federal government used
its authority under the Student Lunch Program to affect childhood obesity rates.

24
While there is considerable research on EIT, there was no research on the
relationship between school nutrition policy and childhood obesity rates. For the first
time, Congress is utilizing federal school nutrition policy to affect childhood obesity
rates. The 2010 USDA Guidelines applied mandates to both energy intake and energy
expenditure. Energy intake is affected by a reduction in the total calorie count for
breakfast and lunch, and nutrient composition is changing in favor of fruits and
vegetables (Ello-Martin, Ledikwe, & Rolls, 2005). Energy expenditure is affected by a
mandate to increase the amount of time each child is required to exercise and/or engage
in vigorous physical activity. Taken together, the USDA mandates were an attempt to
change the energy balance for schoolchildren, a clear experiment using the EIT.
The 2010 USDA Guidelines represented significant changes to nutrition and
exercise mandates for all schools receiving money under the School Lunch Program,
which is effectively 100% of all US High Schools and Grade Schools. The result was a
large-scale longitudinal study using at least 37 million schoolchildren as participants
(USDA, 2012). This study may be the first of many with the aim of measuring the effect
of the HHFKA on childhood obesity rates.
The research question for the study was: After controlling median income and
region of residence (rural or urban), are high school student obesity rates associated with
compliance with the 2010 USDA Guidelines? The choice of the EIT was based on the
research question; the core of the 2010 USDA Guidelines is a decrease in energy intake
and an increase in energy expenditure. The study extended the EIT from experiments
with relatively small samples to a nationwide study of schoolchildren in all 50 states.

25
While this study came relatively early in the history of the 2010 USDA Guidelines, there
was sufficient history to begin to see changes, if any, resulting from the changes. This set
of facts presented a unique opportunity to test the EIT on the entire population, rather
than a sample.
Conceptual Framework
There were two separate concepts, or phenomena, related to this study. First, the
phenomenon of childhood obesity, its causes, prevalence, and factors associated with the
diagnosis were examined. Second, the history, experience, efficacy, and mechanisms for
federal intervention in school nutrition were examined. The following sections examine
childhood obesity and federal government involvement in school nutrition as it relates to
the changes promulgated by the HHFKA and the 2010 USDA Guidelines. Childhood
obesity is defined, and its health consequences, prevalence, costs to society, and risk
factors are discussed (CDC, 2012). After that, the roles of the federal government, state
government, and the school, in implementing federal school nutrition legislation and
policy, are examined. The 2010 USDA guidelines represented the first time in the
nation’s history that federal school nutrition legislation was used to influence childhood
obesity. Because this was the first time the federal government was using school nutrition
policy to influence childhood obesity there was no direct research to compare and
contrast to this study. As such, the structure of the Conceptual Framework section
discusses childhood obesity first and federal nutrition policy second.
Childhood Obesity

26
The term obesity is defined as the excess accumulation of body fat, which
places an individual at increased health risk (CDC, 2012). The CDC defines obesity
using the Body Mass Index (BMI). Body Mass Index is a ratio of weight and height, and
is used to calculate the fat composition in one’s body. Once the BMI is calculated, the
result is compared to the BMI-age percentile lines for the appropriate age and sex
combination, an example of which is shown in Figure 1. The CDC considers a high
school student to be obese if their BMI is at, or above, the 95th percentile (CDC, 2012).
Health consequences of childhood obesity. Obese high school children are at
risk for severe physical and emotional malformations. Physical conditions include type 2
diabetes, heart disease, hypertension, and various related diseases. Obese children are
frequently the target of bullying and name calling which sometimes leads to serious
psychosocial disorders. Thorpe (2009) called obesity the greatest health risk facing high
school age children in the past 100 years. For the first time in U.S. history, a child’s life
span is expected to be shorter than their parents (CDC, 2012).
Significant epidemiological evidence exists for the association between
overweight and obesity, and cardiovascular risk factors in childhood and later in
adulthood (Baker et al., 2007; Burns et al., 2009; Owens, 2013). A sample of 9,167
children ages 5 to 17 were examined in seven cross-sectional studies conducted by the
Bogalusa Heart Study. The study found significant odds ratios for hypertension, and
raised serum lipids were reported in both 5-10 year old and 11-17 year old obese
children, and approximately 60% of the obese children had at least one cardiovascular
risk factor (Owens, 2013).
27
Two large, long-term cohort studies provided significant evidence for the
association between childhood obesity and adult cardiovascular morbidity and mortality
(Baker et al., 2007; Burns et al., 2009). The Harvard Growth Study followed up a cohort
of 508 adolescents for 55 years and found an increased risk of cardiovascular mortality in
men who had been overweight as adolescents, but not for women (Burns et al., 2009).
The retrospective cohort study of 276 Danish children aged 7-13 reported an increased
risk of both fatal and non-fatal cardiovascular events in adulthood with increasing BMI.
The results were found to be consistent across the entire BMI distribution. Based on the
sample size and duration of the studies, there are significant health risks for obese
children. There are societal costs in addition to individual cost of childhood obesity
(Burns et al., 2009).
The relationship between obesity, metabolic syndrome, and Type II diabetes has
been well characterized in adult populations (Thorpe, 2009). Adults with metabolic
syndrome have a fivefold increased risk of developing Type II diabetes. Obesity and
metabolic syndrome are also risk factors for developing childhood Type II diabetes. The
dramatic rise in prevalence of overweight and obesity in children seen in the last 3
decades has been accompanied by the emergence of childhood Type II diabetes. In the
United States, Type II diabetes in now thought to account for around 30-45% of pediatric
diabetes, whereas historically, this proportion was only 5%. The proportion of children
with Type II diabetes who are overweight or obese is approximately 90%, compared to
25% of those with Type I diabetes (Strange, 2010).

28
Factors effecting childhood obesity. Childhood obesity has been associated
with biological factors such as genetics and metabolism (CDC, 2012); psychological
factors including mood, self-efficacy, coping and problem solving skills; and
environmental factors for example, the impact of the food industry, and placement of
local food stores within neighborhoods and socio-economic status (Wilborn et al., 2005).
Furthermore, links between these factors have also been investigated. For instance,
research found an association between increased stress levels and impaired metabolic
functioning (Wilborn et al., 2005). Together this indicates the level of complexity
involved and the potential for nutrition policy to affect obesity rates.
Geographic disparities in high school obesity rates. The prevalence of high
school obesity in the United States varies substantially across geographic regions and
between individual states. As shown in Figure 1, the highest prevalence of obesity for
high school students in 2011 was the South central region at 15%+, while the Mountain
states reported the lowest obesity rates. High school students in Kentucky, North
Carolina, Texas, Tennessee, and West Virginia (17% +) had double the obesity rate of
Colorado high school students (CDC, 2013).

29
Figure 1: 2011 High school student obesity rates by state (CDC, 2013).
The potential for using national school nutritional policy to impact childhood
obesity is substantial because children spend a significant proportion of their time in
school. According to 2009 Census Data, the National School Lunch Program subsidizes
31.5 million of the 48.5 million children attending school in Grades K–12 (Census
Bureau 2012). As a result, national school lunch policies impact all schools’ nutrition
policies by linking NSLP subsidies with the 2010 USDA Guidelines (USDA, 2010).
Demographic risk factors. Figure 3 reports the prevalence of obesity among
adults aged 20 years and over, by poverty income ratio, sex, and race and ethnicity as of
2008. The analysis uses three ranges of poverty income ratio (PIR) to segment the
population. The highest income group was defined as household income ≥ 350% of the
poverty level income; the middle income group was defined as household income ≥130%
and less than 350% of the poverty level income; the lowest income group was defined as

30
household income < 130% of the poverty level income. Approximately 35.7% of all U.S.
adults were obese. The obesity rate among all women was 42.6% versus 34.1% for all
men. The obesity rate was 31.0% for the high PIR group, 36.8% for the medium PIR
group 36.8%, and 35.6% for the low PIR group. Obesity prevalence among all African
Americans was 43.7% and 51.3% for all African American women. Obesity rates among
all Mexican Americans were 37.7% and 41.6% for Mexican American women. The
highest obesity rates were reported for African American women for all PIR groups
(CDC, 2013).
Figure 2. Obesity prevalence rates by income, race and ethnicity (CDC, 2013)
Surgeon General David Satcher stated that the obesity crisis calls upon
individuals, families, communities, schools, worksites, organizations, and the media to
work together to build solutions to bring better health to everyone in this country
(USDHHS, 2001). Surgeon General Satcher added that:

31
Dealing with overweight and obesity is a personal responsibility as well as a
community responsibility. A lack of safe places for children to play and
adults to walk, jog, or cycle is a community responsibility. If school
lunchrooms do not offer healthy and appealing foods, that is a community
responsibility. When we do not require daily physical education in our
schools, it is a community failure. (USDHHS, 2001, p. xiii)
These words provided the context for federal intervention to reduce childhood
obesity using the 2010 USDA Guidelines and subsequent threat to withhold NSLP
funding for failure to adopt those guidelines. However, there was significant controversy
surrounding the use of federal school lunch policy to affect obesity and children’s eating
habits (CDC, 2006, SNA, 2010).
For example, the school lunch boxes at West Hoke Elementary School in Raeford,
North Carolina were subject to daily inspection by teachers and state inspectors (Civitas
Institute, 2014). A government inspector determined a kindergarten student’s homemade
lunch did not meet nutrition requirements. While the 4 year-old was permitted to eat her
home lunch, the girl was forced to take a helping of chicken nuggets, milk, a fruit, and a
vegetable as a supplement. The family’s school account was charged for the meal. The
incident raised the fundamental question of who has the responsibility to make nutritional
decisions for the nation’s children (Perryman, 2011).
Subject to some basic moral boundaries, parents have the exclusive right to raise
their children as they wish, and the responsibility to protect their children from harm
32
(Perryman, 2011). The ethical dilemma occurs when a child becomes obese. Does the
government have the right to intervene and make nutrition choices for those children?
Mermin and Graff (2009) state that obesity is a disease and therefore a public health
issue. As such, the government has the authority to use their police power to promulgate
laws and regulations to counter obesity. On the other hand, civil libertarians take issue
with state police power trumping parental rights (Perryman, 2011; Ryan et al., 2007).
Where does the right to intervene end and parental rights begin? What about children
that are not obese, where does the governments’ right to regulate their nutrition emanate
from? Moreover, does the government even have a right to inspect the lunch box of a
healthy, normal kindergarten girl? (Perryman, 2011).
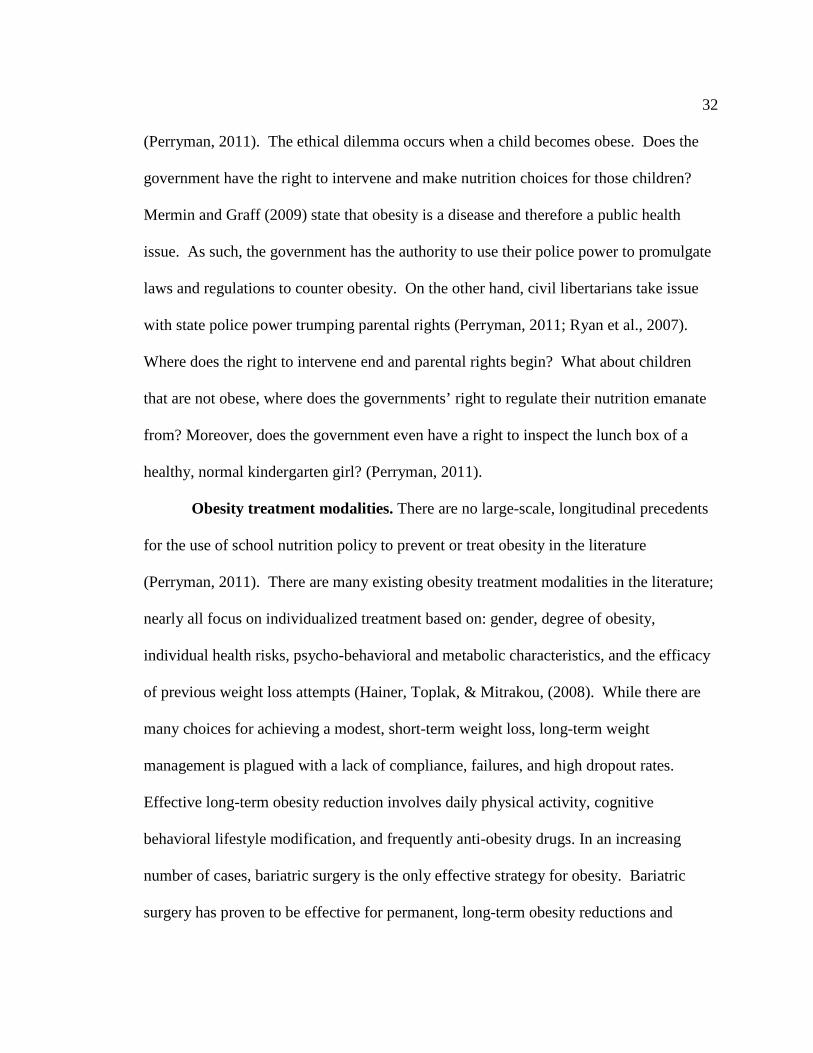
Obesity treatment modalities. There are no large-scale, longitudinal precedents
for the use of school nutrition policy to prevent or treat obesity in the literature
(Perryman, 2011). There are many existing obesity treatment modalities in the literature;
nearly all focus on individualized treatment based on: gender, degree of obesity,
individual health risks, psycho-behavioral and metabolic characteristics, and the efficacy
of previous weight loss attempts (Hainer, Toplak, & Mitrakou, (2008). While there are
many choices for achieving a modest, short-term weight loss, long-term weight
management is plagued with a lack of compliance, failures, and high dropout rates.
Effective long-term obesity reduction involves daily physical activity, cognitive
behavioral lifestyle modification, and frequently anti-obesity drugs. In an increasing
number of cases, bariatric surgery is the only effective strategy for obesity. Bariatric
surgery has proven to be effective for permanent, long-term obesity reductions and

33
overall mortality improvements of 25–50%. Obesity treatment should be individually
tailored and the following factors should be taken into account: sex, the degree of obesity,
individual health risks, psycho-behavioral and metabolic characteristics, and the outcome
of previous weight loss attempts. In the future, an evaluation of hormonal and genetic
determinants of weight loss could also contribute to a better choice of individual therapy
for a particular obese patient. A multilevel obesity management network of mutually
collaborating facilities should be established to provide individually tailored treatment.
Federal Government Intervention in School Nutrition
For the purposes of this study, government intervention refers to the following
laws and regulations. It is necessary to understand the history and operation of federal
and state law to examine the mechanisms for the federal government intervention in what
is a local decision, the school lunch menu. Through the passage of the HHFKA and
subsequent publishing of the 2010 USDA Guidelines, the federal government is
intervening in school nutrition to affect childhood obesity. Public policy intervention in
school nutrition dates back nearly 100 years. Until 2010, all previous government
intervention in school-based nutrition was designed to provide food to impoverished
children and address a lack of nutrition. The 2010 USDA Guidelines was the first effort
to reduce the number of calories and shift consumption toward fruit and vegetables while
reducing fat content. The history is provided here as context for the USDA 2010
intervention aimed at reducing obesity.
Proper nutrition promotes the optimal growth and development of children and
supports the goal of reducing overweight and obese children (USDA, 2010). Schools are

34
well positioned to promote healthy eating habits and promote physical activity to address
the obesity epidemic (USDA, 2012). Congress passed the HHFKA and the USDA
published the 2010 USDA Guidelines to improve the nutrition of food served in schools.
These actions further regulated the distribution of $11.1 billion of state subsidies under
the SLP. The rules extend beyond the confines of the cafeteria to vending machines,
snack bars, school stores, and other venues that offer food and beverages to students. In
addition, the new guidelines cover nutrition education and physical activity as part of a
comprehensive obesity solution (USDA, 2012). School nutrition policy is a states right
that led to a wide variety of nutrition policies in schools between states. Some states
already met the 2010 USDA Guidelines for an extended period of time before passage
2014.
History. The National School Lunch Act (NSLA) of 1946 provided states with
commodity and cash support so that they, in turn, can provide nutritious school lunches to
children, free, or at a reduced cost. The purpose of the NSLA is twofold: (1) to provide
nutritious meals to schoolchildren and (2) to support America’s agriculture markets by
donating surplus commodities for school lunches. There are three legislative acts that
gave the USDA authority to purchase commodities for the school lunch program: (1)
Section 6 of the Richard B. Russell National School Lunch Act, (2) Section 32 of the
Agriculture Act of 1935, and (3) Section 416 of the Agricultural Act of 1949. All three
Acts give the USDA control over nutrition. Pursuant to the legislative acts, schools used
two groups of commodities in their meal programs: Group A Commodities include
perishables: beef, pork, fish, poultry, egg products, fruits and vegetables. Group B

35
Commodities include nonperishables: cereals, grains, peanut products, dairy products,
and oils. An agency of the USDA may purchase items from these groups to limit surplus
and stabilize prices (USDA, 2012). In addition to commodities, the USDA provided
states with a cash reimbursement based on the number of lunches served and family need
(USDA, 2012). Today, because of USDA involvement, “Over 31 million school children
receive a nutritious school lunch each school day in over 100,000 participating public and
private nonprofit schools and institutions” (USDA, 2007, p. 2).
The language of the Dietary Guidelines continued to morph through the 1980’s
and early 1990’s until the publication of the 1992 Food Guide Pyramid. This guide
introduced seven groups in a hierarchical graphic, a pyramid, with the least servings; i.e.,
foods to be used sparingly – fats, oils, and sweets -- at the top and the most servings (6-11
daily) --bread, cereal, rice, and pasta -- at the bottom, or foundation, of the pyramid.
Since the publication of the Food Pyramid in 1992, the serving sizes of all seven groups
have not changed except that the daily meat group servings went from 2-3 servings of 5-7
ounces to 2-3 servings of 4-9 ounces. The “meat group” includes meat, poultry, fish, dry
beans, eggs, and nuts.
In 1994, Congress passed the Healthy Meals for Healthy Americans Act
(HMHAA). This Act required all meals under the NSLP and SBP to meet the HMHAA
Dietary Guidelines (DGA) (USDA, 2007). After the passing of the Healthy Meals Act,
the USDA published a manual, The Road to SMI Success. The purpose of this manual
was “to help foodservice directors, supervisors, and managers successfully implement the

36
USDA’s School Meals Initiative for Healthy Children (SMI) regulations within the scope
of daily practice” (USDA, 2007, p. 1).
None of the history of government legislation or the creation of the 2010 USDA
Guidelines is associated with any theory of childhood obesity. Every five years experts
study the DGA and issue a report. The DGA is technical, scientific, and written for
policymakers, nutrition educators, nutritionists, and healthcare providers. It contains a
vast amount of information not intended for the general public to comprehend; rather,
“The intent of the Dietary Guidelines is to summarize and synthesize knowledge
regarding individual nutrients and food components into recommendations for a pattern
of eating that can be adopted by the public” (USDA, 2007, p. vi).
State’s role. While school nutrition regulation is considered a states’ right, in
order to receive part of the $11.1 billion of federal subsidies, each state had to adopt the
2011 NSLP guidelines. Under the HHFKA, the USDA published nutrition guidelines,
2010 USDA Guidelines, which constitute federal nutrition policy. The federal
requirements NSLP guidelines include: 1) nutrition guidelines, 2) physical activity, 3) a
plan to implement the policy, and 4) must involve parents, students, the school board,
school staff, and the community. The 2010 USDA Guidelines do not “tell schools what
foods to serve, nor does it spell out how much physical activity students must receive”
(Buchanan, 2005, p. 5), however the USDA withholds NSLP subsidies for failure to
comply with the guidelines. As a result, each state must create its own nutrition policy
legislation.

37
Some states have taken seriously the need to develop state nutrition policy beyond
the minimum federal requirements; other states have adopted, practically verbatim, the
federal language into their own policy. Arizona banned the sale of junk food and soda
machines at the elementary and middle school level in 2004, Oklahoma prohibited
serving foods of minimal nutritional value in elementary schools. It also required
elementary students to have at least 60 minutes of physical activity weekly. North
Carolina requires K-8 students to have 30 minutes of physical activity each day
(Buchanan, 2005). The Connecticut House and Senate passed legislation removing sodas
and junk food completely from all schools and requiring 20 minutes of daily physical
activity for all students (Buchanan, 2005).
Key Variables and Concepts
The literature on childhood obesity suggests that race, income, home and school
environment, region of residence, socio-economic status, and ethnicity have a significant
effect on obesity rates (CDC, 2012). For instance, Katz et al. (2006) found that rural
children in North Carolina were 54.7% more likely to be overweight or obese then urban
children. While there are a large number of studies on local school-based obesity
interventions (CDC, 2012; Katz, et al., 2009), there is a gap in the literature on the impact
of community-level obesity intervention. The purpose of this quantitative study was to
examine the relationship between compliance with HHFKA regulations and state-level
high school obesity rates. The study used a quantitative methodology to address the
research question.

38
Dependent Variable – Childhood Obesity Rate
The CDC defines childhood obesity as a BMI at or above the 95th percentile for
children of the same age and sex. For the purposes of this study, CDC reported childhood
obesity rates were used.
Independent Variable – Compliance Score
The following section defines, in detail, the 2010 USDA Guidelines that aim to
reduce energy intake and increase energy expenditure. The Methodology requires each
state in the sample reviewed for the degree to which their school nutrition policies meet
the 2010 USDA Guidelines. The independent variable, State Compliance, represents the
extent to which a state nutrition policy is consistent with the 2010 USDA Guidelines.
The 2010 USDA Guidelines represent an unprecedented, nationwide experiment
in the use of school nutrition policy to reduce childhood obesity rates. For the purposes of
this study, the changes from the 2005 USDA Guidelines to the 2010 USDA Guidelines
are a “treatment” which has been unevenly implemented across the U.S., thereby creating
an opportunity to test for an association between the degree of compliance with the 2010
USDA Guidelines and local high school obesity rates. Each state must pass legislation
and regulations to implement the 2010 USDA, while they can add or accelerate policies
or practices they deem appropriate and in their best interest to promote student nutrition.
This state-level latitude created significant differences between states in the actual school
nutrition policies, which are significant. The impact of the changes to school nutrition
policy mandated by the 2010 USDA guidelines are filtered through the myriad state and
local nutrition policies (i.e., 50 states, plus all public school districts within those states;

39
New Jersey, for example, has over 600 school districts). The state-level discretion created
large variances in school nutrition policy. For instance, Arizona implemented
substantially all of the 2010 USDA Guideline changes as early as 2005.
The 2010 USDA Guidelines for school breakfast and lunch programs were phased
in over time and were required to be 100% operative for the school year ending in 2014.
The energy intake requirements are as follows:
1. Control total calorie intake to manage body weight.
2. Reduce daily sodium intake to less than 2,300 milligrams.
3. Consume less than 10 percent of daily calories from saturated fatty acids by
replacing them with monounsaturated and polyunsaturated fatty acids.
4. Consume less than 300 mg per day of dietary cholesterol.
5. Keep trans fatty acid consumption as low as possible by limiting foods that
contain synthetic sources of trans fats, such as partially hydrogenated oils, and
by limiting other solid fats.
6. Reduce the intake of calories from solid fats and added sugars.
Energy expenditure. A Call to Action (USDHHS, 2001) defines schools as the
role of the school in the crusade against overweight and obesity. It outlines a specific,
detailed strategy that schools can utilize in promoting health and physical activity,
including the following:
1. Educate school administrators, teachers, educators, school service personnel, and
coaches about the importance of school physical activity and healthy nutritional
habits.

40
2. Conduct community outreach to raise awareness of the importance of being good
role models for children in terms of diet and exercise.
3. Raise awareness of school administrators, teachers, educators, school service
personnel, and coaches about the importance of body size acceptance and the
dangers of unhealthy dieting practices and the potential for emotional problems of
in overweight children (p. 19).
Although physical education is a requirement in all 50 states, the amount of time
spent and the quality of the program varies from state to state. The National Association
for Sport and Physical Education (NASPE), a leading organization of physical health,
recommends at least two and a half hours a week of physical education for middle and
high school students. Physical activity (PA) refers to opportunities for children to be
active, separate from state mandated physical education (PE) requirements. NASPE also
suggests at least an hour of physical activity per day while avoiding prolonged periods of
inactivity. The amount of physical activity time varies from state to state and it is one of
the elements of State Compliance Score.
Energy intake. The process for creating the nutritional requirements for the 2010
USDA Guidelines took nearly a decade and involved many large, powerful groups
including the Action for Healthy Kids (AFHK), National Alliance for Nutrition and
Activity (NANA), and the School Nutrition Association (SNA). AFHK is “the nation’s
leading non-profit and largest volunteer network fighting childhood obesity and
undernourishment by working with schools to improve nutrition and physical activity

41
(PA) to help our kids eat right, be active every day, and be ready to learn” (USDA,
2010c). Created in 2002, this organization has over 11,000 members.
AFHK’s Wellness Policy Fundamentals provided a framework for the 2010
USDA Guidelines (AFHK, 2014). It included six policy components that are reflective
of the federal mandates. A study was conducted by the AFHK on the then school
nutrition policies. The study found more than 256 separate policies from 49 states. The
assessment included a sample meant to reflect the underlying 11,000 school districts. The
study found the number and complexity of school nutrition policies made analysis of
their efficacy in reducing obesity untenable. The AFHK called for a single, national
school nutrition standard using the AFHK Wellness Policy Fundamentals as the
foundation.
The National Alliance for Nutrition and Activity (NANA) is made up of more
than 300 organizations, including steering committee members such as the American
Cancer Society, the American Diabetes Association, and the National Association for
Sport and Physical Education (NANA, 2013). NANA developed a 26-page document
entitled Model Local School Wellness Policies on Physical Activity and Nutrition
(NANA, 2013, p. 342). This document is by far the most comprehensive nutrition policy
resource predating the 2010 USDA Guidelines.
The School Nutrition Association is “a national, nonprofit professional
organization representing more than 55,000 members who provide high-quality, low-cost
meals to students across the country” (SNA, 2013). SNA is a recognized authority on
school nutrition since its inception in 1946. The SNA conducted two studies. A
42
Foundation for the Future: Analysis of Local Nutrition Policies from the 100 Largest
School Districts (Future), and A Foundation for the Future II: Analysis of Local Nutrition
Policies from 140 School Districts in 49 States (Future II) were accessed via SNA’s
website and used in this research. Future (October 2006) analyzed local nutrition policies
from the 100 largest school districts in the United States. Future II (December 2008)
analyzed local nutrition policies from a sample of 140 school districts in the United States
representing seven regions. Both studies supported a change in the nutritional
composition of meals but did not call for a reduction in the number of calories. The study
suggested that the obese were in the minority and changes to calorie counts for all
students was counterproductive and antithetical to providing nutrition to students that
cannot afford to buy their own food.
Childhood Obesity Intervention Research
Obesity is a complex phenomenon, affected by clusters of factors at the
community, family, and individual levels. The purpose of this research was to isolate the
association between a community-based nutrition intervention program and state-level
high school obesity rates. Given the volume of research on obesity treatment, the scope of
this review is limited to summarizing, analyzing, and synthesizing recent research on the
efficacy of school-based treatments of childhood obesity.
Widespread increases in obesity despite the universal recognition of the individual
and societal costs suggests that obesity is influenced by multiple interlinking factors, and
not moderated by knowledge of the consequences (Skelton, Buehler, Irby & Grzywacz,
2012) . Systems include: i) individual behaviors (psyche-based), ii) parenting styles and

43
family dynamics (family-based), iii) community and demographic factors (community-
based), including school. This view was supported by the bio-psychosocial perspective
of illness that posits that numerous psychological and sociological factors subjectively
influence obesity, and that it is reductionist to assume that health and illness are only
affected by objectively verified, biomedical factors (Stange, 2010). As children grow up
their food intake becomes more reliant on external cues, such as the amount and type of
food presented. Since children spend so much of their time in schools, much of the
obesity intervention research is based in schools. Research on the causes and potential
interventions for childhood obesity examined the following: i) individual behavioral
change, ii) family, and iii) sociological/school-based interventions.
Family Systems Theory (FST) is a framework for understanding how family
relationships affect individual behavior, and in this case, childhood obesity (Pocock,
Trivedi, Wills, Bunn, Magnusson, 2010; Klein & White, 2008). Skelton et al. (2012)
conducted a comprehensive review of the literature on family theories and pediatric
obesity research and treatment. The search yielded 76 relevant abstracts of which 17 were
thoroughly reviewed and the findings reported. FST was used as a framework in four
reviews/commentaries on childhood obesity, and one article used FST to intervene in
childhood obesity (Kitzman-Ulrich et al., 2009). FST principles were combined with
Social Cognitive Theory for the treatment. A sample of 42 female adolescents aged 12 to
15 years completed a 16-week randomized controlled trial comparing three groups:
multifamily therapy plus psycho-education (n = 15), psycho-education-only (n = 16), or
wait list (control; n = 11) group. Adolescents in the family-based psycho-education only

44
group demonstrated a greater decrease in energy intake compared to the multifamily
therapy plus family-based psycho-education and control groups (P < 0.01). The findings
from this study provided preliminary support for a family-based psycho-educational
weight-loss program that integrated family variables to reduce energy intake in
overweight (>95th percentile) adolescent girls. However, no significant effects were
found for body mass index. Limitations to Kitzman-Ulrich et al. (2009) included the
following: i) while significant decrease in energy intake was observed, no change in BMI
were observed, ii) power to detect effects was limited due to the small sample size, and
iii) the 24-hour dietary recall method was used and is subject to significant inaccuracy.
The Kitzman-Ulrich et al. (2009) study was included here to illustrate relative lack of
research quality regarding systems theory to treat obesity. There were no large-scale
longitudinal studies on any obesity intervention available in the literature. The federal
government’s decision to use a school nutrition-based obesity intervention would be
strengthened and would gain increased support if it was based on proven long-term
research.
Legislative-Based Interventions
Alderman, Smith, Fried, and Daynard (2007) suggested a sociological approach to
obesity intervention at the community-level, meaning the examination and manipulation
of social issues and regulations to effect obesity rates. Their sociological approach does
not reject autonomous behavior; rather it examines individual behavior in social context
and suggests regulatory intervention for obesity, including federal regulation of school
nutrition. Using the law to create a social context and social capacity for health is more

45
effective than focusing on the attainment of actual health for individuals supports a social
epidemiologic view (Alderman et al., 2007). Alderman et al. (2007) found that
legislation to reduce childhood obesity addressed society’s risk factors, as opposed to
individual behavior. They suggested the regulatory scheme should “shift focus away
from individual risk factors and seek the situational and environmental influences that
create an environment conducive to health” (Alderman et al., 2007, p.102). Alderman et
al. (2012) stated, “To be as effective as possible as a policy tool, the law should focus not
only on frequently illusory individual choices, but also on population-wide change and
environmental conditions that affect individual decisions” (p. 90-91). Regulatory
schemes seek to control weight and obesity by focusing on individual choices about diet
and exercise.
Schwartz and Brownell (2007) also suggested that community-level legislative
and regulatory action is the appropriate intervention to reduce childhood obesity.
Schwartz and Brownell (2007) proposed changing the frame from which the public
perceives obesity as an individual problem to that of a societal, public health catastrophe.
They use the term “toxic environment” in that it refers to “several layers of the world
around us that interact with key elements of our biology” (Schwartz & Brownell, 2007, p.
79). Schwartz and Brownell (2007) suggested that when emphasis is diverted from
personal responsibility for obesity and redirected to obesity as a public health issue, then
legislation and regulation should be more effective in combating juvenile obesity.
Schwartz and Brownell (2007) used adding fluoride to America’s drinking water as an
example: from a medical approach, the increase in children’s cavities would have been an

46
individual problem. Seek dental care and take fluoride to fix it. However, the public
health approach had the government put fluoride in all our water. This health
intervention did not require a behavior change or group modification, it was silent and led
to a profound transformation in public health (Schwartz & Brownell, 2007).
Regulation at the federal level can decrease the advertising of unhealthy foods to
children. This is similar to laws restricting tobacco and alcohol advertising. Some
proposals included restricting the frequency and content of unhealthy food
advertisements during child programming as well as having equal representation of good
nutrition and physical activity advertisements, alternatively, balancing unhealthy food ads
against nutritious food and physical activity ads. Regulation also included “the print
media, the Internet, in-store promotional campaigns, and product tie-ins to children’s
television programs” (Mermin & Graff, 2009, p. 2603). Public health officials were
specifically targeting obesity reduction. Many public health activists support federal and
state governments’ involvement in fighting the obesity epidemic, but there is also
opposition. Food industries are concerned about their profits, and consumer groups are
concerned about their civil rights (Mermin & Graff, 2009).
Many agree that obesity is a public health issue, therefore clearing the way for
state governments to use their police power “to develop and enact measures to counter
obesity” (Mermin & Graff, 2009, p. 1800). The federal government control over food
extends to school nutrition through the SLP, however, their jurisdiction stops at meals. A
la carte foods and other competitive food sales, as well as physical education and activity,
are not under the federal laws. Therefore, even though the federal government’s

47
involvement is limited in these areas, it can lay the tracks on which the states, exercising
police power, can ride.
Individual states have police power specifically as it pertains to public health,
welfare, and safety (Mermin & Graff, 2009). It gives states more freedom from
constitutional barriers and more regulatory power when it comes to public health and the
ability to issue laws and regulations that address public health issues. Civil libertarians
take issue with state police power over individual food choice. While state, “Use of the
law generally is a long supported and effective practice to advance public health (Ryan et
al., 2007), the controversy remains, without agreement on where the right to intervene
ends and parental rights begin.
The Healthy, Hunger-Free Kids Act implementation caused immense controversy.
HHFKA school lunch implementation resulted in more than 1 million students choosing
not to eat school meals each day (GAO, 2013). Those paying full price for lunch
declined 10% in 2013 to the lowest level in more than a decade. Those that bought the
newly mandated menu items were throwing the fruits and vegetables away. The GAO
reported that 40% of the fruits and 75% of the vegetables were thrown away (GAO,
2013). In light of the controversy surrounding the HHFKA, the House of Representatives
passed a bill that would postpone some implementation of significant parts of the
HHFKA pending further investigation. At this writing, no change to the HHFKA has
been made by Congress. The debate underscores the need for this study, which addresses
the question, “Will HHFKA compliance actually reduce obesity rates?”

48
School-based Interventions
A study by Gonzales-Suarez et al. (2009) evaluated school-based interventions
using the following treatments: i) increased exercise, ii) improved dietary behaviors, or
iii) combinations of the two approaches (Gonzales-Suarez et al., 2009). Treatment
protocols included classroom lessons emphasizing reductions in high fat, sugary foods;
increases in the number of daily servings of fruits and vegetables; and increasing physical
activity to improve health. In most cases, physical education classes included an increase
for time spent in moderate-to-vigorous physical activity. Most of the studies used
multiple intervention strategies and several included modifications in the availability of
healthy foods in school cafeterias. The increased allocation of time to rigorous exercise
was consistent with the 2010 USDA Guidelines; however, the majority of food
interventions were classroom education based rather than changes to fruit and vegetable
availability in school cafeterias, limiting the applicability to the present study.
Compulsorily education and the attendant administrative structure make school
age children an ideal population for testing these interventions (Katz et al., 2009). Much
of the research utilized multi-factor interventions in a school setting, including changes in
food intake, physical activity, sedentary behaviors, or combinations of these (Gonzalez-
Suarez et al., 2009; Katz, et al., 2009; Sobol-Goldberg et al., 2013). Many combinations
of the following potential interventions were studied in schools: menu changes, physical
education, skills building, behavior modification, extracurricular activities, incentive
schemes, and modification of the overall food environment. Research on school age

49
obesity interventions frequently included an element of parental involvement (Katz et al.,
2009).
A substantial hurdle in evaluating obesity intervention efficacy is that of
measurement. Isolating the effects of an intervention, which occurred over a long period
of time and have complex interactions, made outcome evaluation problematic (Malik et
al., 2013). Treatment effects might be subtle and diffuse, and difficult to isolate,
particularly in the case of obesity where there are certainly multiple causations. As a
result, research on obesity interventions tends to modify behavior within a well-
circumscribed sample over a short timeframe, rather than a large-scale, longitudinal
study. The number of quantitative, peer-reviewed research articles on school-based
childhood obesity intervention in the past 5 years exceeded 115. The following research
review focused on quantitative, randomized controlled trials (RCT) and clinically
controlled studies to limit the size of the review.
Gonzalez-Suarez et al. (2009) conducted a meta-analysis of 26 studies to evaluate
the effectiveness of school-based intervention programs on childhood obesity in terms of
BMI, percentage of body fat, waist girth, triceps, skinfold, and waist–hip ratio. For the
purposes of the study, short-term outcomes were measured immediately after completion
of the intervention, while long-term outcomes were measured at least 6 months after
intervention program completion. The duration of the implementation of the intervention
programs varied, from less than 6 months to greater than 2 years. Only those RCTs and
clinical controlled trials that had high methodological critical appraisal scores, i.e. greater
than 60% of criteria met, as measured by the Critical Appraisal of Evidence Effectiveness

50
tool from the Joanna Briggs Institute. The use of RCVTS and clinical controlled trials,
multiple raters, a large sample size, and long-term studies makes the Gonzalez-Suarez
(2009) study robust.
Gonzalez-Suarez et al. (2009) found that, in the short-term, school-based
interventions were effective in decreasing percentage of body fat and waist girth but not
in reducing BMI in treatment groups in comparison to control groups. However, no
significant reductions in any observed variable were detected in the long-term. The
effectiveness of a school-based intervention program could be influenced by many
factors. The Gonzalez-Suarez et al. (2009) research design addressed program duration,
and included only controlled experiments, factors such as the age of participants,
involvement of parents, school environment/culture, and compliance with the
intervention cannot be readily controlled.
Brown and Summerbell (2009) conducted a meta-analysis of 38 studies to
evaluate the effectiveness of school-based intervention programs on childhood obesity in
terms of BMI, absolute body weight, skin-fold thickness, and percentage of overweight.
Studies with school-aged children ages 5 to 18 were included. A study was included only
if the research design was a RCT or controlled clinical trial of a lifestyle intervention,
school-based, and treatment duration was at least 12 weeks. Study inclusion criteria were
identical to the NICE obesity guidance (NICE, 2013), with the following exception: only
studies with weight outcomes were included. Study duration of the 38 studies ranged
from 12 weeks to 22 years. Twenty-two studies had follow-up of less than 1 year, four
studies had follow-up between 3 and 5 years and two studies had follow-up periods of 10

51
and 20 years. The use of RCT and clinical controlled trials, school-based treatment
protocols, and large sample sizes made the Brown and Summerbell (2009) robust and
highly relevant to the present study.
Brown and Summerbell (2009) found insufficient evidence to assess the
effectiveness of dietary interventions to prevent obesity in schoolchildren, or to compare
the relative effectiveness of diet alone compared to PA alone interventions. One of three
(33%) diet studies alone, five of 15 (33%) PA studies, and nine of 20 (45%) combined
diet and PA studies demonstrated significant differences between intervention and control
for BMI. The study concluded that school-based interventions to increase PA and
improve diet may help children to maintain a healthy weight, but the results are
inconsistent and short-term. The large sample size for both the Brown and Summerbell
(2009) study and the underlying primary research lends considerable reliability and
validity to the results.
Adolescents Committed to Improvement of Nutrition and Physical Activity
(ACTION) conducted a study to the determine feasibility of using a school-based health
center (SBHC) weight management program to reduce BMI. Sixty participant-caregiver
dyads in two urban New Mexico SBHCs were randomized to deliver ACTION or
standard care. The treatment consisted of eight visits of motivational interviewing, and
multimedia presentations to improve diet decisions and physical activity behaviors (Kong
et al., 2013). The study found that ACTION trials of moderate to high intensity (>25
hours) which included adolescent peer participants were more effective than low-
intensity interventions. While the sample was small, the study showed improvements for

52
both boys and girls that were still significant after six months. The large number of
caregiver hours required for the treatment is a limitation to the treatments cost
effectiveness in real world applications.
Katz et al. (2009) reported that school-based interventions with significant
parental involvement were more effective, however this finding was inconsistent as well.
Several reviews explored the relative effectiveness of interventions aimed at diet,
physical activity, or a combination of the two, with no clear answers. Katz et al. (2009)
concluded that school-based intervention programs were the most promising if they
combined dietary and physical activity elements. In contrast, Brown and Summerbell
(2009) found that studies emphasizing physical activity alone were more likely to report a
significant impact on BMI than any other combination of interventions.
Summary
High school obesity rates are at epidemic levels with profoundly negative
implications for long-term health and healthcare costs. The federal government
intervened to reduce childhood obesity by passing the HHFKA in 2010 that creates
nutrition and physical activity mandates for school districts. Pursuant to the HHFKA, the
USDA created the 2010 USDA Guidelines meant to increase physical activity, reduce
calories consumed at school meals, and convert certain calories from fat content to fruits
and vegetables. The 2010 USDA Guidelines represented the first federal intervention in
school nutrition policy to affect childhood obesity. As a result, more than 37
schoolchildren were participants in a nationwide study to determine the effect on
childhood obesity of the policy changes.

53
There was considerable debate in the literature regarding the causes of the
childhood obesity epidemic that began in the 1980s in the United States. Obesity is a
complex phenomenon, affected by clusters of factors at the community, family, and
individual levels. Research has shown that obesity is associated with ethnicity, race,
SES, gender and region of residence. Causes cited in the literature include genetics,
energy imbalance, metabolic abnormalities, diet, and physical activity level. The efficacy
of using federal intervention in school meal planning is not known, there is no precedent
for using school nutrition policy to affect childhood weight or obesity (CDC, 2006;
Perryman, 2011).
There is a gap in the literature regarding the relationship between school meal
policy and childhood obesity rates. The purpose of this quantitative study was to examine
the relationship between compliance with HHFKA regulations and state-level high school
obesity rates. This study was the first, of what will likely be many attempts to measure
the impact of the HHFKA to reduce childhood obesity rates.
Chapter 3 Methodology describes the research design, sample, statistical tests,
and data analysis plan to address the research questions. State compliance with 2010
USDA guidelines, described in detail in this Chapter, were assessed by comparing the
requirements in the regulations to the actual state school lunch policy. An ANOVA study
was conducted to test for an association between State Policy Compliance and childhood
obesity rates after accounting for known factors, such as SES and race.

54
Chapter 3: Research Method
Introduction
The purpose of this quantitative study was to examine the association between
school nutrition policy compliance and federal school nutrition regulations and high
school obesity rates. The research was significant because it examined the association
between federal school nutrition regulation and high school student obesity rates at a time
while controversy exists regarding implementation of the 2010 USDA Guidelines (CBS,
2014). The controversy surrounds high school student complaints about the type and
amount of food available for breakfast and lunch under the new guidelines (CBS, 2014).
The research was significant because it informed public policy makers at a time when
some high school administrators were choosing to ignore the 2010 USDA Guidelines due
to complaints from students and parents.
This chapter presents a description of the study design, sample powering, and data
analysis. It also includes the rationale for the specific research design, methodology, and
the data collection procedure. The study only used existing data collected from published
governmental sources. Chapter 3 includes no mention of study participants, ethical
considerations, recruitment, instrumentation, treatment, or archival data sources due to
the absence of study participants.
Research Design and Rationale
The dependent variable was state obesity rate and the independent variable was
Compliance Scores, as calculated by the researcher. Covariates were median income and
region type. This quantitative study used a causal research design. The methodology

55
aimed to measure state compliance with the 2010 USDA Guidelines for school meal
nutrition and test for an association between Compliance Score and high school obesity
rates. The causal research design is appropriate when variation in one phenomenon, in
this case Compliance Scores, leads to or results in, on average, variation in another
phenomenon, high school obesity rates. The causal research design can be used when an
empirical association exists between variables and there is an appropriate, and
reasonable, relationship in time. The causal research design for this study increased the
probability of generating reliable and valid results (Leedy & Ormrod, 2012). There was
no known resource or time constraint associated with the selection of a causal research
design. No attempt was be made to affect the behaviors of any individual or entity
therefore the research is of a non-experimental nature.
A causal research design using quantitative methodology was an appropriate
choice for this study to advance knowledge. Both the dependent and independent
variables were continuous and reliable sources and were available from which to collect
data. In the case of causal quantitative studies, hypotheses were either accepted or
rejected using inferential statistics and based on observable behavior (Liu & Ju, 2010).
According to Leedy and Ormrod (2012), there were many advantages to using a
quantitative methodology: 1) there is a clear identification of independent and dependent
variables, 2) the research problem can be clearly stated and hypotheses tested, and 3) high
levels of reliability are available relative to other methods.
Population
The target population for this study was all 50 U.S. states with 15.9

56
million high school students who were subject to state and federal nutrition
regulation (IES, 2014). Based on an estimated 13% high school obesity rate, there
were approximately 2.1 million obese high school students in 2012 (Malik et al.,
2013; CDC, 2013).
Sampling and Sampling Procedure
Based on inclusion of all 50 states in the study sample (see below), there was no
sampling strategy, procedure, or frame. Sample size was a function of population, α and
β. Sample size for a small population, as is the case when using 50 states, approaches
100% of the population. The formula for powering the sample size is:
Where: n = Sample size X2 = Chi-square for the specified confidence interval at 1 df N = Population size P = Population proportion ME = desired Margin of Error
Assuming α = .05 and p = 0.05, the calculated sample size is 44 (Faul, Erdfelder,
Buchner & Lang, 2009). Based on the proximity of the calculated sample size to the total
population, the study sample included the entire population.
Procedures for Data Collection
State Compliance Scores data was collected from the State School Health Policy
Database compiled by the National Association of State Boards of Education (NASBE,
2013). The NASBE data was checked against state government websites for reliability.

57
The reliability and reputability of the Compliance Scores data source is addressed by the
following description taken from the NASBE website:
The NASBE State School Health Policy Database is a comprehensive set of laws
and policies from 50 states on more than 40 school health topics. Originally begun
in 1998, and maintained with support from the Centers for Disease Control and
Prevention (CDC), the policy database is designed to supplement information
contained in CDC's School Health Policies and Programs Study. (NASBE, 2013).
The Census Bureau and Center for Disease Control websites provided state
median income, state high school obesity rate, and degree of urbanization (Census
Bureau, 2012; CDC, 2012).
Operationalization of Variables
Definitions.
Compliance Score: Compliance Scores represent the number of the 17 potential
2010 USDA Guideline nutritional elements present in state nutrition policy.
Degree of urbanization: For the purposes of this study, degree of urbanization is
defined as the percentage of the total state population that lives in urban areas, as defined
by the Census Bureau (Census Bureau, 2012).
High school obesity rate: High school obesity was the rate reported by the Center
for Disease Control for 2011 (CDC, 2012).
Median income: Median income was the amount reported by the Census Bureau
for each state in 2011 (Census Bureau, 2012).
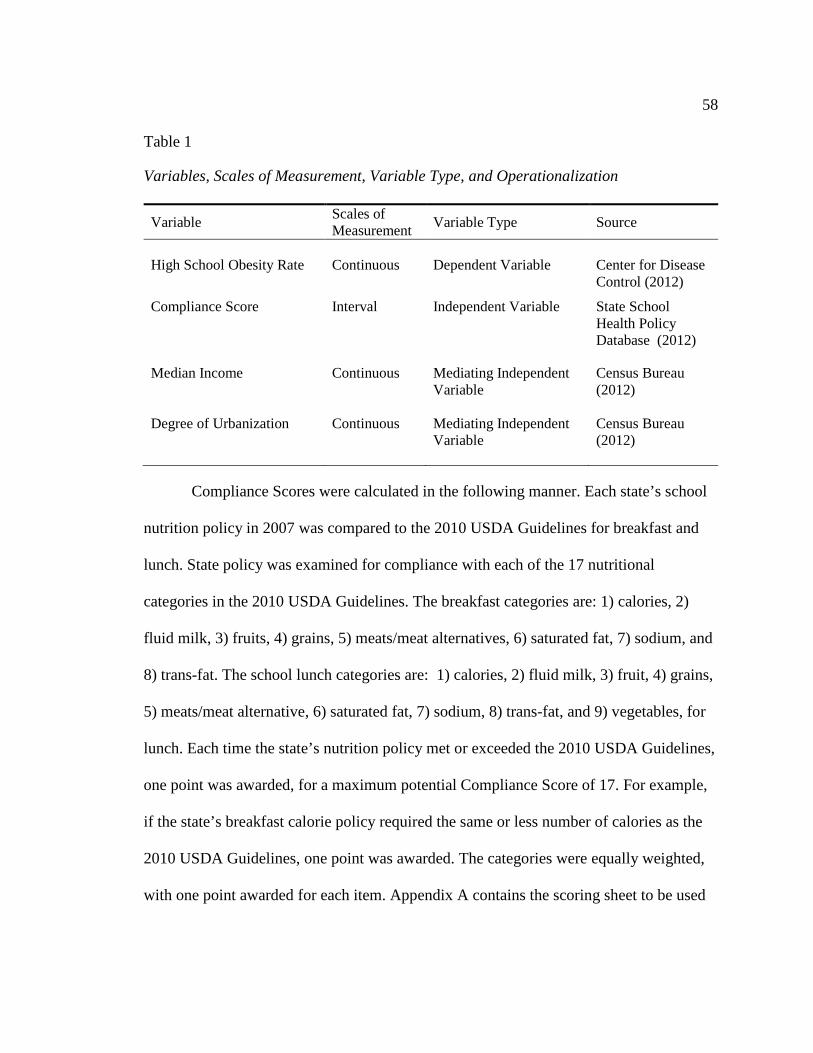
58
Table 1
Variables, Scales of Measurement, Variable Type, and Operationalization
Variable Scales of Measurement Variable Type Source
High School Obesity Rate Continuous Dependent Variable
Center for Disease Control (2012)
Compliance Score Interval Independent Variable
State School Health Policy Database (2012)
Median Income Continuous Mediating Independent Variable
Census Bureau (2012)
Degree of Urbanization Continuous Mediating Independent Variable
Census Bureau (2012)
Compliance Scores were calculated in the following manner. Each state’s school
nutrition policy in 2007 was compared to the 2010 USDA Guidelines for breakfast and
lunch. State policy was examined for compliance with each of the 17 nutritional
categories in the 2010 USDA Guidelines. The breakfast categories are: 1) calories, 2)
fluid milk, 3) fruits, 4) grains, 5) meats/meat alternatives, 6) saturated fat, 7) sodium, and
8) trans-fat. The school lunch categories are: 1) calories, 2) fluid milk, 3) fruit, 4) grains,
5) meats/meat alternative, 6) saturated fat, 7) sodium, 8) trans-fat, and 9) vegetables, for
lunch. Each time the state’s nutrition policy met or exceeded the 2010 USDA Guidelines,
one point was awarded, for a maximum potential Compliance Score of 17. For example,
if the state’s breakfast calorie policy required the same or less number of calories as the
2010 USDA Guidelines, one point was awarded. The categories were equally weighted,
with one point awarded for each item. Appendix A contains the scoring sheet to be used

59
to score each state’s compliance. Appendix B presents an example of the spreadsheet
format used to capture compliance data and generate Compliance Scores.
Data Analysis Plan
Descriptive and inferential statistics were calculated using the Statistical Package
for the Social Sciences (SPSS). High school obesity rate data was downloaded directly
from the U.S. CDC website to an Excel spreadsheet and a scatterplot generated to
identify outliers, and bad or missing data (Rousseeuw & Leroy, 2003). Median income
and degree of urbanization data was downloaded from the Census Bureau website to an
Excel spreadsheet and a scatterplot was generated to identify outliers, and bad or missing
data. Compliance Score data was captured using the scoring sheet in Appendix A and
transferred to an excel spreadsheet for analysis. Dependent and independent variable
Excel spreadsheet data was transferred to SPPS for analysis.
Research Question. After controlling for median income and region of residence
(rural or urban), is there an association between state high school student obesity rates
and Compliance Score?
Hypothesis:
H1o: There is no statistically significant correlation between state high school
student obesity rates and Compliance Scores, after controlling for median
income and degree of urbanization.
H1a: There is a statistically significant correlation between state high school
student obesity rates and Compliance Scores, after controlling for median
income and degree of urbanization.

60
H1 was tested using ANCOVA analysis. Covariates of median income and degree
of urbanization were chosen based on previous research that consistently found that each
was significantly predictive of childhood obesity rates (Zhang et al., 2011). The purpose
of this analysis was to isolate the effect of state nutrition policy on state high school
student obesity rates. The results were interpreted using the output from SPSS, which
reported ANCOVA results to accept or reject the null hypothesis.
Threats to Validity
External validity refers to the generalizability of findings to other settings or
populations. While no threats to external validity were noted, the results might not be
generalizable to other age groups, cultures, or populations with differing ethnic
composition (Leedy & Ormrod, 2012).
The following two potential threats to internal validity are noteworthy:
1. History: a significant amount of time will have passed between the
measurement of state compliance score and high school obesity rates. Any
number of factors could have confounded the relationship between state
nutrition policy and high school obesity rates.
2. Statistical regression: since the study aimed to measure differences in similar
populations, compensating factors and the passage of time might eliminate
those differences.
Childhood obesity is a well-recognized and thoroughly vetted construct, which
removes any threat to construct validity. The use of standard statistical procedures on
100% of the target population reduces threats to statistical conclusion validity but does

61
not eliminate all threats. The primary threat to statistical conclusion validity is the
potential for an unmeasured covariate with greater explanatory value the independent
variable.
Summary
This study used a causal research design and a quantitative methodology. The
causal research design was appropriate for this study given the potential for an empirical
relationship between variables and the reasonable relationship in time. The study aims to
test for an association between state nutrition policy compliance and state high school
obesity rates. The study used descriptive statistics and the ANCOVA inferential statistic
to describe the findings and test the hypothesis. Chapter 4 presents the findings,
characterizes the study sample, and discuss methodological issues arising during the
research process.

62
Chapter 4: Results
Introduction
The purpose of this quantitative study was to examine the relationship between
compliance with the Healthy, Hunger-Free Kids Act of 2010 (HHFKA) regulations and
state-level high school obesity rates. The HHFKA was passed to address the growing
U.S. obesity epidemic (Federal Register, 2010). The HHFKA implementation under the
2010 USDA Guidelines mandating nationwide changes in school cafeteria menus during
the 2013 - 2014 school year was met with significant resistance (CBS, 2014). No large-
scale study on the relationship between school nutrition regulations andSu high school
obesity rates was conducted before enactment of the HHFKA to establish the efficacy of
the then proposed school menu changes. This study aimed to examine the relationship
between state high school obesity rates and state policy compliance with 2010 USDA
Guidelines prior to their enactment. The hypothesis was that U.S. states with at least
some 2010 USDA Guideline compliance in 2007 would report lower high school obesity
rates by 2013, after controlling for median income and region of residence (rural or
urban), known covariates of high school obesity rates.
Chapter 4 includes a discussion of research design issues, data collection
methods, and study findings. Descriptive and demographic statistics are presented for all
50 states taken together, and separately for two samples, one with positive Compliance
Scores, and the second with zero Compliance Scores. Statistical analyses, hypothesis
tests, and results are detailed and discussed. Study findings are summarized and Chapter
5: Conclusions and Recommendations is introduced.

63
Data Collection
The study sample included 15.9 million high school students subject to federal,
state and local nutrition regulation (IES, 2014), of which 2.0 million met the definition
for obesity (CDC, 2014). Study data was collected for each of the 50 United States for
Compliance Scores, high school obesity rates, median income, and rurality. State rurality
and median income data was collected from the 2013 U.S. Census Bureau tables (Census
Bureau, 2014). High school obesity data was drawn from two sources. The 2013 Youth
Risk Behavior Survey (YRBS) was used for the 42 states that responded to the survey
(CDC, 2014), and data for the remaining eight states (California, Colorado, Indiana,
Iowa, Minnesota, Pennsylvania, Oregon, and Washington) was drawn from the Robert
Wood Johnson Foundation (RWJF) report on The State of Obesity: Better Policies for a
Healthier America 2014 (RWJF, 2014). Based on these sources for state high school
obesity rates, the nationwide high school obesity rate was 12.5% in 2013. By state detail
for all study variables is included in Appendix D.
State Compliance Scores data was collected during November and December
2014 from the State School Health Policy Database compiled by the National Association
of State Boards of Education (NASBE, 2013). The 2010 USDA Guidelines were
compared to each state’s school nutrition policy for eight breakfast and nine lunch
components (Appendix B). While the 2010 USDA Standards for vegetable descriptive
indicators included separate categories for dark green vegetables, orange vegetables,
legumes, and starchy vegetables, this study combined the vegetable-related indicators
into a single category called vegetables. Data was available for all 50 states and was

64
scored as compliant or non-compliant for each of the 17 nutritional components. When
insufficient information was available in the state policy database to determine
compliance, the category was coded as non-compliant.
Results
As shown in Table 2, the mean nationwide high school obesity rate was
12.5% (SD = 2.4%), mean rurality was 26.4% (SD=14.5%), median income was $50,595
(SD=$7,338), and mean Compliance Score was 2.32 (SD=3.16). For the purposes of this
analysis, the 50 states were divided into two samples, those with some level of
compliance (Semi-complaint) with 2010 USDA Guidelines, and states with no
compliance (Non-compliant). The mean high school obesity rate for the Semi-compliant
states was 13.2% (SD=2.3%) compared to 11.9% (SD=2.5%) for Non-compliant states,
although not a significant difference at p≤0.10. The mean population residing in rural
areas for the Semi-compliant states was 28.1% (SD=15.1%) compared to 25.0%
(SD=13.7%) for Non-compliant states, although not a significant difference at p≤0.10.
The Semi-compliant states mean obesity rate was higher than the Non-compliant states.
Data was collected from the entire population of 50 states, state-level detail for all study
variables is included in Appendix D.

65
Table 2
Mean Obesity Rates and Compliance Scores
Obesity
Rate
% Rural
Population
Median Income
Compliance
Score
Population
Semi-Compliant States (N=23)
Mean 13.2% 28.1% $49,168 5.04 6,153,792
STD 2.3% 15.1% $6,375 2.80 8,148,043
Non-Compliant States (N=27)
Mean 11.9% 25.0% $51,811 0.00 6,170,615
STD 2.5% 13.7% $8,303 0.00 5,675,254
All 50 States 12.5% 26.4% $50,595 2.32 6,162,876
STD 2.4% 14.5% $7,338 3.16 6,911,649
Table 3 lists the 23 Semicompliant states, obesity rates, rural population
percentage, median incomes, and compliance percentages.

66
Table 3
Semicompliant States
State 2013
Obesity Rate
2013 % Rural Population
2013 Median Income
2007 Compliance Compliance Score %
Alabama 17.1% 41.0% $ 42,590 2 12%
Alaska 12.4% 34.0% $ 57,431 2 12%
Arizona 10.7% 10.2% $ 48,621 4 24%
Arkansas 17.8% 43.8% $ 41,302 2 12%
California 15.1% 5.0% $ 53,367 4 24%
Connecticut 12.3% 12.0% $ 65,415 6 35%
Delaware 14.2% 16.7% $ 54,660 2 12%
Idaho 9.6% 29.4% $ 47,459 7 41%
Michigan 13.0% 25.4% $ 48,879 9 53%
Minnesota 14.0% 26.7% $ 57,820 3 18%
Mississippi 15.4% 50.7% $ 41,090 4 24%
Nebraska 12.7% 26.9% $ 55,616 6 35%
Nevada 11.4% 5.8% $ 47,043 4 24%
New York 10.6% 12.1% $ 50,636 6 35%
North Carolina 12.5% 33.9% $ 45,206 7 41%
Oregon 9.9% 19.0% $ 51,526 2 12%
Pennsylvania 13.5% 21.3% $ 49,910 2 12%
Rhode Island 10.7% 9.3% $ 49,033 11 65%
South Carolina 13.9% 33.7% $ 40,084 4 24%
South Dakota 11.9% 43.3% $ 47,223 4 24%
Tennessee 16.9% 33.6% $ 42,279 8 47%
Vermont 13.2% 61.1% $ 51,862 6 35%
West Virginia 15.6% 51.3% $ 41,821 11 65%
Washington 13.1% 28.1% $ 49,467 5 30%

67
Table 4 summarizes nationwide compliance rates for 2010 USDA Grades 9-12
Breakfast component compliance. Individual component compliance rates ranged from
6% to 28% with a mean compliance rate for Breakfast equal to 14.0%. Fluid milk and
saturated fat had the highest compliance at 28% and 26%, respectively. Breakfast
components with the lowest compliance rates were calories, fruit, grains, protein, and
sodium at 8% or less. Examples from statutory language that was compliant for fluid
milk included the following: Idaho and Mississippi offered only fat-free (skim) or 1% fat
content milk for all meals. On the other hand, Pennsylvania was non-compliant in the
fluid milk requirement because the language used states that at least 75% of milk offered
must be 2% fat or less. Pennsylvania was also non-compliant because the serving size for
all grade levels must be 8 oz. or less and Pennsylvania permits a 12 oz. serving size in
middle and high school.

68
Table 4
Nationwide Grades 9-12 Breakfast Compliance
Category # States Compliant % Compliant
Calories 3 6%
Fluid Milk 14 28%
Fruit 4 8%
Grains 4 8%
Protein 4 8%
Saturated Fat 13 26%
Sodium 4 8%
Trans-fat 9 18%
Total 14%
Table 5 summarizes nationwide compliance rates for 2010 USDA Grades 9-12
Lunch component compliance. Individual component compliance rates ranged from 6%
to 26% with a mean compliance rate for Lunch equal to 14.0%. Fluid milk and saturated
fat had the highest compliance rate at 26%. Lunch components with the lowest
compliance rates were calories, fruit, grains, protein, and sodium at 8% or less. Examples
from statutory language that was compliant for fluid milk included the following:
Examples of statutory language for Lunch policy included: Washington State was non-
compliant in sodium because the sodium limit was significantly higher than guidelines at
1100 mg.

69
Table 5
Nationwide Grades 9-12 Lunch Compliance
Category # States Compliant % Compliant
Calories 3 6
Fluid Milk 13 26%
Fruit 4 8%
Grains 4 8%
Protein 4 8%
Saturated Fat 13 26%
Sodium 4 8%
Trans-fat 9 18%
Vegetables 7 14%
Total 14%
Hypothesis 1
Test for skewness and kurtosis revealed that the study data and residual errors
were normally distributed, thereby meeting the necessary assumption of use of Pearson
and ANCOVA statistics.
There was no statistically significant correlation between state high school student
obesity rates and Compliance Scores, after controlling for median income and degree of
urbanization. The first step in testing Hypothesis 1 was to verify that rurality and median
income are covariates (Leedy & Ormrod, 2012). Table 6 shows Pearson correlation
statistics between each study variable. There were significant correlations between the
dependent variable, high school obesity rate, and study covariates of rurality (r = .404)

70
and median income (r = -.454). As shown in previous studies, obesity was negatively
correlated with median incomes and positively correlated with population density. Since
the absolute value of the correlation between high school obesity and both rurality and
median income was between r ≥.30 and r ≤.90, both rurality and median incomes were
covariates and should be accounted for in the main analysis (Leedy & Ormrod, 2012).
Table 6 also shows no significant correlation between high school obesity rates and
Compliance Score (r = .156) for the sample of 50 U.S. states.
Table 6
Study Variable Pearson Correlation Matrix
Variable Obesity Rurality Median Income
Obesity Pearson Correlation 1 Sig. (2-tailed) N 50
Rurality Pearson Correlation .404** Sig. (2-tailed) .004 N 50
Median Income Pearson Correlation -.454** -.455** Sig. (2-tailed) .001 .001
N 50 50 Compliance Score
Pearson Correlation .156 .107 -.192 Sig. (2-tailed) .279 .458 .181 N 50 50 50
** Correlation significant at p ≤ 0.01 (2 tailed).
Table 7 reports the results of the ANCOVA statistics to test Hypothesis 1. There
was no significant effect of Compliance Score on high school obesity after controlling for
the effects of median income and rurality, F(3, 46) = 1.522, p > .05. There was no

71
statistically significant correlation between state high school student obesity rates and
Compliance Scores, after controlling for median income and degree of urbanization, the
null hypothesis cannot be rejected.
Table 7
Effect of Compliance Score on obesity after Controlling for Median Income and Rurality
Dependent Variable (Obesity) F Sig.
Median Income 9.951 .000*** Rurality 5.623 .021* Compliance Score 1.522 .739
Note. ***p < .01, *p < .05.
Summary
The purpose of this quantitative study was to examine the relationship between
compliance with the Healthy, Hunger-Free Kids Act of 2010 (HHFKA) regulations and
state-level high school obesity rates. Compliance Score data were calculated by
comparing the each state’s school nutrition policy to the 2010 USDA Guidelines for
school meals. As shown in Table 2, the mean nationwide high school obesity rate was
12.5% (SD=2.4%), mean rurality was 26.4% (SD=14.5%), median income was $50,595
(SD=$7,338), and mean Compliance Score was 2.32 (SD=3.16). The 50 states were
divided into two samples, those with some level of compliance (Semi-complaint) with
2010 USDA Guidelines, and states with no compliance (Non-compliant). The mean high
school obesity rate for the Semi-compliant states was 13.2% (SD=2.3%) compared to
11.9% (SD=2.5%) for Non-compliant states, although not a significant difference at
p≤0.10. The mean population residing in rural areas for the Semi-compliant states was
72
28.1% (SD=15.1%) compared to 25.0% (SD=13.7%) for Non-compliant states, although
not a significant difference at p≤0.10. The Semi-compliant states mean obesity rate was
higher than the Non-compliant states.
As shown in Table 6, there was no significant correlation between high school
obesity rates and Compliance Scores (r = .156). There were significant correlations
between high school obesity rates and study covariates of rurality (r = .404), and median
income (r = -.454). In accordance with previous studies, obesity was negatively
correlated with median incomes and positively correlated with population density, and
were treated ass covariates. As shown in Table 7, the null Hypothesis 1 was accepted
there was no statistically significant correlation between state high school student obesity
rates and Compliance Scores, after controlling for median income and degree of
urbanization. Chapter 5 includes a discussion of the findings, conclusions, and
recommendations for future research.

73
Chapter 5: Discussion, Conclusions, and Recommendations
Introduction
The purpose of this quantitative study was to examine the relationship between
compliance with the Healthy, Hunger-Free Kids Act of 2010 (HHFKA) regulations and
state-level high school obesity rates. The HHFKA and the subsequent 2010 USDA
Guidelines represented an attempt to intervene legislatively at the federal level to reduce
nationwide childhood obesity rates. The legislation was passed in response to high
school student obesity rates in the U.S. that had tripled to 12.8% between 1980 and 2011
(CDC, 2013; Ogden et al., 2010). The HHFKA was passed despite the lack of a single
large-scale, longitudinal study on the effect of school nutrition policy on childhood
obesity (Brown & Summerbell, 2009; Gonzalez-Suarez et al., 2009). This study was
particularly timely due to the widespread criticism during the 2014-2015 school year
regarding the 2010 USDA Guidelines and the significant number of school districts that
opted-out of compliance.
State-level data was collected and analyzed for all 50 states on high school
obesity rates, Compliance Scores, state median income, and the proportion of citizens
living in rural areas. Compliance Scores for each state were calculated by comparing
2007 state nutrition policy to the 2010 USDA Guidelines. The supposition was that
obesity is a complex phenomenon and that changes in school cafeteria menus alone are
unlikely to affect high school obesity rates.
The key finding was the absence of a significant relationship between high school
obesity rates and compliance with the 2010 USDA Guidelines. States with the highest

74
high school obesity rates tended to have higher Compliance Scores, which may have been
a function of the early recognition by those states that high school obesity rates warranted
changes to high school nutrition policy. Earlier researcher’s report of a significant
relationship between high school obesity, state median income, and rurality was
confirmed.
Interpretation of Findings
No Significant Correlation between Compliance and Obesity
As shown in Table 7, there was no significant effect of Compliance Score on high
school obesity after controlling for the effects of median income and rurality. While
there are no large-scale or longitudinal precedents for the use of school nutrition policy to
prevent or treat obesity in the literature (Perryman, 2011), the research on obesity
treatment modalities focuses primarily on individualized treatment regimens based on
gender, degree of obesity, individual health risks, psycho-behavioral and metabolic
characteristics, and the efficacy of previous weight loss attempts (Hainer et al., 2008).
The literature on school-based nutritional programs and exercise was mixed, but
generally resulted in modest, short-term weight loss and little or no long-term weight
management benefit. The literature suggests that successful long-term obesity reduction
involves daily physical activity, cognitive behavioral lifestyle modification, and
frequently anti-obesity drugs.
Long-term, widespread increases in high school obesity rates, despite the
devastating individual and societal healthcare costs, suggests that obesity is caused by
multiple interrelated factors and is not subject to influence by knowledge of
75
consequences (Skelton, et al., 2012) . Research suggests that a well-balanced diet rich in
fruit and vegetables is the healthiest lifestyle in terms of obesity. The fact that the
National School Lunch Program (NSLP) provides 33% of the nutritional needs for 28
million school children of low income families makes it an attractive point for federal
intervention. Despite these seemingly related observations, there was no evidence in the
literature, nor in this study, that modifying the amount and types of food provided by
NLSP would have any effect on high school obesity rates. This finding is important in
light of the complaints by school boards that children were throwing away the fruit and
vegetables served in the school cafeteria. Using the NSLP to reduce obesity may have
the perverse effect of children consuming less nutrition than recommended due to
increases in fruit and vegetables that are not consumed.
Obesity Rate Correlated with Median Income and Rurality
As shown in Table 6, obesity rate was positively correlated (r=.404) with
proportion of citizens living in rural areas and the finding was significant at p ≤ 0.01 (2
tailed). As such, as the proportion of the state population living in rural areas increases
so does state high school obesity rate. As shown in Table 6, obesity rate was negatively
correlated (r= -.454) with median income and the finding was significant at p ≤ 0.01 (2
tailed). As such, as median income increases the state high school obesity rate decreases.
Both of these findings are consistent with findings from Gonzalez-Suarez et al. (2009),
and Brown and Summerbell (2009).
As shown in Table 7, median income and rurality both significantly affected high
school obesity based on using the ANCOVA statistic. Since median income was

76
negatively correlated with rurality, this finding demonstrates that rurality contributes to
high school obesity rates even after controlling for median income. Research on the
marginal contribution of rurality after accounting for median income was mixed
(Gonzalez-Suarez et al., 2009). This nation-wide study confirmed median income and
rurality as covariates that independently contributed to high school obesity rates.
Semi-compliant States had Higher Obesity Rates
As shown in Table 3, twenty-three Semi-compliant states adopted an average of
30% of the 2010 USDA Guidelines as of 2007, however the obesity rate for the Semi-
compliant states was 13.2% compared to 12.9% for the 27 states with no compliance at
all. The finding that Semi-compliant states have 11% higher high school obesity rates
was unexpected. This nationwide study used state-level data from all 50 states on high
school obesity rates, compliance with federal nutrition regulations, state median income,
and the proportion of each state’s residents living in rural communities. The 50 states
were divided into two samples, those with some level of compliance (Semi-complaint)
with 2010 USDA Guidelines, and states with no compliance (Non-compliant). The
difference has three potential explanations. First, the Semi-compliant sample median
income was $2,643 lower than the Non-compliant sample. Since lower median income
was shown in both previous studies and in this study to be associated with greater high
school obesity rates, some portion of the difference is reasonably attributable to the
difference in sample median income. Second, the Semi-compliant sample proportion of
citizens living in rural areas was 3.1% higher than the Non-compliant sample. Since a
higher proportion of rural citizenry was associated with greater high school obesity rates

77
in both previous studies and in this study, some portion of the difference is reasonably
attributable to the difference in the sample mean proportion of rural citizenry. Third,
since semi-compliant states have relatively higher high school obesity rates, it may be
that those 23 states initiated changes to school nutrition policy earlier.
Limitations of the Study
Obesity is a complex phenomenon and researchers found SES, genetics, race, and
a number of psychosocial variables to be associated with obesity (Brown & Summerbell,
2009; Gonzales-Suarez et al. 2009). This study aimed to isolate the effect of changing
federal school nutrition policy and high school obesity rates by including median income
and degree of rurality as covariates. Several factors serve to limit the generalizability of
the results. First, unmeasured covariates such as race, SES, or psychosocial factors could
have confound the results. Second, the study used state-level data for all study variables.
Given the considerable variation in study variables and interpretation of the 2010 USDA
Guidelines between schools within a single district, and between school districts, the use
of state-level data may have obfuscated underlying patterns. Third, only 23 of the 50
states were at least partially compliant and their average compliance was less than 33%.
The limited incidence and duration of compliance may have hidden a compliance effect
that would have been apparent using a longer time period for the Compliance Scores.
Fourth, some potential for researcher bias existed. Between state variance in terms of
nomenclature in nutrition, regulations and policy added a level of subjectivity into the
Compliance Score calculation that was not anticipated before the research began. There
is no potential for participant bias, and researcher bias is limited by the use of factual data

78
provided by reliable third parties, all of which are government instrumentalities. The
study’s nationwide scope and reliance on government data was designed to maximize the
usefulness of the findings.
Recommendations
School boards are in the process of implementing the 2010 USDA Guidelines as
stipulated by the HHFKA in order to receive federal reimbursement for school meals
under the NSLP. By school year 2015-2016, it is expected that nearly all public schools
will find ways to bring breakfast and lunch programs into compliance. However, some
districts are opting-out. A recent article in Education Week reported that two New York
school districts, the 4,200-student Niskayuna Central School District and the 1,200-
student Voorheesville district, are foregoing NSLP monies and opted-out of the mandated
nutrition changes (Shah, 2014). Both districts implemented the 2010 USDA Guidelines
and found that the students were discarding substantial amounts of food.
I recommend both large-scale and small scale longitudinal studies be conducted
on the efficacy of using federal and state mandates to effect high school obesity rates.
The opt-out by certain school districts mentioned above creates a control sample of
school districts for comparison to school districts that comply with the 2010 USDA
Guidelines. The research should be done annually using school district-level data on high
school obesity, compliance, median income, and rurality. Data on the change in obesity
rate by school district over time lends itself to a test-retest mean difference methodology
using opt-out school districts as the control group. The validity and reliability of the
study will improve with each successive year of data until the question regarding the

79
efficacy of federal mandate to effect high school obesity is resolved. Once that time
interval and sample sizes are sufficient, perhaps certain school districts would be willing
to modify the meal pattern to test other combinations of nutrition if the 2010 USDA
Guidelines do not significantly reduce high school obesity. I also recommend conducting
the study using individual school districts using known community covariates which are
identified as significant influencers in those areas. In my opinion, each community,
district, and state can have different levels of impact for various covariates.
Implications & Conclusions
High school obesity rates pose a serious threat to the health and well-being of
America’s children. Obesity is a complex phenomenon and the causes for its tripling in
the past 30 years are poorly understood. The HHFKA was passed before completion of
any large-scale, longitudinal studies on the efficacy of school nutrition policy to affect
high school obesity. While there are significant limitations to this study, the absence of a
significant improvement in high school obesity rates between 2007 and 2012 for states
with at least some compliance suggests the limitations of using federal policy affect high
school obesity rates. The fact that a significant number of school boards have
affirmatively opted-out of the HHFKA mandates highlights the risks of using a one-size-
fit all federal approach to a complex phenomenon. Recent pronouncements from the
Obama administration signal changes to the HHFKA in response to those criticisms. The
absence of scientific evidence that the HHFKA has any effect on childhood obesity rates
leaves administrators without a basis for deciding which, if any, regulations should be

80
kept or discarded. Sweeping federal changes to something as critical as children’s food
should be done based on large-scale, longitudinal studies.

81
References
2010 USDA Dietary Guidelines for Americans. (2010). Retrieved from Health.gov:
http://www.cnpp.usda.gov/publications/dietaryguidelines/2010/policydoc/policyd
oc.pdf.
A Child’s Day: 2009 Detailed Tables. (2009). Retrieved from US Census Bureau:
http://www.census.gov/hhes/socdemo/children/data/sipp/well2009/tables.html.
Adair, l., Ng, S., & Popkin, B. (2012). Global nutrition transition and the pandemic of
obesity in developing countries. Nutrition Reviews, 70(1), 3–21.
Alderman, J., Smith, J. A., Fried, E. J., & Daynard, R. (2007). Application of law to the
childhood obesity epidemic. Journal of Law, Medicine, and Ethics, 35(1), 90-
112.
Anderson, P. M., & Butcher, K. M. (2006). Childhood obesity, trends and potential
causes.The Future of Children, 16(1). Retrieved from www.futureofchildren.org.
Baker, J., Olsen L., & Sorensen, T. (2007). Childhood Body-Mass Index and the risk of
coronary heart disease in adulthood. New England Journal of Medicine, 357(23),
2329-2337.
Bonnett, D., & Wright, T. (2000). Sample size requirements for estimating Pearson,
Kendall and Spearman correlations. Psychometrica, (65)1, 33-28.
Brown, T., & Summerbell, C. (2009). Systematic review of school-based interventions
that focus on changing dietary intake and physical activity levels to prevent
childhood obesity: an update to the obesity guidance produced by the National
Institute for Health and Clinical Excellence. Obesity Review, 10(1), 110-141.
82
Buchanan, B. (2005). Getting to Wellness. In Getting to Wellness (pp. 4-7) [Brochure].
Alexandria, VA: National School Boards Association.
Burns, T., Letuchy, E., & Witt, J. (2009). Childhood Predictors of the Metabolic
Syndrome in Middle-aged Adults: The Muscatine Study. Journal of Pediatric
Obesity, 155(3): S5.e17–S5.e26.
Castaneda, T., Jurgens, H., & Wiedmer, P. (2009). Obesity and the neuroendocrine
control of energy homeostasis: the role of spontaneous locomotor activity.
Journal of Nutrition, 135, 1314–9.
CBS. (2014). U.S. to relax healthy school lunch rules after student complaints. Retrieved
from http://www.cbsnews.com/news/us-to-relax-healthy-school-lunch-rules-due-
to-student-complaints/ on February, 12, 2014.
Centers for Disease Control and Prevention. (2006). Overweight among students in
grades K-12--Arkansas, 2003-04 and 2004-05 school years. Morbidity Mortality
Weekly Report, 13;55(1):5-8.
Center for Disease Control [CDC]. (2012). Health, United States, 2012. Retrieved from
http://CDC.gov.
Centers for Disease Control. (2013). Childhood obesity. http://www.cdc.gov/obesity/
childhood/defining.html
Center for Science in the Public Interest (2013). Retrieved from
http://www.cspinet.org/nutritionpolicy/nana.html.
Census Bureau. (2012). Statistical Abstract. Retrieved from
https://www.census.gov/compendia/statab/

83
Creswell, J. W. (2007). Research design: Qualitative and quantitative approaches (2nd
ed.). Thousand Oaks, CA: Sage.
Ello-Martin, J., Ledikwe, J., & Rolls, B. (2005). The influence of food portion size and
energy density on energy intake: implications for weight management. American
Journal of Clinical Nutrition, 82:236S–241S.
Epstein, L., Gordy, C., & Raynor, H. (2009). Increasing fruit and vegetable intake and
decreasing fat and sugar intake in families at risk for childhood obesity. Obesity
Research, 3, 171–8.
Federal Register. (2010). Retrieved from http://www.gpo.gov/fdsys/pkg/PLAW-
111publ296/html/PLAW-111publ296.htm.
Faul, F., Erdfelder, E., Buchner, A., & Lang, A. (2009). Statistical power analyses using
G*Power 3.1: Tests for correlation and regression analyses. Behavior Research
Methods, 41, 1149-1160.
Foster, G., Sherman, S. Borradaile, K. Grundy, K., Veur, S., Nachmani, J., Karpyn, A.,
Kumanyika, S., & Shultz, J. (2008). A Policy-Based School Intervention to
Prevent Overweight and Obesity. Journal of the American Academy of Pediatrics.
Vol. 121. No. 4. 794 -802.
Gonzalez-Suarez, C., Worley, A., Grimmer-Somers, K., & Dones, V. (2009). School-
Based Interventions on Childhood Obesity A Meta-Analysis. American Journal of
Preventive Medicine, 52(2):239-267.

84
Gostin, L. O., Pomeranz, J. L., Jacobson, P. D., & Gottfried, R. N. (2009). Assessing
laws and legal authorities for obesity prevention and control. Journal of Law,
Medicine, & Ethics, 28-36.
Hainer, V., Toplak, H., & Mitrakou, A (2008). Treatment modalities of obesity: what fits
whom? Diabetes Care. 31 Suppl 2:S269-77.
Hall, K., Sacks, G., Chandramohan, D., Chow, C., Wang, Y., Gortmaker, S., &
Swinburn, B. (2011). Quantification of the effect of energy imbalance on
bodyweight. Lancet, 378:826–836.
Hill, J., Holly, R. Wyatt, W., & Peters, J. (2012). Energy Balance and Obesity.
Circulation, Journal of the American Heart Association, 126:126-132.
Institute of Education Sciences, (2014). Projection of Education Statistics to
2021. Retrieved from
http://nces.ed.gov/programs/projections/projections2021/tables/table_01.a
sp
Institute of Medicine (IOM) (2014). Preventing childhood obesity: Health in the balance.
Washington, DC: National Academy of Sciences.
Katz D., O'Connell, M., Njike, V., Yeh, M., & Nawaz, H. (2009). Strategies for the
prevention and control of obesity in the school setting: Systematic review and
meta-analysis. International Journal Obesity (Lond.), 32 (12): 1,780-1,789.
Kitzman-Ulrich, H., Hampson, R., Wilson, D., Presnell, K., Brown, A., & O’Boyle, M.
(2009). An adolescent weight-loss program integrating family variables reduces
energy intake. Journal of American Diet Association, 109: 491–496.

85
Kong, A., Sussman, A., Yahne, C., Skipper, B., Burge, M., & Davis, S. (2013). School-
Based Health Center Intervention Improves Body Mass Index in Overweight and
Obese Adolescents. Journal of Obesity, Volume 2013, Article ID 575016, 10
pages.
Klein, D., & White, J. (2008). Family Theories. 3rd Edition. Thousand Oaks: Sage
Publications.
Labayen, I., Diez, N., & Gonzalez, A. (2003). Effects of protein vs. carbohydrate-rich
diets on fuel utilization in obese women during weight loss. Forum Nutrition,
56:168–70.
League of Women Voters [LWV]. (2011). The history of federal government in public
education: Where have we been and how did we get here? Washington, DC:
League of Women Voters of the United States.
Leedy, P. D. & Ormrod, J. E. (2012). Practical research: Planning and design (10th
Edition). Pearson: London, England.
Lowi, T. J., & Ginsberg, B. (1994). American Government: Freedom and Power (3rd
ed.). New York, NY: W.W. Norton & Company.
Lutes, L., Daiss, S., Barger, S., Read, M., Steinbaugh, E., & Winett, R. (2012). Small
changes approach promotes initial and continued weight loss with a phone-based
follow-up: 9-month outcomes from ASPIRES II. American Journal of Health
Promotion, 26:235–238.

86
Malik, V., Pan, A., Willett, W., & Hu, B. (2013). Sugar-sweetened beverages and weight
gain in children and adults: a systematic review and meta-analysis. American
Journal of Clinical Nutrition, (98)4, 1084 – 1102.
Mayer, J., Purnima, R., & Mitra, K. (1956). Relation between caloric intake, body weight
and physical work: studies in an industrial male population in West Bengal.
American Journal of Clinical Nutrition, 4:169–175.
Mayr, S., Erdfelder, E., Buchner, A., & Faul, F. (2007). A short tutorial of GPower.
Tutorials in Quantitative Methods for Psychology , 3, 51-59.
Mermin, S. E., & Graff, S. K. (2009). A legal primer for the obesity prevention
movement. American Journal of Public Health, 99(10), 1799-1805.
National Alliance for Nutrition and Activity (NANA). (2013). Model local school
wellness policies on physical activity and nutrition. Retrieved from
http://www.schoolwellnesspolicies.org/resources/ NANAWellnessPolicies.pdf.
National Association os School Board Executives [NASBE]. (2013). State School Health
Policy Database. Retrieved from
http://nasbe.org/healthy_schools/hs/bytopics.php?topicid=3110&catExpand=acdn
btm_ca
National Institute for Health and Clinical Excellence (NICE). (2013). Obesity: The
prevention, identification, assessment and management of O\overweight and
obesity in adults and children. London, UK: NICE.
Nestle, M. (2007). Food politics: How the food industry influences nutrition and health.
Berkeley and Los Angeles, CA: University of California Press.

87
Ogden, C., Carroll, M., Curtin, L., Lamb, M., & Flegal, K. (2010). Prevalence of High
Body Mass Index in US Children and Adolescents, 2007-2008, JAMA. Vol. 303,
no. 3. 242-249.
Owens, S. (2013). Childhood Obesity and the Metabolic Syndrome. American Journal of
Lifestyle Medicine, Vol. 7, No. 5, 315-32.
Perryman, M. (2011). Ethical family interventions for childhood obesity. Prevention
Chronic Diseases, 8(5):A99.
Prentic, A., & Jebb, S. (2010). Beyond body mass index. Obesity Review, 2:141-147.
Prospective Studies Collaboration. (2009). Body-mass index and cause-specific mortality
in 900,000 adults: collaborative analyses of 57 prospective studies. Lancet,
373:1083-1096.
Reilly, J.J., Ness, A.R., & Sherriff, A. (2007). Epidemiological and physiological
approaches to understanding the etiology of pediatric obesity: finding the needle
in the haystack. Pediatric Research, 61:646-652.
Richards, E. P., & Rathbun, K. C. (1999, July). The role of the police power in 21st
century public health. Sexually Transmitted Diseases, 26(6), 350-357.
Romero-Corral A., Montori V.M., Somers V.K., Korinek J., Thomas R.J., & Allison, T.
(2006). Association of bodyweight with total mortality and with cardiovascular
events in coronary artery disease: a systematic review of cohort studies. Lancet,
368:666-678.
Rousseeuw, P., & Leroy, A. (2003). Robust Regression and Outlier Detection. New
York, New York:Wiley.

88
Ryan, K. W., Card-Higginson, P., Shaw, J. L., Ganahl, S. A., & Thompson, J. W. (2007).
Law and the public’s health: Public health “malpractice” and the obesity
epidemic. Public Health Reports, 122, 414-416.
School Nutrition Association (SNA). (2013). State Policy Index. Retrieved from
http://docs.schoolnutrition.org/childnutrition/govtaffairs/statutes/
Schutz, Y., Flatt, J., & Jequier, E. (1989). Failure of dietary fat intake to promote fat
oxidation: a factor favoring the development of obesity. American Journal of
Clinical Nutrition, 50:307–14.
Schwartz, M. B., & Brownell, K. D. (2007). Actions necessary to prevent childhood
obesity: Creating the climate for change. Journal of Law, Medicine, & Ethics,
35(1), 78-89.
Shah, N. (2014). Schools are opting-out of School Nutrition Rules. Retrieved from
http://www.edweek.org/ew/articles/2013/02/06/20brief-4.h32.html
Shek, K. (2004). Schools Should Increase their Role in Fighting Obesity. Education
Daily, 37(6).
Skelton, A., Buehler, B., Irby, M., & Grzywacz, J. (2010). Where are family theories in
family-based obesity treatment?: Conceptualizing the study of families in
pediatric weight management. International Journal of Obesity, vol. 2 no. 1 100-
107.
Sobol-Goldberg, S., Rabinowitz, J., & Gross, R. (2013). School-based obesity prevention
programs: a meta-analysis of randomized controlled trials. Obesity, 21(12):2422-
8.

89
Stange, K. (2010). Power to Advocate for Health. Annals of Family Medicine, vol. 8 no. 2
100-107.
State Policy Index. (2012). Retrieved from School Nutrition Association.org:
http://docs.schoolnutrition.org/childnutrition/govtaffairs/statutes.
State School Health Policy Database. (2012). Retrieved from National Association is
State Boards of Education:
http://nasbe.org/healthy_schools/hs/bytopics.php?topicid=3110&catExpand=acdnbtm
_cat.
Swinburn, B., Sacks, S., & Ravussin, E. (2009). Increased food energy supply is more
than sufficient to explain the US epidemic of obesity. Am J Clin Nutr.
2009;90:1453–1456.
Tabachnick, B., & Fidell, L. (2001). Using multivariate statistics (4th ed.). Boston, MA:
Allyn and Bacon.
Thorpe, K. E. (2009). The future costs of obesity: National and state estimates of the
impact of obesity on direct health care expenses. United Health Foundation, the
American Public Health Association, and Partnership for Prevention.
USDA. (2010). 2010 dietary guidelines for Americans. Retrieved from Health.gov:
http://www.cnpp.usda.gov/publications/dietaryguidelines/2010/policydoc/policyd
oc.pdf
USDA. (2011). Nutrition standards in the national school lunch and school breakfast
programs. Federal Register, 76(9).

90
USDA (2012). Compliance support. [Brohure]. Retrieved from usda.gov:
http://www.fns.usda.gov/cnd/governance/legislation/USDAFoods.pdf
USDA. (2014.). Dietary specifics. [Pamphlet]. Retrieved from USDA.gov:
http://www.fns.usda.gov/cnd/governance/legislation/dietaryspecs.pdf
USDA: Healthy, Hunger-Free Kids Act. (HHFKA). (2010). 2010 Healthy, hunger-free
kids act.
http://www.fns.usda.gov/cnd/governance/legislation/cnr_2010.htm.
U.S. Census Bureau. (2013). 2010 Census Urban and Rural Classification and Urban
Area Criteria. Retrieved from http://www.census.gov/geo/reference/urban-
rural.html
U.S. Census Bureau. (2012). Student Demographics. Retrieved from:
www.cdc.gov/obesity.
http://www.fns.usda.gov/nslp/national-school-lunch-program.
U.S. Centers for Disease Control and Prevention. (2012). Trends in the Prevalence of
Obesity, Dietary Behaviors, and Weight Control Practices National YRBS: 1991-
2011. (Accessed May 2014).
U.S. Department of Health and Human Services. (1996). Physical activity and health: A
report of the surgeon general. Washington DC: National Center for Chronic
Disease Prevention and Health Promotion, U.S. Department of Health and Human
Services, and Centers for Disease Control and Prevention.

91
U.S. Department of Health and Human Services. (2001). Promoting better health for
young people through physical activity and sports. Retrieved from
http://fitness.gov/betterhealth/ppar.pdf
U.S. Department of Health and Human Services. (USDHHS) (2001). The surgeon
general’s call to action to prevent and decrease overweight and obesity.
Retrieved from http://www.surgeongeneral.gov/topics/obesity/calltoaction/
CalltoActionl.pdf
Wilborn, C. (2005). Obesity: Prevalence, Theories, Medical Consequences, Management,
and Research Directions. Journal Internal Society of Sports Nutrition, 2(2): 4–31.
Zhang, Q., Zheng, B., Zhang, N., & Wang, Y. (2011). Decomposing the Intergenerational
Disparity in Income and Obesity. B.E. Journal of Economic Analysis & Policy,
vol. 11(3), pp. 1-18.

92
Appendix A: Additional Key Search Terms
Key Search Terms / Keywords
Competitive foods
Community based obesity interventions Comprehensive school health Establishment of nutritional breakfast and lunch Federal nutrition guidelines Nutrition education Nutrition guidelines Nutritional standards for school nutrition program Obesity interventions School-based interventions School breakfast School food programs School health promotion School Lunch Program School lunch program reimbursements School wellness policies taskforce Standards for food sold on school premises USDA guidelines 2005 USDA guidelines 2010
Vending machines in schools

93
Appendix B: Compliance Scoring Sheet
2010 USDA Guidelines - Grades 9 - 12
State Name_______________________
Data Source(s)____________________
Breakfast Item (weekly amounts)
C = Compliant Lunch Item (weekly amounts)
C = Compliant
Calories (525 ± 75) Calories (800 ± 50)
Fluid Milk (5 cups) Fluid Milk (5 cups)
Fruit (5 cups) Fruit (5 cups)
Grains (9-10 oz.) Grains (9-10 oz.)
Protein (7-10 oz.) Protein (10-12 oz.)
Saturated Fat (10%) Saturated Fat (10%)
Sodium (≤ 740 mcg) Sodium (≤ 740 mcg)
Trans-fat (0) Trans-fat (0)
Vegetables (5 cups)
Sub-Score =
Total Score =

94
Appendix C: Compliance Score Tracking Spreadsheet
State Policy Meal_PatternAL Y Fruit N Non-Compliant N Non-CompliantAL Y Vegetables N Non-CompliantAL Y Vegetables_DarkGreen N Non-CompliantAL Y Vegetables_Oranges N Non-CompliantAL Y Vegetables_Legumes N Non-CompliantAL Y Vegetables_Starchy N Non-CompliantAL Y Vegetables_Other N Non-CompliantAL Y Grains N Non-Compliant N Non-CompliantAL Y Meats N Non-Compliant N Non-CompliantAL Y Fluid Milk C Compliant C CompliantAL Y Calories N Non-Compliant N Non-CompliantAL Y Saturated_Fat C Compliant C CompliantAL Y Sodium N Non-Compliant N Non-CompliantAL Y Trans_fat C Compliant C CompliantAL Compliance Sub-scores 3 3AL Compliance Score 6
StatusStatus
LUNCHGrades 9-12
BREAKFAST Grades 9-12

95

96
Appendix D: Study Variables by State
State 2013
Obesity Rate (1)
2013 % Rural
Population (2)
2013 Median
Income (3)
2007 2013 Compliance Population Score (2)
Alabama 17.1% 41.0% $42,590 2 4,779,736 Alaska 12.4% 34.0% $57,431 2 710,231 Arizona 10.7% 10.2% $48,621 4 6,392,017 Arkansas 17.8% 43.8% $41,302 2 2,915,918 California (4) 15.1% 5.0% $53,367 4 37,253,956 Colorado (4) 7.0% 13.8% $58,629 - 5,029,196 Connecticut 12.3% 12.0% $65,415 6 3,574,097 Delaware 14.2% 16.7% $54,660 2 897,934 Florida 11.6% 8.8% $45,105 - 18,801,310 Georgia 12.7% 24.9% $45,973 - 9,687,653 Hawaii 13.4% 8.1% $59,047 - 1,360,301 Idaho 9.6% 29.4% $47,459 7 1,567,582 Illinois 11.5% 11.5% $50,637 - 12,830,632 Indiana (4) 15.0% 27.6% $44,445 - 6,483,802 Iowa (4) 13.0% 36.0% $50,219 - 3,046,355 Kansas 12.6% 25.8% $46,147 - 2,853,118 Kentucky 18.0% 41.6% $39,856 - 4,339,367 Maine 11.6% 61.3% $40,658 - 1,328,361 Louisiana 13.5% 26.8% $49,693 - 4,533,372 Maryland 11.0% 12.8% $68,876 - 5,773,552 Massachusetts 10.2% 8.0% $63,313 - 6,547,629 Michigan 13.0% 25.4% $48,879 9 9,883,640 Minnesota (4) 14.0% 26.7% $57,820 3 5,303,925 Mississippi 15.4% 50.7% $41,090 4 2,967,297 Missouri 14.9% 29.6% $45,774 - 5,988,927 Montana 9.4% 44.1% $40,277 - 989,415 Nebraska 12.7% 26.9% $55,616 6 1,826,341 Nevada 11.4% 5.8% $47,043 4 2,700,551 New Hampshire 11.2% 39.7% $65,880 - 1,316,470 New Jersey 8.7% 5.3% $62,338 - 8,791,894 New Mexico 12.6% 22.6% $41,982 - 2,059,179 New York 10.6% 12.1% $50,636 6 19,378,102 North Carolina 12.5% 33.9% $45,206 7 9,535,483 North Dakota 13.5% 40.1% $56,361 - 672,591 Ohio 13.0% 22.1% $44,648 - 11,536,504 Oklahoma 11.8% 33.8% $48,455 - 3,751,351 Oregon (4) 9.9% 19.0% $51,526 2 3,831,074 Pennsylvania (4) 13.5% 21.3% $49,910 2 12,702,379 Rhode Island 10.7% 9.3% $49,033 11 1,052,567 South Carolina 13.9% 33.7% $40,084 4 4,625,364

97
South Dakota 11.9% 43.3% $47,223 4 814,180 Tennessee 16.9% 33.6% $42,279 8 6,346,105 Texas 15.7% 15.3% $49,047 - 25,145,561
Appendix D: Study Variables by State (cont’d)
State
2013
Obesity Rate (1)
2013
% Rural Population
(2)
2013
Median Income (3)
2007
Compliance Score
2013 Population
(2)
Utah 6.4% 9.4% $55,493 - 2,763,885 Vermont 13.2% 61.1% $51,862 6 625,741 Virginia 12.0% 24.5% $62,616 - 8,001,024 Washington (4) 10.0% 16.0% $56,850 - 6,724,540 West Virginia 15.6% 51.3% $41,821 11 1,852,994 Wisconsin 11.6% 29.8% $52,058 - 5,686,986 Wyoming 10.7% 35.2% $54,509 - 563,626 Median 12.6% 26.3% $49,370 0.00 4,436,370 Mean 12.5% 26.4% $50,595 2.32 6,162,876 Population-Weighted Mean 12.9% STD 2.5% 14.6% $7,522 6,848,235
Notes: (1) High School Obesity Rates (CDC, 2014). (2) U.S. Census Bureau (Census Bureau, 2014). (3) U.S. Census Bureau (Census Bureau, 2014a). (4) Robert Wood Johnson Foundation: The State of Obesity 2014 (RWJF, 2014).