the high return to low-cost private schooling in high return to low-cost private schooling in a ......
TRANSCRIPT

Working paper
The High Return to Low-Cost Private Schooling in a Developing Country
Tessa Bold Mwangi Kimenyi Germano Mwabu Justin Sandefur February 2012
When citing this paper, please use the title and the following reference number: F-6009-KEN-1

The High Return to Low-Cost Private Schooling in aDeveloping Country
Tessa Bold, Mwangi Kimenyi, Germano Mwabu and Justin Sandefur⇤
February 28, 2012
Abstract
Can market solutions provide cost-e↵ective alternatives to failing public servicedelivery systems in developing countries? Existing studies from the U.S., Latin Americaand Asia provide little evidence that private schools lead to large gains in academicperformance relative to public schools. Using data from Kenya – a poor country withweak public institutions – we find a large e↵ect of private schooling on test scores,equivalent to one full standard deviation. This finding is robust to endogenous sortingof more able pupils into private schools. The magnitude of the e↵ect greatly exceedsthe most cost-e↵ective interventions to increase public school performance documentedin the literature. Combining household survey and administrative data, we estimatemedian expenditure per pupil is just $41 per annum in the private sector, comparedto $84 in government primary schools.
1 Introduction
Despite widespread policy interest in market solutions to public service delivery, a large
literature on the e↵ect of private schooling on academic achievement shows little or no causal
benefit. In a much-cited paper, Hsieh and Urquiola (2006) find that a voucher program
that dramatically expanded private schooling in Chile led to no discernible increase in test
scores over time. For the U.S., Altonji, Elder, and Taber (2005) find little or no impact of
⇤Bold: Institute for International Economic Studies, Stockholm University, [email protected]. Ki-menyi: Brookings Institution, Washington D.C., [email protected]. Mwabu: Department of Eco-nomics, University of Nairobi, [email protected]. Sandefur: Center for Global Development, WashingtonD.C., [email protected].
1

Catholic schooling on test scores after controlling for selection e↵ects. Similarly for Indonesia,
Newhouse and Beegle (2011) find that private schooling has a significant, negative e↵ect on
test scores. Angrist, Bettinger, Bloom, King, and Kremer (2002) find significantly positive,
but modest e↵ects from a policy experiment in Colombia, with recipients of randomly-
allocated vouchers scoring roughly 0.2 standard deviations higher than non-recipients.
In this paper we demonstrate that in a low-income African country with weak public-
sector institutions, i.e. Kenya, the e↵ect on test scores of moving to private schooling may
be dramatically higher than found in previous work in the U.S., Latin America or Asia.1
Over the past decade, private school enrollment has grown rapidly in Kenya. In a com-
panion paper, we argue that this secular trend was driven, somewhat paradoxically, by the
abolition of fees in public primary schools in 2003, and the concomitant decline in the per-
ceived quality of public schools (Bold, Kimenyi, Mwabu, and Sandefur 2011).
The main contribution of the paper lies in estimating the causal e↵ect of private school-
ing on test performance for Kenyan primary school students using nationwide standardized
test scores. An obvious obstacle here is the endogenous sorting of pupils. The key to our
identification strategy is aggregation, in the spirit of Hsieh and Urquiola (2006). The growth
of private enrollment will only a↵ect average scores in a district – aggregating over both
public and private schools – inasmuch as there is a genuine causal force at work. Controlling
for time-invariant district characteristics, we document a large performance advantage of
Kenyan private schools, equivalent to a full standard deviation of pupil-level test scores.
Furthermore, we use survey data on households’ education expenditure to show that
Kenyan private schools operate at low cost relative to public schools: nearly two-thirds
of pupils in the private system pay fees less than the median per-pupil funding level in
1Notably, Cox and Jimenez (1991) show that private secondary schools perform poorly relative to gov-ernment schools in Tanzania. This highlights a common feature of both the Kenyan and Tanzanian schoolsystem: while government primary schools lag behind private schools in test performance, selective govern-ment secondary schools remain competitive.
2

Table 1: Achievement: Summary Statistics for KCPE ExamsAverage Score Pupils Sitting Exam
Priv PrivAll Gov’t Priv Premium All Gov’t Priv Share
1998 247 245 281 14.7% 441,742 420,406 21,336 4.8%1999 247 245 286 16.7% 450,030 426,486 23,544 5.2%2000 247 245 288 17.6% 475,951 449,255 26,696 5.6%2001 247 244 291 19.3% 509,325 476,988 32,337 6.3%2002 247 244 291 19.3% 534,865 495,757 39,108 7.3%2003 247 243 297 22.2% 583,439 539,175 44,264 7.6%2004 247 243 297 22.2% 652,224 598,649 53,575 8.2%2005 247 243 290 19.3% 665,644 600,767 64,877 9.7%Averages scores are based on school-level data, weighted by the number of pupils sitting the exam in each
school. Scores are re-based each year so that the national average is constant. This re-basing preserves
changes in relative performance between sub-groups of test takers.
government schools.
2 The raw achievement gap
Our performance measure is provided by scores on the Kenya Certificate of Primary Educa-
tion (KCPE) examination, administered to all pupils completing primary school nationwide,
in public and private schools.
Table (1) shows the trajectory of KCPE scores over time for public and private schools
separately. The raw achievement gap between these sectors is both large – ranging from
14.7% to 22.2% – and increasing over most of the period. The upward trend in private
school enrollment is also visible in the share of test-takers from private schools, increasing
from 4.8% in 1998 to 9.7% in 2005.
3
3 Identification strategy
We use the KCPE exam data to estimate the e↵ect of private schooling on achievement, and
further, to test whether this causal performance gap changed over time.
The key to our identification strategy is aggregation. Clearly, private schools may out-
perform public schools either because of the causal influence of private schooling on scores,
or the selection of more able students into private schooling, or some combination of both.
However, the transfer of pupils from public to private schools will only a↵ect average scores
– aggregating over both public and private schools – inasmuch as there is a genuine causal
force at work.
Following on this logic, we take as our dependent variable the average score across both
public and private schools for all students of a given gender, in a given district, and a given
year. These cells are chosen to be as small as possible to allow su�cient degrees of freedom
for estimation, but large enough so that students cannot endogenously select out of their
cell. We regress these average scores on the proportion of pupils in private schools within the
gender-district-year cell, controlling for cell-specific fixed e↵ects. Furthermore, we control
for common time trends using year dummies.
The consistency of our fixed-e↵ects estimates hinges on the strict exogeneity of private
enrolment shares conditional on an unobserved district-gender-cell e↵ect. Translating this
strict exogeneity assumption to our application, we require that (i) students choose between
government and private schools within their own district, and (ii) year-to-year changes in
the proportion of pupils in private schools within a given district are driven primarily by
supply-side factors. The second assumption is justified in the Kenyan context given the large
supply-side shock of the FPE reform. Additionally, the exogenous flow of new graduates from
teacher-training colleges (combined with a hiring freeze in government schools since 2001) is
a key factor behind the growth of the private system.
4
To be explicit about the limitations of our approach, note that the results would be
compromised by district-level, idiosyncratic shocks to the demand for private schooling that
also directly influence exam performance. An example of such a shock would be a district-
specific (positive) income shock that increases households’ ability to pay for private schooling,
and also increases human capital accumulation through, say, improved nutrition.
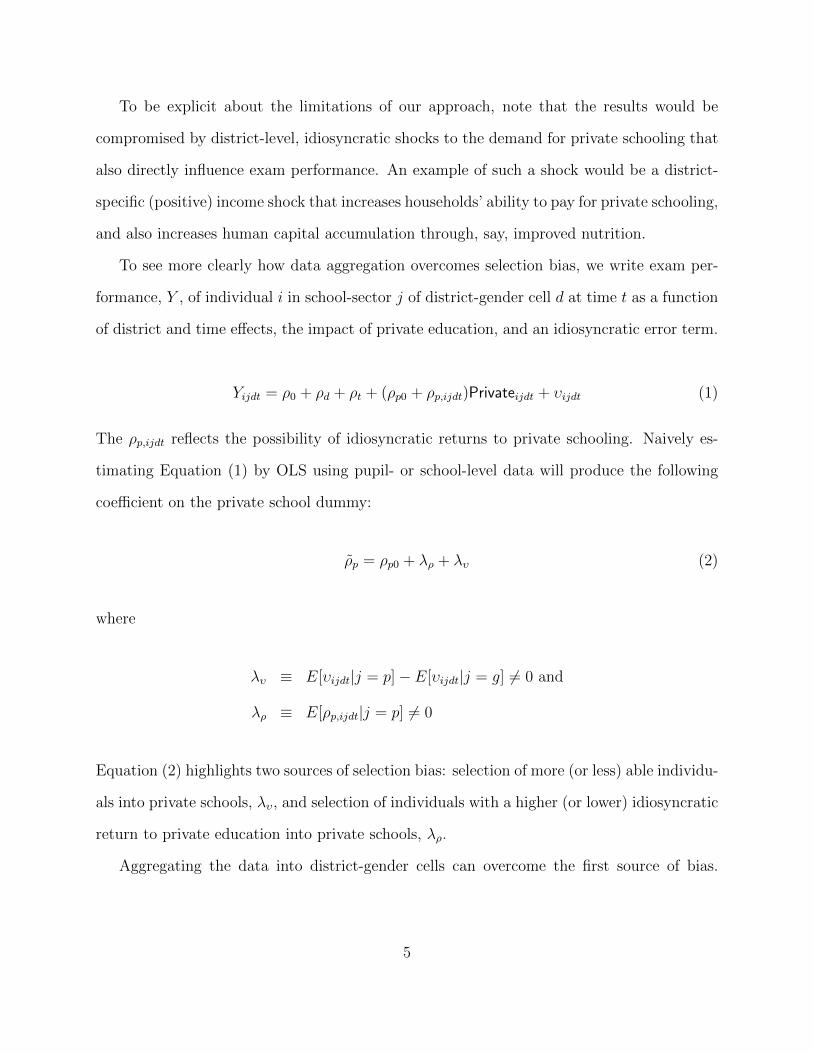
To see more clearly how data aggregation overcomes selection bias, we write exam per-
formance, Y , of individual i in school-sector j of district-gender cell d at time t as a function
of district and time e↵ects, the impact of private education, and an idiosyncratic error term.
Yijdt = ⇢0 + ⇢d + ⇢t + (⇢p0 + ⇢p,ijdt)Privateijdt + �ijdt (1)
The ⇢p,ijdt reflects the possibility of idiosyncratic returns to private schooling. Naively es-
timating Equation (1) by OLS using pupil- or school-level data will produce the following
coe�cient on the private school dummy:
⇢̃p = ⇢p0 + �⇢ + �� (2)
where
�� ⌘ E[�ijdt|j = p]� E[�ijdt|j = g] 6= 0 and
�⇢ ⌘ E[⇢p,ijdt|j = p] 6= 0
Equation (2) highlights two sources of selection bias: selection of more (or less) able individu-
als into private schools, ��, and selection of individuals with a higher (or lower) idiosyncratic
return to private education into private schools, �⇢.
Aggregating the data into district-gender cells can overcome the first source of bias.
5

Estimation of Equation (1) by OLS using cell-level data yields
⇢̂p = ⇢p0 + �⇢ (3)
where the �� term drops out due to averaging. In the terminology of the evaluation literature,
⇢̂p is a local average treatment e↵ect, measuring the average return to private schooling for
those who choose to enrol in private schools.
We are also interested in whether the private-school premium changed over time, espe-
cially in the wake of FPE. We investigate this through a simple interaction term. Thus our
final estimating equation is,
Y dt = ⇢0 + ⇢d + ⇢t + ⇢p0Privatedt + ⇢p1Privatedt ⇥ FPEt + �dt, (4)
using a panel of average KCPE scores. Equation (4) is an aggregate achievement production
function that nets out all individual level and compositional sorting e↵ects on achievement.
The coe�cient on Private therefore measures – under plausible identification assumptions –
all value added of private schools (including spillovers in achievement from peers).
4 Results
Table (2) shows the results from estimating variants of Equation (4), with various combina-
tions of district and year fixed e↵ects.
As a benchmark, columns 1 and 2 regress school-level test scores on a private-school
dummy using disaggregated school data. The estimated ‘e↵ect’ of private schooling is thus
potentially biased by endogenous selection of more able pupils into private schools. Never-
theless, the gap between public and private schools is large (51.4 exam points) and as seen
6

Tab
le2:
Achievement:
Determinan
tsof
Exa
minationScores
Disaggregated
Aggregatedby
schoo
ldata
district&
gender
cells
(1)
(2)
(3)
(4)
(5)
(6)
(7)
Private
51.4
45.4
64.0
60.2
60.6
91.9
64.2
(3.0)⇤
⇤⇤(3.0)⇤
⇤⇤(26.7)⇤
⇤(24.0)⇤
⇤(22.1)⇤
⇤⇤(18.3)⇤
⇤⇤(20.5)⇤
⇤⇤
Private
⇥FPE
11.6
4.6
.95.1
-2.2
(2.2)⇤
⇤⇤(6.5)
(6.2)
(7.2)
(6.0)
Total
enrolm
ent
-4.1
-3.9
-3.9
(.9)⇤
⇤⇤(.8)⇤
⇤⇤(.8)⇤
⇤⇤
Con
stan
t233.2
233.6
232.6
232.8
241.6
240.2
242.2
(1.0)⇤
⇤⇤(1.0)⇤
⇤⇤(1.3)⇤
⇤⇤(1.3)⇤
⇤⇤(2.2)⇤
⇤⇤(2.0)⇤
⇤⇤(2.0)⇤
⇤⇤
Tim
eFE
Yes
Yes
Yes
Yes
Yes
Yes
Yes
CellFE
Yes
Yes
Yes
Yes
Yes
Yes
Yes
Droppingou
tliers
No
No
No
No
No
Yes
Yes
Sam
ple
ofschoo
lsAll
All
All
All
All
All
Pan
elObs.
262,562
262,562
1,182
1,182
1,182
1,060
976
Inthefirsttw
ocolumns,
thedep
endentvariab
leis
theaverageKCPE
examinationscore
forallpupilsofagiven
gender
inagiven
school.
Columns5on
wardaggregateover
publican
dprivate
schools
foreach
district,separately
bygender.“Totalenrolm
ent”
isthetotalnumber
of
childrentakingtheKCPE
exam
inthedistrict-gender-yearcell,measuredin
’000s.
“Private”is
adummyforenrolm
entin
private
schooling,
or–when
aggregatingover
schoolsin
columns3-7
–theproportionofthesestudents
whoare
enrolled
inprivate
schools.“Tim
eFE”represent
dummiesforeach
year;“cellFE”referto
dummiesforeach
district-gender
cell.
7
in column 2, widens significantly over time.2
Columns 3 to 7 use aggregated data from the district-gender cells, removing the e↵ects of
endogenous sorting from the estimated private-schooling coe�cients. The 262,562 primary
schools in the sample are collapsed into 1,182 cells, representing the 75 districts over 8 years,
separated by gender. In all specifications, the private schooling e↵ect remains large and
significant. With the inclusion of both location and time e↵ects, we find a gap between
private and public schools of 64 exam points, or roughly one standard deviation of the
underlying pupil-level test scores.3
Including an interaction term between the private-school and FPE dummies in columns
4-7 shows that the private-school e↵ect did not increase under FPE. Thus the increased
public-private gap in the raw data over this period shown in Table 1 is likely attributable to
increased sorting of more able or better prepared pupils into private schools after FPE.
Columns 5 to 7 perform additional robustness checks. A first concern is that results may
be biased by idiosyncratic increases in the overall demand for education in a district over
time. To address this, we include an additional control for total enrolment spanning both
public and private schools in each district cell, which acts as a time-varying proxy for the
demand for education in the district. While the coe�cient on this term is significant, it
does not undermine the core result for private schooling. A second concern is that results
may be driven by outliers. Column 6 drops districts containing the largest 1% of year-
on-year changes in KCPE scores or private enrolment shares – leading to a loss of seven
2Using school-level averages, the mean score in the regression sample is 247.1, with a standard deviationof 42.5 points. However, for consistency with the literature, we report e↵ect sizes relative to the standarddeviation of the underlying pupil -level data. While we do not have access to pupil-level data for the sampleused here, 2010 pupil-level data available at yields an estimated standard deviation of 65.0 points, which wetake as our denominator for e↵ect sizes throughout the paper.
3This very large implied e↵ect refers to a binary switch from government to private schooling, which isrelevant for an individual pupil but not for a district. The national increase in the proportion of private-school test-takers from 1998 to 2005 was roughly 4.9%. Thus our econometric estimates imply that thisfairly dramatic expansion of private schooling led to a 5 point increase in average scores (point estimate of64 ⇥ 4.9% increase in private schooling), or 0.08 standard deviations of school-level average scores.
8

0.2
.4.6
.81
Cu
mu
lativ
e P
rob
ab
ility
$10 $30 $100 $300 $1,000Per pupil funding in USD per annum - log scale
Private Schools Public Schools
0.2
.4.6
.81
Cu
mu
lativ
e P
rob
ab
ility
100 200 300 400 500KCPE Exam Score
Private Schools Public Schools
Figure 1: The distribution of funding and test scores in public and private schools
districts. Again, the results are qualitatively unchanged, with the private-school coe�cient
only increasing in magnitude. A final concern is that improvements in data collection and
data capture over time may have led to the inclusion of more private schools in later years,
creating the illusion of private enrolment growth and performance gains. To address this
concern column 7 restricts the sample to a balanced panel of schools. The estimate of the
private schooling e↵ect remains at 64.2 points.
5 Funding
The analysis in the previous section showed that private schooling raises test scores. It
does not necessarily follow that private schooling is more e�cient at delivering education, as
measured by cost-benefit ratio. The superior performance of private schools may reflect an
advantage in terms of financial and human resources. Direct comparison of resource levels
between public and private schools is di�cult because funding for each sector flows from
di↵erent (and sometimes multiple) sources, requiring collation of multiple data sources.
Private schools are funded by fees. Using data from the Kenya Integrated Household
9
Budget Survey (KIHBS), we calculate that private school fees per primary school pupil had
a median of $40.87 and a mean of $110.00 per year in 2006.
In contrast, as of 2003 public primary schools in Kenya are forbidden from charging fees.
Instead, public schools receive two resource flows from the central government. The first
is a per pupil grant, equivalent to approximately $14 per annum, transferred to a school
bank account. The second resource, teaching sta↵, is provided in-kind. We place a value
on teachers equivalent to their average salary divided by the pupil-teacher ratio in a given
school. While salaries vary by seniority and qualification, a nationwide survey conducted
by the Kenya National Examination Council (Kenya National Examination Council 2010)
found an average salary among civil service teachers of $262 per month over twelve months
in 2009 (the nearest available year), which we use as the basis for our calculations. Variation
in per pupil funding in the public school system arises primarily due to di↵erences in sta�ng
levels, as reflected in pupil-teacher ratios. Based on administrative data from the Education
Management Information System (EMIS) maintained by the Ministry of Education, in 2005
the median pupil-teacher ratio was 39.7 and the mean was 42.1 in public primary schools.
Combining these figures yields a median funding level of $83.81 and a mean of $88.42 in
public schools per pupil per annum.
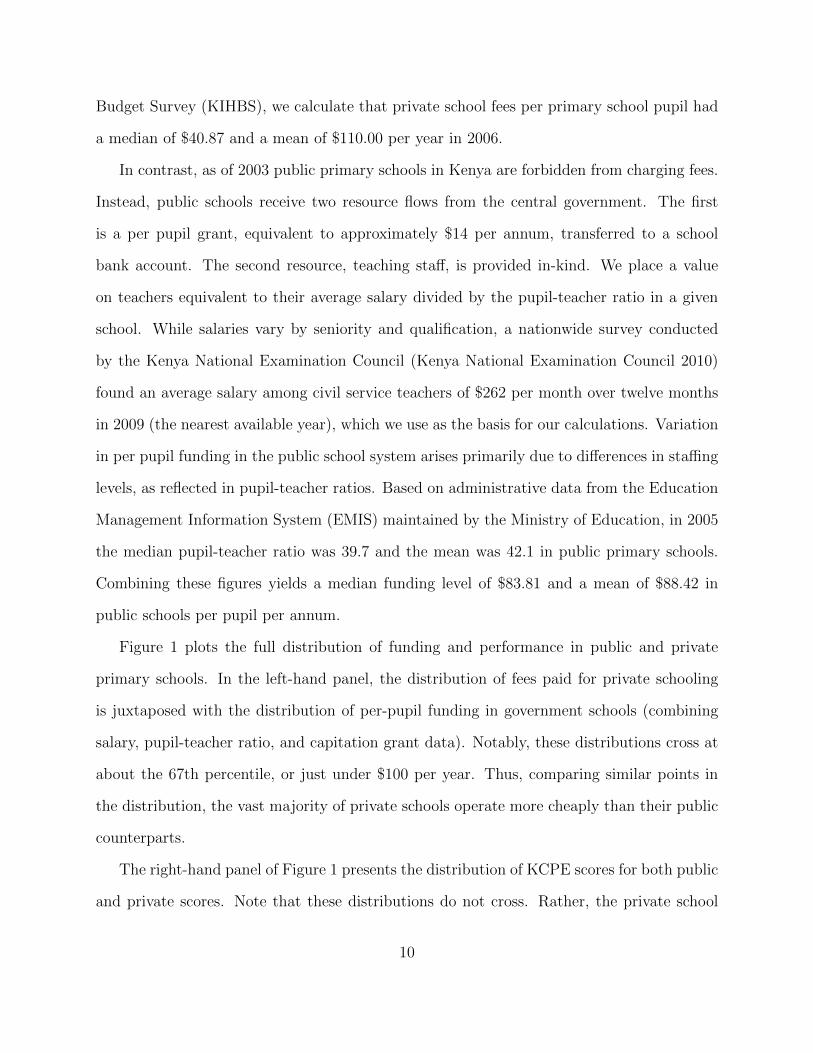
Figure 1 plots the full distribution of funding and performance in public and private
primary schools. In the left-hand panel, the distribution of fees paid for private schooling
is juxtaposed with the distribution of per-pupil funding in government schools (combining
salary, pupil-teacher ratio, and capitation grant data). Notably, these distributions cross at
about the 67th percentile, or just under $100 per year. Thus, comparing similar points in
the distribution, the vast majority of private schools operate more cheaply than their public
counterparts.
The right-hand panel of Figure 1 presents the distribution of KCPE scores for both public
and private scores. Note that these distributions do not cross. Rather, the private school
10

distribution is markedly and uniformly to the right of the public school score distribution.
6 Conclusion
We find a robust, causal exam performance premium of one standard deviation delivered by
private schools. This point estimate is significantly larger than found in previous studies,
and dwarfs the impact of narrower interventions within public primary schools in the micro-
empirical development literature (see (Kremer 2003)). Furthermore, from a social perspective
private schooling is relatively cheap: nearly two-thirds (64%) of children in private schools
pay fees less than the median per-child funding levels in public schools circa 2005/6. Taken
together, our results suggest that expanding access to private schools may provide a viable
route to improving education quality at relatively low cost in low-income countries with weak
public school systems.
References
Altonji, J. G., T. E. Elder, and C. R. Taber (2005): “Selection on Observed and Un-
observed Variables: Assessing the E↵ectiveness of Catholic Schools,” Journal of Political
Economy, 113(1), 151–184.
Angrist, J., E. Bettinger, E. Bloom, E. King, and M. Kremer (2002): “Vouchers
for Private Schooling in Colombia: Evidence from a Randomized Natural Experiment,”
American Economic Review, 92(5), 1535–1558.
Bold, T., M. Kimenyi, G. Mwabu, and J. Sandefur (2011): “Why Did Abolishing
Fees Not Increase Public School Enrollment in Kenya?,” Center for Global Development
Working Paper Series, 271.
11

Cox, D., and E. Jimenez (1991): “The relative e↵ectiveness of private and public schools:
Evidence from two developing,” Journal of Development Economics, 34.
Hsieh, C., and M. Urquiola (2006): “The e↵ects of generalized school choice on achieve-
ment and stratification: Evidence from Chile’s voucher program,” Journal of Public Eco-
nomics, 90(8-9), 1477–1503.
Kenya National Examination Council (2010): “Community Support Teacher Baseline
Survey Report,” Discussion paper, Nairobi.
Kremer, M. (2003): “Randomized evaluations of education programs in developing coun-
tries: Some lessons,” American Economic Review, 93, 102 – 106.
Newhouse, D., and K. Beegle (2011): “The E↵ect of School Type on Academic Achieve-
ment Evidence from Indonesia,” Journal of Human Resources, 41(3), 529–557.
12

A Data Appendix
A.1 Test scores
The Kenya Certificate of Primary Education (KCPE) examination constitutes the sole, na-
tionwide, standardized test for primary students in Kenya. Our data set constitutes an
unbalanced panel of all public and private primary schools in Kenya, for each year from
1998 to 2006. It contains information on average scores achieved by girls and boys in the
school, the number of test-takers of each gender, the district of the school and whether it is
government or private. The test covers English, Kiswahili, math, science and history.
A.2 Household survey data
Data on fees in the private school sector is taken from the 2006 Kenya Integrated Household
Budget Survey (KIHBS), a nationally-representative, household survey conducted by the
Kenya National Bureau of Statistics, spanning 13,212 households.
A.3 School administrative data
For all Kenyan public schools, the Ministry of Education’s Educational Monitoring Infor-
mation System (EMIS) database provides information on sta�ng levels and enrollment.
Digitized data are available for the years 2002 to 2008.
13
Designed by soapbox.co.uk
The International Growth Centre (IGC) aims to promote sustainable growth in developing countries by providing demand-led policy advice based on frontier research.
Find out more about our work on our website www.theigc.org
For media or communications enquiries, please contact [email protected]
Subscribe to our newsletter and topic updates www.theigc.org/newsletter
Follow us on Twitter @the_igc
Contact us International Growth Centre, London School of Economic and Political Science, Houghton Street, London WC2A 2AE