the history and biology of the modulation spectrum steven greenberg silicon speech & technical...
TRANSCRIPT

The History and Biologyof
THE MODULATION SPECTRUM
Steven Greenberg
Silicon Speech &Technical University of Denmark
Additional material: www.silicon-speech.com/siliconspeechpub www.silicon-speech.com/modspec

A Brief History A variety of studies indicate the importance of low-frequency modulations for spoken language
This was first demonstrated by Homer Dudley in 1939 with an early form of speech synthesis, the VODER; modulations higher than 25 Hz could be filtered out without significant impact on intelligibility
Silicon Speech

A Brief History VOCODER (the VODER’s successor) was originally designed for data compression and efficient speech
coding
Much research was performed into the number of acoustic frequency channels required for intelligible speech (answer: ca. 10 channels)
Silicon Speech
VODER Schematic
VOCODER

A Brief History Dudley’s insights were largely ignored over the next several decades
Exceptions: Zadeh (who coined the term “variational frequency” in the 1950s) and Holmes (who discussed modulations for articulatory synthesis in the 1960s)
Modulation spectrum’s rebirth – 1970s in room acoustics and speech intelligibility
Silicon Speech

Houtgast and Steeneken – Room Intelligibility In the 1970s Houtgast and Steeneken demonstrated that low frequency (< 16 Hz) modulations are associated with good intelligibility
for wide range of acoustic environments
Discovered this in the context of a study of room acoustics – what makes a good environment or a bad one wrt intelligibility?
In highly reverberant environments, the modulation spectrum’s peak is highly attenuated, shifting down to ca. 2 Hz, the speech becoming increasingly difficult to comprehend
[Based on an illustration by Hynek Hermansky]
Modulation Spectrum
Silicon Speech

Modulation Spectrum and Intelligibility Notice in the figure that the boundaries of the syllables in the speech waveform are “blurred” in the
reverberated version
When speech is highly reverberant, it is difficult to understand (particularly for the hearing impaired)
Silicon Speech[Based on an illustration by Hynek Hermansky]
Modulation Spectrum

Quantifying Intelligibility Houtgast and Steeneken coined the term “Modulation Spectrum” to designate the amount of amplitude modulation present in the acoustic signal
Intelligible signals have a prominent peak ca. 4 Hz
Less intelligible speech shows a reduction in the magnitude of the modulation spectrum and a shift in the peak downwards
Suggesting there’s something important about the temporal properties of speech for intelligibility
Silicon Speech[Based on an illustration by Hynek Hermansky]
Modulation Spectrum

Intelligibility and Hearing Impairment The hearing impaired have particular difficulty understanding speech in reverberant environments
This suggests that there’s something about the brain’s ability to temporally parse speech that’s important for its intelligibility
This was a radical suggestion at the time …
Silicon Speech

Speech Transmission Index If the modulation spectrum is a good predictor of intelligibility among the normal hearing, could it be used to predict intelligibility among the hearing impaired?
Result – Speech Transmission Index (STI), Holland’s version of the Articulation Index (developed by Harvey Fletcher and colleagues in the U.S., 1940s, 1950s)
Basic premise – speech can be decomposed into a series of low-frequency modulation patterns distributed across the tonotopic acoustic axis
Disruption of these low-frequency modulations impedes intelligibility
The disruptions can be external in origin (e.g., reverberation in a poorly designed room) or internal (damage to the auditory system)
In both instances, the amount of disruption (in terms of intelligibility) can be measured via the modulation spectrum, which is a physical quantity
Great advantage – intelligibility predictable on the basis of a measurable physical quantity (acoustics) or behavioral measure (hearing)
Silicon Speech

Speech Transmission Index The STI assumes that all of an acoustic signal’s linguistic information is contained in the magnitude of modulations below ~16 Hz
The STI essentially sums the modulation magnitude for each frequency band (the bandwidth varies in different versions – the original was 1 octave wide)
A single number is used to describe a listening environment’s intelligibility
The STI was a major advance over its predecessors
However, it doesn’t handle certain special cases where modulation phase is important (more about phase later)
Silicon Speech[Based on an illustration by Hynek Hermansky]
Modulation Spectrum

Relationship between Modulations & Intelligibility However, there was an additional piece of the puzzle needed to convince the scientific community that something VERY important was being observed
Missing was a demonstration that specific parts of the modulation spectrum were required for speech comprehension and that control of this element of the speech signal could have predictable effects on intelligibility and segment identification
In the mid-1990s, Rob Drullman demonstrated the impact of low-pass filtering the modulation spectrum on intelligibility and segment identification – modulations below 8 Hz appeared to be most important
Previously, the role of low-frequency modulations only indirectly measured
Drullman was the first to demonstrate, with some precision, the relation of specific parts of the modulation spectrum to intelligibility
His study set the stage for what was to follow ….
Silicon Speech

Noise-VOCODED Speech Around the same time Drullman published his study, Bob Shannon published an interesting demonstration of low-frequency modulation cues
He used Gaussian noise, modulated by the speech envelope in one, two, three or four (acoustic) channels (earlier, Stuart Rosen and Diane van Tassel had each used single channel speech envelope-modulated noise with less than stellar intelligibility)
The intent was to minimize (not eliminate) spectral cues by highlighting the modulation information
Although noise-vocoded speech was not new (Ben Gold had used the technique in the 1960s), Shannon’s study brought it to the attention of the “masses”
Drullman’s and Shannon’s studies placed low-frequency speech modulations on “the scientific map”
Silicon Speech

Pause …. Basis of Low-Frequency Modulations In the 1980s, skepticism was a common reaction to the work of Houtgast, Steeneken and Plomp, particularly their focus on very low-frequency modulations
Hearing was known to be sensitive to frequencies between 50 and 20,000 Hz….
Yet, their work suggested that frequencies BELOW 50 Hz were the most important for understanding spoken language!!!
How could this be?
Silicon Speech

Low-Frequency Modulations Something about the speech signal IS correlated with low-frequency modulations
This is the rate at which the vocal articulators (lips, jaw, tongue) move
Silicon Speech
ArticulatorsVisual Stream

Low-Frequency Modulations This low-frequency movement is evident in speech acoustics in two ways:
Oscillations of energy at quasi-syllabic rates (reflecting lip and jaw movements)
Variation in formant patterns, which reflect the changes in vocal tract resonances (associated with tongue movement)
Homer Dudley anticipated this approach in his 1939 and 1940 papers describing the conceptual basis of the VOCODER
Silicon Speech

Decoding Low-Frequency Modulations How is the low-frequency modulation of energy decoded in the brain?
These oscillations are most prominent between 3 and 10 Hz
This is infra-sound, so how can this information be transduced?
Silicon Speech

Decoding Low-Frequency Modulations The auditory cortex is MOST sensitive to fluctuations of this low rate
It is not “frequency” in the conventional sense, but rather a fluctuation in energy that does not necessarily have a sinusoidal basis function (more on this later…)
Auditory cortical neurons fire ca. 3 - 20 times per second, depending on the input
In response to speech, they can fire once per syllable up to rates of ca. 7 syllables per second (Schreiner and Wong)
Thus, there is a high-level auditory decoder of these slow oscillations
The rest of this tutorial section focuses on the details of the decoding
Silicon Speech
Which Modulations are Important for Speech? Let’s briefly review Drullman’s study before proceeding further
He asked listeners to decode spoken sentences (Dutch) and syllables
The modulation spectrum of the speech material was filtered in a variety of ways
Low-pass filtering – variable cutoff
High-pass filtering – variable cutoff (we’ll omit discussion as the results were probably compromised by signal-processing artifacts
Speech intelligibility measured as a function of low-pass cutoff of the modulation spectrum
Conclusion: Modulations below 8 Hz are most important (though modulations above this limit DO contribute)
Limitations of study:
Method for filtering modulations produced artifacts
Entire acoustic spectrum uniformly modulation filtered
No great insight as to WHY intelligibility impacted by filtering modulation spectrum
Silicon Speech
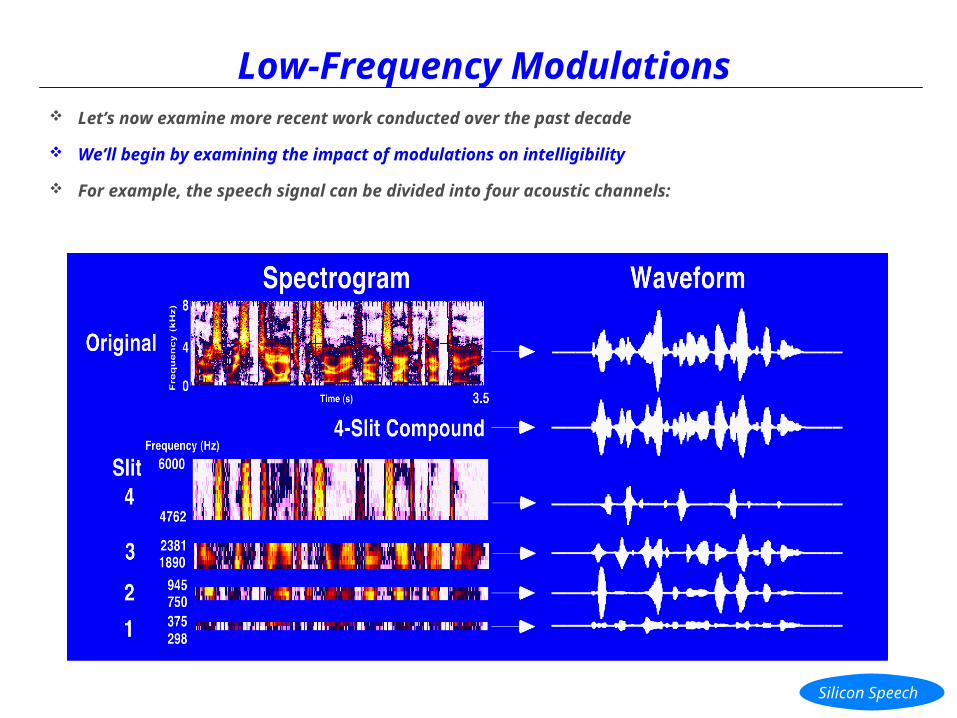
Low-Frequency Modulations Let’s now examine more recent work conducted over the past decade
We’ll begin by examining the impact of modulations on intelligibility
For example, the speech signal can be divided into four acoustic channels:
Silicon Speech

Modulation Spectrum for Sentences The spectrum of spoken sentences (TIMIT corpus) can be partitioned into narrow (1/3-octave) channels
(“slits”)
In the example shown, there are four, one-third-octave slits distributed across the frequency spectrum
Silicon Speech

Modulation Spectrum for Sentences Notice that the modulation properties of the original (full-band) signal are similar to that of the 4-slit
compound
It is the combination of different modulation patterns that provides the phonetic distinctiveness associated with a variety of sounds, syllables and words
Silicon Speech
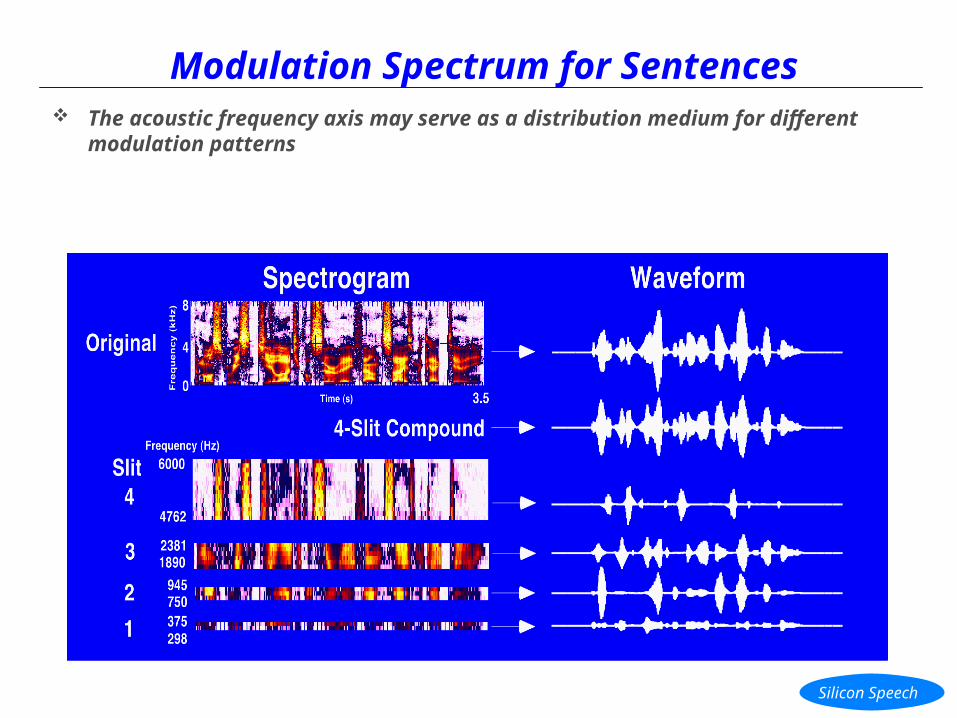
Modulation Spectrum for Sentences The acoustic frequency axis may serve as a distribution medium for different
modulation patterns
Silicon Speech

Intelligibility Requires More Than One Channel No single slit provides more than 9% intelligibility
The two central slits provide 60% intelligibility
Two slits (other than the central ones) generally provide 30% intelligibility
Three slits can provide up to 83% intelligibility
Four slits provides ca. 90% intelligibility
Silicon SpeechIn collaboration with Takayuki Arai and Rosaria Silipo

Low-Pass Filtering Modulation Spectrum Each sentence presented contained four spectral slits
Baseline performance – 4 slits without modulation filtering – was 87% intelligibility
The modulation spectrum was systematically low-pass filtered between 24 Hz and 3 Hz, in 3-Hz steps for each of the two-slit combinations, without modulation filtering the other two slits in the stimulus
Silicon SpeechIn collaboration with Rosaria Silipo

The Modulation Spectrum Across Frequency The modulation spectrum differs across the tonotopic axis
Note the highest frequency channel
Because intelligibility is poor for any single slit, more than the modulation spectrum MAGNITUDE is required for understanding sentential material
Silicon SpeechIn collaboration with Takayuki Arai

Linguistic Significance of Modulation Spectrum Given the importance of the modulation spectrum for intelligibility, what does it reflect linguistically?
The distribution of syllable duration matches the modulation spectrum, suggesting that the integrity of the syllable is essential for understanding speech
Syllable duration(modulation frequency)
Modulation Spectrum
Silicon Speech

How Do Listeners Decode Spoken Language? Reflections from walls and other surfaces routinely modify the spectro-temporal structure of the speech signal under everyday conditions
Yet, the intelligibility of speech is remarkably stable
Implying that intelligibility is based NOT on fine spectral detail, but rather on some more basic parameter(s) – what might these be????
Silicon Speech

Spectro-Temporal Jittering of Speech By jittering spectral channels relative to each other and measuring the relation between the amount of jitter and intelligibility
It is possible to deduce the auditory system’s sensitivity to temporal jitter and the importance of the modulation spectrum
Silicon Speech

Spectral Asynchrony - Paradigm
The magnitude of energy in the 3-6 Hz region of the modulation spectrum is computed for each (4 or 7 channel sub-band) as a function of spectral asynchrony
The modulation spectrum magnitude is relatively unaffected by asynchronies of 80 ms or less (open symbols), but is appreciably diminished for asynchronies of 160 ms or more
Is intelligibility of read sentences (TIMIT) correlated with the reduction in the 3-6 Hz modulation spectrum?
Silicon Speech

Intelligibility and Spectral Asynchrony Intelligibility is roughly correlated with the amount of energy in the modulation
spectrum between 3 and 6 Hz
However, the correlation varies, depending on the sub-band and the degree of spectral asynchrony
Silicon Speech

Frequency Dependence of Intelligibility From a piece-wise discriminant analysis (based on performance slopes) ….
The LOWER frequency (<1.5 kHz) channels appear to be most important when the degree of asynchrony is LOW
The HIGHER frequency (>1.5 kHz) channels are most important when the degree of asynchrony is HIGH
This frequency-selective pattern provides important clues as to the frequency selective intelligibility deficits associated with sensori-neural hearing loss
Silicon Speech

Implications of Spectral Asynchrony The results imply that the brain is able to tolerate large amounts of temporal jitter
without significantly compromising intelligibility – however …
Because there are potentially hundreds (or thousands) of frequency channels in the auditory system, this result doesn’t really prove the point
The “TRUE” amount of asynchrony (from the ear’s perspective) may have been overestimated
Silicon Speech

Desynchronizing Slits Affects Intelligibility Four channels, presented synchronously, yield ca. 90% intelligibility
Intelligibility for two channels ranges between 10 and 60% intelligibility
When the center slits lead or lag the lateral slits by more than 25 ms intelligibility suffers significantly
Silicon Speech

Asynchrony greater than 50 ms results in intelligibility lower than baseline
A trough in performance occurs at ca. 200-250 ms asynchrony
A slight rebound in intelligibilty occurs for longer asynchronies
These results suggest that the modulation phase Is extremely important for intelligibility (and is the conceptual basis for the STMI recently developed by Shamma and colleagues)
Slit Asynchrony Affects Intelligibility
Silicon Speech

Atomic Physics of Speech Perception Word intelligibility is a crude metric for understanding how the brain decodes the speech signal
True insight requires a finer grain of detail
Hence, we’ll adopt a strategic focus on consonants, which are essential for understanding spoken language

Nuclear Physics of Speech Perception However …. consonant identification, itself, is too crude to study how the brain decodes spoken material
Therefore …. we decompose consonants into articulatory-acoustic features – Voicing, Manner and Place of Articulation
These features behave differently from each other (as observed by Miller and Nicely in 1955)
Such feature decomposition provides greater insight into speech processing than consonant identification alone

Stimuli, Presentation and Subjects
Stimuli: (Danish) Consonant + Vowel + Liquid (CVL)
Consonants (11): [p], [t]. [k], [b], [d]. [g], [f], [v], [s], [m], [n]
Vowels (3): [i], [a], [u]
Talkers (2): One Male, One Female
Presentation: Diotic over headphones @ 65 dB SPL
Listeners: 6 normal-hearing, native Danish speakers
Age of Listeners: 21 – 28
In collaboration with Thomas Christiansen

Stimulus Conditions – Spectral Slits Up to three narrowband (3/4 octave) spectral slits presented singly or in
combinations of two or three
Single Slits
3000 Hz
1500 Hz
750 Hz
Two Slits
3000 Hz
1500 Hz
750 Hz 750 Hz
1500 Hz
3000 Hz
Three Slits
1500 Hz
750 Hz
3000 Hz

Stimulus Conditions – Modulation Filtering The signals were LP modulationfiltered at 24, 12, 6 and 3 Hz using the Modulation Toolbox developed by
Atlas and Schimmel (University of Washington)
In this talk, we focus NOT on the specific impact of modulation filtering, but rather on evidence of synergy
Slit Center Frequency
OOO
O O
OO
OO
O
O
O
30001500750
Modulation Low-Pass Filtering
< 3Hz< 6 Hz< 12 Hz< 24 HzAll Pass

Consonant identification in terms of number of slits, their combination and the specific parameters of modulation filtering is NOT very informative
Modulation Low-Pass FilteringSlit Center Frequency
OOO
O O
OO
OO
O
O
O
< 3Hz< 6 Hz< 12 Hz< 24 HzAll Pass30001500750
38.4
40.2
39.7
62.9
73.5
69.2
88.4
32.8
35.9
31.4
61.6
75.0
71.0
87.9
27.5
29.0
29.0
55.6
71.7
63.6
81.1
21.5
19.7
21.5
41.7
56.8
46.0
64.1
18.2
16.2
16.7
26.3
34.9
31.6
42.9
Consonant Identification – Disregard these Data!

Let’s Examine Phonetic Features! Articulatory-acoustic features are the building blocks of segments and syllables
They can parsimoniously represent any speech sound
BackStop–k
CentralStop+d
BackStop+g
FrontStop+b
CentralNasal+n
FrontNasal+m
CentralFricative–s
FrontFricative+v
FrontFricative–f
CentralStop–t
FrontStop–p
PlaceMannerVoicing
Phonetic Feature
Segment

Three principal articulatory dimensions are distinguished (among others) – VOICING, MANNER and PLACE of articulation
As illustrated for a sample word, “Nap” [n] [ae] [p]
In order to correctly identify a consonant, all three principle phonetic feature dimensions need to be decoded correctly
A Brief Introduction to Phonetic Features
Voiced
[n] [ae] [p]
Voiced Unvoiced
Nasal Vocalic Stop
Alveolar (Medial) Bilabial (Front)
ProsodicAccent
Segment
Manner
Voicing
Place Front
Word “nap” (def:Interspeech)

Perceptual Confusion Matrix – Example Below is a “typical” confusion matrix associated with right and wrong responses
Cells show the (absolute) number of responses for each consonant presented
0
0
0
0
0
0
0
0
1
1
19
p
0
0
0
1
0
0
0
0
8
32
13
t
0
0
0
0
0
1
0
0
27
2
1
k
0
0
0
0
0
5
2
25
0
0
0
b
0
0
0
1
0
7
34
10
0
1
0
d
0
0
1
0
0
22
0
0
0
0
0
g
8
1
27
1
0
1
0
0
0
0
0
v
3
24
7
0
0
0
0
1
0
0
0
m
32
4
4
0
0
0
0
0
0
0
0
n
00d
00b
00g
00t
00n
00m
00v
1023f
432s
00k
03p
fs
Response
Sti
mu
lus
0
0
0
0
0
0
0
0
1
1
19
p
0
0
0
1
0
0
0
0
8
32
13
t
0
0
0
0
0
1
0
0
27
2
1
k
0
0
0
0
0
5
2
25
0
0
0
b
0
0
0
1
0
7
34
10
0
1
0
d
0
0
1
0
0
22
0
0
0
0
0
g
8
1
27
1
0
1
0
0
0
0
0
v
3
24
7
0
0
0
0
1
0
0
0
m
32
4
4
0
0
0
0
0
0
0
0
n
00d
00b
00g
00t
00n
00m
00v
1023f
432s
00k
03p
fs
Response
Sti
mu
lus
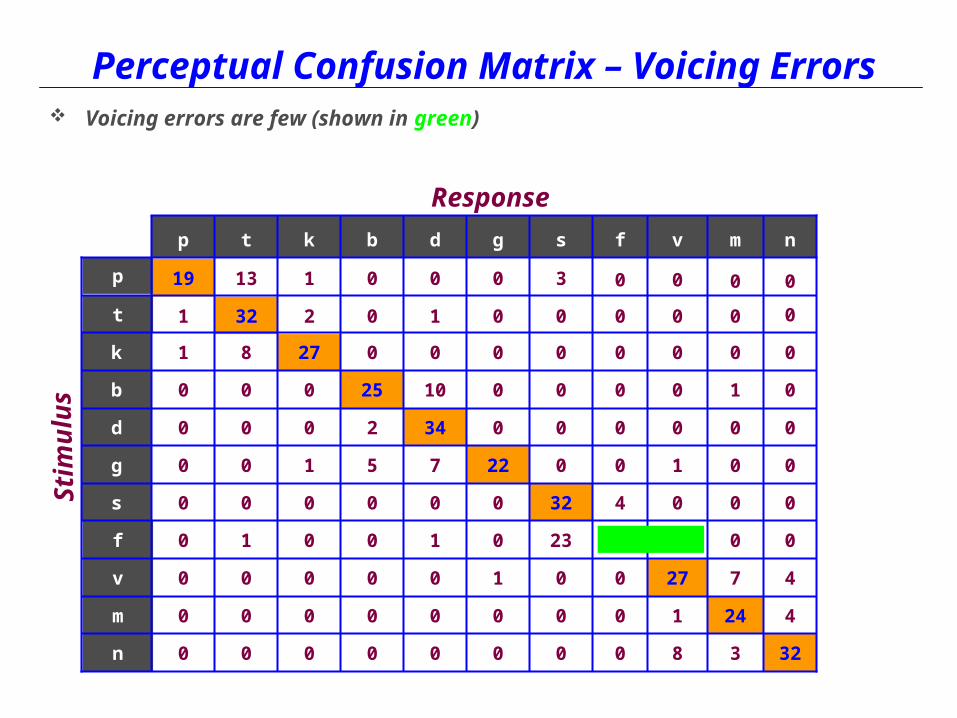
Perceptual Confusion Matrix – Voicing Errors Voicing errors are few (shown in green)

0
0
0
0
0
0
0
0
1
1
19
p
0
0
0
1
0
0
0
0
8
32
13
t
0
0
0
0
0
1
0
0
27
2
1
k
0
0
0
0
0
5
2
25
0
0
0
b
0
0
0
1
0
7
34
10
0
1
0
d
0
0
1
0
0
22
0
0
0
0
0
g
8
1
27
1
0
1
0
0
0
0
0
v
3
24
7
0
0
0
0
1
0
0
0
m
32
4
4
0
0
0
0
0
0
0
0
n
00d
00b
00g
00t
00n
00m
00v
1023f
432s
00k
03p
fs
Response
Sti
mu
lus
Perceptual Confusion Matrix – Manner Errors Manner of Articulation errors are slightly more common (shown in purple)

0
0
0
0
0
0
0
0
1
1
19
p
0
0
0
1
0
0
0
0
8
32
13
t
0
0
0
0
0
1
0
0
27
2
1
k
0
0
0
0
0
5
2
25
0
0
0
b
0
0
0
1
0
7
34
10
0
1
0
d
0
0
1
0
0
22
0
0
0
0
0
g
8
1
27
1
0
1
0
0
0
0
0
v
3
24
7
0
0
0
0
1
0
0
0
m
32
4
4
0
0
0
0
0
0
0
0
n
00d
00b
00g
00t
00n
00m
00v
1023f
432s
00k
03p
fs
Response
Sti
mu
lus
Perceptual Confusion Matrix – Place Errors The Place of Articulation Errors are very frequent (shown in red)
Errors are NOT random – Place of Articulation errors predominate

Information Transmission Computation The amount of information transmitted is computed from the confusion matrix
using the following equation:
∑−=ji ij
jiij p
pppcT
,
log)(
Where p is the probability associated with the presentation (pi ) and response (pj ) for a given confusion matrix
The confusion matrices for each of the phonetic features is derived
From this the information transmission for each phonetic feature is computed

Total Information Transmitted (= Consonant ID)
Low pass modulation filtering single slits results in a progressive decline, whereas multi-slit stimuli are affected mostly below 12 Hz
The most dramatic decline is observed below 12 Hz
Low Pass ModulationFrequency Cutoff (Hz)
2412
63
2.91
2.65
2.02
1.37
2.34
2.23
1.66
1.04
2.26
2.02
1.48
1.02
1.91
1.76
1.35
0.840.85
0.63
0.39
0.27
0.89
0.68
0.43
0.30
1.05
0.73
0.44
0.39
0.0
0.5
1.0
1.5
2.0
2.5
3.0
1.5 kHz
3 kHz
0.75 + 1.5 kHz + 3 kHz
Information Transmitted (bits)
Stimulus Condition(Slit Center Frequency)
0.75 kHz
0.75 + 3.0 kHz + 3 kHz
1.5 + 3.0 kHz + 3 kHz
0.75 + 1.5 + 3.0 kHz 3 kHz
Single Slit
Multiple Slits
Perfect Transmission = 3.46 bits

Voicing Information Transmitted
Some decline between 3 and 12 Hz for all conditions
Most dramatic for multi-slit conditions
Low Pass ModulationFrequency Cutoff (Hz)
2412
63
0.950.94
0.81
0.48
0.72 0.77
0.56
0.33
0.87
0.79
0.59
0.37
0.680.66
0.51
0.330.3
0.22
0.12
0.04
0.25
0.23
0.14
0.07
0.31
0.27
0.11
0.07
0.0
0.2
0.4
0.6
0.8
1.0
1.2
1.5 kHz
3 kHz
0.75 + 1.5 kHz + 3 kHz
Information Transmitted (bits)
Stimulus Condition(Slit Center Frequency)
0.75 kHz
0.75 + 3.0 kHz + 3 kHz
1.5 + 3.0 kHz + 3 kHz
0.75 + 1.5 + 3.0 kHz 3 kHz
Single Slit
Multiple Slits
Perfect Transmission = 1 bit

Manner Information Transmitted
Significant declines in IT below 12 Hz for multi-slit conditions
Progressive decline in IT for single-slit conditions down to 6 Hz
Low Pass ModulationFrequency Cutoff (Hz)
2412
63
1.18
1.04
0.84
0.51
1.10
0.98
0.72
0.32
1.00
0.87
0.55
0.41
0.85
0.8
0.59
0.270.31
0.16
0.07
0.04
0.36
0.22
0.09
0.06
0.42
0.22
0.1
0.11
0.0
0.2
0.4
0.6
0.8
1.0
1.2
1.5 kHz
3 kHz
0.75 + 1.5 kHz + 3 kHz
Information Transmitted (bits)
Stimulus Condition(Slit Center Frequency)
0.75 kHz
0.75 + 3.0 kHz + 3 kHz
1.5 + 3.0 kHz + 3 kHz
0.75 + 1.5 + 3.0 kHz 3 kHz
Single Slit
Multiple Slits
Perfect Transmission = 1.58 bits
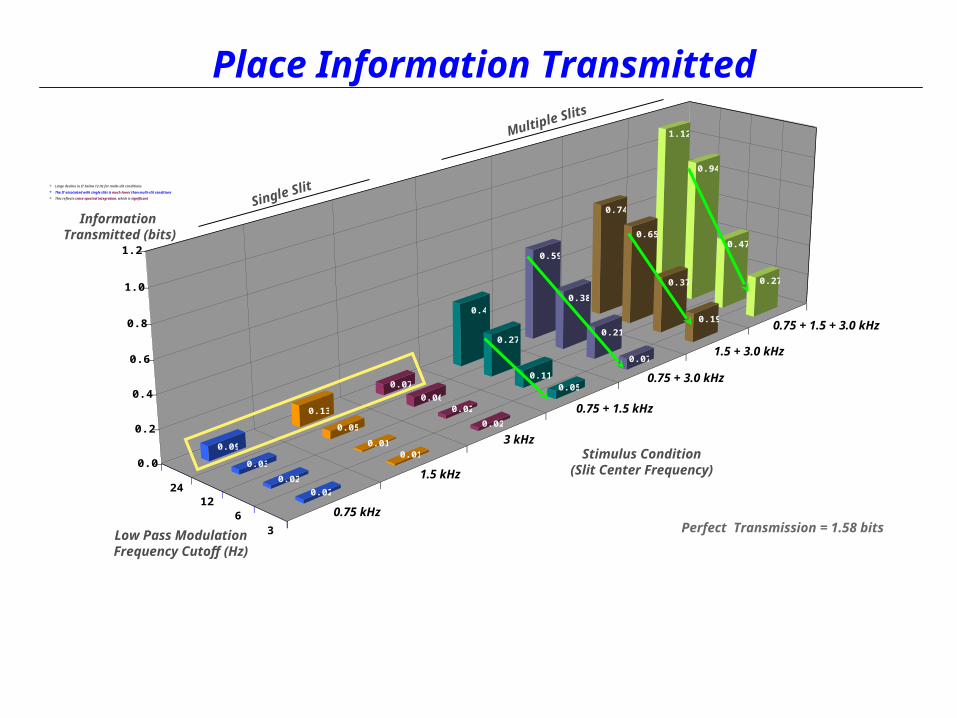
Place Information Transmitted
Large decline in IT below 12 Hz for multi-slit conditions
The IT associated with single slits is much lower than multi-slit conditions
This reflects cross-spectral integration, which is significant
Low Pass ModulationFrequency Cutoff (Hz)
2412
63
1.12
0.94
0.47
0.27
0.74
0.65
0.37
0.19
0.59
0.38
0.21
0.07
0.4
0.27
0.110.050.07
0.060.02
0.02
0.13
0.05
0.010.01
0.09
0.03
0.02
0.02
0.0
0.2
0.4
0.6
0.8
1.0
1.2
1.5 kHz
3 kHz
0.75 + 1.5 kHz + 3 kHz
Information Transmitted (bits)
Stimulus Condition(Slit Center Frequency)
0.75 kHz
0.75 + 3.0 kHz + 3 kHz
1.5 + 3.0 kHz + 3 kHz
0.75 + 1.5 + 3.0 kHz 3 kHz
Single Slit
Multiple Slits
Perfect Transmission = 1.58 bits

Phonetic Features & the Modulation Spectrum Phonetic features vary with respect to their modulation spectral properties
Place is associated with frequencies higher than 6 Hz
Manner is mostly associated with frequencies above 12 Hz and below 6 Hz
Voicing’s association with the modulation spectrum is frequency-specific; Below 6 Hz for high audio frequencies and above 12 Hz for low audio frequencies
Silicon Speech

Perspective The modulation spectrum reflects basic temporal processing mechanisms of the
brain
Although the modulation spectrum is usually associated with auditory processing of sound, the same concept (and mathematical analyses) can be applied to other sensory modalities (e.g., vision) as well as the motor system
Figure courtesy of Virginie van WassenhoveSilicon Speech

Perspective The modulation spectrum provides a theoretical and mathematical framework for
understanding how the sensory and motor systems coordinate their function for processing spoken language
Figure courtesy of Virginie van Wassenhove
Visual
Auditory
Posterior Superior Temporal (pSTP)
Pars Opercularis (POp)
Ventral Premotor (PMv)
M1
SomatosensorySupramarginal Gyrus (SMG)
Silicon Speech

Perspective The modulation spectrum reflects a direct link to a linguistic unit – the syllable –
and hence can be used for speech technology applications (automatic speech recognition, coding, enhancement and synthesis)
Such applications will be discussed in tutorial presentations by Les Atlas and Hynek Hermansky
Silicon Speech

Thank You
Conclusion of Part 1 (of 3)
THE MODULATION SPECTRUMAnd Its Application to Speech Science and Technology