the history and future of whales produced by and for the hot science – cool talks outreach lecture...
TRANSCRIPT

The History and Future of Whales
Produced by and for the Hot Science – Cool Talks Outreach Lecture Series of the Environmental Science Institute. We request that the use of any of these materials
include an acknowledgement of Dr. Stephen R. Palumbi and the Hot Science – Cool Talks Outreach Lecture Series of the Environmental Science Institute of the University
of Texas at Austin. We hope you find these materials educational and enjoyable.
Dr. Stephen R. PalumbiHot Science - Cool Talks Volume 45

The History and Future of Whales
The History and Future of Whales
Stephen R. PalumbiStanford University's Hopkins Marine Station

The Sea Around Us Project: D. Pauly and coworkers at UBC
Ocean neighborhoods
have changed

The Sea Around Us Project: D. Pauly and coworkers at UBC

The Sea Around Us Project: D. Pauly and coworkers at UBC
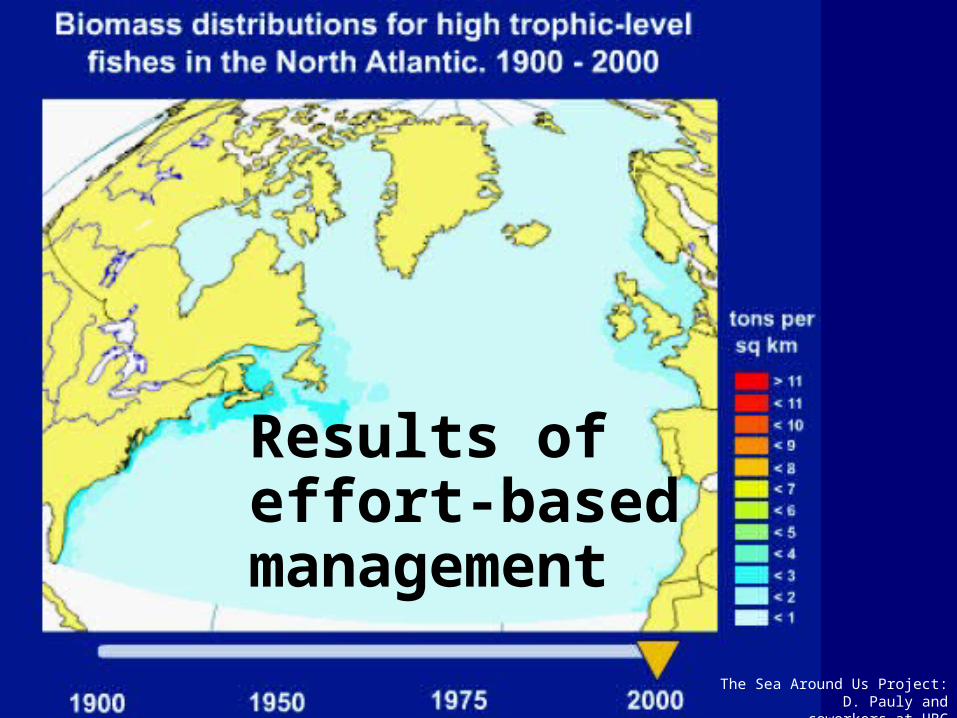
Results of effort-based management
The Sea Around Us Project: D. Pauly and coworkers at UBC

Vitousek et al. 1997
Decline in state of the World’s fisheries


Microdocs.org - Cooking with DNA - NPR’s Splendid Table
What fish is that on my plate?

Package of whale meat - what species is it?

• International Whaling Commission (IWC)
Sets catch limits and manages population recovery
• Convention on International Trade of Endangered Species (CITES)
Requires permits for international shipment
What whale meat is legal?

CITESConvention for the International Trade of Endangered Species
• Regulates imports and exports of endangered species and derivatives of endangered species
• Distinguishes endangered and commercially threatened species
• Member nations follow strict import/export regulations

• IWC members issue themselves permits for scientific whaling.
• Review is necessary but approval is not.
• Commercial use of products is encouraged after research use.
Scientific whaling

Forensic monitoring of Forensic monitoring of resource useresource use
NOAA

Scott Baker on first Tokyo meat mission (1993)
DNA testing of retail whale products examines relationship between policy and practice
Forensics and the future

Scott Baker tries for a GQ cover
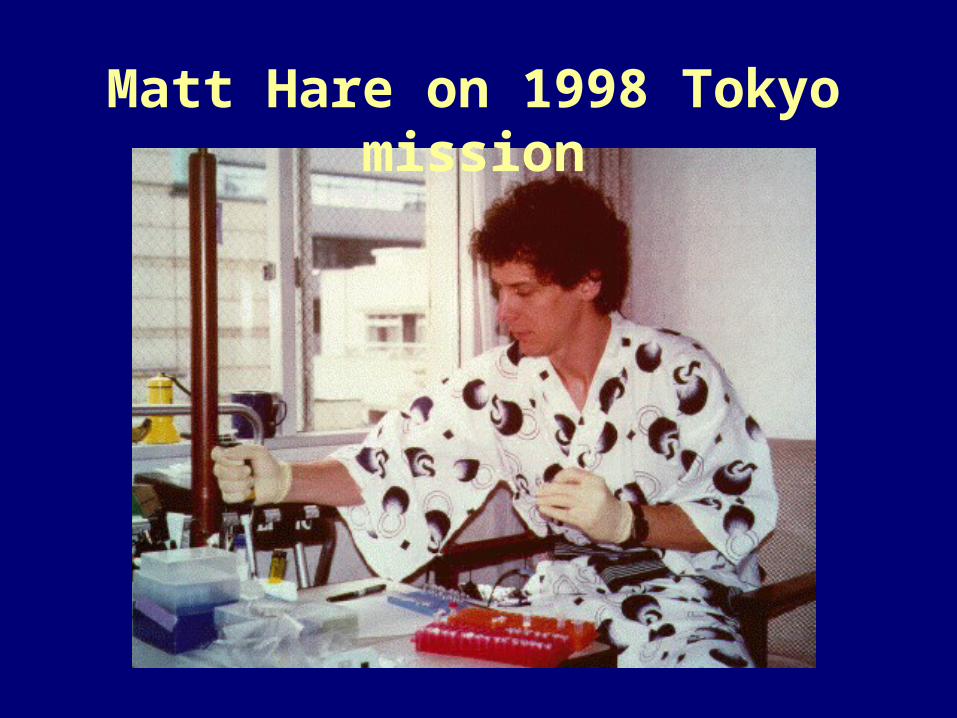
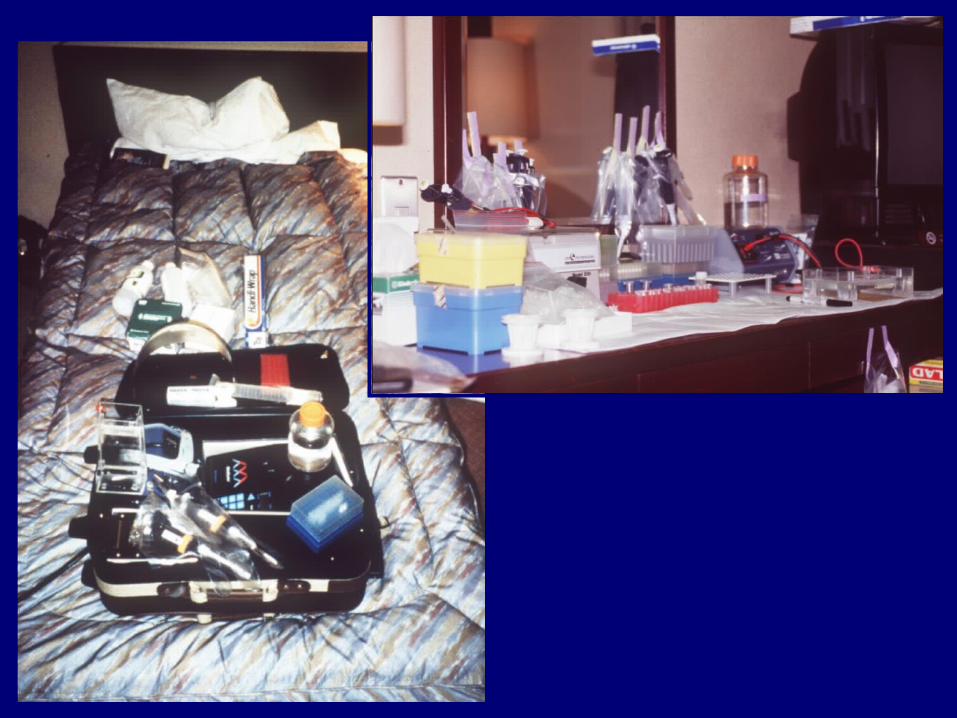
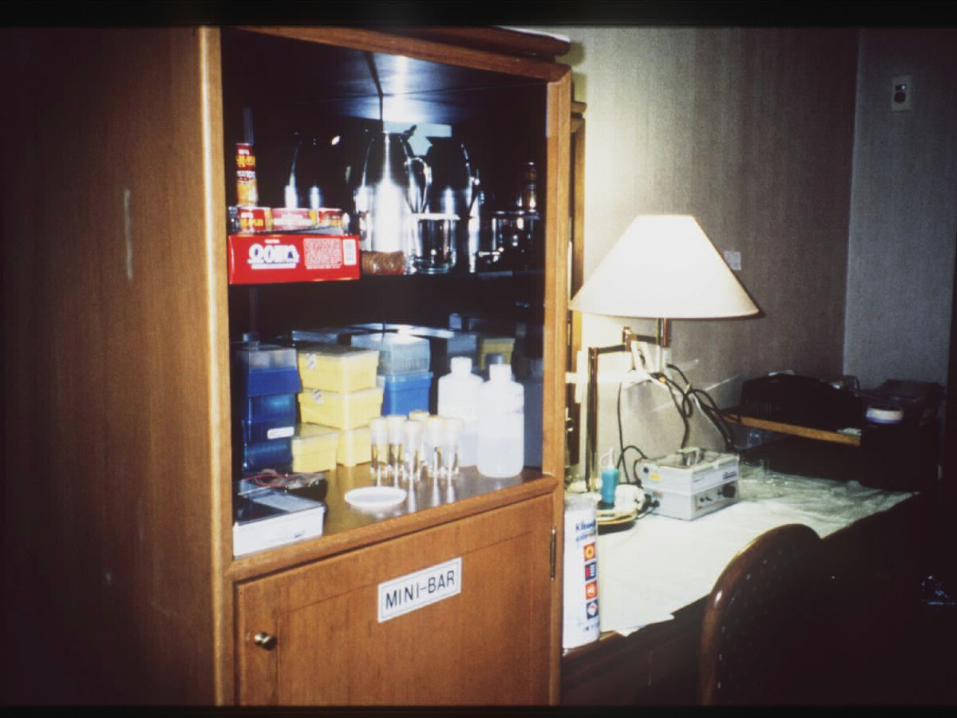
Matt Hare on 1998 Tokyo mission

PCR copied whale genes are separated from native whale DNA in the field so we can strictly follow CITES regulations

Simplified phylogenyof whales used for assigning species
names to meat samples

33936910297
49
2
7
Data from Palumbi, Baker labs 1993-2000
Molecular identificationof baleen whale products
N. minke
S. minke
Brydes
Pygmy Brydes
Sci
Humpback
Fin
Blue
Grey

Species other than baleen whales in retail markets
Sperm
Pygmy Sperm
Other BeakedWhales
Baird’s
Cuvier’s
Porpoise
Killer Whale
Dolphin
Non-Whale
515
566
19
2
104
7
Data from Palumbi, Baker labs 1993-2000

• Many species of whales and dolphins are for sale in retail markets.
• Does this failure to protect put any whales at risk of extinction?
Conclusion

North Pacific genotypes
Sea of Japangenotypes
Genotypes from market Surveys show 1:2 mix of Sea of Japan and North Pacific animals
Consequences of selling the wrong whalesThreatened Sea of Japan minke meat masquerading
as legal take from the North Pacific

The consequence of scientific whalingPredicted extinction of Sea of Japan minke whales
(Baker et al. 2000)
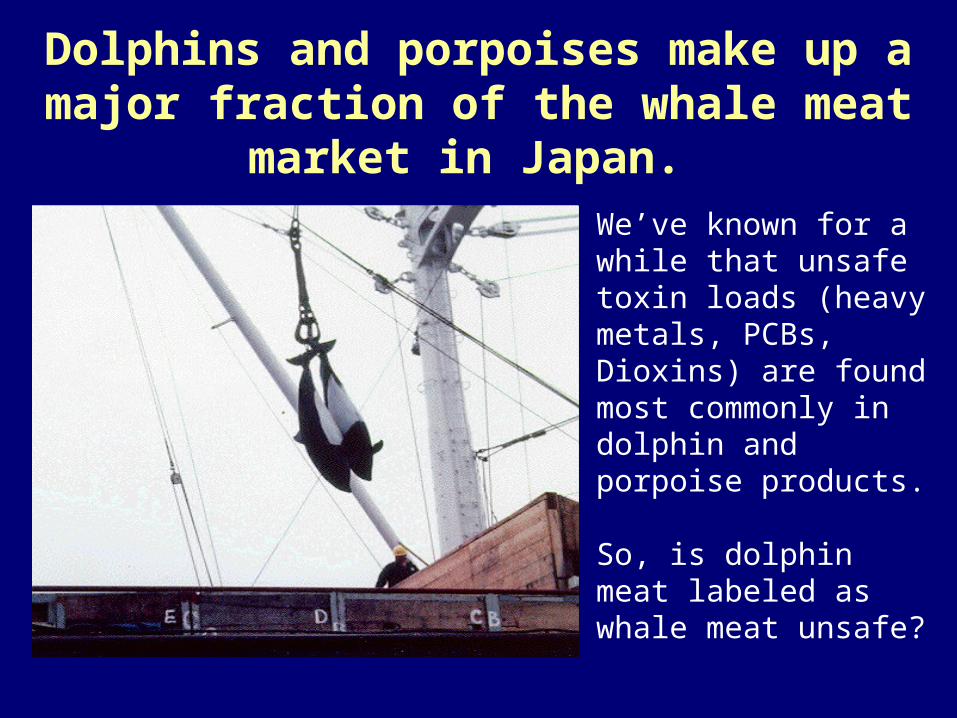
Dolphins and porpoises make up a major fraction of the whale meat market in Japan.
We’ve known for a while that unsafe toxin loads (heavy metals, PCBs, Dioxins) are found most commonly in dolphin and porpoise products.
So, is dolphin meat labeled as whale meat unsafe?

Mercury content (micrograms/gram)
0
2
4
6
8
10
12
14
16
18
20
.1 .2 .3 .4 .5 .6 .7 .8 .9 1
Yes, dolphin meat is often toxicHow bad? Dolphins > Pacific minke whales> southern minkes
Southern minke whale
Northern minke whale
Odontocetes
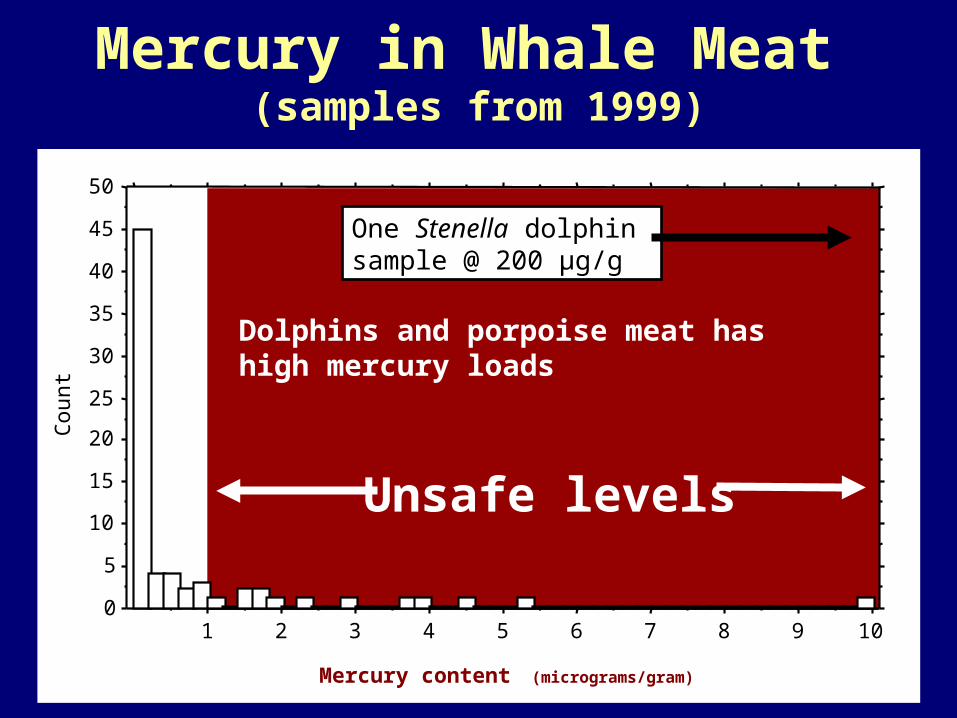
Mercury in Whale Meat (samples from 1999)
0
5
10
15
20
25
30
35
40
45
50
1 2 3 4 5 6 7 8 9 10
Cou
nt
Dolphins and porpoise meat has high mercury loads
One Stenella dolphin sample @ 200 µg/g
Mercury content (micrograms/gram)
Unsafe levels

The history of whales revealed by genetics
How many whales were there before hunting?

Catch records for Antarctic whales are well known.
From Hilborn et al. 2004

• Written records
• Oral records
• Fossils
• Tree rings
• Ice cores
• Reef cores
Where History Where History Comes FromComes From
Byrd Polar Research Center 2005Byrd Polar Research Center 2005

Climate History
Tree ringsTree ringsand ice coresand ice coresrecord climaterecord climate
Arnold Paul

Family historyMy Great Aunts

What do we know What do we know about the histories about the histories of whale of whale populations?populations?

Jean Francoise de La Perouse, 1786
“It is impossible to describe either the number of whales or their familiarity,”
with breath that “caused a most annoying stench”

47,300
Fin Whales North Atlantic 1969-89
Mean: 47,300 Range: 27,700 - 82,000www.iwcoffice.org/conservation/estimate.htm
Current estimate:
Past estimate:30-50,000 (Sargeant 1977)
Trouble with conventional wisdom about whale history
(e.g. Atlantic fin whales)
www.calacademy.org

Genetic estimates of population size
Mutation increases genetic diversity
Inbreeding decreases genetic diversity

High diversity
Large populations have low inbreeding
Genetic estimates of population size

Low diversity
Small populations have strong inbreeding
Genetic estimates of population size
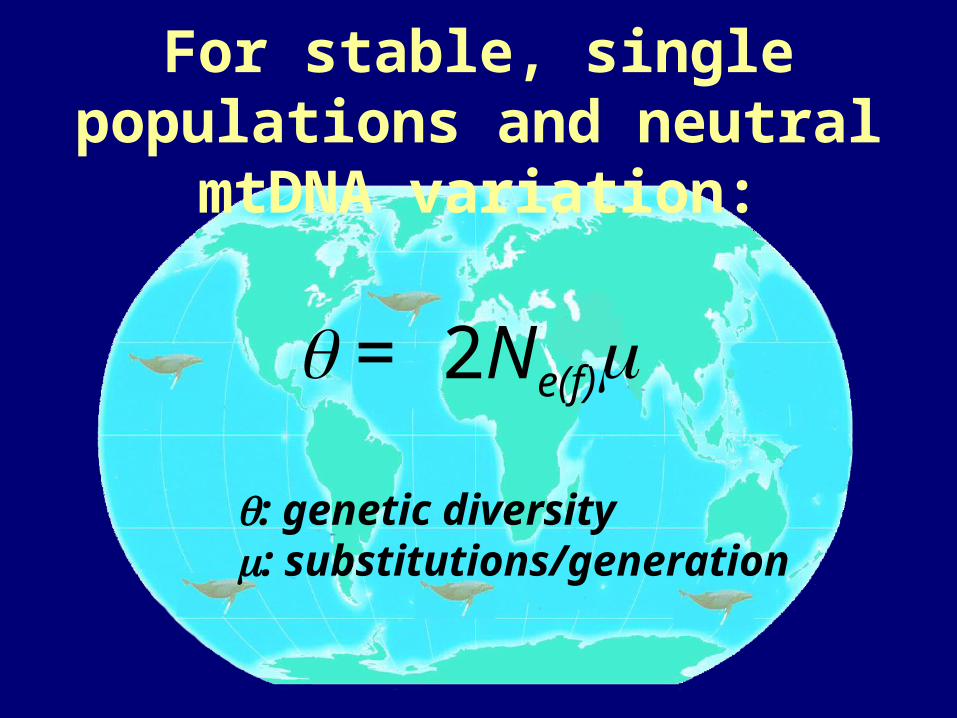
= 2Ne(f)
For stable, single populations and neutral mtDNA variation:
: genetic diversity: substitutions/generation

Atlantic collaborator Joe Roman at Harvard University

World-wide sample of humpback World-wide sample of humpback whales from biopsieswhales from biopsies
Data from Palumbi, Baker, Palsbol, Rosenbaum

Shared recent ancestors (similarity of DNA signified by shorter branch length)
Shared ancient ancestors (greater differences in DNA signified by longer branch length)
Phylogenetic Trees Branch Length and Genetic Diversity

w a 20 0 3w a 19 0 4w a 19 0 5w a 07 0 6w a 02 0 7g i2 20 8g i2 20 9g i1 21 0g i1 21 1e a 08 1 1e a 08 1 2g i0 62 5w a 03 1 8t g 10 1 9t g 10 2 0w a 05 1 3w a 05 1 4w a 05 1 51 0 G L 9 10 51 2 G L 9 16 41 2 G L 9 16 41 2 G L 9 16 41 2 G L 9 16 41 2 G L 9 16 41 2 G L 9 16 41 2 G L 9 16 4t g 08 2 1g i3 82 2M NA V A JO9 0 -0 29 0 -0 7M TO R CHM VA L L EYN f 03g i1 02 41 1 G L 9 16 5M CC S 0 3N f 08w a 08 2 39 0 -2 59 0 -0 99 0 -4 8I c e0 1I c e0 2M BI L B OM CR A N EM SC Y L LAM TR I D EN TM WR A PN f 02N f 05N f 07N f 11N F 12N F 14D R 401 5 WG 88 0 11 7 G L 9 00 71 7 G L 9 00 71 7 G L 9 00 71 7 G L 9 00 71 7 G L 9 00 71 7 G L 9 00 71 7 G L 9 00 71 7 G L 9 00 71 7 G L 9 00 71 7 G L 9 00 71 7 G L 9 00 71 7 G L 9 00 71 7 G L 9 00 71 7 G L 9 00 71 7 G L 9 00 71 7 G L 9 00 71 7 G L 9 00 71 7 G L 9 00 71 7 G L 9 00 71 7 G L 9 00 71 7 G L 9 00 71 7 G L 9 00 71 7 G L 9 00 71 7 G L 9 00 71 7 G L 9 00 71 7 G L 9 00 71 7 G L 9 00 71 7 G L 9 00 71 7 G L 9 00 71 8 IL 9 1 159 0 -0 39 0 -2 9N f 01D R 15M M A S KL I K EM TA L O N1 4 WG 88 1 41 3 G L 9 12 71 6 G M 90 5 61 6 G M 90 5 69 0 -1 89 0 -0 40 4 G M 90 1 50 4 G M 90 1 50 4 G M 90 1 50 4 G M 90 1 50 4 G M 90 1 50 4 G M 90 1 50 8 G L 9 10 30 8 G L 9 10 30 8 G L 9 10 30 8 G L 9 10 30 8 G L 9 10 30 8 G L 9 10 30 8 G L 9 10 30 8 G L 9 10 3D R 180 6 G L 9 11 30 6 G L 9 11 30 9 IL 9 1 030 5 G L 9 01 99 0 -1 0N F 16N f 17N f 06D R 110 2 SB 9 0 190 2 SB 9 0 190 2 SB 9 0 190 2 SB 9 0 190 2 SB 9 0 190 2 SB 9 0 190 2 SB 9 0 190 2 SB 9 0 190 2 SB 9 0 190 2 SB 9 0 190 2 SB 9 0 190 2 SB 9 0 190 2 SB 9 0 190 2 SB 9 0 190 2 SB 9 0 19D R 38N f 18M SP E A RN F 090 1 G L 9 10 00 1 G L 9 10 00 1 G L 9 10 00 3 G L 9 12 2D R 13D R 19D R 33D R 120 7 SB 9 0 390 7 SB 9 0 399 0 -2 0w a 21 1 6w a 21 1 7e a 12 2 6e a 02 2 7e a 02 2 8e a 02 2 9t g 09 3 0t g 09 3 1t g 09 3 2I c e0 39 0 -3 2D R 20D R 37M CL I P PE RM CO M E TM HE L I XM SW O R DN f 10N F 152 3 G L 9 03 02 3 G L 9 03 02 3 G L 9 03 02 3 G L 9 03 02 3 G L 9 03 02 3 G L 9 03 02 3 G L 9 03 02 3 G L 9 03 02 3 G L 9 03 02 3 G L 9 03 02 3 G L 9 03 02 3 G L 9 03 02 3 G L 9 03 02 3 G L 9 03 02 3 G L 9 03 02 3 G L 9 03 02 3 G L 9 03 02 3 G L 9 03 02 3 G L 9 03 02 3 G L 9 03 02 7 G L 9 10 22 8 G L 9 02 92 8 G L 9 02 92 8 G L 9 02 92 8 G L 9 02 92 8 G L 9 02 92 8 G L 9 02 92 8 G L 9 02 92 8 G L 9 02 92 9 G L 9 13 02 9 G L 9 13 09 0 -0 19 0 -0 5M BE L T AN EM SI L H O U E T2 5 G L 9 01 92 6 G L 9 00 42 6 G L 9 00 42 6 G L 9 00 42 6 G L 9 00 42 6 G L 9 00 42 6 G L 9 00 42 6 G L 9 00 42 6 G L 9 00 42 6 G L 9 00 4M PO L AR I S2 4 G M 90 5 8w a 18 3 3n z 01 3 4n z 01 3 5n z 01 3 6n z 01 3 7t g 15 3 8g i1 63 9g i1 64 0g i1 64 1g i1 64 2g i1 64 3g i1 64 4g i1 64 5g i2 54 6t g 02 5 6e a 13 5 0w a 28 5 1t g 14 5 2w a 15 5 3e a 05 5 4g i1 76 0g i1 76 1g i1 76 2g i1 76 3t g 11 5 5g i4 26 4g i3 05 7g i3 05 8g i2 45 9a p 02 6 5a p 02 6 6a p 02 6 7C a 08 . A PBC a 11C a 13C a 14 . A PBM x1 5 . pa r tM x2 3 . AP Bt g 05 6 8g i0 17 3g i0 17 4g i0 17 5g i0 17 6g i0 17 7g i0 17 8g i0 17 9g i0 18 0w a 01 6 9e a 06 7 0e a 06 7 1a p 01 7 2g i3 64 7g i3 74 8g i0 74 9g i1 18 1G I1 1C a 22g i0 58 2g i0 58 3G I0 5 aG I0 5 bC a 01 . A PBC a 06 . A PBC a 07 . A PBC a 16 . A PBC a 23 . A PBC a 05 . A PBM x2 7 . AP BC a 04 . A PBH i0 2. C S BH i0 1. C S BH i0 3. C S BH i0 4. C S BH i0 5. C S BH i0 6. C S BH i0 7. C S BS E A0 1 . AP BS E A0 2 . AP BS E A0 3 . AP BS E A0 6 . AP BS E A0 7 . AP BM x0 8 . AP BM x2 2 . AP BM x0 7 . AP BM x2 5 . AP B
0.001 substitutions/site
UPGMA
4% 3% 2% 1% 0
High global mtDNA diversity for humpback whales
Genetic diversity predicted for 115,000 whales
Branch lengths (percent substitution)

w a 20 0 3w a 19 0 4w a 19 0 5w a 07 0 6w a 02 0 7g i2 20 8g i2 20 9g i1 21 0g i1 21 1e a 08 1 1e a 08 1 2g i0 62 5w a 03 1 8t g 10 1 9t g 10 2 0w a 05 1 3w a 05 1 4w a 05 1 51 0 G L 9 10 51 2 G L 9 16 41 2 G L 9 16 41 2 G L 9 16 41 2 G L 9 16 41 2 G L 9 16 41 2 G L 9 16 41 2 G L 9 16 4t g 08 2 1g i3 82 2M NA V A JO9 0 -0 29 0 -0 7M TO R CHM VA L L EYN f 03g i1 02 41 1 G L 9 16 5M CC S 0 3N f 08w a 08 2 39 0 -2 59 0 -0 99 0 -4 8I c e0 1I c e0 2M BI L B OM CR A N EM SC Y L LAM TR I D EN TM WR A PN f 02N f 05N f 07N f 11N F 12N F 14D R 401 5 WG 88 0 11 7 G L 9 00 71 7 G L 9 00 71 7 G L 9 00 71 7 G L 9 00 71 7 G L 9 00 71 7 G L 9 00 71 7 G L 9 00 71 7 G L 9 00 71 7 G L 9 00 71 7 G L 9 00 71 7 G L 9 00 71 7 G L 9 00 71 7 G L 9 00 71 7 G L 9 00 71 7 G L 9 00 71 7 G L 9 00 71 7 G L 9 00 71 7 G L 9 00 71 7 G L 9 00 71 7 G L 9 00 71 7 G L 9 00 71 7 G L 9 00 71 7 G L 9 00 71 7 G L 9 00 71 7 G L 9 00 71 7 G L 9 00 71 7 G L 9 00 71 7 G L 9 00 71 7 G L 9 00 71 8 IL 9 1 159 0 -0 39 0 -2 9N f 01D R 15M M A S KL I K EM TA L O N1 4 WG 88 1 41 3 G L 9 12 71 6 G M 90 5 61 6 G M 90 5 69 0 -1 89 0 -0 40 4 G M 90 1 50 4 G M 90 1 50 4 G M 90 1 50 4 G M 90 1 50 4 G M 90 1 50 4 G M 90 1 50 8 G L 9 10 30 8 G L 9 10 30 8 G L 9 10 30 8 G L 9 10 30 8 G L 9 10 30 8 G L 9 10 30 8 G L 9 10 30 8 G L 9 10 3D R 180 6 G L 9 11 30 6 G L 9 11 30 9 IL 9 1 030 5 G L 9 01 99 0 -1 0N F 16N f 17N f 06D R 110 2 SB 9 0 190 2 SB 9 0 190 2 SB 9 0 190 2 SB 9 0 190 2 SB 9 0 190 2 SB 9 0 190 2 SB 9 0 190 2 SB 9 0 190 2 SB 9 0 190 2 SB 9 0 190 2 SB 9 0 190 2 SB 9 0 190 2 SB 9 0 190 2 SB 9 0 190 2 SB 9 0 19D R 38N f 18M SP E A RN F 090 1 G L 9 10 00 1 G L 9 10 00 1 G L 9 10 00 3 G L 9 12 2D R 13D R 19D R 33D R 120 7 SB 9 0 390 7 SB 9 0 399 0 -2 0w a 21 1 6w a 21 1 7e a 12 2 6e a 02 2 7e a 02 2 8e a 02 2 9t g 09 3 0t g 09 3 1t g 09 3 2I c e0 39 0 -3 2D R 20D R 37M CL I P PE RM CO M E TM HE L I XM SW O R DN f 10N F 152 3 G L 9 03 02 3 G L 9 03 02 3 G L 9 03 02 3 G L 9 03 02 3 G L 9 03 02 3 G L 9 03 02 3 G L 9 03 02 3 G L 9 03 02 3 G L 9 03 02 3 G L 9 03 02 3 G L 9 03 02 3 G L 9 03 02 3 G L 9 03 02 3 G L 9 03 02 3 G L 9 03 02 3 G L 9 03 02 3 G L 9 03 02 3 G L 9 03 02 3 G L 9 03 02 3 G L 9 03 02 7 G L 9 10 22 8 G L 9 02 92 8 G L 9 02 92 8 G L 9 02 92 8 G L 9 02 92 8 G L 9 02 92 8 G L 9 02 92 8 G L 9 02 92 8 G L 9 02 92 9 G L 9 13 02 9 G L 9 13 09 0 -0 19 0 -0 5M BE L T AN EM SI L H O U E T2 5 G L 9 01 92 6 G L 9 00 42 6 G L 9 00 42 6 G L 9 00 42 6 G L 9 00 42 6 G L 9 00 42 6 G L 9 00 42 6 G L 9 00 42 6 G L 9 00 42 6 G L 9 00 4M PO L AR I S2 4 G M 90 5 8w a 18 3 3n z 01 3 4n z 01 3 5n z 01 3 6n z 01 3 7t g 15 3 8g i1 63 9g i1 64 0g i1 64 1g i1 64 2g i1 64 3g i1 64 4g i1 64 5g i2 54 6t g 02 5 6e a 13 5 0w a 28 5 1t g 14 5 2w a 15 5 3e a 05 5 4g i1 76 0g i1 76 1g i1 76 2g i1 76 3t g 11 5 5g i4 26 4g i3 05 7g i3 05 8g i2 45 9a p 02 6 5a p 02 6 6a p 02 6 7C a 08 . A PBC a 11C a 13C a 14 . A PBM x1 5 . pa r tM x2 3 . AP Bt g 05 6 8g i0 17 3g i0 17 4g i0 17 5g i0 17 6g i0 17 7g i0 17 8g i0 17 9g i0 18 0w a 01 6 9e a 06 7 0e a 06 7 1a p 01 7 2g i3 64 7g i3 74 8g i0 74 9g i1 18 1G I1 1C a 22g i0 58 2g i0 58 3G I0 5 aG I0 5 bC a 01 . A PBC a 06 . A PBC a 07 . A PBC a 16 . A PBC a 23 . A PBC a 05 . A PBM x2 7 . AP BC a 04 . A PBH i0 2. C S BH i0 1. C S BH i0 3. C S BH i0 4. C S BH i0 5. C S BH i0 6. C S BH i0 7. C S BS E A0 1 . AP BS E A0 2 . AP BS E A0 3 . AP BS E A0 6 . AP BS E A0 7 . AP BM x0 8 . AP BM x2 2 . AP BM x0 7 . AP BM x2 5 . AP B
0.001 substitutions/site
UPGMA
Genetic estimates of world-wide population
>1 million humpbacks
Genetic diversity predicted for 115,000 whales
Branch lengths (percent substitution)
4% 3% 2% 1% 0

= 2.2% (n = 188)
= 2*(# breeding females) *
(mutation/generation)
==> female size = 68,000
==> population size = 240,000
North Atlantic humpback mtDNA diversity

Original population - 115,000
North Atlantic original - 30,000
North Atlantic current - 10,000
MSY North Atlantic - 16,000
Nearly ready for harvest
Current view of the history of humpback whales
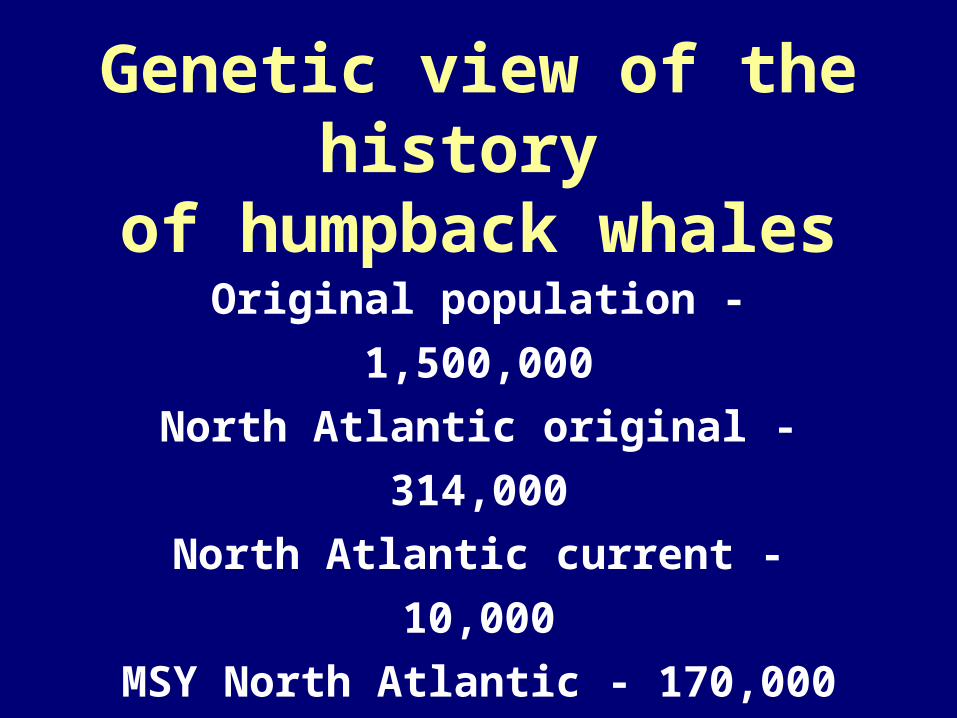
Genetic view of the history of humpback whales
Original population - 1,500,000
North Atlantic original - 314,000
North Atlantic current - 10,000
MSY North Atlantic - 170,000
Ready for harvest in 150 years

Antarctic whales existed in huge numbers
What does DNA tell
us about their past?
Title
Frank goes back to Japan for Antarctic samples

= 2Ne (µ/year)( (years/generation)
= 0.02 for cyt bµ/year = 0.34% permillion years (cyt b)
Generation time = 15 yr
/2 * 5.1% per million generations =>195,000 females => 1,150,000 population size
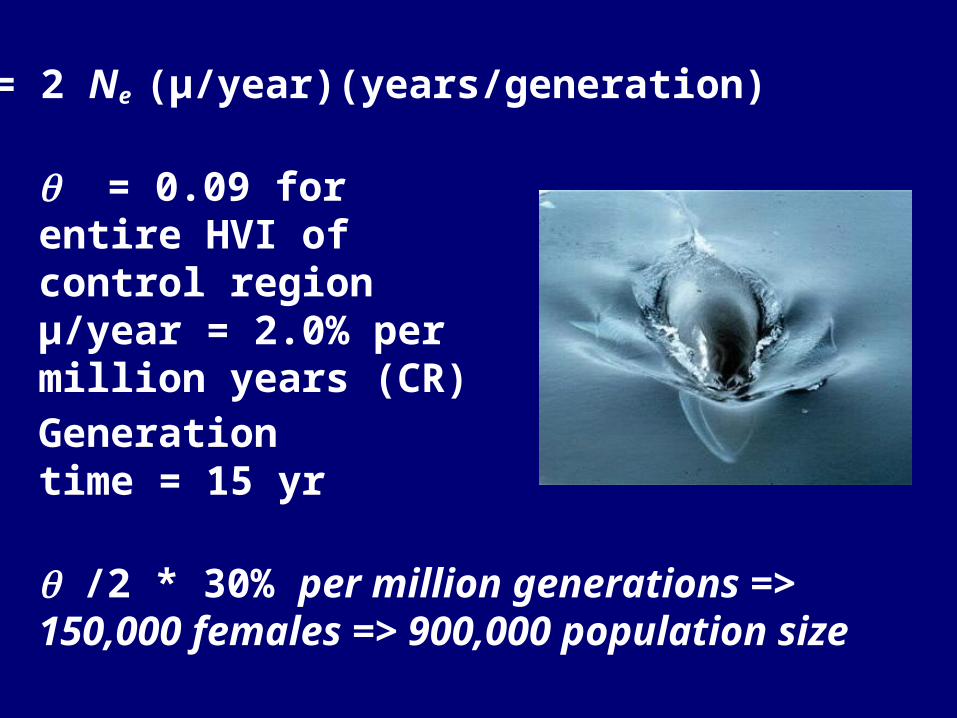
= 2 Ne (µ/year)(years/generation)
= 0.09 for entire HVI of control regionµ/year = 2.0% per million years (CR)
Generation time = 15 yr
/2 * 30% per million generations =>150,000 females => 900,000 population size

No evidence that minke
whales prevent recovery of
cousins in the Antarctic
Data: Dr. Seiji Ohsumi
Genetic estimateof historicpopulation of minke whales(900,000)
Nu
mb
er o
f W
hal
es (u
nit
: 1
0,0
00
)A CB D
E
E
E
E
20
0
20
0
40
20
0
20
0
40
60
80
1900 20 40 60 80 2000
Minke Whale
Sei Whale
Fin Whale
Blue Whale
Year

Genetic surveys to date that show large historic population sizes
5 species5 species8 populations8 populations3 ocean basins3 ocean basins6 genes6 genes

2004 IWC recommendation for continuing genetic estimates
• Verify substitution rate• Analyze multiple loci• Measure population dynamics• Measure variance • Evaluate ghost populations• Get better measures for log records• Estimate food levels needed

Summary• The past history of whales is a very important part of our
view of what the future should be.
• Estimates based on whaling ship log books appear to underestimate populations. The genetics of whale populations suggest that they were much more numerous than we believed.
• Genetic techniques are useful tools for understanding population levels, species diversity, and human exploitation of whale resources.
• Knowledge of the history of whale populations and resource use are essential components of whale conservation efforts.
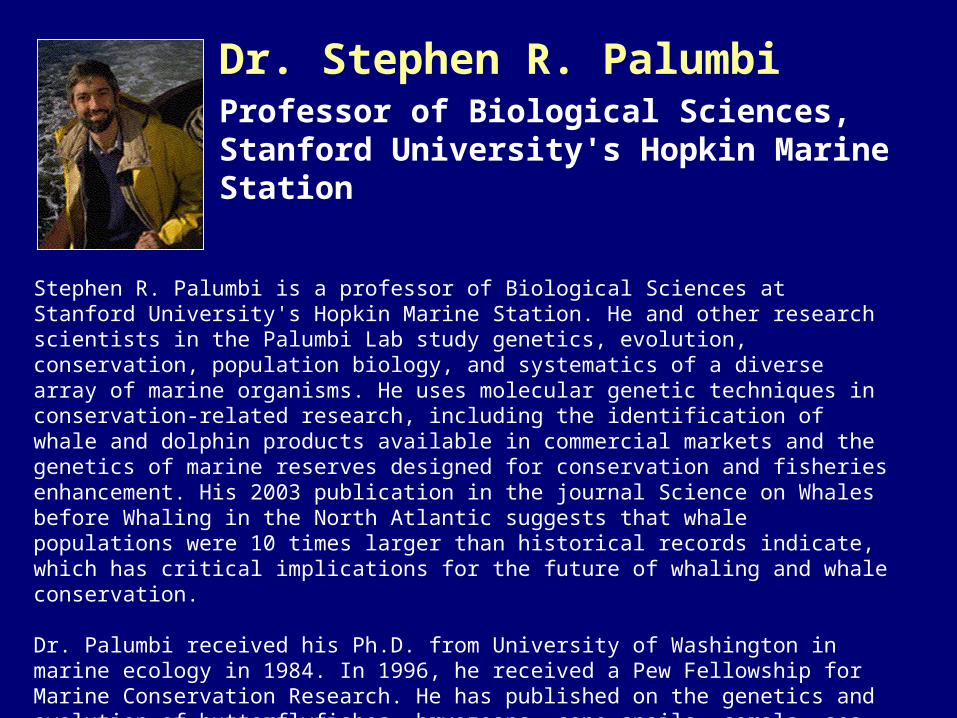
Dr. Stephen R. PalumbiProfessor of Biological Sciences, Stanford University's Hopkin Marine Station
Stephen R. Palumbi is a professor of Biological Sciences at Stanford University's Hopkin Marine Station. He and other research scientists in the Palumbi Lab study genetics, evolution, conservation, population biology, and systematics of a diverse array of marine organisms. He uses molecular genetic techniques in conservation-related research, including the identification of whale and dolphin products available in commercial markets and the genetics of marine reserves designed for conservation and fisheries enhancement. His 2003 publication in the journal Science on Whales before Whaling in the North Atlantic suggests that whale populations were 10 times larger than historical records indicate, which has critical implications for the future of whaling and whale conservation.
Dr. Palumbi received his Ph.D. from University of Washington in marine ecology in 1984. In 1996, he received a Pew Fellowship for Marine Conservation Research. He has published on the genetics and evolution of butterflyfishes, bryozoans, cone snails, corals, sea urchins, sharks, spiders, shrimps, and whales. His recent books include The Evolution Explosion: How humans cause rapid evolutionary change and Marine Reserves: An Ecosystem Tool for Marine Management and Conservation.