the history of artificial insemination: selected notes and
TRANSCRIPT

The history of artificial insemination: Selected notes and notables1
R. H. Foote2
Department of Animal Science, Cornell University, Ithaca, NY 14853-4801
ABSTRACT: Artificial insemination (AI) was thefirst great biotechnology applied to improve reproduc-tion and genetics of farm animals. It has had an enor-mous impact worldwide in many species, particularly indairy cattle. The acceptance of AI technology worldwideprovided the impetus for developing other technologies,such as cryopreservation and sexing of sperm, estrouscycle regulation, and embryo harvesting, freezing, cul-ture and transfer, and cloning. New, highly effectivemethods of sire evaluation were developed. The historyof development of AI is reviewed, particularly in dairycattle, in which the impact on genetic improvement andcontrol of venereal diseases have been greatest. Other
Key Words: Artificial Insemination, Estrus, Livestock, Selection, Semen, Sex Determination
2002 American Society of Animal Science. All rights reserved.
Introduction
Artificial insemination (AI), as practiced by bees andmany other flying insects, has played an important rolein plant reproduction for a very long time. Use of AI inanimals is a human invention and more recent. Undocu-mented tales exist of Arabs obtaining sperm from matedmares belonging to rival groups and using the spermto inseminate their own mares.
However, our story starts with recorded history,where facts are available to document noteworthyachievements. Consequently, the story is related chro-nologically. Much of the development of AI occurredbefore the 1980s when electronic networks becameavailable, so earlier references are included. The devel-opments that made AI the most important animal bio-technology applied to date include improved methodsof male management and semen collection, evaluation,preservation, and insemination. Detection of estrus and
1The author is indebted to all those who diligently pioneered re-search and extension activities to make AI one of the greatest storiesnever fully told, and to D. Bevins for assistance with manuscript prep-aration.
2Correspondence: 204 Morrison Hall (phone: 607-255-2866; fax:607-255-9829; E-mail: [email protected]).
Received March 26, 2001.Accepted June 8, 2001.
1
species briefly included are swine, horses, sheep, goats,dogs, rabbits, poultry, and endangered species. Majorlandmarks in AI development are cited, along with thepeople most closely associated with these develop-ments. Many of these pioneers helped to develop a newgeneration of reproductive physiologists and biotech-nologists. A bit of the flavor of the times is included,along with the historical facts. Many of the referenceswill take the reader back to an era before electronicnetworks were available, so these citations of classicalstudies will not be found with the press of a key onthe electronic keyboard. Readers are invited to explorethese historical treats that have provided a springboardfor the future.
control of the estrous cycle in the female also wereimportant. The development of AI is a remarkable storyof tireless workers dedicated to the pursuit of knowl-edge, to the replacement of fiction with facts, and theapplication thereof.
Dairy cattle will be emphasized because AI has hadthe greatest genetic impact in that species. Other spe-cies overviewed include swine, horses, sheep, goats,dogs, rabbits, poultry, and endangered species.
This review can only provide a taste of the importantdiscoveries and developments associated with AI andthe people most involved. A more comprehensive over-view of the technical aspects of AI are available in manyof the books on AI and reproduction (Walton, 1933;Anderson, 1945; Cole and Cupps, 1959; Maule, 1962;Mann, 1964; Milovanov, 1964; Perry, 1968; Salisburyet al., 1978; Watson, 1978; Brackett et al., 1981; Foote,1981; Herman, 1981; Cupps, 1991). Also, several re-views are available (Nishikawa, 1962, 1964, 1972; As-dell, 1969; Bonadonna, 1975; Bonadonna and Succi,1976; Foote, 1999).
Early History of AI
Leeuwenhoek (1678) and his assistant, Hamm, werethe first persons to see sperm, which they called “ani-malcules.” Leeuwenhoek did not have an advanced for-mal education, so he did not study Latin, the scientific

Foote2
language of the day. However, he was a clever, capableindividual who ground lenses so precisely (one still ex-ists today with 270 magnifications) that sperm werevisible. His published paper (Leeuwenhoek, 1678)amazed, and perhaps amused, the reigning king of En-gland, who regularly read papers submitted to theRoyal Society, where Leeuwenhoek’s paper was pub-lished.
Another century passed before the first successfulinsemination was performed by Spallanzani (1784) ina dog, which whelped three pups 62 d later. Spallanzanioriginally trained to be a priest, but he had a greatinterest in natural history and pursued the latter. Hewas a professor of natural history in Pavia by the ageof 25. He collected, analyzed, and classified a largearray of butterflies, shells, and other marine and landanimals. His abode was overrun with many collections,somewhat to the consternation of relatives living there.But he used these for rigorous, comparative objectiveanalysis to discern much about animal physiology andcharacteristics of fitness.
Another 100 yr passed before Heape (1897) and oth-ers in several countries reported that AI had been usedin isolated studies with rabbits, dogs, and horses. Heapewas an outstanding reproductive biologist, establishingmuch of the basis for the relationship between seasonal-ity and reproduction. This led to Cambridge becominga world center for reproductive studies (Marshall, Ham-mond, Walton, and students such as M. C. Chang).
AI Becomes a Focal Point of Research
Pioneering efforts to establish AI as a practical proce-dure were begun in Russia in 1899 by Ivanow (see Iva-noff, 1922). By 1907 Ivanow (also transliterated as Iva-nov or Ivanoff) had studied AI in domestic farm ani-mals, dogs, foxes, rabbits, and poultry. Some of thisresearch, especially in horses, is included in a paper inEnglish (Ivanoff, 1922) submitted June 21, 1922, andpublished in record time in the July 1922 issue of theJournal of Agricultural Science. He developed semenextenders and trained technicians to select superiorstallions and multiply their progeny through AI. Muchof the AI work in Russia was taken over later by Milova-nov (1938), described in a text translated into English(Milovanov, 1964). He established major projects forsheep and cattle breeding. He did not E-mail his ordersfor supplies. In his own workshop Milovanov designedand made practical artificial vaginas and other items,many similar to those used today. This was an enor-mous improvement over the earlier method of collectingsemen from sponges placed in the vagina of mountanimals.
The development of AI by Ivanow also stimulatedresearch outside of Russia. The Japanese scientist Dr.Ishikawa studied with Ivanow. He returned to Japanand began a similar program in horses in 1912 (Nishi-kawa, 1962). This gradually developed into AI beingapplied in Japan in cattle, sheep, goats, swine, and
poultry. Other Japanese researchers became involved(Ito, Niwa, Sato, Yamane, etc.). Because most of theresearch was published in Japanese and few westernersknew Japanese, little was known about this researchin the Western world until Niwa (1958) and Nishikawa(1962, 1964, 1972) summarized the research in English.
News of the extensive use of AI in Russia followingthe Ivanoff (1922) report became widespread in theWestern world with the publication of the book on AIby Walton (1933). Walton conducted a number of experi-ments, including a pioneering shipment of ram semento Poland, which 2 d later was used for successful insem-ination of ewes. However, commercial AI did not evolverapidly in the United Kingdom.
Some AI work, particularly with horses, had beenperformed in the early 1900s in Denmark. EduardSørensen, at The Royal Veterinary College in Copenha-gen, Denmark, was familiar with the Russian work.With Gylling-Holm, Sørensen organized the first coop-erative dairy AI organization in Denmark in 1936. Theprogram enrolled 1,070 cows the 1st yr and 59% con-ceived, slightly better than natural service in the sameherds. This was an important stimulus for the develop-ment of AI in dairy cattle in the United States andother Western countries.
The Danish veterinarians established the method ofrectovaginal fixation of the cervix, allowing semen tobe deposited deeply into the cervix or into the bodyof the uterus. This technique provided a tremendousadvantage because fewer sperm were required for in-semination of each cow. Another Danish “invention”was the straw for packaging semen (Sørensen, 1940).In 1956 I saw some of the original oat straws that Dr.Sørensen kept in his desk. Subsequently he saw chil-dren at a birthday party for his daughter sipping punchwith cellophane straws, and he recognized that he hadfound the straw that he needed. Later Cassou (1964)produced straws commercially that have been usedworldwide. So, the French straw is a modified Danishstraw. Dr. Sørensen also was a tough examiner in anat-omy. Passing his exams was reported to be as tough as“getting a camel through the eye of a needle.”
Meanwhile, the much earlier research by Spallanzaniled eventually in Italy to the development of an artificialvagina for dogs by Amantea in 1914 (Perry, 1968). Thiswork served as a model for the Russian development ofartificial vaginas for bulls, stallions, and rams. AnotherItalian, Bonadonna (1937), continued research on AI inseveral species. His enthusiasm for the potential valueof AI, along with Lagerlof, resulted in the establishmentof the highly successful International Congress on AIand Animal Reproduction held every 4 yr. The first onewas held in Milan in 1948. One time I remarked aboutthe extraordinary beauty of the Renaissance works ofart in Italy, and Dr. Bonadonna said “Yes, but remem-ber the future requires that you do not spend too muchtime dreaming about the past.”
In Sweden, Lagerlof became known for his researchon infertility problems in bulls. This research was stim-

History of artificial insemination 3
ulated by his visit with W. W. Williams, a CornellD.V.M., who had published methods of staining sperma-tozoa. Meanwhile, Lagerof completed his classic Ph.D.dissertation titled “Changes in the spermatozoa and inthe testes of bulls with impaired or abolished fertility”(Lagerlof, 1934). He established a group with worldwideinfluence in training veterinarians in the various as-pects of fertility and AI. Other Scandanavians, such asBlom (1950), followed, publishing a steady stream ofexcellent papers on abnormal sperm morphology (seeBarth and Oko, 1989). These pioneers were all thinkersand doers, and they trained many who followed.
Modern Development of AI in Dairy Cattle
Phenomenal growth of AI occurred in the 1940s inthe United States. The procedures developed in theUnited States became established worldwide (Salis-bury et al., 1978). In 1936, Brownell was inseminatingcows in the Cornell herd (Sipher, 1991), and other AIwork was started in the late 1930s in Minnesota andWisconsin. In 1938, an AI cooperative was establishedin New Jersey, modeled after the Danish system (Perry,1968). Another one in 1938 followed in the state of NewYork (Sipher, 1991). The development of the New YorkArtificial Breeders, Cooperative, Inc., currently Genex,Inc., in Ithaca, New York made possible the close collab-oration between a farmer cooperative and researchersand extension personnel at Cornell University. Thiswas a highly productive relationship resulting in theexperimental insemination of hundreds of thousands ofcows and publication of more than 100 research papers(Foote, 1998) on sire selection, testicular evaluation,semen collection, evaluation and processing; and fertil-ity testing. The present status of AI in many countrieshas been summarized recently (Malafosse and Thibier,1990; Foote, 1999).
Semen Evaluation
The most widely used test of sperm quality from theinitial stages of AI development until the present timehas been the assessment of the proportion of normal,progressively moving sperm (Anderson, 1945; Maule,1962; Salisbury et al., 1978). Thus, a good microscope isthe key. In addition to examining sperm with brightfieldmicroscopes, differential interference contrast micro-scopes, multiple stains, flow cytometry, and computer-assisted sperm analysis (CASA) have contributed toimproved quantification of sperm motion (Graham,1978; Salisbury et al., 1978; Pace et al., 1981; Garneret al., 1997; Foote, 1998). With frozen semen, evaluationof post-thaw survival became important. The ability toevaluate the acrosomal status of sperm was enhancedby the work of Saacke and Marshall (1968). Techniquesused for evaluating sperm morphology have been re-viewed by Barth and Oko (1989).
Ejaculate volume and sperm concentration are thetwo other critical components of semen evaluation be-
cause they determine the number of sperm obtained.Volume originally was measured in graduated contain-ers. Volume today often is determined more accuratelyby weight, assuming that the specific gravity is 1.0.Stallion semen was weighed years ago (Nishikawa,1959). Rapid optical density methods for measuringsperm concentration have replaced tedious hemocyto-metric procedures.
Fertility of sperm is the ultimate test of sperm qual-ity. Often it is not possible to measure fertility, so manytests of semen quality in addition to motility and mor-phology, such as the hypoosmotic swelling test, mucousor gel penetration, and integrity of the DNA have beencorrelated with fertility (Graham, 1978; Saacke, 1981;Foote, 1998, 1999). Competitive fertilization (Beatty,1960; Saacke, 1981; Dziuk, 1996; Foote, 1998) withmixed sperm offers an efficient way to rank the fertilityof males either using in vitro fertilization tests or testswith animal insemination. However, it is not generallyfeasible to mix semen in commercial AI. For commercialAI, an inexpensive method of estimating fertility, basedon cows not returning for insemination, was developedas an essential component of the AI program (Thomp-son and Salisbury, 1947). This made possible the com-paring of fertility of bulls, inseminators, semen pro-cessing procedures, and even herd performance underpractical field conditions. It provided a remarkable newsystem of recording breeding efficiency. Others had ar-gued strongly for using pregnancy diagnosis, but thisclearly involved few cows, was performed sporadically,and did not provide for centralized collection and evalu-ation of data. The efficiency of the nonreturn method formonitoring fertility is reduced today because of multiplesuppliers of semen to individual farms and within-herd inseminators.
Semen Extenders, Semen Cooling, and Extension Rate
Initially the most important problem to resolve wasa method to store semen long enough for shipment anduse in the field. The first major improvement in theAI procedure initiated in the United States was thedevelopment of a yolk-phosphate semen extender (Phil-lips and Lardy, 1940). Salisbury et al. (1941) improvedthe media by buffering the egg yolk with sodium citrate.Sperm survival at 5°C permitted use of the semen forup to 3 d, and the citrate dispersed the fat globules inegg yolk, making sperm visible for microscopic exami-nation. This semen extender was used worldwide forcattle. Glycerol was added later for cryopreservation ofbull sperm.
The next major stimulus to AI of dairy cattle was animprovement of about 15% in fertility resulting from abetter method of initially protecting sperm from coldshock (Foote and Bratton, 1949) and the control of somevenereal diseases by the addition of antibiotics (Alm-quist et al., 1949; Foote and Bratton, 1950). The Cornellextender (Foote and Bratton, 1950), containing the anti-biotic mixture of penicillin, streptomycin, and poly-

Foote4
myxim B, was used for many years as the standard.Many years were required to eradicate the diseasesfrom bulls. During that time in vitro treatment of semenwith antibiotics prevented transmission of several dis-eases. Antibiotics are still included as “insurance” pro-tection against possible contamination. This treatmentof semen was worth hundreds of millions of dollars tothe dairy world. No patents were filed, and neitherPennsylvania nor Cornell received any remuneration.The reward was service to agriculture. Growth of AI wasnow ensured, because dairies using only AI eliminatedvenereal diseases, reduced embryonic death, andachieved high fertility.
With AI expanding rapidly, demands for semen frompopular bulls increased. The simplest way to meet thisdemand was to “stretch” each ejaculate farther by usingfewer sperm per insemination, providing that this couldbe accomplished without sacrificing fertility. Salisburyand coworkers published several classic papers (seeSalisbury et al., 1978; Foote, 1998) clearly supportingthe concept that only a few million sperm per insemina-tion were required. In conducting these experimentsSalisbury was criticized by some who declared that “di-lution” of semen was like “watering the milk.” Conse-quently, Foote and Bratton (1950) introduced the word“extender” because the yolk-citrate-antibiotic mediumenhanced and extended the usefulness of semen. Thisword has “stuck.” We considered using the word “sus-pender” as a snappy term, also. The net result of theseexperiments was that semen extension could be in-creased at least 25-fold. Sperm numbers per insemina-tion with liquid semen were reduced from more than100 × 106 sperm per insemination to 4 × 10⁶ sperm perinsemination (see Salisbury et al., 1978; Foote, 1998).Along with hard work in the laboratory, Salisbury’sgraduate students remember relaxing over gourmetfood in his home.
The yolk-based extender was improved with CornellUniversity Extender (CUE, Foote et al., 1960), whichresulted in the highest fertility achieved in AI on hun-dreds of thousands of inseminations (Salisbury et al.,1978; Foote, 1998). Shannon visited Cornell in the late1950s and modified the extender (Shannon et al., 1984)for use with liquid semen in the intensive breedingseason in New Zealand. Caproic acid and catalase wereincluded with 5% egg yolk by volume to form “Capro-gen,” an effective extender for preserving bull sperm atthe moderate ambient temperatures of New Zealand,with as few as 2 × 10⁶ sperm per insemination. Severalresearchers (see Salisbury et al., 1978; Foote, 1998) hadreported that the volume of egg yolk used originallycould be greatly reduced, particularly at ambient tem-peratures, and that catalase might be beneficial atroom temperature.
Milk also was widely used. Following the report byMichajilov (1950), Almquist and coworkers (Thackerand Almquist, 1953; O’Dell and Almquist, 1957; Alm-quist and Wickersham, 1962) published a series of pa-pers on skim milk and whole milk, establishing the
optimal procedures for detoxification of milk and addi-tion of glycerol for freezing semen. The milk-glycerolextender continues to be used by many AI organi-zations.
Bull Sexual Behavior, Intensity of Semen Collection,and Sire Power
To meet the high demand for semen from selectedbulls, harvesting the maximal number of sperm perbull was the other approach to increasing the numberof inseminations possible per bull. Early research onsexual preparation and intensity of semen collectionwas initiated by Bratton and colleagues (Collins et al.,1951; Bratton and Foote, 1954; Hafs et al., 1959) andAlmquist and colleagues (Hale and Almquist, 1960;Amann, 1970; Almquist, 1973, 1982). The extensivestudies by Almquist and associates included beef bullsas well as dairy bulls (Almquist, 1973). These collectivestudies resulted in recognizing the importance of evalu-ating the sexual responses of individual bulls andapplying stimuli along with an optimal frequency ofabout six semen collections per week. The result wasa sperm output of 30 to 40 × 109 sperm per week persire. With a 50-wk-per-year collection schedule and 10 ×106 sperm per insemination dose, these sperm numberstranslate into 200,000 doses of semen for inseminationeach year.
Large differences occurred in sperm output of bullswhen semen was collected under comparable condi-tions. Methods were developed to evaluate both thequality and quantity of spermatogenesis in bulls (Foote,1969; Amann, 1970). These studies revealed that thedifferences in sperm output were largely due to testicu-lar size. Testis size was easily measured and was highlyinherited, h2 = 0.67 (Coulter et al., 1976). So, attentionto testis size was important in selection and evaluationof sires.
Extensive studies were conducted on nutrition, per-formance, and aging of bulls (see Foote, 1998). Rapidgrowth was important in minimizing the time requiredfor young bulls to reach puberty and be tested for AI.Unfortunately, these data are largely unknown becausethey were published in bulletin form (Bratton et al.,1959, 1961), although one classic paper appeared in ajournal (Almquist, 1982). Almquist always kept an openmind about what might be possible. At one scientificmeeting he handed out note pads less than 1 inch wideand several inches long to remind people not to be “nar-row-minded.” Bratton was a perfectionist and did notpublish results until the experiments were completed,even if they took 10 yr. Tenure then was translated as10 yr.
Genetic Selection of Bulls for Milk
One of the major reasons for initiating AI was tomake the males that transmit superior genetics for milkproduction available to more producers in the animal

History of artificial insemination 5
industry. This was democracy in action. The elite bullswould not be limited to the wealthy. However, bull se-lection procedures practiced before the AI era gave dis-appointing results. Many bulls with high proofs in natu-ral service did not repeat in AI. Robertson and Rendel(1950) in Scotland and Henderson (1954) at CornellUniversity pioneered new methods of sire selection(Van Vleck, 1981). Henderson continued his researchto establish the principles required for optimal sire se-lection programs and to provide objective methods foradjusting records for unequal environmental in-fluences.
Henderson received his training under Dr. Lush atIowa. He combined this with his mathematical geniusand attracted graduate students and scholars from allover the world. Along with these scholars, Hendersonhas had the greatest impact on dairy cattle genetics ofany single person in history. He was a modest individ-ual, always ready to take time with a yellow pad ofpaper to scratch out a solution to anyone’s mathemati-cal problem. He didn’t need modern computers becausehe was born with one.
Frozen Semen
While the geneticists were making breakthroughs onsire selection, an astounding achievement was reportedfrom England (Polge et al., 1949), the successful freez-ing of chicken sperm by including glycerol. Glycerolsoon was found to be useful for bull sperm. Many re-searchers had tried to freeze bull semen (I had eventried ethylene glycerol unsuccessfully in the late 1940sto store bull sperm at −10°C) but had failed. A bit ofserendipity played a role in the discovery (Polge, 1968).The research had focused on using sugars as cryoprotec-tants, but they did not lead to successful results. How-ever, Polge relates that he returned 6 mo later to tryagain, and results were promising, presumably withthe same bottle of fructose stock solution. Why successnow? What was in the bottle? Chemical analysis showedthat the bottle contained no sugar, but rather glyceroland protein in proportions comprising Meyers albuminused for histology. Apparently, there had been a mis-take in labeling when reagents were stored. HoraceWolpole coined the word serendipity, noting that it com-bined accidental discovery with sagacity. Both aspectswere displayed here. Unfortunately, the dictionaries donot include sagacity in defining serendipity.
The basic medium used by Polge was the originalyolk-citrate extender (Salisbury et al., 1941) plus glyc-erol. Almquist and coworkers (O’Dell and Almquist,1957) developed whole milk-glycerol as a good mediumto cryopreserve bull sperm. Tris-buffered egg yolk-glyc-erol also provided excellent protection for sperm eitherfrozen or unfrozen (Davis et al., 1963; Foote, 1998).This soon became the most commonly used mediumworldwide for cryopreservation of bull sperm and spermfrom several other species (Iritani, 1980).
Packaging frozen semen for use with solid carbondioxide (Dry Ice�) or liquid nitrogen was a problem.Glass ampules often broke during freezing or thawing.Cassou (1964) modified the system developed bySørensen (1940), with a method for sealing plasticstraws and a gun for insemination (Pickett and Berndt-son, 1974). Originally 0.5-mL capacity straws wereused, but 0.25-mL straws are popular because they re-quire less storage space.
Another major change in storage occurred in the1950s with the shift from solid carbon dioxide storageat −79°C to liquid nitrogen at −196°C. Researchers haddemonstrated that sperm survival at −196°C was virtu-ally infinite, whereas biologic changes occurred withstorage at −79°C. Also, storage with solid carbon dioxidewas not convenient, and frequent resupply was nec-essary.
Liquid nitrogen storage also was a problem, becauseinsulation of the tanks was inefficient. Frequent refill-ing was required to maintain a safe temperature ofabout −196°C. Manufacturers of tanks were not inter-ested in improving tanks until J. Rockefeller Prentice,owner of American Breeders Service, privately provideda substantial sum of money, which convinced LindeDivision of the American Cyanamid Company thatthere was a market for liquid nitrogen containers withimproved insulation. The successful cryopreservationof sperm and development of efficient liquid nitrogencontainers provided the foundation upon which today’sentire cryopreservation industry is built.
Frozen semen is less fertile than fresh semen (Shan-non and Vishwana (1995), as many semen additives toimprove fertility of frozen semen have been tested withminimal success (Foote, 1999). However, a recent report(Amann et al., 1999) provided preliminary support fora peptide that increased fertility when added to frozen-thawed semen.
Detection of Estrus, Synchronization,and Timing Insemination
Obviously, success in the field depended on the properdetection of estrus and skillful insemination. The clas-sic rule referred to as the A.M. to P.M. and P.M. to A.M.system for insemination was established by Trimberger(1948). It was based on observation, palpation of theovaries, and breeding data. This rule established thatfor best fertility cows first seen in estrus in the A.M.should be inseminated during the afternoon of the sameday. Cows first seen in estrus in the P.M. should beinseminated before noon the next day. Trimberger wasa keen observer and was one of the most successfulcoaches of intercollegiate dairy cattle judging teams.
Accurate detection of estrus is a problem on manyfarms (Foote, 1975). Intensive research to regulate thetime of estrus and ovulation in the cow has been ongoingfor about 50 yr (Ulberg et al., 1951; Hansel and Trimb-erger, 1952). Fertility was very low in early studieson estrus synchronization (Hansel and Convey, 1983).

Foote6
Fertility still is lower in many cases, but cows can beinseminated at a fixed time without detection of estrus(Nebel et al., 2000). Rowson (1971) predicted that AI,combined with superovulation, synchronization of es-trus, and manipulation of embryos would lead to majoradvances in animal production beyond the use of AIalone. Rowson was a prodigious worker with a greatsense of humor. Many researchers came to Cambridgeto gain from his experience.
Women played key roles. Few were inseminators, buttaking the farmers’ calls and washing and sterilizingthe glassware (before the era of plastic) daily providedimportant teamwork.
Sexing Sperm
One of the most dramatic technical advances in re-cent years is the sexing of sperm by DNA quantificationusing flow cytometry instrumentation developed at Liv-ermore Laboratories (Gledhill, 1985) and improvedsince (Johnson and Seidel, 1999). The time currentlyrequired to sort the billions of sperm per ejaculate limitsextensive commercial application, but the machines aregetting faster.
Freeze-Dried Sperm
Successful freeze-drying of bull sperm was erron-eously reported by Meryman in 1960 (see Graham etal., 1974 for references). Attempts by many researchersto repeat the research produced negative results. How-ever, Graham et al. (1974) produced one pregnancy.Had microinjection techniques been available then,Graham would have been at work at his usual 5 a.m.start of the day looking for another way to use AI.With the microinjection technique, preservation of theintegrity of the DNA of freeze-dried sperm was demon-strated recently (Wakayama and Yanagimachi, 1998).
Development and Use of AI in SpeciesOther Than Dairy Cattle
Beef Cattle
Beef cattle greatly outnumber dairy cattle in theUnited States. The technology of semen handling andinsemination of beef cows is similar to that used fordairy cows, but beef cows are not managed as conve-niently for AI. Many cows are on extensive rangeswhere detection of estrus and rounding up animals inestrus for insemination is not cost-effective. Therefore,the proportion of beef cattle bred by AI is low (Foote,1981; Dziuk and Bellows, 1983). Where small groupsof beef cows are kept in close confinement, estrous cycle-regulating agents can be used to synchronize the timeof insemination for at least one insemination. In cross-breeding programs, AI has the advantage because se-men can inexpensively replace maintaining bulls of sep-arate breeds.
Swine
The AI of swine was initiated by Ivanow in Russiain the early 1900s (Ivanow, 1907; Ivanoff, 1922). Moreextensive investigations were conducted in the 1930s(Milovanow, 1938; Anderson, 1945; Maule, 1962; Nishi-kawa, 1964). Early work was started in the UnitedStates in Missouri (McKenzie, 1931), in Japan in 1948(Ito et al., 1948; Niwa, 1958), and in western Europein the 1950s (Polge, 1956). Boars are easily trained tomount dummies (Milovanov, 1938; Polge, 1956).
All artificial vaginas developed for boar semen collec-tion provided a means of applying pressure to the glanspenis (McKenzie, 1931; Ito et al., 1948; Polge, 1956), ora gloved hand can be used directly. McKenzie trainedmany early outstanding reproductive physiologists (An-drews, Casida, Phillips, etc.). He attended animal sci-ence meetings long after officially retiring, asking ques-tions about the latest developments. At the 75th meet-ing of the American Society of Animal Science, when aroll of long-time members was called, he was the onlymember standing at the end, a member for 61 yr.
Russian diluters for boar semen were based on glu-cose solutions with sodium potassium tartrate or so-dium sulfate and peptone, keeping the concentrationof electrolytes low (Milovanov, 1938; Anderson, 1945;Polge, 1956; Maule, 1962). The recommended storagetemperature was 7 to 12°C. However, Ito et al. (1948)recommended storage at 15 to 20°C. When the yolk-phosphate, yolk-citrate, and milk extenders were devel-oped for bull semen, they were used or modified forboar semen (Polge, 1956; Niwa, 1958; Maule, 1962),including use with cooled semen.
Major efforts were made to freeze semen, followingthe successful use of frozen bull sperm (Nishikawa,1964; Graham, 1978; Iritani, 1980; Johnson and Lars-son, 1985; Johnson and Rath, 1991; Rath et al., 1996;Johnson, 1998; Foote, 1999; Johnson and Guthrie,2000). Many modifications of extenders and freezingprocedures were developed (see Johnson, 1998), includ-ing the pellet method of freezing, which was developedoriginally in Japan (Nagase and Graham, 1964). Preg-nancy rates and litter sizes are reduced with cryopre-served boar sperm, so frozen semen is limited to use inspecial breeding programs. Fresh or extended liquidsemen is used for about 99% of AI in swine.
Rapid transport of extended semen makes it feasiblefor swine farmers to take advantage of commerciallyproduced boar semen. Large corporations increase theservices possible from their own boars by using AI.Insemination is done by the swine farm personnel. Atypical dose is 3 × 10⁹ sperm inseminated in 80 mL.Over 50% of the sows in the United States are insemi-nated today, and about 80% farrow with 10 pigs perlitter. Swine AI is growing at a phenomenal rate.
Techniques for evaluating quality of boar sperm aresimilar to those used for bull sperm (Johnson, 1998).Sexing of boar sperm is possible but is too slow to pro-duce sexed sperm for commercial use. Detection of es-

History of artificial insemination 7
trus is facilitated in sows because most come into estruswithin a week after weaning their litters. Further tech-nical details can be found in the references cited pre-viously.
Horses
Research on AI of horses started in Russia in 1899(Ivanow, 1907; Ivanoff, 1922), stimulated particularlyby the military’s need for horses. Ishikawa initiatedsimilar studies in Japan in 1912 (Sato, 1916; Nishi-kawa, 1962). The book by Nishikawa provides a fasci-nating account of the extensive, detailed studies by agreat researcher and teacher and an extraordinary gen-tleman. After visiting in our home in the 1960s he wrotethat he couldn’t wait for me to visit him in Japan wherehe could “hospitalize” me. I was treated royally. McKen-zie et al. (1939) and Berliner (1942) initiated studieson the collection, processing, and insemination of stal-lion and jack semen in the United States.
The earliest collections of semen were obtained byplacing a rubber semen collection bag in the vagina ofa mare in estrus. In the 1930s and 1940s, several typesof artificial vaginas were developed (Anderson, 1945;Maule, 1962; Perry, 1968; Davies Morel, 1999) and theysince have been modified. A smaller, lighter versionwas developed by Nishikawa (see Davies Morel, 1999).Semen evaluation is performed similarly to the evalua-tion of bull semen.
Military studs provided a convenient source of stal-lions (Anderson, 1945; Maule, 1962), but after WorldWar II many of these were eliminated because the horsepopulation had declined. In addition, the restrictive reg-ulations on the use of AI by several equine breed organi-zations inhibited research and the application of AI.China was the major country using equine AI duringthis period.
Advances made in cryopreserving bovine sperm stim-ulated interest in cryopreservation of equine semen.Research results are summarized in several congressesand symposia (Nishikawa, 1964, 1972; Bonadonna andSucci, 1976; Sharp and Bazer, 1995) and by DaviesMorel (1999). Although methods have been devised tofreeze stallion sperm, most equine AI is done withcooled, extended semen used within 48 h of collectionduring the spring breeding season. The breeding seasonmay be advanced by fall lighting.
Sheep and Goats
The early development of AI in sheep on a major scalebegan in Russia (Milovanov, 1938, 1964; Maule, 1962),where the collective farms provided an ideal arrange-ment for establishing AI programs. China also has ex-tensive sheep AI programs. Artificial inseminationspread to central Europe and also was widely appliedcommercially in France and Brazil (Anderson, 1945;Maule, 1962; Foote, 1999). The techniques for semencollection and artificial insemination in sheep and goats
have been described in detail (Evans and Maxwell,1987). Semen quality and breeding efficiency are af-fected by season.
Both rams and bucks can be trained to serve theartificial vagina. However, for obtaining semen from alarge number of rams in the field, electroejaculationis a useful procedure, pioneered by Gunn (1936) andapplied to many species (Dziuk et al., 1954). Much ofthe early research in the Western world on extendersfor sperm, freezing of semen, and AI techniques wasdone by Emmens and Blackshaw, followed by Salamonand Maxwell in Australia, and Dauzier, Colas, and Cor-tell in France (Corteel, 1981; Salamon and Maxwell,1995a,b; Maxwell et al., 1999).
Buck sperm cryopreservation is more successful thanthe cryopreservation of ram sperm. The techniques andmedia for freezing semen such as with egg yolk-tris-glycerol were modified (Corteel, 1981; Salamon andMaxwell, 1995a; Maxwell and Watson, 1996; Amoahand Gelaye, 1997) from procedures developed for bullsperm (Davis et al., 1963).
Frozen-thawed semen results in satisfactory fertilityin goats provided that the sperm are deposited deepinto or through the cervix. In the ewe this is difficult.Therefore, insemination into the uterus with the aidof a laparoscope has been necessary to achieve highfertility. Recently, Maxwell et al. (1999) used intrac-ervical insemination successfully by adding seminalplasma to cryopreserved ram sperm before it was usedfor insemination. Because of the difficulty of insemina-tion, general management and low value per animal,AI, particularly of sheep, is not widespread.
Poultry
Artificial insemination has been widely applied topoultry. Semen collection, processing, and AI have beenreviewed by Sexton (1979) and Lake (1986) and morerecently by Donoghue and Wishart (2000). Pioneers inthe poultry field were Burrows and Quinn (1937), whodeveloped the method of abdominal massage and pres-sure to collect semen. With the ease of collecting poultrysemen, and proximity of hens on large breeding farms,AI is used extensively with freshly collected semen. Itis used 100% for turkey breeding because mating isdifficult. Freshly collected chicken semen was amongthe first type of semen to be frozen (Shaffner et al.,1941; Polge et al., 1949). However, cryopreserved poul-try sperm are less fertile and freezing poultry spermstill is experimental (Gill et al., 1999).
Other Domestic Mammals
Although the dog was the first animal in which AIwas documented, AI has only been used in special cases,such as for breeding guide dogs or for overcoming spe-cial problems. Many breed organizations do not registerpuppies produced by AI. Cryopreservation of dog spermis successful, using modifications of the yolk-tris and

Foote8
yolk-lactose extenders developed for cryopreservingbull sperm (Foote, 1990).
Rabbits have been extensively used as a model forlarge animals and humans (Foote, 1998; Foote and Car-ney, 2000). All the reproductive techniques employedwith farm animals can be performed with the low-costrabbit model, and certain placental membrane charac-teristics make them especially relevant for studies ofhuman teratology (Foote and Carney, 2000).
Endangered Mammals
The first animal reproductive biotechnology used topreserve endangered species was AI (Wildt et al., 1995).Again, many of the principles and procedures used wereadapted from cattle (Watson, 1978).
Implications
In the initial stages of attempting to develop AI therewere several obstacles. The general public was againstresearch that had anything to do with sex. Associatedwith this was the fear that AI would lead to abnormalit-ies. Finally, it was difficult to secure funds to supportresearch because influential cattle breeders opposed AI,believing that this would destroy their bull market. Thecareful field-tested research that accompanied AI soonproved to the agricultural community that the technol-ogy applied appropriately could identify superior pro-duction bulls free from lethal genes, would control vene-real diseases, and did result in healthy calves. Thus,fear was overcome with positive facts. The extensionservice played an important role in distributing thesefacts.
The knowledge gained from the AI experience wasextremely helpful in stepwise development of each suc-cessive reproductive technology, such as frozen semen,superovulation, embryo transfer, and, eventually, clon-ing. Simultaneously, the public became better informedand more willing to accept that technology developedwith worthy goals, and built-in ethical application,could produce positive change, benefiting the wholecommunity. Worthy goals, development of the neces-sary knowledge and skills, and ethical considerationsall are essential components of any technology that willresult in a positive impact on society and the environ-ment. Thus, the impact of AI was much more profoundthan simply another way to impregnate females.
Literature Cited
Almquist, J. O. 1973. Effects of sexual preparation on sperm output,semen characteristics and sexual activity of beef bulls with acomparison to dairy bulls. J. Anim. Sci. 36:331–336.
Almquist, J. O. 1982. Effect of long term ejaculation at high frequencyon output of sperm, sexual behavior, and fertility of Holsteinbulls: Relation of reproductive capacity to high nutrient allow-ance. J. Dairy Sci. 65:814–823.
Almquist, J. O., P. J. Glantz, and H. E. Shaffer. 1949. The effect ofa combination of penicillin and streptomycin upon the livabilityand bacterial content of bovine semen. J. Dairy Sci. 32:183–190.
Almquist, J. O., and E. W. Wickersham. 1962. Diluents for bovinesemen. XII. Fertility and motility of spermatozoa in skim milkwith various levels of glycerol and methods of glycerolization.J. Dairy Sci. 45:782–787.
Amann, R. P. 1970. Sperm production rates. In: A. D. Johnson, W.R. Gomes, and N. L. Van Demark (ed.) The Testis. Vol. 1. pp443–482. Academic Press, NY.
Amann, R. P., G. E. Seidel, Jr., and Z. A. Brink. 1999. Exposure ofthawed frozen bull sperm to a synthetic peptide before artificialinsemination increases fertility. J. Androl. 20:42–46.
Amoah, E. A., and S. Gelaye. 1997. Biotechnological advances in goatreproduction. J. Anim. Sci. 75:578–585.
Anderson, J. 1945. The Semen of Animals and its Use for ArtificialInsemination. Tech. Comm. Imperial Bureau of Animal BreedingGenetics, Edinburgh.
Asdell, A. A. 1969. Historical introduction. In: H. H. Cole and P. T.Cupps (ed.) Reproduction in Domestic Animals. 2nd ed. Aca-demic Press, New York.
Barth, A. D., and R. J. Oko. 1989. Abnormal Morphology of BovineSpermatozoa. Iowa State University Press, Ames.
Beatty, B. A. 1960. Fertility of mixed semen from different rabbits.J. Reprod. Fertil. 1:52–60.
Berliner, V. R. 1942. Dilutors for stallion and jack semen. J. Anim.Sci. 1:314–319.
Blom, E. 1950. Interpretation of spermatic cytology in bulls. Fertil.Steril. 1:223–238.
Bonadonna, T. 1937. Le basi scientifiche e le possibilite applicativedella fecondazione artificiale neglianimale domestica. Casa Ed.Vannini, Brescia, Italy.
Bonadonna, T. 1975. VIth International enquiry into artificial insemi-nation in the world (1971–1973). Zootec. Vet. 30:2–108.
Bonadonna, T., and G. Succi. 1976. Artificial insemination of animalsin the world. In: Proc Int. Congr. Anim. Reprod. Art. Insem.,Krakow, Poland. 4:769–777.
Brackett, B. G., G. E. Seidel, Jr., and S. M. Seidel. 1981. New Techno-logies in Animal Breeding. Academic Press, New York.
Bratton, R. W., and R. H. Foote. 1954. Semen production and fertilityof dairy bulls ejaculated either once or twice at intervals of eitherfour or eight days. J. Dairy Sci. 37:1439–1443.
Bratton, R. W., S. D. Musgrave, H. O. Dunn, and R. H. Foote. 1959.Causes and prevention of reproductive failures in dairy cattle.II. Influence of underfeeding and overfeeding from birth to 80weeks of age on growth, sexual development and semen produc-tion of Holstein bulls. Cornell Univ. Agric. Exp. Sta. Bull. 940,Ithaca. pp 1–45.
Bratton, R. W., S. D. Musgrave, H. O. Dunn, and R. H. Foote. 1961.Causes and prevention of reproductive failures in dairy cattle.III. Influence of underfeeding and overfeeding from birththrough 80 weeks of age on growth, sexual development, semenproduction and fertility of Holstein bulls. Cornell Univ. Exp.Sta. Bull. No. 964, Ithaca. pp 1–24.
Burrows, W. H., and J. P. Quinn. 1937. The collection of spermatozoafrom the domestic fowl and turkey. Poult. Sci. 26:19–24.
Cassou, R. 1964. La methode des pailletes en plastique adaptee a lageneralisation de la conqelation. In: Proc. 5th Int. Congr. Anim.Reprod. Trento, Italy. 4:540–546.
Cole, H. H., and P. T. Cupps. 1959. Reproduction in Domestic Animals.1st ed. Academic Press, New York.
Collins, W. J., R. W. Bratton, and C. R. Henderson. 1951. The relation-ship of semen production to sexual excitement of dairy bulls. J.Dairy Sci. 34:224–227.
Corteel, J. M. 1981. Collection, processing and artificial inseminationof goat semen. In: C. Gall (ed.) Goat Production. pp 171–191.Academic Press, London.
Coulter, G. H., T. R. Rounsaville, and R. H. Foote. 1976. Heritabilityof testicular size and consistency in Holstein bulls. J. Anim. Sci.43:9–12.
Cupps, P. T. 1991. Reproduction in Domestic Animals. 4th ed. Aca-demic Press, San Diego, CA.
Davies Morel, M. C. G. 1999. Equine Artificial Insemination. CABIPublishing, Wallingford, Oxon, U.K.

History of artificial insemination 9
Davis, I. S., R. W. Bratton, and R. H. Foote. 1963. Livability of bovinespermatozoa at 5, −25, and −85°C in tris-buffered and citrate-buffered yolk-glycerol extenders. J. Dairy Sci. 46:333–336.
Donoghue, A. M., and G. J. Wishart. 2000. Storage of poultry semen.Anim. Reprod. Sci. 62:213–232.
Dziuk, P. J. 1996. Review: Factors that influence the proportion ofoffspring sired by a male following heterospermic insemination.Anim. Reprod. Sci. 43:65–88.
Dziuk, P. J., and R. A. Bellows. 1983. Management of reproductionof beef cattle, sheep and pigs. J. Anim. Sci. 57(Suppl. 2):355–379.
Dziuk, P. J., E. F. Graham, J. D. Donker, G. B. Marion, and W. E.Petersen. 1954. Some observations in collection of semen frombulls, goats, boars and rams by electrical stimulation. Vet. Med.49:455–458.
Evans, G., and W. M. C. Maxwell. 1987. Salamon’s Artificial Insemi-nation of Sheep and Goats. Butterworths, Sydney.
Foote, R. H. 1969. Research techniques to study reproductive physiol-ogy in the male. Techniques and Procedures in Animal ScienceResearch. pp 81–110. Am. Soc. Anim. Prod., Albany, NY.
Foote, R. H. 1975. Estrus detection and estrus detection aids. J. DairySci. 58:248–256.
Foote, R. H. 1981. The artificial insemination industry. In: B. G.Brackett, G. E. Seidel, Jr., and S. M. Seidel (ed.) New Technolog-ies in Animal Breeding. pp 13–39. Academic Press, New York.
Foote, R. H. 1998. Artificial Insemination to Cloning: Tracing 50Years of Research. Published by the author, Ithaca, New York.
Foote, R. H. 1999. Artificial insemination from its origins up to today.In: V. Russo, S. Dall ’Olio, and L. Fontanesi (ed.) Proc. of theSpallanzani Int. Symp., Reggio Emilia, Italy. pp 23–67.
Foote, R. H., and R. W. Bratton. 1949. The fertility of bovine semencooled with and without the addition of citrate-sulfanilamide-yolk extender. J. Dairy Sci. 32:856–861.
Foote, R. H., and R. W. Bratton. 1950. The fertility of bovine semenin extenders containing sulfanilamide, penicillin, streptomycin,and polymyxin. J. Dairy Sci. 33:544–547.
Foote, R. H., and C. W. Carney. 2000. The rabbit as a model forreproductive and developmental toxicity studies. Reprod. Tox-icol. 14:477–493.
Foote, R. H., L. C. Gray, D. C. Young, and H. O. Dunn. 1960. Fertilityof bull semen stored up to four days at 5°C in 20% egg yolkextenders. J. Dairy Sci. 43:1330–1334.
Garner, D. L., C. A. Thomas, H. W. Joerg, J. M. DeJarnett, and C.E. Marshall. 1997. Fluorometric assessments of mitochondrialfunction and viability in cryopreserved bovine spermatozoa. Biol.Reprod. 57:1401–1406.
Gill, S. P., R. H. Hammerstedt, and R. P. Amann. 1999. Poultryartificial insemination: Procedures, current status and futureneeds. In: Proc. Annu. Mtg. Soc. Theriogenology, Nashville, TN.pp. 353–362.
Gledhill, B. L. 1985. Cytometry of mammalian sperm. Gamete Res.12:423–438.
Graham, E. F. 1978. Fundamentals of the preservation of spermato-zoa. In: The Integrity of Frozen Spermatozoa. Proc. Conf. Natl.Acad. Sci., Washington, DC. pp 4–44.
Graham, E. F., E. V. Larson, and B. G. Crabo. 1974. Freezing andfreeze-drying bovine spermatozoa. In: Proc. 5th Tech. Conf. Arti-ficial Insem., Reprod., NAAB, Columbia, MO. pp 14–20.
Gunn, R. M. C. 1936. Fertility in Sheep. CSIRO Bull. 94, Mel-bourne, Australia.
Hafs, H. D., R. S. Hoyt, and R. W. Bratton. 1959. Libido, spermcharacteristics, sperm output and fertility of mature dairy bullsejaculated daily or weekly for thirty-two weeks. J. Dairy Sci.42:626–636.
Hale, E. B., and J. O. Almquist. 1960. Relation of sexual behavior togerm cell output in farm animals. J. Dairy Sci. (Suppl.)43:145–169.
Hansel, W., and E. M. Convey. 1983. Physiology of the estrous cycle.J. Anim. Sci. 57(Suppl. 2):404–424.
Hansel, W., and G. W. Trimberger. 1952. The effect of progesteroneon ovulation time in dairy heifers. J. Dairy Sci. 35:65–70.
Heape, W. 1897. The artificial insemination of mammals and subse-quent possible fertilization or impregnation of their ova. Proc.R. Soc. Lond. B 61:52–63.
Henderson, C. R. 1954. Selecting and sampling young sires. In: Proc.7th Annu. Conf. Natl. Assoc. Artif. Breeders, Harrisburg, PA.pp 93–103.
Herman, H. A. 1981. Improving Cattle by the Millions: NAAB andthe Development and Worldwide Application of Artificial Insemi-nation. University of Missouri Press, Columbia.
Iritani, A. 1980. Problems of freezing spermatozoa of different species.In: Proc. 9th Int. Congr. Anim. Reprod. Artif. Insemin., Madrid,Spain. 1:115–131.
Ito, T., T. Niwa, and A. Kudo. 1948. Studies on artificial inseminationin swine. Zootech. Exp. Sta. Res. Bull. 55:1–74.
Ivanoff, E. I. 1922. On the use of artificial insemination for zootechni-cal purposes in Russia. J. Agric. Sci. 12:244–256.
Ivanow [Ivanov], E. I. 1907. De la fecondation artificielle chez lesmammiferes. Arch. Sci. Biol. 12:377–511.
Johnson, L. A. 1998. Current developments in swine semen: Preserva-tion, artificial insemination and sperm sexing. Proc. 15th Int.Pract. Vet. Sci., Birmingham, U.K. 1:225–229.
Johnson, L. A., and H. D. Guthrie. 2000. Boar Semen PreservationIV. Proc. IVth Int. Conf. on Boar Semen Preservation, Beltsville,MD. Allen Press, Laurence, KS.
Johnson, L. A., and K. Larsson. 1985. In: Proc. First Int. Conf. DeepFreezing of Boar Semen. Swedish Univ. Agricultural Sciences,Uppsala.
Johnson, L. A., and D. Rath. 1991. Boar Semen Preservation. II.Second Int. Conf. Boar Semen Preservation, Beltsville, MD.Suppl. I, Reprod. Domestic Anim.
Johnson, L. A., and G. E. Seidel, Jr. 1999. Proc. Current Status ofSexing Mammalian Sperm. Theriogenology 52:1267–1484.
Lagerlof, N. 1934. Changes in the spermatozoa and in the testes ofbulls with impaired or abolished fertility. Acta Path. Microbiol.Scand. Suppl. 19:1–254.
Leeuwenhoek, A. 1678. De natis e semine genitali animalculis. R.Soc. (Lond.) Philos. Trans. 12:1040–1043.
Lake, P. E. 1986. The history and future of the cryopreservation ofavian germ plasm. Poult. Sci. 65:1–15.
Malafosse, A., and M. Thibier. 1990. An outlook on the artificialinsemination industry in the EEC. In: Proc. 13th Tech. Conf.Artif. Insem. Reprod. NAAB, Columbia MO. pp 35–40.
Mann, T. 1964. The Biochemistry of Semen and of the Male Reproduc-tive Tract. Springer-Verlag, Berlin.
Maule, J. P. 1962. The Semen of Animals and Artificial Insemination.Commonwealth Agricultural Bureaux, Farnham Royal, U.K.
Maxwell, W. M. C., G. Evans, S. T. Mortimer, L. Tillan, E. S. Gellatly,and C. A. McPhie. 1999. Normal fertility after cervical insemina-tion with frozen-thawed spermatozoa supplemented with semi-nal plasma. Reprod. Fertil. Devel. 11:123–126.
Maxwell, W. M. C., and P. F. Watson. 1996. Recent progress in thepreservation of ram semen. Anim. Reprod. Sci. 42:55–65.
McKenzie, F. F. 1931. A method for collection of boar semen. J. Am.Vet. Med. Assoc. 78:244–246.
McKenzie, F. F., J. F. Lasley, and R. W. Phillips. 1939. The storageof horse and swine semen. Am. Soc. Anim. Prod. pp 222–225.
Michajilov, N. N. 1950. Sperm dilution in the milk. The Czecho-Slovak Vet. Mag. J. Am. Vet. Med. Assoc. 117:337 (Abstr.).
Milovanov, V. K. 1938. Isskusstvenoye Ossemenebie Selsko-Khozias-vennykh Jivotnykh [The Artificial Insemination of Farm Ani-mals]. Seljhozgiz, Mowcow.
Milovanov, V. K. 1964. Artificial Insemination of Livestock in theU.S.S.R. Trans. by A. Birron and Z. S. Cole. S. Monson, Jerusa-lem. Tech. Services, U.S. Dept. Commerce, Washington, DC.
Nagase, H., and E. F. Graham. 1964. Pelleted semen: Comparisonof different extenders and processes on fertility of bovine sperma-tozoa. In: Proc. 5th Int. Congr. Anim. Reprod. Artif. Insem.,Trento, Italy. 4:387–391.
Nebel, R. L., M. G. Dransfield, S. M. Jobst, and J. H. Bame. 2000.Automated electronic systems for the detection of oestrus andtiming of AI in cattle. Anim. Reprod. Sci. 60–61:713–723.

Foote10
Nishikawa, Y. 1959. Studies on Reproduction in Horses. Koei, Ky-oto, Japan.
Nishikawa, Y. 1962. Fifty years of artificial insemination of farmanimals in Japan. English Bull. 2. Kyoto University, Japan.
Nishikawa, Y. 1964. History and development of artificial insemina-tion in the world. In: Proc. 5th Int. Congr. Anim. Reprod. Artif.Insem., Trento, Italy. 7:163–259.
Nishikawa, Y. 1972. Present state of long-term conservation of spermand its application in various species of domestic animals. In:Proc. 7th Int. Congr. Anim. Reprod. Artif. Insem., Munich, Ger-many. 1:145–165.
Niwa, T. 1958. Artificial insemination with swine in Japan. Natl.Inst. Agric. Sci., Chiba-shi, Japan.
O’Dell, W. T., and J. O. Almquist. 1957. Freezing bovine semen. I.Techniques for freezing bovine spermatozoa in milk diluents. J.Dairy Sci. 40:1534–1541.
Pace, M. M., J. J. Sullivan, F. I. Elliott, E. F. Graham, and G. H.Coulter. 1981. Effects of thawing temperature, number of sper-matozoa and spermatozoal quality on fertility of bovine sperma-tozoa packaged in .5 ml French straws. J. Anim. Sci. 53:693–701.
Perry, E. J. (ed.) 1968. The Artificial Insemination of Farm Animals.4th ed. Rutgers University Press, New Brunswick, NJ.
Phillips, P. H., and H. A. Lardy. 1940. A yolk-buffer pabulum for thepreservation of bull semen. J. Dairy Sci. 23:399–404.
Pickett, B. W., and W. E. Berndtson. 1974. Preservation of bovinespermatozoa by freezing in straws: A review. J. Dairy Sci.57:1287–1301.
Polge, C. 1956. The development of artificial insemination service forpigs. Anim. Breed Abstr. 24:209–217.
Polge, C. 1968. Frozen semen and the A.I. Programme in Great Brit-ain. In: Proc. 2nd Tech. Conf. Artif. Insem. Reprod. NAAB, Co-lumbia, MO. pp 46–51.
Polge, C., A. U. Smith, and A. S. Parkes. 1949. Revival of spermatozoaafter vitrification and dehydration at low temperatures. Nature(Lond.) 164:666.
Rath, D., L. A. Johnson, and R. K. Weitze (ed.). 1996. Boar SemenPreservation. III. Reprod. Domestic Anim. 31:1–342.
Robertson, A., and J. M. Rendel. 1950. The use of progeny testingwith artificial insemination in dairy cattle. J. Genet. 50:21–31.
Rowson, L. E. A. 1971. The role of reproductive research in animalproduction. J. Reprod. Fertil. 26:113–126.
Saacke, R. G. 1981. Components of semen quality. J. Anim. Sci.(Suppl. 2) 55:1–13.
Saacke, R. G., and C. E. Marshall. 1968. Observations on the acroso-mal cap of fixed and unfixed bovine spermatozoa. J. Reprod.Fertil. 16:511–514.
Salamon, S., and W. M. C. Maxwell. 1995a. Review. Frozen storageof ram semen. I. Processing, freezing, thawing and fertility aftercervical insemination. Anim. Reprod. Sci. 37:185–249.
Salamon, S., and W. M. C. Maxwell. 1995b. Review. Frozen storageof ram semen. II. Causes of low fertility after cervical insemina-tion and methods of improvement. Anim. Reprod. Sci. 38:1–36.
Salisbury, G. W., H. K. Fuller, and E. L. Willett. 1941. Preservationof bovine spermatozoa in yolk-citrate diluent and field resultsfrom its use. J. Dairy Sci. 24:905–910.
Salisbury, G. W., N. L. VanDemark, and J. R. Lodge. 1978. Physiologyof Reproduction and Artificial Insemination of Cattle. 2nd ed.W. H. Freeman Co., San Francisco.
Sato, S. 1916. Life-duration of the horses spermatozoon outside thebody. Acta School. Med. Kioto 1:361–374.
Sexton, T. J. 1979. Preservation of poultry semen—a review. In:H. W. Hawk (ed.) Animal Reproduction. Beltsville Symposia inAgricultural Research, No. 3. pp 159–170. Allanheld, Osmun &Co., Montclair, NJ.
Shaffner, C. S., E. W. Henderson, and C. G. Card. 1941. Viability ofspermatozoa of the chicken under various environmental condi-tions. Poult. Sci. 20:259–265.
Shannon, P., B. Curson, and A. P. Rhodes. 1984. Relationship betweentotal spermatozoa per insemination and fertility of bovine semenstored in Caprogen at ambient temperature. N.Z. J. Agric. Res.27:35–41.
Shannon, P., and R. Vishwanath. 1995. The effect of optimal andsuboptimal concentrations of sperm on the fertility of fresh andfrozen bovine semen and a theoretical model to explain the fertil-ity differences. Anim. Reprod. Sci. 39:1–10.
Sharp, D. C., and F. W. Bazer. 1995. Equine Reproduction VI. Mono-graph Ser. I. Soc. Study Reprod., Madison, WI.
Sipher, E. 1991. The Gene Revolution: The History of CooperativeArtificial Breeding in New York and New England, 1938–1940.Eastern A. I. Cooperative, Inc., Ithaca, NY.
Sørensen, E. 1940. Insemination with gelatinized semen in paraffinedcellophane tubes [in Danish]. Medlernsbl. Danske Dyrlaege-foren. 23:166–169.
Spallanzani, L. 1784. Dissertations relative to the natural history ofanimals and vegetables. Trans. by T. Beddoes in DissertationsRelative to the Natural History of Animals and Vegetables. Vol.2:195–199. J. Murray, London.
Thacker, D. L., and J. O. Almquist. 1953. Diluters for bovine semen.I. Fertility and motility of bovine spermatozoa in boiled milk.J. Dairy Sci. 36:173–180.
Thompson, A. W., and G. W. Salisbury. 1947. A suggested procedurefor the establishment of standard and comparable breeding effi-ciency reports in artificial breeding. Mimeo. Pub. 1, Cornell Uni-versity, Ithaca, NY. [Adopted officially by Am. Dairy Sci. Assoc.].
Trimberger, G. W. 1948. Breeding efficiency in dairy cattle fromartificial insemination at various intervals before and after ovu-lation. Nebraska Agric. Exp. Sta. Bull, Lincoln. 153:26.
Ulberg, L. C., R. E. Christian, and L. E. Casida. 1951. Ovarian re-sponse in heifers to progesterone injections. J. Anim. Sci.10:752–759.
Van Vleck, L. D. 1981. Potential genetic impact of artificial insemina-tion, sex selection, embryo transfer, cloning and selfing in dairycattle. In: B. C. Brackett, G. E. Seidel, Jr., and S. M. Seidel(ed.) New Technologies in Animal Breeding. Academic Press,New York.
Wakayama, T., and R. Yanagimachi. 1998. Development of normalmice from oocytes injected with freeze-dried spermatozoa. Na-ture Biotech. 16:639–641.
Walton, A. 1933. The Technique of Artificial Insemination. ImperialBureau Anim. Genetics. Oliver and Boyd, Edinburgh.
Watson, P. F. 1978. Artificial Breeding of Non-Domestic Animals.Zool. Soc. Lond. Symp. 43. Academic Press, London.
Wildt, D. E., B. S. Pukazhenthi, J. L. Brown, S. Monfort, J. G. Howard,and T. L. Roth. 1995. Spermatology for understanding, manag-ing and conserving rare species. Reprod. Fertil. Dev. 7:811–824.

Livestock manure odor abatement with plant-derived oils and nitrogenconservation with urease inhibitors: A review1
V. H. Varel
USDA-ARS, U.S. Meat Animal Research Center, Clay Center, NE 689332
ABSTRACT: Confined animal feeding operations areunder environmental scrutiny for production of largequantities of waste in a small area. The waste can resultin odor, global warming gases, and the transfer of nutri-ents and pathogens to water and food sources. An in-complete anaerobic degradation of the carbohydrate,protein, and lipid components in waste is the primarycause of odor emissions. This incomplete degradationresults in the formation of short-chain volatile fattyacids (VFA), amines and other nitrogenous compounds,and sulfur-containing compounds. Our objectives areto provide simple, cost-effective, and environmentallysound solutions to control odor and pathogens in live-stock waste, with nutrient management a top priority.Previous studies have indicated that a urease inhibitor,N-(n-butyl) thiophosphoric triamide, can be used to re-duce urea hydrolysis in beef cattle feedlot pens, con-serve nitrogen, and inhibit ammonia emissions thatcontribute to odor. Our laboratory studies with antimi-crobial plant-derived oils, thymol and carvacrol, at 2 g/
Key Words: Animal Wastes, Essential Oils, Odors, Pathogens, Urease Inhibitors
2002 American Society of Animal Science. All rights reserved. J. Anim. Sci. 80(E. Suppl. 2):E1–E7
Introduction
Typically, cattle feedlots lose 75% of the nitrogen ex-creted by the animals under current management sys-tems (Vanderholm, 1985; Eghball and Power, 1994;Bierman et al., 1999). This volatilization of ammonianitrogen and related compounds contributes to offen-sive odor emissions. The nitrogen from feedlot manurein the United States is valued at approximately $111million if it is available as a fertilizer (Eghball andPower, 1994). Besides this nitrogen loss, livestock wastecan create other problems, which include nutrient en-
1The author wishes to thank ALPHARMA for sponsoring this BeefCattle Nutrition Symposium.
2Correspondence: P.O. Box 166 (phone: 402/762-4207; fax: 402/762-4209; E-mail: [email protected]).
Received September 17, 2001.Accepted November 19, 2001.
E1
kg of feedlot waste, demonstrated that production ofVFA in flasks over 23 d can be completely inhibited.Fecal coliforms were reduced from 4.6 × 10⁶ to 2.0 × 10³
cells/mL 2 days after treatment and were undetectablewithin 4 d. Total anaerobic bacteria were reduced from8.4 × 1010 to 1.5 × 10⁷ cells/mL after 2 d and continuedto be suppressed to that level after 28 d. These plant oilsare not degraded under anaerobic conditions. However,our feedlot studies and the literature indicate these oilsare degraded under aerobic conditions. This suggeststhat these generally recognized as safe (GRAS) chemi-cals, which are routinely used as preservatives in foodand personal care products, should not accumulate insoils to which this waste is applied. It is concluded thatchemical additives can be added to animal waste toprevent degradation, which in turn controls odor emis-sions, reduces pathogens, and conserves nutrients untilthe waste can be recycled as fertilizer. The economicsand environmental effects of using thymol and carva-crol in livestock production facilities need to be de-termined.
richment of soil and water, emissions of greenhouse gasand odorants, and transmission of pathogenic microor-ganisms (Mackie et al., 1998; McCrory and Hobb, 2001).Most of these problems are related to microbial metabo-lism of the livestock waste. Thus, understanding themicrobial activities occurring in the waste is critical tofinding solutions to solve some of these problems.
This review will briefly describe some of the problemscreated by confined animal feeding operations (CAFO)in relation to the waste products generated and proposesome solutions primarily associated with the use ofchemical additives to control microbial fermentation ofthe waste. Specifically, the focus will be on 1) microbialmetabolism occurring in feedlot waste and how ureaseinhibitors may affect nitrogen emissions and 2) micro-bial aspects of odor production and how natural antimi-crobial additives, plant-derived essential oils, might beused to control odor emissions and pathogens in thewaste.

VarelE2
General Concepts
Problems Created with CAFO. Livestock productionhas evolved over the last few decades away from inte-grated farms to intensive systems using confined facili-ties. Thus, a large number of animals are reared in asmall area, with the production of large quantities ofexcreta in a specific area. Many producers do not haveadequate land immediately available to routinely andeconomically dispose of this waste. This may result invarious methods to store the waste, including openstockpiles, compost piles, basins, or lagoons. These stor-age methods create problems associated with odor; pro-duction of the greenhouse gases carbon dioxide, meth-ane and nitrous oxide; surface and ground water con-tamination; and transmission of pathogens. Dust canalso be a major problem when the waste accumulateson the feedlot surface in a dry climate. Normally all ofthese storage methods result in considerable loss ofnutrients from the waste. Nutrient management shouldbe a high priority in determining solutions for problemsassociated with CAFO. This obviously begins with opti-mizing nutrient utilization by the animal to avoid ex-cess nutrient excretion. A smaller mass of nutrientsexcreted means fewer substrates for microbial produc-tion of odor and other potential air, water, and soil con-tamination.
Feedlot Nitrogen Considerations
Schematics on the nitrogen cycle of a cattle feedlot(Varel, 1997) and nitrogen loss from a feedlot (Mackieet al., 1998) have been previously published. Dependingon their diet, feedlot cattle excrete approximately 60 to80% of their nitrogen in urine and 20 to 40% in feces(Van Horn et al., 1996; Bierman et al., 1999). Fecalnitrogen is 50% organic nitrogen and 50% ammonia;however, urine contains up to 97% urea nitrogen, whichis readily converted by microbial urease to ammoniashortly after excretion (Muck and Richards, 1980; Mo-bley and Hausinger, 1989; Mobley et al., 1995). Temper-ature, moisture, and pH greatly influence the volatiliza-tion of ammonia; however, the majority of ammoniawill be emitted into the atmosphere (Van Horn et al.,1996), which enhances the deposition of nitrate, creat-ing acid rain that acidifies soils and woodlands (Likenset al., 1996; McCory and Hobbs, 2001). Ammonia emis-sions in Europe have increased by more than 50% dur-ing the past 30 yr. Livestock production has been identi-fied as the primary contributor to this increase (Painet al., 1998; McCory and Hobbs, 2001). Many Europeancountries have legislated the amount of livestock wastenitrogen that can be spread per unit of land area. Thisin turn requires increased storage capacity, which con-tributes to ammonia emissions.
Urease Inhibitors. Greater than 50% of ammonia inlivestock slurries originates from urea hydrolysis (VanHorn et al., 1996). Thus, successfully inhibiting thisprocess will potentially conserve nitrogen in waste.
Figure 1. Effect of weekly topical applications of theurease inhibitor N-(n-butyl) thiophosphoric triamide(NBPT) on the accumulation of urea in feedlot manure.Adapted from Varel et al. (1999).
Studies have been conducted in the rumen to determinethe effectiveness of various urease inhibitors (Jones andMulligan, 1975; Whitelaw et al., 1991; Ludden et al.,2000). These results suggest that short-term inhibitionin the rumen is possible, but the ruminal microfloraappear to adapt to the inhibition and some of the inhibi-tors are absorbed by the rumen, which limit their practi-cal use in improving utilization of dietary urea(Whitelaw et al., 1991; Ludden et al., 2000).
Urease inhibitors have been used successfully on ashort-term basis as a soil additive to control ureaseactivity when urea-based fertilizers are applied (Byrnesand Freney, 1995). Feedlot waste and the urea associ-ated with it is more similar to the soil environment thanthe rumen environment, especially when the feedlotsurface is dry. Initial laboratory studies with cattlewaste slurries suggest that inhibitors prevent hydroly-sis of urea for 4 to 11 d, and then a gradual hydrolysisoccurs that is complete at 28 d (Varel, 1997). If theurease inhibitor is added weekly, 70% of the urea re-mains after 28 d.
Field studies (Varel et al., 1999) with the urease in-hibitor N-(n-butyl) thiophosphoric triamide (NBPT) in-dicated that it could be used to increase the concentra-tion of urea in feedlot pens with weekly treatments(Figure 1). These data indicate that little to no ureaaccumulates in feedlot manure when the urease inhibi-tor is not applied. This observation is important because60 to 80% of the total nitrogen excreted by cattle is inurine, and urine contains up to 97% urea nitrogen (VanHorn et al., 1996; Bierman et al., 1999). Once this ureais converted to ammonia, it serves as a buffer, keeps thepH elevated, and enhances volatilization of ammonia(Varel et al., 1999). We estimate from our data in Figure1 that at 30.7 d, urea nitrogen accumulation is insteady-state with degradation, and 17 g of urea/kg ofDM is retained in the feedlot waste.
Controlling the environment on an open feedlot isnot possible. Therefore, rainfall can easily reduce the

Chemical additives to control livestock odor E3
concentration of an inhibitor applied to a feedlot surfaceand reduce its effectiveness. Microbial adaptation anddegradation of urease inhibitors are also possible.McCrory and Hobbs (2001) concluded that urease inhib-itors are currently too expensive and easily brokendown or inactivated to bring any economic or practicalbenefit to livestock producers. Although the currentlyavailable compounds for inhibiting urease are very ef-fective on a short-term basis (4 to 11 d), further studiesare needed to prolong this inhibition. Future studies inwhich encapsulation of the inhibitors, which wouldlimit the accessibility of the compounds to biologicaland chemical reactions and provide a prolonged andslow-release inhibition, may be fruitful. Also, a minorchemical modification of the compounds may reducetheir susceptibility to microbial degradation (Mobley etal., 1995). In summary, urease inhibitors are initiallyvery effective to conserve nitrogen in manure, but fur-ther processing such as injection of this manure intosoil or transfer to an enclosed container must occurperiodically to effectively recycle this nitrogen.
Microbial Aspects of Odor Production
Livestock excreta consists of undigested organic resi-dues, including proteins, carbohydrates, and fats. Thesecomponents can be degraded anaerobically, normally aslow process, or aerobically, which is a faster process.Under aerobic conditions the carbon, nitrogen, and sul-fur compounds generally end up as carbon dioxide, ni-trate, sulfate, and water. Under anaerobic conditions,if the organic matter is completely degraded, methane,carbon dioxide, hydrogen sulfide, ammonia, and waterare the products. However, in most livestock environ-ments the waste is in a dynamic state fluctuating be-tween aerobic and anaerobic conditions. This results inthe emissions of ammonia and associated N compounds,volatile fatty acids (VFA), sulfur compounds, variousalcohols, and aromatic (indole, skatole, and cresol) com-pounds (Watts et al., 1994; Mackie et al., 1998). Thereare hundreds of volatile organic compounds (VOC)formed; most are offensive to the general public andare considered nuisance odor compounds.
There are many problems with defining odor becauseof the numerous compounds formed, accurately collect-ing and quantifying these compounds, and trying todetermine whether the compounds analyzed by instru-mentation correlate with sensory perception and evalu-ation (Zhu et al., 1999; Zahn et al., 2001). Ammonia,hydrogen sulfide, and VOC are considered the only vola-tile components from livestock production facilitieswith any appreciable odor. Ammonia and hydrogen sul-fide are not well correlated with odor intensity. How-ever, Zahn (1997) found a good correlation between airconcentrations of VOC and odor offensiveness when 34swine production facilities were examined. Therefore,controlling the formation and emission of the VOCshould have a direct influence on odor release fromanimal production facilities.
The most critical point in controlling odor emissionsis regulating the volatilization rate. There are six fac-tors that influence the volatilization rate: source con-centration, surface area, net radiation, air temperature,wind velocity, and relative humidity. By using a coverover a lagoon or waste storage basin we can reduce thevolatilization rate by decreasing the solar radiation anddirect wind velocity stripping off the VOC. Variousother engineered processes can be used to affect the sixfactors controlling volatilization rate (Zahn et al., 1997).
If we can control the microbial formation of the VOCwe will be even more successful in controlling the vola-tilization rate. In most livestock production facilitiesit is not possible to control the environment in whichcomplete degradation of the waste to methane and car-bon dioxide occurs. Conventional anaerobic digestersfor production of methane were popular during the1970s and 1980s; however, economics and the technicalexpertise required to operate these digesters have di-minished their popularity (Morse et al., 1996). Simi-larly, aerobic treatment is not economically feasible,and it does little to conserve nutrients. Therefore, if wecan slow down or stop the microbial fermentation of theorganic matter in waste (Figure 2) before the hydrolyticand acetogenic bacteria become active, we can preventthe formation of VOC, which represent odor. This issupported by the studies of Zahn et al. (1997), in whichthey concluded that C2 through C9 organic acids fromswine waste demonstrated the greatest potential fordecreased air quality, because these compounds exhib-ited the highest transport coefficients and highest air-borne concentrations. Thus, the use of antimicrobialchemicals should inhibit the fermentation, and in turnreduce odor produced, nutrients should be retained,pathogens may be destroyed, and production of green-house gases should be inhibited.
Natural Antimicrobial Additives
The requirements of chemicals that might be used tocontrol the microbial fermentation of manure shouldinclude additives that are safe in the environment, inex-pensive, and easy to apply. One group of chemical addi-tives that fits these requirements is the naturally oc-curring antimicrobial plant-derived oils (Beuchat,1994; Helander et al., 1998; Ultee et al., 1999). Essentialoils are secondary metabolites of plants. They are vola-tile, consisting mostly of terpenes and oxygenated deriv-atives, and are used for flavor, fragrances, spices, andantiseptic and preservative action. Oils with the mosteffective antimicrobial activity, in descending order, arethe phenolic compounds, alcohols, aldehydes, ketones,ethers, and hydrocarbons (Charai et al., 1996; Dormanand Deans, 2000). Two phenolic compounds we havestudied are thymol (5-methyl-2-isopropylphenol) andcarvacrol (5-isopropyl-2-methylphenol) (Figure 3). Inpractice, carvacrol is added to different products suchas baked goods (16 ppm), nonalcoholic beverages (28ppm/0.18 mM), and chewing gum (8 ppm) (Ultee et

VarelE4
Figure 2. Anaerobic fermentation of organic matter. Adapted from Watts et al. (1994).
al., 1999). Thymol is a component in many differentproducts, including soaps, toothpastes, shampoos, de-odorants, and mouthwashes (Shapiro et al., 1994; Ma-nou et al., 1998). These chemicals, like most plant es-sential oils, are generally recognized as safe (GRAS).Their antimicrobial mode of action consists of interac-tions with cell membranes that change the permeabilityfor cations such as H+ and K+ (Ultee et al., 1999). Thedissipation of ion gradients leads to loss of turgor pres-sure, inhibition of DNA synthesis, enzyme activity, andoverall metabolic activities, and finally to cell death.
Numerous studies indicate that carvacrol and thymolare bactericidal to pathogenic microorganisms (Kim etal., 1995; Ultee et al., 1998; Hammer et al., 1999), andin particular to Escherichia coli 0157:H7 (Helander etal., 1998; Skandamis and Nychas, 2000) in pure culture.Helander et al. (1998) have shown that the minimuminhibitory concentration with carvacrol or thymol in apure culture system is 3 mM and 1 mM for E. coli0157:H7 and Salmonella enterica serovar Typhimu-rium, respectively. Kim et al. (1995) also found that 500�g/mL (3.3 mM) of carvacrol will kill E. coli 0157:H7.Livestock waste contains many different types of micro-bial species; therefore, these in vitro studies may notbe directly comparable to in vivo studies. Kim et al.(1995) found that a 1.5% solution of carvacrol was neces-sary to kill S. enterica serovar Typhimurium on fishcubes, a level that is significantly higher than the con-centration (0.1%) needed to kill the organism in liq-uid medium.
Inhibition of Odor and Pathogens. We have evaluatedvarious chemicals (Varel and Miller, 2000) and a num-ber of plant essential oils (Varel and Miller, 2001) for
their ability to control the production of short-chainfatty acids, L-lactate, gas production, and reduction oftotal anaerobic bacteria and fecal coliforms in storedwaste. Some of these chemical additives, α-pinene, lim-onene, camphor, borneol, fenchol, eugenol, geraniol, 2-bromoethanesulfonic acid, anthraquinone, monensin,N,N1-dicylohexylcarbodiimide, and methylglyoxal, hadlittle inhibitory effect on the fermentation of cattlewaste. Others, such as chlorhexidine diacetate, iodoace-tic acid, and diphenyliodonium, were inhibitory to cattlebut not swine waste (Varel, 2002).
Our studies suggest that thymol and carvacrol arethe most effective in controlling the parameters listed
Figure 3. Structure of two plant essential oils, thymol(5-methyl-2-isopropylphenol) and carvacrol (5-isopropyl-2-methylphenol).

Chemical additives to control livestock odor E5
Table 1. Effect of pinene (P), carvacrol (C), and thymol (T) on total volatile fatty acidproduction from cattle waste in anaerobic flasks
Total VFA produced (mM) in the treatment (mg/L) flasksa
Control P C T C+T C+T+PIncubation, h (no additions) 500 1,000 1,000 500 + 500 1,000 + 1,000 + 500 SD
0 40 40 40 40 40 40 —1 79 78 55 59 60 40 0.782 87 84 63 66 68 42 1.504 92 84 68 72 71 42 0.757 90 86 71 73 73 42 0.90
10 92 84 72 77 75 43 1.6316 93 84 75 78 78 41 1.2323 91b 88b 85b 94b 94b 41c 2.83
aTotal VFA include acetate, propionate, butyrate, isobutyrate, valerate, isovalerate, and caproate; n = 3.b,cMeans with different superscripts differ (P < 0.05).
above. The data in Table 1 indicate that a combinationof carvacrol and thymol, each at 1,000 mg/L, and 500mg/L pinene will stop any new production of VFA incattle waste for 23 d. Pinene is simply a masking agentand has no inhibitory effect on the fermentation whenit is added by itself (Table 1). Data in Table 2 indicatethat a combination of carvacrol, thymol, and pinene, atboth concentrations evaluated, 750 or 1,000 mg/L eachof carvacrol and thymol, reduced the number of viableanaerobic bacteria within 2 d in the waste comparedwith the control flasks. We did not see a complete bacte-ricidal effect after 14 d, even at the higher concentrationof carvacrol and thymol (1,000 mg/L); however, thenumber of organisms remained low, similar to the 2-dpopulation. The population of fecal coliforms was re-duced to nondetectable levels after 4 d when carvacroland thymol were combined at 1,000 mg/L each (Table3). The absence of fecal coliforms in the control flasksafter 14 d was likely due to pH, which had dropped to4.2 (Varel and Miller, 2001).
Previous studies have suggested that a combinationof carvacrol and thymol would provide better antimicro-bial action, rather than a higher concentration of onealone (Paster et al., 1995; Manou et al., 1998). However,further studies indicate that thymol or carvacrol canbe used individually, and each is as effective as the
Table 2. Reduction of total anaerobic bacteria in cattle waste slurries incubatedanaerobically after carvacol (C), thymol (T), and pinene (P)
were added at two concentrationsa
Anaerobic bacteria (108 cells/mL)b
C, T (750 mg/L each); C, T (1,000 mg/L each);Time, d Control P (500 mg/L) P (500 mg/L) SE
0 844 844 844 562 79.4c 4.0d 0.15e 0.87 78.3c 1.4d 0.06e 0.5
14 33.6c 7.6d 0.16e 0.9
aAdapted from Varel and Miller (2001), with permission.bMeans represent the average from three replicate flasks.c,d,eMeans in a row with different superscripts differ (P < 0.05).
combination as long as the total concentration addedis the same (Varel and Miller, 2001; Varel, 2002). Basedon cost, thymol would be the oil of choice. We havepurchased thymol for $6.36/kg, which may even be lessif a bulk purchase is made. Carvacrol is several timesthis amount.
We have initiated field studies with thymol in cattlefeedlot pens with the objective of controlling pathogenicbacteria, in particular E. coli O157:H7, and odor. Ourpreliminary data indicate that the concentration of topi-cally applied thymol decreases within days after appli-cation under aerobic conditions. This is consistent withother studies (Vokow and Liotiri, 1999) that suggestthat essential oils are used as a carbon and energysource by ubiquitously occurring soil microorganisms,and these chemicals would not accumulate in soil ifenvironmental conditions favor growth of these micro-organisms. However, under anaerobic conditions, simi-lar to those used in our laboratory studies, we havefound thymol and carvacrol are not degraded for over60 d (Varel, 2002). In livestock production facilities thisappears to be ideal, because odor (VFA) is producedunder anaerobic conditions, during which time we donot want these antimicrobial oils degraded. However,at the same time, we do not want these oils to build upin the soil environment. Therefore, it is speculated that

VarelE6
Table 3. Reduction of total fecal coliforms in cattle waste slurries incubatedanaerobically after carvacrol (C), thymol (T), and pinene (P) were added at two
concentrationsa
Coliform bacteria (105 cells/mL)b
C, T (750 mg/L each); C, T (1,000 mg/L each);Time, d Control P (500 mg/L) P (500 mg/L) SE
0 46 46 46 5.12 81c 1.5d 0.02e 0.44 2.9c 0.44d None detectedf 0.37 1 0.57 0.4
14 None detectedf 0.03 0.005
aAdapted from Varel and Miller (2001), with permission.bMeans represent the average of three replicate flasks.c,d,eMeans in a row with different superscripts differ (P < 0.05).fDetection limit is 1.0 × 10².
once the livestock wastes are spread on the soil surface(aerobic conditions), any essential oil would be brokendown and metabolized by the soil microbes.
Elder et al. (2000) have shown that 28% of cattle maybe carriers of E. coli O157 in their feces, and 11% ofcattle presented for slaughter carry E. coli O157 ontheir hides. They suggest that there is a correlationbetween fecal prevalence and carcass contamination.Their data indicate that proper waste management mayhelp control pathogens on the farm. Waste treated withcarvacrol or thymol may reduce the spreading of thisorganism among cattle in the same pen and potentiallyreduce hide contamination at slaughter. Application ofthese chemicals is not something that would be requiredthroughout the year. The peak season for cattle shed-ding E. coli O157 is late summer and early fall (Elderet al., 2000). This may be the most effective time toapply these chemicals to control pathogens. This sea-sonal period can also be an active time for odor produc-tion, because of high temperatures; thus, a reductionin odor emissions and pathogens could be accomplishedsimultaneously when both are most prevalent.
Feasibility of an Antimicrobial Approach. Potentiallimitations to the use of antimicrobial plant oils in live-stock waste are that little to no degradation of the wastewill occur, the cost-effectiveness of their use is unclear,and potential unknown adverse environmental effectsmust be studied further. Potential advantages of usingthese natural antimicrobial chemicals are that 1) micro-bial fermentation of waste is inhibited, which shouldreduce the rate of odor emissions, reduce the productionof global warming gases, and conserve nutrients in thewaste for increased fertilizer value; 2) pathogenic fecalcoliforms should be destroyed; 3) the phenolic plant oilsare stable under anaerobic conditions, although theyare degraded under aerobic environments; 4) theseproducts are classified as GRAS; and 5) these oils areused as pesticides, which could play a significant rolein controlling flies in livestock waste.
Implications
Livestock production has changed over the last fewdecades and is now challenged with environmental and
food safety issues. Nutrient management, odor emis-sions, and pathogenic microorganisms associated withlivestock must be resolved with safe and cost-effectivetreatments. This requires a multidisciplinary approachand one solution is not universal to all production facili-ties. Microorganisms play a central role in many ofthe production issues, and therefore microbial activitiesshould be addressed. Chemical additives that affect keymetabolic pathways (urea hydrolysis), or additives thatserve as antimicrobial agents (plant-derived oils), mayoffer multiple solutions for sustainable livestock pro-duction. Additives must be thoroughly evaluated andtested before one can expect producers to use them ona broad basis.
Literature Cited
Beuchat, L. R. 1994. Antimicrobial properties of spices and theiressential oils. In: V. M. Dillon and R. G. Board (ed.) NaturalAntimicrobial Systems and Food Preservation. pp 167–179. CABInternational, Wallingford, U.K.
Bierman, S., G. E. Erickson, T. J. Klopfenstein, R. A. Stock, andD. H. Shain. 1999. Evaluation of nitrogen and organic matterbalance in the feedlot as affected by level and source of dietaryfiber. J. Anim. Sci. 77:1645–1653.
Byrnes, B., and J. R. Freney. 1995. Recent developments on the useof urease inhibitors in the tropics. Fertil. Res. 42:251–259.
Charai, M., M. Mosaddak, and M. Faid. 1996. Chemical compositionand antimicrobial activities of two aromatic plants: Oregamonmajorana L. and O. compactum Benth. J. Essential Oil Res.8:657–664.
Dorman, H. J. D., and S. G. Deans. 2000. Antimicrobial agents fromplants: Antibacterial activity of plant volatile oils. J. Appl. Bacte-riol. 88:308–316.
Eghball, B., and J. F. Power. 1994. Beef cattle feedlot manure manage-ment. J. Soil Water Conserv. 49:113–122.
Elder, R. O., J. E. Keen, G. R. Siragusa, G. A. Barkocy-Gallagher,M. Koohmaraie, and W. W. Laegreid. 2000. Correlation of entero-hemorrhagic Escherichia coli O157 prevalence in feces, hides,and carcass of beef cattle during processing. Proc. Natl. Acad.Sci. USA 97:2999–3003.
Hammer, K. A., C. F. Carson, and T. V. Riley. 1999. Antimicrobialactivity of essential oils and other plant extracts. J. Appl. Micro-biol. 86:985–990.
Helander, I. K., H. L. Alakomi, K. Latva-Kala, T. Mattila-Sandholm,I. Pol, E. J. Smid, and A. von Wright. 1998. Characterization ofthe action of selected essential oil components on Gram-negativebacteria. J. Agric. Food Chem. 46:3590–3595.
Chemical additives to control livestock odor E7
Jones, G. A., and J. D. Milligan. 1975. Influence on some rumen andblood parameters of feeding acetohydroxamic acid in a urea-containing ration for lambs. Can. J. Anim. Sci. 55:39–47.
Kim, J. M., M. R. Marshall, J. A. Cornell, J. F. Preston III, andC. I. Wei. 1995. Antibacterial activity of carvacrol, citral, andgeraniol against Salmonella typhimurium in culture mediumand on fish cubes. J. Food Sci. 60:1364–1374.
Kim, J. M., M. R. Marshall, and C. I. Wei. 1995. Antibacterial activityof some essential oil components against five foodborne patho-gens. J. Agric. Food Chem. 43:2839–2845.
Likens, G. E., C. T. Driscoll, and D. C. Buso. 1996. Long-term effectsof acid rain: response and recovery of a forest ecosystem. Science(Wash DC) 272:244–245.
Ludden, P. A., D. L. Harmon, G. B. Huntington, B. T. Larson, andD. E. Axe. 2000. Influence of the novel urease inhibitor N-(n-butyl) thiophosphoric triamide on ruminant nitrogen metabo-lism: II. Ruminal nitrogen metabolism, diet digestibility, andnitrogen balance in lambs. J. Anim. Sci. 78:188–198.
Mackie, R. I., P. G. Stroot, and V. H. Varel. 1998. Biochemical identi-fication and biological origin of key odor components in livestockwaste. J. Anim. Sci. 76:1331–1342.
Manou, I., L. Bouillard, M. J. Devleeschouwer, and A. O. Barel. 1998.Evaluation of the preservation properties of Thymus vulgarisessential oil in applied formulations under a challenge test. J.Appl. Microbiol. 84:368–376.
McCrory, D. F., and P. J. Hobbs. 2001. Additives to reduce ammoniaand odor emissions from livestock wastes: A review. J. Environ.Qual. 30:345–355.
Mobley, H. L. T., and R. P. Hausinger. 1989. Microbial ureases: sig-nificance, regulation, and molecular characterization. Microbiol.Rev. 53:85–108.
Mobley, H. L. T., M. D. Island, and R. P. Hausinger. 1995. Molecularbiology of microbial ureases. Microbiol. Rev. 59:451–480.
Morse, D., J. C. Guthrie, and R. Mutters. 1996. Anaerobic digestersurvey of California dairy producers. J. Dairy Sci. 79:149–153.
Muck, R. E., and B. K. Richards. 1980. Losses of manurial N in free-stall barns. Agric. Manure 7:65–93.
Pain, B. F., T. J. Van der Weeder, B. J. Chambers, V. T. Phillips,and S. C. Jarvis. 1998. A new inventory for ammonia emissionsfrom U.K. agriculture. Atmos. Environ. 32:309–313.
Paster, N., M. Menasherov, U. Ravid, and B. Juven. 1995. Anti-fungalactivity of oregano and thyme essential oils applied as fumigantsagainst fungi attacking stored grain. J. Food Prot. 58:81–85.
Shapiro, S., A. Meier, and B. Guggenheim. 1994. The antimicrobialactivity of essential oils and essential oil components towardoral bacteria. Oral Microbiol. Immunol. 9:202–208.
Skandamis, P. N., and G. J. E. Nychas. 2000. Development and evalu-ation of a model predicting the survival of Escherichia coliO157:H7 NCTC 12900 in homemade eggplant salad at various
temperatures, pHs, and oregano essential oil concentrations.Appl. Environ. Microbiol. 66:1646–1653.
Ultee, A., L. M. G. Gorris, and E. J. Smid. 1998. Bactericidal activityof carvacrol towards the food-borne pathogen Bacillus cereus. J.Appl. Microbiol. 85:211–218.
Ultee, A., E. P. W. Kets, and E. J. Smid. 1999. Mechanisms of actionof carvacrol on the food-borne pathogen Bacillus cereus. Appl.Environ. Microbiol. 65:4606–4610.
Vanderholm, D. H. 1985. Nutrient losses from livestock waste duringstorage, treatment and handling. Am. Soc. Agric. Eng. Publ. 13-85. pp 395–398. St. Joseph, MI.
Van Horn, H. H., G. L. Newton, and W. E. Kunkle. 1996. Ruminantnutrition from an environmental perspective: Factors affectingwhole-farm nutrient balance. J. Anim. Sci. 74:3082–3102.
Varel, V. H. 1997. Use of urease inhibitors to control nitrogen lossfrom livestock waste. Bioresour. Technol. 63:11–17.
Varel, V. H. 2002. Carvacrol and thymol reduce swine waste odorand pathogens; stability of oils. Curr. Microbiol. 44:38–43.
Varel, V. H., and D. N. Miller. 2000. Effect of antimicrobiol agentson livestock waste emissions. Curr. Microbiol. 40:392–397.
Varel, V. H., and D. N. Miller. 2001. Plant-derived oils reduce patho-gens and gaseous emissions from stored cattle waste. Appl. Envi-ron. Microbiol. 67:1366–1370.
Varel, V. H., J. A. Nienaber, and H. C. Freetly. 1999. Conservationof nitrogen in cattle feedlot waste with urease inhibitors. J.Anim. Sci. 77:1162–1168.
Vokou, D., and S. Liotiri. 1999. Stimulation of soil microbial activityby essential oils. Chemecology 9:41–45.
Watts, P. J., M. Jones, S. C. Lott, R. W. Tucker, and R. J. Smith.1994. Feedlot odor emissions following heavy rainfall. Trans.ASAS (Am. Soc. Agric. Eng.) 37:629–636.
Whitelaw, F. G., J. S. Milne, and S. A. Wright. 1991. Urease (EC3.5.1.5) inhibition in the sheep rumen and its effect on urea andnitrogen metabolism. Br. J. Nutr. 66:209–225.
Zahn, J. A. 1997. Swine odor and emissions from pork production.In: K. McGuire (ed.) Environmental Assurance Program. pp 20–122. National Pork Producers Council, Des Moines, IA.
Zahn, J. A., A. A. DiSpirito, Y. S. Do, B. E. Brooks, E. E. Cooper, andJ. L. Hatfield. 2001. Correlation of human olfactory responsesto airborne concentrations of malodorous volatile organic com-pounds emitted from swine effluent. J. Environ. Qual.30:624–634.
Zahn, J. A., J. L. Hatfield, Y. S. Do, A. A. Dispirito, D. A. Laird, andR. L. Pfeiffer. 1997. Characterization of volatile emissions andwastes from a swine production facility. J. Environ. Qual.26:1687–1696.
Zhu, J., G. L. Riskowski, and M. Torremorell. 1999. Volatile fattyacids as odour indicators in swine manure—A critical review.Trans. ASAE (Am. Soc. Agric. Eng.) 42:175–182.

Role of the extracellular matrix in muscle growth and development
S. G. Velleman1
Department of Animal Sciences, Ohio Agricultural Research and Development Center,The Ohio State University, Wooster 44691
ABSTRACT: Skeletal muscle fibers are surroundedby an extracellular matrix. The extracellular matrixforms a complex dynamic architecture and is composedof glycoproteins, collagen, and proteoglycans. Proteo-glycans have been suggested to play an important func-tional role in tissue differentiation. Proteoglycans affectthe myogenic process by regulating collagen fibrillo-genesis, modulating cell growth and the response togrowth factors. The extracellular matrix communicatesinformation back to the cell through integrin receptors.Integrins are heterodimeric transmembrane glycopro-
Key Words: Connective Tissue, Muscles, Proteoglycans
2002 American Society of Animal Science. All rights reserved. J. Anim. Sci. 80(E. Suppl. 2):E8–E13
Introduction
Studies on skeletal muscle development have tradi-tionally focused on myosin and actin. However, musclesecretes a network of macromolecules termed the extra-cellular matrix. The extracellular matrix is a part ofthree connective tissue layers (endomysium, perimy-sium, and epimysium) surrounding muscle fibers. Ex-tracellular matrix is composed of proteins includingcollagens and proteoglycans.
There are at least 19 different vertebrate collagenswith tissue-specific distributions and unique functionalproperties. Skeletal muscle predominantly contains fi-brillar collagens Types I and III. Fibrillar collagenscontain a single triple-helical domain consisting ofthree separate peptide chains. The three chains forma right-handed alpha helix that is linked together byinterchain disulfide bonds. After collagen molecules aresynthesized, they are secreted from the cell into theextracellular space and align in a quarter-staggerarray. Crosslink formation between collagen microfi-brils is then initiated. The crosslinks are largely respon-sible for the tensile strength attributed to collagen.
1Correspondence: phone: 330-263-3905; fax: 330-263-3949; E-mail:[email protected].
Received July 26, 2001.Accepted November 28, 2001.
E8
teins that contain extracellular, transmembrane, andcytoplasmic domains. During myogenesis, integrinsplay a role in both cell ahesion to the extracellularmatrix and sarcomere formation. Therefore, the regula-tion of myoblast integrin temporal and spatial expres-sion is critical in the formation of differentiated muscle.Although specific extracellular matrix componentshave been identified as being essential in myogenesis,the exact functions of these macromolecular proteinsas they relate to muscle formation and growth is stillnot well understood.
Proteoglycans are a diverse component of the extra-cellular matrix and contain a central core protein withcovalently attached glycosaminoglycans. The glycosam-inoglycans are polymers of disaccharide repeats thatare highly sulfated, except for hyaluronic acid. The sul-fation of the glycosaminoglycan gives the proteoglycanmolecule a net negative charge. Typical glycosaminog-lycans attached to the core protein include chondroitinsulfate, dermatan sulfate, heparan sulfate, and keratansulfate. Proteoglycans are a multifunctional componentof the extracellular matrix and play roles in regulatingmatrix organization, growth factor activity, and cellproliferation and differentiation. This review articlewill focus primarily on how proteoglycans and extracel-lular matrix-cell signal transduction may regulate skel-etal muscle development, growth, and function.
A Brief Overview of SkeletalMuscle Development
Myogenesis involves the precise regulation of a num-ber of developmental events, which includes cell adhe-sion and cell-cell recognition (Miller, 1992; Bucking-ham, 1994). These processes are critical in myoblastalignment and fusion into multinucleated myotubes.The formation of multinucleated myotubes is centralto skeletal muscle development. Research during thepast decade has significantly advanced our understand-ing of how myogenic precursor cells proliferate and dif-ferentiate into multinucleated myotubes. The expres-

Extracellular matrix E9
Table 1. Characteristics of proteoglycans found in skeletal muscle
Proteoglycan Core protein size, kDa Glycosaminoglycana Reference
Decorin 36 CS, DS Iozzo and Murdock, 1996Syndecans 1–4 19–35 HS, CSb Stringer and Gallagher, 1997Glypican-1 64 HS Stringer and Gallagher, 1997Perlecan 400 HS Stringer and Gallagher, 1997Versican 370 CS Lebaron, 1966
aCS = chondroitin sulfate; DS = dermatan sulfate; HS = heparan sulfate.bSyndecans 2 and 3 contain only HS chains attached to the core protein.
sion of myogenic regulatory factors (MRF) is key to theprocess of activating the transcription of muscle-specificgenes (Edmondson and Olson, 1993; Weintraub, 1993;Yablonka-Reuveni and Paterson, 2001). In addition tothe MRF, the macromolecular components of the extra-cellular matrix are likely to play a critical role in regu-lating myogenesis (Fernandez et al., 1991; Florini etal., 1991; McLennan, 1993). However, little informationis known about how the muscle extracellular matrixinteracts with proliferating and differentiating musclecells to influence the formation and maintenance ofskeletal muscle structure.
Dynamic Expression of Proteoglycans DuringSkeletal Muscle Development
In skeletal muscle, chondroitin sulfate, dermatan sul-fate, and heparan sulfate proteoglycans have been iden-tified (Young et al., 1989; Fernandez et al., 1991; Bran-dan and Larraın, 1998). Table 1 provides a list of proteo-glycans found in skeletal muscle. Fernandez et al.(1991) showed that the extracellular matrix is a com-plex structure and proteoglycan expression changesduring embryonic chicken skeletal muscle develop-ment. As skeletal muscle proceeds through embryonicchicken maturation, a transition from a matrix rich inlarge chondroitin sulfate proteoglycans into a complexmatrix containing smaller chondroitin sulfate, derma-tan sulfate, and heparan sulfate proteoglycans occurs(Young et al., 1989). This same shift in proteoglycanexpression has been reported in turkeys (Velleman etal., 1999) and mice (Young et al., 1990). Olguin andBrandan (2001) have found that the expression of myo-genin, a muscle transcriptional regulatory factor, istemporally and spatially coincident with the expressionof the proteoglycans syndecan-3 and decorin. Both syn-decan-3 (Fuentealba et al., 1999) and decorin (Riquelmeet al., 2001) have been shown to be essential in skeletalmuscle differentiation. Therefore, it is likely that differ-ent types of proteoglycans expressed in skeletal musclemay have specific functions during skeletal muscle dif-ferentiation because the expression pattern of proteo-glycans appears to be conserved across species.
Although the exact function of each type of skeletalmuscle proteoglycan is not known as it relates to musclegrowth and development, specific roles may be hypothe-sized. For example, the large chondroitin sulfate proteo-
glycan, versican, has been identified in numerous tis-sues, including skeletal muscle (Carrino and Caplan,1989; Carrino et al., 1994). Versican has a high negativecharge due to the large number of covalently attachedchondroitin sulfate chains and will interact ionicallywith water. High levels of versican have been reportedduring early stages of chicken skeletal muscle myogen-esis (Carrino and Caplan, 1984) and in regeneratingmuscle (Carrino et al., 1988). Although the exact roleplayed by versican in developing muscle is not known,it is possible that versican may be involved with thespacing of developing muscle fibers due to its ability toionically associate with water and to the fact that it isexpressed during developmental periods when musclefibers are forming. The dermatan sulfate proteoglycan,decorin, is a multifunctional proteoglycan regulatingcollagen fibrillogenesis (Vogel et al., 1984; Weber et al.,1996), cell proliferation and growth (Santra et al., 1995;Moscatello et al., 1998), and transforming growth fac-tor-β (TGF-β; Yamaguchi et al., 1990). These propertiesare all critical in achieving normal muscle growth, de-velopment, and function. Decorin has been detected inturkey (Velleman et al., 1997, 1999) and chicken (Len-non et al., 1991) skeletal muscle, as well as in that ofother species (Brandan et al., 1991; Eggen et al. 1994).Heparan sulfate proteoglycans are localized extracellu-larly, or at the plasma and basement membranes. He-paran sulfate proteoglycans regulate the binding of fi-broblast growth factor (FGF) to its high-affinity cell-signaling receptor (Aviezer et al., 1994; Brandan andLarraın, 1998). Fibroblast growth factor is a potentstimulator of muscle cell proliferation and an inhibitorof differentiation (Dollenmeir et al., 1981).
Proteoglycan Regulation of ExtracellularMatrix Organization
The structural architecture of the extracellular ma-trix affects the response of skeletal muscle to tensilestress. In particular, the amount of collagen crosslink-ing and fibril organization largely determines skeletalmuscle elasticity. Decorin, a chondroitin/dermatan sul-fate proteoglycan, associates with fibrillar collagen, in-cluding Types I, II, and III (Vogel et al., 1984; Scott,1988; Thiezsen and Rosenquist, 1994). Molecular mod-eling studies have predicted that the decorin core pro-tein binds to collagen in the gap zone between adjacent

VellemanE10
collagen molecules (Weber et al., 1996). In vitro studiessupport the notion that the interaction between decorinand collagen governs the formation of collagen fibrils(Vogel et al., 1984; Vogel and Trotter, 1987; Scott, 1988).Collagen fibrils in a decorin knockout mouse model ex-hibit irregular size and diameter (Danielson et al.,1997). Viability of the mice was not altered, but theirskins were extremely fragile and tore with appliedforce. One function of decorin critical to matrix organi-zation and function is to influence the maturation ofcollagen fibrils into larger fibrils and fiber networks.
The chicken Low Score Normal (LSN) genetic muscledisorder is characterized by subnormal muscle growthand function. The LSN defect is an example of a skeletalmuscle alteration that can occur in the absence of nor-mal extracellular matrix expression. Low Score Normalbirds at 3 mo of age have an impaired ability to rightthemselves when repeatedly placed on their backs (Vel-leman et al., 1996). Prior to 20 d of embryonic develop-ment, LSN proteoglycan and glycosaminoglycan levelsdo not vary significantly from levels expressed in nor-mal muscle (Velleman et al., 1996); however, at 20 d ofembryonic development there is a dramatic increase indecorin. Subsequent to the increase in decorin, LSNcollagen crosslink concentration is increased by nearly200% at 6 wk posthatch. Although collagen crosslinkingis modified, collagen concentration is not affected. Fit-ting with the role of decorin, this change in collagencrosslink properties affects collagen fibril organization.In terms of skeletal muscle function, the increase incollagen crosslinking results in a reduced ability to re-spond to tensile stress and is likely reflected in thedecreased physical performance of the LSN birds.
Proteoglycan Regulation ofGrowth Factor Activity
Controlling the onset of skeletal muscle proliferationand differentiation is influenced by the extrinsic envi-ronment. Growth factors such as FGF and TGF-β eitherstimulate or inhibit skeletal muscle proliferation anddifferentiation. Therefore, regulating the response togrowth factors has a significant impact on the progres-sion of skeletal muscle formation from a mononucleatedmyoblast to a multinucleated myotube.
The response of muscle-forming cells to basic FGFis, in part, modulated by heparan sulfate containingproteoglycans. Heparan sulfate proteoglycans are a di-verse group of proteoglycans with at least one cova-lently attached heparan sulfate glycosaminoglycanchain to the core protein; they are located extracellu-larly or associated with the plasma or basement mem-brane (Timpl, 1993). The membrane-associated he-paran sulfate proteoglycans, syndecan and glypican,function as low-affinity co-receptors for basic FGF. Thisinteraction is required for the high-affinity binding ofbasic FGF to its cellular receptor. If heparan sulfate isremoved, basic FGF no longer functions as an inhibitorof muscle differentiation (Rapraeger et al., 1991).
Therefore, the presence of heparan sulfate proteogly-cans is necessary for skeletal muscle development.
The heparan sulfate proteoglycans, syndecan-1 andglypican, have been shown to be differentially regulatedduring skeletal muscle differentiation (Brandan et al.,1996; Larraın et al., 1997). Syndecan expression is highearly in skeletal muscle differentiation and is subse-quently down-regulated, whereas glypican expressionis the reverse of that observed for syndecan (Brandanet al., 1996; Larraın et al., 1997).
The syndecan family of proteoglycans are the mostwell-studied of the heparan sulfate proteoglycans. Syn-decans are transmembrane heparan sulfate proteogly-cans with at least four members interacting with avariety of extracellular matrix molecules including, butnot limited to, collagen, fibronectin, and basic FGF (forreview see Carey, 1997). With regard to skeletal muscledifferentiation, the interaction of syndecan with basicFGF is critical for basic FGF to bind to its high-affinitycell surface receptor.
Unlike the syndecans, glypican is not a transmem-brane heparan sulfate proteoglycan but is associatedwith the cell surface by a glycosylphosphatidylinositollinkage. Both of these proteoglycans are cofactors forbasic FGF, but their function with regard to skeletalmuscle differentiation and growth is not well under-stood. Syndecan is down-regulated during differentia-tion, whereas glypican expression is enhanced. Thequestion that needs to be answered is why these proteo-glycans are expressed in opposite modes, because theyare both cofactors for basic FGF. Brandan and Larraın(1998) have suggested that syndecan may function asa basic FGF presenter during myoblast proliferationand glypican as a basic FGF sequester after differentia-tion has been initiated and prevent the inhibitory effectof basic FGF.
In support of a proteoglycan functioning as a growthfactor sequester, decorin has been shown to functionin this mode for TGF-β. Transforming growth factor-βbinds to decorin at its core protein (Schonherr et al.,1998). When TGF-β is bound to the decorin core proteinits activity is suppressed (Yamaguichi et al., 1990). In-creased expression of TGF-β upregulates the expressionof several extracellular matrix molecules, including de-corin (Bassols and Massague, 1998), fibronectin (Heinoet al., 1989), collagen (Heino et al., 1989; Heino andMassague, 1990), and integrins (Heino et al., 1989).Therefore, TGF-β and decorin may be key cofactors ina feedback regulatory mechanism. Decorin is a negativeregulator of TGF-β and TGF-β functions as a positiveregulator of extracellular matrix protein expression.
Proteoglycan Regulation of Cell Proliferationand Differentiation
The regulation of cell proliferation and differentiationare key events in the formation of skeletal muscle anddetermining muscle mass. In addition to decorin’s mod-ulation of collagen fibrillogenesis, decorin also functions

Extracellular matrix E11
in the control of cell growth (Santra et al., 1995; Mosca-tello et al., 1998). Several independent areas of researchsupport this function of decorin: 1) overexpression ofdecorin in Chinese hamster ovary cells inhibits cell pro-liferation (Yamaguchi and Ruoslahti, 1988); 2) expres-sion of decorin suppresses human colon cancer cellgrowth (Santra et al., 1995); and 3) during human dip-loid fibroblast quiescence decorin is up-regulated (Cop-pock et al., 1993; Mauviel et al., 1995).
In LSN pectoral muscle, decorin is up-regulated latein embryonic development. Fitting with the function ofdecorin’s regulation of cell proliferation and differentia-tion, LSN pectoral muscle satellite cells exhibit de-creased proliferation and differentiation compared tonormal satellite cells, and LSN pectoral muscle massis 68% the weight of normal pectoral muscle at 1 wkposthatch (Li et al., 1997). Skeletal muscle satellite cellsare myogenic precursor cells responsible for postnatalmuscle fiber growth and muscle regeneration followinginjury. Satellite cells function by proliferating, differ-entiating, and fusing with existing muscle fibers orother differentiated satellite cells, leading to increasedmuscle weight. Therefore, developing a comprehensiveunderstanding of how the extracellular matrix is in-volved with the regulation of myogenic satellite cellactivity is of key importance to the poultry industry.
Does Extracellular Matrix-Cell SignalTransduction Affect Skeletal
Muscle Development?
One of the main functions of the extracellular matrixis to communicate information back to the cell that mayaffect cellular gene expression, cell shape, cell migra-tion, or cell proliferation and differentiation. The extra-cellular matrix communicates this information throughheterodimeric transmembrane receptors termed inte-grins. Integrins are composed of noncovalently associ-ated α and β subunits. There are numerous isoforms ofeach integrin subunit with tissue-specific distributionsand unique functional properties. In general, integrinsare transmembrane proteins that have an extracellulardomain that binds to extracellular matrix proteins suchas fibronectin, collagen, and laminin and an intracellu-lar domain that binds to the cellular cytoskeletal net-work. When integrins bind to the extracellular matrix,they become clustered on the cell membrane and in theinterior of the cell form a cytoskeletal signaling complexleading to the assembly of actin filaments (Giancottiand Ruoslahti, 1999).
During skeletal muscle formation, myoblasts alignand then fuse to form multinucleated myotubes. Theprocess of multinucleated myotube formation requiresmyoblast cell migration. Cell migration involves a se-ries of complex steps including cell extension at theleading edge, formation of stable contacts between thecell and extracellular matrix, contraction of the cellularcytoskeleton, translocation of the cell, and release ofthe cell-extracellular matrix contact at the rear of the
cell. Central to appropriate cell migration is the adhe-sion of the myoblast through integrins to the extracellu-lar matrix. Boettiger et al. (1995) have shown byblocking a myoblast-extracellular matrix integrin thatboth cell migration and myotube morphogenesis areinhibited. Hence, appropriate communication from theextracellular matrix through integrins plays a criticalrole during muscle assembly.
In vitro studies with LSN myogenic satellite cellshave shown during differentiation that myotube mor-phology is modified (Velleman and McFarland, 1999).After 48 h of growing LSN satellite cells in cultureconditions to promote the formation of multinucleatedmyotubes, only 10% of the myotubes had four to sixnuclei, whereas in normal satellite cell cultures 70%of the myotubes had four to six nuclei (Velleman andMcFarland, 1999). Subsequent studies have demon-strated that the expression of integrin is reduced inLSN satellite cell cultures during myotube formation(Velleman et al., 2000). The reduction in LSN integrinexpression likely reduces the amount of cellular contactwith the extracellular matrix. This results in a decreasein cell migration and cellular contact necessary to formmultinucleated myotubes. Morphologically, the muscleexhibits a significant reduction in weight and yields aless desirable product.
Conclusions
Skeletal muscle proteoglycans are precisely regu-lated in a dynamic fashion during skeletal muscle devel-opment. Regulation of both proteoglycan synthesis andspatial distribution may play a key role in tissue mor-phogenesis in terms of growth factor responsiveness,cellular growth, and extracellular matrix architecture.The heparan sulfate family of proteoglycans are crucialin regulating the cellular response to basic FGF. Proteo-glycans such as decorin are multifunctional and arecritical in modulating TGF-β, cellular growth proper-ties, and collagen fibril organization. How each of theseproteoglycan types influences myogenesis still remainsan enigma. In addition to the proteoglycans, signaltransduction from the extracellular matrix to the my-oblast likely plays a significant role in muscle formationand growth. Continued analysis of the skeletal muscleextracellular matrix is necessary to develop a compre-hensive understanding of the myogenic process thattranscends just the myofibrillar proteins.
Implications
Why should the domestic animal industries be con-cerned about the extracellular matrix? Selection forgrowth rate and muscling alters muscle fiber propor-tions, and likely the amount of extracellular matrixspace. The extracellular matrix functions in tissue wa-ter-holding capacity, elasticity, growth factor regula-tion, and cellular growth properties. Both the swineand turkey industries in recent years have experienced

VellemanE12
a meat quality problem termed pale, soft, and exudative(PSE). When cooked, meat from animals with the PSEcondition has a soft texture, poor juiciness, and in-creased yield losses. Proteoglycans are a major determi-nant in tissue water-holding capacity but have not beenstudied with regard to PSE. If the amount of proteogly-cans have been reduced in animals selected for growthrate and muscling, the reduced water-holding capacitywould directly affect the juiciness and drip loss. There-fore, domestic animal industries should consider howthe extracellular matrix is affected by selection.
Literature Cited
Aviezer, D., E. Levy, M. Safran, C. Svahn, E. Buddecke, A. Schmid, G.David, I. Vlodavsky, and A. Yayon. 1994. Differential structuralrequirements of heparin and heparan sulfate proteoglycans thatpromote binding of basic fibroblast growth factor to its receptor.J. Biol. Chem. 269:114–121
Bassols, A., and J. Massague. 1988. Transforming growth factor β
regulates the expression and structure of extracellular matrixchondroitin/dermatan sulfate proteoglycans. J. Biol. Chem.263:3039–3045.
Boettiger, D., E. Enomto-Iwamoto, H. Y. Yoon, U. Hofer, A. S. Menko,and R. Chiquet-Ehrismann. 1995. Regulation of integrin a5β1affinity during myogenic differentiation. Dev. Biol. 169:261–272.
Brandan, E., D. J. Carey, J. Larraın, F. Melo, and A. Campos. 1996.Synthesis and processing of glypican during differentiation ofskeletal muscle cells. Eur. J. Cell Biol. 71:170–176.
Brandan, E., M. E. Fuentes, and W. Andrade. 1991. The proteoglycandecorin is synthesized and secreted by differentiated myotubes.Eur. J. Cell Biol. 55:209–216.
Brandan, E., and J. Larrain, 1998. Heparan sulfate proteoglycansduring terminal skeletal muscle differentiation: Possible func-tions and regulation of their expression. Basic Appl. Myol.8:107–114.
Buckingham, M. 1994. Molecular biology of muscle development. Cell78:15–21.
Carey, D. J. 1997. Syndecans: Multifunctional cell-surface co-recep-tors. Biochem. J. 327:1–16.
Carrino, D. A., and A.I. Caplan. 1984. Isolation and partial character-ization of high-buoyant-density proteoglycans synthesized in ovoby embryonic chick skeletal muscle and heart. J. Biol. Chem.259:12419–12430.
Carrino, D. A., and A. I. Caplan. 1989. Structural characterizationof chick embryonic skeletal muscle chondroitin sulfate proteogly-can. Connect. Tissue Res. 19:35–50.
Carrino, D. A., J. E. Dennis, R. F. Drushel, S. E. Haynesworth, andA. I. Caplan. 1994. Identity of the core proteins of the largechondroitin sulphate proteoglycans synthesized by skeletal mus-cle and prechondrogenic mesenchyme. Biochem. J. 298:51–60.
Carrino, D. A., U. Oron, D. G. Pechak, and A. I. Caplan. 1988. Reinitia-tion of chondroitin sulphate proteoglycan synthesis in regenerat-ing skeletal muscle. Development (Camb.) 103:641–656.
Coppock, D. L., C. Kopman, S. Scandalis, and S. Gilleran. 1993.Preferential gene expression in quiescent human lung fibroblast.Cell Growth Differ. 4:483–493.
Danielson, K. G., H. Baribault, D. F. Holmes, H. Graham, K. E.Kadler, and R. V. Iozzo. 1997. Targeted disruption of decorinleads to abnormal collagen fibril morphology and skin fragility.J. Cell Biol. 136:729–743.
Dollenmeier, P., D. C. Turner, and H. M. Eppenberger. 1981. Prolifer-ation and differentiation of chick skeletal muscle cells culturedin a chemically defined medium. Exp. Cell Res. 135:47–61.
Edmondson, D. G., and E. N. Olson. 1993. Helix-loop-helix proteinsas regulators of muscle-specific transcription. J. Biol. Chem.268:755–768.
Eggen, K. H., A. Malstrøm, and S. O. Kolset. 1994. Decorin and alarge dermatan sulfate proteoglycan in bovine striated muscle.Biochem. Biophys. Acta 1204:287–297.
Fernandez, M. S., J. E. Dennis, R. F. Drushel, D. A. Carrino, K.Kimata, M. Yamagata, and A. I. Caplan. 1991. The dynamicsof compartmentalization of embryonic muscle by extracellularmatrix molecules. Dev. Biol. 147:46–61.
Florini, J. R., D. Z. Ewton, and K. A. Magri. 1991. Hormones, growthfactors, and myogenic differentiation. Annu. Rev. Physiol.53:201–216.
Fuentealba, L., D. J. Carey, and E. Brandan. 1999. Antisense inhibi-tion of syndecan-3 expression during skeletal muscle differentia-tion accelerates myogenesis through a basic fibroblast growthfactor-dependent mechanism. J. Biol. Chem. 274:37876–37884.
Giancotti, F. G., and E. Ruoslahti. 1999. Integrin signaling. Science(Wash DC) 285:1028–1032.
Heino, J., R. A. Ignotz, M. E. Hemler, C. Crouse, and J. Massague.1989. Regulation of cell adhesion receptors by transforminggrowth factor-β. J. Biol. Chem. 264:380–388.
Heino, J., and J. Massague. 1990. Cell adhesion to collagen anddecreased myogenic gene expression implicated in the controlof myogenesis by transforming growth factor beta. J. Biol. Chem.265:10181–10184.
Iozzo, R. V., and A. D. Murdoch. 1996. Proteoglycans of the extracellu-lar environment: Clues from the gene and protein side offernovel perspectives in molecular diversity and function. FASEBJ. 10:598–614.
Larrain, J., G. Cizmeci-Smith, V. Troncoso, R. C. Stahl, D. J. Carey,and E. Brandan. 1997. Syndecan-1 expression is down-regulatedduring myoblast terminal differentiation. J. Biol. Chem.272:18418–18424.
Lebaron. R. G. 1996. Versican. Perspect. Dev. Neurobiol. 3:261–271.Lennon, D. P., D. A. Carrino, M. A. Baber, and A. I. Caplan. 1991.
Generations of a monoclonal antibody against avian small der-matan sulfate proteoglycan: Immunolocalization and tissue dis-tribution of PG-II (decorin) in embryonic tissues. Matrix11:412–427.
Li, Z., S. G. Velleman, D. C. McFarland, J. E. Pesall, K. K. Gilkerson,N. H. Ferrin, and Y. Yun. 1997. Characterization of satellitecells derived from chickens with the low score normal (LSN)muscle weakness. Cytobios 91:75–85.
Mauviel, A., M. Santra, Y. Q. Chen, J. Uitto, and R. V. Iozzo. 1995.Transcriptional regulation of decorin gene expression: Inductionby quiescence and repression by tumor necrosis factor-alpha. J.Biol. Chem. 270:116692–116700.
McLennan, I. S. 1993. Localisation of transforming growth factorbeta 1 in developing muscles: Implications for connective tissueand fiber type pattern formation. Dev. Dyn. 197:281–290.
Miller, J. B. 1992. Myoblast diversity in skeletal myogenesis: Howmuch and to what end? Cell 69:1–3.
Moscatello, D. K., M. Santra, D. M. Mann, D. J. McQuillan, A. J.Wong, and R. V. Iozzo. 1998. Decorin suppresses tumor cellgrowth by activating the epidermal growth factor receptor. J.Clin. Invest. 101:406–412.
Olguin, H., and E. Brandan. 2001. Expression and localization ofproteoglycans during limb myogenic activation. Dev. Dyn.221:106–115.
Rapraeger, A. C., A. Krufka, and B. B. Olwin. 1991. Requirement ofheparan sulfate for bFGF-mediated fibroblast growth factor andmyoblast differentiation. Science (Wash DC) 251:1705–1708.
Riquelme, C., J. Larraın, E. Schonherr, J. P. Henriquez, H. Kresse,and E. Brandan. 2001. Antisense inhibition of decorin expressionin myoblasts decreases cell responsiveness to transforminggrowth factor β and accelerates skeletal muscle differentiation.J. Biol. Chem. 276:3589–3596.
Santra, M., T. Skorski, B. Calabretta, E. C. Lattime, and R. V. Iozzo.1995. De novo decorin gene expression suppresses the malignantphenotype in human colon cancer cells. Proc. Natl. Acad. Sci.USA 92:7016–7020.
Schonherr, E., M. Broszat, E. Brandan, P. Bruckner, and H. Kresse.1998. Decorin core protein fragment leu155-val260 interacts
Extracellular matrix E13
with TGF-β but does not compete for decorin binding to type Icollagen. Arch. Biochem. Biophys. 355:241–248.
Scott, J. E. 1988. Proteoglycan-fibrillar collagen interactions. J. Bio-chem. 252:313–323.
Stringer, S. E., and J. T. Gallagher. 1997. Heparan sulfate. Int. J.Biochem. Cell Biol. 29:709–714.
Thieszen, S. L., and T. H. Rosenquist. 1994. Expression of collagensand decorin during aortic arch artery development: Implicationsfor matrix patter formation. Matrix Biol. 14:573–582.
Timpl, R. 1993. Proteoglycans of basement membranes. Experientia49:417–428.
Velleman, S. G., C. S. Coy, L. Gannon, M. Wick, and D. C. McFarland.2000. β1 integrin expression during normal and low score normalavian myogenesis. Poult. Sci. 79:1179–1182.
Velleman, S. G., X. Liu, K. H. Eggen, and K. E. Nestor. 1999. Develop-mental regulation of proteoglycan synthesis and decorin expres-sion during turkey embryonic skeletal muscle formation. Poult.Sci. 78:1619–1626.
Velleman, S. G., and D. C. McFarland. 1999. Myotube morphology,and expression and distribution of collagen type I during normaland low score normal avian satellite cell myogenesis. Dev.Growth Diff. 41:153–161.
Velleman, S. G., R. A. Patterson, and K. E. Nestor. 1997. Identificationof decorin and chondroitin sulfate proteoglycans in turkey skele-tal muscle. Poult. Sci. 76:506–510.
Velleman, S. G., J. D. Yeager, H. Krider, D. A. Carrino, S. D. Zimmer-man, and R. J. McCormick. 1996. The avian low score normalmuscle weakness alters decorin expression and collagen cross-linking. Connect. Tissue Res. 34:33–39.
Vogel, K. G., M. Paulsson, and D. Heinegard. 1984. Specific inhibitionof type I and type II collagen fibrillogenesis by the small proteo-glycan of tendon. J. Biochem. 223:587–597.
Vogel, K. G., and J. A. Trotter. 1987. The effects of proteoglycans onthe morphology of collagen fibrils formed in vitro. Collagen Relet.Res. 7:105–114.
Weber, I. T., R. W. Harrison, and R. V. Iozzo. 1996. Model structureof decorin and implications for collagen fibrillogenesis. J. Biol.Chem. 271:31767–31770.
Weintraub, H. 1993. The MyoD family and myogenesis: Redundancy,networks, and thresholds. Cell 75:1241–1244.
Yablonka-Reuveni, Z., and B. M. Paterson. 2001. MyoD and myogeninexpression patterns in cultures of fetal and adult chicken my-oblasts. J. Histochem. Cytochem. 49:455–462.
Yamaguchi, Y., D. M. Mann, and E. Ruoslahti. 1990. Negative regula-tion of transforming growth factor-β by the proteoglycan decorin.Nature (Lond.) 346:281–284.
Yamaguchi, Y., and E. Ruoslahti. 1988. Expression of human proteo-glycan in chinese hamster ovary cells inhibits cell proliferation.Nature (Lond.) 336:244–246.
Young, H. E., D. A. Carrino, and A. I. Caplan. 1989. Histochemicalanalysis of newly synthesized and accumulated sulfate glyco-saminoglycans during musculogenesis in the embryonic chickleg. J. Morphol. 201:85–103.
Young, H. E., D. A. Carrino, and A. I. Caplan. 1990. Change insynthesis of sulfated glycoconjugates during muscle develop-ment, maturation and aging in embryonic to senescent CBF-1mouse. Mech. Ageing Dev. 53:179–193.

Management of twinning cow herds
B. W. Kirkpatrick1
Department of Animal Sciences, University of Wisconsin, Madison 53706
ABSTRACT: Beef producers are commonly opposedto twin births owing to the number of detriments associ-ated with the trait. These include increased incidenceof calf mortality, dystocia (malpresentation), stillbirth,abortion, calf abandonment, retained placenta, length-ened interval from parturition to conception, and occur-rence of freemartin heifers. Some problems can be over-come with changes in management, others lack an obvi-ous management fix, and still others are of littlepractical significance. Management alterations thatmay facilitate successful exploitation of twin birth in-clude 1) pregnancy checks to determine twin vs singlepregnancy, 2) adequate calving facilities, and 3) earlycalf weaning. Determining pregnancy status eliminatessurprises at calving time in that cows at high risk formalpresentation are identified beforehand. Addition-ally, cows gestating twins could be fed a higher plane
Key Words: Calves, Cows, Reproduction, Twins
2002 American Society of Animal Science. All rights reserved. J. Anim. Sci. 80(E. Suppl. 2):E14–E18
Introduction
Twin birth offers the potential for increased beef pro-duction efficiency if suitable changes in managementcan be made to accommodate problems inherent withtwinning. Twin birth is undesired by most beef produc-ers for its association with a number of detriments,including lower perinatal calf survival and poorer cowreproductive performance. Regarding cow performance,twinning is associated with increased dystocia (due tomalpresentation), increased incidence of retained pla-centa, greater frequency of abortion in twin gestation,and longer interval from parturition to first estrus (Ta-ble 1). Results cited in Table 1 represent only the mostrecent reports in the literature. Descriptions in the sci-entific literature of the association between twin birthand cow or calf performance can be found from priorto the 1930s up to the present. The results of these
1Correspondence: phone: 608-263-4323; fax: 608-262-5157; E-mail:[email protected].
Received July 27, 2001.Accepted December 3, 2001.
E14
of nutrition in recognition of the higher nutritional re-quirements both during late gestation and subse-quently while nursing twins. Adequate calving facilitiesare a necessity given the significant fraction of twinbirths that are malpresentations. Calving pens also per-mit temporary penning of cows with their twins to ad-dress calf abandonment problems. Given the typicallylonger interval from parturition to conception for twin-bearing cows, early weaning may help maintain ade-quate reproductive performance. There are no obviousalterations of management that will improve twinning-related problems with stillbirth, abortion, or retainedplacenta. Freemartinism is an item that is more a per-ceived than real problem; although the percentage offertile females is reduced in a twinning system, theabsolute number of fertile females produced from atwinning system will differ little from that from a sin-gle-birth system.
numerous surveys and studies have generally been con-sistent in their identification of problems associatedwith twinning with one exception, that being dystocia.Inconsistent results for incidence of dystocia may reflecttwo competing dynamics: twinning reduces incidenceof dystocia attributable to large calf size but increasesincidence of dystocia attributable to malpresentation.Efforts to exploit twin birth in beef production systemswill require changes in management to address theseproblems.
Diagnosing Twin Pregnancy
In typical beef herds, twins are a relatively unusualevent. Reviews on the genetics of twinning (Rutledge,1975; Morris and Day, 1986) suggest that twinning ratein beef breeds is typically less than 5%. As a conse-quence, most twin births in beef cattle herds are unan-ticipated events. Because they are unanticipated, mostproducers are not prepared to address complications,such as malpresentation, that may arise. One of themost important changes in management that shouldaccompany efforts to exploit twinning is determinationof pregnancy status with regard to single vs twin preg-

Management of twinning cow herds E15
Table 1. Detrimental association of twinning with calf and cow performance
Item Single birth Twin birth P-value
Perinatal calf mortality, %Mee, 1991 6.2 16.5 <0.001Day et al., 1995 3.2 15.7 <0.005Gregory et al., 1990 5 22 <0.01Cady and Van Vleck, 1978 5.9 22.4 <0.05
Retained placenta, %Anderson et al., 1979 0 14 NSa
Gregory et al., 1990 2.8 21.5 <0.01Eddy et al., 1991 2 16 <0.001Echternkamp and Gregory, 1999a 1.9 27.9 <0.01
Dystocia, %Anderson et al., 1979 20 21 NSGregory et al., 1990 23 35 <0.01Berry et al., 1994, 1st lactation 30.6 34.5 NSBerry et al., 1994, 2nd lactation 11.8 30.0 <0.05Eddy et al., 1991 5 7 NSMee, 1991 46.4 45.6 NSEchternkamp and Gregory, 1999a 20.6 46.9 <0.01
Abortion frequency, %Mee, 1991 1.81 1.20 NSDay et al., 1995 12.0 29.3 <0.05Echternkamp and Gregory, 1999b 3.5 12.4 <0.01
Stillborn calves, %Mee, 1991 4.1 12.9 <0.001
Interval, parturition to conception, dGregory et al., 1990b 83 93 <0.01Eddy et al., 1991 92 125 <0.001
aNS = not significant.
nancy. Available methods for diagnosing pregnancy sta-tus include transrectal palpation of the reproductivetract or transrectal ultrasonography to visualize thereproductive tract. Palpation can be used to determinepregnancy status but may provide only modest sensitiv-ity. Day et al. (1995), in a report utilizing data frompracticing veterinarians in commercial California dairyherds, reported a sensitivity for diagnosis of twin preg-nancy of 49.3% (meaning that in just under half thecases when a cow was actually pregnant with twins wasa diagnosis of twin gestation made). Ultrasonographyrepresents a more sensitive means of determining preg-nancy status as documented by several studies (Davisand Haibel, 1993; Dobson et al., 1993; McMillan et al.,1994). Davis and Haibel (1993) reported more accuratediagnosis of twin pregnancy when ultrasonography wasperformed between 49 and 55 d of gestation relativeto earlier dates, with no improvement in accuracy byexamination at later dates. From the data provided bythe Davis and Haibel (1993), sensitivity of ultrasonicdiagnosis of twin pregnancy between averages of 49 to55 d of gestation was 93%. McMillan et al. (1994) re-ported lower accuracy (40 to 62%) when making a diag-nosis at 45 or 60 d of gestation, which may in partreflect a higher rate of subsequent embryonic or fetalloss. As in the two previously mentioned studies, Echt-ernkamp and Gregory (1991) reported greater accuracy(65%) in diagnosis of twin pregnancy at 46 to 79 d ofgestation vs 28 to 45 d (57%). They also noted difficultyin performing ultrasonic evaluation after 80 d of gesta-
tion. Examination at later stages of gestation may becomplicated by physical size and location of the uterus.As a consequence, a herd of beef cows might need tobe pregnancy-checked by ultrasound on two differentoccasions to ensure that all animals are at one time orthe other in a stage of gestation that permits accurateultrasonic evaluation. A likely constraint to the applica-tion of this technology for many producers is the avail-ability of equipment or ultrasonography services at ajustifiable cost.
A future, alternative approach for determining preg-nancy status may be evaluation of hormone or proteinlevels associated with luteal, fetal, or placental tissues.Among factors that display differing levels between sin-gle- and twin-gestating cows are progesterone (Dobsonet al, 1993), estrone sulfate (Dobson et al., 1993; Taka-hashi et al., 1997), cortisol (Patel et al., 1996), bovinepregnancy-specific protein B (Patel et al., 1995; Dobsonet al, 1993), bovine pregnancy serum protein 60(PSP60) (Patel et al., 1998; Chauvin et al., 1999), andpregnancy-associated glycoprotein (Zoli et al., 1991).Variability in some of these factors is too great for prac-tical application as predictors of twin vs single preg-nancy; however, others such as PSP60 show potentialvalue. Chauvin et al. (1999) in work with a twinningbeef cattle population found that a diagnostic test basedon a single measurement of PSP60 had a sensitivityof 77.2% (percentage of cows carrying twins correctlydiagnosed) and specificity of 75.9% (percentage of cowscarrying singles correctly diagnosed). An assay of this

KirkpatrickE16
type provides an advantage over ultrasound of beingapplicable at a later stage of gestation. However, fur-ther work is needed to attain an assay with acceptablesensitivity, specificity, and cost.
Dealing with Dystocia
Twin-bearing cows are at higher risk than single-bearing cows for dystocia due to malpresentation. Ech-ternkamp and Gregory (1999a) in a study of 3,370 singleand 1,014 twin births reported an incidence of malpre-sentation of 4.5% for single births and 37.0% for twinbirths. Therefore, a prior diagnosis of twin pregnancyis valuable to producers in alerting them to cows thatare more likely to encounter problems at calving. Inaddition to diagnosing pregnancy status, as describedabove, producers who wish to exploit twinning in cattlewould be well served by investing in some basic calvingfacilities. Calving pens with a headgate and a gate thatdoubles as a crowding gate are relatively simple andinexpensive to construct and reduce stress on both ani-mal and handler. Facilities should be designed so thatit is easy to move cows into the calving pens.
In the event of a malpresentation with twin calves,it will be necessary to pen the cow and reposition thecalves prior to delivery. Although this is not a trivialissue, adequate facilities greatly simplify the task, andcompared with singletons, twins are easier to repositiondue to their lighter weight.
Nutritional Requirements of Twinning Cows
In addition to giving producers foreknowledge of po-tential calving problems, diagnosis of twin pregnancywould also permit producers to modify feeding pro-grams for twin-bearing cows during the last third ofgestation. Twin pregnancy has a higher metabolizableenergy (ME) requirement than does single pregnancy,and dams gestating twins lose maternal weight duringthe last weeks of gestation, whereas dams of singlesgain weight during the same period if fed equivalentdiets (Koong et al., 1982). Koong et al. (1982) foundno difference in maintenance energy requirements fordams carrying twin vs single fetuses, only a differencein pregnancy energy requirement (6.49 ± 0.26 and 6.09± 0.28 Mcal ME/d for twin-bearing cows and heifers,3.80 ± 0.29 and 3.89 ± 0.22 Mcal ME/d for single-bearingcows and heifers). Using the values reported by Koonget al. (1982) and assuming a 600-kg cow, daily dietaryenergy would need to be increased about 13% for twin-bearing cows relative to single-bearing cows. Bunge etal. (1997) reported a similar value of 11% greater energyrequirement for heifers gestating twins in a separatestudy.
Early Weaning of Calves
Most data suggest that twinning cows are at risk forlonger intervals from parturition to conception. In a
study using several thousand cumulative records fromthe USDA twinning cattle population, Echternkampand Gregory (1999b) reported a greater than 12-dlonger interval from parturition to conception for cowsgiving birth to and suckling twins vs cows birthing andsuckling singles. Corresponding differences in concep-tion rate were observed between the two groups; 79.2%of single-bearing cows conceived in a 60- to 70-d breed-ing period vs 66.3% for twin-bearing and twin-sucklingcows. Turman et al. (1971), in a much smaller study,used superovulation to create multiple births. All damssuckling single calves rebred in a 90-d breeding periodbut 25% (5/20) of cows suckling twins failed to rebreedduring the same period. Wheeler et al. (1982) used em-bryo transfer to create twin births in heifers and cows.Averaged across age groups, twin-bearing and -rearingfemales experience an interval from parturition to firstovulation that was approximately 17 d longer than thatfor single-bearing and -rearing females; however, thisdifference was not statistically significant. Differencesbetween these same groups in interval from parturitionto conception were less for females bearing and rearingtwins, but again differences were not statistically sig-nificant. Other studies have simulated twinning post-natally by forced adoption of an additional calf on adam of a single calf. In one such study, suckling twocalves vs one caused a significant delay in return toestrus; at 90 d postpartum, 71.4 and 88.8% of cowssuckling a single natural or foster calf, respectively,had returned to estrus vs 42.8% for cows suckling twocalves (Wyatt et al., 1977; Wettemann et al., 1978).Single- and twin-suckling cows in this study were feddiffering amounts of concentrate to achieve similarweight changes in both groups over the suckling period.In contrast, a more recent study with a very similardesign failed to detect an effect of single vs twin sucklingon percentage of females expressing estrus, intervalfrom parturition to first estrus, or first-service concep-tion rate (Small et al., 2000). One aspect of the studiesthat may have contributed to the different outcomeswas use of beef × dairy cross cows in the former (Hol-stein × Hereford) and beef cows (primarily Herefordbreeding) in the latter. Assuming that suckling twocalves does predispose a cow to delayed conception, oneanswer would be to remove the suckling stimulus byearly calf weaning.
Early weaning (i.e., at 6 to 8 wk of age or younger)has been well documented to improve postpartum re-productive performance. Laster et al. (1973) weanedcalves 1 wk prior to the start of the breeding season atan average age of 55 d. The percentage of 2-, 3-, and 4-yr-old and older cows conceiving in a 42-d breedingseason was increased by 25.9, 15.6 and 7.9%, respec-tively, for early-weaned calves vs those weaned afterthe breeding period. Similarly, Lusby et al. (1981) com-pared calf weaning at 6 to 8 wk of age with weaningat 7 mo of age for first-calf heifers and reported anincrease in the percentage of females conceiving in a64-d breeding season of 37.4%. Correspondingly, the

Management of twinning cow herds E17
interval from parturition to conception was 17.5 d lessfor the early-weaned group. Houghton et al. (1990) re-ported a significant 24-d reduction in postpartum inter-val to first estrus for early-weaned vs normally weanedcows in a study using mature beef cows. However, noeffect on conception rate was observed despite the re-duced postpartum anestrus interval. Bell et al. (1998)compared early weaning, once-daily milking, and nor-mal weaning using first-calf heifers and reported a re-duction in days to first estrus of 17 d for early-weanedvs normally weaned cows among those that were lessthan 85 d postpartum at initiation of the study. Consid-ering results from these various studies, early weaningof twin calves may be a way to improve postpartumreproductive performance of twin-bearing and twin-suckling cows, particularly those of younger age.
Maternal Behavior and Calf Acceptance
A common concern among producers is the propensityfor cows that bear twins to accept only one of the twinsand to abandon the other. This problem is seldom en-countered in the USDA Meat Animal Research Center(MARC) twinning herd (Gordon Hayes, personal com-munication), and the lack of a problem is attributed totheir management practice of routinely penning twinswith their mother for 24 h or longer before they aremoved to pasture with other cows with twins. Likewise,in the author’s experience it has not been a significantproblem. In the author’s twinning herd only cows re-quiring assistance during delivery are routinely pennedwith their calves for 24 h. Cows giving birth to twinswithout assistance who show signs of not accepting bothcalves are penned with their twins for approximately 24h and that is usually sufficient to correct the situation(personal observation).
Other Issues
Several problems that accompany twin birth have noeasy management fix. Included among these are thegreater frequency of abortion, stillbirth, and retainedplacenta. These are important issues that are detrimen-tal to the reproductive efficiency of a beef cow herd.
Some authors have suggested that the incidence ofretained placenta may be affected by nutritional regi-men (Studer, 1998), particularly in the context of dairycattle managed for high production levels. Dairy cowsthat are in excessive condition at calving or are subjectto imbalanced rations at the transition from the dryperiod to lactation are thought to be at higher riskfor retained placenta (Studer, 1998). Whether this is asuitable comparison with twinning beef cattle is un-clear. Gestation length in twinning cattle is roughly 5to 7 d shorter in duration than for cattle bearing singles(Cady and Van Vleck, 1978; Anderson et al., 1982; Ech-ternkamp and Gregory; 1999a). As a consequence, re-tained placenta in twinning cattle may more likely re-sult from the slightly premature parturition. Several
studies with dairy cattle have suggested that vitaminE administration 1 to 2 wk prior to parturition canreduce the incidence of retained placenta (Trinder etal., 1973; Julien et al., 1976), although results havevaried (Batra et al., 1992). Again, whether this would bean effective approach for preventing twinning-relatedincidences of retained placenta is unknown. There isno clearly effective treatment for retained placenta (re-viewed by Peters and Laven, 1996), so in twinning cowsthat do experience retained placenta the most cost-ef-fective approach to treatment may simply be no inter-vention.
It is difficult to unambiguously distinguish stillborncalves that are delivered near full-term from perinatalcalf death losses, unless personnel are present at birth.Gregory et al. (1996) in examining extensive recordsfrom the MARC twinning herd report survival ratesat birth for single and twin calves of 96.4 and 83.4%,respectively. The authors report that this accounts forprematurely delivered calves, which would presumablyinclude stillbirths, so that higher mortality of twinsin this report probably reflects both the influence ofdystocia and stillbirth combined. Although calf lossesdue to dystocia can probably be reduced by providingassistance at parturition, there is no clear means ofpreventing early-term abortions, late-term abortions,or stillbirths associated with twinning cows. It is possi-ble that different individuals or genetic lines of cattlemay have varying predisposition to carry multiple fe-tuses successfully to term. In the longer term, currentefforts to identify specific genetic loci controlling ovula-tion rate (Blattman et al., 1996; Kappes et al., 2000;Kirkpatrick et al., 2000) may facilitate introgressionof specific genes into different populations to test thishypothesis. Unfortunately, in the short term there isno management strategy that will clearly improve thisaspect of reproductive performance.
Implications
Exploitation of twin birth presents a potential meansof dramatically improving efficiency of beef production.Successful use of twinning in beef cattle production willrequire changes in management to address problemsof increased dystocia and calf mortality and poorer post-partum reproduction. Key changes in management mayinclude diagnosis of twin vs single pregnancy, modifi-cation of nutrition for cows bearing or suckling twins,and use of early weaning.
Literature Cited
Anderson, G. B., P. T. Cupps, and M. Drost. 1979. Induction of twinsin cattle with bilateral and unilateral embryo transfer. J. Anim.Sci. 49:1037–1042.
Anderson, G. B., R. H. BonDurant, and P. T. Cupps. 1982. Inductionof twins in different breeds of cattle. J. Anim. Sci. 54:485–490.
Batra, T. R., M. Hidiroglou, and M. W. Smith. 1992. Effect of vitaminE on incidence of mastitis in dairy cattle. Can. J. Anim. Sci.72:287–297.

KirkpatrickE18
Bell, D. J., J. C. Spitzer, and G. L. Burns. 1998. Comparative effectsof early weaning or once-daily suckling on occurrence of postpar-tum estrus in primiparous beef cows. Theriogenology 50:707–715.
Berry, S. L., A. Ahmadi, and M. C. Thurmond. 1994. Periparturientdisease on large, dry lot dairies: Interrelationships of lactation,dystocia, calf number, calf mortality, and calf sex. J. Dairy Sci.77 (Suppl. 1):379 (Abstr.).
Blattman, A. N., K. E. Gregory, and B. W. Kirkpatrick. 1996. A searchfor quantitative trait loci for ovulation rate in cattle. Anim.Genet. 27:157–162.
Bunge O., H. J. Papstein, and K. Ender. 1997. Studies on the growth,gain and carcass value of primipara during singleton and twinpregnancies. 2. Gain of body substances and energy, birthweights and courses of calving. Zuechtungskunde 69:20–30.
Cady, R. A., and L. D. Van Vleck. 1978. Factors affecting twinningand effects of twinning in Holstein dairy cattle. J. Anim. Sci.46:950–956.
Chauvin, C., S. Camous, P. Gillard, P. Maugrion, C. Robert, and J.L. Foulley. 1999. PSP60 profile and its variation factors andapplication to twinning diagnosis in a beef suckling herd. Rev.Med. Vet. 150:143–150.
Davis, M. E., and G. K. Haibel. 1993. Use of real-time ultrasound toidentify multiple fetuses in beef cattle. Theriogenology40:373–382.
Day, J. D., L. D. Weaver, and C. E. Franti. 1995. Twin pregnancydiagnosis in Holstein cows—discriminatory powers and accuracyof diagnosis by transrectal palpation and outcome of twin preg-nancies. Can. Vet. J. 36:93–97.
Dobson, H., T. G. Rowan, I. S. Kippax, and P. Humblot. 1993. Assess-ment of fetal number, and fetal and placental viability through-out pregnancy in cattle. Theriogenology 40:411–425.
Echternkamp, S. E., and K. E. Gregory. 1991. Identification of twinpregnancies in cattle by ultrasonography. J. Anim. Sci. 69(Suppl. 1):220 (Abstr.).
Echternkamp, S. E., and K. E. Gregory. 1999a. Effects of twinninggestation length, retained placenta, and dystocia. J. Anim. Sci.77:39–47.
Echternkamp, S. E., and K. E. Gregory. 1999b. Effects of twinningon postpartum reproductive performance in cattle selected fortwin birth. J. Anim. Sci. 77:48–60.
Eddy, R. G., O. Davies, and C. David. 1991. An economic assessmentof twin births in British dairy herds. Vet. Rec. 129:526–529.
Gregory, K. E., S. E. Echternkamp, and L. V. Cundiff. 1996. Effectsof twinning on dystocia, calf survival, calf growth, carcass traitsand cow productivity. J. Anim. Sci. 74:1223–1233.
Gregory, K. E., S. E. Echternkamp, G. E. Dickerson, L. V. Cundiff,R. M. Koch, and L. D. Van Vleck. 1990. Twinning in cattle: III.Effects of twinning on dystocia, reproductive traits, calf survival,calf growth and cow productivity. J. Anim. Sci. 68:3133–3144.
Houghton, P. L., R. P. Lemenager, L. A. Horstman, K. S. Hendrix,and G. E. Moss. 1990. Effects of body composition, pre- andpostpartum energy level and early weaning on reproductive per-formance of beef cows and preweaning calf gain. J. Anim. Sci.68:1438–1446.
Julien, W. E., H. R. Conrad, and A. L. Moxon. 1976. Selenium andvitamin E and incidence of retained placenta in parturient dairycows. II. Prevention in commercial herds with prepartum treat-ment. J. Dairy Sci. 59:1960–1966.
Kappes, S. M., G. L. Bennett, J. W. Keele, S. E. Echternkamp, K. E.Gregory, and R. M. Thallman. 2000. Initial results of genomicscans for ovulation rate in a cattle population selected for in-creased twinning rate. J. Anim. Sci. 78:3053–3059.
Kirkpatrick, B., B. M. Byla, and K. E. Gregory. 2000. Mapping quanti-tative trait loci for bovine ovulation rate. Mamm. Genome11:136–139.
Koong, L. J., G. B. Anderson, and W. N. Garrett. 1982. Maternalenergy status of beef cattle during single and twin pregnancy.J. Anim. Sci. 54:480–485.
Laster, D. B., H. A. Glimp, and K. E. Gregory. 1973. Effects of earlyweaning on postpartum reproduction of cows. J. Anim. Sci.36:734–740.
Lusby, K. S., R. P. Wettemann, and E. J. Turman. 1981. Effects ofearly weaning calves from first-calf heifers on calf and heiferperformance. J. Anim. Sci. 53:1193–1197.
McMillan, W. H., A. P. Oakley, and D. R. H. Hall. 1994. Determiningthe number of calves in early pregnancy using real-time ultra-sound imaging in beef cows induced to twin. Proc. N. Z. Soc.Anim. Prod. 54:353–355.
Mee, J. F. 1991. Factors affecting the spontaneous twinning rate andthe effect of twinning on calving problems in 9 Irish dairy herds.Irish Vet. J. 44:14–20.
Morris, C. A., and A. M. Day. 1986. Potential for genetic twinningin cattle. In: Proc. 3rd World Congr. Genet. Appl. to Livest. Prod.,Lincoln, Nebraska. 11:14–29.
Patel, O. V., S. Camous, N. Takenouchi, T. Takahashi, M. Hirako,N. Sasaki, and I. Domeki. 1998. Effect of stage of gestation andfoetal number on plasma concentrations of a pregnancy serumprotein (PSP-60) in cattle. Res. Vet. Sci. 65:195–199.
Patel, O. V., I. Domeki, N. Sasaki, T. Takahashi, M. Hirako, R. G.Sasser, and P. Humblot. 1995. Effect of fetal mass, number andstage of gestation on pregnancy-specific protein-B concentra-tions in the bovine. Theriogenology 44:827–833.
Patel, O. V., T. Takahashi, N. Takenouchi, M. Hirako, N. Sasaki,and I. Domeki. 1996. Peripheral cortisol levels throughout gesta-tion in the cow: Effect of stage of gestation and foetal number.Br. Vet. J. 152:425–432.
Peters, A. R., and R. A. Laven. 1996. Treatment of bovine retainedplacenta and its effects. Vet. Rec. 139:535–539.
Rutledge, J. J. 1975. Twinning in cattle. J. Anim. Sci. 40:803–815.Small, J. A., E. Charmley, and A. D. Kennedy. 2000. The performance
of primiparous and multiparous beef cows rearing single andsimulated-twin calves. Can. J. Anim. Sci. 80:569–576.
Studer, E. 1998. A veterinary perspective of on-farm evaluation ofnutrition and reproduction. J. Dairy Sci. 81:872–876.
Takahashi, T., M Hirako, H. Takahashi, O.V. Patel, N. Takenouchi,and I Domeki. 1997. Maternal plasma estrone sulfate profileduring pregnancy in the cow: Comparison between singletonand twin pregnancies. J. Vet. Med. Sci. 59:287–288.
Trinder, N., R. J. Hall, and C. P. Renton. 1973. The relationshipbetween the intake of selenium and vitamin E on the incidenceof retained placenta in dairy cows. Vet. Rec. 93:641–646.
Turman, E. J., D. B. Laster, R. E. Renbarger, and D. F. Stephens.1971. Multiple births in beef cows treated with equine gonadotro-pin (PMS) and chorionic gonadotropin (HCG). J. Anim. Sci.32:962–967.
Wettemann, R. P., E. J. Turman, R. D. Wyatt, and R. Totusek. 1987.Influence of suckling intensity on reproductive performance ofrange cows. J. Anim. Sci. 47:342–346.
Wheeler, M. B., G. B. Anderson, R. H. BonDurant, and G. H. Staben-feldt. 1982. Postpartum ovarian function and fertility in beefcattle that produce twins. J. Anim. Sci. 54:589–593.
Wyatt, R. D., M. B. Gould, and R. Totusek. 1977. Effects of single vssimulated twin rearing on cow and calf performance. J. Anim.Sci. 45:1409–1414.
Zoli, A. P. L. A. Builbault, P. Delahaut, W. B. Ortiz, and J. F. Beckers.1991. Radioimmunoassay of a bovine pregnancy-associated gly-coprotein in serum: Its application for pregnancy diagnosis. Biol.Reprod. 46:83–92.

Evolution and use of ultrasonic technology in the swine industry
S. J. Moeller1,2
The Ohio State University, Columbus 43210
ABSTRACT: The use of ultrasound to measure bio-logical tissue dates back to at least 1950, and earlyultrasonic work focused primarily on applications tohuman medicine. The application in livestock specieswas somewhat slow due to the cumbersome, fragile ma-chines and high investment costs. Historically, the ap-plication of ultrasound to swine has focused on composi-tion and reproductive status assessment, with most ofthe research carried out through land-grant institu-tions. Early researchers evaluated the relationshipamong ultrasound measurements and carcass mea-sures. However, the accuracy of the early amplitude-depth (A-mode), single-crystal devices was often quitevariable. The introduction of B-mode (brightness mod-ality) ultrasound, using multiple-crystal transducersand displayed in real-time, greatly enhanced the accu-racy of live animal composition and provided an under-standing of extraneous effects on accuracy of measure-ments. In 1993, the U.S. swine industry implementeda national ultrasound training and certification pro-
Key Words: Composition, Detection, Pregnancy, Swine, Ultrasound
2002 American Society of Animal Science. All rights reserved. J. Anim. Sci. 80(E. Suppl. 2):E19–E27
Introduction
The application of ultrasound technology in theswine industry dates to the late 1950s when Claus(1957) reported research results evaluating the feasi-bility of using ultrasound to evaluate carcass composi-tion on the live pig. This paper was quickly followedby additional research reports (Hazel and Kline, 1959;Price et al., 1960ab; Stouffer et al., 1961) that de-scribed the accuracy of live animal measurements ob-tained with ultrasound compared with metal probemeasures on live pigs and traditional carcass mea-sures. These initial findings corresponded closely with
1Salaries and research support from state and federal funds appro-priated to the Ohio Agric. Res. and Dev. Center, The Ohio StateUniversity. Manuscript 37-01AS.
2Correspondence: 122 Animal Sciences Building, 2029 Fyffe Road(phone: 614-688-3686, fax: 614-292-3513, E-mail: [email protected]).
Received July 27, 2001.Accepted December 7, 2001.
E19
gram for composition assessment. Application of ultra-sound principles has expanded to include on-line car-cass composition estimation in packing facilities as wellas on-farm applications for the measurement of leangrowth rate and subsequent nutrition modeling. Earlyresearch in the reproduction area used Doppler ultra-sound systems that measured fluid flow within theuterus. A-mode systems were evaluated in the mid1970s. Doppler and A-mode devices, while relativelyinexpensive and accurate within specified time framesduring gestation, are less accurate than real-time ultra-sound. Research indicates real-time ultrasound is anaccurate system of pregnancy detection as early as 22d after first mating. Enhanced technology, increasedportability, and reduced cost have allowed ultrasoundto be a common tool used in swine units, packing plants,and research institutes. Future research in the areas ofcomposition, muscle quality, and reproductive biology,along with enhanced imaging capabilities, will lead theway to new, innovative applications.
a change in focus by the swine industry to reduce fatand increase muscle in existing swine populations andthe establishment of swine testing centers throughoutNorth America and Europe. Since the early applicationof ultrasound, geneticists, nutritionists, meat scien-tists, and engineers have actively pursued advancesin methodology and developed additional applicationsfor ultrasound technology to improve the swine in-dustry.
Enhancing reproductive efficiency within the swineindustry has been a second focal point for ultrasonicresearch and application. Fraser and Robertson (1968)reported encouraging results for research conductedusing Doppler ultrasound instrumentation to detectpregnancy status of breeding females. As with compo-sition estimation, these early results led to expandedresearch initiatives to improve the accuracy and earlydetection capabilities of ultrasound for determiningpregnancy status. Advanced ultrasound image capa-bilities continue to expand the applications of ultra-sound for reproductive purposes.

MoellerE20
Table 1. Partial listing of research reports evaluatingthe accuracy of ultrasound devices
Research publication Ultrasound device Ultrasound type
Hazel and Kline, 1959 Kelvin and Hughes Mark V A – modePrice et al., 1960a Sperry Reflectoscope A – modePrice et al., 1960b Sperry Reflectoscope A – modeStouffer et al, 1961 Sperry Reflectoscope A – modeAnderson and Wahlstrom, 1969 Branson Model 212 A – modeAdams et al., 1972 Lean Meater A – modeAlliston et al., 1982 Sonatest A – mode
Scanogram LinearDanscanner B – mode
Sather et al., 1982 Krautkramer USM2 A – modeScanoprobe 731A A – mode
Mersmann, 1982 Scanogram Model 722 A – modeBusk, 1986 Renco Lean Meater LM7 A – mode
Krautkramer USK-6 A – modeAloka SSD 210DX B – modeScanmatic SM-1 A – mode
Danscanner B – modeForrest et al., 1986 Technicare 210DX B – modeKanis et al., 1986 Krautkramer USK6 A – mode
Renco Lean Meater A – modeSather et al., 1986 Krautkramer USM2 A – mode
Scanoprodbe 731A A – modeLopes et al., 1987 Technicare 210DX B – modeMcLaren et al., 1989 Johnson and Johnson 210DX B – modeTurlington et al., 1990 Technicare 210DX B – modeChristian and Moeller, 1990 Aloka 500 B – modeMoeller et al., 1998 Aloka 500 B – mode
The objective of this review article is to highlightthe early applications and the evolution of ultrasoundtechnology within the swine industry with a focus inthe areas of composition assessment and improvementin reproductive efficiency.
Ultrasound as a Tool to Measure Composition
Instrumentation and Accuracy
Response to market signals in the 1950s increasedinterest in producing leaner pigs, resulting in the de-velopment of genetic selection programs to meet thisgoal. Improving the rate of genetic improvement andthe accuracy of selection required methods to evaluatecomposition in the live pig. Hazel and Kline (1952)developed the metal backfat probe, an invasive methodto measure backfat depth, and reported correlationsabove 0.80 between live and carcass measures of back-fat. Although accuracy of the metal probe was reason-able, the potential for infection at the points of incisionand the need for animal restraint made this techniquedifficult and undesirable. The first reported use of ul-trasound for measuring backfat (Claus, 1957) wasquickly followed by additional research evaluating thisnew, noninvasive technology. Numerous manufactur-ers supplied ultrasound instrumentation to the swineindustry throughout the years and many researchprojects focused on evaluating accuracy as well as com-parisons among machines. Table 1 lists several re-
search articles published since the late 1950s and thetypes of machines tested.
Early ultrasound devices utilized amplitude-depth(A-mode) ultrasound technology involving a soundemitted from a single quartz crystal located within theultrasound transducer. Sound waves emitted from thetransducers entered the animal and traveled throughthe biological tissues (skin, fat, fascia, and muscle),and differences in acoustic density resulted in soundbeing reflected back through the transducer to re-ceiver. Using time/distance relationships, the reflectedwaves were converted into signals that were interpre-ted by using either an oscilloscope, a series of lightsor, in later years, LED readout.
The A-mode, single-point estimates of fat and mus-cle depth were generally compared with carcass mea-surements at multiple locations along the loin, justoff the midline, to determine accuracy relative to thecarcass measurement. Multiple A-mode measures,taken at various angles of incidence, were recorded onPolaroid film and used to obtain the first crude, two-dimensional, cross-sectional view of the loin for esti-mation of loin muscle area (Price et al., 1960b; Stoufferet al., 1961). Many trials reported that early ultra-sound instrumentation was not as effective for mea-surement when backfat depths were large (Claus,1957; Price et al., 1960b) and when taken over theshoulder region due to the presence of the trapeziusmuscle. Stouffer et al. (1961), an early pioneer in ultra-sound, noted the need for further refinement of instru-
Evolution of ultrasound use in swine E21
mentation due to the large variation found betweenoperators interpreting images, a concern that waslater expressed in research reported by Sather et al.(1982), who indicated operator ability was more criti-cal than machine when measuring composition withultrasound. Meyer et al. (1966) published a researchbulletin summarizing research findings and resultsdescribing the application of ultrasonic techniques forestimation of live animal and carcass measurements.
Accuracy of A-mode ultrasonic devices was quitevariable within and across research reports. Hazel andKline (1959) reported relatively high correlations (r =−0.76 to −0.90) between live ultrasound fat depth andpercentage lean cuts. Price et al. (1960a) reported cor-relations of 0.89, 0.91, and 0.89 between live ultra-sound, live ruler, and carcass ultrasound backfat inrelation to carcass backfat, respectively, when fat wasmeasured at the center of pigs’ backs. Correlationswere significantly smaller for off-midline backfat mea-sured near the shoulder (Anderson and Wahlstrom,1969; Adams et al., 1972; Mersmann, 1982). Sather etal. (1986) compared the effect of operator, machine,and probe site and reported fat measures were moreaccurate when only two fat layers were measured andnoted machine × operator interactions demonstratedthat interpretation ability was not the same for eitheroperators or machines. Summarized across trials, A-mode ultrasound was consistently less accurate at lo-cations and on pigs where fat depth was large and A-mode frequently underestimated corresponding mea-surements on carcasses. Sather et al. (1986) hypothe-sized that with some A-mode machines, the underesti-mation may have been a function of the inability toconsistently define the third layer of fat that coversthe loin muscle of the pig.
Early attempts to measure loin muscle area with A-mode revealed only moderate correlations with carcassloin muscle area measurements (Price et al., 1960b, r= 0.74; Stouffer et al., 1961, r = 0.70). The primaryproblems with multiple A-mode measures to outlinethe loin were 1) lack of highly trained technicians,2) animal movement and restraint, and 3) the timeinvolved in obtaining images. Attempts to predict car-cass loin muscle area from ultrasonic loin depth werenot predictable or reliable due to differences in muscleshape and the inability to consistently differentiatethe third layer of fat over the loin from the muscle.Busk (1986) reported correlations between loin depthand area of 0.51 and 0.60 at the 10th and last riblocations, respectively.
Although the accuracy of A-mode devices was oftenless than ideal, the relatively low investment cost andperceived ease of operation made them widely usedfor seedstock selection, central testing programs, uni-versity and industry research, and on-farm applica-tions. Still today, many swine producers and research-ers continue to utilize A-mode technology for measur-ing fat depth due to the low investment cost.
The introduction of B-mode (brightness mode), real-time ultrasound represented a significant advance inour ability to measure composition of the live animaland hanging carcass. B-mode ultrasound utilized mul-tiple sound-emitting quartz crystals arranged in a lin-ear array within the transducer and produced a two-dimensional image of the tissue being investigated ona video screen. The image appeared in real-time asa result of continuous transmission and reception ofsound waves that were converted to images at a frame-refreshing rate between 8 and 16 frames per second.Images used to estimate composition were created us-ing ultrasound frequencies between 3.0 and 5.0 MHzemitted from transducers containing 64 to 120 quartzcrystals along a length of 12 and 17 cm. This allowedthe entire loin and individual fat layers covering theloin to be viewed and allowed technicians to refineanatomical location of the probe based on the shapeof the loin muscle and presence or absence of othermuscle systems. A new wave of experimentationstarted in the late 1970s and through the 1990s asuniversity researchers attempted to evaluate the effi-cacy of real-time ultrasound.
Resolution capabilities of the first real-time ma-chines, generally 256 × 256 lines of resolution, pro-vided a significant challenge for researchers. An earlyreport comparing real-time ultrasound (Danscanner)with A-mode devices (Alliston et al., 1982) found A-mode devices were superior to the real-time deviceand the addition of real-time loin muscle area did notimprove the ability to predict carcass lean. Forrest etal. (1986), using a Technicare 210DX fitted with a 3.5-MHz linear probe, compared carcass and live real-timemeasures with split carcass measurements and re-ported carcass real-time measurements were morehighly correlated than live real-time with the mea-sured carcass value for backfat (r = 0.75 vs 0.71) andloin muscle area (r = 0.70 vs 0.68) at the 10th riblocation. Busk (1986) compared off-midline fat at threelocations (10th rib, last rib, and last lumbar vertebrae)using real-time (Aloka SSD-210DX fitted with a 3.5-MHz, 12.5-cm linear transducer) and A-mode ma-chines. The results showed no differences among ma-chine, but for all machines fat was more highly corre-lated at the 10th rib (r = 0.87 to 0.91) than at the lastrib (r = 0.78 to 0.90) and last lumbar locations (r = 0.67to 0.73) across machines. Lopes et al. (1987) reportedcorrelations between real-time 10th rib backfat andsplit carcass measurements ranging from 0.80 to 0.89with mean absolute deviations between real-time andcarcass fat depth ranging from 2.2 to 6.2 mm. Theyalso reported loin muscle area correlations at the 10thrib ranged from 0.27 to 0.71 with mean absolute devia-tions from 2.5 to 6.5 cm2. Proposed reasons for largevariability in real-time accuracy, as measured by thecorrelation coefficient, across research trials was at-tributed to resolution capabilities of the machine, ex-perience of the operator (McLaren et al., 1991), andpotential shifts in fat and muscle when comparing a
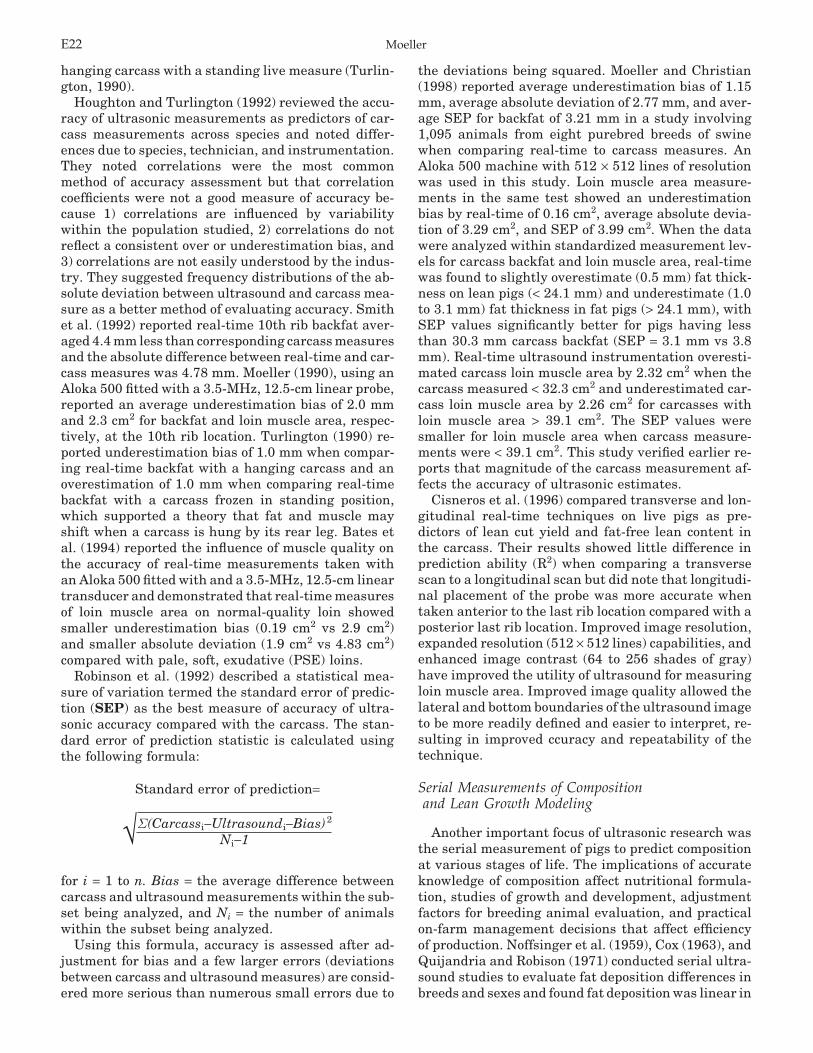
MoellerE22
hanging carcass with a standing live measure (Turlin-gton, 1990).
Houghton and Turlington (1992) reviewed the accu-racy of ultrasonic measurements as predictors of car-cass measurements across species and noted differ-ences due to species, technician, and instrumentation.They noted correlations were the most commonmethod of accuracy assessment but that correlationcoefficients were not a good measure of accuracy be-cause 1) correlations are influenced by variabilitywithin the population studied, 2) correlations do notreflect a consistent over or underestimation bias, and3) correlations are not easily understood by the indus-try. They suggested frequency distributions of the ab-solute deviation between ultrasound and carcass mea-sure as a better method of evaluating accuracy. Smithet al. (1992) reported real-time 10th rib backfat aver-aged 4.4 mm less than corresponding carcass measuresand the absolute difference between real-time and car-cass measures was 4.78 mm. Moeller (1990), using anAloka 500 fitted with a 3.5-MHz, 12.5-cm linear probe,reported an average underestimation bias of 2.0 mmand 2.3 cm2 for backfat and loin muscle area, respec-tively, at the 10th rib location. Turlington (1990) re-ported underestimation bias of 1.0 mm when compar-ing real-time backfat with a hanging carcass and anoverestimation of 1.0 mm when comparing real-timebackfat with a carcass frozen in standing position,which supported a theory that fat and muscle mayshift when a carcass is hung by its rear leg. Bates etal. (1994) reported the influence of muscle quality onthe accuracy of real-time measurements taken withan Aloka 500 fitted with and a 3.5-MHz, 12.5-cm lineartransducer and demonstrated that real-time measuresof loin muscle area on normal-quality loin showedsmaller underestimation bias (0.19 cm2 vs 2.9 cm2)and smaller absolute deviation (1.9 cm2 vs 4.83 cm2)compared with pale, soft, exudative (PSE) loins.
Robinson et al. (1992) described a statistical mea-sure of variation termed the standard error of predic-tion (SEP) as the best measure of accuracy of ultra-sonic accuracy compared with the carcass. The stan-dard error of prediction statistic is calculated usingthe following formula:
Standard error of prediction=
√Σ(Carcassi−Ultrasoundi−Bias)2
Ni−1
for i = 1 to n. Bias = the average difference betweencarcass and ultrasound measurements within the sub-set being analyzed, and Ni = the number of animalswithin the subset being analyzed.
Using this formula, accuracy is assessed after ad-justment for bias and a few larger errors (deviationsbetween carcass and ultrasound measures) are consid-ered more serious than numerous small errors due to
the deviations being squared. Moeller and Christian(1998) reported average underestimation bias of 1.15mm, average absolute deviation of 2.77 mm, and aver-age SEP for backfat of 3.21 mm in a study involving1,095 animals from eight purebred breeds of swinewhen comparing real-time to carcass measures. AnAloka 500 machine with 512 × 512 lines of resolutionwas used in this study. Loin muscle area measure-ments in the same test showed an underestimationbias by real-time of 0.16 cm2, average absolute devia-tion of 3.29 cm2, and SEP of 3.99 cm2. When the datawere analyzed within standardized measurement lev-els for carcass backfat and loin muscle area, real-timewas found to slightly overestimate (0.5 mm) fat thick-ness on lean pigs (< 24.1 mm) and underestimate (1.0to 3.1 mm) fat thickness in fat pigs (> 24.1 mm), withSEP values significantly better for pigs having lessthan 30.3 mm carcass backfat (SEP = 3.1 mm vs 3.8mm). Real-time ultrasound instrumentation overesti-mated carcass loin muscle area by 2.32 cm2 when thecarcass measured < 32.3 cm2 and underestimated car-cass loin muscle area by 2.26 cm2 for carcasses withloin muscle area > 39.1 cm2. The SEP values weresmaller for loin muscle area when carcass measure-ments were < 39.1 cm2. This study verified earlier re-ports that magnitude of the carcass measurement af-fects the accuracy of ultrasonic estimates.
Cisneros et al. (1996) compared transverse and lon-gitudinal real-time techniques on live pigs as pre-dictors of lean cut yield and fat-free lean content inthe carcass. Their results showed little difference inprediction ability (R2) when comparing a transversescan to a longitudinal scan but did note that longitudi-nal placement of the probe was more accurate whentaken anterior to the last rib location compared with aposterior last rib location. Improved image resolution,expanded resolution (512 × 512 lines) capabilities, andenhanced image contrast (64 to 256 shades of gray)have improved the utility of ultrasound for measuringloin muscle area. Improved image quality allowed thelateral and bottom boundaries of the ultrasound imageto be more readily defined and easier to interpret, re-sulting in improved ccuracy and repeatability of thetechnique.
Serial Measurements of Compositionand Lean Growth Modeling
Another important focus of ultrasonic research wasthe serial measurement of pigs to predict compositionat various stages of life. The implications of accurateknowledge of composition affect nutritional formula-tion, studies of growth and development, adjustmentfactors for breeding animal evaluation, and practicalon-farm management decisions that affect efficiencyof production. Noffsinger et al. (1959), Cox (1963), andQuijandria and Robison (1971) conducted serial ultra-sound studies to evaluate fat deposition differences inbreeds and sexes and found fat deposition was linear in

Evolution of ultrasound use in swine E23
the weight ranges studied. Cooksley and Cunningham(1977) reported that 98% of variation in backfat thick-ness could be explained by a linear relationship withweight. Ahlschwede et al. (1978) in one of the largeststudies reported (n = 54,085 boars) determined thatthe relationship between backfat and weight was es-sentially linear with only a small deviation accountedfor by nonlinear effects. Mersmann (1984) reportedresults suggesting that curvilinear deposition of back-fat occurred for off-midline fat at one-fifth and three-quarter body length locations and linear depositionoccurred at the one-half body length location.
Mersman (1984) reported nonlinear deposition ofloin muscle area at the one-half body length locationbetween d 56 of age and 90 kg, and McLaren et al.(1989) reported significant linear and quadratic re-gression coefficients for serial measures taken from8.9 to 98.5 kg live weights. In contrast, Tess et al.(1986) reported fat, lean, and protein accretion waslinear between 10 and 24 wk of age, and Moeller (1990)reported linear deposition for fat and loin muscle areabetween 70 and 105 kg live weight. Moeller et al. (1998)reported linear deposition of backfat and loin musclearea at the 10th rib location and a quadratic compo-nent that accounted for less than 1% of the variationin the best-fitting regression equation over a weightrange from 70 to 105 kg.
Improved genetics, capable of maintaining high lev-els of lean to heavier live weights, and a better under-standing of nutritional needs of the pig have expandedthe interest in using ultrasound to predict compositionat various live weights and matching nutritional pro-grams to more accurately reflect the nutrient needsfor lean growth. Accurate lean growth models relyheavily on the ability to accurately assess both backfatand loin muscle on the live pig via ultrasound. Theportability and improved accuracy of real-time ma-chines as well as more highly trained technicians nowallow independent swine producers to collect serialscan information at a relatively low cost and developfarm-specific nutritional programs to meet their genet-ics and environment.
Implications for the Packing Industry
The packing industry is constantly searching for ac-curate, noninvasive technology to estimate value ofthe carcass for merit based purchasing. Ultrasoundtechnology is currently being used in some U.S. swinepacking plants to determine carcass lean content andpayment schedules. Ultrasound systems used in pack-ing facilities includes relatively simple A-mode tech-nology, more complex B-mode instrumentation, andvery complex, multi-transducer A-mode systems uti-lizing computer imaging to differentiate fat and mus-cle. An initial, and sometimes ongoing, problem withultrasound in packing plants was the ability to consis-tently establish appropriate contact between thetransducer and the carcass at line speeds that can
exceed 1,000 carcasses per hour. Poor contact betweenthe probe and the carcass results in either no measure-ment or a measurement with the potential for largeerrors. A second problem experienced has been relatedto durability of ultrasound devices in an environmentthat is often less than ideal for complex circuitry. Inaddition, the consistency of the angle and location ofthe transducer with respect to anatomical referenceson the carcass are critical factors that affect accuracyin packing plant situations.
The UltraFom (SFK Technology A/S, Denmark) ul-trasonic system represents an A-mode device used tomeasure fat and muscle depth on the hot carcass. TheUltraFom can incorporate either single or multipletransducers to allow for measurement at one or multi-ple anatomical locations. As with all A-mode devices,the accuracy of the device is a function of transducerangle, consistency of anatomical location, and experi-ence of the operator. A newer, more advanced Ul-traFom 300 uses 64 ultrasound-emitting crystals tomeasure fat and muscle depth. The UltraFom is capa-ble of measure carcasses at line speeds of 1,200 perhour.
The AutoFom (SFK Technology A/S, Denmark) is acomplex A-mode ultrasonic instrument, utilizing 16individual transducers positioned in a U-shapedtrough. The hot, wet swine carcass is moved acrossthese transducers from tail-head through the shoulderwith the reflected ultrasonic signals recorded and ana-lyzed using mathematical algorithms to predict com-position of the total carcass as well as primal propor-tions. Carcass measurements are taken every 5 mmalong the length of the carcass and every 25 mm alongthe width of the carcass, with a total of approximately3,000 measurements per carcass. This technology of-fers significant advantages due to the ability to mea-sure whole-body composition and the absence of a hu-man operator, but at this time algorithms to estimatelean are still being developed.
Animal Ultrasound System (AUS) (Animal Ultra-sound Services, Ithaca, NY) utilizes B-mode instru-mentation to assess backfat and loin muscle depthfrom a longitudinal image obtained approximately 5to 6 cm off the midline from the last rib forward approx-imately 17 cm. The AUS system utilizes a 17-cm, 3.0-MHz, linear array transducer. Fat depth and loindepth to the bottom of the intercostals spaces is mea-sured at various locations along the length of the trans-ducer and used to estimate percentage lean in thecarcass. Liu and Stouffer (1995) reported R2 values of0.88 and a residual standard deviation of 0.54 kg whenpredicting defatted, deboned weight of lean in the fourlean cuts and an R2 of 0.92 with an residual standarddeviation of 0.49 kg when predicting weight of gradelean. The accuracy of the AUS system appears to beinfluenced by transducer location and angle, operatorexperience, and clarity of the images obtained atline speeds.

MoellerE24
Technician Education and Certification
In an effort to improve the accuracy and consistencyof ultrasonic data collected in the swine industry, theNational Swine Improvement Federation has con-ducted ultrasound education and certification clinicsevery year since 1993. The focus of these clinics hasbeen to provide a forum for ultrasound technicians tointeract and discuss the critical factors that affect theaccuracy of ultrasound procedures. The educationalprogram focuses on 1) understanding the anatomy ofthe animal, 2) applying ultrasound technology to theanatomy, 3) factors affecting image quality and consis-tency, 4) image interpretation, and 5) an explanationof why and how accuracy is assessed.
Technician certification consists of hands-on scan-ning, during which technicians are required to scanand interpret ultrasonic backfat and loin muscle areaat the 10th rib on 50 market hogs with varying levelsof fat depth and loin size. Market hogs are renumberedand scanned a second time to assess the repeatabilityof backfat and loin muscle area by each technician.Ultrasound measurements are compared with splitcarcass measurements obtained by two experiencedmeat scientists with the requirement that the maxi-mum deviation between the two carcass measure-ments be no more than 1.3 mm for backfat and 1.29 cm2
for loin muscle area. Certification criteria for backfatdepth are as follows: standard error of prediction = 3.8mm, repeatability 3.8 mm and bias = ± 3.8 mm. Criteriafor loin muscle area are the following: standard errorof prediction = 3.22 cm2, repeatability = 3.22 cm2, andbias = ± 3.22 cm2. Technicians must meet all criteria(standard error of prediction, repeatability, and bias)to certify for backfat and (or) loin muscle area. Certifi-cation is extended for a period of 2 yr.
Applications of Ultrasound for Reproduction
Efficiency and cost of production for a swine enter-prise are directly associated with reproductive effi-ciency of the breeding herd. The impact of poor concep-tion and farrowing rates as well as the extra feed andhousing costs for females that not reproductively ac-tive has long been an area of interest for researchersand swine producers. Almond and Dial (1987) summa-rized the pregnancy diagnosis techniques available toproducers, including the use of various ultrasoundtechniques. The ideal pregnancy test as described byAlmond and Dial (1987) has high accuracy (> 95%), lowprevalence (< 5%) of false positive and false negativeresults, is safe, simple, and inexpensive and providesresults within a few minutes. Researchers and clini-cians (Almond et al., 1985) defined accuracy of preg-nancy detection in terms of sensitivity (the ability todetect pregnant animals and reported as the propor-tion of pregnant animals that test positive) and speci-ficity (the ability to detect non-pregnant animals, mea-sured as the proportion of non-pregnant animals that
test negative). Because ultrasound offered the oppor-tunity to meet many of these targets a significant num-ber of research projects in the past 30 yr have beenconducted to study the efficacy of ultrasonic instru-mentation.
Doppler Ultrasound
Fraser and Robertson (1968) and Fraser et al. (1971)reported on the use of a fetal pulse detector or “Dopp-ler” device that consisted of an amplifier and trans-ducer. The amplifier converted the ultrasonic reflec-tions into audible signals, which in turn were used todetect pregnancy in swine and sheep. Doppler ultra-sound devices detect changes in frequency of the soundwaves as the sounds are reflected off moving objectssuch as blood flow, fetal movement, and gastrointesti-nal movement. Through analysis of the various soundswithin the pregnant uterus, researchers were able todetermine the distinct audible characteristics of thefetal heart, maternal pulsations, and fetal circulationfrom which a pregnancy status was diagnosed. TheDoppler devices were commonly placed on either sideof the rear flank, just above the teat line near thesecond and third last teats and angled toward theuterus or inserted rectally to detect pregnancy.
Fraser and Robertson (1968) reported 33 of 37 swinecorrectly diagnosed as pregnant when tested between6 and 13 wk postbreeding; three animals were wronglydiagnosed pregnant and one animal was incorrectlydiagnosed nonpregnant. McCaughey (1979) comparedDoppler ultrasound with vaginal biopsy at scheduledintervals between d 20 and 39 of pregnancy and con-cluded that the Doppler instrument studied was un-likely to be satisfactory before d 27 of gestation, al-though the majority of sows were diagnosed by d 35.McCaughey (1979) also noted the average time re-quired to diagnose a pregnancy was 3.0 min. Almondet al. (1985), in a report comparing Doppler with ampli-tude-depth ultrasound, reported both instrumentswere not reliable between d 15 and d 22 of gestation,the A-mode machine was more sensitive between d 23and d 45 than the Doppler device, but the Dopplerdevice had higher specificity of detecting nonpregnantfemales. Almond and Dial (1987) summarized thatDoppler instrumentation was subject to extraneoussounds such as fans and measurements taken nearfeeding time and they noted a large variation in accu-racy due to stage of gestation as well as significantdifferences in quality of instrumentation.
Amplitude-Depth (A-Mode) Ultrasound
A-mode (pulse echo) ultrasound is designed to detectand diagnose pregnancy based on the presence or ab-sence of a fluid-filled uterus. The fluid-filled sacs sur-rounding the developing embryo and fetus create afluid-filled void that is detected by the ultrasoundwaves and reported either on an oscilloscope, as an

Evolution of ultrasound use in swine E25
auditory signal, or as a light turned on when the fluid-filled voids are detected. The transducer is positionedin the rear flank area just above the teat line near thesecond to third last teat and angled anterior and dorsaltoward the opposite loin. Errors in transducer place-ment, including posterior angle, can result in false-positive results due to detection of a full urinary blad-der. Mycotoxins, such as zearalenone, and uterine in-fections can also create fluid accumulation and false-positive results (Almond and Dial, 1987).
Lindahl et al. (1975) reported results of a study uti-lizing A-mode technology using oscilloscope readouts.The results in laboratory and on-farm settings showedthat of 612 sows diagnosed pregnant, 608 farrowedand only 2% of sows diagnosed nonpregnant farrowed alitter when measured between 30 and 90 d of gestation.They indicated the optimal range for determination ofpregnancy with A-mode is from 30 to 90 d of gestation,below which not enough fluid is present in the uterusand beyond which fetal growth and reduced volumeof uterine fluids reduces accuracy. Almond and Dial(1986) reported A-mode devices fitted with a dioderuler was less accurate than an A-mode device withan oscilloscope for both sensitivity and specificity. Al-mond and Dial (1987) reported that, across studiesthey had summarized, A-mode devices tended to havehigher sensitivity but poorer specificity than Dopplerdevices, but they cautioned that variation in instru-mentation was also a significant concern with A-mode ultrasound.
B-Mode Ultrasound
The development of B-mode, real-time ultrasoundinstrumentation had a significant impact on the abilityto accurately detect pregnancy at early stages of gesta-tion. By visualizing the internal anatomy in two di-mensions on a video monitor, researchers and produc-ers have the ability to correctly position the transducerand allows for assurance of the nature of the fluid-filleduterus. Transducers used for reproductive purposesgenerally range in frequency from 3.5 to 7.0 MHz,depending on the penetration capabilities desired.Lower frequency probes allow for deeper penetrationand reduced image resolution and are often used whenprobing externally. Higher-frequency probes providehigh-resolution capabilities and are often used fortransrectal examination. Both linear and sector probesare commonly used in the reproductive assessment,with linear most commonly used in transrectal andsector probes used for transabdominal scanning.
Inaba et al. (1983) evaluated the use of a linear real-time ultrasound to detect pregnancy from d 18 through32 of gestation. Results indicated 13, 30, 73, 91, and100% of animals evaluated were correctly diagnosedas pregnant or nonpregnant at d 18, 19, 20, 21, and22+, respectively. Jackson (1986) evaluated 308 sowsbetween d 24 and 37 following mating using real-timeand indicated 100% (n = 23) of animals diagnosed as
nonpregnant were correctly identified and 99% (282 of285) of sows diagnosed pregnant farrowed or aborted,confirming pregnancy. Woodard et al. (1994) reportedsuccess with real-time ultrasound as early as 22 dfollowing mating. In a second report using field data,Woodard et al. (1995) reported 74.5% accuracy for cor-rect pregnancy diagnosis between d 17 and 20 and anincrease to 97% on d 21 through d 58 of gestation.
Armstrong et al. (1997) compared the influence oftechnician and probe type/frequency on the sensitivity,specificity, and accuracy of real-time ultrasound at d21 after mating. One technician was found to be supe-rior to the second technician regardless of probe fre-quency; the superior technician expressed a highersensitivity (84.6 vs 68%), specificity (95.7 vs 88%), andhigher overall accuracy (89.9 vs 78%) when using a3.5-MHz sector probe, with overall accuracy increasingto 94.4% compared with 88.2% when using a 5.0-MHzlinear probe. Both technicians were found to have bet-ter success when using a 5.0-MHz linear probe com-pared with a 3.5-MHz sector probe.
Almond (1998), in a summary article, reported onadditional uses of ultrasound, including detection ofretained piglets at farrowing, assessment of fetal vital-ity, and counting the number of live and dead pigswithin the uterus. Belstra (2000) reported the use ofreal-time to diagnose reproductive problems such ascystic follicles or metritis within the uterus as well asopportunities to study follicular growth and ovulation,uterine involution, and embryonic development/mor-tality.
A number of factors have traditionally preventedwidespread adoption of real-time ultrasound on swinefarms, including, cost, reliability, and portability. His-torically, technological advances in ultrasonic instru-mentation occur first in human medicine and are grad-ually passed down to the animal industries, resultingin high initial cost and equipment that is not designedfor the environment in swine facilities. In recent years,as operation size has significantly increased, new real-time machines are being manufactured specifically foranimal use. This has resulted in more competition,lower investment costs, increased durability, and en-hanced design features. Of all the improvements, in-creased portability may be the most important featureof current real-time models. Battery-operated, light-weight ultrasound machines are now readily availableand with the addition of wrist-held monitors and visiongoggles, technicians are able to routinely pregnancy-check females at a very quick, yet accurate, pace. Fur-ther improvement in ultrasound resolution, currentmodels are now have 1,024 × 1,024 lines of resolution,will provide even more opportunities to improve repro-ductive efficiency in the future.
Implications
Ultrasound technology has had a profound impact onthe efficiency of production across the swine industry.

MoellerE26
Ultrasound applications continue to expand as theswine industry modifies management practices thataffect productivity and profitability. Large swinefarms routinely utilize ultrasound for pregnancy de-tection, condition scoring, and lean estimation, andseedstock producers rely on ultrasound to improve ge-netic merit for composition traits. Cost is the mainfactor limiting widespread, on-farm application of ul-trasound. However, purchase price continues to de-cline and ultrasound services are now common. Tech-nology advances will expand both research and com-mercial applications. The advances will initiate at thehuman medicine level and be passed down to the swineindustry. Improved resolution, refined probes, andcolor imaging capabilities promise to improve the func-tionality of ultrasound in the swine industry.
Literature Cited
Adams, J. P., I. T. Omtevedt, J. V. Whiteman, and J. E. Walters.1972. Live and carcass measurements as indicators of lean cutyield in swine. J. Anim. Sci. 35:25–30.
Ahlschewede, W. T., L. W. Olson, and T. E. Socha. 1978. New adjust-ment factors for performance testing. Nebraska Swine Rep.1978, Lincoln. pp 22–24.
Alliston, J. C., A. J. Kempster, M. G. Owen, and M. Ellis. 1982. Anevaluation of three ultrasonic machines for predicting bodycomposition of live pigs of the same breed, sex, and live weight.Anim. Prod. 35:165–169.
Almond, G. W. 1998. Clinical reproduction in the sow: Integratingnew technology with stockmanship. In: Proc. 15th Int. Pig Vet.Soc. Congr., Birmingham, U.K. pp 33–44.
Almond, G. W., W. T. K. Bosu, and G. J. King. 1985. Pregnancydiagnosis in swine: A comparison of two ultrasound instru-ments. Can. Vet. J. 26:205–208.
Almond, G. W., and G. D. Dial. 1986. Pregnancy diagnosis in swine:A comparison of the accuracies of mechanical and endocrinetests with return to estrus. J. Am. Vet. Med. Assoc.189:1567–1571.
Almond, G. W., and G. D. Dial. 1987. Pregnancy diagnosis in swine:Principles, applications, and accuracy of available techniques.J. Am. Vet. Med. Assoc. 191:858–870.
Anderson, L. M., and R. C. Wahlstrom. 1969. Ultrasonic predictionof swine carcass composition. J. Anim. Sci. 28:593–600.
Armstrong, J. D., K. D. Zering, S. L. White, W. L. Flowers, T. O.Woodard, M. B. McCaw, and G. W. Almond. 1997. Use of real-time ultrasound for pregnancy diagnosis in swine. In: Proc.28th Annu. Mtg. Am. Assoc. Swine Practitioners, Quebec City,Canada. pp 195–202.
Bates, R. O., L. L. Christian, E. Dotson, E. Fugate, T. Klaustermeier,and B. Zierke. 1994. The National Swine Improvement Federa-tion (NSIF) ultrasound certification program. J. Anim. Sci.72(Suppl. 2):48 (Abstr.).
Belstra, B. 2000. Reproductive uses of ultrasonography in swinebreeding herds: Present and future applications. In: Proc. NorthCaroline Healthy Hogs Seminar, Greenville.
Busk, H. 1986. Testing of five ultrasonic equipments for measuringof carcass quality on live pigs. World Rev. Anim. Prod. 22:55–65.
Christian, L. L., and S. J. Moeller. 1990. Current status of real-timeultrasound research. In: Proc. North Am. Swine ImprovementConf., Des Moines, IA. pp 19–25.
Cisneros, F., M. Ellis, K. D. Miller, J. Novakofski, E. R. Wilson, andF. K. McKeith. 1996. Comparison of transverse and longitudi-nal real-time ultrasound scans for prediction of lean cut yieldsand fat-free lean content in live pigs. J. Anim. Sci. 74:2566–2576.
Claus, A. 1957. The measurement of natural interfaces in the pig’sbody with ultrasound. Fleischwirtschaft 9:552–557.
Cooksley, M., and P. J. Cunningham. 1977. Backfat thickness andweight. Nebraska Swine Rep. 1977, Lincoln. pp 23–25.
Cox, D. F. 1963. Breed and sex effects on the relationship betweenweight and fatness measured at a constant age in swine. J.Anim. Sci. 22:1091–1092.
Forrest, J. C., A. P. Schinckel, M. W. Orcutt, M. D. Judge, and J.R. Stouffer. 1986. Accuracy of measuring body composition inthe live animal and carcass. In: Proc. Natl. Swine ImprovementFed. Conf., St. Louis, MO. pp 27–32.
Fraser, A. F., V. Nagartnam, and R. B. Callicott. 1971. The compre-hensive use of Doppler Ultra-sound in Farm Animal Reproduc-tion. Vet. Rec. 104:255–258.
Fraser, A. F., and J. G. Robertson. 1968. Pregnancy diagnosis anddetection of foetal life in sheep and pigs by and ultrasonicmethod. Br. Vet. J. 124:239–243.
Hansen, L. H., and I. J. Christiansen. 1976. The accuracy of porcinepregnancy diagnosis by a newly developed ultrasonic A-scantester. Br. Vet. J. 132:66–67.
Hazel, L. N., and E. A. Kline. 1952. Mechanical measurement offatness and carcass value on live hogs. J. Anim. Sci. 11:313–318.
Hazel, L. N., and E. A. Kline. 1959. Ultrasonic measurements offatness in swine. J. Anim. Sci. 18:815–819.
Houghton, P. L., and L. M. Turlington. 1992. Application of ultra-sound for feeding and finishing animals: A review. J. Anim.Sci. 70: 930–941.
Inaba, T., Y. Nakazima, N. Matsui, and T. Imori. 1983. Early preg-nancy diagnosis in sows by ultrasonic linear electronic scan-ning. Theriogenology 20: 97–101.
Jackson, G. H. 1986. Pregnancy diagnosis in the sow using real-time ultrasonic scanning. Vet. Rec. 119:90–91.
Kanis, E., H. A. M. Van Der Steen, K. De Roo, and P. N. De Groot.1986. Prediction of lean parts and carcass price from ultrasonicbackfat measurements in live pigs. Livest. Prod. Sci. 14:55–63.
Lindahl, I. L., J. P. Totsch, P. A. Martin, and P. J. Dziuk. 1975.Early diagnosis of pregnancy in sows by ultrasonic amplitude-depth analysis. J. Anim. Sci. 40:220–222.
Liu, Y., and J. R. Stouffer. 1995. Pork carcass evaluation with anautomated and computerized ultrasonic system. J. Anim. Sci.73:29–38.
Lopes, D. M., S. A. Williamson, J. A. Jacobs, and M. W. Thomas.1987. Estimation of fat depth and longissimus muscle area inswine by the use of real time ultrasonography. J. Anim. Sci.65(Suppl. 1):512. (Abstr.).
McCaughey, W. J. 1979. Pregnancy diagnosis in sows: A comparisonof the vaginal biopsy and doppler ultrasound techniques. Vet.Rec. 104:255–258.
McLaren, D. G., F. M. McKeith, and J. Novakofski. 1989. Predictionof carcass characteristics at market weight from serial real-time ultrasound measures of backfat and loin eye area in thegrowing pig. J. Anim. Sci. 67:1657–1667.
McLaren, D. G., J. Novakofski, D. F. Parrett, L. L. Lo, S. D. Singh,K. R. Neumann, and F. K. McKeith. 1991. A study of operatoreffects on ultrasonic measures of fat depth and longissimusmuscle area in cattle, sheep and pigs. J. Anim. Sci. 69:54–66.
Mersmann, H. J. 1982. Ultrasonic determination of backfat depthand loin area in swine. J. Anim. Sci. 54:268–275.
Mersmann, H. J. 1984. Accretion of fat and muscle in growing swineas assessed by ultrasonic methods. J. Anim. Sci. 58:324–330.
Meyer, W. E., W. G. Moody, G. D. Hunziger, T. P. Ringkob, M. A.Alexander, S. E. Zobrisky and H. B. Dedrick. 1966. Applicationof ultrasonic techniques in live animal and carcass evaluation.Univ. of Missouri, Columbia. Res. Bull. 905.
Moeller, S. J. 1990. Serial real-time ultrasonic evaluation of fatand muscle deposition in market hogs. M.S. thesis. Iowa StateUniv., Ames.
Moeller, S. J., and L. L. Christian. 1998. Evaluation of the accuracyof real-time ultrasonic measurements of backfat and loin mus-cle area in swine using multiple statistical analysis procedures.J. Anim. Sci. 76:2503–2514.

Evolution of ultrasound use in swine E27
Moeller, S. J., L. L. Christian and R. N. Goodwin. 1998. Developmentof adjustment factors for backfat and loin muscle area fromserial real-time ultrasonic measurements on purebred lines ofswine. J. Anim. Sci. 76:2008–2016.
Noffsinger, T. L., F. N. Andrews, and V. L. Anderson. 1959. The rateof fat deposition in four lines of swine. J. Anim. Sci. 18:127–133.
Price, J. F., A. M. Pearson, H. B. Pfost, and R. J. Deans. 1960a.Application of ultrasonic reflection techniques in evaluatingfatness and leanness in pigs. J. Anim. Sci. 19:381–387.
Price, J. F., A. M. Pearson and J. A. Emerson. 1960b. Measurementof the cross sectional area of the loin eye muscle in live swineby ultrasonic reflections. J. Anim. Sci. 19:786–792.
Quijandria, B., Jr., and O. W. Robison. 1971. Body weight and back-fat deposition in swine: Curves and correction factors. J Anim.Sci. 33:911–918.
Robinson, D. L., C. A. McDonald, K. Hammond, and J. W. Turner.1992. Live animal measurement of carcass traits by ultrasound.Assessment and accuracy of sonographers. J. Anim. Sci.70:1667–1676.
Sather, A. P., H. T. Fredeen, and A. H. Martin. 1982. Live animalevaluation or two ultrasonic probes as estimators of subcutane-ous backfat and carcass composition in pigs. Can. J. Anim. Sci.62:943–954.
Sather, A. P., A. K. W. Tong, and D. S. Harbison. 1986. A study ofultrasonic probing techniques for swine. I. The effect of opera-tor, machine, site. Can. J. Anim. Sci. 66:591–598.
Smith, B. S., W. R. Jones, J. D. Hough, D. L. Huffman, W. B. Mikel,and D. R. Mulvaney. 1992. Prediction of carcass characteristicsby real-time ultrasound in barrows and gilts slaughtered atthree weights. J. Anim. Sci 70:2304–2308.
Stouffer, J. R., M. V. Valentine, G. H. Wellington, and A. Diekmann.1961. Development and application of ultrasonic methods formeasuring fat thickness and rib eye area in cattle and hogs.J. Anim. Sci. 20:759–767.
Tess, M. W., G. E. Dickerson, J. A. Nienaber, and C. L. Ferrell.1986. Growth, development and body composition in three ge-netic stocks of swine. J. Anim. Sci. 62:968–979.
Turlington, L. M. 1990. Live animal evaluation of swine and sheepusing ultrasonics. M.S. thesis. Kansas State Univ., Manhattan.
Wild, J. J. 1950. The use of ultrasonic pulses for the measurement ofbiological tissues and the detection of density changes. Surgery27:183–188.
Woodard, T. O., J. D. Armstrong, G. W. Almond, and M. B. McCaw.1994. Real-time ultrasound for pregnancy diagnosis in sows andgilts. In: Proc. North Carolina Healthy Hogs Seminar, Raleigh.Available at: http://mark.asci.ncsu.edu/HealthyHogs/book1994/woodard.htm. Accessed July 2001.
Woodard, T. O., S. L. White, W. L. Flowers, G. W. Almond, M. B.McCaw, and J. D. Armstrong. 1995. Real-time ultrasound asan enhanced means of pregnancy diagnosis in swine. 1995Annu. Rep., Dept. of Anim. Sci., Coll. of Agric. and Life Sci.,North Carolina State Univ., Raleigh.

Role of placental function in mediating conceptus growth and survival1,2
M. E. Wilson3
Division of Animal and Veterinary Science, West Virginia University, Morgantown 26506-6108
ABSTRACT: Conceptus mortality is a significant fac-tor limiting reproductive efficiency of livestock. In bothsinglet- (i.e., cattle) and litter- (i.e., pigs and sheep)bearing species, investigations of conceptus mortalityhave focused on the period immediately preceding andthroughout the attachment phase, around the time ofmaternal recognition of pregnancy. Recently, data haveemerged leading to the suggestion that conceptus losslater in gestation is also significant and that variationin placental size and function may play a very im-portant part in determining whether a conceptus sur-vives. In the pig, the number of conceptuses presentafter the initial period of loss that survive to term ap-pears to be influenced by the total amount of placentalmass present, such that litters containing individualswith relatively small placentae have a greater potentialfor a large litter size when compared with litters con-taining similar numbers of individuals with relativelylarge placentae. In ruminants, recent evidence supportsthe time of placental development and initial vasculari-
Key Words: Conceptus Survival, Placental Function, Reproductive Efficiency
2002 American Society of Animal Science. All rights reserved. J. Anim. Sci. 80(E. Suppl. 2):E195–E201
Introduction
A major limitation to the reproductive efficiency oflivestock species is the loss of conceptuses during gesta-tion (Edey, 1969; Short, 1984; Rohrer et at, 1999). His-torically, the peri-implantation period has been identi-fied as a period of significant conceptus loss in swine(Corner, 1923; Perry, 1954; Scofield, 1972), cattle (Ham-mond, 1914; Hanly, 1961), and sheep (Boshier, 1969;Guillomot et al., 1981). The peri-implantation period ischaracterized by dramatic morphological changes in the
1Journal paper published with the approval of the Director ofAgricultural and Forestry Experiment Station, West Virginia Univer-sity, as scientific paper No. 2797.
2The author would like to sincerely thank S. P. Ford for his guid-ance and critical role in much of the work presented here and E. K.Inskeep for his support and continued guidance.
3Correspondence: G048 Agricultural Science (phone: 304-293-2406, ext. 4425; fax: 304-293-2232; e-mail: [email protected]).
Received October 8, 2001.Accepted December 18, 2001.
E195
zation (between d 28 and 40) as a second period ofsignificant loss, particularly in situations involving ma-nipulation (ovulation synchronization for timed AI incattle and out-of-season breeding in sheep). In the pig,not only does placental size vary, but efficiency (as mea-sured by the ratio of fetal weight to placental weight)can also vary as much as threefold within a litter, lead-ing to the suggestion that selection for small, very effi-cient placentae may provide a mechanism for increas-ing litter size. In ruminants, there are obvious caseswhere placental growth has been markedly altered (i.e.,large offspring syndrome or heat stress) and a subse-quent deviation from “normal” placental efficiency oc-curs. Less information is available on normal variationin placental size and efficiency; however, the timing ofthe secondary period of loss supports a role for eventsduring placental development and vascularization be-ing critical to survival and potentially contributing tothe observed loss.
embryo, including elongation, and by the initiation ofan intimate attachment between the outer embryonicmembrane and the uterine luminal epithelium (Perryand Rowlands, 1962). The dramatic nature of thesedevelopmental stages has led to suggestions that lossesare a result of asynchronous development between theuterus and embryo, or among embryos within a litter(Dziuk, 1987). Conceptus loss during the peri-implanta-tion period is estimated at 30 to 40% in pigs (reviewedby Pope, 1994) and 20 to 30% in ruminants (reviewedby Zavy, 1994). Recently, evidence has emerged thatappreciable conceptus loss occurs during later gestation(Foxcroft, 1997; Wilson et al., 2000; Inskeep, 2001). Al-though conceptus loss during later gestation does notrepresent the largest component of total loss, it is sig-nificant and negatively impacts reproductive efficiencyin livestock species. This review will focus on the poten-tial role that variation in placental function may playin contributing to the variation in conceptus survivalobserved, and the implication of variations in placentalfunction with regard to growth and survival of theneonate.

WilsonE196
Conceptus Loss After Attachment
Pig
During the last 30 yr, evidence has accumulated thataround d 30 of gestation, the capacity of the uterusbecomes limiting. In cases where the number of em-bryos present during early gestation is increased (eitherby transfer of additional embryos to an already preg-nant female or by superovulation), embryos are lostduring the peri-implantation period in proportions sim-ilar to those in normal pregnancies (i.e., 30 to 40%),resulting in an increased number of conceptuses pres-ent after d 18. However, the additional conceptusessurviving beyond d 18 are lost after d 30 such thatsimilar numbers of conceptuses are present at term asobserved for control females (Fenton et al., 1972; Popeet al., 1972; Huang et al., 1987). Additionally, in sowsthat are unilaterally hysterectomized-ovariectomized,ovarian compensation will result in an ovulation ratesimilar to that of controls, with only one-half the uterinespace available. As with the experimental models thatincrease the number of embryos in an intact uterus,reducing the amount of uterine space results in a rela-tively stable proportion of embryos lost prior to d 30,with approximately one-half the normal number of con-ceptuses surviving to term (Christenson et al., 1987).Several recent investigations employing current com-mercial sow lines have reported relatively high ovula-tion rates (i.e., approximately 26; Foxcroft, 1997; Wilsonet al., 2000). As with females induced to have largenumbers of conceptuses by superovulation or superin-duction, these sows exhibit a 30 to 40% conceptus lossby d 25 of gestation (16 ± 1 viable conceptuses). Uterinecapacity then becomes limiting, and an additional 15%of the original number of potential conceptuses are lost(12 ± 1 viable conceptuses), confirming the notion thatuterine capacity becomes limiting sometime after d 30in animals without experimental intervention (Wilsonet al., 2000). More than 10 yr ago, the Meishan breedwas imported into the United States to examine thebiological underpinnings of its prolificacy (Bazer et al.,1988). Meishan gilts exhibit similar ovulation rates anduterine sizes to occidental breeds used for comparison(i.e., Yorkshire, Large White, and the USDA MARCwhite composite) while giving birth to three to five morepigs per litter (Christenson, 1993; Galvin et al., 1993;Lee et al., 1995). A component of the increased pro-lificacy is reduced peri-implantation conceptus mortal-ity (Ford, 1997). In addition to increasing the proportionof conceptuses that survive the peri-implantation pe-riod, a greater number of conceptuses are able to sur-vive to term. A major component of this increased pro-lificacy appears to be the reduced placental size of theMeishan conceptus as compared with the Yorkshireconceptus throughout gestation, allowing more concep-tuses to occupy a similar amount of space in utero (Ash-worth et al., 1990; Biensen et al., 1998; Wilson et al.,1998). This decreased placental size likely results from
a decreased preimplantation embryonic growth rate,leading to a decreased length of Meishan vs. Yorkshireembryos after elongation, and probably allows more ofthe embryos surviving to d 30 to colonize the uterus(Ashworth et al., 1990; Ford et al., 1994). Nutrient allo-cation to a conceptus would be expected to be reducedby the small size of the Meishan placenta; however,when Meishan and Yorkshire littermate conceptusesare cogestated in either a Meishan or Yorkshire uterineenvironment, the piglets will have similar birth weights(Wilson et al., 1998, 1999). The similarity in pigletweights in the face of marked differences in placentalsize appears to result from the markedly greater den-sity of blood vessels for nutrient uptake in the Meishanplacenta compared with the Yorkshire placenta duringthe final third of gestation (Biensen et al., 1998).
Ruminants
Current and emerging technologies to increase repro-ductive efficiency in ruminants include methodologiesto control the synchrony and timing of ovulation incattle to facilitate breeding management and reducelabor cost of estrus detection and the use of progestogentreatments to facilitate normal luteal function, improv-ing pregnancy rates to ram-induced out-of-seasonbreeding in sheep (Inskeep, 2001; Knights et al., 2001).The development and widespread use of transrectalultrasonography for the diagnosis of ovarian functionand pregnancy status very early in gestation (i.e., d 25of gestation) has allowed investigators to ascertain thepregnancy status of females very early on and to bettercharacterize conceptus loss. Recently, Inskeep (2001)summarized a number of current reports of significantconceptus loss in individuals assigned to timed AI proto-cols. The described pregnancy loss between approxi-mately d 25 and 40 to 70 of gestation was approximately15%, but varied widely among groups, ranging from 7.7to 45.9%. The key observation is that embryos appear tosurvive the early stages of gestation when gross geneticabnormalities would be expected to result in embryonicloss (Butcher and Fugo, 1967), but they die shortlyafter the transition from the yolk sac as the source ofnutrition to the chorioallantoic placenta, supporting theidea that either abnormalities in the chorioallantoicplacenta or an inappropriate transition cause embryoloss. Unfortunately, there is a paucity of experimentaldata on this period of conceptus loss, and therefore wemust rely on educated speculation and hope, in theyears to come, to expand the observational data to in-clude experimentation.
Placentation
The major physiological developmental event that oc-curs during the early stages of gestation, after attach-ment, is the initial growth and development of the pla-centa, referred to as placentation. This very importantbiological phenomenon begins with the outgrowth from

Conceptus growth and survival E197
the embryonic hindgut of the allantois (Patten, 1948).The allantois will grow to fill the chorionic sac, fusingwith it to form the chorioallantoic portion of the fetalmembranes. Our guiding hypothesis has involved theas yet unsubstantiated notion that the size attained bythe chorion is directly proportional to the length theembryo attains during elongation and is limiting tothe size of the vascularized chorioallantoic membrane(Wilson and Ford, 2000). The apparent timing of theconceptus loss during the fourth to seventh week ofgestation in pigs, sheep, and cattle concurrent with theoutgrowth, fusion, and establishment of the chorioal-lantoic membrane is suggestive of at least a partial roleeither in all or some subset of embryonic loss. In thepig, as an example of the noninvasive placentation seenin livestock, placental weight increases exponentiallybetween d 20 and 60 of gestation (Pomeroy, 1960;Knight et al., 1977). The weight of the placenta in-creases steadily throughout the remainder of gestation(Pomeroy, 1960; Knight et al., 1977; Biensen et al.,1998). Several authors have argued that placentalweight does not change after 70 d of gestation; however,these authors all ceased measurement of placentalweight on or before 105 d of gestation, the time of theinitiation of the secondary increase (Knight et al., 1977;Vallet et al., 1996; Klemcke and Christenson, 1997).The surface area of the chorioallantoic membrance in-creases rapidly from d 35 to 70 (Knight et al., 1977).On d 35, the surface area is approximately 250 cm2,whereas by d 70, it is approximately 1,000 cm2 (Knightet al., 1977; Biensen et al., 1998). By d 60 to 70 ofgestation, there exists an interlocking network of fetaland maternal microvilli, furthering the massive ex-hange surface of the placenta (Friess et al., 1980; Bjork-man and Dantzer, 1987; Biensen et al., 1998). From d70 to 100, there is little change in placental surfacearea (Knight et al., 1977). However, sometime after d100, there is a marked increase in the surface area of theplacenta, reaching approximately 1,500 cm2 (Biensen etal., 1998), or even doubling in size by d 110 (Wigmoreand Strickland, 1985).
In sheep, the allantois first appears on d 14 to 15 ofgestation and expands to fill the extraembryonic space,eventually fusing with and vascularizing the chorion,giving rise to the chorioallantoic membrane. The em-bryo will begin to interact with the uterine luminalepithelium once it has completed elongation via looseattachments, initially in the region of the embryonicdisk, but soon spreading to the remainder of the chori-onic membrane (Guillomot et al., 1981; King, 1993).This attachment initially occurs throughout the chorio-allantoic surface (Guillomot et al., 1981). Between d 16to 18 of gestation, the portions of the chorioallantoicmembrane overlying the caruncles (specialized struc-tures dispersed throughout the uterine lining for nutri-ent and waste product exchange between the maternaland conceptus compartments) begin to interdigitatewith the caruncular epithelium. This initial interactionof the chorioallantoic membrane with the underlying
caruncle begins in the region immediately surroundingthe embryonic disk and spreads from there, similarto the case for the initial loose attachment (Perry, 1981).
Further development of the caruncle and the associ-ated chorioallantoic membrane (to be called the cotyle-don) will result in the development of a mature placen-tome (Bjorkman and Dantzer, 1987). The placentomeswill account for the majority of blood flow to the graviduterus by term (Reynolds and Redmer, 1995). Cotyle-dons will first develop simple villi that fill the cryptsfound in the caruncles, forming an initial adherenceto the uterine lining. These villi proliferate, formingcomplex structures coursing throughout the caruncle,which, now activated, will increase in size dramaticallyduring gestation (Stegeman, 1974). Lining the placento-mal crypts are large binucleated cells, possibly a fusionproduct of the caruncular and cotyledonary epithelia ora result of chorionic epithelial cells that have undergonekaryokinesis without cytokinesis. In the regions be-tween placentomes, the chorionic epithelium loosely ad-heres to the endometrial epithelium, except over theuterine glands where areolae (specialized structures forthe absorption of uterine glandular secretions) form(Guillomot, 1981).
Placental Efficiency
Placental efficiency has been described for a numberof species as simply the weight of the fetal componentof the conceptus divided by the weight of the placentalcomponent (Molteni et al., 1978; Kurz et al., 1999).Although this view of placental function does not takeinto account, or do justice to, the complexity and diver-sity of mechanisms involved in nutrient (Dantzer, 1982;Battaglia, 1986; Sibley et al., 1997), gas and waste (Car-ter, 1989) exchange between the conceptus and the ma-ternal system (Davies, 1960; Faber and Thornburg,1986; Munro, 1986), its simplistic nature allows for sig-nificant, repeatable variations in placental function tobe described. As mentioned above, one of the strikingdifferences between the Meishan pig and the occidentalbreeds to which it was compared is the substantial re-duction in placental size. Throughout gestation, theMeishan pig exhibits a reduced placental size in con-junction with a reduced embryonic size prior to elonga-tion. Evidence from studies with the pig support thesuggestion that the early development of the embryohas long-term impacts on conceptus growth and devel-opment (Ford, 1997; Wilson et al., 1998; Wilson andFord, 2000). Embryos of the Meishan breed exhibit amarkedly slower growth rate throughout the preim-plantation period, elongate to a shorter length aroundd 12 of gestation, and have a markedly smaller placentathroughout the remainder of gestation when comparedwith commercial breeds (Ford, 1997; Wilson et al.,1998). The slower growth rate of the Meishan embryohas been attributed to a dramatically slower prolifera-tion of the cells of the trophectodermal layer and isevident as early as d 6 of gestation, as measured by a

WilsonE198
reduced number of trophectoderm cells per inner cellmass cell (Rivera et al., 1997). Slower growth continuesthrough d 12 of gestation, as measured by a reducedapparent mitotic rate in the trophectoderm (Wilson andFord, 1997). Slower proliferation of the trophectodermis consistent with the observed smaller placental sizeas the trophectoderm will become the outer layer of thethe chorioallantoic membrane. In association with thereduced early embryonic growth rate, the Meishan hasa markedly lower uterine luminal content of a numberof histotrophic components, including IGF-I (Wilsonand Ford, 1997). Additionally, treatment of early d-5 to-6 pig embryos with insulin (an IGF-I receptor agonist)resulted in a increased embryonic diameter following24 h of culture, consistent with a role for the IGF systemin modulating very early embryonic growth (Lewis etal., 1992). In an effort to understand better the role ofplacental size and function in pigs, a series of experi-ments was conducted to determine the contributions ofboth the conceptus and the maternal environment inestablishing the size and function of the placenta. Sev-eral of these experiments involved cotransfer of Meis-han and Yorkshire embryos to a common uterine envi-ronment to facilitate direct comparison of littermateMeishan and Yorkshire conceptuses. The pivotal exper-iment focusing attention on placental function as a keycomponent in conceptus survival involved cotransfer ofMeishan and Yorkshire embryos on d 2 of gestation toYorkshire recipient females, which were then allowedto farrow. At term, Meishan and Yorkshire pigs wereborn at similar weights, with Meishan pigs attached toplacentae approximately two-thirds the size of theirYorkshire littermates. Notably, the Meishan placentaeexhibited an apparently greater vascular densitythroughout the chorioallantoic membrane. This conceptof variation in placental vascularity contributing to thevariation in placental size and function has a long his-tory, dating back at least to the report of McKenzieand Bogart (1934) on the contribution of the size and“quality” (i.e., color, integrity, etc.) of cotyledons in theplacentae of lambs as an indicator of the thrift of thelambs. Recently, Reynolds and Redmer (2001) againaffirmed the concept that the appropriate growth anddevelopment of the placenta is paramount for the suc-cess of gestation. Measures of poor placental function(oxygen delivery to the conceptus), as well as experi-mental models including carunculectomy and heatstress that establish poor placental function, are evi-dent very early on in gestation, prior to the dramaticexponential increase in fetal weight during the finalone-third of gestation, supporting the notion that ab-normal placental function leads to abnormal fetalgrowth.
The longstanding assumption that restriction of pla-cental growth can force an increase in placental effi-ciency has recently been questioned (Ott et al., 1997).There is no doubt that in cases of massive reductionsin placental size as a result of intense uterine crowding,carunculectomy or heat stress can force the placenta to
maximize its efficiency, but there is also evidence thatunder reasonably normal situations, the efficiency ofthe placenta has a strong conceptus-directed compo-nent. In the pig, studies employing estrogen adminis-tration to pregnant Meishan gilts around the time ofelongation, in an attempt to increase uterine luminalgrowth factors and therefore conceptus size, resultedin marked increases in placental size with no reductionin placental efficiency (Wilson and Ford, 2000). Addi-tionally, in Meishan × Yorkshire F1 crosses, the placen-tal efficiency of the crossbred offspring was intermedi-ate to that of the straightbred Meishan and Yorkshire(Biensen et al., 1999). Ott et al. (1997) demonstratedthat restricting sheep conceptuses to a single uterinehorn decreased placental size without increasing pla-cental efficiency.
Vascular Development of the Placenta
As early as d 18 of gestation in the pig and sheepand by d 22 to 24 of gestation in the cow, the allantoicmembrane fuses with the chorion and the blood vesselsof the newly formed chorioallantoic membrane will be-gin to proliferate (Reynolds and Redmer, 2001). In ru-minants, discrete areas of fetal maternal interactiondevelop between the permanent caruncles dispersedthroughout the uterine lining and the ephemeral cotyle-dons. The cotyledon begins as a focal point of vascularproliferation in the chorioallantoic membrane overlyingcaruncles. From this point of proliferation, villi willdevelop and interdigitate with the crypts of the carun-cle. In sheep, the density of blood vessels in the cotyle-don remains relatively constant through approximatelyd 80 of gestation, at which point the cotyledonary bloodvessel density increases linearly through 140-plus daysof gestation (Reynolds and Redmer, 2001). In pigs, thedensity of blood vessels in the chorioallantoic mem-brane is relatively constant from d 25 to 45 of gestationand begins increasing linearly between d 45 and 70,continuing this increase until term (Vonnahme et al.,2001). An important component in the function of theplacenta during gestation is the development of a suffi-cient absorptive area, not only in the physical size ofthe placenta, but also in the number and density ofblood vessels for nutrient exchange (Friess et al., 1980;Leiser and Dantzer, 1988; Reynolds and Redmer, 1995).By d 70 of gestation, the placental vasculature accountsfor approximately 3.7% of the total volume of the chorio-allantoic membrane (Biensen et al., 1998). The densityof blood vessels will remain relatively constant duringlate gestation, occupying 3% of chorioallantoic mem-brane volume by d 90 and 2.5% of chorioallantoic mem-brane volume by d 110 (Biensen et al., 1998). Further-more, Wilson et al. (1998) reported that in farrowedplacentae, the vascular volume was approximately 4%of placental volume. Pigs, sheep, and cattle are all de-scribed as having a noninvasive placentation, whichlimits placental function to the rate of both uterineand placental (umbilical) blood flow (Carter and Myatt,

Conceptus growth and survival E199
1995). It is worthwhile to note that although placentaein the livestock species are not invasive, they can bevery efficient, especially with respect to freely diffusablenutrients, such as oxygen and carbon dioxide, as thedistance between maternal and fetal endothelial cellmembranes separating fetal and maternal blood is re-duced to approximately 2 �m (Friess et al., 1980, 1982).
The extreme nature of vascular growth and prolifera-tion in the placenta, particularly during the later stagesof gestation, has made it a tissue of interest for investi-gators interested in angiogenesis, or the developmentof new blood vessels from existing ones (Barcroft, 1946;Wallace, 1948; Alexander, 1964). A number of growthfactors, several with an affinity for heparin, have beendescribed to promote or enhance one of the three maincomponents of angiogenesis: migration, proliferation,and/or tube formation (Cheung, 1997). One of the mostpotent of these angiogenic factors is vascular endothe-lial growth factor (VEGF; Ferrara et al., 1992). Theplacenta of the sheep produces VEGF and the placen-tome and intercotyledonary tissue are the predominantsites of synthesis in the gravid uterus (Millaway etal., 1989; Reynolds and Redmer, 1995; Reynolds andRedmer, 2001). The density of microvasulature in thecotyledon is relatively constant from d 40 to 80 of gesta-tion, followed by a marked (i.e., 8- to 10-fold), linearincrease in cotyledonary vascular density from d 80until near term in the ewe (Stegeman, 1974). Placentalangiogenesis in the last one-half to one-third of gesta-tion is credited for allowing placental (or umbilical)blood flow to continue to increase until term in the faceof a lack of increase in placental size or surface area(Reynolds and Redmer, 1995). Observed increases inoxygen extraction from uterine blood in the sheep havebeen attributed primarily to increases in umbilicalblood flow as opposed to any increase in extraction effi-ciency (Reynolds and Redmer, 1995). An increase in thesurface area available for transfer would likely allow forgreater increases in placental function during periodsof extremely rapid fetal growth. The pig placenta alsosynthesizes VEGF in the chorionic epithelium veryearly on in gestation (i.e., d 25; Winther et al., 1999;Vonnahme et al., 2001). This production has been dem-onstrated at the mRNA level as well as the proteinlevel (Winther et al., 1999; Vonnahme et al., 2001).Vonnahme et al. (2001) demonstrated that the amountof VEGF expressed by the fetal membranes increasesduring gestation, in a manner very similar to the pat-tern of vascular development mentioned above. The ex-pression of VEGF by the pig placenta is correlated withplacental efficiency, likely as a result of the correlationsthat exist between VEGF expression and the vasculardensity of both the placenta and the underlying endo-metrium (Vonnahme et al., 2001).
Variation in Placental Efficiency
In the pig, variation in the efficiency of the placentais marked by as much as threefold variation within
individual litters (Wilson et al., 1999). This tremendousvariation led Wilson et al. (1999) to select both boarsand gilts that had developed on either large, relativelyinefficient placentae or small, relatively efficient pla-centae. When these boars and gilts were mated withinplacental efficiency category, the offspring exhibited apattern of placental efficiency similar to that exhibitedby their sire and dam. In addition to the divergentresponse of the offspring in placental efficiency, thoseindividuals that were selected for a small, efficient pla-centa gave birth to approximately three more pigs perlitter than the individuals selected for large relativelyinefficient placentae (Wilson et al., 1999). These resultsled to the suggestion that uterine capacity is not ade-quately described by simply the number of offspringcarried to term, but better described by the total placen-tal mass a female can carry to term. Defining uterinecapacity in such a way allows for variation in litter sizeas a result of variation in placental efficiency in caseswhere uterine size is similar. In other words, the num-ber of conceptuses surviving to term is a combinationof either physical or physiological uterine size and pla-cental size.
The realized heritability of placental efficiency calcu-lated from the selection experiment employing placen-tal efficiency was 0.37 (Wilson et al., 1999). Recently,Vallet et al. (2001) failed to find an increase in placentalefficiency in unilaterally hysterectomized-ovariecto-mized gilts selected for uterine capacity (simply mea-sured as number of conceptuses) compared with unse-lected controls. Those authors did observe an increasein placental efficiency in the line selected for ovulationrate. More importantly, in the 422 litters that werecollected across all three lines, the heritablility of pla-cental efficiency was noteworthy for a reproductive trait(0.29 ± 0.08; Vallet et al., 2001), particularly when com-pared with reported heritabilities for uterine capacityand litter size (0.09, Young et al., 1996, and 0.16, Her-tzer et al., 1940, respectively).
A key component of placental efficiency gleaned fromresults of studies with pigs throughout gestation, in-cluding long before fetal growth markedly outpaces pla-cental growth, is that there is no association betweenfetal weight and placental efficiency. However, there isa strong negative correlation between placental weightand placental efficiency (Biensen et al., 1999; Wilson etal., 1999, 2000). These associations, or the lack thereof,have been interpreted to suggest that both large andsmall fetuses can develop on either a small or largeplacenta, but that generally a small placenta is efficientand a large placenta is inefficient.
Implications
Conceptus mortality at any stage of gestation reducesreproductive efficiency, either by decreasing litter sizein pigs and sheep or by eliminating pregnancy alto-gether. Placental efficiency appears to influence thenumber of conceptuses than can survive in a given uter-

WilsonE200
ine space and may also influence the survival of a givenconceptus in the absence of uterine crowding. A greaterunderstanding of the physiological components associ-ated with conceptus loss should provide the infrastruc-ture necessary to implement strategies to minimizeloss.
Literature Cited
Alexander, G. 1964. Studies on the placenta of sheep. Placental size.J. Reprod. Fertil. 7:289–298.
Ashworth, C. J., C. S. Haley, R. P. Aitken, and I. Wilmut. 1990.Embryo survival and conceptus growth after reciprocal embryotransfer between Chinese Meishan and Landrace × Large Whitegilts. J. Reprod. Fertil. 90:595–603.
Barcroft, J. 1946. Researches on Pre-Natal Life. Charles C. Thomas,Springfield, IL.
Battaglia, F. C. 1986. Placental transport and utilization of aminoacids and carbohydrates. Fed. Proc. 45:2508–2512.
Bazer, F. W., W. W. Thatcher, F. Martinat-Botte, and M. Terqui. 1988.Conceptus development in Large White and prolific ChineseMeishan pigs. J. Reprod. Fertil. 84:37–42.
Biensen, N. J., M. E. Wilson, and S. P. Ford. 1998. The impact ofeither a Meishan or Yorkshire uterus on Meishan or Yorkshirefetal and placental development to days 70, 90, and 110 of gesta-tion. J. Anim. Sci. 76:2169–2176.
Biensen, N. J., M. E. Wilson, and S. P. Ford. 1999. The impacts ofuterine environment and fetal genotype on conceptus size andplacental vascularity during late gestation in pigs. J. Anim. Sci.77:954–959.
Bjorkman, N., and V. Dantzer. 1987. Placentation. Pages 340–360in Textbook of Veterinary Histology. 3rd ed. H.-D. Dellmann,and E. M. Brown, ed. Lea & Febiger, Philadelphia, PA.
Boshier, D.P. 1969. A histological and histochemical examination ofimplantation and early placentome formation in sheep. J. Re-prod. Fertil. 19:51–61.
Butcher, R. L., and N. W. Fugo. 1967. Overripeness and the mamma-lian ova. II. Delayed ovulation and chromosome abnormalities.Fertil. Steril. 18:297–302.
Carter, A. M. 1989. Factors affecting gas transfer across the placentaand the oxygen supply to the fetus. J. Dev. Physiol. 12:305–322.
Carter, A. M., and L. Myatt. 1995. Control of placental blood flow:Workshop report. Reprod. Fertil. Dev. 7:1401–1406.
Cheung, C. Y. 1997. Vascular endothelial growth factor: possible rolein fetal development and placental function. J. Soc. Gynecol.Invest. 4:169–177.
Christenson, R. K. 1993. Ovulation rate and embryonic survival inChinese Meishan and White crossbred pigs. J. Anim. Sci.71:3060–3066.
Christenson, R. K., K. A. Leymaster, and L. D. Young. 1987. Justifica-tion of unilateral hysterectomy-ovariectomy as a model to evalu-ate uterine capacity in swine. J. Anim. Sci. 65:738–744.
Corner, G. W. 1923. The problem of embryonic pathology in mammals,with observations upon intra-uterine mortality in the pig. Am.J. Anat. 31:523–545.
Davies, J. 1960. Pages 19–52 in Survey of Research in Gestation andthe Developmental Sciences. Williams and Wilkins, Balti-more, MD.
Dantzer, V. 1982. Transfer tubules in the porcine placenta. Bibl.Anat. 22:144–149.
Dziuk, P. J. 1987. Embryonic loss in the pig: An enigma. J. L. Barnett,E. S. Batterham, and G. M. Cronin, ed. Pages 28–39 in Manipu-lating Pig Production, Australasian Pig Science Assoc., Wer-ribee, Victoria, Australia.
Edey, T. N. 1969. Prenatal mortality in sheep: A review. Anim. Breed.37:173–190 (Abstr.).
Faber, J. J., and K. L. Thornburg. 1986. Fetal nutrition: Supply,combustion, interconversion, and deposition. Fed. Proc.45:2502–2507.
Fenton, F. R., F. L. Schwartz, F. W. Bazer, O. W. Robison, and L. C.Ulberg. 1972. Stage of gestation when uterine capacity limitsembryo survival in gilts. J. Anim. Sci. 35:383–388.
Ferrara, N., K. Houck, L. Jakeman, and D. W. Leung. 1992. Molecularand biological properties of the vascular endothelial growth fac-tor family of proteins. Endocrinol. Rev. 13:1–18.
Ford, S. P. 1997. Embryonic and fetal development in different geno-types in pigs. J. Reprod. Fertil. 52(Suppl.):165–176.
Ford, S. P., L. K. Christenson, R. M. Rivera, and C. R. Youngs. 1994.Inhibitory effects of the Meishan uterus on growth rate andestradiol-17β (E2) secretion of day 30 conceptuses. Biol. Reprod.50(Suppl. 1):175.
Foxcroft, G. R. 1997. Mechanisms mediating nutritional effects onembryonic survival in pigs J. Reprod. Fert. 52(Suppl.):47–61.
Friess, A. E., F. Sinowatz, R. Skolek-Winnisch, and W. Trautner.1980. The placenta of the pig. I. Finestructural changes of theplacental barrier during pregnancy. Anat. Embryol 158:179–191.
Friess, A. E., F. Sinowatz, R. Slolek-Winnisch, and W. Trautner.1982. Structure of the epitheliochorial porcine placenta. Bibl.Anat. 22:140–143.
Galvin, J. M., I. Wilmut, B. N. Day, M. Ritchie, M. Thomson, and C.S. Haley. 1993. Reproductive performance in relation to uterineand embryonic traits during early gestation in Meishan, LargeWhite and crossbred sows. J. Reprod. Fert., 98:377–384.
Guillomot, M., J. E. Flechon, and S. Wintenberger-Torres. 1981. Con-ceptus attachment in the ewe: An ultrastructural study. Pla-centa 2:169–182.
Hammond, J. 1914. On some factors controlling fertility in domesticanimals. J. Agric. Sci. 6:263–277.
Hanly, S. 1961. Prenatal mortality in farm animals. J. Reprod. Fertil.2:182–194.
Hertzer, H. O., W. V. Lambert, and H. H. Zeller. 1940. Influence ofinbreeding and other factors on litter size in Chester Whiteswine. Circular 570:1-10. USDA, Washington, DC.
Huang, Y. T., R. K. Johnson, and G. R. Eckardt. 1987. Effect ofunilateral hysterectomy and ovariectomy on puberty. Uterinesize and embryo development in swine. J. Anim. Sci. 65:1298–1305.
Inskeep, E. K. 2001. Factors that affect embryonic survival in thecow: application of technology to improve calf crop. Pages 255–279 in Factors Affecting Calf Crop: Biotechnology of Reproduc-tion. M. J. Fields, R. J. Sand, and J. V. Yelich, ed. CRC Press,Boca Raton, FL.
King, G. J. 1993. Comparative placentation in ungulates. J. Exp.Zool. 266:588–602.
Klemcke, H. G. and R. K. Christenson. 1997. Porcine fetal and mater-nal adrenocorticotropic hormone and corticosteroid concentra-tions during gestation and their relation to fetal size Biol. Re-prod. 57:99–106.
Knight, J. W., F. W. Bazer, W. W. Thatcher, D. E. Franke, and H. D.Wallace. 1977. Conceptus development in intact and unilaterallyhysterectomized-ovariectomized gilts: Interrelations among hor-monal status, placental development, fetal fluids and fetalgrowth. J. Anim. Sci. 44:620–637.
Knights, M., T. D. Maze, P. J. Bridges, P. E. Lewis, and E. K. Inskeep.2001. Short-term treatment with a controlled internal drug re-leasing (CIDR) device and FSH to induce fertile estrus and in-crease prolificacy in anestrous ewes. Theriogenology 55:1181–1191.
Kurz, H., U. Zechner, A. Orth and R. Fundele. 1999. Lack of correla-tion between placenta and offspring size in mouse interspecificcrosses. Anal. Embryol. 200:335–343.
Lee, G. J., M. Ritchie, M. Thomson, A. A. Macdonald, A. Blasco, M.A. Santacreu, M. J. Argente, and C. S. Haley. 1995. Uterinecapacity and prenatal survival in Meishan and Large Whitepigs. Anim. Sci. 60:471–479.
Leiser, R., and V. Dantzer. 1988. Structural and functional aspectsof porcine placental microvasculature. Anat. Embryol.177:409–419.

Conceptus growth and survival E201
Lewis, A. M., P. L. Kaye, R. Lising, and R. D. A. Cameron. 1992.Stimulation of protein synthesis and expansion of pig blastocystsby insulin in vitro. Reprod. Fertil. Dev. 4:119–123.
McKenzie, F. F., and R. Bogart. 1934. The afterbirth as an index tothe thrift of the lamb. Proc. Am. Soc. Anim. Prod. 27:221–224.
Millaway, D. S., D. A. Redmer, J. D. Kirsch, R. V. Anthony, and L.P. Reynolds. 1989. Angiogenic activity of maternal and fetalplacental tissues of ewes throughout gestation. J. Reprod. Fertil.86:689–696.
Molteni, R. A., S. J. Stys, and F. C. Battaglia. 1978. Relationshipof fetal and placental weight in human beings: fetal/placentalweight ratios at various gestational ages and birth weight distri-butions. J. Reprod. Med. 21:327–334.
Munro, H. N. 1986. Role of the placenta in ensuring fetal nutrition.Fed. Proc. 45:2500–2501.
Ott, T. L., A. A. Wiley, and F. F. Bartol. 1997. Effects of stage ofgestation and uterine ligation on ovine placentome developmentand glycosaminoglycans. J. Anim. Sci. 75:1053–1062.
Patten, B. M. 1948. Embryology of the Pig. 3rd ed. McGraw-Hill BookCo., New York.
Perry, J. S. 1954. Fecundity and embryonic mortality in pigs. J.Embryol. Exp. Morphol 2:308–322.
Perry, J. S. 1981. The mammalian fetal membranes. J. Reprod. Fertil.62:321–335.
Perry, J. S., and I. W. Rowlands. 1962. Early pregnancy in the pig.J. Reprod. Fertil. 4:175–188.
Pomeroy, R. W. 1960. Infertility and neonatal mortality in the sowIII. Neonatal mortality and foetal development. J. Agric. Sci.54:31–56.
Pope, C. E., R. K. Christenson, V. A. Zimmerman-Pope, and B. N.Day. 1972. Effect of number of embryos on embryonic survivalin recipient gilts. J. Anim. Sci. 35:805–809.
Pope, W. F. 1994. Embryonic mortality in swine. Pages 53–72 inEmbryonic Mortality in Domestic Species. M. T. Zavy, and R.D. Geisert, ed. CRC Press, Boca Raton, FL.
Reynolds, L. P., and D. A. Redmer. 1995. Utero-placental vasculardevelopment and placental function. J. Anim. Sci. 73:1839–1851.
Reynolds, L. P., and D. A. Redmer. 2001. Angiogenesis in the placenta.Biol. Reprod. 64:1033–1040.
Rivera, R. M., C. R. Youngs, and S. P. Ford. 1997. A comparisonof the number of inner cell mass and trophectoderm cells ofpreimplantation Meishan and Yorkshire pig embryos at similardevelopmental stages. J. Reprod. Fertil. 106:111–116.
Rohrer, G. A., J. J. Ford, T. H. Wise, J. L. Vallet, and R. K. Chris-tenson. 1999. Identification of quantitative trait loci affectingfemale reproductive traits in a multigeneration Meishan-whitecomposite swine population J. Anim. Sci. 77:1385–1391.
Scofield, A. M. 1972. Embryonic mortality. Pages 367–383 in PigProduction. D. J. A. Cole, ed. Butterworths, London, U.K.
Short, R.V. 1984. Species differences in reproductive mechanisms.In Reproduction in Mammals, Vol. 4. C. R. Austin and R. V.Short, ed. Cambridge Univ. Press, Cambridge, U.K.
Sibley, C., J. Glazier, and S. D’Souza. 1997. Placental transporteractivity and expression in relation to fetal growth. Exp. Physiol.82:389–402.
Stegeman, J. H. J. 1974. Placental development in the sheep and itsrelation to fetal development. Contrib. Zool. 44:3–14.
Vallet, J. L., R. K. Christenson, and W. J. McGuire. 1996. Associationbetween uteroferrin, retinol-binding protein, and transferrinwithin the uterine and conceptus compartments during preg-nancy in swine. Biol. Reprod. 55:1172–1178.
Vallet, J. L., K. A. Leymaster, J. P. Cassady, and R. K. Christenson.2001. Are hematocrit and placental selection tools for uterinecapacity in swine? J. Anim. Sci. 79(Suppl. 1):64.
Vonnahme, K. A., M. E. Wilson and S. P. Ford. 2001. Role of vascularendothelial growth factor in modulating placental/endometrialvascularity in the pig. Biol. Reprod. 64:1821–1825.
Wallace, L. R. 1948. The growth of lambs before and after birth inrelation to the level of nutrition. Part III. Agric. Sci. 38:367–381.
Wigmore, P. K. C., and N. C. Strickland. 1985. Placental growth inthe pig. Anat. Embryol. 173:263–268.
Wilson, M. E., and S. P. Ford. 1997. Differences in trophectodermmitotic rate and P450 17α hydroxylase expression between latepreimplantation Meishan and Yorkshire conceptuses. Biol. Re-prod. 56:380–385.
Wilson, M. E., and S. P. Ford. 2000. Effect of estradiol-17β administra-tion during the time of conceptus elongation on placental sizeat term in the Meishan pig. J. Anim. Sci. 78:1047–1052.
Wilson, M. E., N. J. Biensen, C. R. Youngs, and S. P. Ford. 1998.Development of Meishan and Yorkshire littermate conceptusesin either a Meishan or Yorkshire uterine environment to day90 of gestation and to term. Biol. Reprod. 58:905–910.
Wilson, M. E., N. J. Biensen, and S. P. Ford. 1999. Novel insight intothe control of litter size in the pig, using placental efficiency asa selection tool. J. Anim. Sci. 77:1654–1658.
Wilson, M. E., K. A. Vonnahme, G. R. Foxcroft, G. Gourley, T. Wolff,M. Quirk-Thomas, and S. P. Ford. 2000. Characteristics of thereproductive biology of multiparous sows from a commerciallyrelevant population. J. Anim. Sci. 78(Suppl. 1):213.
Winther, H., A. Ahmed, and V. Dantzer. 1999. Immunohistochemicallocalization of vascular endothelial growth factor (VEGF) andits two specific receptors, Flt-1 and KDR, in the porcine placentaand non-pregnant uterus. Placenta 20:35–43.
Young, L. D., K. A. Leymaster, and R. K. Christenson. 1996. Opportu-nities for indirect selection for uterine capacity of swine J. Anim.Sci. 74(Suppl. 1):119.
Zavy, M. T. 1994. Embryonic mortality in cattle. Pages 79–98 inEmbryonic MortalIty In Domestic Species. M. T. Zavy, and R.D. Geisert, ed. CRC Press, Boca Raton, FL.

Biological basis of the ractopamine response
S. E. Mills2
Department of Animal Science, Purdue University, West Lafayette, IN 47907
ABSTRACT: The potential for beta-adrenergic recep-tor (βAR) agonists to modify growth rate and body com-position has been investigated for over 20 yr. Ractopam-ine was developed by Elanco Animal Health and is thefirst βAR ligand to be cleared for use in pigs in theUnited States, which occurred in 2000. Ractopamine isstructurally similar to the natural catecholamines epi-nephrine and norepinephrine and binds with high af-finity to βAR in pig adipose and muscle tissue. Thefamily of βAR, however, belongs to a much larger familyof structurally related G-protein coupled receptors(GPCR) and there is little or no information availableas to whether ractopamine binds and signals throughadditional GPCR. The question of whether βAR mediatethe growth response in pigs and other animals is notfully settled, but primary attention has been given tounderstanding how βAR might mediate increasedgrowth and protein accretion, and whether effects aredirect on adipose and muscle tissue or mediated bysecondary factors. Ractopamine is a racemic mixtureof four isomers resulting from two asymmetric carbons.The RR isomer (levorotatory at both carbons) has the
Key Words: Adipose Tissue, Beta-Adrenergic Agonists, Livestock, Muscle
2002 American Society of Animal Science. All rights reserved. J. Anim. Sci. 80(E. Suppl. 2):E28–E32
Introduction
Early reports of the effects of beta-adrenergic recep-tor (βAR) ligands on growth in rodents (Emery et al.,1984) and lambs (Baker et al., 1984) appeared nearly20 yr ago. Stock and Rothwell were investigating theanti-obesity effects of sympathomimetic drugs in ro-dents. These authors observed that whereas a nonselec-tive ligand reduced weight gain and body fat, a β2AR-selective ligand (clenbuterol) increased food intake,weight gain, and protein accretion (Emery et al., 1984).
1Journal paper no. 16690 of the Purdue Univ. Agric. Res. Prog.Presented in part at the 2001 IAAFSC Mtg. (J. Anim. Sci. 79[Suppl.1]:238 [Abstr.]).
2Correspondence: Lilly Hall (phone: 765-494-4845, fax: 765-494-9346; E-mail: [email protected]).
Received July 28, 2001.Accepted January 3, 2002.
E28
highest affinity for the pig β1AR and β2AR and Kd valuesare essentially equivalent for both subtypes (∼25 nM).Other isomers have from 3- to 600-fold lower affinity.The RR isomer appears to mediate the growth responsein rats and likely is the active isomer in pigs. Therefore,ractopamine can be considered nonselective in bindingto either the β1AR or β2AR in pigs. It is not known,however, whether the β3AR or additional subtypes maymediate a ractopamine response. Direct activation ofβAR in adipocytes promotes triglyceride hydrolysis anddecreases fatty acid and triglyceride synthesis, thusleading to less lipid accumulation. Fat accretion in pigsgiven ractopamine is not consistently reduced, whichmay result from βAR down-regulation. Ractopamineconsistently increases muscle protein accretion in pigs.Responses are maximal within the 1st wk and declinetoward zero over 4 to 6 wk. Curiously, βAR down-regu-lation is not significant in skeletal muscle. The mecha-nism responsible for increased protein accretion is notclear, but cumulative evidence points to a direct effect,possibly involving both protein synthesis and degra-dation.
Clenbuterol also increased protein accretion in lambs(Baker et al., 1984). Increased growth was not observedwith a β1-selective ligand in rodents (Emery et al., 1984;Convey et al., 1987). It cannot be expected, however,that the β2AR mediates the growth response in otherspecies because the distribution of βAR subtypes maywell differ. Increased protein accretion and leannesshave been observed in all livestock species, with cattleand sheep generally responding to a greater extent thanpigs, and pigs greater than chickens (Mersmann, 1998;Moody et al., 2000). That qualitative changes are simi-lar across species suggests a common mechanism ofaction, although differences between species may indi-cate a more complex model. Insight into the mechanismof βAR-mediated growth is obtained by comparing theresponses of βAR ligands and somatotropin, which ex-hibits a similar net increase in protein accretion (Nossa-man et al., 1991). Ractopamine and other phenethano-lamines typically increase carcass dressing percentagein pigs, whereas somatotropin decreases this parame-

Biology of ractopamine E29
ter. This difference reflects the selective effect of phe-nethanolamines on skeletal muscle vs the generalgrowth enhancement and greater effect on organgrowth by somatotropin. The combination of ractopam-ine and somatotropin are additive on growth (Jones etal., 1989). It might be inferred, therefore, that racto-pamine does not share a common mediator or signalingpathway with somatotropin, and that βAR activate tar-gets unique to muscle.
β-Adrenergic Receptors
The βAR are cell-surface receptors that belong tolarge class of 7-transmembrane domain proteins. A sub-set of these proteins is the large family of G-proteincoupled receptors (GPCR) to which the βAR belongs(Strosberg, 1996). Although ractopamine and other phe-nethanolamines are known to bind to βAR in cell mem-branes from different species (Colbert et al., 1991; Spur-lock et al., 1993), it is less certain whether this classof compounds or specific members of this class of com-pounds mediates their effects solely through the βAR.Part of the uncertainty is that over 1,000 GPCR havebeen identified that are bound by a wide array of ligandsfrom small amines to lipids to proteins (Strosberg,1996). The GPCR may have evolved from a commonancestral gene forming subtle structural changes to ac-commodate the wide variety of ligands. Although it iseasy to demonstrate binding and signaling through theβAR, it is more difficult to prove exclusivity to thisreceptor class and the possibility of binding to otherreceptor classes cannot be ignored. In addition, the nat-ural catecholamines also bind to the alpha-adrenergicreceptors (α-AR), which signal quite differently fromthe βAR. Ractopamine is purported to have low affinityfor α-AR in rodents (Colbert et al., 1991), but I amunaware of published data for the pig or any otherspecies.
Three βAR subtypes have been cloned from severalspecies, including the pig (Liang et al., 1997; Cao etal., 1998; Smith et al., 2001). The βAR subtypes shareapproximately 50% sequence homology, with the great-est homology in the transmembrane domains wherethe ligand binding pocket is formed. Subtype diversityprovides for greater control of metabolic processes andprovides the pharmacologist the means to better definemetabolic targets. The βAR subtypes exhibit ligand se-lectivity such that the rank order of affinity for norepi-nephrine is β1AR > β2AR > β3AR. Epinephrine bindsthe β1AR and β2AR with a similar affinity but has agreater affinity for the β2AR than does norepinephrine.The β1AR and β2AR are co-expressed in most tissuesof the body but the ratio of these βAR subtypes canvary, such that in the rat, the heart is predominantlyβ1AR, whereas the lung and skeletal muscle havemostly β2AR. The β3AR has a limited pattern of expres-sion and is found most abundantly in white and brownadipose tissue.
Subtypes also differ in regulation by phosphorylationand gene expression and G-protein selectivity (Strosb-erg, 1996). Multiple subunits of the G-proteins havebeen identified that bind βAR with varying affinity andshow differential tissue expression. All of this leads toconsiderable diversity in the response to a given ligand.Sequence homology for any given subtype across speciesis typically high and on the order of 90%. Despite thehigh homology, one cannot assume that the pharmaco-logical properties of a given subtype will be the sameacross species. Whether a given ligand exhibits high orlow affinity for a βAR and is able to signal through G-proteins is highly dependent on amino acid sequence,which differs across species. For example, the antago-nist ICI 118,551 is highly selective for the β2AR in hu-mans and rats and is used extensively to target thissubtype. However, ICI 118, 551 is not β1-β2AR selectivein the pig and cannot be used to distinguish these sub-types (Mersmann et al., 1993; Liang and Mills, 2002).Similarly, BRL 37344, which is selective for the β3ARin the rat, is β2AR-selective in the pig (Liang and Mills,2002). The distribution of βAR subtypes may also differby species. This is most evident for the β3AR, which isthe predominant subtype in rodent adipose tissues andthe primary regulator of lipolysis and thermogenesis.In humans and pigs, however, the β3AR represents lessthan 10% of the βAR subtypes in white adipose tissue,and less than 2% of the subtypes in other major tissues(McNeel and Mersmann, 1999). The β1AR is the pre-dominant subtype in most pig tissues, comprisingnearly 80% in adipose, 72% in heart, 65% in lung, 60%in skeletal muscle, and 50% in liver (McNeel and Mers-mann, 1999; Liang et al., 2002).
Ractopamine Isomers
Phenethanolamines are one class of compounds thatbind to αAR and βAR and are characterized by a substi-tuted aromatic ring and an ethanolamine side chainwith various substitutions on the aliphatic nitrogen(Smith, 1998; Ruffolo, 1991). Epinephrine, norepineph-rine, and ractopamine belong to this class. Interactionof ligands with amino acids of the βAR involves thepositively charged nitrogen, the β-hydroxyl group, andsubstituents on the aromatic ring. The β-hydroxylgroup generates a chiral center and has two possibleoptically active isomers; R(−) and S(+). The βAR arestereoselective, showing an approximate 100-foldhigher affinity for R(−) (Ruffolo, 1991). Ractopaminecontains two chiral centers and a possible four stereo-isomers, RR, RS, SR, and SS (Ricke et al., 1999). TheRR isomer is lipolytic (Yen et al., 1983) and accountsfor enhanced growth in rats (Ricke et al., 1999). Struc-turally, therefore, the ractopamine isomer responsiblefor modifying growth and composition is the one mostlikely to bind the βAR. The selectivity of pig βAR forractopamine stereoisomers has been determined usingthe cloned β1AR and β2AR expressed in Chinese ham-ster ovary cells (CHO; Kissel et al., 2001). The RR

MillsE30
isomer has the highest affinity for each subtype andhas nearly equivalent binding affinity (25 nM). Therank order of affinities for each subtype was RR > RS> SR > SS, and Kd values ranged from 25 to 16,600nM. Except for the RR isomer, other isomers exhibitedpreferential binding to the β2AR. Receptor activationand adenylyl cyclase stimulation indicated that theβ2AR was a more functional target than the β1AR. Noneof the isomers significantly stimulated adenylyl cyclasethrough the β1AR in CHO cell membranes, althoughisoproterenol was effective. In membranes from CHOcells expressing the β2AR, the RR isomer was mosteffective and a small response was observed for SR.One of the hallmarks of pig βAR is the remarkablestructural requirement these receptors have for ade-nylyl cyclase activation. The RR isomer was at best50% as effective as isoproterenol in adenylyl cyclaseactivation. Ractopamine and most other βAR ligandsevaluated for livestock growth are only partial agonistsat pig βAR (Mills and Mersmann, 1995). Lipolysis inadipocytes is a more sensitive test of βAR activationthan is activation of adenylyl cyclase. Because pig adi-pocytes contain nearly 80% β1AR, we evaluatedwhether the RR isomer stimulated lipolysis via theβ1AR or β2AR. Results indicated that both βAR subtypeswere used, indicating that ractopamine could signalthrough the β1AR and β2AR. To summarize what isknown about ractopamine selectivity for pig βAR sub-types, the RR isomer exhibits equal affinity for β1ARand β2AR, with other isomers showing a small prefer-ence for β2AR. No ractopamine isomer was as efficaciousas isoproterenol and some may be functional antago-nists. The RR isomer was the most efficacious and ap-pears to exhibit better efficacy through the β2AR thanthrough the β1AR, although signaling appears to occurthrough both subtypes. A similar finding was noted inrats, in which ractopamine was more efficacious at theAR than at the β1AR (Colbert et al., 1991).
Adipose Tissue Metabolism
Ligands for βAR were first screened for their anti-obesity properties, so it is expected that adipose tissueaccretion should decrease. Direct activation of βAR inadipose tissue and increased protein kinase A activityleads to activation and translocation of hormone-sensi-tive lipase with subsequent triglyceride hydrolysis. Ac-tivation of protein kinase A is also antilipogenic due tophosphorylation and inactivation of glucose transportand acetyl-CoA carboxylase and reduced expression oflipogenic genes (see Mills and Mersmann 1995; Mers-mann, 1998). Pigs fed ractopamine consistently have areduced percentage of carcass fat (Moody et al., 2000).However, the rate of fat accretion is not consistentlyreduced (Dunshea, 1993) and expression and activityof lipogenic genes may or may not be altered (Liu etal., 1994). The reduction in carcass fat may reflect morea dilution by increased protein accretion than a directeffect on adipose tissue. Ractopamine acutely increases
plasma free fatty acids in vivo (Veenhuizen et al., 1987)and in vitro (Liu et al., 1989), so there is little doubtthat ractopamine is an agonist in pig adipose tissue.However, the response to ractopamine may be short-lived because total βAR are down-regulated by nearly50% within the first 7 d of administration (Spurlocket al., 1994). Because ractopamine isomers have onlylimited ability to activate pig βAR, down-regulationmay limit the effectiveness of ractopamine and leadto the variation in carcass fat. Implementing feedingstrategies to circumvent down-regulation (McElligot etal., 1989) may enhance the ability of ractopamine tolimit fat accretion. McElligot et al. (1989) used intermit-tent feeding of clenbuterol to prevent down-regulation,and Herr et al. (2001) used a step-up dosing procedureto accommodate the loss of βAR. Both strategies appearto show a greater response than chronic administrationof a single concentration.
Muscle Metabolism
The initial finding that βAR ligands increase musclemass was a surprise, particularly given that catechola-mines are more closely linked with degradative pro-cesses and energy expenditure. Considerable effort hasgone into understanding the link between βAR activa-tion and increased protein accretion. Most evidencepoints to the βAR as mediating the growth response.Whereas initial reports indicated that skeletal musclegrowth was not prevented by βAR antagonists (Reedset al., 1988), subsequent reports showed that the βARdoes mediate the growth response (Choo et al., 1992).For ractopamine, because the RR isomer accounts forthe growth response and also is the most potent andefficacious ligand for the βAR, mediation by the βAR isindicated. The question of whether effects are direct orindirect on skeletal muscle remains unanswered, butdirect effects seem likely. Unfortunately, in vitro stud-ies have not provided the evidence for a direct link,adding to the uncertainty. Byrem et al. (1998) showedthat infusion of cimaterol to the hind limb of cattleincreased amino extraction across the limb, supportingthe idea that direct effects could account for increasedprotein gain. In addition, there is little evidence foralteration of blood hormone concentrations that mightcontribute to increased growth (see recent reviews, seeMersmann 1998; Moody et al., 2000). Blood flow to skel-etal muscle is increased at least transiently, whichwould increase the provision of nutrients and perhapscontribute to the growth response (Byrem et al., 1998;Mersmann, 1998).
The primary effect of βAR ligands is to cause fiberhypertrophy without a concomitant increase in DNA,indicating that protein synthesis, degradation, or bothare affected. Both sides of the equation have been impli-cated as contributing to increased gain. Protein degra-dation is not typically measured directly, but rather asthe difference from measured rates of synthesis andgain. If increased rates of synthesis are not observed

Biology of ractopamine E31
then protein degradation is assumed to be responsible(Reeds et al., 1986). Protein synthesis is increased inseveral species, but responses may be transient (Bergenet al., 1989; Maltin et al., 1989; Byrem et al., 1998).Increased mRNA abundance for myofibrillar proteinsand calpastatin has been observed (see Moody et al.,2000), which would favor a role for both increased syn-thesis and reduced degradation. How might βAR medi-ate changes in protein synthesis and degradation? Adirect link between cAMP and transcriptional regula-tion of the genes for myosin heavy chain in cardiomyo-cytes (Gupta et al., 1996) and bovine calpastatin (Conget al., 1998) has been shown. It is not known whethereither gene alone is rate-limiting for synthesis and deg-radation and would be sufficient to modify protein me-tabolism, but given the complexity of protein metabo-lism, involvement of additional regulatory signalsseems likely. In addition to direct effects of cAMP, βARhave been shown to activate alternative signaling cas-cades (MAP kinase) in common with insulin (Luttrellet al., 1998). Insulin promotes protein synthesis andinhibits protein degradation and the signaling cascadeshave been linked to protein metabolism (Dennis et al.,1999). The potential involvement of these pathways inthe βAR alteration of protein metabolism needs explo-ration.
Implications
The recent approval by the FDA of ractopamine foruse in pigs to enhance growth and feed efficiency shouldusher in expanded research to identify the pathwaysactivated by beta-adrenergic receptor (βAR) ligandsthat are linked to protein metabolism and to identifystrategies to take full advantage of the potential pro-vided by this class of compounds. Receptor down-regu-lation may well limit the effectiveness of ractopamine,particularly in adipose tissue. Further work is neededto determine why βAR in skeletal muscle are not assusceptible to down-regulation as adipose tissue andwhether this apparent difference is critical to the netresponse of ractopamine.
Literature Cited
Baker, P. K., R. H. Dalrymple, R. H. Ingle, D. L. Ingle, and C. A.Ricks. 1984. Use of a β-adrenergic agonist to alter muscle andfat deposition in lambs. J. Anim. Sci. 59:1256–1261.
Bergen, W. G., S. E. Johnson, D. M. Skjaerlund, A. S. Babiker, N.K. Ames, R. A. Merkel, and D. B. Anderson. 1989. Muscle proteinmetabolism in finishing pigs fed ractopamine. J. Anim. Sci.67:2255–2262.
Byrem, T. M., D. H. Beermann, and T. F. Robinson. 1998. The beta-agonist cimaterol directly enhances chronic protein accretion inskeletal muscle. J. Anim. Sci. 76:988–998.
Cao, H., C. A. Bidwell, S. K. Williams, W. Liang, and S. E. Mills.1998. Rapid Communication: Nucleotide sequence of the codingregion for the procine β1-adrenergic receptor gene. J. Anim. Sci.76:1720–1721.
Choo, J. J., M. A. Horan, R. A. Little, and N. J. Rothwell. 1992.Anabolic effects of clenbuterol on skeletal muscle are mediatedby beta 2-adrenoceptor activation. Am. J. Physiol. 263:E50–56.
Colbert, W. E., P. D. Williams, and G. D. Williams. 1991. Beta-adreno-ceptor profile of ractopamine HCl in isolated smooth and cardiacmuscle tissues of rat and guinea pig. J. Pharm. Pharmacol.43:844–847.
Cong, M., V. F. Thompson, D. E. Goll, and P. B. Antin. 1998. Thebovine calpastatin gene promoter and a new N-terminal regionof the protein are targets for cAMP-dependent protein kinaseactivity. J. Biol. Chem. 273:660–666.
Convey, E. M., E. Rickes, Y. T. Yang, M. A. McElligott, and G. Olson.1987. Effects of beta-adrenergic agonist L-644,969 on growthperformance, carcass merit and meat quality. Proc. Recip. Meat.Conf. 40:47–55.
Dennis, P. B., S. Fumagalli, and G. Thomas. 1999. Target of rapa-mycin (TOR): Balancing the opposing forces of protein synthesisand degradation. Curr. Opin. Genet. Dev. 9:49–54.
Dunshea, F. R. 1993. Effect of metabolism modifiers on lipid metabo-lism in the pig. J. Anim. Sci. 71:1966–1977.
Emery, P. W., N. J. Rothwell, M. J. Stock, and P. D. Winter. 1984.Chronic effects of beta 2-adrenergic agonists on body compositionand protein synthesis in the rat. Biosci. Rep. 4:83–91.
Gupta, M. P., M. Gupta, S. Jakovcic, and R. Zak. 1996. Catechola-mines and cardiac growth. Mol. Cell. Biochem. 163–164:203–210.
Herr, C. T., D. C. Kendall, K. A. Bowers, S. L. Hankins, T. E. Weber,A. P. Schinckel, and B. T. Richert. 2001. Effect of a step-up orstep-down ractopamine sequence for late-finishing pigs. J. Anim.Sci. 79(Suppl. 2):49(Abstr.).
Jones, D. J., D. B. Anderson, W. P. Waitt, J. F. Wagner, and D. H.Mowrey. 1989. Effect of ractopamine hydrochloride (RAC) andpituitary derived porcine somatotropin (pST) alone and in combi-nation on swine growth and carcass parameters. J. Anim. Sci.67(Suppl. 1):221(Abstr.).
Kissel, J. D., D. J. Smith, and S. E. Mills. 2001. Stereoselectivity ofporcine β-adrenergic receptors for ractopamine isomers. J. Anim.Sci. 79(Suppl. 1):429(Abstr.).
Liang, W., C. A. Bidwell, S. K. Williams, and S. E. Mills. 1997. RapidCommunication: Molecular cloning of the porcine β2-adrenergicreceptor gene. J. Anim. Sci. 75:2824.
Liang, W., and S. Mills. 2001. Profile of ligand binding to the porcinebeta2-adrenergic receptor. J. Anim. Sci. 79:877–883.
Liang, W. and S. E. Mills. 2002. Quantitative analysis of beta-adren-ergic receptor subtypes in pig tissues. J. Anim. Sci. (in press).
Liu, C. Y., J. L. Boyer, and S. E. Mills. 1989. Acute effects of beta-adrenergic agonists on porcine adipocyte metabolism in vitro.J. Anim. Sci. 67:2930–2936.
Liu, C. Y., A. L. Grant, K. H. Kim, S. Q. Ji, D. L. Hancock, D. B.Anderson, and S. E. Mills. 1994. Limitations of ractopamine toaffect adipose tissue metabolism in swine. J. Anim. Sci. 72:62–67.
Luttrell, L. M., T. van Biesen, B. E. Hawes, G. J. Della Rocca, D.K. Luttrell, and R. J. Lefkowitz. 1998. Regulation of mitogen-activated protein kinase pathways by catecholamine receptors.Adv. Pharmacol. 42:466–470.
Maltin, C. A., S. M. Hay, M. I. Delday, G. E. Lobley, and P. J. Reeds.1989. The action of the beta-agonist clenbuterol on protein me-tabolism in innervated and denervated phasic muscles. Biochem.J. 261:965–971.
McElligott, M. A., A. Barreto, Jr., and L. Y. Chaung. 1989. Effect ofcontinuous and intermittent clenbuterol feeding on rat growthrate and muscle. Comp. Biochem. Physiol. C92:135–138.
McNeel, R. L., and H. J. Mersmann. 1999. Distribution and quantifi-cation of beta1-, beta2-, and beta3-adrenergic receptor subtypetranscripts in porcine tissues. J. Anim. Sci. 77:611–621.
Mersmann, H. J. 1998. Overview of the effects of beta-adrenergicreceptor agonists on animal growth including mechanisms ofaction. J. Anim. Sci. 76:160–172.
Mersmann, H. J., K. Akanbi, A. Shparber, and R. L. McNeel. 1993.Binding of agonists and antagonists to the procine adipose tissuebeta-adrenergic receptor(s). Comp. Biochem. Physiol.C106:725–732.
Mills, S. E., and H. J. Mersmann. 1995. Beta-adrenergic agonists,their receptors, and growth: Special reference to the peculiarities

MillsE32
in pigs. In S. B. Smith and D. R. Smith (ed.) Biology of Fat inMeat Animals: Current Advances. pp. 1–34. American Societyof Animal Science, Champaign, IL.
Moody, D. E., D. L. Hancock, and D. B. Anderson. 2000. Phenethano-lamine repartitioning agents. In: J. P. F. D’Mello (ed.) FarmAnimal Metabolism and Nutrition. pp. 65–96. CAB Interna-tional, Wallingford, Oxon, U.K.
Nossaman, D. A., A. P. Schinckel, L. F. Miller, and S. E. Mills. 1991.Interaction of somatotropin and genotype on the requirementfor energy in two lines of finishing pigs. J. Nutr. 121:223–230.
Reeds, P. J., S. M. Hay, P. M. Dorwood, and R. M. Palmer. 1986.Stimulation of muscle growth by clenbuterol: Lack of effect onmuscle protein biosynthesis. Br. J. Nutr. 56:249–258.
Reeds, P. J., S. M. Hay, P. M. Dorwood, and R. M. Palmer. 1988. Theeffect of beta-agonists and antagonists on muscle growth andbody composition of young rats (Rattus sp.). Comp. Biochem.Physiol. Comp. Pharm. 89:337–341.
Ricke, E. A., D. J. Smith, V. J. Feil, G. L. Larsen, and J. S. Caton. 1999.Effects of ractopamine HCl stereoisomers on growth, nitrogenretention, and carcass composition in rats. J. Anim. Sci.77:701–707.
Ruffolo, R. R. 1991. Chirality in α- and β-adrenoceptor agonists andantagonists. Tetrahedron 47:9953–9980.
Smith, D. J. 1998. The pharmacokinetics, metabolism, and tissueresidues of beta-adrenergic agonists in livestock. J. Anim. Sci.76:173–194.
Smith, T. R., C. A. Bidwell, and S. E. Mills. 2001. Rapid Communica-tion: Nucleotide sequence of the porcine beta3-adrenergic recep-tor gene. J. Anim. Sci. 79:781–782.
Spurlock, M. E., J. C. Cusumano, and S. E. Mills. 1993. The affinity ofractopamine, clenbuterol, and L-644,969 for the beta-adrenergicreceptor population in porcine adipose tissue and skeletal musclemembrane. J. Anim. Sci. 71:2061–2065.
Spurlock, M. E., J. C. Cusumano, S. Q. Ji, D. B. Anderson, C. K.Smith, II, D. L. Hancock, and S. E. Mills. 1994. The effect ofractopamine on beta-adrenoceptor density and affinity in porcineadipose and skeletal muscle tissue. J. Anim. Sci. 72:75–80.
Strosberg, A. D. 1996. G protein coupled R7G receptors. Cancer Surv.27:65–83.
Veenhuizen, E. L., K. K. Schmiegel, E. P. Waitt, and D. B. Anderson.1987. Lipolytic, growth, feed efficiency and carcass responses tophenethanolamines in swine. J. Anim. Sci. 65(Suppl.1):130(Abstr.).
Yen, T. T., M. M. McKee, N. B. Stamm, and K. G. Bemis. 1983.Stimulation of cyclic AMP and lipolysis in adipose tissue of nor-mal and obese Avy/a mice by LY79771, a phenethanolamine,and stereoisomers. Life Sci. 32:1515–1522.

Embryonic mortality in cattle from the embryo’s perspective
P. J. Hansen1
Department of Animal Sciences, University of Florida, Gainesville 32611-0910
ABSTRACT: For the embryo to successfully completedevelopment it must be capable of executing its develop-mental program within a microenvironment largely es-tablished by the mother. Mortality results either be-cause of intrinsic defects within the embryo, an inade-quate maternal environment, asynchrony betweenembryo and mother, or failure of the mother to respondappropriately to embryonic signals. To some extent, theembryo’s fate is dictated by events before fertilization:embryos formed from incompetent oocytes have a lowprobability of successful development. For example, em-bryos have reduced developmental competence whenformed from oocytes from persistent ovarian follicles orfrom cows during the summer in Florida. Chromosomalabnormalities, caused by incompetent gametes or othercauses, and homozygous recessive genes, exacerbatedby inbreeding, represent additional types of intrinsicerrors responsible for embryonic loss. Alterations in thematernal environment can cause embryonic mortality,as has been shown for heat stress and feeding diets high
Key Words: Development, Embryos, Fertility, Mortality, Oocytes
2002 American Society of Animal Science. All rights reserved. J. Anim. Sci. 80(E. Suppl. 2):E33–E44
Introduction
Embryonic development is initiated by syngamy ofmale and female pronuclei. The fate of the embryo isuncertain at this earliest stage in its life. To completedevelopment, the embryo must progress through a se-ries of preprogrammed developmental steps that trans-form it from an undifferentiated one-cell organism intoa healthy neonatal animal. The probability of successfuldevelopment is already partially determined at syn-gamy by virtue of the genetic and nongenetic inheri-tance that the embryo receives from the gametes fromwhich it was formed. Subsequent errors in the executionof its developmental program can also lead to embry-onic mortality.
Received July 27, 2001.Accepted January 8, 2002.1Correspondence: PO Box 110910 (E-mail: Hansen@
animal.ufl.edu).
E33
in degradable protein. The preimplantation embryo ismost susceptible to certain types of stresses (most nota-bly, heat shock) very early in development when itsgenome is largely repressed. Thus, the cellular adjust-ments the early embryo can make in response to pertur-bations in its environment are limited. Some genes re-lated to resistance to cellular stress can become acti-vated early in development (for example, heat shockprotein 70) while other responses to stress are absent.For example, the early bovine embryo cannot undergoapoptosis in response to cellular stresses that ordinarilyactivate this process. One possibility is that the acquisi-tion of the capacity for apoptosis represents an im-portant mechanism by which an embryo acquires theability to survive cellular stress. The embryo can alsomodify, to some extent, an inappropriate maternal envi-ronment. Development of procedures to improve oocytecompetence and to manipulate embryonic stress re-sponses may lead to new practices for improving embry-onic survival.
Development is played out in the reproductive tractand the mother has a major impact on embryonic sur-vival. Embryonic loss is increased when physiologicalregulation of oviductal and uterine function is inade-quate or when the mother is exposed to one or moreof the many stresses that can compromise embryonicsurvival. Conversely, maternal inputs may minimizethe nature of minor deficiencies inherent within theembryo.
The embryo has some capacity to direct the maternalsystem to produce a local environment that serves theneeds of the embryo. The embryo also possesses cellularadaptive mechanisms to limit adverse effects of variousdisturbances in the maternal environment. Whether aparticular maternal stress affects embryonic survivaldepends not only on the magnitude of the stress im-posed on the embryo but also on the effectiveness ofembryonic adaptive responses to that stress.
This review will address the role the embryo itselfplays in determination of its survival. Two features ofthis problem will be addressed: intrinsic errors thatpredispose it to failure, particularly those that arise

HansenE34
Table 1. Characteristics of cattle that affect oocyte competence
Percentage oocytes to blastocyst Reference
Agea
Adult 42.1% Salamone et al., 2001Calf 3.4%
ParityFirst 3.9% Snijders et al., 2000Third 10.4%
Genetic ability for milkMedium 11.4% Snijders et al., 2000High 6.8%
Body condition score3.3–4.0 9.9% Snijders et al., 20001.5–2.5 3.0%
Level of protein feedingLow-NH3 diet 23.2% Sinclair et al., 2000aHigh-NH3 diet 8.8%
Season, FloridaWinter 26.2% Al-Katanani et al., 2002aSummer 17.6%
aAfter parthenogenetic activation.
from the gametes from which the embryo was formed,and the development of embryonic adaptive responsesto stress. The review focuses largely on cattle but simi-lar principles likely hold true for other species as well.
Gametic Determinants of Embryonic Survival
The newly-formed zygote is composed of both geneticand nongenetic material from the oocyte and spermata-zoa that produced it. Sperm mitochondria are rapidlyubiquitinated and cleared from the zygote (Sutovsky etal., 2000) but, in many species, rodents being a majorexception, the sperm-contributed centriole is involvedin formation of the zygote’s centrosome (Sutovsky andSchatten, 2000). The oocyte contributes even more ma-terial than the sperm; indeed, the cytoplasm of the zy-gote is largely derived from the oocyte and only mater-nal mitochondria survive in the zygote. Until the latefour-cell to eight-cell stage, when there is a major roundof embryonic transcription, the early embryo undergoesonly limited transcription (Memili and First, 2000) andthe embryo is dependent in large part on transcriptsand proteins formed in the oocyte. Given the derivationof the zygote from the gametes, it is not surprisingthat defects in the formation or function of oocytes andspermatozoa can decrease embryonic survival.
The Oocyte as a Determinant of Embryonic Survival
The term oocyte competence has been developed todescribe the potential for an oocyte to give rise to anormally developing embryo following fertilization. Itis becoming increasingly clear that environmental ornutritional stresses can adversely affect oocyte compe-tence. Using in vitro fertilization, several factors havebeen reported to reduce oocyte competence, as mea-sured by the reduction in the proportion of oocytes thatsuccessfully develop into blastocysts (see Table 1).
These factors include diets with high amounts of de-gradable crude protein (Sinclair et al., 2000a; Arm-strong et al., 2001), low body condition score (Snijderset al., 2000), primiparity (Snijders et al., 2000), andhigh genetic merit for milk yield (although not actualmilk yield; Snijders et al., 2000). In addition, oocytecompetence is reduced in prepubertal animals (Arm-strong, 2001). Using in vitro fertilization protocols, theproportion of oocytes that develop to blastocyst isgreater for oocytes from larger follicles than for oocytesrecovered from smaller follicles (Lonergan et al., 1994).
Laboratories in Louisiana (Rocha et al., 1998), Wis-consin (Rutledge et al., 1999), Israel (Zeron et al., 2001),and Florida (Al-Katanani et al., 2002a, 2002b) havereported a reduction in oocyte competence during thesummer. The summer decline in oocyte competence ispresumably due to heat stress. In sheep, heat stress 12d before estrus reduced fertilization and lambing rates(Dutt, 1964.) In addition, retrospective analysis of alarge reproductive data set in lactating dairy cattle re-vealed a negative association between heat stress 10 dbefore breeding and subsequent pregnancy rate (Al-Katanani et al., 1999). Near estrus, the oocyte also ap-pears sensitive to damage. Exposure of superovulatedcows to heat stress for 10 h beginning at the onset ofestrus had no effect on fertilization rate but reducedthe proportion of normal embryos recovered on d 7 afterestrus (Putney et al., 1989a).
It is likely that oocyte competence can be compro-mised by changes in follicular dynamics. This has beendemonstrated to be the case following estrus synchroni-zation schemes using progestogen-releasing devices.Use of these implants results in incomplete suppressionof LH secretion and development of a persistent domi-nant follicle of prolonged lifespan. It has long beenknown that fertility following insemination of cows withpersistent dominant follicles is low (Savio et al., 1993;

Embryonic mortality in cattle E35
Revah and Butler, 1996; Austin et al., 1999). Oocytesfrom persistent dominant follicles undergo prematuremeiosis, probably because of the premature exposureto high LH concentrations (Revah and Butler, 1996;Mihm et al., 1999). They also exhibit various abnormali-ties including an enlargement of the perivitelline space,intracellular vacuoles and irregular vesicles, and in-creased numbers of mitochrondia and lipid droplets(Mihm et al., 1999). The low fertility associated withpersistent dominant follicles may also represent, atleast in part, effects on the reproductive tract; cowswith persistent dominant follicles had altered proteinsecretory patterns in the oviduct (Binelli et al., 1999).
While pharmacologically induced persistent domi-nant follicles are associated with reduced fertility, thereis yet little evidence that fertility is reduced in cowsovulating a follicle that was produced in an estrouscycle with two follicular waves (where lifespan of thedominant follicle is extended) as compared to cows ovu-lating a follicle that was produced in an estrous cyclewith three follicular waves. In the only experiment ofthis type (Ahmad et al., 1997), there was no differencein pregnancy rate between cows ovulating a two-wave(36/44 cows; 84% pregnant) vs three-wave dominantfollicle (6/6 cows; 100% pregnant). However, studieswith additional numbers of animals will be warrantedto draw definitive conclusions.
Cellular and Molecular Basis for Oocyte Competence
A matured oocyte must complete a multiplicity ofprocesses to give rise to an embryo capable of successfuldevelopment. These processes include acquisition of thesperm receptor proteins and signaling molecules on theooplasm to allow for fertilization, accumulation of intra-cellular stores of calcium for signaling events, executionof the block to polyspermy, nuclear maturation withproper segregation of chromosomes, acquisition of thereducing agents and other molecules required for pro-nuclear decondensation, development of the cytoskele-tal apparatus necessary for syngamy, and synthesisand storage of the mRNA, proteins, and other moleculesnecessary to support preimplantation development.Factors that reduce oocyte competence undoubtedly actat some point in oocyte growth or maturation to makefor suboptimal execution of one or more of the processeslisted above.
Improper chromosomal segregation is one docu-mented cause of oocyte incompetence. Analysis by Ya-dav et al. (1991) indicated that about 15% of culturedoocytes possess chromosomal abnormalities (4.2% an-euploids and 10.7% diploids) and embryos formed as aresult of fertilization of such oocytes would fail to de-velop. Heat stress, at least in mice, can cause chromo-somal abnormalities in oocytes (Baumgartner andChrisman, 1981, 1988), and it is possible that otherenvironmental or physiological influences on the cowcan also disrupt normal karyokinesis. The incidence ofchromosomal abnormalties is much greater for embryos
produced by in vitro fertilization than is the case invivo (Viuff et al., 2001) and some causes of chromosomaldefects that are expressed in culture may not occur invivo. Indeed, culture can cause profound changes inoocyte and embryo gene expression and function (seeDuranthon and Renard, 2001) and it is possible thatsome apparent differences in oocyte competence thathave been deduced using in vitro fertilization may notbe observed when the oocyte undergoes maturation andfertilization in vivo.
Until it reaches about 110 to 120 �m in diameter (2- to3-mm follicle; Hyttel et al., 2001), the oocyte is activelyinvolved in synthesis, packaging, and storage of mRNAthat will be used by the developing embryo. The bovineembryo is dependent on these maternal mRNA for thebulk of its protein synthesis until the late four-cell oreight-cell stage, when the embryonic genome becomesactivated (Memili and First, 2000). Although much ofthe prestored maternal mRNA degrades rapidly in theembryo, it is likely that some embryonic protein synthe-sis depends on maternal mRNA even after embryonicgenome activation. In the mouse, maternal mRNA isstill present at the blastocyst stage in trophoblast andinner cell mass (Bachvarova and Moy, 1985). Failureof the oocyte to synthesize mRNA in adequate amountsto support embryonic development could lead to embry-onic failure. In addition, the mRNA that is synthesizedin the oocyte for use in embryonic development is pack-aged in a manner that allows for its storage and coordi-nated translation at the proper time in development(Brevini Gandolfi and Gandolfi, 2001). Disruption ofthis process could also compromise oocyte competence.
Translation of mRNA is controlled in part by polyade-nylation at the 3′ untranslated region of the mRNA.Using morphological evaluation of the ovary to identifyoocytes classified as being of high or low competence,Brevini-Gandolfi et al. (1999) demonstrated that thelength of the polyA tail on several genes was shorterfor oocytes of low competence, suggesting reducedtranslation of these mRNA. In addition, Lonergan etal. (2000) have shown that two-cell embryos that hadundergone first cleavage by 30 h after inseminationwere more likely to develop to the blastocyst stage andto have higher amounts of transcripts for IGF-I, glu-cose-6-phosphate dehydrogenase, and hypoxanthinephosphoribosyl transferase than slower-cleaving em-bryos with reduced developmental potential. These re-sults also support the importance of maternally derivedmRNA for oocyte competence.
Membrane composition may be one important deter-minant of oocyte competence, because it is within themembrane that signal transduction and transport pro-teins function. Membranes from oocytes collected dur-ing the summer in Israel had higher lipid-phase transi-tion temperatures than oocytes collected during thewinter (Zeron et al., 2001). In the same study, therewas also a higher proportion of saturated fatty acids inthe summer for granulosa cells and follicular fluid.

HansenE36
Specific proteins synthesized by the oocyte duringmaturation are also likely to be important for embry-onic development. One factor that improves competenceduring the maturation process, at least in culture, isepidermal growth factor (EGF) (Lonergan et al., 1996;Goff et al., 2001). Culture of cumulus-oocyte complexeswith EGF during maturation led to induction of twooocyte proteins and increased synthesis of an additionalsix oocyte proteins (Goff et al., 2001).
Factors such as heat stress and diets high in crudeprotein that alter oocyte competence could do so byaffecting oocyte development directly or by compromis-ing the function of follicular cells supporting oocyte de-velopment. Sirard (2001) has suggested that, after com-pleting or ceasing its growth, the follicle sends informa-tion to the oocyte that allows it to acquire competence.Evidence for this idea comes from experiments indicat-ing that oocyte competence is improved in superstimu-lated cows if harvest of oocytes is delayed until 48 hafter administration of the last injection of FSH(Blondin et al., 1997; Sirard et al., 1999). Similarly,competence of oocytes collected at slaughter is in-creased if oocytes are allowed to reside in the ovary for4 h before harvest (Blondin et al., 1997). Using PCR-based suppressive subtractive hybridization, Robert etal. (2001) identified 18 transcripts that were present inhigher amounts in granulosa cells from follicles yieldingcompetent oocytes (100% development to blastocyst)than from granulosa cells from follicles yielding incom-petent oocytes (0% development to blastocyst). Thesegenes included the progesterone and prostaglandin re-ceptors and the transcription factors Egr-1 and DNAbinding protein A. Other genes identified included EGF,Sprouty 2, which modulates signal transduction of fi-broblast growth factor, and epiregulin, which interactswith the EGF receptor. Such transcripts are potentialtarget genes for alteration by factors that affect oo-cyte competence.
An unknown question is when, in the relatively longperiod of its growth and development, the oocyte issusceptible to disruption. The estimated time forgrowth of a bovine follicle from the initiation of folliculargrowth at the primary follicle stage to ovulation is 84to 85 d (Picton et al., 1998; McNatty et al., 1999), ofwhich approximately 42 d represents the antral phaseof growth (Lussier et al., 1987). A stress capable ofinducing oocyte lesions in the early stages of folliculargrowth could affect fertility for a considerable periodafter removal of the stress. There is some evidence thatsuch a phenomenon may occur for heat stress. In Israel,Roth et al. (1999) harvested oocytes from 3- to 8-mmfollicles during four consecutive estrous cycles in theautumn from previously heat-stressed cows. Over time,there was an increase in oocyte quality score and devel-opment. In another study, cooling cows for 42 d beforeslaughter in the summer did not increase oocyte compe-tence as determined by development to the blastocyststage after in vitro maturation, fertilization, and cul-ture (Al-Katanani et al., 2002b). Although the cooling
may not have been adequate to eliminate heat stress,it is also possible that oocytes were already damagedby heat stress before the 42-d period of cooling was ini-tiated.
Role of the Spermatozoa in Embryonic Mortality
Like the oocyte, the male gamete influences fertilitynot simply by affecting fertilization rate but also, tosome extent, by imparting characteristics to the embryothat influence its ability to proceed through develop-ment. Thus, one can observe differences in embryonicmortality between bulls in vivo (Wijerante, 1973) andin vitro (Hillery et al., 1990; Shi et al., 1990). In therabbit, embryos formed from fertilization of oocyteswith spermatozoa that had been exposed to elevatedtemperature had reduced survival (Howarth et al.,1965; Burfening and Ulberg, 1968).
One cause of male-derived embryonic loss is induc-tion of chromosomal abnormalities. The incidence ofnondisjunction in bovine spermatogenesis has been es-timated at 2.8% (Logue and Harvey, 1978). Bulls car-rying the 1/29 Robertsonian translocation produce ahigh rate of embryos that are aneuploid (Kawarskyet al., 1996) and are accordingly of reduced fertility(Dyrendahl and Gustavsson, 1979). Defective chroma-tin structure can also presumably lead to failure ofpronuclear decondensation or early embryonic death:bulls with stable chromatin as determined by acid dena-turation are more likely to give rise to offspring in heter-ospermic fertilization tests than bulls with less-stableDNA (Ballachey et al., 1988).
Embryonic Determinants of Embryonic Survival
Intrinsic Causes of Embryonic Mortality
Development during the embryonic period of preg-nancy (until about d 42 of pregnancy when the fetus canbe delineated) is a complicated phenomenon involving,among other processes, embryonic genome activation,compaction, blastocyst formation, elongation of the tro-phoblast, secretion of interferon-τ to maintain the cor-pus luteum, differentiation of placental tissues, anddevelopment of the inner cell mass into the fetus. Anyof these processes could fail because of some intrinsicdefect in the embryo, whether derived originally fromthe oocyte or sperm or originating subsequent to zy-gote formation.
There is little information about embryonic loss dueto intrinsic errors. Chromosomal abnormalities can con-tinue to occur after the first cleavage division to giverise to a mixoploid embryo in which some cells are dip-loid and others exhibit a chromosomal abnormality. Thepercentage of mixoploid embryos increases during thepreimplantation period both in vitro (Kawarsky et al.,1996) and in vivo (Viuff et al., 2001). The proportion ofmixoploid embryos from superovulated females at d 5after ovulation was 31% (Viuff et al., 2001). It is not

Embryonic mortality in cattle E37
known what extent of mixoploidy is compatible withlive birth.
Recessive lethal genes also contribute to embryonicmortality. About 2% of Holsteins in the United Statespossess an autosomal recessive form of the gene foruridine-5′-monophosphate synthease which, whenpresent in the homozygous condition, leads to embry-onic mortality before d 40 (Zavy, 1994). Given the likeli-hood that other lethal recessive genes exist that compro-mise embryonic survival, inbreeding represents athreat to the genetic potential for fertility in livestockspecies. This is especially true for dairy cattle in whichthere has been an increase in inbreeding, including forJerseys (Thompson et al., 2000) and Holsteins (Youngand Seykora, 1996; Hansen, 2000). One geneticist hassuggested that the problem has reached the point atwhich dairy producers should consider crossbreedingschemes (Hansen, 2000).
It has long been assumed that a proportion of preg-nancies in cattle fail because the embryo produces inad-equate amounts of interferon-τ (IFN-τ) to block uterineprostaglandin F2α production and thereby allow for con-tinued maintenance of the corpus luteum (Thatcher etal., 1989). There is considerable variation in the degreeto which the trophoblast has undergone elongation be-tween d 15 and 17 of pregnancy, when the embryo firstsecretes IFN-τ in anti-luteolytic amounts. Amounts ofIFN-τ secretion increase as size of the embryo increases(Geisert et al., 1988; Leung et al., 2000). At d 14 to 17,embryos were smaller in repeat-breeder heifers thanin previously virgin heifers and were less likely to ex-tend the lifespan of the corpus luteum (Albihn et al.,1991).
Inadequate IFN-τ because of delayed or retarded tro-phoblast development may reflect intrinsic defects inthe embryo. In addition, adverse alterations in the ma-ternal environment could affect embryonic IFN-τ secre-tion. Sheep (Nephew et al., 1991) and cows (Mann et al.,1998) experiencing a delay in the rise in progesteroneconcentrations after ovulation contained lower concen-trations of IFN-τ in uterine flushes at d 13 (sheep) or16 of pregnancy (cow) than females experiencing earlierrises in progesterone concentrations.
It has proven difficult to increase pregnancy rate incattle by pharmacological manipulation of the luteolyticprocess. Administration of IFN-α to cows after breed-ing, to mimic the effects of the closely-related IFN-τ,did not improve fertility in cattle, but rather caused aslight reduction in pregnancy rate (Barros et al., 1992a).Interferons are pleiotropic molecules and cows adminis-tered IFN-α experienced acute hyperthermia, disrup-tions in LH secretion, and a short-term reduction incirculating concentrations of progesterone (Newton etal., 1990; Barros et al., 1992b). There is some reasonto warrant that doses of IFN-τ itself may be found thatcan extend luteal lifespan while having minimal sideeffects (Meyer et al., 1995).
Administration of a single injection of GnRH or itsanalogs around d 11 to 14 after breeding has also been
evaluated as a method for increasing pregnancy rate(Peters et al., 2000). Presumably, the GnRH would workby luteinizing follicles involved in initiation of luteolysisand thereby delaying CL regression so that a retardedembryo had additional time to develop adequate IFN-τ synthetic capacity. Results with this regimen havebeen mixed. A recent meta-analysis has indicated anoverall beneficial effect of GnRH treatment to increasepregnancy rate (Peters et al., 2000) but more work isrequired to understand the basis for the variation ineffectiveness of the treatment.
Responses of the Embryo to the MaternalEnvironment: The Heat Stress Example
In large part, an embryo’s survival depends on thematernal environment. Embryonic loss can occur whenthere is disruption in the physiological regulation ofoviductal and uterine function due to intrinsic errorsin maternal physiology or to specific environmentalstresses imposed on the mother. Whether or not anembryo can survive perturbations in the maternal envi-ronment depends on the degree to which the embryocan either 1) adjust its own internal physiology to allowfor its survival and continued development or 2) act onthe mother to restore to some degree the microenviron-ment that the embryo resides in. The extent to whichthe embryo is capable of self-adjustment or adjustmentsof the maternal unit is not well understood for mostmaternal factors affecting fertility. The one exceptionis the case for heat stress; abundant information on theability of the embryo to maintain cellular function anddevelopment in the face of elevated temperature (i.e.,heat shock) is available. For this stress, at least, theembryo acquires mechanisms to become resistant toelevated temperature as it progresses through develop-ment. The biochemical and molecular nature of thethermoprotective mechanisms that allow more ad-vanced embryos to become more resistant to elevatedtemperature is still under investigation.
In cattle, as for other species, exposure of pregnantfemales to heat stress during the embryonic periodleads to embryonic loss (Putney et al., 1988; Ealy et al.,1993). One cause of embryonic death is the disruptionof embryonic development caused when the embryo isexposed to elevated temperature. Thus, exposure of em-bryos to heat shock by elevating culture temperatureblocks or reduces subsequent development (Edwardsand Hansen, 1997; Rivera and Hansen, 2001). Heatshock leads to embryonic death, at least in part, becauseprotein synthesis is reduced (Edwards and Hansen,1996; Edwards et al., 1997) and, at least in the mouse(Arechiga et al., 1995), free radical metabolism is in-creased.
One of the features of heat stress on embryonic sur-vival, at least in the cow (Ealy et al., 1993), as well assheep (Dutt, 1963) and pig (Tompkins et al., 1967),is that the magnitude of the depression in embryonicsurvival is less when heat stress is applied later in the

HansenE38
Figure 1. Effect of exposure of embryos to 41°C forvarious times on development to the blastocyst stage.Embryos were collected at 26 to 32 h after insemination(two- to four-cell stage) or at d 5 after insemination (allembryos > 16 cells), exposed to 41°C for the times indi-cated, and returned to 38.5°C until determination of per-centage blastocysts at d 8. Data are least squares means± SEM and represent the results from 5 to 10 replicatesper group (58 to 86 embryos per group). Developmentwas affected by stage × time (P = 0.05). Data are from C.E. Krininger III and P. J. Hansen, unpublished.
preimplantation period than when applied earlier indevelopment. In cows, for example, exposure of super-ovulated females to heat stress at d 1 after breeding(i.e., when embryos were at the one- or two-cell stage)reduced the proportion of embryos at d 8 of pregnancythat were at the blastocyst stage of development (Ealyet al., 1993). However, heat stress had no effect on theproportion of embryos at d 8 classified as blastocystswhen heat stress was applied at d 3 (four- to eight-cell), 5 (16 cell-morula), or d 7 (morula-blastocyst stage).Similarly, in culture, exposure of embryos to elevatedculture temperature caused a greater reduction in de-velopment at the two-cell stage than in embryos at the> 16 cell stage or morula stage (Edwards and Hansen,1997; also see Figure 1 for unpublished results of Krin-inger and Hansen).
The fact that bovine embryos increase in resistanceto heat shock as development proceeds has led to the useof embryo transfer as a method of improving pregnancyrates during periods of heat stress. One would expectthat heat stress would have less effect on embryonicsurvival for recipient cows receiving an embryo at d7 after estrus than for inseminated cows because theformer embryos have already progressed through thestages in development most susceptible to heat stress.In fact, several studies have shown higher pregnancyrates in the summer for lactating dairy cows that weresubjected to embryo transfer than for artificially insem-
inated controls (Putney et al., 1989b; Ambrose et al.,1999; Drost et al., 1999; Al-Katanani et al., 2002c).
Cellular and Biochemical Basis forDevelopmental Acquisition of Thermotolerance
One molecule that plays an important role in cellularresistance to heat shock is heat shock protein 70(HSP70), which acts to protect cells exposed to elevatedtemperature by stabilizing protein structure (Georgo-poulos and Welch, 1993), inhibiting translation (Thu-lasiraman et al., 1998), and preventing apoptosis (Li etal., 1996). Injection of mRNA for HSP70 into mouseoocytes increased oocyte survival following heat shock(Hendrey and Kola, 1991). Indeed, HSP70 is importantfor development in the absence of heat shock; provisionof HSP70 antibody to culture medium decreased devel-opment in the absence of stress in mice (Neuer et al.,1998) and cattle (Al-Katanani and Hansen, 2002).
Given the importance of HSP70 for cellular thermo-protective responses, and the fact that embryonic geneexpression is largely repressed during early embryonicdevelopment (Memili and First, 2000), it is reasonableto hypothesize that failure to synthesize HSP70 in re-sponse to heat shock could be responsible for the height-ened sensitivity of two-cell embryos to heat shock. How-ever, bovine embryos develop the ability to produceHSP70 in response to heat shock as early as the two-cell stage (Edwards and Hansen, 1996; Edwards et al.,1997), that is, before they gain resistance to heat shock.Recent studies using RT-PCR support the idea that theheat-induced increase in HSP70 synthesis at the two-cell stage is due in large part to transcription (Chan-dolia et al., 1999). One possibility is that the amountsof HSP70 that the two-cell embryo can synthesize inresponse to heat shock are inadequate to compensatefor the deleterious effects of heat shock.
Another system that might be involved in develop-mental acquisition of thermotolerance is the antioxi-dant status of the embryo. Experiments in the mouseembryo (Arechiga et al., 1995) indicate that heat shockcauses a reduction in intracellular concentrations ofglutathione (GSH), an antioxidant tripeptide that par-ticipates in a variety of reactions to eliminate free radi-cals from cells. Moreover, administration of buthioninesulfoximine, an inhibitor of GSH synthesis, preventsthe induced thermotolerance reaction in mouse em-bryos (Arechiga et al., 1995). Induced thermotolerancerefers to the phenomenon whereby exposure to a mildheat shock makes cells more resistant to a subsequent,more severe heat shock. Consistent with the role forantioxidant systems in developmental acquisition ofthermotolerance is the finding that, in the bovine em-bryo, there is a decline in GSH content from the one-cell to the two- to eight-cell stage that is followed by arise in GSH content by the 9- to 16-cell stage (Lim etal., 1996). Concentrations then remain constant untila further increase associated with hatching. The impor-tance of GSH as a determinant of embryonic resistance

Embryonic mortality in cattle E39
Figure 2. Time-dependent, heat-induced apoptosis inbovine embryos ≥ 16-cell stage collected at d 5 after insem-ination. Results are least squares means ± SEM of fourreplicates (342 embryos total). Exposure of embryos toheat shock of 40°C (closed circles) or 41°C (open circle)increased (P < 0.001) the percentage of cells undergoingapoptosis. There was a linear (P = 0.05) and a quadratic(P < 0.01) effect of time at 40°C and linear (P < 0.001) andquadratic (P < 0.001) effect of time at 41°C. However, heatshock had no effect on total cell number/embryo. Dataare from Paula-Lopes and Hansen (2002).
to elevated temperature has been called into question,however, by more recent findings that, in contrast toits effects on induced thermotolerance, addition of buth-ionine sulfoximine to culture medium did not increasesensitivity of mouse embryos to mild heat shocks capa-ble of reducing development (Arechiga and Hansen,1998).
The ability of embryos to undergo apoptosis in re-sponse to heat shock is also developmentally regulatedin bovine embryos. For embryos ≥ 16 cells in numberat d 5 after fertilization, heat shock induces an increasein the proportion of cells undergoing apoptosis (Paula-Lopes and Hansen, 2002; see Figure 2). In contrast,heat shock does not increase the number of apoptoticcells at the two-, four-, or eight-cell stage. The 8- to 16-cell stage appears transitional: embryos at this stage
collected at d 3 after fertilization do not undergoapoptosis, whereas such embryos collected at d 4 afterfertilization are capable of heat-induced apoptosis(Paula-Lopes and Hansen, 2002).
The fact that embryonic resistance to heat shock istemporally associated with ability to undergo apoptosisin response to heat shock suggests that apoptosis maybe involved in embryonic resistance to elevated temper-ature. Cells exposed to stress that cannot undergoapoptosis frequently undergo cell death more reminis-cent of necrosis (Xiang et al., 1996; Woo et al., 1998).Such necrotic death may be more inimical to the long-term developmental capability of embryos than the or-derly removal of cells by apoptosis. Perhaps a limitedamount of apoptosis is beneficial to heat-shocked em-bryos by eliminating cells damaged by heat shock and,possibly, by preventing necrosis.
The molecular basis for developmental acquisition ofthe ability to undergo heat-induced apoptosis is notknown. The machinery for apoptosis is present, at leastat some level, since the beginning of development. Thus,the protein kinase C inhibitor, staurosporine, could in-duce apoptosis in mouse embryos at the one- to four-cell stage (Well et al., 1996; Exley et al., 1999) andbovine embryos at the 1- to 16-cell stage (Byrne et al.,1999). The failure of heat shock to induce apoptosisearly in development, then, could possibly be caused bya predominance of anti-apoptotic modulatory proteinsin the early cleavage-stage embryo and a decline in theamounts of these proteins as development proceeds.There may also be some developmental changes in lev-els of proteins involved in induction of apoptosis. Inone study, RT-PCR was used to evaluate presence ofcaspase transcripts in mouse embryos (Exley et al.,1999). Although transcripts for all caspases tested couldbe detected in oocytes, these transcripts disappeared bythe zygote stage (except for caspase-2, which remainedpresent in zygotes). Transcripts reappeared at the two-cell stage (caspase-2, -3, and -6) or at the eight-cellstage (caspase-7) or remained undetectable through theblastocyst stage (caspase-1 and -11). Thus, as for manyother oocyte mRNA, transcripts for caspases decreasecoincident with fertilization and reappear at some laterspecific stage.
Embryonic Responses to Other Stresses
The developmental pattern in embryonic resistanceto a specific stress depends on the biochemical nature ofthe lesion induced by the stress and the developmentalchanges in the corresponding cytoprotective mecha-nisms of the embryo. For some stresses, as for heatshock, the embryo acquires increased resistance as itadvances in development. In cattle, development to theblastocyst stage was inhibited by KCN, an inhibitor ofoxidative phosphorylation, when added during d 1 to 3of culture but not when added during d 4 to 6 (Donnayet al., 2000). Embryos again became sensitive to KCNwhen added during blastocyst formation (d 6 to 8). Rab-
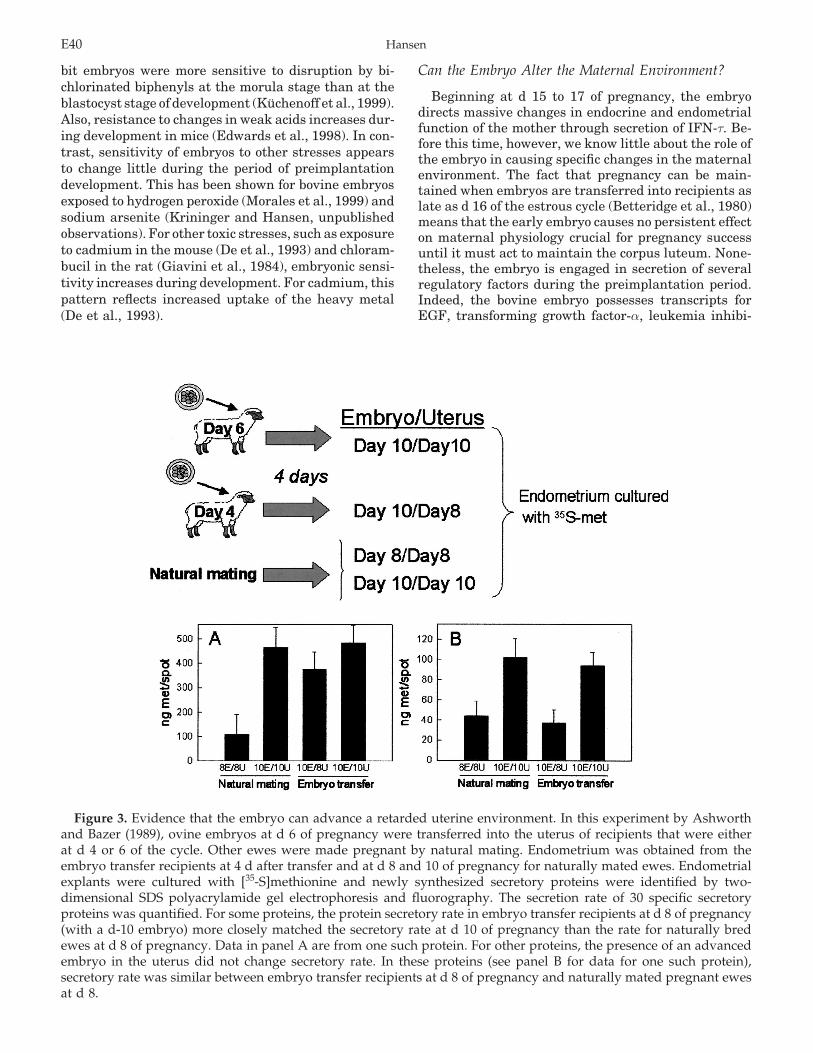
HansenE40
bit embryos were more sensitive to disruption by bi-chlorinated biphenyls at the morula stage than at theblastocyst stage of development (Kuchenoff et al., 1999).Also, resistance to changes in weak acids increases dur-ing development in mice (Edwards et al., 1998). In con-trast, sensitivity of embryos to other stresses appearsto change little during the period of preimplantationdevelopment. This has been shown for bovine embryosexposed to hydrogen peroxide (Morales et al., 1999) andsodium arsenite (Krininger and Hansen, unpublishedobservations). For other toxic stresses, such as exposureto cadmium in the mouse (De et al., 1993) and chloram-bucil in the rat (Giavini et al., 1984), embryonic sensi-tivity increases during development. For cadmium, thispattern reflects increased uptake of the heavy metal(De et al., 1993).
Figure 3. Evidence that the embryo can advance a retarded uterine environment. In this experiment by Ashworthand Bazer (1989), ovine embryos at d 6 of pregnancy were transferred into the uterus of recipients that were eitherat d 4 or 6 of the cycle. Other ewes were made pregnant by natural mating. Endometrium was obtained from theembryo transfer recipients at 4 d after transfer and at d 8 and 10 of pregnancy for naturally mated ewes. Endometrialexplants were cultured with [35-S]methionine and newly synthesized secretory proteins were identified by two-dimensional SDS polyacrylamide gel electrophoresis and fluorography. The secretion rate of 30 specific secretoryproteins was quantified. For some proteins, the protein secretory rate in embryo transfer recipients at d 8 of pregnancy(with a d-10 embryo) more closely matched the secretory rate at d 10 of pregnancy than the rate for naturally bredewes at d 8 of pregnancy. Data in panel A are from one such protein. For other proteins, the presence of an advancedembryo in the uterus did not change secretory rate. In these proteins (see panel B for data for one such protein),secretory rate was similar between embryo transfer recipients at d 8 of pregnancy and naturally mated pregnant ewesat d 8.
Can the Embryo Alter the Maternal Environment?
Beginning at d 15 to 17 of pregnancy, the embryodirects massive changes in endocrine and endometrialfunction of the mother through secretion of IFN-τ. Be-fore this time, however, we know little about the role ofthe embryo in causing specific changes in the maternalenvironment. The fact that pregnancy can be main-tained when embryos are transferred into recipients aslate as d 16 of the estrous cycle (Betteridge et al., 1980)means that the early embryo causes no persistent effecton maternal physiology crucial for pregnancy successuntil it must act to maintain the corpus luteum. None-theless, the embryo is engaged in secretion of severalregulatory factors during the preimplantation period.Indeed, the bovine embryo possesses transcripts forEGF, transforming growth factor-α, leukemia inhibi-

Embryonic mortality in cattle E41
tory factor, basic fibroblast growth factor, and IGF-I(Yoshida et al., 1998; Eckert and Niemann, 1998; Loner-gan et al., 2000). It is likely that these molecules act,at least in part, to change the maternal environmentearly in pregnancy.
The fact that embryonic expression of leukemia inhib-itory factor is up-regulated during culture of bovineembryos (Eckert and Niemann, 1998) implies that theembryo can modify secretion of regulatory moleculesin response to changes in its environment. If so, it isconceivable that the preimplantation embryo can acton the mother to improve certain inadequate maternalenvironments. There is some experimental evidencethat this is the case. In particular, Ashworth and Bazer(1989) demonstrated in sheep that an embryo placedin a uterus that is retarded in time relative to the em-bryo can alter the secretion of many endometrial secre-tory proteins to levels similar to those characteristic ofa uterus at the same day of pregnancy as the embryo(Figure 3).
Relationship Between Events in thePreimplantation Period and
Postimplantation Development
It has long been known that exposure of preimplanta-tion embryos to various toxins can lead to various devel-opmental defects during fetal development (Eibs et al.,1982; Iannaccone, 1984; Generoso et al., 1987; Otani etal., 1991; Lane and Gardner, 1994; Jacquet et al., 1995).More recently, the question of how the developmentalprocess can be incorrectly programmed during the pre-implantation period has been placed at the center ofresearch concerning embryo technology because of theassociation between in vitro fertilization, embryo cul-ture, and nuclear cloning with the occurrence of a hostof abnormalities in the fetal and neonatal period calledgenerically the large-offspring syndrome (Betteridge,2001). Postulated mechanisms for the large offspringsyndrome have been the focus of many recent reviews(for example, see Sinclair et al., 2000b; Young andFairburn, 2000; Farin et al., 2001) and will not be dis-cussed further. It is pertinent to ask, however, to whatdegree errors in postimplantation development in popu-lations of livestock species bred via natural or artificialinsemination can be attributed to errors in genetic pro-gramming early in the preimplantation period. Consis-tent with this idea are observations in sheep that fetalovergrowth can be induced by transfer of embryos intoan advanced uterine environment (Wilmut and Sales,1981) or premature elevation of progesterone concen-trations (Kleeman et al., 1994). There is some evidencein lactating dairy cows that the rate of postimplantationembryonic failure is higher than previously thought(Lucy, 2001; Stevenson, 2001) and it will be instructiveto determine the proportion of these losses that repre-sent carryover effects of stress during embryonic devel-opment into the fetal period.
Implications
Pregnancy rate per insemination in dairy cattle hasdeclined in the last 30 yr or so in the United States andGreat Britain (Royal et al., 2000; Lucy, 2001). Althoughsome of this decline likely reflects failures of estrusdetection, improper semen deposition, and so on, sucha large decrease in pregnancy rate points to an increasein embryonic mortality. Evidence gathered in this re-view indicates that one source of embryonic mortalityis inadequate oocyte growth and maturation leading toan oocyte that is incapable of becoming a healthy em-bryo. Perhaps failure of the embryo to undergo cellularadaptations to stabilize embryonic function in the faceof an adverse maternal environment is another sourceof embryonic loss. Research directed toward improvingoocyte competence and toward manipulation of embry-onic stress responses may lead to new methods for en-hancing fertility in cattle and other species.
Literature Cited
Ahmad, N., E. C. Townsend, R. A. Dailey, and E. K. Inskeep. 1997.Relationships of hormonal patterns and fertility to occurrenceof two or three waves of ovarian follicles, before or after breeding,in beef cows and heifers. Anim. Reprod. Sci. 49:13–28.
Albihn, A., H. Gustafsson, M. Hurst, and H. Rodriquez-Martinez.1991. Embryonic ability to prolong the interestrous interval invirgin and repeat breeder heifers. Anim. Reprod. Sci. 26:193–210.
Al-Katanani, Y. M., and P. J. Hansen. 2002. Induced thermotolerancein bovine two-cell embryos and the role of heat shock protein70 in embryonic development. Mol. Reprod. Dev. (In press).
Al-Katanani, Y. M., F. F. Paula-Lopes, and P. J. Hansen. 2002a.Effect of season and exposure to heat stress on oocyte competencein Holstein cows. J. Dairy Sci. 85:390–396.
Al-Katanani, Y. M., R. M. Rivera, and P. J. Hansen. 2002b. Seasonalvariation in development of in vitro produced bovine embryos.Vet. Rec. (In press).
Al-Katanani, Y. M., M. Drost, R. L. Monson, J. J. Rutledge, C. E.Krininger, III, J. Block, W. W. Thatcher, and P. J. Hansen.2002c. Pregnancy rates following timed embryo transfer withfresh or vitrified in vitro produced embryos in lactating dairycows under heat stress conditions. Theriogenology (In press).
Al-Katanani, Y. M., D. W. Webb, and P. J. Hansen. 1999. Factorsaffecting seasonal variation in 90 day non-return rate to firstservice in lactating Holstein cows in a hot climate. J. Dairy Sci.82:2611–2615.
Ambrose, J. D., M. Drost, R. L. Monson, J. J. Rutledge, M. L. Leibfried-Rutledge, M.-J. Thatcher, T. Kassa, M. Binelli, P. J. Hansen, P.J. Chenoweth, and W. W. Thatcher. 1999. Efficacy of timedembryo transfer with fresh and frozen in vitro produced embryosto increase pregnancy rates in heat-stressed dairy cattle. J. DairySci. 82: 2369–2376.
Arechiga, C. F., A. D. Ealy, and P. J. Hansen. 1995. Evidence thatglutathione is involved in thermotolerance of preimplantationmouse embryos. Biol. Reprod. 52:1296–1301.
Arechiga C. F., and P. J. Hansen. 1998. Response of preimplantationmurine embryos to heat shock as modified by developmentalstage and glutathione status. In Vitro Cell Dev. Anim.34:655–659.
Armstrong, D. T. 2001. Effects of maternal age on oocyte develop-mental competence. Theriogenology 55:1303–1322.
Armstrong, D. G., T. G. McEvoy, G. Baxter, J. J. Robinson, C. O.Hogg, K. J. Woad, R. Webb, and K. D. Sinclair. 2001. Effect ofdietary energy and protein on bovine follicular dynamics and

HansenE42
embryo production in vitro: Associations with the ovarian insu-lin-like growth factor system. Biol. Reprod. 64:1624–1632.
Ashworth, C. J., and F. W. Bazer. 1989. Changes in ovine conceptusand endometrial function following asynchronous embryo trans-fer or administration of progesterone. Biol. Reprod. 40:425–433.
Austin, E. J., M. Mihm, M. P. Ryan, D. H. Williams, and J. F. Roche.1999. Effect of duration of dominance of the ovulatory follicleon onset of estrus and fertility in heifers. J. Anim. Sci.77:2219–2226.
Bachvarova, R., and K. Moy. 1985. Autoradiographic studies on thedistribution of labeled maternal RNA in early development. J.Exp. Zool. 233:397–403.
Ballachey, B. E., D. P. Evenson, and R. G. Saacke. 1988. The spermchromatin structure assay: Relationship with alternate tests ofsemen quality and heterospermic performance of bulls. J. An-drol. 9:109–115.
Barros, C. M., J. G. Betts, W. W. Thatcher, and P. J. Hansen. 1992b.Possible mechanisms for reduction of circulating concentrationsof progesterone by interferon-α in cows: Effects on hyperthermia,luteal cells, metabolism of progesterone and secretion of luteiniz-ing hormone. J. Endocrinol. 133:175–182.
Barros, C. M., G. R. Newton, W. W. Thatcher, M. Drost, C. Plante,and P. J. Hansen. 1992a. The effect of bovine interferon-αI1 onpregnancy rate in heifers. J. Anim. Sci. 70:1471–1477.
Baumgartner, A. P., and C. L. Chrisman. 1981. Cytogenetic analysisof ovulated mouse oocytes following hyperthermic stress duringmeiotic maturation. Exp. Cell Res. 132:359–366.
Baumgartner, A. P., and C. L. Chrisman. 1988. Analysis of post-implantation mouse embryos after maternal heat stress duringmeiotic maturation. J. Reprod. Fertil. 84:469–474.
Betteridge, K. J. 2001. Enigmas and variations among mammalianembryos. Reprod. Domest. Anim. 36:37–40.
Betteridge, K. J., M. D. Eaglesome, G. C. Randall, and D. Mitchell1980. Collection, description and transfer of embryos from cattle10-16 days after oestrus. J. Reprod. Fertil. 59:205–216.
Binelli, M., J. Hampton, W. C. Buhi, and W. W. Thatcher. 1999.Persistent dominant follicle alters pattern of oviductal secretoryproteins from cows at estrus. Biol. Reprod. 61:127–134.
Blondin, P., L. A. Guilbault, and M.-A. Sirard. 1997. The time intervalbetween FSH-P administration and slaughter can influence thedevelopmental competence of beef heifer oocytes. Theriogenology48:803–813.
Brevini-Gandolfi, T. A. L., L. A. Favetta, L. Mauri, A. M. Luciano,F. Cillo, and F. Gandolfi. 1999. Changes in poly(A) tail lengthof maternal transcripts during in vitro maturation of bovineoocytes and their relation with developmental competence. Mol.Reprod. Dev. 52:427–433.
Brevini Gandolfi, T. A. L., and F. Gandolfi. 2000. The maternal legacyto the embryo: Cytoplasmic components and their effects onearly development. Theriogenology 55:1255–1276.
Burfening, P. J., and L. C. Ulberg. 1968. Embryonic survival subse-quent to culture of rabbit spermatozoa at 38° and 40°C. J. Re-prod. Fertil.15:87–92.
Byrne, A. T., J. Southgate, D. R. Brison, and H. J. Leese. 1999.Analysis of apoptosis in the preimplantation bovine embryo us-ing TUNEL. J. Reprod. Fertil. 117:97–105.
Chandolia, R. K., M. R. Peltier, W. Tian, and P. J. Hansen. 1999.Transcriptional control of development, protein synthesis andheat-induced heat shock protein 70 synthesis in 2-cell bovineembryos. Biol. Reprod. 61:1644–1648.
De, S. K., B. C. Paria, S. K. Dey, and G. K. Andrews. 1993. Stage-specific effects of cadmium on preimplantation embryo develop-ment and implantation in the mouse. Toxicology 80:13–25.
Donnay, I., S. Bernard, J. M. Feugang, S. Kaidi, and A. Moens. 2000.Effect of cyanide (KCN) on bovine embryo development andapoptosis. Theriogenology 53:350 (Abstr.).
Drost, M., J. D. Ambrose, M. J. Thatcher, C. K. Cantrell, K. E. Wols-dorf, J. F. Hasler, and W. W. Thatcher. 1999. Conception ratesafter artificial insemination or embryo transfer in lactating dairycows during summer in Florida. Theriogenology 52:1161–1167.
Duranthon, V., and J. P. Renard. 2001. The developmental compe-tence of mammalian oocytes: A convenient but biologically fuzzyconcept. Theriogenology 55:1277–1289.
Dutt, R. H. 1963. Critical period for early embryo mortality in ewesexposed to high ambient temperature. J. Anim. Sci. 22:713–719.
Dutt, R. H. 1964. Detrimental effects of high ambient temperature onfertility and early embryo survival in sheep. Int. J. Biometeorol.8:47–56.
Dyrendahl, I., and I. Gustavsson. 1979. Sexual functions, semen char-acteristics and fertility of bulls carrying the 1/29 chromosometranslocation. Heridatas 90:281–289.
Ealy, A. D., M. Drost, and P. J. Hansen. 1993. Developmental changesin embryonic resistance to adverse effects of maternal heat stressin cows. J. Dairy Sci. 76:2899–2905.
Eckert, J., and H. Niemann. 1998. mRNA expression of leukaemiainhibitory factor (LIF) and its receptor subunits glycoprotein130 and LIF-receptor-beta in bovine embryos derived in vitroor in vivo. Mol. Hum. Reprod. 4:957–965.
Edwards, J. L., A. D. Ealy, V. H. Monterroso, and P. J. Hansen.1997. Ontogeny of temperature-regulated heat shock protein 70synthesis in preimplantation bovine embryos. Mol. Reprod. Dev.48:25–33.
Edwards, J. L., and P. J. Hansen. 1996. Elevated temperature in-creases heat shock protein 70 synthesis in bovine two-cell em-bryos and compromises function of maturing oocytes. Biol. Re-prod. 55:340–346.
Edwards, J. L., and P. J. Hansen. 1997. Differential responses ofbovine oocytes and preimplantation embryos to heat shock. Mol.Reprod. Dev. 46:138–145.
Edwards, L. J., D. A. Williams, and D. K. Gardner. 1998. IntracellularpH of the preimplantation mouse embryo: Effects of extracellularpH and weak acids. Mol. Reprod. Dev. 50:434–442.
Exley, G. E., C. Tang, A. S. McElhinny, and C. M. Warner. 1999.Expression of caspase and BCL-2 apoptotic family members inmouse preimplantation embryos. Biol. Reprod. 61:231–239.
Farin, P. W., A. E. Crosier, and C. E. Farin. 2001. Influence of invitro systems on embryo survival and fetal development in cattle.Theriogenology 55:151–170.
Geisert, R. D., M. T. Zavy, B. G. Biggers, J. E. Garrett, and R. P.Wettemann. 1988. Characterization of the uterine environmentduring early conceptus expansion in the bovine. Anim. Reprod.Sci. 16:11–25.
Georgopoulos, C., and W. J. Welch. 1993. Role of the major heatshock proteins as molecular chaperones. Ann. Rev. Cell Biol.9:601–634.
Giavini, E., L. Bonanomi, and F. Ornaghi. 1984. Developmental toxic-ity during the preimplantation period: Embryotoxicity and clas-togenic effects of chlorambucil in the rat. Teratog. Carcinog.Mutagen. 4:341–348.
Goff, A. K., Z. Yang, R. Cortvrindt, J. Smitz, and P. Miron. 2001.Protein synthesis during maturation of bovine oocytes, effect ofepidermal growth factor. Reprod. Domest. Anim. 36:19–24.
Hansen, L. B. 2000. Consequences of selection for milk yield from ageneticist’s viewpoint. J. Dairy Sci. 83:1145–1150.
Hansen, T. R., K. J. Austin, D. J. Perry, J. K. Pru, M. G. Teixeira,and G. A. Johnson. 1999. Mechanism of action of interferon-tauin the uterus during early pregnancy. J. Reprod. Fertil. Suppl.54:329–339.
Hendrey, J. J., and I. Kola. 1991. Thermolability of mouse oocytesis due to the lack of expression and/or inducibility of Hsp70.Mol. Reprod. Dev. 25:1–8.
Hillery, F. L., J. J. Parrish, and N. L. First. 1990. Bull specific effecton fertilization and embryo development in vitro. Theriogenology33:249 (Abstr.)
Howarth, B., C. W. Alliston, and L. C. Ulberg. 1965. Importance ofuterine environment on rabbit sperm prior to fertilization. J.Anim. Sci. 24:1027–1032.
Hyttel, P., D. Viuff, T. Fair, J. Laurincik, P. D. Thomsen, H. Callesen,P. L. A. M. Vos, P. J. M. Hendriksen, S. J. Dieleman, K. Schel-lander, U. Besenfelder, and T. Greve. 2001. Ribosomal RNA gene

Embryonic mortality in cattle E43
expression and chromosome aberrations in bovine oocytes andpreimplantation embryos. Reproduction 122:21–30.
Iannaccone, P. M. 1984. Long-term effects of exposure to methylni-trosourea on blastocysts following transfer to surrogate femalemice. Cancer Res. 44:2785–2789.
Jacquet, P., L. de Saint-Georges, J. Vankerkom, and L. Baugnet-Mahieu. 1995. Embryonic death, dwarfism and fetal malforma-tions after irradiation of embryos at the zygote stage: Studieson two mouse strains. Mutat. Res. 332:73–87.
Kawarsky, S. J., P. K. Basrur, R. B. Stubbings, P. J. Hansen, andW. A. King. 1996. Chromosomal abnormalities in bovine embryosand their influence on development. Biol. Reprod. 54:53–59.
Kleeman, D. O., S. K. Walker, and R. F. Seamark. 1994. Enhancedfetal growth in sheep administered progesterone during the firstthree days of pregnancy. J. Reprod. Fertil. 102:411–417.
Kuchenhoff, A., R. Eckard, K. Buff, and B. Fischer. 1999. Stage-specific effects of defined mixtures of polychlorinated biphenylson in vitro development of rabbit preimplantation embryos. Mol.Reprod. Dev. 54:126–134.
Leung, S. T., K. Derecka, G. E. Mann, A. P. F. Flint, and D. C.Wathes. 2000. Uterine lymphocyte distribution and interleukinexpression during early pregnancy in cows. J. Reprod. Fertil.119:25–33.
Li, W. X., C. H. Chen, C. C. Ling, and G. C. Li. 1996. Apoptosis inheat-induced cell killing: The protective role of hsp-70 and thesensitization effect of the c-myc gene. Radiat Res. 145:324–330.
Lim, J. M.,S. S. Liu, and W. Hansel. 1996. Intracytoplasmic glutathi-one concentration and the role of β-mercaptoethanol in preim-plantation development of bovine embryos. Theriogenology46:429–439.
Logue, D. N., and M. J. A. Harvey. 1978. Meiosis and spermatogenesisin bulls heterozygous for a presumptive 1/29 Robertsonian trans-location. J. Reprod. Fertil. 54:159–165.
Lonergan, P., C. Carolan, A. Vanlangendonckt, I. Donnay, H. Khatir,and P. Mermillod. 1996. Role of epidermal growth factor in bo-vine oocyte maturation and preimplantation embryo develop-ment in vitro. Biol. Reprod. 54:1420–1429.
Lonergan, P., A. Gutierrez-Adan, B. Pintado, T. Fair, F. Ward, J. D.Fuente, and M. Boland. 2000. Relationship between time of firstcleavage and the expression of IGF-I growth factor, its receptor,and two housekeeping genes in bovine two-cell embryos andblastocysts produced in vitro. Mol. Reprod. Dev. 57:146–152.
Lonergan, P., P. Monaghan, D. Rizos, M. P. Boland, and I. Gordon.1994. Effect of follicle size on bovine oocyte quality and develop-mental competence following maturation, fertilization and cul-ture in vitro. Mol. Reprod. Dev. 37:48–53.
Lucy, M. C. 2001. Reproductive loss in high-producing dairy cattle:Where will it end? J. Dairy Sci. 84:1277–2193.
Lussier, J. G., P. Matton, and J. J. Dufour. 1987. Growth rates offollicles in the ovary of the cow. J. Reprod. Fertil. 81:301–307.
Mann, G. E., G. E. Lamming, and P. A. Fisher. 1998. Progesteronecontrol of embryonic interferon tau production during early preg-nancy in the cow. J. Reprod. Fertil. Abstr. Ser. 21: Abstr. 37(Abstr.).
McNatty, K. P., D. A. Heath, T. Lundy, A. E. Fidler, L. Quirke, A.O’Connel, P. Smith, N. Groome, and D. J. Tisdall. 1999. Controlof early ovarian follicular development. J. Reprod. Fertil. Suppl.54:3–16.
Memili, E., and N. L. First. 2000. Zygotic and embryonic gene expres-sion in cow: a review of timing and mechanisms of early geneexpression as compared with other species. Zygote 8:87–96.
Meyer, M. D., P. J. Hansen, W. W. Thatcher, M. Drost, and R. M.Roberts. 1995. Effect of bovine interferon-τ on body temperatureand plasma progesterone concentrations in cyclic dairy cattle.J. Dairy Sci. 78:1470–1476.
Mihm, M., N. Curran, P. Hyttel, P. G. Knight, M. P. Boland and J.F. Roche. 1999. Effect of dominant follicle persistence on follicu-lar fluid oestradiol and inhibin and on oocyte maturation inheifers. J. Reprod. Fertil. 116:293–304.
Morales, H., P. Tilquin, J. F. Rees, A. Massip, F. Dessy, and A. VanLangendonckt. 1999. Pyruvate prevents peroxide-induced injury
of in vitro preimplantation bovine embryos. Mol. Reprod. Dev.52:149–157.
Nephew, K. P., K. E. McClure, T. L. Ott, D. H. Dubois, F. W. Bazer, andW. F. Pope. 1991. Relationship between variation in conceptusdevelopment and differences in estrous cycle duration in ewes.Biol. Reprod. 44:536–539.
Neuer, A., C. Mele, H. C. Liu, Z. Rosenwaks, and S. S. Witkin. 1998.Monoclonal antibodies to mammalian heat shock proteins impairmouse embryo development in vitro. Hum. Reprod. 13:987–990.
Newton, G. R., S. Martinod, P. J. Hansen, W. W. Thatcher, B. Siegen-thaler, C. Gerber, and M.-J. Voirol. 1990. Effect of bovine inter-feron on acute changes in body temperature and serum proges-terone concentration in heifers. J. Dairy Sci. 73:3439–3449.
Otani, H., O. Tanaka, R. Tatewaki, H. Naora, and T. Yoneyama.1991. Diabetic environment and genetic predisposition as causesof congenital malformations in NOD mouse embryos. Diabetes40:1245–1250.
Paula-Lopes, F. F., and P. J. Hansen. 2002. Heat-induced apoptosis inpreimplantation bovine embryos is a developmentally-regulatedprocess. Biol. Reprod. 66:(In press).
Peters, A. R., T. A. Martinez, and A. J. Cook. 2000. A meta-analysisof studies of the effect of GnRH 11-14 days after inseminationon pregnancy rates in cattle. Theriogenology 54:1317–126.
Picton, H., D. Briggs, and R. Gosden. 1998. The molecular basis ofoocyte growth and development. Mol. Cell Endocrinol. 145:27–37.
Putney, D. J., M. Drost, and W. W. Thatcher. 1988. Embryonic devel-opment in superovulated dairy cattle exposed to elevated ambi-ent temperatures between days 1 to 7 post insemination. Therio-genology 30:195–209.
Putney, D. J., M. Drost, and W. W. Thatcher. 1989a. Influence ofsummer heat stress on pregnancy rates of lactating dairy cattlefollowing embryo transfer or artificial insemination. Theriogen-ology 31:765–778.
Putney, D. J., S. Mullins, W. W. Thatcher, M. Drost, and T. S. Gross.1989b. Embryonic development in superovulated dairy cattleexposed to elevated ambient temperatures between the onset ofestrus and insemination. Anim. Reprod. Sci. 19:37–51.
Revah, I., and W. R. Butler. 1996. Prolonged dominance of follicles andreduced viability of bovine oocytes. J. Reprod. Fertil. 106:39–47.
Rivera, R. M., and P. J. Hansen. 2001. Development of culturedbovine embryos after exposure to increased temperatures in thephysiological range. Reproduction 121:107–115.
Robert, C., D. Gagne, D. Bousquet, F. L. Barnes, and M.-A. Sirard.2001. Differential display and suppressive subtractive hybrid-ization used to identify granulosa cell messenger RNA associatedwith bovine oocyte developmental competence. Biol. Reprod.64:1812–1830.
Rocha, A., R. D. Randel, J. R. Broussard, J. M. Lim, R. M. Blair, J. D.Roussel, R. A. Godke, and W. Hansel. 1998. High environmentaltemperature and humidity decrease oocyte quality in Bos taurusbut not in Bos indicus cows. Theriogenology 49:657–665.
Roth, Z., A. Arav, A. Bor, Y. Zeron, A. Ocheretny, and D. Wolfenson.1999. Enhanced removal of impaired follicles improves the qual-ity of oocytes collected in the autumn from summer heat-stressedcows. In: Proc. Annu. Mtg. Soc. Study Fertil., Abstr. 78.
Rutledge, J. J., R. L. Monson, D. L. Northey, and M. L. Leibfried-Rutledge. 1999. Seasonality of cattle embryo production in atemperate region. Theriogenology 51:330 (Abstr.).
Salamone, D. F., P. Damiani, R. A. Fissore, J. M. Robl, and R. T. Duby.2001. Biochemical and developmental evidence that ooplasmicmaturation of prepubertal bovine oocytes is compromised. Biol.Reprod. 64:1761–1768.
Savio, J. D., W. W. Thatcher, G. R. Morris, K. Entwhistle, M. Drost,and M. R. Mattiacci. 1993. Effects of induction of low plasmaprogesterone concentrations with a progesterone-releasing in-travaginal device on follicular turnover and fertility in cattle.J. Reprod. Fertil. 98:77–84.
Shi, K. S., K. H. Lu, and I. Gordon. 1990. Effect of bulls on fertilizationof bovine oocytes and their subsequent development in vitro.Theriogenology 33:324 (Abstr.).

HansenE44
Sinclair, K. D., M. Kuran, F. E. Gebbie, R. Webb, and T. G. McEvoy.2000a. Nitrogen metabolism and fertility in cattle: II. Develop-ment of oocytes recovered from heifers offered diets differingin their rate of nitrogen release in the rumen. J. Anim. Sci.78:2670–2680.
Sinclair, K. D., L. E. Young, I. Wilmut, and T. G. McEvoy. 2000b.In-utero overgrowth in ruminants following embryo culture: Les-sons from mice and a warning to men. Hum. Reprod. 15 (Suppl.5):68–86.
Sirard, M. A. 2001. Resumption of meiosis: mechanism involved inmeiotic progression and its relation with developmental compe-tence. Theriogenology 55:1241–1254.
Sirard, M.-A., L. Picard, M. Dery, K. Coenen, and P. Blondin. 1999.The time interval between FSH administration and ovarian aspi-ration influences the development of cattle oocytes. Theriogeo-nology 51:699–708.
Snijders, S. E. M., P. Dillon, D. O’Callaghan, and M. P. Boland. 2000.Effect of genetic merit, milk yield, body condition and lactationnumber on in vitro oocyte development in dairy cows. Theriogen-ology 53:981–989.
Stevenson, J. S. 2001. Reproductive management of dairy cows in highmilk-producing herds. J. Dairy Sci. 84 (E. Suppl.): E128–143.
Sutovsky, P., R. D. Moreno, J. Ramalho-Santos, T. Dominko, C. Sim-erly, and G. Schatten. 2000. Ubiquitinated sperm mitochondria,selective proteolysis, and the regulation of mitochondrial inheri-tance in mammalian embryos. Biol. Reprod. 63:582–590.
Sutovsky, P., and G. Schatten. 2000. Paternal contributions to themammalian zygote: Fertilization after sperm-egg fusion. Int.Rev. Cytol 195:1–65.
Thatcher, W. W., K. L. Macmillan, P. J. Hansen, and M. Drost 1989.Concepts for regulation of corpus luteum function by the concep-tus and ovarian follicles to improve fertility. Theriogenology31:149–164.
Thompson, J. R., R. W. Everett, and C. W. Wolfe. 2000. Effects ofinbreeding on production and survival in Jerseys. J. Dairy Sci.83:2131–2138.
Thulasiraman, V., Z. Xu, S. Uma, Y. Gu, J. J. Chen, and R. L. Matts.1998. Evidence that Hsc70 negatively modulates the activationof the heme-regulated eIF-2a kinase in rabbit reticulocyte lysate.Eur. J. Biochem. 255:552–562.
Tompkins, E. C., C. J. Heidenreich, and M. Stob. 1967. Effect of post-breeding thermal stress on embryonic mortality in swine. J.Anim. Sci. 26:377–380.
Viuff, D., P. J. M. Hendriksen, P. L. A. M. Vos, S. J. Dieleman,B. M. Bibby, R. Greve, P. Hyttel, and P. B. Thomsen. 2001.Chromosomal abnormalities and developmental kinestics in invivo-developed cattle embryos at Days 2 to 5 after ovulation.Biol. Reprod. 65:204–208.
Well, M., M. D. Jacobsen, H. S. R. Coles, T. J. Davies, R. L. Gardner,K. D. Raff, and M. C. Raff. 1996. Constitutive expression of themachinery for programmed cell death. J. Cell Biol. 133:1053–1059.
Wijerante, W. V. S. 1973. A population study of apparent embryonicmortality in cattle, with special reference to genetic factors.Anim Prod. 16:251–259.
Wilmut, I., and D. I. Sales 1981. Effect of an asychronous environmenton embryonic development in sheep. J. Reprod. Fertil.61:179–184.
Woo, M., R. Hakem, M. S. Soengas, G. S. Duncan, A. Shahinian, D.Kagi, A. Hakem, M. McCurrach, W. Khoo, S. A. Kaufman, G.Senaldi, T. Howard, S. W. Lowe, and T. W. Mak. 1998. Essentialcontribution of caspase 3/CPP32 to apoptosis and its associatednuclear changes. Genes Dev. 12:806–819.
Xiang, J., D. T. Chao, and S. J. Korsmeyer. 1996. BAX-induced celldeath may not require interleukin-1β-converting enzyme-likeproteases. Proc. Natl. Acad. Sci. USA 93:14559–14563.
Yadav, B. R., W. A. King, K. P. Xu, J. W. Pollard, and L. Plante.1991. Chromosome analysis of bovine oocytes cultured in vitro.Genet. Sel. Evol. 23:191–196.
Yoshida, Y., M. Miyamura, S. Hamano, and M. Yoshida. 1998. Expres-sion of growth factor ligand and their receptor mRNAs in bovineova during in vitro maturation and after fertilization in vitro.J. Vet. Med. Sci. 60:549–554.
Young, C. W., and A. J. Seykora. 1996. Estimates of inbreeding andrelationship among registered Holstein females in the UnitedStates. J. Dairy Sci. 79:502–505.
Young, L. E., and H. R. Fairburn. 2000. Improving the safety ofembryo technologies: Possible role of genomic imprinting. Theri-ogenology 53:627–648.
Zavy, M. T. 1994. Embryonic mortality. In: M. T. Zavy and R. D.Geis-ert (ed.) Embryonic Mortality in Domestic Species. pp 99–140.CRC Press, Boca Raton, FL.
Zeron, Y., A. Ocheretny, O. Kedar, A. Borochov, D. Sklan, and A.Arav. 2001. Seasonal changes in bovine fertility: Relation todevelopmental competence of oocytes, membrane properties andfatty acid composition of follicles. Reproduction 121:447-454.
Developmental regulation of protein synthesis1,2
T. A. Davis3, M. L. Fiorotto, A. Suryawan, P. M. J. O’Connor, and J. A. Bush
USDA-ARS Children’s Nutrition Research Center, Department of Pediatrics,Baylor College of Medicine, Houston, TX 77030
ABSTRACT: Growth and development are charac-terized by high rates of protein turnover that supportrapid rates of protein accretion. The relative rates ofprotein deposition vary among tissues, with the growthrate of the skeletal musculature being among the high-est. The efficiency with which dietary amino acids areutilized for protein deposition is high in the neonatalanimal and decreases as the animal matures. This highefficiency in the neonate is associated with an enhancedstimulation of protein synthesis by feeding. The rise in
Key Words: Amino Acids, Insulin, Muscles, Neonates, Pigs, Protein Synthesis
2002 American Society of Animal Science. All rights reserved. J. Anim. Sci. 80(E. Suppl. 2):E45–E49
Introduction
The relative rates of growth and protein depositionare higher during the neonatal period than at any otherstage of postnatal life (Denne and Kalhan, 1987; Golds-pink and Kelly, 1984). The rapid rate of protein deposi-tion is sustained by elevated fractional rates of proteinsynthesis. With the advancement of development, frac-tional rates of growth and protein synthesis decline.During the neonatal period, the fractional gain in pro-tein mass in skeletal muscle is greater than for whole-body protein (Young, 1970). Fractional rates of protein
1This work is a publication of the USDA-ARS Children’s NutritionResearch Center, Department of Pediatrics, Baylor College of Medi-cine and Texas Children’s Hospital, Houston, TX. This project hasbeen funded in part by National Institute of Arthritis and Musculo-skeletal and Skin Diseases Institute Grant R01 AR44474 and theU.S. Department of Agriculture, Agricultural Research Service, un-der Cooperative Agreement number 58-6250-6-001. The contents ofthis publication do not necessarily reflect the views or policies of theU.S. Department of Agriculture, nor does mention of trade names,commercial products or organizations imply endorsement by theU.S. Government.
2The authors thank Doug Burrin, Peter Reeds, Phil Beckett, HanhNguyen, Rhonda Vann, and Diane Wray-Cahen for their considerableefforts in the studies cited herein. We also thank Leslie Loddeke andDaniel Wallace for assistance in the preparation of this manuscript.
3Correspondence: 1100 Bates Street (phone: 713-798-7169, fax:713-798-7171, E-mail: [email protected]).
Received October 10, 2001.Accepted January 17, 2002.
E45
protein synthesis in response to feeding and its develop-mental decline are more pronounced in skeletal musclethan in other tissues. In the neonatal pig, the postpran-dial rise in both insulin and amino acids in the periph-eral circulation independently stimulate protein syn-thesis in skeletal muscle, whereas amino acids are theprincipal anabolic stimulus in the liver. The develop-mental changes in muscle protein synthesis are regu-lated by alterations in the expression and activity ofcomponents of the intracellular signaling pathway thatcontrols the initiation of translation.
synthesis in skeletal muscle are high immediately afterbirth and decline more rapidly than in other tissues ofthe body during the first month of life (Davis et al.,1993b, 1996; Skjaerlund et al., 1994). This develop-mental decline in skeletal muscle protein synthesis var-ies with fiber type (Davis et al., 1989). Marked changesin the composition of muscle also occur during the earlypostnatal period, including a specific accumulation ofmyofibrillar proteins (Fiorotto et al., 2000). This reviewsummarizes current literature on the regulation of pro-tein synthesis during early postnatal development.
Role of Nutrient Intake in the DevelopmentalRegulation of Protein Synthesis
The efficiency with which dietary amino acids areutilized for protein deposition is higher in the neonatalanimal than at any other stage of postnatal life anddeclines rapidly with development (Davis et al., 1993b;Fiorotto et al., 1991; McCracken et al., 1980). Our workin rats and pigs suggests that neonatal animals utilizetheir dietary amino acids more efficiently for growthbecause they are capable of a greater increase in tissueprotein synthesis in response to feeding than are olderanimals, thereby reducing the loss of amino acids bycatabolism (Davis et al., 1991, 1993, 1996). Althoughfeeding increases protein synthesis in all tissues of theneonatal pig (Burrin et al., 1997; Davis et al., 1996,1997) and rat (Burrin et al., 1991, 1992; Davis et al.,1993a), the postprandial rise in protein synthesis and

Davis et al.E46
the developmental decline in the response to feedingare most pronounced in skeletal muscle, particularly inthose muscles that contain predominately white musclefibers. About 50% of the decline in skeletal muscle pro-tein synthesis from birth to adulthood occurs duringthe first month of life.
The postprandial stimulation of protein synthesis hasbeen observed in the whole body of the newborn human(Denne et al., 1991) and in skeletal muscle of the post-weaned growing rat (Garlick et al., 1983) and lamb(Oddy et al., 1987; Wester et al., 2000). The responseis present to a lesser extent, if at all, in adult mammals(Baille and Garlick, 1992; Melville et al., 1989; Tessariet al., 1996). By contrast, liver protein synthesis ratescan be modulated by changes in food intake in bothgrowing (Burrin et al., 1992, 1997) and adult (Mosoniet al., 1996; Preedy et al., 1988) animals.
Thus, fundamental differences seem to exist betweenthe mechanisms that regulate protein deposition in theadult and in the neonate. In the adult, protein mass isgained and lost equally between the postprandial andpostabsorptive periods, and changes in protein synthe-sis with feeding and fasting are minimal. In the neo-nate, protein is deposited more rapidly in the postpran-dial state than the amount that is lost in the postabsorp-tive state, and, thus, high postprandial rates of proteinsynthesis are required. The enhanced stimulation ofprotein synthesis in skeletal muscle in response toeating serves as an efficient mechanism that channelsdietary amino acids into muscle protein, thereby accel-erating muscle protein accretion in the neonate.
Role of Insulin in the DevelopmentalRegulation of Protein Synthesis
Insulin plays a key role in the regulation of proteindeposition in the neonatal animal. Examination of therelationship between skeletal muscle protein synthesisand plasma insulin concentrations in fasted and fedsuckling pigs shows a positive relationship between thepostprandial changes in protein synthesis and thechanges in circulating insulin concentrations. This rela-tionship decreases with development (Davis et al.,1997). However, the postprandial rise in amino acidsand glucose potentially influence the relationship be-tween protein synthesis and insulin. Therefore, to de-termine the effects of insulin that are independent ofchanges in circulating amino acids and glucose, we de-veloped a novel amino acid clamp technique (Wray-Cahen et al., 1997), for use in conjunction with theglucose clamp technique (DeFronzo et al., 1979), thatmaintains constant blood concentrations of both aminoacids and glucose during the infusion of insulin. Use ofthe amino acid clamp during insulin infusion studiesis particularly important in young animals because ex-perimentally induced systemic hyperinsulinemia, inthe absence of amino acid administration, results ina decrease in amino acid concentrations that is moreprofound and more rapid the younger the animal. A
decrease in circulating amino acid levels during theinfusion of insulin could limit the ability of insulin tostimulate protein synthesis.
Results of studies using the hyperinsulinemic-eugly-cemic-euaminoacidemic clamp technique showed thatinsulin stimulates the utilization of amino acids forprotein deposition in the neonatal pig and that both thesensitivity and responsiveness of amino acid disposalto insulin decline markedly with development (Wray-Cahen et al., 1997). This response suggests that theenhanced insulin sensitivity of whole-body amino aciddisposal may underlie the more efficient use of dietaryamino acids for growth in the neonatal animal. Further-more, raising insulin concentrations in neonatal pigsto reproduce the levels in the fed state, while aminoacids and glucose are clamped near fasting levels, in-creases the rate of skeletal muscle protein synthesis tothat present in the fed state (Wray-Cahen et al., 1998).This response to insulin is attenuated as the pig ma-tures, in parallel with the developmental change in thestimulation of muscle protein synthesis by feeding. Thestimulation of muscle protein synthesis by insulin, likethat in response to feeding, is greater in white muscleand is not specific to myofibrillar proteins (Davis etal., 2001).
The stimulatory effects of insulin on whole-bodyamino acid disposal and skeletal muscle protein synthe-sis in the early postnatal pig are consistent with theability of insulin to stimulate whole-body amino acidutilization (Thureen et al., 2000) and protein synthesisin the fetal sheep (Liechty et al., 1992), hindlimb of theyoung lamb (Wester et al., 2000), and skeletal muscleof the weaned rat (Garlick et al., 1983). In markedcontrast to studies conducted during growth and devel-opment, most studies in adult animals (Baille and Gar-lick, 1991; McNulty et al., 1993) and humans (Gelfandand Barrett, 1987; Heslin et al., 1992; Louard et al.,1992) show little, if any, response of muscle proteinsynthesis to an increase in insulin within the physiolog-ical range. Collectively, these results suggest that insu-lin mediates the feeding-induced stimulation of proteinsynthesis in skeletal muscle of young mammals andthat this response decreases with development.
Interestingly, insulin also stimulates protein synthe-sis in another peripheral tissue, the skin, and in cardiacmuscle of the neonatal pig (Davis et al., 2001). Theinsulin-stimulated responses in these tissues, like thatin skeletal muscle, also decrease with development. Bycontrast, insulin infusion, even in the presence of fast-ing levels of glucose and amino acids, does not stimulateprotein synthesis in visceral tissues including the liver,intestine, pancreas, and kidney (Davis et al., 1999,2001, 2002), even though feeding stimulates proteinsynthesis in these tissues (Burrin et al., 1995; Davis etal., 1996, 1997). This suggests that the feeding-inducedstimulation of visceral tissue protein synthesis in theyoung pig is not mediated by insulin and that differentmechanisms regulate the synthesis of muscle and vis-ceral tissue proteins in the neonatal animal.

Regulation of protein metabolism E47
Role of Amino Acids in the DevelopmentalRegulation of Protein Synthesis
The postprandial rise in amino acids plays an im-portant role in the feeding-induced stimulation of pro-tein synthesis. Our recent studies have shown that theinfusion of an amino acid mixture to raise the circulat-ing amino acid concentration to the fed level, in thepresence of either euinsulinemia or hyperinsulinemia,stimulates protein synthesis in skeletal muscle of theneonatal pig, similar to the stimulatory effect of feedingand insulin infusion (Davis et al., 1998, 2002). The re-sponse to hyperaminoacidemia decreases with develop-ment in parallel with the developmental decline in thefeeding-induced stimulation of skeletal muscle proteinsynthesis. The stimulation of skeletal muscle proteinsynthesis by amino acids is greater in muscles thatcontain predominately fast-twitch, glycolytic musclefibers than in slower oxidative muscles and is similarin myofibrillar and sarcoplasmic proteins. In contrast,amino acid infusion has little effect on other insulin-responsive tissues, that is, cardiac muscle and skin.Hyperaminoacidemia, in the presence of either euinsul-inemia or hyperinsulinemia, increases protein synthe-sis in insulin-unresponsive tissues, that is, liver, kid-ney, and pancreas. The ability of amino acids to stimu-late protein synthesis in liver appears to wane withdevelopment, consistent with the ability of amino acidsto stimulate liver protein synthesis in growing (Flaimet al., 1982; Shah et al., 1999) but not adult (Mosoni etal., 1993) rats. Interestingly, amino acid infusion, likeinsulin infusion, has no effect on protein synthesis inthe intestine.
The results suggest that the feeding-induced stimula-tion of protein synthesis in skeletal muscle is mediatedby both amino acids and insulin. The postprandial risein amino acids also stimulates protein synthesis in theliver, kidney, and pancreas, whereas the postprandialrise in insulin also stimulates protein synthesis in theheart and skin. Because amino acids were infused intothe peripheral circulation, we postulate that amino acidsupply to the mucosal rather than the serosal side ofthe enterocyte may be the important modulator of thefeeding-induced stimulation of intestinal protein syn-thesis. Thus, it appears that the stimulation of proteinsynthesis by feeding is mediated by either insulin oramino acids in most tissues of the neonatal pig, butin skeletal muscle, the feeding-induced stimulation ofprotein synthesis is regulated by both insulin andamino acids. The ability of skeletal muscle to respondto two anabolic stimuli likely contributes to the morerapid gain in protein mass in the skeletal muscle of theneonate than in the body as a whole.
Intracellular Mechanisms Regulating theDevelopmental Changes in Muscle
Protein Synthesis in Vivo
Recent studies have been revealing the cellular mech-anisms that regulate the rapid growth of skeletal mus-
cle during early postnatal life. The high rate of proteinsynthesis in immature muscle and its decline with de-velopment are driven largely by an elevated numberof ribosomes at birth and a developmental decline inribosome abundance as the musculature matures(Davis et al., 1989, 2001). The feeding-induced stimula-tion of protein synthesis can be attributed to an increasein the efficiency of the translation process, that is, theamount of protein synthesized per ribosome (Davis etal., 1993a, 1996). Because acute regulation of proteinsynthesis is achieved, in part, through changes in therate of translation of mRNA via alterations in peptide-chain initiation (Harmon et al., 1984; Kimball and Jef-ferson, 1988; Kimball et al., 1994), recent studies haveexamined the developmental changes in the expressionand activation of eukaryotic initiation factors (eIF) thatregulate translation initiation in skeletal muscle. Be-cause the postprandial elevation in skeletal muscle pro-tein synthesis in neonatal pigs is mediated, in part, byinsulin (Davis et al., 2001; Wray-Cahen et al., 1998),the developmental changes in the insulin signalingpathway that regulate protein synthesis have alsobeen examined.
Our studies have shown that insulin receptor abun-dance in skeletal muscle decreases with developmentin parallel with the overall developmental decline inmuscle protein synthesis (Suryawan et al., 2001). Theactivation of the insulin receptor in response to feedingdecreases with development, even when expressed rela-tive to insulin receptor abundance. This developmentaldecline in the feeding-induced activation of the insulinreceptor is propagated down the signaling pathway toinsulin receptor substrate (IRS)-1 and -2, phosphatidyl-inositol 3-kinase (PI 3-kinase), and protein kinase B(PKB). The phosphorylation of subsequent signalingcomponents that regulate the protein synthetic appara-tus, ribosomal protein S6 kinase (S6K1) and 4E-bindingprotein 1 (4E-BP1) also increases after a meal, a re-sponse that decreases with development (Davis et al.,2000). The feeding-induced increase in the phosphory-lation of 4E-BP1 results in the dissociation of the inac-tive 4E-BP1�eIF4E complex, an increased associationof eIF4E�eIF4G, and thus an enhanced assembly of theactive eIF4F complex that mediates the binding ofmRNA to the 40S ribosomal subunit. The feeding-in-duced activation of S6K1, assembly of the active eIF4Fcomplex, and stimulation of protein synthesis in neona-tal pig muscle can be attenuated, but not completelyblocked, by inhibiting the protein kinase mTOR (mam-malian target of rapamycin), a component of the insulinsignal transduction pathway that is downstream ofPKB (Kimball et al., 2000).
Together, these results suggest that the develop-mental decline in the response of skeletal muscle pro-tein synthesis to food consumption results from a reduc-tion in the capacity of the intracellular signaling path-way to transduce to the translational apparatus thestimulus provided by the postprandial rise in circulat-ing insulin and(or) amino acid concentration. The re-
Davis et al.E48
sults further suggest that an mTOR-dependent processinvolving enhanced assembly of the active eIF4F com-plex accounts for part of the postprandial stimulationof muscle protein synthesis. However, additional stepsmay be involved in the regulation of this process, andthey warrant further study.
Implications
Neonatal animals deposit protein at high rates andefficiently utilize dietary amino acids for protein deposi-tion. This high efficiency is associated with an elevatedstimulation of protein synthesis by feeding, which isparticularly marked in skeletal muscle. The rapid rateof protein synthesis in skeletal muscle of the neonateis enabled by the high ribosome abundance and theenhanced sensitivity of protein synthesis to both insulinand amino acids. An enhanced feeding-induced activa-tion of the insulin-signaling pathway leading to transla-tion initiation in skeletal muscle of the neonatal piglikely plays a crucial role in initiating the processesthat result in the high rate of protein deposition inskeletal muscle during early postnatal life. Furtherstudy of the fundamental mechanisms that regulatethe high rate of protein deposition in early life mayhave important implications with respect to the im-provement of neonatal survival and the enhancementof lean tissue growth in pigs.
Literature Cited
Baillie, A. G. S., and P. J. Garlick. 1991. Attenuated responses ofmuscle protein synthesis to fasting and insulin in adult femalerats. Am. J. Physiol. 262:E1–E5.
Burrin, D. G., T. A. Davis, S. Ebner, P. A. Schoknecht, M. L. Fiorotto,and P. J. Reeds. 1997. Colostrum enhances the nutritional stimu-lation of vital organ protein synthesis in neonatal pigs. J. Nutr.127:1284–1289.
Burrin, D. G., T. A. Davis, S. Ebner, P. A. Schoknecht, M. L. Fiorotto,P. J. Reeds, and S. McAvoy. 1995. Nutrient-independent andnutrient-dependent factors stimulate protein synthesis in colos-trum-fed newborn pigs. Pediatr. Res. 37:593–599.
Burrin, D. G., T. A. Davis, M. L. Fiorotto, and P. J. Reeds. 1991.Stage of development and fasting affect protein synthetic activityin the gastrointestinal tissues of suckling rats. J. Nutr.121:1099–1108.
Burrin, D. G., T. A. Davis, M. L. Fiorotto, and P. J. Reeds. 1992.Hepatic protein synthesis in suckling rats: Effects of stage ofdevelopment and fasting. Pediatr. Res. 31:247–252.
Davis, T. A., D. G. Burrin, M. L. Fiorotto, and H. V. Nguyen. 1996.Protein synthesis in skeletal muscle and jejunum is more respon-sive to feeding in 7- than in 26-day-old pigs. Am. J. Physiol.270:E802–E809.
Davis, T. A., D. G. Burrin, M. L. Fiorotto, P. J. Reeds, and F. Jahoor.1998. Roles of insulin and amino acids in the regulation of proteinsynthesis in the neonate. J. Nutr. 128:347S–350S.
Davis, T. A., M. L. Fiorotto, D. G. Burrin, W. G. Pond, and H. V.Nguyen. 1997. Intrauterine growth restriction does not alterresponse of protein synthesis to feeding in newborn pigs. Am.J. Physiol. 272:E877–E884.
Davis, T. A., M. L. Fiorotto, P. R. Beckett, D. G. Burrin, P. J. Reeds,D. Wray-Cahen, and H. V. Ngugyen. 2001. Differential effectsof insulin on peripheral and visceral tissue protein synthesis inneonatal pigs. Am. J. Physiol. 280:E770–E779.
Davis, T. A., M. L. Fiorotto, D. G. Burrin, P. J. Reeds, H. V. Nguyen,P. R. Beckett, R. C. Vann, and P. M. J. O’Connor. 2002. Stimula-tion of protein synthesis by both insulin and amino acids isunique to skeletal muscle in neonatal pigs. Am. J. Physiol. (Inpress).
Davis, T.A., M. L. Fiorotto, H. V. Nguyen, and D. G. Burrin. 1999.Aminoacyl-tRNA and tissue free amino acid pools are equili-brated after a flooding dose of phenylalanine. Am. J. Physiol.Endocrinol. Metabol. 277:E103–E109.
Davis, T. A., M. L. Fiorotto, H. V. Nguyen, D. G. Burrin, and P. J.Reeds. 1991. Response of muscle protein synthesis to fasting insuckling and weaned rats. Am. J. Physiol. 261:R1373–R1380.
Davis, T. A., M. L. Fiorotto, H. V. Nguyen, and P. J. Reeds. 1989.Protein turnover in skeletal muscle of suckling rats. Am. J.Physiol. 257:R1141–R1146.
Davis, T. A., M. L. Fiorotto, H. V. Nguyen, and P. J. Reeds. 1993a.Enhanced response of muscle protein synthesis and plasma insu-lin to food intake in suckled rats. Am. J. Physiol. 265:R334–R340.
Davis, T. A., M. L. Fiorotto, and P. J. Reeds. 1993b. Amino acidcompositions of body and milk protein change during the suck-ling period in rats. J. Nutr. 123:947–956.
Davis, T. A., H. V. Nguyen, A. Suryawan, J. A. Bush, L. S. Jefferson,and L. S. Kimball. 2000. Developmental changes in the feeding-induced stimulation of translation initiation in skeletal muscleand liver of neonatal pigs. Am. J. Physiol. Endocrinol. Metab.279:E1226–E1234.
DeFronzo, R. A., J. D. Tobin, and R. Andres. 1979. Glucose clamptechnique: A method for quantifying insulin secretion and resis-tance. Am. J. Physiol. Endocrinol. Metab. 237:E214–E223.
Denne, S. C., and S. C. Kalhan. 1987. Leucine metabolism in humannewborns. Am. J. Physiol. 253:E608–E615.
Denne, S. C., E. M. Rossi, and S. C. Kalhan. 1991. Leucine kineticsduring feeding in normal newborns. Pediatr. Res. 30:23–27.
Fiorotto, M. L., D. G. Burrin, M. Perez, and P. J. Reeds. 1991. Intakeand use of milk nutrients by rat pups suckled in small, medium,or large litters. Am. J. Physiol. 260:R1104–R1113.
Fiorotto, M. L., T. A. Davis, and P. J. Reeds. 2000. Regulation ofmyofibrillar protein turnover during maturation in normal andundernourished rat pups. Am. J. Physiol. 278:R845–R854.
Flaim, K. E., D. E. Peavy, W. V. Everson, and L. S. Jefferson. 1982.The role of amino acids in the regulation of protein synthesisin perfused rat liver. J. Biol. Chem. 257:2932–2938.
Garlick, P. J., M. Fern, and V. R. Preedy. 1983. The effect of insulininfusion and food intake on muscle protein synthesis in postab-sorptive rats. Biochem. J. 210:669–676.
Gelfand, R. A., and E. J. Barrett. 1987. Effect of physiologic hyperin-sulinemia on skeletal muscle protein synthesis and breakdownin man. J. Clin. Investig. 80:1–6.
Goldspink, D. F., and F. J. Kelly. 1984. Protein turnover and growthin the whole body, liver and kidney of the rat from the foetusto senility. Biochem. J. 217:507–516.
Harmon, C. S., C. G. Proud, and V. M. Pain. 1984. Effects of starvation,diabetes and acute insulin treatment on the regulation of poly-peptide-chain initiation in rat skeletal muscle. Biochem. J.223:687–696.
Heslin, M. J., E. Newman, R. F. Wolf, P. W. T. Pisters, and M. F.Brennan. 1992. Effect of hyperinsulinemia on whole body andskeletal muscle leucine carbon kinetics in humans. Am. J. Phys-iol. 262:E911–E918.
Kimball, S. R., and L. S. Jefferson. 1988. Cellular mechanisms in-volved in the action of insulin on protein synthesis. DiabetesMetab. Rev. 4:773–787.
Kimball, S. R., L. S. Jefferson, H. V. Nguyen, A. Suryawan, J. A. Bush,and T. A. Davis. 2000. Feeding stimulates protein synthesis inmuscle and liver of neonatal pig through an mTOR-dependentprocess. Am. J. Physiol. 279:E1080–E1087.
Kimball, S. R., T. C. Vary, and L. S. Jefferson. 1994. Regulation ofprotein synthesis by insulin. Ann. Rev. Physiol. 56:321–348.
Liechty, E. A., D. W. Boyle, H. Moorehead, Y. M. Liu, and S. C. Denne.1992. Effect of hyperinsulinemia on ovine fetal leucine kinetics

Regulation of protein metabolism E49
during prolonged maternal fasting. Am. J. Physiol. 263:E696–E702.
Louard, R. J., D. A. Fryburg, R. A. Gelfand, and E. J. Barrett. 1992.Insulin sensitivity of protein and glucose metabolism in humanforearm skeletal muscle. J. Clin. Investig. 90:2348–2354.
McCracken, K. J., S. M. Eddie, and W. G. Stevenson.1980. Energyand protein utilization of early-weaned pigs. Effect of energyintake and energy:protein on growth, efficency and nitrogen uti-lization of pigs between 8-32d. Br. J. Nutr. 43:289–304.
McNulty, P. A., L. H. Young, and E. J. Barrett. 1993. Response ofrat heart and skeletal muscle protein in vivo to insulin andamino acid infusion. Am. J. Physiol. 264:E958–E965.
Melville, S., M. A. McNurlan, K. C. McHardy, J. Broom, E. Milne,A. G. Calder, and P. J. Garlick. 1989. The role of degradationin the acute control of protein balance in adult man: Failureof feeding to stimulate protein synthesis as assessed by L-[1-13C]leucine infusion. Metabolism. 38:248–255.
Mosoni, L., M.-L. Houlier, P. P. Mirand, G. Bayle, and J. Grizard.1993. Effect of amino acids alone or with insulin on muscle andliver protein synthesis in adult and old rats. Am. J. Physiol.264:E614–0E620.
Mosoni, L., T. Malmezat, M.-C. Valluy, M.-L. Houlier, and P. P.Mirand. 1996. Muscle and liver protein synthesis adapt effi-ciently to food deprivation and refeeding in 12-month-old rats.J. Nutr. 126:516–522.
Oddy, V. H., D. B. Lindsay, P. J. Barker, and A. J. Northrop. 1987.Effect of insulin on hind-limb and whole body leucine and proteinmetabolism in fed and fasted lambs. Br. J. Nutr. 58:437–452.
Preedy, V.R., L. Paska, P. H. Sugden, P. Schofield, and M. C. Sugden.1988. The effects of surgical stress and short-term fasting onprotein synthesis in vivo in diverse tissues of the mature rat.Biochem. J. 250:179–188.
Shah, O. J., D. A. Antonetti, S. R. Kimball, and L.S. Jefferson. 1999.Leucine, glutamine, and tyrosine reciprocally modulate thetranslation intiation factors eIF4F and eIF2B in perfused ratliver. J. Biol Chem. 274:36168–36175.
Skjaerlund, D. M., D. R. Mulvaney, W. G. Bergen, and R. A. Merkel.1994. Skeletal muscle growth and protein turnover in neonatalboars and barrows. J. Anim. Sci. 72: 315–321.
Suryawan, A., H. V. Nguyen, J.A. Bush, and T.A. Davis. 2001. Devel-opmental changes in the feeding-induced activation of the insu-lin signaling pathway in neonatal pigs. Am. J. Physiol. 281:E908–E915.
Tessari, P., M. Zanetti, R. Barazzoni, M. Vettore, and F. Michielan.1996. Mechanism of postprandial protein accretion in humanskeletal muscle. J. Clin. Investig. 98:1361– 1372.
Thureen P. J., B . Scheer, S. M. Anderson, J. A. Tooze, D. A. Young,and W. W. Hay. 2000. Effect of hyperinsulinemia on amino acidutilization in the ovine fetus. Am. J. Physiol. 279: E1294–E1304.
Wester, T. J., G. E. Lobley, L. M. Birnie, and M. A. Lomax. 2000.Insulin stimulates phenylalanine uptake across the hind limbin fed lambs. J. Nutr. 130:608–611.
Wray-Cahen, D., P. R. Beckett, H. V. Nguyen, and T. A. Davis. 1997.Insulin-stimulated amino acid utilization during glucose andamino acid clamps decreases with development. Am. J. Physiol.273:E305–E314.
Wray-Cahen, D., H. V. Nguyen, D. G. Burrin, P. R. Beckett, M. L.Fiorotto, P. J. Reeds, T. J. Wester, and T. A. Davis. 1998. Re-sponse of skeletal muscle protein synthesis to insulin in sucklingpigs decreases with development. Am. J. Physiol. 275:E602–E609.
Young, V. R. 1970. The role of skeletal and cardiac muscle in theregulation of protein metabolism. In: H. M. Munro (ed.) Mamma-lian Protein Metabolism. vol. 4. pp 585–674. Academic Press,New York.

Stress and muscle wasting1
P.-O. Hasselgren2
Department of Surgery, University of Cincinnati, Cincinnati, OH 45267-0558
ABSTRACT: One of the metabolic hallmarks of sep-sis and severe injury is the catabolic response in skele-tal muscle, mainly reflecting increased protein break-down, in particular myofibrillar protein breakdown.This review describes recent knowledge regarding themolecular mechanisms of sepsis-induced muscle wast-ing. Among different intracellular proteolytic path-ways, the energy-ubiquitin-dependent pathway is par-ticularly important for the regulation of muscle proteinbreakdown during sepsis, both in animals and humans.The gene expression of ubiquitin, ubiquitin-conjugating
Key Words: Calpain, Muscles, Proteolysis, Sepsis, Ubiquitin
2002 American Society of Animal Science. All rights reserved. J. Anim. Sci. 80(E. Suppl. 2):E50–E55
Introduction
Sepsis and severe injury, including burn injury, areassociated with increased degradation of muscle pro-teins, resulting in muscle wasting (Hasselgren, 1999b).There is evidence that muscle protein breakdown inthese conditions mainly reflects degradation of the con-tractile myofibrillar proteins actin and myosin (Hassel-gren et al., 1989), in part explaining why patients withsevere metabolic stress experience muscle fatigue. Mus-cle wasting in patients with sepsis and severe injuryhas important clinical implications because it can pre-vent or delay ambulation, increasing the risk for throm-boembolic complications and prolonging rehabilitation.In addition, when respiratory muscles are affected(Reid and MacGowan, 1998), there is an increased riskfor pulmonary complications and a need for extendedventilatory support. Understanding the mechanisms,including the molecular regulation, of the catabolic re-sponse in skeletal muscle, therefore, is important bothfrom a biological and clinical standpoint. The purposeof this review is to describe recent knowledge with re-gard to intracellular mechanisms of sepsis-induced
1Supported in part by NIH grant DK 37908 and by grants fromthe Shriners of North America.
2Correspondence: 231 Albert Sabin Way (phone: 513-584-4841; fax:513-584-2958; E-mail: [email protected]).
Received July 24, 2001.Accepted January 22, 2002.
E50
enzyme E214k, ubiquitin ligase E3α, and several compo-nents of the 20S proteasome is up-regulated and theactivity of the 20S proteasome is increased in muscleduring sepsis. In addition, sepsis-induced muscle prote-olysis can be blocked by specific proteasome inhibitors,both in vivo and in vitro. Sepsis is also associated withincreased calcium levels and upregulated gene expres-sion of calpains in skeletal muscle. Calcium-calpain-dependent release of myofilaments from the sarcomereprovides substrates for the ubiquitin-proteasome path-way and may be an early component of sepsis-inducedmuscle wasting.
muscle proteolysis. In particular, evidence for involve-ment of the ubiquitin-proteasome and calcium-calpain-dependent proteolytic pathways is discussed. More ex-tensive reviews of intracellular mechanisms and molec-ular regulation of muscle wasting were recently pub-lished elsewhere (Mitch and Goldberg, 1996; Hassel-gren and Fischer, 2001).
The Ubiquitin-Proteasome Pathway
The ubiquitin-proteasome proteolytic pathway wasreviewed recently by Hershko and Ciechanover (1998)and by Attaix (2002) and will be described only brieflyhere. Proteins degraded by this mechanism are firstconjugated to multiple molecules of ubiquitin, which isa 76-amino acid, 8.5-kDa residue. The ubiquitinationof proteins is regulated by at least three sets of enzymes,the ubiquitin activating enzyme E1, ubiquitin conjugat-ing enzyme E2, and ubiquitin ligase E3. The structureof the ubiquitin system is hierarchical in that a singleE1 activates ubiquitin for most modifications, whereassubstrate and tissue specificity are accounted for bydifferent E2 and E3. There is evidence that the 14-kDaE214k and E3α are important for the degradation ofproteins in skeletal muscle (Wing and Banville, 1994;Kwon et al., 1998). It is possible that other E3 areequally, or perhaps even more, important than E3α inskeletal muscle. For example, recent studies suggestthat the ubiquitin ligases Muscle Ring Finger 1, MuscleAtrophy F-box (Bodine et al., 2001), and atrogin-1
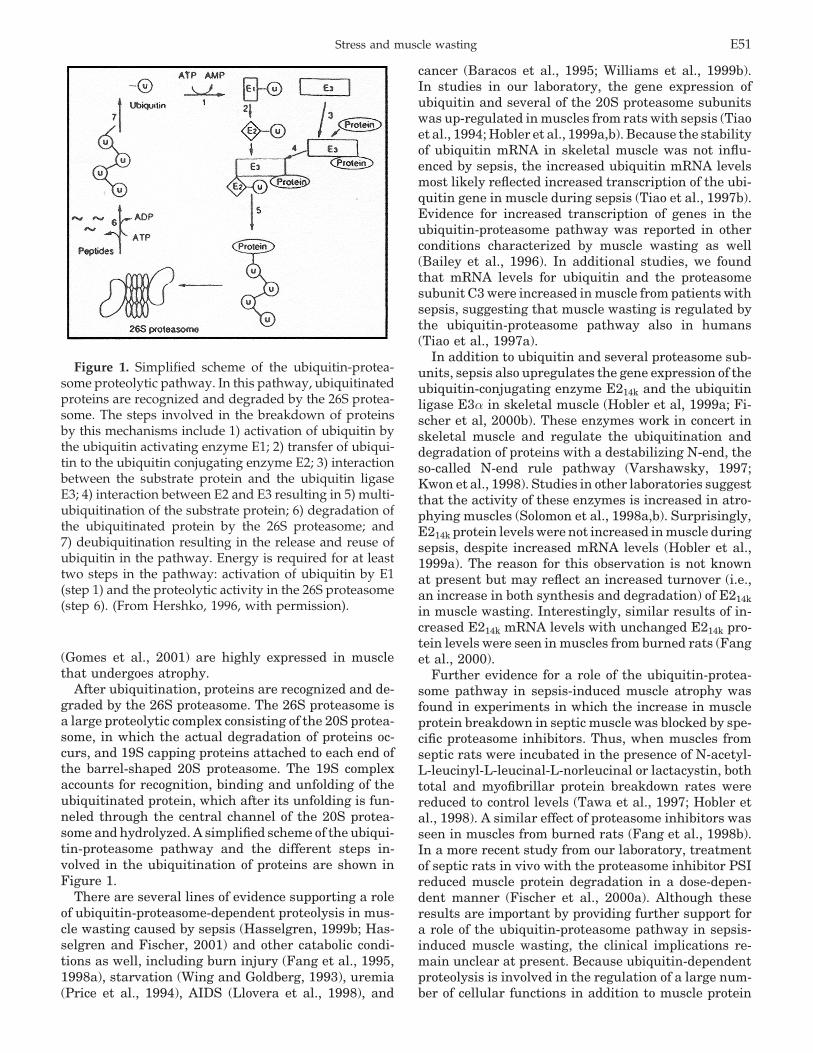
Stress and muscle wasting E51
Figure 1. Simplified scheme of the ubiquitin-protea-some proteolytic pathway. In this pathway, ubiquitinatedproteins are recognized and degraded by the 26S protea-some. The steps involved in the breakdown of proteinsby this mechanisms include 1) activation of ubiquitin bythe ubiquitin activating enzyme E1; 2) transfer of ubiqui-tin to the ubiquitin conjugating enzyme E2; 3) interactionbetween the substrate protein and the ubiquitin ligaseE3; 4) interaction between E2 and E3 resulting in 5) multi-ubiquitination of the substrate protein; 6) degradation ofthe ubiquitinated protein by the 26S proteasome; and7) deubiquitination resulting in the release and reuse ofubiquitin in the pathway. Energy is required for at leasttwo steps in the pathway: activation of ubiquitin by E1(step 1) and the proteolytic activity in the 26S proteasome(step 6). (From Hershko, 1996, with permission).
(Gomes et al., 2001) are highly expressed in musclethat undergoes atrophy.
After ubiquitination, proteins are recognized and de-graded by the 26S proteasome. The 26S proteasome isa large proteolytic complex consisting of the 20S protea-some, in which the actual degradation of proteins oc-curs, and 19S capping proteins attached to each end ofthe barrel-shaped 20S proteasome. The 19S complexaccounts for recognition, binding and unfolding of theubiquitinated protein, which after its unfolding is fun-neled through the central channel of the 20S protea-some and hydrolyzed. A simplified scheme of the ubiqui-tin-proteasome pathway and the different steps in-volved in the ubiquitination of proteins are shown inFigure 1.
There are several lines of evidence supporting a roleof ubiquitin-proteasome-dependent proteolysis in mus-cle wasting caused by sepsis (Hasselgren, 1999b; Has-selgren and Fischer, 2001) and other catabolic condi-tions as well, including burn injury (Fang et al., 1995,1998a), starvation (Wing and Goldberg, 1993), uremia(Price et al., 1994), AIDS (Llovera et al., 1998), and
cancer (Baracos et al., 1995; Williams et al., 1999b).In studies in our laboratory, the gene expression ofubiquitin and several of the 20S proteasome subunitswas up-regulated in muscles from rats with sepsis (Tiaoet al., 1994; Hobler et al., 1999a,b). Because the stabilityof ubiquitin mRNA in skeletal muscle was not influ-enced by sepsis, the increased ubiquitin mRNA levelsmost likely reflected increased transcription of the ubi-quitin gene in muscle during sepsis (Tiao et al., 1997b).Evidence for increased transcription of genes in theubiquitin-proteasome pathway was reported in otherconditions characterized by muscle wasting as well(Bailey et al., 1996). In additional studies, we foundthat mRNA levels for ubiquitin and the proteasomesubunit C3 were increased in muscle from patients withsepsis, suggesting that muscle wasting is regulated bythe ubiquitin-proteasome pathway also in humans(Tiao et al., 1997a).
In addition to ubiquitin and several proteasome sub-units, sepsis also upregulates the gene expression of theubiquitin-conjugating enzyme E214k and the ubiquitinligase E3α in skeletal muscle (Hobler et al, 1999a; Fi-scher et al, 2000b). These enzymes work in concert inskeletal muscle and regulate the ubiquitination anddegradation of proteins with a destabilizing N-end, theso-called N-end rule pathway (Varshawsky, 1997;Kwon et al., 1998). Studies in other laboratories suggestthat the activity of these enzymes is increased in atro-phying muscles (Solomon et al., 1998a,b). Surprisingly,E214k protein levels were not increased in muscle duringsepsis, despite increased mRNA levels (Hobler et al.,1999a). The reason for this observation is not knownat present but may reflect an increased turnover (i.e.,an increase in both synthesis and degradation) of E214kin muscle wasting. Interestingly, similar results of in-creased E214k mRNA levels with unchanged E214k pro-tein levels were seen in muscles from burned rats (Fanget al., 2000).
Further evidence for a role of the ubiquitin-protea-some pathway in sepsis-induced muscle atrophy wasfound in experiments in which the increase in muscleprotein breakdown in septic muscle was blocked by spe-cific proteasome inhibitors. Thus, when muscles fromseptic rats were incubated in the presence of N-acetyl-L-leucinyl-L-leucinal-L-norleucinal or lactacystin, bothtotal and myofibrillar protein breakdown rates werereduced to control levels (Tawa et al., 1997; Hobler etal., 1998). A similar effect of proteasome inhibitors wasseen in muscles from burned rats (Fang et al., 1998b).In a more recent study from our laboratory, treatmentof septic rats in vivo with the proteasome inhibitor PSIreduced muscle protein degradation in a dose-depen-dent manner (Fischer et al., 2000a). Although theseresults are important by providing further support fora role of the ubiquitin-proteasome pathway in sepsis-induced muscle wasting, the clinical implications re-main unclear at present. Because ubiquitin-dependentproteolysis is involved in the regulation of a large num-ber of cellular functions in addition to muscle protein

HasselgenE52
breakdown, such as regulation of the cell cycle, activa-tion of transcription factors, and the immune response(Hershko and Ciechanover, 1998), the administrationof a proteasome inhibitor in vivo may result in signifi-cant side effects. Further studies are needed before pro-teasome inhibitors would be considered for the preven-tion or treatment of muscle wasting in patients withmetabolic stress.
Calcium/Calpain-DependentRelease of Myofilaments
Because previous studies suggest that it is mainlymyofibrillar proteins that are subjected to ubiquitin-proteasome-dependent degradation in muscle duringsepsis and other catabolic conditions (Hasselgren et al.,1989; Tiao et al., 1994), it is interesting that the protea-some does not degrade intact myofibrils (Koohmaraie,1992; Solomon and Goldberg, 1996). Recent observa-tions suggest that actin and myosin are released fromthe sarcomere by a calcium/calpain-dependent mecha-nism before ubiquitination and degradation and it ispossible that the released myofilaments have destabi-lizing N-ends and therefore are substrates in the N-end rule pathway. In studies from our laboratory wefound morphological evidence for disruption of sarco-meric Z-disks (which are the anchoring sites for actinand myosin) and biochemical evidence for release ofmyofilaments from the sarcomere (Williams et al.,1999a). In the same study, sepsis resulted in upregu-lated gene expression of m- and �-calpain and the mus-cle-specific calpain p94. Direct evidence for a role ofcalpain in muscle protein degradation was reported byHuang and Forsberg (1998). In other experiments, dan-trolene, which blocks the release of calcium from intra-cellular stores (Fruen et al., 1997), prevented the sepsis-induced increase in muscle calcium levels, release ofmyofilaments, and total and myofibrillar protein degra-dation (Hotchkiss and Karl, 1994; Williams et al.,1999a; Fischer et al., 2001). Other studies as well sup-port a role of calcium in the regulation of muscle proteindegradation (Sugden, 1980; Goldberg et al., 1984; Bar-acos et al., 1986). Taken together, these observationsare consistent with a model of sepsis-induced musclewasting in which calcium/calpain-dependent release ofactin and myosin is a “proximal” (and perhaps rate-limiting) event followed by ubiquitin-proteasome-de-pendent degradation of the myofilaments (Figure 2). Ifthis model is correct, the ubiquitin-proteasome-depen-dent proteolysis in muscle wasting may be the responseto an increased amount of substrates (released myofil-aments) rather than the cause of muscle breakdown.
It is interesting to note that in early studies, the roleof the ubiquitin-proteasome pathway was believed tobe the breakdown and disposal of abnormal and poten-tially harmful proteins (Hershko and Ciechanover,1998). It may therefore be argued that inhibition ofthe proteasome in muscle wasting would be harmful,allowing for the accumulation of abnormal proteins.
Figure 2. Model of sepsis-induced muscle wasting. Inthis model, sepsis results in calcium/calpain-dependentrelease of myofilaments from the sarcomere. The myofil-aments are ubiquitinated in the N-end rule pathway anddegraded by the 26S proteasome or reincorporated intothe myofibrils. This model offers two levels of possibletherapeutic intervention: inhibition of the calcium/cal-pain-dependent release of myofilaments (e.g., with dan-trolene) or inhibition of the ubiquitin-proteasome path-way (e.g., with proteasome inhibitor) (from Hasselgrenand Fischer, 2001, with permission).
However, other studies (van der Westhuyzen et al.,1981) suggest that myofilaments released from the sar-comere can be reincorporated into the myofibril (seeFigure 2) and it is possible that this process is enhancedif the proteasome-dependent degradation of the myo-filaments is blocked. Alternatively, abnormal proteinsmay be degraded by other proteolytic systems if theproteasome is inhibited. More studies are needed todefine the relationship between calpain-dependent re-lease of myofilaments and ubiquitin-proteasome-depen-dent protein degradation in muscle wasting.
Transcription Factors
Despite the fact that the expression of several genesinvolved in different proteolytic mechanisms is in-creased during muscle atrophy, surprisingly little infor-mation is available regarding transcription factors inskeletal muscle. In a recent study, we found evidencethat sepsis is associated with altered DNA binding ac-tivity of the “inflammatory” transcription factors NF-κB and AP-1 (Penner et al., 2001). Interestingly,whereas AP-1 activity was up-regulated in musclethroughout the septic course in rats after cecal ligationand puncture, NF-κB DNA binding activity was in-creased early during sepsis but was subsequently down-regulated (Figure 3). In other experiments, the DNAbinding activity of C/EBP as well was increased in sep-tic muscle (Gang et al., 2000), further supporting theconcept that multiple transcription factors that havebeen found previously to be involved in the inflamma-

Stress and muscle wasting E53
Figure 3. DNA binding activity of the transcriptionfactors AP-1 (upper panel) and NF-kB (lower panel) inrat extensor digitorum longus muscles at various time-points after sham-operation or cecal ligation and puncture(CLP). Competition reactions were performed by addingan excess of unlabeled wild-type or mutant oligonucleo-tide to the reactions (lanes 8 and 9, upper panel, and lanes3 and 4, lower panel). Similar results were observed inthree repeated experiments. (From Penner et al., 2001,with permission).
tory response in other tissues and cell types are acti-vated in skeletal muscle during sepsis.
In a recent analysis (using the MatInspector V 2.2program; Quandt et al., 1995) of the promoter of multi-ple genes in the ubiquitin-proteasome and calpain pro-teolytic pathways we found potential binding sites forAP-1, NF-κB, and C/EBP in the promoters of ubiquitin,E214k, E3α, several of the proteasome subunits and cal-pains, including the muscle-specific calpain p94. Fur-ther experiments are needed to determine whetherthese genes are indeed regulated by the transcriptionfactors described here and, more importantly, whetherthese genes are involved in the regulation of proteindegradation in muscle wasting.
Glucocorticoids are the most important mediator ofsepsis-induced muscle proteolysis (Hasselgren, 1999a).Treatment of septic rats with the glucocorticoid recep-tor antagonist RU 38486 blocked sepsis-induced muscleproteolysis in previous reports from our laboratory(Hall-Angeras et al., 1991; Tiao et al., 1996). In a morerecent study, the same treatment prevented the earlyup-regulation and the subsequent down-regulation of
NF-κB in skeletal muscle (Penner et al., 2001). Takentogether, these observations suggest that NF-κB mayregulate genes that are involved in the development ofmuscle wasting during sepsis.
Results from recent in vitro experiments support theconcept that NF-κB regulates gene(s) that are involvedin the regulation of muscle protein breakdown. Thus,in a study by Du et al. (2000), treatment of culturedmyotubes with dexamethasone reduced NF-κB DNAbinding activity and up-regulated transcription of thegene for the proteasome C3 subunit. The results in thatstudy were interpreted as indicating that NF-κB is asuppressor of the C3 gene and that the reduced NF-κBDNA binding activity seen in dexamethasone-treatedmyotubes results in increased expression and activityof the C3 gene, ultimately leading to stimulated proteinbreakdown. It is likely that other genes as well areimportant for the regulation of protein breakdown inatrophying muscle and that some of those genes maybe regulated by the transcription factors discussed here(and probably by other transcription factors as well).
Outlook
Although most existing data support a role of theubiquitin-proteasome proteolytic pathway and calpain-dependent release of myofilaments in muscle wastingduring stress, it is likely that other mechanisms areinvolved as well. For example, recent studies suggestthat the ubiquitination of proteins and processing ofubiquitinated proteins by the 26S proteasome may beinfluenced by the recently described COP9 signalosome(Wei and Deng, 1999). An intriguing observation is thatthe eight subunits of the signalosome are identical tothe lid components of the 19S capping protein(Schwechheimer and Deng, 2000). Also of interest isthe fact that the signalosome subunit CSN5/JAB1 is animportant coactivating factor for the c-jun subunit ofthe AP-1 transcription factor (Chamovitz and Segal,2001). The potential role of the COP9 signalosome inmuscle wasting is an exciting area for future research.
The proteasome degrades ubiquitinated proteins intopeptides and further proteolytic activity “beyond theproteasome” is needed for complete proteolysis into freeamino acids. The enzyme tripeptidyl peptidase II (TPPII) may be an important component of the degradationof peptides generated by proteolysis in the proteasome.Although TPP II was discovered almost 20 yr ago (Baloet al., 1983), it is only recently that its potential rela-tionship with the proteasome has been suggested. Likethe COP9 signalosome and the 26S proteasome, TPP IIis a “giant” complex consisting of at least eight subunits,each with a molecular weight of 130 kDa (Tomkinson,1999; Yao and Cohen, 1999). There is evidence that thecomplete assembly of this complex is needed for its fullproteolytic capacity, but the mechanisms regulating theassembly of TPP II are poorly understood at present.Tripeptidyl peptidase II cleaves peptides generated bythe 26S proteasome into tripeptides and has therefore

HasselgenE54
been characterized as an enzyme that “can count tothree” (Tomkinson, 1999). In recent experiments in ourlaboratory, we have found evidence that TPP II maybe involved in the degradation of peptides in musclefrom septic rats (C.W. Wray, B. Tomkinson, P.O. Has-selgren, unpublished observations). It will be importantin future experiments to determine the role of TPP II(and other peptidases) for the complete hydrolysis ofproteins in muscle during sepsis and other catabolicconditions.
Implications
Sepsis-induced muscle wasting is a significant clini-cal problem resulting in muscle weakness and fatigueand whole-body protein loss. Although ubiquitin-pro-teasome-dependent breakdown of myofibrillar proteinsplays a central role in muscle atrophy during sepsisand after severe injury, multiple other regulatory mech-anisms are involved as well. An increased understand-ing of the molecular regulation of muscle wasting instress may help in the future to develop novel treatmentstrategies in patients with muscle wasting.
Literature Cited
Attaix, D., L. Combaret, M.-N. Pouch, and D. Taillander. 2002. Cellu-lar control of ubiquitin-proteasome-dependent proteolysis. J.Anim. Sci. 80(E.-Suppl. 2): (In press).
Bailey, J. L., X. Wang, B. K. England, S. R. Price, X. Ding, and W.E. Mitch. 1996. The acidosis of chronic renal failure activatesmuscle proteolysis in rats by augmenting transcription of genesencoding proteins of the ATP-dependent ubiquitin-proteasomepathway. J. Clin. Investig. 97:1447–1453.
Balow, R. M., U. Ragnarsson, and O. Zetterquist. 1983. Tripeptidylaminopeptidase in the extralysosomal fraction of rat liver. J.Biol. Chem. 258:11622–11628.
Baracos, V. E., C. DeVivo, D. H. R. Hoyle, and A. L. Goldberg. 1995.Activation of the ATP-ubiquitin-proteasome pathway in skeletalmuscle of cachectic rats bearing a hepatoma. Am. J. Physiol.268:E996–E1006.
Baracos, V. E., R. E. Greenberg, and A. L. Goldberg. 1986. Influenceof calcium and other divalent cations on protein turnover in ratskeletal muscle. Am. J. Physiol. 250:E702–E710.
Bodine, S. C., E. Latres, S. Baumhueter, V. K. Lai, L. Nunez, B. A.Clarke, W. T. Poueymirou, F. J. Panaro, E. Na, K. Dharmarajan,Z. Q. Pan, D. M. Valenzuela, T. M. DeChiara, T. N. Stitt, G. D.Yancopoulos, and D. J. Glass. 2001. Identification of ubiquitinligases required for skeletal muscle atrophy. Science (Wash DC)294:1704–1708.
Chamovitz, D. A., and D. Segal. 2001. JAB1/CSN5 and the COP9signalasome. A complex situation. EMBO (Euro. Mol. Biol. Or-gan.) Rep. 21:96–101.
Du, J., W. E. Mitch, X. Wang, and S. R. Price. 2000. Glucocorticoidsinduce proteasome C3 subunit expression in L6 muscle cells byopposing the suppression of its transcription by NF-κB. J. Biol.Chem. 275:19661–19666.
Fang, C. H., B. G. Li, G. Tiao, J. J. Wang, J. E. Fischer, and P. O.Hasselgren. 1998a. The molecular regulation of protein break-down following burn injury is different in fast-and slow-twitchskeletal muscle. Int. J. Mol. Med. 1:163–169.
Fang, C. H., X. Sun, B. G. Li, D. R. Fischer, T. A. Pritts, G. Penner,and P. O. Hasselgren. 2000. Burn injuries in rats upregulatethe gene expression of the ubiquitin-conjugating enzyme E214k
in skeletal muscle. J. Burn Care Rehabil. 21:528–534.
Fang, C. H., G. Tiao, J. H. James, C. Ogle, J. E. Fischer, and P. O.Hasselgren. 1995. Burn injury stimulates multiple proteolyticpathways in skeletal muscle including the ubiquitin-energy-de-pendent pathway. J. Am. Coll. Surg. 180:161–170.
Fang, C. H., J. J. Wang, S. Hobler, B. G. Li, J. E. Fischer, and P. O.Hasselgren. 1998b. Proteasome blockers inhibit protein break-down in skeletal muscle after burn injury in rats. Clin. Sci.(Lond.) 95:225–233.
Fischer, D. R., G. Gang, T. Pritts, and P. O. Hasselgren. 2000a.Sepsis-induced muscle proteolysis is prevented by a proteasomeinhibitor in vivo. Biochem. Biophys. Res. Commun. 270:215–221.
Fischer, D. R., X. Sun, G. Gang, T. Pritts, and P. O. Hasselgren. 2000b.The gene expression of ubiquitin ligase E3α is upregulated inskeletal muscle during sepsis in rats. Potential role of glucocorti-coids. Biochem. Biophys. Res. Commun. 267:504–508.
Fischer, D. R., X. Sun, A. B. Williams, G. Gang, T. A. Pritts, J. H.James, M. Malloy, J. E. Fischer, R. J. Paul, and P. O. Hasselgren.2001. Dantrolene reduces serum TNFα and corticosterone levelsand muscle calcium, calpain gene expression, and protein break-down in septic rats. Shock 15:200–207.
Fruen, B. R., J. R. Michelson, and C. F. Louis. 1997. Dantroleneinhibition of sarcoplasmic reticulum calcium release by directand specific action at skeletal muscle ryanodine receptors. J.Biol. Chem. 272:26965–26971.
Gang, G., C. G. Penner, D. R. Fischer, and P. O. Hasselgren. 2000.Sepsis upregulates the DNA binding activity of the inflammatorytranscription factors NF-κB, C/EBP, and AP-1 in rat skeletalmuscle. Surg. Forum (Chic.) 51:214–216.
Goldberg, A. L., V. Baracos, P. Rodemann, L. Waxman, and C. Dinare-llo. 1984. Control of protein degradation in muscle by prostaglan-dins, Ca2+, and leukocytic pyrogen (interleukin-1). Fed. Proc.43:1301–1306.
Gomes, M. D., S. H. Lecker, R. T. Jagoe, A. Navon, and A. L. Goldberg.2001. Atrogin-1, a muscle specific F-box protein highly expressedduring muscle atrophy. Proc. Natl. Acad. Sci. USA 98:14440–14445.
Hall-Angeras, M., U. Angeras, O. Zamir, P.O. Hasselgren, and J.E.Fischer. 1991. Effect of the glucocorticoid receptor antagonistRU 38486 on muscle protein breakdown in sepsis. Surgery109:468–473.
Hasselgren, P. O. 1999a. Glucocorticoids and muscle catabolism.Curr. Opin. Nutr. Metab. Care 2:201–205.
Hasselgren, P. O. 1999b. Pathways of muscle protein breakdown ininjury and sepsis. Curr. Opin. Clin. Nutr. Metab. Care 2:155–160.
Hasselgren, P. O., and J. E. Fischer. 2001. Muscle cachexia: Currentconcepts of intracellular mechanisms and molecular regulation.Ann. Surg. 233:9–17.
Hasselgren, P. O., J. H. James, D. W. Benson, M. Hall-Angeras, U.Angeras, D. T. Hiyawa, S. Li, and J. E. Fischer. 1989. Total andmyofibrillar protein breakdown in different types of rat skeletalmuscle: effects of sepsis and regulation by insulin. Metabolism38:634–640.
Hershko, A. 1996. Lessons from the discovery of the ubiquitin system.Trends Biochem. Sci. 21:445–449.
Hershko, A., and A. Ciechanover. 1998. The ubiquitin system. Annu.Rev. Biochem. 67:425–479.
Hobler, S. C., G. Tiao, J. E. Fischer, J. Monaco, and P. O. Hasselgren.1998. The sepsis-induced increase in muscle proteolysis isblocked by specific proteasome inhibitors. Am. J. Physiol.274:R30–R37.
Hobler, S. C., J. J. Wang, A. B. Williams, F. Melandri, X. Sun, J. E.Fischer, and P. O. Hasselgren. 1999a. Sepsis is associated withincreased ubiquitin conjugating enzyme E214k mRNA in skeletalmuscle. Am. J. Physiol. 276:R468–R473.
Hobler, S. C., A. B. Williams, D. R. Fischer, J. J. Wang, X. Sun, J.E. Fischer, J. J. Monaco, and P. O. Hasselgren. 1999b. Activityand expression of the 20S proteasome are increased in skeletalmuscle during sepsis. Am. J. Physiol. 277:R434–R440.
Hotchkiss, R. S., and I. E. Karl. 1994. Dantrolene ameliorates themetabolic hallmarks of sepsis in rats and improves survival

Stress and muscle wasting E55
in a mouse model of endotoxemia. Proc. Natl. Acad. Sci. USA91:3039–3043.
Huang, J., and N. E. Forsberg. 1998. Role of calpain in skeletal-muscleprotein degradation. Proc. Natl. Acad. Sci. USA 95:12100–12105.
Koohmaraie, M. 1992. Ovine skeletal muscle multicatalytic protein-ase complex (proteasome): Purification, characterization, andcomparison of its effects on myofibrils with �-calpains. J. Anim.Sci. 70:3697–3708.
Kwon, Y. T., Y. Reiss, V. A. Fried, A. Hershko, J. K. Yoon, D. K.Gonda, P. Sangan, N. G. Copeland, N. A. Jenkins, and A. Vars-havsky. 1998. The mouse and human genes encoding the recogni-tion component of the N-end rule pathway. Proc. Natl. Acad.Sci. USA 95:7898–7903.
Llovera, M., C. Garzia-Martinez, N. Agell, F. J. Lopez-Soriano, F. J.Authier, R. K. Gherarrdi, and J. M. Argiles. 1998. Ubiquitin andproteasome gene expression is increased in skeletal muscle ofslim AIDS patients. Int. J. Mol. Med. 2:69–73.
Mitch, W. E., and A. L. Goldberg. 1996. Mechanisms of muscle wast-ing. The role of the ubiquitin-proteasome pathway. N. Engl. J.Med. 335:1897–1905.
Penner, C. G., G. Gang, C. Wray, J. E. Fischer, and P. O. Hasselgren.2001. The transcription factors NF-κB and AP-1 are differen-tially regulated in skeletal muscle during sepsis. Biochem. Bio-phys. Res. Commun. 281:1331–1336.
Price, S. R., B. K. England, J. K. Bailey, K. van Vreede, and W. E.Mitch. 1994. Acidosis and glucocorticoids concomitantly increaseubiquitin and proteasome subunit mRNAs in rat muscle. Am.J. Physiol. 267:C955–C960.
Quandt, K., K. Frech, H. Karas, E. Wingender, and T. Werner. 1995.MatInd and MatInspector. New fast and versatile tools for detec-tion of consensus matches in nucleotide sequence data. NucleicAcids Res. 23:4878-4884.
Reid, W. D., and N. A. MacGowan. 1998. Respiratory muscle injuryin animal models and humans. Mol. Cell. Biochem. 179:63-80.
Schwechheimer, C., and X. W. Deng. 2000. The COP/DET/FUS pro-teins-regulators of eukaryotic growth and development. Cell De-velopm. Biol. 11:495–503.
Solomon, V., V. Baracos, P. Sarraf, and A. L. Goldberg. 1998a. Ratesof ubiquitin conjugation increase when muscles atrophy, largelythrough activation of the N-end rule pathway. Proc. Natl. Acad.Sci. USA 95:12602–12607.
Solomon V., and A. L. Goldberg. 1996. Importance of the ATP-ubiqui-tin-proteasome pathway in the degradation of soluble and myo-fibrillar proteins in rabbit muscle extracts. J. Biol. Chem.271:26690–26697.
Solomon, V., S. H. Lecker, and A. L. Goldberg. 1998b. The N-end rulepathway catalyzes a major fraction of the protein degradation inskeletal muscle. J. Biol. Chem. 273:25216–25222.
Sugden, P. H. 1980. The effects of calcium ions, ionophore A23187,and inhibition of energy metabolism on protein degradation inthe rat diaphragm and epitrochlearis muscles in vitro. Biochem.J. 190:593–603.
Tawa, N. E., R. Odessey, and A. L. Goldberg. 1997. Inhibitors of theproteasome reduce the accelerated proteolysis in atrophying ratskeletal muscles. J. Clin. Investig. 100:197–203.
Tiao, G., J. M. Fagan, V. Roegner, M. Lieberman, J. J. Wang, J. E.Fischer, and P. O. Hasselgren. 1996. Energy-ubiquitin-depen-dent muscle proteolysis during sepsis in rats is regulated byglucocorticoids. J. Clin. Investig. 97:339–348.
Tiao, G., J. M. Fagan, N. Samuels, J. H. James, K. Hudson, M.Lieberman, J. E. Fischer, and P. O. Hasselgren. 1994. Sepsisstimulates nonlysosomal, energy-dependent proteolysis and in-creases ubiquitin mRNA levels in rat skeletal muscle. J. Clin.Investig. 94:2255–2264.
Tiao, G., S. Hobler, J. J. Wang, T. A. Meyer, F. A. Luchette, J. E.Fischer, and P. O. Hasselgren. 1997a. Sepsis is associated withincreased mRNAs of the ubiquitin-proteasome proteolytic path-way in human skeletal muscle. J. Clin. Investig. 99:163–168.
Tiao, G., M. A. Lieberman, J. E. Fischer, and P. O. Hasselgren. 1997b.Intracellular regulation of protein degradation during sepsis isdifferent in fast- and slow-twitch muscle. Am. J. Physiol.272:R849–R856.
Tomkinson, B. 1999. Tripeptidyl peptidases: Enzymes that count.TIBS 24:355–359.
van der Westhuyzen, D. R., K. Matsumoto, and J. D. Etlinger. 1981.Easily releasable myofilaments from skeletal and cardiac mus-cles maintained in vitro. Role in myofibrillar assembly and turn-over. J. Biol. Chem. 256:11791–11797.
Varshavsky, A. 1997. The N-end rule pathway of protein degradation.Genes Cells 2:13–28.
Wei, N., and X. W. Deng. 1999. Making sense of the COP9 signalo-some. Trends Genet. 15:98–103.
Williams, A. B., G. M. deCourten-Meyers, J. E. Fischer, G. Luo, X.Sun, and P. O. Hasselgren. 1999a. Sepsis stimulates release ofmyofilaments in skeletal muscle by a calcium-dependent mecha-nism. FASEB J. 13:1435–1443.
Williams, A. B., X. Sun, J. E. Fischer, and P. O. Hasselgren. 1999b.The expression of genes in the ubiquitin-proteasome proteolyticpathway is increased in skeletal muscle from patients with can-cer. Surgery (St. Louis) 126:744–750.
Wing, S. S., and D. Banville. 1994. 14kDa ubiquitin-conjugating en-zyme: Structure of the rat gene and regulation upon fasting andby insulin. Am. J. Phsyiol. 267:E39–E48.
Wing, S. S., and A. L. Goldberg. 1993. Glucocorticoids activate theATP-ubiquitin-dependent proteolytic system in skeletal muscleduring fasting. Am. J. Physiol. 264:E668–E676.
Yao, T., and R. E. Cohen. 1999. Giant proteases: Beyond the protea-some. Curr. Biol. 9:R551–R553.

Economics of visceral energy metabolism in ruminants:Toll keeping or internal revenue service?
C. K. Reynolds1
Department of Agriculture, Centre for Dairy Research, The University of Reading,Earley Gate, Reading, Berkshire, RG6 6AJ, U.K.
ABSTRACT: Measurements across a range of pro-ductive states show that the portal-drained viscera andliver, or the total splanchnic tissues, account for 40 to50% of body oxygen consumption or heat. This high rateof metabolism is in part attributable to high rates ofprotein turnover and thus, AA utilization, as well asother “service” functions supporting nutrient assimila-tion and “waste management.” This metabolic intensityand the anatomic position of absorptive and liver tis-sues have led to the assumption that the tissues thatassimilate and process incoming nutrients from the dietexact a toll in payment for their entry. This “toll” isbelieved to reduce the extent to which absorbed nutri-ents gain admission to the arterial blood pool and reach“productive” organs such as the mammary gland orskeletal muscle. Measurements of net nutrient flux gen-erally support this concept of splanchnic metabolism“restricting entry” and, thus, dictating supply. On a
Key Words: Splanchnic Metabolism, Energy, Amino Acids
2002 American Society of Animal Science. All rights reserved. J. Anim. Sci. 80(E. Suppl. 2):E74–E84
Introduction
In balancing energy inputs and outputs, energy ex-penditure, or heat, represents a substantial componentof the energy budget of ruminant livestock. The fractionof total metabolizable energy spent as heat generallyranges from 1 at maintenance (by definition), to about0.7 in growing heifers (e.g., Reynolds et al., 1991) and0.5 to 0.6 in lactating dairy cows (e.g., Andrew et al.,1991). The metabolic sources of this expenditure at boththe cellular and organ level have been reviewed (e.g.,Webster, 1980; McBride and Kelly, 1990) and includethe maintenance of cell structure and functional integ-rity through processes such as ion transport and proteinturnover. Because protein synthesis and degradation
1Correspondence: P.O. Box 237 (phone: -44-(0)118-931-6572; fax: -44-(0)118-935-2421; E-mail: [email protected]).
Received July 25, 2001.Accepted January 25, 2002.
E74
net basis the appearance of the major carbon-basednutrients absorbed into the portal vein is typically lowcompared to their rate of disappearance from the gutlumen. An alternative interpretation is that this lownet recovery of absorbed nutrients across splanchnictissues is attributable to extensive metabolism of nutri-ents from the arterial pool, which masks true rates ofabsorption. In this scenario, any tax to support commu-nity services is paid using internal funds. Measure-ments of nutrient kinetics, based on isotopic labeling,support the latter scenario. In the case of the liver,catabolism of AA is driven in part by supply and de-mand, with overpopulation dealt with by deportation,restructuring, or the metabolic equivalent of cremation.Similarly, relative rates of AA metabolism by the gutand mammary gland vary with requirement. Metabo-lism of many energy-yielding nutrients varies with sup-ply, demand, and the need for community services suchas waste management.
are energetically expensive processes, tissues with highrates of protein turnover typically have a high rate ofenergy expenditure and AA requirement, as well as ahigh rate of blood flow to provide oxygen and removecarbon dioxide. High rates of metabolism typify mostof the visceral tissues, such as the heart, kidney, gastro-intestinal tract, and liver, whose many support andservice functions contribute substantially to their highrate of metabolism. The kidneys receive more blood flowper unit mass than any other tissue in the ruminant(Hales, 1973), but in this case, a high rate of blood flowis in part attributable to their function in the excretionof waste products and the maintenance of fluid balance,thus, their fractional extraction of oxygen is lower thanfor tissues such as the liver (Reynolds et al., 1991). Ingrowing heifers, the kidneys accounted for roughly 6%of body oxygen consumption, but their blood flow andoxygen consumption were relatively constant acrosstwo diet forage:concentrate ratios and two levels of in-take, suggesting that their metabolic functions repre-sent a true maintenance cost (Reynolds et al., 1991).

Visceral metabolism in ruminants E75
Figure 1. Relationship between dry matter intake andportal-drained viscera (PDV), liver, and total splanchnic(TSP) oxygen consumption in cattle. See text for ref-erences.
Splanchnic Metabolism
In contrast to the kidneys, the portal-drained viscera(PDV; gastrointestinal tract, pancreas, spleen, and as-sociated omental and mesenteric fat) and liver (togetherthe total splanchnic tissues) account for substantialportions of body oxygen consumption and their metabo-lism varies with intake. Across a variety of experimen-tal conditions, the total splanchnic tissues account forfrom 36 to 54% of body oxygen use in growing andlactating cattle (e.g., Reynolds, 1995). This high rate ofmetabolism is in part dictated by DM and metabolizableenergy intake (Reynolds, 1995), which, to a large extent,determines the mass and functional load of the compo-nent splanchnic tissues. Across a series of studies ingrowing and lactating cattle at USDA in Beltsville(Reynolds, 1995), and more recent studies in lactatingand nonlactating dairy cattle at the author’s currentlocation (Reynolds et al., 2000; Benson et al., 2002;Caton et al., 2001), total splanchnic oxygen use in-creased with increasing DMI (Figure 1). More variation
in splanchnic oxygen consumption was observed instudies conducted in dairy cattle at higher intakes, inpart due to greater variety in diet composition, but alsodue to differences in productive state. In this regard,the energy expenditure of the liver responds to nutrientrequirements as well as DMI (Reynolds, 1995), and therelationship between DMI and oxygen consumption indairy cows (Figure 1) was more variable for the liver(r2 = 0.33) than for the PDV (r2 = 0.59). Because themetabolism of the splanchnic tissues is determined byDMI, they also account for a substantial portion of bodyheat increment. In growing beef heifers fed groundcorn- or alfalfa-based diets at two equalized metaboliz-able energy intakes, the total splanchnic tissues ac-counted for 44 and 72% of the incremental increase inbody oxygen consumption for the two diets, respectively(Reynolds et al., 1991).
The intense metabolism of the PDV and liver is drivenlargely by their roles in nutrient assimilation and wastemanagement (McBride and Kelly, 1990). Major expen-ditures of the PDV include the community servicesthese tissues provide in terms of diet digestion, nutrientabsorption and metabolism, maintenance of gut epithe-lial structure and immune functions, and synthetic pro-cesses within the pancreas and spleen. The synthesisof numerous compounds and its role in waste and toxinmanagement dictate the liver’s metabolic activity. Forboth the liver and PDV, cell maintenance and nutrienttransfer require substantial levels of ion transport. Allof these, and other community services, exact a sub-stantial tax in terms of energy expenditure, which ispaid through the metabolism of oxidizable substrates.For the ruminant, these taxes are paid largely throughthe metabolism of acetate, glucose, β-OH-butyrate(BOHB), and long-chain fatty acids, which account formuch of body carbon dioxide production (Annison andBryden, 1999). In addition, many nonessential AA areimportant sources of oxidizable carbon for specific tis-sues, such as the small intestinal enterocytes (Wind-mueller and Spaeth, 1980), and provide ATP throughspecialized interorgan carbon shuttles (Stoll et al.,1999). In addition, all AA are subject to catabolism andoxidation, particularly when absorbed and available inexcess of requirement (Elwyn, 1970; Waterlow, 1999).
Because most nutrients are absorbed via gut epithe-lial cells and enterocytes, they are available for metabo-lism during absorption. In addition, as a consequenceof the anatomical position of the PDV and liver as aportal vascular system, all nutrients absorbed into por-tal vein blood must “run the gauntlet” of the liver beforereaching the vena cava. These anatomical considera-tions and the intense metabolic activity required to sup-port the community services of the splanchnic tissueshas led to the logical assumption that substantial por-tions of the nutrients absorbed from the gut lumen aremetabolized during their absorption and transfer toarterial blood. By analogy, the absorptive tissues ofthe PDV and subsequently the liver are perceived asexacting a toll in payment for nutrient entry, acting as a

ReynoldsE76
gatekeeper and restricting entry of absorbed nutrients,thereby dictating nutrient availability in arterial bloodand, thus, supply to tissues such as the mammary glandor muscle.
Measurement of Splanchnic Metabolism
This concept of metabolic “toll-keeping” is supportedby comparisons of net nutrient release by the PDV withestimates or measurements of rate of absorption ofthose nutrients from the lumen of the digestive tract.With the exception of long-chain fatty acids absorbedinto lymph, measurements of blood-borne nutrient ab-sorption and metabolism by the PDV and liver can beobtained using multicatheterization procedures. Theseprocedures enable simultaneous sampling of arterialand appropriate venous blood draining the liver andPDV, or sections of the PDV, and measurement of bloodflow. Net rates of nutrient removal or release by thetissues of interest can then be calculated as the productof blood flow and venous-arterial difference (Hunting-ton et al., 1989). However, these measurements repre-sent net flux, which equals the combined rates of nutri-ent release into venous blood and removal from arterialblood. For example, net PDV flux of glucose in rumi-nants is often zero or slightly negative. This does notnecessarily mean that there is no absorption of glucose,but that the rate of glucose release from the small intes-tinal enterocytes into mesenteric vein blood is equal toor less than the rate of removal of glucose from arterialblood by PDV tissues. The PDV represents an anatomi-cal and vascular aggregation of heterogeneous tissuetypes. In the case of glucose and AA, whereas someabsorptive metabolism may occur in the small intesti-nal enterocytes, those cells represent a small proportionof the total PDV. Many other PDV tissues such as therumen and hindgut epithelium, gut muscle, pancreas,and adipose have substantial glucose and AA require-ments. As discussed in more detail later, any use ofthese nutrients from arterial blood will mask an equiva-lent release into venous blood.
To obtain measurements of gross or “unidirectional”rates of nutrient removal or release by splanchnic tis-sues measurements of net flux are combined with isoto-pic labeling to trace metabolism of a specific nutrient(Bergman, 1975). By labeling the blood pool, usuallyunder steady-state conditions, removal of the labelednutrient from arterial blood can be measured and, bydifference, gross rates of nutrient release calculated.However, for the PDV, these measurements of arterialnutrient extraction do not account for any use or “se-questration” during absorption. To measure this ab-sorptive use during passage from the gut lumen to ve-nous blood, the labeled nutrient can be introduced intothe lumen of the gut and recovery in portal blood mea-sured. However, to obtain true rates of sequestrationduring “first-pass” absorption, the extraction of labelednutrient recirculated to the PDV in arterial blood mustbe accounted for by simultaneously enriching the blood
pool using a separate label. The concepts underlyingthis methodology are illustrated in Figure 2 for mea-surements of arterial and absorptive use of Leu andPhe by the PDV of dairy cows (Reynolds et al., 2001;Caton et al., 2001) using approaches based on a modeldeveloped in sheep (MacRae et al., 1997a; Yu et al.,2000). Alternatively, absorptive use of nutrients can beestimated by comparing known or estimated rates ofabsorption from the lumen of the gut, with gross releaseby the PDV, or in the case of glucose and AA, the mesen-teric-drained viscera (MDV). Depending on the site ofsampling relative to the confluence of the ileocecal vein,the MDV represents the small intestine and associatedmesenteric fat, with or without the large intestine andcecum (Reynolds and Huntington, 1988a; MacRae etal., 1997b).
Volatile Fatty Acid Metabolism
In ruminants, the VFA represent the principal formof energy assimilation, accounting for roughly two-thirds of digestible energy absorption (Sutton, 1985)and representing an important source of carbon for oxi-dation and fat synthesis. However, in vitro studies (Ste-vens and Stettler, 1966) and pioneering in vivo mea-surements of Bergman and Wolff (1971) suggested sub-stantial losses of the principal VFA acetate, propionate,and n-butyrate during their absorption across rumenepithelial tissue. Using multicatheterization proce-dures, Bergman and Wolff (1971) measured net flux ofVFA in sheep fed maintenance levels of dehydratedalfalfa pellets at Cornell University. Because arterialconcentrations of propionate and n-butyrate were verylow, they assumed little arterial use of these VFA bythe PDV and that net flux equated with gross release.Arterial concentrations of acetate are substantial,therefore removal of arterial acetate by the PDV wasmeasured using 14C-acetate extraction, enabling thecalculation of gross acetate release into the portal vein.These measurements of PDV release of VFA were thencompared to previously published measurements of ru-minal VFA production obtained by isotope dilution insheep fed similar amounts of dehydrated lucerne at theRowett Research Institute in Scotland (Bergman et al.,1965). Assuming that these measurements of ruminalproduction equated with amounts truly absorbed, theyestimated that 30, 50, and 92% of acetate, propionate,and n-butyrate are subjected to “first-pass” absorptivemetabolism and never reach venous blood. On a netbasis, PDV release of acetate accounted for only 50%of ruminal acetate production. These extensive propor-tions of “absorptive use” of VFA by the rumen have sincebecome dogma. Other measurements of net increases inPDV release of VFA during ruminal infusions into fedcattle (Huntington et al., 1983; Krehbiel et al., 1992)and sheep (Weekes and Webster, 1975; Kristensen etal., 2000b,c), or sheep maintained totally by intragastricinfusions (Gross et al., 1990a,b), have supported theconcept of extensive absorptive use of VFA. However,
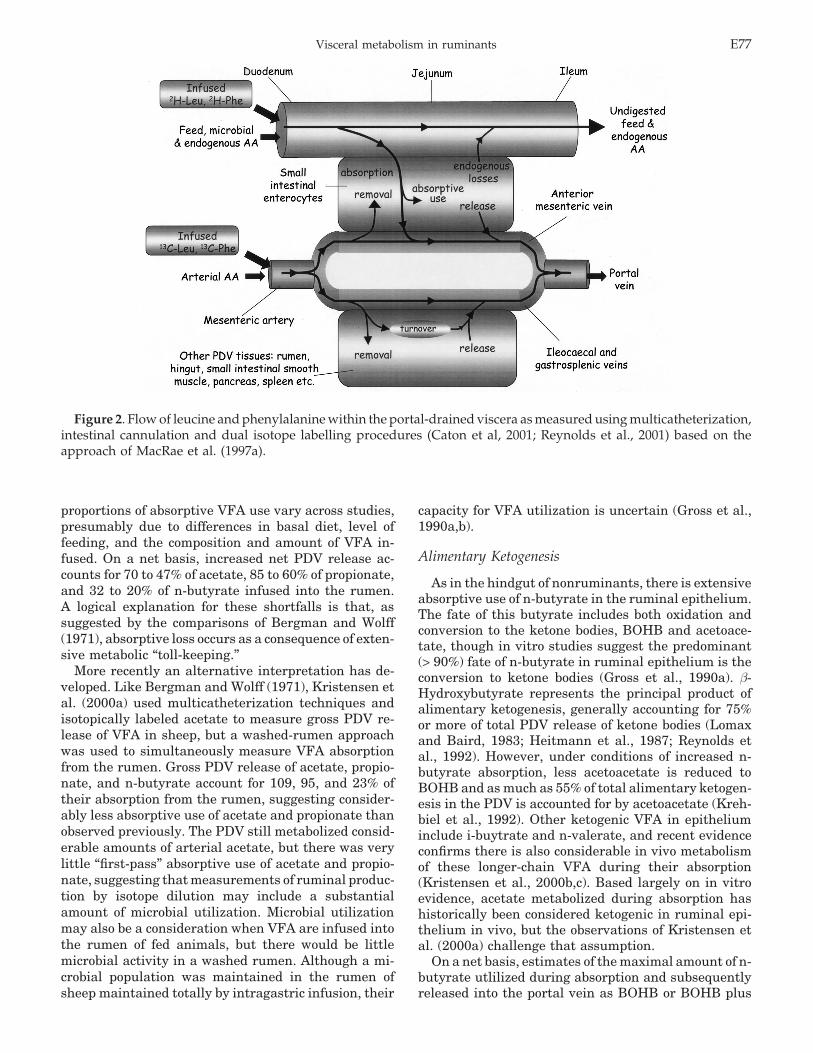
Visceral metabolism in ruminants E77
Figure 2. Flow of leucine and phenylalanine within the portal-drained viscera as measured using multicatheterization,intestinal cannulation and dual isotope labelling procedures (Caton et al, 2001; Reynolds et al., 2001) based on theapproach of MacRae et al. (1997a).
proportions of absorptive VFA use vary across studies,presumably due to differences in basal diet, level offeeding, and the composition and amount of VFA in-fused. On a net basis, increased net PDV release ac-counts for 70 to 47% of acetate, 85 to 60% of propionate,and 32 to 20% of n-butyrate infused into the rumen.A logical explanation for these shortfalls is that, assuggested by the comparisons of Bergman and Wolff(1971), absorptive loss occurs as a consequence of exten-sive metabolic “toll-keeping.”
More recently an alternative interpretation has de-veloped. Like Bergman and Wolff (1971), Kristensen etal. (2000a) used multicatheterization techniques andisotopically labeled acetate to measure gross PDV re-lease of VFA in sheep, but a washed-rumen approachwas used to simultaneously measure VFA absorptionfrom the rumen. Gross PDV release of acetate, propio-nate, and n-butyrate account for 109, 95, and 23% oftheir absorption from the rumen, suggesting consider-ably less absorptive use of acetate and propionate thanobserved previously. The PDV still metabolized consid-erable amounts of arterial acetate, but there was verylittle “first-pass” absorptive use of acetate and propio-nate, suggesting that measurements of ruminal produc-tion by isotope dilution may include a substantialamount of microbial utilization. Microbial utilizationmay also be a consideration when VFA are infused intothe rumen of fed animals, but there would be littlemicrobial activity in a washed rumen. Although a mi-crobial population was maintained in the rumen ofsheep maintained totally by intragastric infusion, their
capacity for VFA utilization is uncertain (Gross et al.,1990a,b).
Alimentary Ketogenesis
As in the hindgut of nonruminants, there is extensiveabsorptive use of n-butyrate in the ruminal epithelium.The fate of this butyrate includes both oxidation andconversion to the ketone bodies, BOHB and acetoace-tate, though in vitro studies suggest the predominant(> 90%) fate of n-butyrate in ruminal epithelium is theconversion to ketone bodies (Gross et al., 1990a). β-Hydroxybutyrate represents the principal product ofalimentary ketogenesis, generally accounting for 75%or more of total PDV release of ketone bodies (Lomaxand Baird, 1983; Heitmann et al., 1987; Reynolds etal., 1992). However, under conditions of increased n-butyrate absorption, less acetoacetate is reduced toBOHB and as much as 55% of total alimentary ketogen-esis in the PDV is accounted for by acetoacetate (Kreh-biel et al., 1992). Other ketogenic VFA in epitheliuminclude i-buytrate and n-valerate, and recent evidenceconfirms there is also considerable in vivo metabolismof these longer-chain VFA during their absorption(Kristensen et al., 2000b,c). Based largely on in vitroevidence, acetate metabolized during absorption hashistorically been considered ketogenic in ruminal epi-thelium in vivo, but the observations of Kristensen etal. (2000a) challenge that assumption.
On a net basis, estimates of the maximal amount of n-butyrate utlilized during absorption and subsequentlyreleased into the portal vein as BOHB or BOHB plus

ReynoldsE78
acetoacetate range from 14 to 48% in sheep (Gross etal., 1990a,b; Kristensen et al., 2000c) and cattle (Kreh-biel et al., 1992). Like acetate, the ketone bodies repre-sent an important source of oxidizable substrate in arte-rial blood, so measurements of net PDV release under-estimate their gross release to the extent of their usefrom arterial supply. Recent measurements in multi-catheterized sheep obtained using 13C-BOHB indicatethat arterial BOHB use by the PDV was substantial,equaling net PDV release, and accounting for 40% ofbody irreversible loss rate (ILR; Kristensen et al.,2000c). The effect of ruminal n-butyrate infusion onBOHB metabolism was also measured. Release ofBOHB by the PDV accounted for 48 and 62% on a netand gross basis, respectively, of the infused n-butyratenot recovered in the portal vein. Presumably, conver-sion to acetoacetate, oxidation during absorption, andmicrobial utilization account for the remaining 38% ofruminally infused n-butyrate.
Based on recent evidence, it appears that the absorp-tive use of acetate and propionate is less than suggestedpreviously. The ketogenic VFA are subjected to consid-erable absorptive metabolism, but this largely repre-sents a repackaging as ketone bodies that are subse-quently released into venous blood and transferred tothe hepatic circulation. The low net recovery of ab-sorbed acetate and BOHB from metabolized n-butyrateacross the PDV is in part a consequence of the useof these substrates from arterial blood, which negatessubstantial amounts of gross release. In the PDV andother body tissues, acetate and BOHB account for sub-stantial amounts of carbon dioxide production and fattyacid synthesis (Annison and Bryden, 1999).
Glucose Metabolism
Previous estimates of the recovery of starch digestedin the small intestine as increased net PDV glucoserelease also indicate a considerable shortfall, sug-gesting substantial absorptive use of glucose for meta-bolic fates such as oxidation, support of fat synthesis,mucin synthesis, and glycolysis to lactate and glycerol-3-phosphate. In ruminants, in which long-chain fattyacids are largely absorbed as NEFA, glycerol is requiredfor triglyceride and subsequently chylomicron synthe-sis and long-chain fatty acid absorption into lymph(Harrison and Leat, 1975). However, this potential lossof absorbed glucose does not entirely explain the short-fall in net PDV glucose release in ruminants, becausesimilar shortfalls occur in pigs (Rerat et al., 1988), inwhich long-chain fatty acids are absorbed primarily asacyl-glycerides. In cattle, the net recovery of starch in-fused into the abomasum as increased net PDV glucoserelease has ranged from 25 to 51% (Huntington andReynolds, 1986; Reynolds et al., 1998a,b; Harmon etal., 2001). This low recovery in part reflects incompletedigestion in the small intestine, but in studies in whichileal flow of starch has been accounted for, the shortfallis still substantial (Kreikemeier et al., 1991; Kreike-
meier and Harmon, 1995). Other explanations for thelow recovery include fermentation of starch in the ileumor use of arterial glucose by the PDV. As for acetateand BOHB, use of arterial glucose by the PDV is consid-erable and can account for 20 to 43% of body IRL (Berg-man, 1975; Piccioli Cappelli, 1997; Harmon et al., 2001).This use in part reflects use by adipose tissue, as wellas the stomach tissues. In beef steers fed lucerne, theMDV utilized acetate, BOHB, and glucose on a net ba-sis, and net MDV use of glucose was equal to 69% oftotal net PDV glucose use (Reynolds and Huntington,1988a,b). When the steers were changed to a diet con-taining large amounts of cornstarch, a switch to netMDV glucose release was measured. However, the in-crease in net MDV glucose absorption measured wasin part countered by an increase in net stomach use,which may in part reflect increased glucose use byomental adipose drained by the gastrosplenic vein.
More recent studies confirm that increased glucoseabsorption from the PDV, resulting from postruminalinfusion of starch or glucose, is accompanied by in-creased PDV use of arterial glucose. In a recent studyin growing cattle (Harmon et al., 2001), increased netPDV release of glucose accounted for 51% of the starchequivalents in starch hydrolyzate infused into the abo-masum. This low net recovery was in part due to a132% increase in PDV use of arterial glucose measuredusing 14C-glucose. The increase in PDV use of arterialglucose accounted for 20% of the glucose in starch in-fused and 52% of the increase in body IRL of glucose.Correction for the PDV use of arterial glucose revealedthat 71% of the glucose infused appeared in the portalblood. The remaining 29% was either not digested com-pletely to glucose, was fermented, or was used duringabsorption. Absorptive use of glucose was not measuredin the studies of Harmon et al. (2001), but in youngpigs, absorptive use of glucose infused into the duode-num was only 6% (Stoll et al., 1999). In the same pigs,absorptive and arterial glucose use accounted for 6 and27% of total PDV production of carbon dioxide, respec-tively.
In contrast to the studies of Harmon et al. (2001),numerical increases (48%) in PDV use of arterial glu-cose during duodenal glucose infusions in sheep werenot significant (Piccioli Capelli et al., 1997). This mayrelate to previous findings that the net portal recoveryof glucose infused into the abomasum is greater thanwhen similar amounts of glucose are infused as starch(Huntington and Reynolds, 1986; Kreikemeier et al.,1991). Possible explanations for a greater portal recov-ery of glucose compared to starch include differencesin regulatory signals arising during the entry of glucosevia the duodenum vs the ileum, which have varied ef-fects on the use of glucose in fat and other PDV tissues(Reynolds et al., 1997).
Amino Acid Metabolism
As for VFA and glucose, comparison of net PDV re-lease of AA with amounts absorbed from or infused into

Visceral metabolism in ruminants E79
Table 1. Ratio of net portal-drained visceral to netmesenteric-drained visceral release of amino acids
(PDV/MDV) in sheep and cattle
Amino acid Sheepa Dairy cowsb
Leu 0.64 0.68Val 0.57 0.46Lys 0.56 0.72Thr 0.69 0.38Ile 0.55 0.61Phe 0.68 0.76EAAc — 0.62NEAAd — 0.50TAAe — 0.56
aMacRae et al., 1997b.bBerthiaume et al., 2001.cEssential amino acids measured.dNonessential amino acids measured.eTotal amino acids measured.
the small intestine of ruminants have suggested thata substantial loss occurs during absorption. Tagari andBergman (1978) compared rates of disappearance of AAfrom the small intestine of two sheep, measured usingre-entrant cannulas, with simultaneous measurementsof their net PDV release and found a considerable (36 to100%) shortfall in the recovery of many AA (Bergman,1986). The shortfall was more than 100% for glutamateand aspartate, which undoubtedly relates to their pref-erential use as energy substrates for intestinal tissue(Windmueller and Spaeth, 1980). In the study of Stollet al. (1999), absorptive use accounted for 94% of gluta-mate infused into the duodenum of young pigs, althoughthis measurement was not corrected for any potentialuse of absorbed glutamate trace recirculated to the PDVin arterial blood. In addition to absorptive use, the largeshortfall in glutamate and aspartate absorption in thestudy of Tagari and Bergman (1978) is also attributableto the hydrolysis of glutamine to glutamate and aspara-gine to aspartate during preparation of digesta for anal-ysis. In addition, measurements of net AA flow underes-timate intestinal disappearance unless endogenous se-cretions in the ileum are accounted for. Finally, andperhaps most importantly for many AA, PDV use ofarterial AA is not accounted for in net flux mea-surements.
A substantial utilization of arterial AA by the PDVis confirmed by comparison of net measurements ofMDV and PDV flux of AA in sheep and cattle (Reynoldset al., 1988a; MacRae et al., 1997b; Berthiaume et al.,2001). For essential AA, the ratio of net PDV releaseto net MDV release in sheep and cattle ranges from0.55 to 0.66 (Table 1). The higher net release of theseAA by the MDV indicates a substantial use of arterialAA by the stomach and other tissues of the PDV that donot have metabolic access to AA during their absorptioninto the mesenteric veins (Figure 2). In both sheep (Ma-cRae et al., 1997b) and dairy cattle (Berthiaume et al.,2001), comparison of net rates of small intestinal disap-pearance and net MDV release of AA suggests very
Table 2. Sequestration of essential amino acids by theportal-drained viscera of sheep (MacRae et al., 1997a)
Amino acid % of IRLa Arterial/totalb
Leu 46 0.82Val 65 0.86Lys 53 0.84Thr 48 0.83Ile 56 0.79His 32 0.76Phe 47 0.49
aTotal portal-drained visceral sequestration as a percentage of totalbody irreversible loss (IRL). Mean of values for sheep fed 800 fed or1,200 g (as-fed basis) alfalfa pellets daily.
bProportion of total PDV sequestration (arterial and absorptiveuse) accounted for by removal from arterial blood.
little or no absorptive use of most essential AA butconfirms substantial net losses of the glutamate-gluta-mine and aspartate-asparagine pairs and other nones-sential AA (Berthiaume et al., 2001). Nitrogen from thecatabolism of these and other AA is used in the synthe-sis of Ala using pyruvate, in part arising from the glycol-ysis of glucose. Alanine is typically the AA releasedacross the PDV of ruminants in the largest amount ona net basis, transferring nitrogen and carbon to the liverfor urea and glucose synthesis (Reynolds et al., 1994a).
Direct measurements of absorptive use of essentialAA in sheep have been obtained using a dual isotopemethod reported by MacRae et al. (1997a; Figure 2).Using simultaneous differential labeling of AA in thesmall intestine lumen and blood, the absorptive andarterial use of AA by the PDV can be measured asdiscussed previously. Measurement of essential AA me-tabolism (Table 2) indicates that utilization by the PDVof sheep accounts for substantial amounts of body IRL,but that the predominant source of the AA utilized isarterial blood. For most of the essential AA measured,arterial use accounted for 75% or more of total PDVuse, the only exception being Phe, for which a lowerarterial use indicated that total PDV use was equallydivided between absorptive and arterial supply. Gener-ally, the rate of absorptive use was comparable for theessential AA, whereas the proportional rate of totalPDV use was similar to the proportional compositionof PDV proteins. Further use of these methods for mea-surements of PDV and MDV use of Leu in sheep (Yuet al., 2000) indicate that the MDV accounted for only12% of arterial Leu use by the PDV. In addition, only1% of Leu utilized during absorption was oxidized tocarbon dioxide, suggesting that most of the Leu seques-tered was used for enzyme and constitutive protein syn-thesis. In contrast, 49% of Leu sequestered from arte-rial blood by the MDV was oxidized.
A dual isotope approach was also used to describethe effects of intake level on absorptive and arterialLeu and Phe utilization by the PDV of lactating andnonlactating dairy cows (Reynolds et al., 2001). Thesemeasurements confirm observations in sheep that arte-rial use accounts for a substantial portion of total Leu

ReynoldsE80
and Phe absorption and IRL, but the proportion of ab-sorption accounted for was considerably lower when thecows were lactating. As in sheep, absorptive use was ahigher proportion of total PDV use for Phe than forLeu. Absorptive use was negligible at low intakes butincreased by greater intake within both the nonlactat-ing and lactating state, suggesting an increase in en-terocyte mass, or perhaps differences in the absorptiveuse of these AA caused by increasing supply relativeto requirement.
Using the same approach, measurements of PDV me-tabolism of Leu and Phe, in response to abomasal infu-sions of casein or an equivalent mixture of free essentialAA over a 6-d period, were obtained in late-lactationcows (Caton et al., 2001). Absorptive use of both AAwas again negligible during control samplings. Bothabsorptive and arterial PDV use of Leu and Phe wereincreased by infusion of the essential AA mixture, butnot casein. During free AA infusion the increase in totalPDV use was equal to the increase in their true absorp-tion from the lumen of the small intestine. This confirmsand explains previous results from studies at this loca-tion in lactating dairy cows, in which increases in netPDV release of AA accounted for most (75%) of the AAinfused into the abomasum as casein, but only 22%when an equivalent supply of free essential AA wasinfused (Reynolds et al., 1999). The low recovery in thelater case appears due to an increase in both absorptiveand arterial essential AA use. Reasons for the responseare not certain, but as for glucose metabolism, in re-sponse to abomasal starch vs glucose infusion, differ-ences in the metabolic response of the PDV observedmay relate to the site of absorption of the AA. Alterna-tively, the lack of nonessential AA in the mixture of freeessential AA supplied may have caused an imbalance inAA availability that stimulated a catabolic response.
Liver Metabolism
Recent studies now suggest alternative explanationsfor the low net PDV recovery of many nutrients ab-sorbed from the lumen of the ruminant gut. For acetate,propionate, glucose, and most essential AA, there ap-pears to be little absorptive use and their low net recov-ery appears due to overestimates of their absorption orextensive removal from arterial blood. For the ketogenicVFA, there is extensive absorptive use, but they areessentially repackaged and released into the portalblood as ketone bodies. Nonessential amino acids arealso subject to extensive absorptive use and their Nused in the synthesis of Ala released by the PDV. Beforereaching the peripheral circulation, these absorbed nu-trients must negotiate the liver, which is metabolicallyactive in the extreme. Representing about 2% of emptyBW in dairy cows, the liver receives about 40% of car-diac output and is responsible for 20 to 25% of bodyenergy expenditure in cattle (Reynolds, 1995). Generalaspects of liver nutrient metabolism, in relation toamounts absorbed across the PDV, have been addressed
in numerous previous reviews (e.g., Elwyn, 1970; Reyn-olds, 1995; Annison and Bryden, 1999). General rela-tionships between net PDV release and liver removalof major nutrients are shown for lactating dairy cattlein Table 3. On a net basis, there is normally little liverremoval of acetate, and in most studies in ruminants,a small net release of acetate is reported. Thus, theliver has little impact on the supply of absorbed acetateto the rest of the body. In contrast, nearly all the propio-nate, n-butyrate, and longer-chain VFA absorbed areremoved, such that their supply in arterial blood isnegligible. Similarly, on a net basis, virtually all acet-oacetate released by the PDV is removed by the liver(Reynolds et al., 1992; Krehbiel et al., 1992). n-Butyrateand acetoacetate are largely converted to BOHB in theliver, which is also produced from the oxidation of long-chain fatty acids. Like acetate, there is normally a sub-stantial supply of BOHB released to the periphery ona net basis (Table 3), providing substrate for energyexpenditure and fat synthesis.
Most propionate removed by the liver is repackagedas glucose, which is also released to the periphery forproductive and maintenance functions (Table 3). In thefed state, the other principal precursors for glucose syn-thesis include lactate and AA, with the glucogenicnonessential AA considered the AA of greatest impor-tance for glucose synthesis. Ruminant nutritionistshave often questioned the extent to which glucose pre-cursor supply limits liver glucose synthesis. However,across a number of studies in which propionate ornonessential AA have been infused into fed ruminantsto mimic an increase in their absorption, liver glucoseproduction has been unchanged and liver lactate re-moval reduced (see Reynolds, 1995). However, in early-lactation dairy cows (Table 3) abomasal infusion of ca-sein for 6 d increased liver glucose production, but infu-sion of a mixture of free AA supplying the same amountof essential AA evoked a similar increase in liver glu-cose release (Reynolds et al., 1999). This suggests theresponse to casein infusion was not attributable to thenonessential AA infused. Liver glucose production mayhave been increased through direct effects of essentialAA on liver metabolism, or indirectly through an in-creased glucose requirement in other tissues resultingfrom the provision of a balanced mixture of essentialAA. In this regard, liver urea production was decreasedwhen the essential AA mixture was infused, indicatingan improved overall utilization of AA. In contrast, mes-enteric vein infusion of a mixture of free nonessentialAA equal in composition to milk protein caused a largeincrease in liver urea production and a decrease in milkyield and protein composition in cows fed a low-proteindiet in early lactation (Reynolds et al., 1995). In thesame cows, infusions of AA providing the essential ortotal AA in milk protein increased milk protein contentand yield. None of the infusions increased liver glucoseproduction significantly. Although nonessential AA areundoubtedly important carbon sources for liver glucose

Visceral metabolism in ruminants E81
Table 3. Net splanchnic (portal-drained viscera and liver) metabolism (mmol/h) ofnutrients in lactating dairy cows consuming 23 kg DM and producing
37 kg milk daily during abomasal infusions of water(Reynolds et al., 1999 and unpublished observations)
Item PDVa Liver Total splanchnic
Acetate 2,409 452 2,860Propionate 1,012 −942 70n-Butyrate 214 −180 34i-Butyrate 28 −27 1i-Valerate 48 −47 1n-Valerate 40 −42 −2β-OH-Butyrate 210 408 618L-Lactate 175 −24 151Glucose −7 781 775EAAb 268 −21 247NEAAc 363 −224 139TAAd 631 −245 386Oxygen −3,897 −3,686 −7,583
aPortal-drained viscera.bEssential amino acids measured.cNonessential amino acids measured.dTotal amino acids measured.
synthesis, their utilization is dependent on an adequateand balanced supply of essential AA.
As for many tissues of the PDV, the high rate ofmetabolism of the liver is associated with a high rateof protein turnover, and, thus, the liver has a consider-able AA requirement for the synthesis of constitutiveand export proteins. In addition, the liver serves a“waste management” role in the management of N bal-ance, removing AA absorbed in excess of requirementand consequently producing urea and oxidizing or re-packaging their carbon skeletons (Elwyn, 1970; Wa-terlow, 1999). For many AA, depending on protein sta-tus of the animal, net liver removal represents a sub-stantial portion of amounts absorbed by the PDV on anet basis (Elwyn, 1970; Lobley and Milano, 1997; Lobleyet al., 2001). For example, the ratio of net liver removalto net PDV release of individual AA removed by theliver can vary from 0 to over 100%, implying that inmany cases only small proportions of the AA absorbedreach the periphery. However, the total liver extractionratio may range from less than 1 to only 20%. Thisextraction ratio represents the amount removed as apercentage of the total supply in portal and arterialblood. On a net or gross basis, amounts of AA absorbedare relatively small compared to the total arterial sup-ply to the PDV; therefore, the majority of the AA presentin portal vein blood were recirculated to the PDV andliver in arterial blood. Thus, whereas the net amountof an AA such as Ala removed by the liver may be equalto or greater than the amount absorbed, only a smallfraction of absorbed Ala is removed in the “first-pass”through the liver and the amount removed is highlycorrelated with arterial concentration. After a 24-hmesenteric vein infusion mimicking a doubling of netAla absorption across the PDV, the increase in net liverremoval of Ala equaled 82% of the Ala infused (Reynolds
and Tyrrell, 1991). This increase in Ala removal wasaccompanied by a doubling of arterial Ala concentra-tion, but no change in liver extraction ratio (Reynoldset al., 1994b). The response to short-term supplementa-tion of AA may not reflect the longer-term response,because the urea cycle can take days to adapt to alter-ations in nitrogen input or output (Waterlow, 1999). Inlactating dairy cows, abomasal infusion of casein for 6d increased liver removal of most of the AA measuredand for many AA the increase in liver removal wasgreater than the amount infused, but arterial concen-trations of all AA measured were increased (Reynoldset al., 1999). In this case, both the ratio of net liverremoval to net PDV release and total liver extractionratio were increased for most AA measured by providingsupplemental AA to the blood pool in excess of require-ment (Table 4).
Tissue Supply vs Requirement
In the liver and other body tissues, amount and pat-tern of supply relative to requirements determine thepartition of AA utilization between synthetic and cata-bolic processes. In lactating dairy cows fed three levelsof rumen-protected soybean meal (Metcalf et al., 1996),increasing protein supply increased arterial concentra-tion of AA linearly, but milk protein yield and net mam-mary gland removal of essential AA responded curvilin-early, reaching a plateau at the intermediate level ofprotein fed. Milk protein response, and thus removalof AA by the mammary gland, was not determinedsolely by AA supply. In addition, the utilization of AAwithin the mammary gland also varies with supply rela-tive to requirement. This is illustrated by the responseof mammary gland Leu oxidation in goats. As a fractionof gross Leu removal, mammary Leu oxidation was in-

ReynoldsE82
Table 4. Arterial concentration (�M) and net liver removal of amino acids as apercentage of net PDV release or total supply in early-lactation dairy cows
(Reynolds et al., 1999) after 6-d abomasal infusionof water or 800 g casein protein/d
Aeterial concentration
Net liver removal
% of PDV % of Supply
Amino acid Water Casein Water Casein Water Casein
Ala 235 247 62 98 10 20Lys 94 116 30 62 10 21Met 15 21 42 69 11 20Phe 51 58 39 76 5 12EAAa 1,132 1,443 −21d 41 −2d 5NEAAb 1,166 1,315 51 87 7 15TAAc 2,298 2,758 22 68 3 10
aEssential amino acids measured.bNonessential amino acids measured.cTotal amino acids measured.dNegative value reflects net liver release of total EAA as a consequence of the net release of branched-
chain AA.
creased when diet protein level was increased, and de-creased when a mixture of the essential AA devoid ofLeu was infused intravenously, creating a Leu defi-ciency (Bequette et al., 1996a,b). Nutrient supply to themammary gland is determined both by blood flow andnutrient concentration, but mammary use of the AAsupplied is determined by the propensity of the glandfor protein synthesis. Blood flow is determined by themetabolic activity of the gland, but also increases inresponse to a nutrient deficit. In other work in lactatinggoats, the creation of a His deficiency increased bloodflow to the gland as well as the extraction ratio for Histo the extent that mammary vein blood was virtuallydevoid of His (Bequette et al., 2000).
Conclusions
In spite of their numerous service functions and in-tense metabolic activity, the tax exacted by the splanch-nic tissues of ruminants does not dictate the supply ofnutrients to peripheral tissues to the extent suggestedby measurements of net nutrient absorption. Measure-ments of unidirectional metabolism reveal that the nu-trient requirements of these tissues are largely metthrough payments made from internal funds providedby arterial blood. This removal of nutrients from arte-rial blood masks the true rate of absorption of manynutrients. This is especially true for acetate, BOHB,glucose, and most of the essential AA. The ketogenicVFA and propionate are metabolized during their ab-sorptive passage through gut epithelia and the liverbut are essentially repackaged into BOHB or glucosemade available to the periphery. Rather than dictatingthe supply of nutrients to peripheral tissues, like otherbody tissues, the splanchnic tissues draw on reservesavailable from the blood pool.
Implications
Appropriate representation of the distribution of nu-trients via blood flow and the regulation of blood nutri-ent concentration is crucial for the development of mod-els of absorbed nutrient utilization. Blood flow, andultimately nutrient utilization, are determined primar-ily by the propensity for production and resulting tissuerequirements, whereas the metabolic fate of nutrientsabsorbed is determined by tissue requirement relativeto supply from the diet. Therefore, animal-specific indi-cators of productive capacity are needed to accuratelypredict absorbed nutrient metabolism.
Literature Cited
Andrew, S. M., H. F. Tyrrell, C. K. Reynolds, and R. A. Erdman.1991. Net energy value for lactation of a dietary fat, calciumsalts of long-chain fatty acids, for cows fed silage-based diets.J. Dairy Sci. 74:2588–2600.
Annison, E. F., and W. L. Bryden. 1999. Perspectives on ruminantnutrition and metabolism. II. Metabolism in ruminant tissues.Nutr. Res. Rev. 12:147–177.
Benson, J. A., C. K. Reynolds, P. C. Aikman, B. Lupoli, and D. E.Beever. 2002. Effects of abomasal long chain fatty acid infusionon splanchnic nutrient metabolism in lactating dairy cows. J.Dairy Sci. (In press).
Bequette, B. J., F. R. C. Backwell, J. C. MacRae, G. E. Lobley, L.A. Crompton, J. A. Metcalf, and J. D. Sutton. 1996a. Effect ofintravenous amino acid infusion on leucine oxidation across themammary gland of the lactating goat. J. Dairy Sci. 79:2217–2224.
Bequette, B. J., M. D. Hanigan, A. G. Calder, C. K. Reynolds, G. E.Lobley, and J. C. MacRae. 2000. Kinetics of amino acid transportin the mammary gland of lactating goats when histidine supplyis limiting for milk production. J. Dairy Sci. 83:765–775.
Bequette, B. J., J. A. Metcalf, D. Wray-Cahen, F. R. C. Backwell, J.D. Sutton, M. A. Lomax, J. C. MacRae, and G. E. Lobley. 1996b.Leucine and protein metabolism in the lactating dairy cow mam-mary gland: responses to supplemental dietary crude proteinintake. J. Dairy Res. 63:209–222.

Visceral metabolism in ruminants E83
Bergman, E. N. 1975. Production and utilisation of metabolites bythe alimentary tract as measured in portal and hepatic blood.In: I. W. McDonald and A. C. I. Warner (ed.) Digestion andMetabolism in the Ruminant. p 292. The University of NewEngland, Armidale, Australia.
Bergman, E. N. 1986. Splanchnic and peripheral uptake of aminoacids in relation to the gut. Fed. Proc. 45:2277–2282.
Bergman, E. N., R. S. Reid, M. G. Murray, J. M. Brockway, and F.G. Whitelaw. 1965. Interconversions and production of volatilefatty acids in the sheep rumen. Biochem. J. 97:53–58.
Bergman, E. N., and J. E. Wolff. 1971. Metabolism of volatile fattyacids by liver and portal-drained viscera in sheep. Am. J. Physiol.221:586–592.
Berthiaume, R., P. Dubreuil, M. Stevenson, B. W. McBride, and H.Lapierre. 2001. Intestinal disappearance and mesenteric andportal appearance of amino acids in dairy cows fed ruminallyprotected methionine. J. Dairy Sci. 84:194–203.
Caton, J. S., C. K. Reynolds, B. J. Bequette, B. Lupoli, P. C. Aikman,and D. J. Humphries. 2001. Effects of abomasal casein or essen-tial amino acid infusions on splanchnic leucine and phenylala-nine metabolism in lactating dairy cows. J. Dairy Sci. 84(Suppl.1):363 (Abstr.).
Elwyn, D. H. 1970. The role of the liver in regulation of amino acid andprotein metabolism. In: H. N. Munro (ed.) Mammalian ProteinMetabolism. p 523. Academic Press, New York.
Gross, K. L., D. L. Harmon, and T. B. Avery. 1990a. Portal-drainedvisceral flux of nutrients in lambs fed alfalfa or maintained bytotal intragastric infusion. J. Anim. Sci. 68:214–221.
Gross, K. L., D. L. Harmon, J. E. Minton, and T. B. Avery. 1990b.Effects of isoenergetic infusions of propionate and glucose onportal-drained visceral nutrient flux and concentrations of hor-mones in lambs maintained by total intragastric infusion. J.Anim. Sci. 68:2566–2574.
Hales, J. R. S. 1973. Radioactive microsphere measurements of car-diac output and regional tissue blood flow in sheep. PflugersArch. Eur. J. Physiol. 344:119–132.
Harmon, D. L., C. J. Richards, K. C. Swanson, J. A. Howell, J. C.Matthews, A. D. True, G. B. Huntington, S. A. Gahr, and R. W.Russell. 2001. Influence of ruminal or postruminal starch onvisceral glucose metabolism in steers. In: A. Chwalibog and K.Jakobsen (ed.) Energy Metabolism in Farm Animals. EAAPPubl. No. 103. p 273. Wageningen Pers, Wageningen, The Neth-erlands.
Harrison, F. A., and W. M. F. Leat. 1975. Digestion and absorptionof lipids in non-ruminant and ruminant animals: a comparison.Proc. Nutr. Soc. 34:203–210.
Heitmann, R. N., D. J. Dawes, and S. C. Sensenig. 1987. Hepaticketogenesis and peripheral ketone body utilization in the rumi-nant. J. Nutr. 117:1174–1180.
Huntington, G. B., and P. J. Reynolds. 1986. Net absorption of glucose,L-lactate, volatile fatty acids, and nitrogenous compounds bybovine given abomasal infusions of starch or glucose. J. DairySci. 69:2428–2436.
Huntington, G. B., C. K. Reynolds, and B. Stroud. 1989. Techniquesfor measuring blood flow in the splanchnic tissues of cattle. J.Dairy Sci. 72:1583–1595.
Huntington, G. B., P. J. Reynolds, and H. F. Tyrrell. 1983. Net absorp-tion and ruminal concentrations of metabolites in nonpregnantdry Holstein cows before and after intraruminal acetic acid infu-sion. J. Dairy Sci. 66:1901–1908.
Krehbiel, C. R., D. L. Harmon, and J. E. Schnieder. 1992. Effect ofincreasing ruminal butyrate on portal and hepatic nutrient fluxin steers. J. Anim. Sci. 70:904–914.
Kreikemeier, K. K., and D. L. Harmon. 1995. Abomasal glucose, maizestarch and maize dextrin infusions in cattle: Small intestinaldisappearance, net portal glucose flux and ileal oligosaccharideflow. Br. J. Nutr. 73:763–772.
Kreikemeier, K. K., D. L. Harmon, R. T. Brandt, T. B. Avery, and D.E. Johnson. 1991. Small intestinal starch digestion in steers:effect of various levels of abomasal glucose, corn starch and
corn dextrin infusion on small intestinal disappearance and netglucose absorption. J. Anim. Sci. 69:328–338.
Kristensen, N. B., G. Gabel, S. G. Pierzynowski, and A. Danfær.2000a. Portal recovery of short-chain fatty acids infused into thetemporarily-isolated and washed reticulo-rumen of sheep. Br.J. Nutr. 84:1–7.
Kristensen, N. B., S. G. Pierzynowski, and A. Danfær. 2000b. Netportal appearance of volatile fatty acids in sheep intraruminallyinfused with mixtures of acetate, propionate, isobutyrate, buty-rate, and valerate. J. Anim. Sci. 78:1372–1379.
Kristensen, N. B., S. G. Pierzynowski, and A. Danfær. 2000c. Portal-drained visceral metabolism of 3-hydroxybutyrate in sheep. J.Anim. Sci. 78:2223–2228.
Lobley, G. E., D. M. Bremner, and D. S. Brown. 2001. Responsein hepatic removal of amino acids by the sheep to short-terminfusions of varied amounts of an amino acid mixture into themesenteric vein. Br. J. Nutr. 85:689–698.
Lobley, G. E., and G. D. Milano. 1997. Regulation of hepatic nitrogenmetabolism in ruminants. Proc. Nutr. Soc. 56:547–563.
Lomax, M. A., and G. D. Baird. 1983. Blood flow and nutrient ex-change across the liver and gut of the dairy cow. Br. J. Nutr.49:481–496.
MacRae, J. C., L. A. Bruce, D. S. Brown, and A. G. Calder. 1997a.Amino acid use by the gastrointestinal tract of sheep given lu-cerne forage. Am. J. Physiol. 273:G1200–G1207.
MacRae, J. C., L. A. Bruce, D. S. Brown, D. A. H. Farningham, andM. Franklin. 1997b. Absorption of amino acids from the intestineand their net flux across the mesenteric- and portal-drainedviscera of lambs. J. Anim. Sci. 75:3307–3314.
McBride, B. W., and J. M. Kelly. 1990. Energy cost of absorption andmetabolism in the ruminant gastrointestinal tract and liver: Areview. J. Anim. Sci. 68:2997–3010.
Metcalf, J. A., D. Wray-Cahen, E. E. Chettle, J. D. Sutton, D. E.Beever, L. A. Crompton, J. C. MacRae, B. J. Bequette, and F.R. C. Backwell. 1996. The effect of dietary crude protein asprotected soybean meal on mammary metabolism in the lactat-ing dairy cow. J. Dairy Sci. 79:603–611.
Piccioli Cappelli, F., C. J. Seal, and D. S. Parker. 1997. Glucose and[13C]leucine metabolism by the portal-drained viscera of sheepfed on dried grass with acute intravenous and intraduodenalinfusions of glucose. Br. J. Nutr. 78:931–946.
Rerat, A., P. Vaissade, and P. Vaugelade. 1988. Absorption kineticsof dietary hydrolysis products in conscious pigs given diets withdifferent amounts of fish protein. 1. Amino-nitrogen and glucose.Br. J. Nutr. 60:91–104.
Reynolds, C. K. 1995. Quantitative aspects of liver metabolism inruminants. In: W. v. Engelhardt, S. Leonhard-Marek, G. Brevesand D. Giesecke (ed.) Ruminant Physiology: Digestion, Metabo-lism, Growth and Reproduction. Proc. 8th Int. Symp. RuminantPhysiol. p 351. Ferdinand Enke Verlag, Stuttgart, Germany.
Reynolds, C. K., B. J. Bequette, J. S. Caton, D. J. Humphries, P. C.Aikman, B. Lupoli, and J. D. Sutton. 2001. Effects of intake andlactation on absorption and metabolism of leucine and phenylal-anine by splanchnic tissues of dairy cows. J. Dairy Sci. 84(Suppl.1):362 (Abstr.).
Reynolds, C. K., L. A. Crompton, K. Firth, D. Beever, J. Sutton, M.Lomax, D. Wray-Cahen, J. Metcalf, E. Chettle, B. Bequette, C.Backwell, G. Lobley, G. and J. MacRae. 1995. Splanchnic andmilk protein responses to mesenteric vein infusion of 3 mixturesof amino acids in lactating dairy cows. J. Anim. Sci. 73(Suppl.1):274 (Abstr.).
Reynolds, C. K., D. L. Harmon, and M. J. Cecava. 1994a. Absorptionand delivery of nutrients for milk protein synthesis by portal-drained viscera. J. Dairy Sci. 77:2787–2808.
Reynolds, C. K., D. L. Harmon, R. L. Prior, and H. F. Tyrrell. 1994b.Effects of mesenteric vein L-alanine infusion on liver metabolismof organic acids in beef heifers fed diets differing in forage toconcentrate ratio. J. Anim. Sci. 72:3196–3206.
Reynolds, C. K., D. J. Humphries, J. A. Benson, and D. E. Beever.1998a. Effects of abomasal maize starch infusion on splanchnic

ReynoldsE84
metabolism and milk production in dairy cows. J. Anim. Sci.76(Suppl. 1):310 (Abstr.).
Reynolds, C. K., D. J. Humphries, S. B. Cammell, J. Benson, J. D.Sutton, and D. E. Beever. 1998b. Effects of abomasal wheatstarch infusion on splanchnic metabolism and energy balanceof lactating dairy cows. In: K. J. McCracken, E. F. Unsworthand A. R. G. Wylie (ed.) Energy Metabolism of Farm Animals.Proc. 14th Symp. Energy Metabolism. p 39. CAB International,Wallingford, U.K.
Reynolds, C. K., and G. B. Huntington. 1988a. Partition of portal-drained visceral net flux in beef steers. 1. Blood flow and netflux of oxygen, glucose and nitrogenous compounds across stom-ach and post-stomach tissues. Br. J. Nutr. 60:539–551.
Reynolds, C. K., and G. B. Huntington. 1988b. Partition of portal-drained visceral net flux in beef steers. 2. Net flux of volatilefatty acids, D-β-hydroxybutyrate and L-lactate across stomachand post-stomach tissues. Br. J. Nutr. 60:553–562.
Reynolds, C. K., B. Lupoli, P. C. Aikman, J. A. Benson, D. J. Humph-ries, L. A. Crompton, J. France, D. E. Beever, and J. C. MacRae.2000. Effects of diet protein level and abomasal amino acid infu-sions on splanchnic metabolism in lactating dairy cows. J. DairySci. 83(Suppl. 1):299 (Abstr.).
Reynolds, C. K., B. Lupoli, P. C. Aikman, D. J. Humphries, L. A.Crompton, J. D. Sutton, J. France, D. E. Beever, and J. C. Ma-cRae. 1999. Effects of abomasal casein or essential amino acidinfusions on splanchnic metabolism in lactating dairy cows. J.Anim. Sci. 77(Suppl. 1):266 (Abstr.).
Reynolds, C. K., J. D. Sutton, and D. E. Deever. 1997. Effects of feedingstarch to dairy cows on nutrient availability and production. In,P. C. Garnsworthy and J. Wiseman (ed.) Recent Advances inAnimal Nutrition. Proc. 30th Univ. of Nottingham Conf. FeedManufacturers. p 105. University of Nottingham Press, Notting-ham, U.K.
Reynolds, C. K., and H. F. Tyrrell. 1991. Effects of mesenteric veinL-alanine infusion on liver metabolism in heifers fed on diets
differing in forage-to-concentrate ratio. Brit. J. Nutr. 66:437–450.
Reynolds, C. K., H. F. Tyrrell, and L. E. Armentano. 1992. Effectsof mesenteric vein n-butyrate infusion on liver metabolism bybeef steers. J. Anim. Sci. 70:2250–2261.
Reynolds, C. K., H. F. Tyrrell, and P. J. Reynolds. 1991. Effects ofdiet forage-to-concentrate ratio and intake on energy metabolismin growing beef heifers: Whole body energy and nitrogen balanceand visceral heat production. J. Nutr. 121:994–1003.
Stevens, C. E., and B. K. Stettler. 1966. Factors affecting transportof volatile fatty acids across rumen epithelium. Am. J. Physiol.210:365–372.
Stoll, B., D. G. Burrin, J. Henry, H. Yu, F. Jahoor, and P. J. Reeds.1999. Substrate oxidation by the portal drained viscera of fedpiglets. Am. J. Physiol. 277:E168–E175.
Sutton, J. D. 1985. Digestion and absorption of energy substrates inthe lactating cow. J. Dairy Sci. 68:3376–3393.
Tagari, H., and E. N. Bergman. 1978. Intestinal disappearance andportal blood appearance of amino acids in sheep. J. Nutr.108:790–803.
Waterlow, J. C. 1999. The mysteries of nitrogen balance. Nutr. Res.Rev. 12:25–54.
Webster, A. J. F. 1980. Energy costs of digestion and metabolismin the gut. In: Y. Ruckebusch and P. Thivend (ed.) DigestivePhysiology and Metabolism in Ruminants. p 469. AVI PublishingCo., Westport, CT.
Weekes, T. E. C., and A. J. F. Webster. 1975. Metabolism of propionatein the tissues of the sheep gut. Br. J. Nutr. 33:425–438.
Windmueller, H. G., and A. E. Spaeth. 1980. Respiratory fuels andnitrogen metabolism in vivo in small intestine of rats. Quantita-tive importance of glutamine, glutamate and aspartate. J. Biol.Chem. 255:107–112.
Yu, F., L. A. Bruce, A. G. Calder, E. Milne, R. L. Coop, F. Jackson,G. W. Horgan, and J. C. MacRae. 2000. Subclinical infectionwith the nematode Trichostrongylus colubriformis increases gas-trointestinal tract leucine metabolism and reduces availabilityof leucine for other tissues. J. Anim. Sci. 78:380–390.

Cellular control of ubiquitin-proteasome-dependent proteolysis1
D. Attaix2, L. Combaret, M.-N. Pouch, and D. Taillandier
Human Nutrition Research Center of Clermont-Ferrand and Institut National de la Recherche Agronomique,Nutrition and Protein Metabolism Unit, Theix, 63122 Ceyrat, France
ABSTRACT: This review focuses on recent advancesin our understanding of the ubiquitin-proteasome-de-pendent pathway, which plays a major role in skeletalmuscle proteolysis and is involved in the control ofmany major biological functions. The ubiquitination/deubiquitination system is a complex machine responsi-ble for the specific tagging and proofreading of sub-strates degraded by the 26S proteasome, but ubiquiti-nation itself also serves other functions. The formationof a polyubiquitin degradation signal is usually re-quired for proteasome-dependent proteolysis. Hierar-
Key Words: Proteolysis, Ubiquitin, Proteinases, Calpains, Cathepsins, Skeletal Muscle
2002 American Society of Animal Science. All rights reserved. J. Anim. Sci. 80(E. Suppl. 2):E56–E63
Introduction
An exponential amount of information on the charac-terization and regulation of ubiquitin-proteasome-me-diated proteolysis has been obtained during the lasttwo decades. This pathway is the major non-lysosomalprocess responsible for the breakdown of most short-and long-lived proteins in mammalian cells (Rock etal., 1994). For example, in skeletal muscle, the systemis responsible for the breakdown of the major contractileproteins, actin and myosins (for recent reviews see At-taix and Taillandier, 1998; Lecker et al., 1999; Hassel-gren and Fischer, 2001). In addition, the pathway alsocontrols various major biological events such as cell-cycle progression, oncogenesis, transcriptional control,development and differentiation, signal transduction,receptor down-regulation and antigen processing, viathe breakdown of specific proteins (Peters et al., 1998;Hershko et al., 2000). In this review we first discussthe selectivity of the system, which is the most elaborate
1Studies in the laboratory of the authors are supported by theAssociation pour la Recherche contre le Cancer, the Conseil Regionald’Auvergne, the Institut National de la Recherche Agronomique, theFrench Ministere de la Recherche, and Nestle.
2To whom correspondence should be addressed (phone: 33 4 73 6242 11; fax: 33 4 73 62 47 55; E-mail: [email protected]).
Received July 24, 2001.Accepted January 25, 2002.
E56
chical families of enzymes, which may comprise dozensof members to achieve high selectivity, control this pro-cess. The substrates tagged by ubiquitin are then recog-nized by the 26S proteasome and degraded into pep-tides. However, the 26S proteasome also recognizes anddegrades some non-ubiquitinated proteins, and severalproteasome populations participate in protein break-down. Thus, mammalian cells contain multiple ubiquit-in- and(or) proteasome-dependent pathways. These sys-tems can degrade single proteins by alternative mecha-nisms and may also interfere or cooperate with otherproteolytic pathways.
protein degradation machinery known. We also de-scribe alternative ubiquitin- and(or) proteasome-depen-dent proteolytic routes and their possible connectionswith other proteolytic systems.
Ubiquitination
There are two main steps in the pathway: 1) covalentattachment of a polyubiquitin chain to the substrateand 2) specific recognition of this signal and degrada-tion of the tagged protein by the 26S proteasome (Fig-ure 1).
Ubiquitination is a multistep process (Hershko andCiechanover, 1998; Scheffner et al., 1998; Ciechanoveret al., 2000). In brief, ubiquitin is initially activatedin the presence of ATP to a high-energy thiol esterintermediate by the ubiquitin-activating enzyme (E1),which then transfers ubiquitin to one of the ubiquitin-conjugating enzymes (E2), which also forms a thiol es-ter linkage between the active site cysteine and ubiqui-tin. Ubiquitin-conjugating enzymes and(or) ubiquitin-protein ligases (E3), which play a role in the selectionof proteins for conjugation, bind the first ubiquitin mole-cule to protein substrates via an isopeptide bond be-tween the activated C-terminal glycine residue of ubi-quitin and the ε-amino group of a lysine residue of thesubstrate. The resulting monoubiquitinated protein isusually not targeted for degradation by the proteasome.Typical monoubiquitinated conjugates are receptors or

Ubiquitin-proteasome-dependent proteolysis E57
Figure 1. (A) Ubiquitin is first activated by the ubiqui-tin-activating enzyme (E1) and transferred on one ubiqui-tin-conjugating enzyme (E2). (B) The E2 with or withoutan ubiquitin-protein ligase (E3), mono- di or tri-ubiquiti-nates the substrate (Protein-[Ub]1,2,3), which is not tar-geted for breakdown. (C) In constrast, when a polyubiqui-tin degradation signal is formed (Protein-[Ub]n), the sub-strate can be deubiquitinated (D) or is recognized anddegraded into peptides by the 26S proteasome (E).
basic proteins such as histones. Alternatively, E2and(or) E3 catalyze the formation of polyubiquitinatedconjugates. This is usually achieved by transfer of addi-tional activated ubiquitin moieties to Lys48 of the pre-ceding conjugated ubiquitin molecule. Finally, a fourthenzyme, called E4, which catalyzes the efficient poly-merization of very long polyubiquitin chains, has beencharacterized in yeast (Koegl et al., 1999).
The ubiquitin-conjugating system is hierarchical. Inmammals there is a single E1 (Hershko and Ciecha-nover, 1998; Pickart, 2001), at least 20 to 30 E2 (Schef-fner et al., 1998), and several dozen E3 (Wilkinson,2000; Pickart, 2001).
Ubiquitin-Activating Enzyme (E1)
Ubiquitin-activating enzyme exists as two isoformsof 110 and 117 kDa that derive from a single gene andare found in both the nucleus and cytosol (Haas andSiepmann, 1997). The reaction starts with the bindingof ATP-Mg2+, and then of ubiquitin, leading to the for-mation of a ubiquitin adenylate intermediate thatserves as the donor of ubiquitin to the critical cysteineresidue in the E1 active site. When fully loaded, the E1carries two molecules of activated ubiquitin (as a thiolester and as an adenylate, respectively), so that thethiol-linked ubiquitin is transferred to one of the E2.This reaction is very efficient and allows the productionof activated ubiquitin for the entire downstream ubiqui-tin conjugation pathway. Thus, and not surprisingly,deletion of E1 is lethal in yeast.
Ubiquitin-Conjugating Enzymes (E2)
Ubiquitin-conjugating enzymes are a superfamily ofrelated proteins with a molecular weight range of ∼14to 35 kDa. There are four classes of E2 that share acentral catalytic domain of ∼150 amino acids with theactive site cysteine, and some variable N- and(or) C-terminal extensions that may play a role in substratespecificity. There are 11 E2 in yeast (Pickart, 2001) and20 to 30 E2 in mammals (Scheffner et al., 1998). Despitetheir structural similarities, E2 are responsible for dis-tinct biological functions so that only a limited numberof E2 (e.g., three E2 in yeast) play a role in the formationof the polyubiquitin degradation signal. The other yeastE2 are involved in the formation of mono-, di-, and tri-ubiquitin conjugates that are not targeted for degrada-tion (see below). The formation of the polyubiquitindegradation signal is catalyzed by only the E1 and someE2, and more generally by the E1, one E2, and one E3.A given E2 can interact with a limited number of E3(and conversely), which in turn recognize their specificprotein substrates (Pickart, 2001). Moreover, a givenprotein substrate can be ubiquitinated by different com-binations of E2 and E3 (Gonen et al., 1996). This resultsin a wide range of ubiquitination pathways, which arepresumably specific for a given protein or a class of sub-strates.
Ubiquitin-Protein Ligases (E3)
Ubiquitin-protein ligases play a key role in the ubi-quitin pathway and are responsible for the selectiverecognition of protein substrates. Very few E3 thatshared poor apparent structural similarities were firstdescribed (Hershko and Ciechanover, 1998). Recently,our knowledge of these enzymes has been rapidly grow-ing. All known E3 are HECT domain E3 or RING fingerE3 (Pickart, 2001).
The first major group of E3 corresponds to enzymes ofthe HECT (Homologous to E6-AP C-Terminus) domainfamily. E6-AP (E6-Associated Protein) forms a complexwith the papilloma virus E6 oncoprotein (which acts asan adapter protein) to ubiquitinate the tumor suppres-sor p53 protein. The final third of the E6-AP sequence,called the HECT domain, is approximately 350 aminoacids in length (Figure 2A). The HECT domain itselfmediates E2 binding and ubiquitination of the targetprotein via thiol ester linkage formation with ubiquitin.The N-terminus region of every HECT E3 binds to spe-cific substrate(s) (Figure 2A). Twenty different humanHECT E3 that interact with two classes of E2 havebeen described (Schwarz et al., 1998), but mammaliangenome sequencing projects have identified numerouspotential uncharacterized HECT E3 (Pickart, 2001).
The RING finger structure is defined by eight cyste-ine and histidine residues that coordinate two zinc ions(Freemont, 2000; Pickart, 2001) (Figure 2B). There areseveral hundred cDNA encoding RING finger proteinsin the GeneBank database, and many unrelated RING

Attaix et al.E58
Figure 2. Schematic representation of E3. (A) General structure of the HECT domain E3. N and C denotes the N-terminus and C-terminus, respectively, of the HECT E3. AA, amino acid; Cyst, cysteine residue, Ub, ubiquitin. (B)Schematic representation of the RING finger motif. C and H denote cysteine and histidine residues, respectively. (C)Schematic representation of the monomeric RING finger E3α. Type I and II denote the binding site for basic andhydrophobic N-terminal amino acid of the substrate, respectively. (D) Schematic representation of a multi-subunitRING finger SCF E3. The three subunits in the catalytic core are boxed in white, and Rbx1 is the RING fingersubunit. Cul1, cullin1. Adapter proteins are boxed in grey (see text).
finger proteins with unknown functions behave in vitroas E3 (Lorick et al., 1999). This suggests that the num-ber of E3 could be much larger than previously believed.The RING finger E3 are either monomeric proteins ormultiple subunit complexes (Pickart, 2001).
The nature of the N-terminal amino acid of a protein(N-end rule) may determine its rate of polyubiquitina-tion and subsequent degradation (Varshavsky, 1996).The N-end rule enzyme E3α that binds to proteins bear-ing basic or bulky hydrophobic N-terminal amino acidresidues (Figure 2C) is the best known monomericRING finger E3. E3α interacts with the 14-kDa E2.
The multiple subunit complexes of RING finger E3comprise, so far, at least three distinct E3 familiescalled the cyclosome or APC (Anaphase PromotingComplex) (Hershko and Ciechanover, 1998), the SCF(Skp1-Cdc53-F-box protein family), and the VCB-like(Von Hippel-Lindau tumor suppressor-ElonginC/B) E3(Tyers and Willems, 1999; Lisztwan et al., 1999; Pick-art, 2001). These complexes contain a catalytic core andsubstrate-specific adapter proteins (Tyers and Willems,
1999). For example, in SCF E3 the catalytic core isformed by three subunits: Cullin1, the RING fingersubunit Rbx1, and an E2 (Figure 2D). The adapter pro-tein Skp1 recruits (via the F-box motif) F-box proteins,which themselves recruit specific protein substratesthrough protein-protein interaction domains such asleucine-rich repeats or WD-40 domains (Figure 2D). F-box proteins represent an expanding family of eukaryo-tic proteins (Cenciarelli et al., 1999). Interestingly, sev-eral F-box proteins are themselves degraded in an ub-iquitin- and proteasome-dependent manner in vivo,suggesting that their breakdown allows rapid switchingamong multiple E3 complexes (Galan and Peter, 1999).
Signals That Target Substrates forUbiquitination and Proteolysis
Ubiquitination is an important and widespread post-translational modification of proteins that resemblesphosphorylation. Very importantly, ubiquitination isnot only a degradation signal, but also directs proteins

Ubiquitin-proteasome-dependent proteolysis E59
to a variety of fates that include roles in ribosomalfunction, in DNA repair, in protein translocation, and inmodulation of structure or activity of the target proteins(Wilkinson, 2000; Pickart, 2001). For example, manymonoubiquitinated proteins are targeted for endocyto-sis, ultimately resulting in proteolysis in the lysosome/yeast vacuole (Shih et al., 2000). In order to be effi-ciently degraded, the substrate must be bound to apolyubiquitin degradation signal that comprises atleast four ubiquitin moieties (Thrower et al., 2000).These signals are usually determined by short regionsin the primary sequence of the targeted protein (Pick-art, 2001).
The N-end rule pathway (see above) is involved inpolyubiquitination of some substrates and thus in theirsubsequent degradation (Varshavsky, 1996). However,the physiological role of the N-end rule is still unclear,because there are very few identified N-end rule sub-strates (Herskho and Ciechanover, 1998). So far, theN-end rule pathway is only known to be important forthe increased breakdown of soluble muscle proteins(Solomon et al., 1998). However, it is now clear thatthis pathway plays a role in specific biological functionssuch as the cell’s capacity to import peptides (Turneret al., 2000) or chromosome stability (Rao et al., 2001),via the breakdown of specific protein substrates.
Phosphorylation is required for efficient polyubiquiti-nation of several proteins, especially those recognizedby the SCF E3 (Hershko and Ciechanover, 1998). Themajor recognition site of G1 cyclins is present within a100- to 200-amino acid C-terminal region rich in Pro-Glu-Ser-Thr (PEST) motifs. These PEST motifs, whichare characteristic of rapidly degraded proteins (Rogerset al., 1986), are in fact minimum consensus phosphory-lation sites for several protein kinases (Wilkinson,2000). The ability of an E3 to recognize a phosphory-lated signal may be due to the presence of phosphoa-mino acid binding motifs, such as WW or WD40 do-mains (Pickart, 2001). However, there is no clear pat-tern of phosphorylation that targets substrates forubiquitination, because phosphorylation has been re-ported at single or multiple sites. Second, phosphoryla-tion of some proteins (c-Fos, c-Jun) actually preventstheir ubiquitination and degradation (Musti et al.,1997). Finally, recognition of substrates that dependson dephosphorylation has also been reported (Pick-art, 2001).
By contrast, the destruction box (i.e., a very degener-ate 9-amino acid motif) is a crucial signal for the ubiqui-tination and breakdown of mitotic cyclins and othercell-cycle regulators, both in vivo and in vitro. In thismotif, only Arg and Leu are invariable amino acids inpositions 1 and 4, respectively, and are key determi-nants of specificity (Hershko and Ciechanover, 1998;Pickart, 2001). The destruction box itself is not an ubi-quitination site, but is a transferable degradation sig-nal. Reporter proteins containing such motifs are rap-idly degraded in a cell-cycle-dependent manner. Recentdata may suggest that a specific conformation of the
destruction box is required for efficient E3 recognition(Pickart, 2001).
Deubiquitination
Eukaryotic cells also contain DUB (DeUBiquitinat-ing enzymes), which are encoded by the UCH (Ubiqui-tin Carboxyl-terminal Hydrolases) and the UBP (UBi-quitin-specific Processing proteases) gene families(Chung and Baek, 1999). Genome sequencing projectshave identified more than 90 DUB (Chung and Baek,1999). Ubiquitin carboxyl-terminal hydrolases are rela-tively small proteins (< 40 kDa) and constitute a smallfamily. Only one UCH exists in yeast, and only a coupleof isoforms have been characterized in higher eukary-otes. Ubiquitin carboxyl-terminal hydrolases mainlyhydrolyze small amides and esters at the C-terminusof ubiquitin. In contrast, UBPs are 50- to 250-kDa pro-teins and constitute a large family; 16 UBP are knownin yeast. Deubiquitination can be compared to dephos-phorylation, and not surprisingly UBP are involved inseveral biological processes, including the control ofgrowth, differentiation, and genome integrity. In pro-teasome-dependent proteolysis, the putative majorroles of DUB are 1) to maintain free ubiquitin levels,by processing ubiquitin precursors and polyubiquitindegradation signals into free monomers, 2) to proofreadubiquitination (e.g., to deubiquitinate substrates erron-eously tagged for degradation), and 3) to keep 26S pro-teasomes free of polyubiquitin chains that can interferewith the binding of another substrate.
Degradation of Non-ubiquitinated Proteins
The 26S proteasome is not an absolute ubiquitin-dependent proteolytic enzyme; it also degrades non-ubiquitinated substrates. The first discovered was orni-thine decarboxylase (ODC) (Murakami et al., 1992).The 26S proteasome recognizes the C-terminal degra-dation signal of ODC exposed by attachment of anti-zyme (a protein that binds to ODC and substitutes forubiquitin) (Murakami et al., 1999). Indeed, ubiquitina-tion does not seem always a prerequisite for the break-down of a growing number of substrates that includec-Jun (Jariel-Encontre et al., 1995), IκBα (Krappmannet al., 1996), the Cdk inhibitor p21Cip1 (Sheaff et al.,2000), denatured ovalbumin, and native forms of cal-modulin or troponin C (Benaroudj et al., 2001). The 26Sproteasome can recognize misfolded proteins that arenot ubiquitinated (Strickland et al., 2000). This mayaccount for the breakdown of denatured ovalbumin. Inaddition, hydrophobicity plays a major role in polyubi-quitin chain recognition by the 26S proteasome(Thrower et al., 2000). Hydrophobic stretches of aminoacids in the primary sequence of calmodulin and tropo-nin C may substitute for ubiquitin and be sufficientfor recognition by the 26S proteasome (Benaroudj etal., 2001).

Attaix et al.E60
Figure 3. Schematic representation of the gating of thechannel of the 20S proteasome by the 19S or 11S regula-tory complex. For simplicity only one 19S or 11S complexis shown. Left panel: in the free 20S proteasome particle (αand β denote α and β subunits, respectively) the channel(black oval within the upper α-ring) is blocked by N-terminal sequences of α-subunits. Substrate entry andpeptide release occur at a very low rate, if any. Rightpanel: the binding of one regulatory complex to the α-ring gates the 20S proteasome channel, so that both sub-strate entry and peptide release are increased.
The Proteasomes
The second major step in the ubiquitin-proteasomepathways is the degradation of polyubiquitinated pro-teins by the 26S proteasome, which is formed by thebinding of two 19S regulatory complexes with the 20Sproteasome (Voges et al., 1999; DeMartino and Slaugh-ter, 1999).
The 20S Proteasome
The mammalian 20S proteasome is a cylindrical par-ticle composed of four stacked rings of subunits, eachring containing seven different subunits. The outerrings are composed of α-subunits, and the two innerrings of β-subunits, which contain the catalytic sitesinside the particle (Figure 3). Thus the proteasome isa self-compartmentalizing protease (Baumeister et al.,1998); substrates must enter the catalytic chamber inorder to be degraded into peptides. In eukaryotes, the20S proteasome contains at least two chymotrypsin-like, two trypsin-like, and two caspase-like active sites(Kisselev et al., 1999). These activities are allostericallyregulated and it has been suggested that there is anordered, cyclical mechanism for protein degradation:
the chymotrypsin-like site may initially cleave the poly-peptide and stimulate the caspase-like sites; their acti-vation accelerates further cleavage of the fragments,while the chymotrypsin-like activity is temporarily in-hibited; when further caspase-like cleavages are impos-sible, the chymotryptic site is reactivated and the cyclerepeated (Kisselev et al., 1999). The confinement of mul-tiple active sites within a nano-compartment has an-other advantage. Proteasomes hydrolyze most peptidebonds and generate peptides that are typically 3 to 22amino acids long and do not conserve biological proper-ties, except for antigen presentation.
Substrates access the active sites by traversing a nar-row opening in the α-ring that is blocked in the unli-ganded free 20S proteasome by N-terminal sequencesof α-subunits (Whitby et al., 2000). The binding of 20Sproteasomes to 11S or 19S regulator complexes induceconformational changes in α-subunits that open thegate separating the catalytic chamber of the 20S protea-some from the intracellular environment (Groll et al.2000; Whitby et al., 2000) (Figure 3). Thus, whetherfree 20S proteasomes may have any proteolytic activityin cells remains an open question. Oxidized proteinshave been repeatedly reported to be degraded by 20Sproteasomes and not by 26 proteasomes (Davies, 2001).However, it is totally unclear how oxidized proteinsmay gate the 20S proteasome channel.
It should be pointed out that the 20S proteasomeis the proteolytic core of a modular system in whichpeptidase activities can be modulated by the bindingof regulatory complexes (see below). Furthermore, thereare immunoproteasomes in which three catalytic β sub-units are replaced by three distinct β subunits, so thatcatalytic properties are altered to generate antigenicpeptides more efficiently. Thus, there are different sub-types of 20S particles in a given tissue that differ bytheir catalytic properties. For example, the 20S protea-some population in skeletal muscle comprises six dis-tinct subtypes, including constitutive proteasomes, im-munoproteasomes, and their intermediate forms (Dahl-mann et al., 2001). Therefore, the properties of a 20Sproteasome population isolated from a given tissue rep-resent the average properties of the whole set of protea-somes subtypes.
The 19S Complex
The 19S complex is an activator that stimulates bothpeptidase and proteolytic activities of the 20S protea-some. This complex contains at least 18 different sub-units and can be topologically defined by two subcom-plexes called the base and the lid (Glickman et al.,1998). The base contains six ATPases, and three non-ATPase subunits in humans. The ATPases provide en-ergy for the assembly of the 26S proteasome and thebreakdown of ubiquitinated proteins into peptides, forthe gating of the proteasome channel, and presumablythe unfolding of protein substrates, and their injectioninto the catalytic chamber of the proteasome (Voges et

Ubiquitin-proteasome-dependent proteolysis E61
al., 1999; Kohler et al., 2001). The binding of the 20Sproteasome to the base alone supports ATP-dependentpeptide hydrolysis. In contrast, both the base and thelid are required for ubiquitin-dependent proteolysis(Glickman et al., 1998). The lid contains at least eightnon-ATPase subunits. Subunit S5a binds tightly to thepolyubiquitin degradation signal (Deveraux et al.,1994). However, the yeast homolog of S5a is not essen-tial for ubiquitin-dependent proteolysis (van Nocker etal., 1996). Thus, another subunit or several additionalsubunits may also act as a polyubiquitin-conjugate re-ceptor.
Surprisingly, the base of the 19S complex also haschaperone-like activity and is able to refold a denaturedprotein in vitro, a function opposite to its presumedrole in proteolysis (Braun et al., 1999). These findingssuggest that the ultimate fate of a proteasome substrate(degradation or refolding) is determined by subsequentevents (e.g., translocation into the proteolytic core)(Zwickl and Baumeister, 1999). Extensive experimentsare currently in progress in several laboratories to eluci-date the precise topology (Gorbea et al., 2000) and rolesof subunits in both the base and the lid (Kohler et al.,2001). Such experiments should provide insights intothe precise mechanisms that regulate the recognition,unfolding, and translocation of substrates into the pro-teasome, and contribute to elucidate the precise role(s)of ATP in proteolysis. For example, it has been recentlyreported that Rpt2, one of the six ATPases in the baseof the 19S complex, gates the proteasome channel andcontrols both substrate entry and product release(Kohler et al., 2001).
Other Proteasome Activators
The 11S regulator is another regulatory particle ofthe 20S proteasome. The 11S regulator (an hexamer orheptamer of subunits PA28α and β) binds to both endsof the 20S proteasome in an ATP-independent fashionto form a PA28 particle. The binding of the 11S regula-tor to the 20S proteasome only modulates its peptidaseactivities. PA28 particles play a role in antigen presen-tation, by generating peptides for MHC class I mole-cules, possibly in connection with 26S immunoprotea-somes (Rechsteiner et al., 2000).
Subunit PA28γ is closely related to subunits PA28αand β. PA28γ is able to form a homopolymer that alsobinds to 20S proteasomes. The resulting proteasome-PA28γ seems to be involved in growth control (Murataet al., 1999).
Finally, the existence of hybrid proteasomes, in whichone 11S regulator and one 19S complex bind simultane-ously to a 20S proteasome, has been demonstrated(Hendil et al., 1998). Such complexes are induced byinterferon-γ and play a role both in antigen presenta-tion and in the breakdown of some proteins (Tanahashiet al., 2000, and see below).
The Ubiquitination and the Proteasome SystemsAre Part of a Huge Proteolytic Machine
The mechanism that facilitates the translocation ofa substrate to the proteasome in vivo is poorly under-stood. However, a physical association between severalE2 and the 26S proteasome has been reported (Ton-gaonkar et al., 2000) and E2 bind tightly to the ubiqui-tin-loaded E1 (Pickart, 2001). Various E3 also interactwith specific subunits of the 19S complex (Xie and Vars-havsky, 2000). Thus, the whole ubiquitination systemmay directly and physically participate in the deliveryof tagged substrates to the 26S proteasome.
The 26S proteasome degrades proteins only into pep-tides. Except when presented on MHC Class I mole-cules, these peptides must undergo further hydrolysisinto free amino acids. In Thermoplasma acidophilumthe proteasome-generated peptides are then cleavedinto smaller di- to tetra-peptides by a huge (14.6 MDa)self-compartmentalizing proteolytic complex called thetricorn protease; finally, these di- to tetra-peptides aresequentially hydrolyzed into free amino acids by at leastthree additional aminopeptidase-interacting factors(Tamura et al., 1998). The tricorn protease has no homo-log in higher organisms. However, several giant prote-ases that may act downstream of the proteasome andpartially substitute for its functions have been recentlycharacterized in eukaryotic cells (Yao and Cohen, 1999).
Conversely, other proteases may act upstream of theproteasome. Specific interactions between the myofi-brillar proteins appear to protect them from ubiquitin-dependent degradation, and the rate-limiting step intheir degradation is probably their dissociation fromthe myofibril (Solomon and Goldberg, 1996). Calpainsplay key roles in the disassembly of sarcomeric proteins(Huang and Forsberg, 1998) and in Z-band disintegra-tion, resulting in the release of myofilaments (Williamset al., 1999). These data suggest that calpains are actingupstream of the proteasome. However, it remains to bedemonstrated whether there is a functional connectionbetween the two proteolytic systems. Finally, recentexperiments have shown that cathepsin L is systemati-cally overexpressed in several muscle-wasting condi-tions, suggesting that this lysosomal protease may alsocooperate with the ubiquitin-proteasome system inmuscle (Deval et al., 2001).
Degradation of Substrates of the Ubiquitin-Proteasome Pathway by
Alternative Proteolytic Routes
Ornithine decarboxylase, the first discovered non-ubiquitinated substrate of 26S proteasomes (see above),can also be degraded by hybrid proteasomes (Tanahashiet al., 2000). Thus, several proteasome-dependent path-ways can be involved in the breakdown of a single pro-tein substrate.
Another non-ubiquitinated substrate of the 26S pro-teasome is the protooncogene c-Jun (Jariel-Encontre et

Attaix et al.E62
al., 1995). However, c-Jun can also be ubiquitinated(Treier et al., 1994), and both ubiquitin-dependent andubiquitin-independent proteasome pathways degradethe protein. Similar situations are known for the invivo proteasomal breakdown of the IκBα transcriptionfactor inhibitor (Krappmann et al., 1996) and of theCdk inhibitor p21Cip1 (Sheaff et al., 2000). At least inthe case of IκBα these alternative ubiquitin-dependentand ubiquitin-independent, but proteasome-depen-dent, pathways dramatically affect the protein half-life,and thus tightly control IκBα activity (Krappmann etal., 1996).
Finally, the tumor suppressor p53 protein (Salvat etal., 1999) and the retinoblastoma family protein p107(Jang and Choi, 1999) are degraded in vivo by distinctproteolytic systems, the proteasome and the calpains.The proteasome, calpain (Salvat et al., 1999), and lyso-somal (Knecht et al., 1998) systems can even degradethe protooncogene c-Fos. All these observations suggestthat a given protein substrate is targeted for degrada-tion by many alternative proteolytic routes. Assumingthat various signaling pathways dictate the routes, thismay clearly explain how the cell rapidly modulates thehalf-lives of various proteins, in response to the cellenvironment, and accounts for the fine tuning of indi-vidual protein levels.
Implications
The precise mechanisms that regulate the ubiquitin-proteasome-dependent breakdown of some key proteins(e.g., cyclins, transcription factors) have started to beelucidated. In contrast, how this proteolytic pathwaydegrades muscle proteins, and more particularly con-tractile proteins, remains largely unknown. Informa-tion on the E2 and E3 that operate in muscle is stillscarce. Similarly, neither the signals that target myo-fibrillar proteins for breakdown nor the precise sub-strates of the pathway have been identified. Studiesthat aim to explore the role of deubiquitinating enzymeand the regulation of proteolytic/peptidase activities ofmuscle proteasomes are also needed. Finally, the possi-ble relationships of the ubiquitin-proteasome-pathwaywith the cathepsins and calpains should also be ex-plored in depth. However, the complexity of the ubiqui-tin pathway will clearly impede the identification of theprecise mechanisms that are important in the controlof muscle proteolysis.
Literature Cited
Attaix, D., and D. Taillandier. 1998. The critical role of the ubiquitin-proteasome pathway in muscle wasting in comparison to lyso-somal and Ca2+-dependent systems. In: E. E. Bittar and A. J.Rivett (ed.) Intracellular Protein Degradation. p 235. JAI PressInc., Greenwich, CT.
Baumeister, W., J. Walz, F. Zuhl, and E. Seemuller. 1998. The protea-some: Paradigm of a self-compartmentalizing protease. Cell92:367–380.
Benaroudj, N., E. Tarcsa, P. Cascio, and A. L. Goldberg. 2001. Theunfolding of substrates and ubiquitin-independent protein degra-
dation by proteasomes. Biochimie (Paris) 83:311–318.275:875–882.
Braun, B. C., M. Glickman, R. Kraft, B. Dahlmann, P. M. Kloetzel,D. Finley, and M. Schmidt. 1999. The base of the proteasomeregulatory particle exhibits chaperone-like activity. Nat. Cell Biol.1:221–226.
Cenciarelli, C., D. S. Chiaur, D. Guardavaccaro, W. Parks, M. Vidal,and M. Pagano. 1999. Identification of a family of human F-boxproteins. Curr. Biol. 9:1177–1179.
Chung, C. H., and S. H. Baek. 1999. Deubiquitinating enzymes: theirdiversity and emerging roles. Biochem. Biophys. Res. Commun.266:633–640.
Ciechanover, A., A. Orian, and A. L. Schwartz. 2000. Ubiquitin-medi-ated proteolysis: biological regulation via destruction. Bioessays22:442–451.
Dahlmann, B., T. Ruppert, P. M. Kloetzel, and L. Kuehn. 2001. Sub-types of 20S proteasomes from skeletal muscle. Biochimie (Paris)83:295–299.
Davies, K. J. 2001. Degradation of oxidized proteins by the 20S protea-some. Biochimie (Paris) 83:301–310.
DeMartino, G. N., and C. A. Slaughter. 1999. The proteasome, a novelprotease regulated by multiple mechanisms. J. Biol. Chem.274:22123–22126.
Deval, C., S. Mordier, C. Obled, D. Bechet, L. Combaret, D. Attaix, andM. Ferrara. 2001. Identification of cathepsin L as a differentiallyexpressed message associated with skeletal muscle wasting. Bio-chem. J. 360:143–150.
Deveraux, Q., V. Ustrell, C. Pickart, and M. Rechsteiner. 1994. A 26Sprotease subunit that binds ubiquitin conjugates. J. Biol. Chem.269:7059–7061.
Freemont, P. S. 2000. RING for destruction? Curr. Biol. 10:R84–R87.Galan, J. M., and M. Peter. 1999. Ubiquitin-dependent degradation of
multiple F-box proteins by an autocatalytic mechanism. Proc.Natl. Acad. Sci. USA 96:9124–9129.
Glickman, M. H., D. M. Rubin, O. Coux, I. Wefes, G. Pfeifer, Z. Cjeka,W. Baumeister, V. A. Fried, and D. Finley. 1998. A subcomplexof the proteasome regulatory particle required for ubiquitin-conju-gate degradation and related to the COP9-signalosome and eIF3.Cell 94:615–623.
Gonen, H., I. Stancovski, D. Shkedy, T. Hadari, B. Bercovich, E. Bengal,S. Mesilati, O. Abu-Atoum, A. L. Schwartz, and A. Ciechanover,1996. Isolation, characterization, and partial purification of anovel ubiquitin-protein ligase, E3. J. Biol. Chem. 271:302–310.
Gorbea, C., D. Taillandier, and M. Rechsteiner. 2000. Mapping subunitcontacts in the regulatory complex of the 26 S proteasome. S2and S5b form a tetramer with ATPase subunits S4 and S7. J.Biol. Chem. 275:875–882.
Groll, M., M. Bajorek, A. Kohler, L. Moroder, D. M. Rubin, R. Huber,M. H. Glickman, and D. Finley. 2000. A gated channel into theproteasome core particle. Nat. Struct. Biol. 7:1062–1067.
Haas, A. L., and T. J. Siepmann. 1997. Pathways of ubiquitin conjuga-tion. FASEB J. 11:1257–1268.
Hasselgren, P. O., and J. E. Fischer. 2001. Muscle cachexia: currentconcepts of intracellular mechanisms and molecular regulation.Ann. Surg. 233:9–17.
Hendil, K. B., S. Khan, and K. Tanaka. 1998. Simultaneous bindingof PA28 and PA700 activators to 20S proteasomes. Biochem. J.332:749–754.
Hershko, A., and A. Ciechanover. 1998. The ubiquitin system. Annu.Rev. Biochem. 67:425–479.
Hershko, A., A. Ciechanover, and A. Varshavsky. 2000. Basic MedicalResearch Award. The ubiquitin system. Nat. Med. 6:1073–1081.
Huang, J., and N. E. Forsberg. 1998. Role of calpain in skeletal-muscleprotein degradation. Proc. Natl. Acad. Sci. USA 95:12100–12105.
Jang, J. S., and Y. H. Choi. 1999. Proteolytic degradation of the retino-blastoma family protein p107: a putative cooperative role of cal-pain and proteasome. Int. J. Mol. Med. 4:487–492.
Jariel-Encontre, I., M. Pariat, F. Martin, S. Carillo, C. Salvat, and M.Piechaczyk 1995. Ubiquitinylation is not an absolute requirementfor degradation of c-Jun protein by the 26S proteasome. J. Biol.Chem. 270:11623–11627.

Ubiquitin-proteasome-dependent proteolysis E63
Kisselev, A. F., T. N. Akopian, V. Castillo, and A. L. Goldberg. 1999.Proteasome active sites allosterically regulate each other, sug-gesting a cyclical bite-chew mechanism for protein breakdown.Mol. Cell 4:395–402.
Knecht, E., J. J. M. de Llano, E. J. Andreu, and I. M. Miralles. 1998.Pathways for the degradation of intracellular proteins within lyso-somes in higher eukaryotes. In: E. E. Bittar and A. J. Rivett(ed.) Intracellular Protein Degradation. p 201. JAI Press Inc.,Greenwich, CT.
Koegl, M., T. Hoppe, S. Schlenker, H. D. Ulrich, T. U. Mayer, and S.Jentsch. 1999. A novel ubiquitination factor, E4, is involved inmultiubiquitin chain assembly. Cell 96:635–644.
Kohler, A., P. Cascio, D. S. Leggett, K. M. Woo, A. L. Goldberg, andD. Finley. 2001. The axial channel of the proteasome core particleis gated by the rpt2 atpase and controls both substrate entry andproduct release. Mol. Cell 7:1143–52.
Krappmann, D., F. G. Wulczyn, and C. Scheidereit. 1996. Differentmechanisms control signal-induced degradation and basal turn-over of the NF-κB inhibitor IκBα in vivo. EMBO (Euro. Mol. Biol.Organ.) J. 15:6716–6726.
Lecker, S. H., V. Solomon, W. E. Mitch, and A. L. Goldberg. 1999.Muscle protein breakdown and the critical role of the ubiquitin-proteasome pathway in normal and disease states. J. Nutr. 129(1SSuppl.):227S–237S.
Lisztwan, J., G. Imbert, C. Wirbelauer, M. Gstaiger, and W. Krek.1999. The von Hippel-Lindau tumor suppressor protein is a com-ponent of an E3 ubiquitin-protein ligase activity. Genes Dev.13:1822–1833.
Lorick, K. L., J. P. Jensen, S. Fang, A. M. Ong, S. Hatakeyama, and A.M. Weissman. 1999. RING fingers mediate ubiquitin-conjugatingenzyme (E2)-dependent ubiquitination. Proc. Natl. Acad. Sci. USA96:11364–11369.
Murakami, Y., S. Matsufuji, T. Kameji, S. Hayashi, K. Igarashi, T.Tamura, K. Tanaka, and A. Ichihara. 1992. Ornithine decarboxyl-ase is degraded by the 26S proteasome without ubiquitination.Nature (Lond.) 360:597–599.
Murakami, Y., S. Matsufuji, S. I. Hayashi, N. Tanahashi, and K. Ta-naka. 1999. ATP-dependent inactivation and sequestration of or-nithine decarboxylase by the 26S proteasome are prerequisitesfor degradation. Mol. Cell. Biol. 19:7216–7227.
Murata, S., H. Kawahara, S. Tohma, K. Yamamoto, M. Kasahara, Y.Nabeshima, K. Tanaka, and T. Chiba. 1999. Growth retardationin mice lacking the proteasome activator PA28γ. J. Biol. Chem.274:38211–38215.
Musti, A. M., M. Treier, and D. Bohmann. 1997. Reduced ubiquitin-dependent degradation of c-Jun after phosphorylation by MAPkinases. Science (Wash DC) 275:400–402.
Peters, J.-M., J. R. Harris, and D. Finley (ed.). 1998. Ubiquitin andthe Biology of the Cell. Plenum Press, New York.
Pickart, C. M. 2001. Mechanisms underlying ubiquitination. Annu.Rev. Biochem. 70:503–533.
Rao, H., F. Uhlmann, K. Nasmyth, and A. Varshavsky. 2001. Degrada-tion of a cohesin subunit by the N-end rule pathway is essentialfor chromosome stability. Nature (Lond.) 410:955–959.
Rechsteiner, M., C. Realini, and V. Ustrell. 2000. The proteasomeactivator 11S REG (PA28) and class I antigen presentation. Bio-chem. J. 345:1–15.
Rock, K. L., C. Gramm, L. Rothstein, K. Clark, R. Stein, L. Dick, D.Hwang, and A. L. Goldberg. 1994. Inhibitors of the proteasomeblock the degradation of most cell proteins and the generation ofpeptides presented on MHC class I molecules. Cell 78:761–771.
Rogers, S., R. Wells, and M. Rechsteiner. 1986. Amino acids sequencescommon to rapidly degraded proteins: the PEST hypothesis. Sci-ence (Wash DC) 234:364–368.
Salvat, C., C. Acquaviva, I. Jariel-Encontre, P. Ferrara, M. Pariat, A.-M. Steff, S. Carillo, and M. Piechaczyk. 1999. Are there multipleproteolytic pathways contributing to c-Fos, c-Jun and p53 proteindegradation in vivo? Mol. Biol. Rep. 26:45–51.
Scheffner, M., S. Smith, and S. Jentsch. 1998. The ubiquitin-conjuga-tion system. In: J.-M. Peters, J. R. Harris, and D. Finley (ed.)
Ubiquitin and the Biology of the Cell. p 65. Plenum Press, NewYork.
Schwarz, S. E., J. L. Rosa, and M. Scheffner. 1998. Characterizationof human hect domain family members and their interaction withUbcH5 and UbcH7. J. Biol. Chem. 273:12148–12154.
Sheaff, R. J., J. D. Singer, J. Swanger, M. Smitherman, J. M. Roberts,and B. E. Clurman. 2000. Proteasomal turnover of p21Cip1 doesnot require p21Cip1 ubiquitination. Mol. Cell 5:403–410.
Shih, S. C., K. E. Sloper-Mould, and L. Hicke. 2000. Monoubiquitincarries a novel internalization signal that is appended to activatedreceptors. EMBO (Euro. Mol. Biol. Organ.) J. 19:187–198.
Solomon, V., V. Baracos, P. Sarraf, and A. L. Goldberg. 1998. Ratesof ubiquitin conjugation increase when muscles atrophy, largelythrough activation of the N-end rule pathway. Proc. Natl. Acad.Sci. USA 95:12602–12607.
Solomon, V., and A. L. Goldberg. 1996. Importance of the ATP-ubiqui-tin-proteasome pathway in the degradation of soluble and myofi-brillar proteins in rabbit muscle extracts. J. Biol. Chem.271:26690–26697.
Strickland, E., K. Hakala, P. J. Thomas, and G. N. DeMartino. 2000.Recognition of misfolding proteins by PA700, the regulatory sub-complex of the 26 S proteasome. J. Biol. Chem. 275:5565–5572.
Tamura, N., F. Lottspeich, W. Baumeister, and T. Tamura. 1998. Therole of tricorn protease and its aminopeptidase-interacting factorsin cellular protein degradation. Cell 95:637–648.
Tanahashi, N., Y. Murakami, Y. Minami , N. Shimbara, K. B. Hendil,and K. Tanaka. 2000. Hybrid proteasomes. Induction by inter-feron-gamma and contribution to ATP-dependent proteolysis. J.Biol. Chem. 275:14336–14345.
Thrower, J. S., L. Hoffman, M. Rechsteiner, and C. M. Pickart. 2000.Recognition of the polyubiquitin proteolytic signal. EMBO (Euro.Mol. Biol. Organ.) J. 19:94–102.
Tongaonkar, P., L. Chen, D. Lambertson, B. Ko, and K. Madura. 2000.Evidence for an interaction between ubiquitin-conjugating en-zymes and the 26S proteasome. Mol. Cell. Biol. 20:4691–4698.
Treier, M., L. M. Staszewski, and D. Bohmann. 1994. Ubiquitin-depen-dent c-Jun degradation in vivo is mediated by the delta domain.Cell 78:787–798.
Turner, G. C., F. Du, and A. Varshavsky. 2000. Peptides accelerate theiruptake by activating a ubiquitin-dependent proteolytic pathway.Nature (Lond.) 405:579–583.
Tyers, M., and A. R. Willems. 1999. One ring to rule a superfamily ofE3 ubiquitin ligases. Science (Wash DC) 284:601–604.
van Nocker, S., S. Sadis, D. M. Rubin, M. Glickman, H. Fu, O. Coux,I. Wefes, D. Finley, and R. D. Vierstra. 1996. The multiubiquitin-chain-binding protein Mcb1 is a component of the 26S proteasomein Saccharomyces cerevisiae and plays a nonessential, substrate-specific role in protein turnover. Mol. Cell. Biol. 11:6020–6028.
Varshavsky, A. 1996. The N-end rule: functions, mysteries, uses. Proc.Natl. Acad. Sci. USA 93:12142–12149.
Voges, D., P. Zwickl, and W. Baumeister. 1999. The 26S proteasome:a molecular machine designed for controlled proteolysis. Annu.Rev. Biochem. 68:1015–1068.
Whitby, F. G., E. I. Masters, L. Kramer, J. R. Knowlton, Y. Yao, C. C.Wang, and C. P. Hill. 2000. Structural basis for the activation of20S proteasomes by 11S regulators. Nature (Lond.) 408:115–120.
Wilkinson, K. D. 2000. Ubiquitination and deubiquitination: targetingof proteins for degradation by the proteasome. Semin. Cell Dev.Biol. 11:141–148.
Williams, A. B., G. M. Decourten-Myers, J. E. Fischer, G. Luo, X.Sun, and P. O. Hasselgren. 1999. Sepsis stimulates release ofmyofilaments in skeletal muscle by a calcium-dependent mecha-nism. FASEB J. 13:1435–1443.
Xie, Y., and A. Varshavsky. 2000. Physical association of ubiquitinligases and the 26S proteasome. Proc. Natl. Acad. Sci. USA97:2497–2502.
Yao, T., and R. E. Cohen. 1999. Giant proteases: beyond the proteasome.Curr. Biol. 9:R551–R553.
Zwickl, P., and W. Baumeister. 1999. AAA-ATPases at the crossroadsof protein life and death. Nat. Cell Biol. 1:E97–E98.

Reproductive, growth, feedlot, and carcass traits oftwin vs single births in cattle1,2
S. E. Echternkamp3 and K. E. Gregory
USDA, ARS, Roman L. Hruska U.S. Meat Animal Research Center, Clay Center, NE 68933
ABSTRACT: The frequency of fraternal twin birthshas increased 3.1% per year to an annual rate of 50 to55% twins in a selected herd of cattle at the U. S. MeatAnimal Research Center. Because twin ovulations arethe first prerequisite for fraternal twins, breeding valuefor twinning was predicted by repeated measures ofovulation rate in all yearling heifers and of twinningrate in selected females. Gestation length was shorter(276.1 vs 283.1 d; P < 0.01) and birth weight was lower(37.2 vs 47.2 kg; P < 0.01) for twin vs single calves,respectively, but total birth weight (live) was increased53.1% for twins. Respective weaning weights (200-dweight) were 232 vs 259 kg (P < 0.01). Number of calvesweaned per cow calving was 0.89 for single, 1.52 fortwin births, and 1.80 for triplets (P < 0.01); total wean-ing weight was increased 48.1% for twins and 66.8%for triplets. Single-born male calves gained 74 g moreper day than twin-born males from birth to 200 d and45 g more per day from 200 d to slaughter; males were
Key Words: Twins, Calf Survival, Dystocia, Productivity, Carcass Quality, Cattle
2002 American Society of Animal Science. All rights reserved. J. Anim. Sci. 80(E. Suppl. 2):E64–E73
Introduction
The development of a cattle population with an an-nual twinning rate of over 50% fraternal twins presentsa new paradigm in beef cattle management and produc-tion and affords an opportunity to increase both repro-ductive and economic efficiency in beef cattle. Whenthe Twinning Project was formalized at the U.S. MeatAnimal Research Center (MARC) in 1981, twinning
1Names are necessary to report factually on available data; how-ever, the USDA neither guarantees nor warrants the standard of theproduct, and the use of the same by USDA implies no approval ofthe product to the exclusion of others that may also be suitable.
2Appreciation is expressed to Gordon Hays, Mike Wilford, JohnStark, Doug Felber, Dan O’Kief, Steve Snell, Melvin Sukup, LoyalClang, and Todd Boman for operations and technical support and toDarrell Light for data analyses.
3Correspondence: P. O. Box 166 (phone: 402-762-4183; fax: 402-762-4382; E-mail: [email protected]).
Received July 27, 2001.Accepted January 25, 2002.
1
weaned at an average of 172 d of age and were castratedat 200 d. Differences in carcass traits between twinand single steers were small. Freemartins, 96% of thefemales born co-twin to a male, did not differ from intacttwin females in growth traits, but freemartins hadhigher (P < 0.05) scores for marbling and a greater (P< 0.05) percentage of carcasses were USDA Choice orhigher quality grade. Efficiency constraints to twinbirths were increased (P < 0.01) incidence of retainedplacentas (27.9 vs 1.9%), of dystocia (46.9 vs 20.6%), andof perinatal calf mortality (14.1 vs 3.6%); calf survival at200 d of age was 12.4% less for twin calves. Dystociaof twins resulted primarily from malpresentation of oneor both calves at birth. Fertility was reduced 11.6% (P< 0.01) after a twin birth and 7.3% (P < 0.05) after aretained placenta, but the effect of twinning on fertilityvaried significantly (P < 0.01) among years and seasons.Collectively, twinning increased productivity at wean-ing by 54.2 kg (or 28.3%) per cow exposed at breeding.
rate in cattle ranged from about 0.5% in British beefbreeds to 1 to 2% in the Continental breeds and to 4%in some dairy breeds (Rutledge, 1975). However duringthe past 20 yr, there has been a trend for the frequencyof fraternal twins to increase in most cattle breeds (e.g.,twinning rates of 10 to 15% in some Holstein herds;Fricke, 2001).
Based on their origin, twin births are classified asfraternal or identical twins. Fraternal, or dizygotic,twins are the most common type of twins. As the termdizygotic implies, fraternal twins originate from twoseparate ova or eggs. Thus, the first prerequisite for aset of fraternal twins is a twin ovulation, which canoccur either on the same ovary or one on each ovary.A corpus luteum (CL) forms at the ovulation site as theresult of luteinization and proliferation of the granulosaand thecal cells that originally lined the ovulatory folli-cle(s). Thus, ovulation rate can be measured by countingthe number of CL present on the ovaries several daysafter ovulation; CL can be detected in cattle by eitherrectal palpation, ultrasonography, or laparoscopy of theovaries. In contrast, identical, or monozygotic, twins
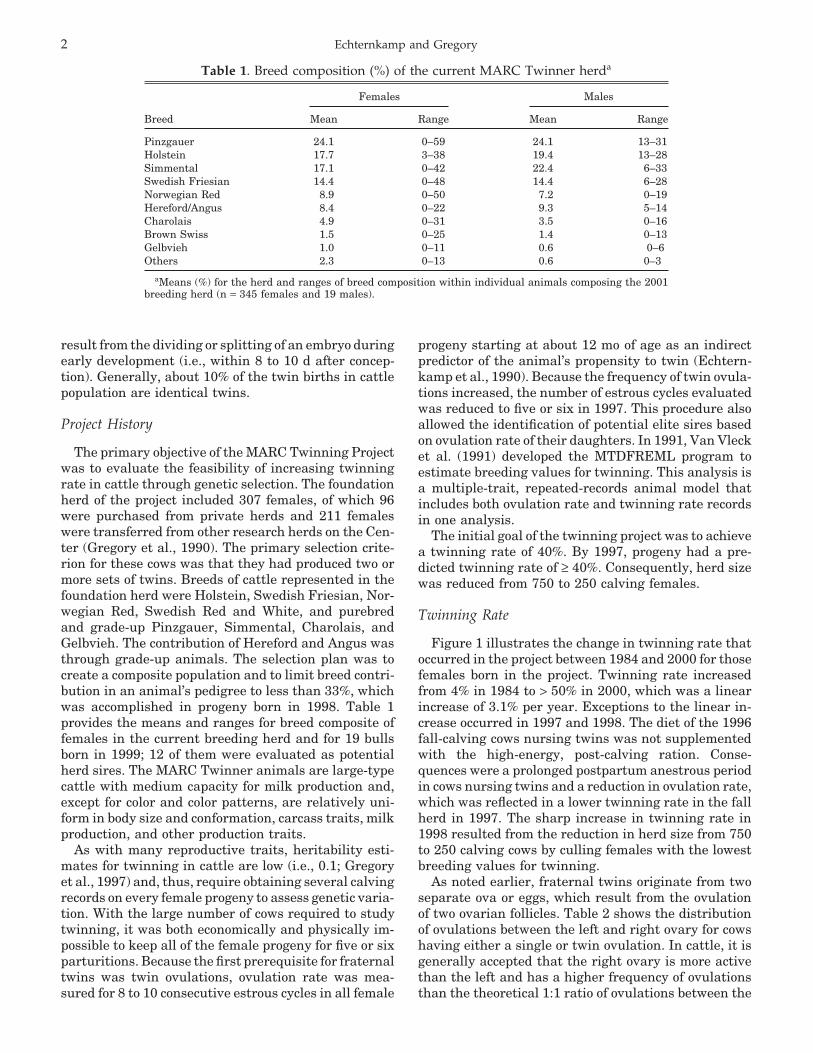
Echternkamp and Gregory2
Table 1. Breed composition (%) of the current MARC Twinner herda
Females Males
Breed Mean Range Mean Range
Pinzgauer 24.1 0–59 24.1 13–31Holstein 17.7 3–38 19.4 13–28Simmental 17.1 0–42 22.4 6–33Swedish Friesian 14.4 0–48 14.4 6–28Norwegian Red 8.9 0–50 7.2 0–19Hereford/Angus 8.4 0–22 9.3 5–14Charolais 4.9 0–31 3.5 0–16Brown Swiss 1.5 0–25 1.4 0–13Gelbvieh 1.0 0–11 0.6 0–6Others 2.3 0–13 0.6 0–3
aMeans (%) for the herd and ranges of breed composition within individual animals composing the 2001breeding herd (n = 345 females and 19 males).
result from the dividing or splitting of an embryo duringearly development (i.e., within 8 to 10 d after concep-tion). Generally, about 10% of the twin births in cattlepopulation are identical twins.
Project History
The primary objective of the MARC Twinning Projectwas to evaluate the feasibility of increasing twinningrate in cattle through genetic selection. The foundationherd of the project included 307 females, of which 96were purchased from private herds and 211 femaleswere transferred from other research herds on the Cen-ter (Gregory et al., 1990). The primary selection crite-rion for these cows was that they had produced two ormore sets of twins. Breeds of cattle represented in thefoundation herd were Holstein, Swedish Friesian, Nor-wegian Red, Swedish Red and White, and purebredand grade-up Pinzgauer, Simmental, Charolais, andGelbvieh. The contribution of Hereford and Angus wasthrough grade-up animals. The selection plan was tocreate a composite population and to limit breed contri-bution in an animal’s pedigree to less than 33%, whichwas accomplished in progeny born in 1998. Table 1provides the means and ranges for breed composite offemales in the current breeding herd and for 19 bullsborn in 1999; 12 of them were evaluated as potentialherd sires. The MARC Twinner animals are large-typecattle with medium capacity for milk production and,except for color and color patterns, are relatively uni-form in body size and conformation, carcass traits, milkproduction, and other production traits.
As with many reproductive traits, heritability esti-mates for twinning in cattle are low (i.e., 0.1; Gregoryet al., 1997) and, thus, require obtaining several calvingrecords on every female progeny to assess genetic varia-tion. With the large number of cows required to studytwinning, it was both economically and physically im-possible to keep all of the female progeny for five or sixparturitions. Because the first prerequisite for fraternaltwins was twin ovulations, ovulation rate was mea-sured for 8 to 10 consecutive estrous cycles in all female
progeny starting at about 12 mo of age as an indirectpredictor of the animal’s propensity to twin (Echtern-kamp et al., 1990). Because the frequency of twin ovula-tions increased, the number of estrous cycles evaluatedwas reduced to five or six in 1997. This procedure alsoallowed the identification of potential elite sires basedon ovulation rate of their daughters. In 1991, Van Vlecket al. (1991) developed the MTDFREML program toestimate breeding values for twinning. This analysis isa multiple-trait, repeated-records animal model thatincludes both ovulation rate and twinning rate recordsin one analysis.
The initial goal of the twinning project was to achievea twinning rate of 40%. By 1997, progeny had a pre-dicted twinning rate of ≥ 40%. Consequently, herd sizewas reduced from 750 to 250 calving females.
Twinning Rate
Figure 1 illustrates the change in twinning rate thatoccurred in the project between 1984 and 2000 for thosefemales born in the project. Twinning rate increasedfrom 4% in 1984 to > 50% in 2000, which was a linearincrease of 3.1% per year. Exceptions to the linear in-crease occurred in 1997 and 1998. The diet of the 1996fall-calving cows nursing twins was not supplementedwith the high-energy, post-calving ration. Conse-quences were a prolonged postpartum anestrous periodin cows nursing twins and a reduction in ovulation rate,which was reflected in a lower twinning rate in the fallherd in 1997. The sharp increase in twinning rate in1998 resulted from the reduction in herd size from 750to 250 calving cows by culling females with the lowestbreeding values for twinning.
As noted earlier, fraternal twins originate from twoseparate ova or eggs, which result from the ovulationof two ovarian follicles. Table 2 shows the distributionof ovulations between the left and right ovary for cowshaving either a single or twin ovulation. In cattle, it isgenerally accepted that the right ovary is more activethan the left and has a higher frequency of ovulationsthan the theoretical 1:1 ratio of ovulations between the

Productivity of twin-producing cattle 3
Figure 1. Change in twinning rate from 1984 to 2000in female progeny.
two ovaries (Echternkamp et al., 1990). The same phe-nomenon existed in cattle with twin ovulations; thefrequency of twin ovulations was also greater on theright ovary (Table 2). Theoretically, 25% of twin ovula-tions would occur on the left ovary, 25% on the right,and 50% bilaterally; again, the observed distributiondiffered (P < 0.05) from the theoretical.
Fertility
In the first study to evaluate the effect of ovulationrate on embryonic survival and twinning rate (Echtern-kamp et al., 1990), a portion of the cows in the Twinnerherd was laparoscoped 7 to 11 d after AI to determinethe number and location of the CL. It was assumedthat fertilization was ≥ 98% and, thus, each CL repre-sented a potential embryo. Sixty-eight percent (Table3) of the single ovulations yielded a calf, whether thesingle ovulation occurred on the left or right ovary.Embryonic survival was similar or a little lower fortwin ovulations (Table 3). With the number of observa-tions in the study, embryonic survival was similarwhether the twin ovulations were on the same ovary or
Table 2. Distribution (%) of ovulations between the left and right ovary in cattlea
Type of ovulation
Singleb Twinc
Location n % n %
Left ovary 716 45.0 299 19.5Right ovary 877 55.0 562 36.4Bilateral — — 681 44.1
aData collected from 1994 to 2000 and analyzed by chi-square analysis.bDistribution of single ovulations between ovaries differs (P < 0.05) from the theoretical ratio of 1:1.cDistribution differs (P < 0.05) from the theoretical ratio of 1:1:2.
involved both ovaries. Also, 48% of the twin ovulationsresulted in twin births.
Since 1990, the management procedure has been todetermine by ultrasonography the number and locationof the fetuses in the uterus and of the CL on the ovaries.The ultrasound examinations were performed transrec-tally by scanning the uterus and both ovaries with a3.5-MHz convex-array probe connected to a real-timeultrasound scanner (Aloka 500 V, Corometrics MedicalSystems, Wallingford, CT). Examination of the uterusbetween d 35 and 75 of gestation yielded the highestaccuracy for determination of fetal number; twin fe-tuses were easily missed before d 35 and some uteriwere too large for a complete scan after d 80 of gestation.Thus, the first ultrasound examination was conductedapproximately 75 d after the first day of the breedingseason. Females < 35 d of gestation or nonpregnant atthe first examination were re-examined about 35 dlater. The rationale for determining the number of fe-tuses was to provide cows gestating twins with a higherplane of nutrition and increased obstetrical care beforeand during calving because rumen capacity is compro-mised and dystocia is increased with a twin pregnancy.
About 10 wk before the projected beginning of thecalving season, cows gestating twins were sorted offand fed a corn silage-alfalfa haylage diet at a rate toprovide about 38 Mcal of ME�animal−1�d−1 vs 28 Mcalfor cows gestating a single. The nutritional goal was toachieve a body condition score of 6 or 7 on a 9-scorescale. Likewise, cows gestating twins were observedmore frequently and rendered obstetrical assistancequicker during calving; cows gestating twins have lessovert signs of labor, or labor subsides before expulsionof the calves, in comparison to cows birthing a single.Such dystocia may result from the extra fetal weight oftwins, which causes fatigue of the uterine musculaturebefore parturition is completed.
After calving, the cows were grouped by whether theywere nursing one or two calves. For triplets, one calfwas grafted to another cow. Cows nursing twins werefed a supplemented corn silage-corn diet to provideabout 58 Mcal�animal−1�d−1 until the beginning of thebreeding season, when the cows were allotted to breed-ing pastures and fed to nutritional need. Females nurs-ing a single calf were fed about 31 Mcal�animal−1�d−1
after calving. To better utilize human and production

Echternkamp and Gregory4
Table 3. Effect of ovulation rate on embryonic survivala
Type of ovulationb
Single Twin
Location nc %d nc %d
Left ovary 205 68.0 57 56.0Right ovary 114 68.0 35 67.0Bilateral — — 63 62.0
aData from Echternkamp et al. (1990).bOvulation rate was determined by laparoscopy on d 7 to 11 after AI.cNumber of cows.dRatio of number of calves born to number of corpora lutea and expressed as a percentage.
resources and to reduce the calving interval in damssuckling twins, the MARC Twinner herd has two breed-ing seasons. The 70-d spring-breeding period lasts fromlate May to early August, and the 60-d fall period fromlate October to late December.
Ovulation data reported in Table 4 were collectedat the two ultrasound examinations described above.Fertility was based on calving results rather than firsttrimester pregnancy diagnosis. Percentage of femalesthat calved after a single ovulation (Table 4) was thesame whether the ovulation was on the left or rightovary. Calving rates (conception) reported in Table 4were the accumulative total for the breeding seasonand, thus, conception was greater than for one AI inthe previous study (Table 3; Echternkamp et al., 1990).
As noted previously (Echternkamp et al., 1990), aboutone-half of the twin ovulations produced a twin birth(Table 4). However, in this comparison, twinning ratewas greater (P < 0.01) when the twin fetuses were lo-cated in separate uterine horns compared with bothfetuses in the same horn. Conversely, the incidence ofsingle births was reduced (P < 0.01) when the twinovulation was bilateral. The percentage of nonpregnantfemales was the same for all three groups. Becausethe percentage of nonpregnant females did not differ
Table 4. Effect of number and location of ovulations on fertility
Type of birthc
Corpora luteano. and locationa nb Nonpregnant, % Single, % Twin, % Triplet, %
Single ovulationLeft ovary 697 15.1 84.9 — —Right ovary 849 17.2 82.8 — —
Twin ovulationLeft ovary 298 16.8 27.9 55.4 —Right ovary 594 19.4 27.0 53.6 —Bilateral 674 17.8 20.9* 61.3* —
Triple ovulationSame ovary 23 52.2 0.0 34.8 13.0Bilateral 85 31.8 14.1 29.4 24.7
aOvulation rate category and location were determined by ultrasonography at 75 and 110 d after thebeginning of the breeding period.
bNumber of females.cDistribution (%) of females within an ovulatory location (row) by type of birth (yr 1994 to 2000).*Means differ within an ovulation rate category (P < 0.05).
between bilateral and unilateral twin ovulations, spec-ulation is that fertilization rate was decreased and(or)early embryonic mortality (i.e., before placental anasto-mosis between twins) was increased with unilateraltwin ovulations rather than increased abortions fromuterine crowding. Although the placenta will grow intoand attach in the contralateral uterine horn, migrationof bovine embryos between uterine horns is rare (Scan-lon, 1972; Echternkamp, 1992). Presumably, the localembryonic regulation of the uterine luteolytic factor hasprompted natural selection against embryo migrationin monotonous cattle. The detection of an embryo inthe uterine horn contralateral to a single ovulation isvery rare in either cattle or sheep (Scanlon, 1972). Thenumber of triplet ovulations has also increased in theTwinner herd, but only a small percentage of the tripletovulations (Table 4) produced triplet births. A signifi-cant percentage of the triplets were aborted during ges-tation, especially when all three were in the same uter-ine horn.
Fetal Survival
A unique characteristic of multiple fetuses in cattle isthe fusion or anastomosis of the chorionic blood vessels

Productivity of twin-producing cattle 5
Table 5. Comparisons between fetal number and subsequent type of birth
Type of birthc
Fetal diagnosisa nb Nonpregnant, % Single, % Twin, % Triplet, %
Single 890 6.0 92.2 1.8 —Twin 583 12.2 4.6 81.8 1.4Triplet 28 50.0 3.6 14.3 32.1
aNumber of fetuses was determined by ultrasonography between d 35 and 75 of gestation.bNumber of diagnosed pregnancies.cDistribution (%) of births within a fetal category (yr 1994 to 2000).
between fetuses so that fetuses share a common bloodsupply (Echternkamp, 1992). Chorionic membranesmay fuse between fetuses in sheep and swine, but rarelydo the blood vessels anastomose (Hunter, 1995). Fusionof the chorionic blood vessels between fetuses has twomajor consequences: 1) freemartin syndrome and 2) in-creased fetal mortality. Fusion of the placenta betweenfetuses occurs at about d 35 of gestation, which is sev-eral days before sexual differentiation of bovine fetuses(Jost et al., 1973). Also, sexual differentiation occursseveral days earlier in male than in female fetuses.Thus, when the twin fetuses are of different sex, anti-Mullerian hormone from the developing male gonad istransported to the female fetus via the common bloodsupply and suppresses development of the Mullerianduct system in the female (Vigier et al., 1984); the Mul-lerian duct system is the precursor of the female repro-ductive tract. The consequence is a genetic female withvery small, undifferentiated gonads and cords of con-nective tissue instead of a uterus, cervix, and an ante-rior vagina (see review by Echternkamp, 1998). Be-cause the exterior vagina originates from the urinarysystem, most freemartins have a short exterior vagina.Over 95% of the females born co-twin to a male are afreemartin and, thus, sterile (Gregory et al., 1996).
The second consequence of placental fusion is in-creased fetal mortality. When one fetus in a placentalunit dies, the other fetus(es) dies also (Echternkamp,1992). At each ultrasound pregnancy diagnosis, two orthree of the approximately 50 twin pregnancies werecomposed of a live and a dead fetus; all of these cowswere nonpregnant when rediagnosed 30 to 40 d later.Also, the incidence of a single-born freemartin femalecalf has been very rare, further suggesting that whenone twin fetus dies both fetuses die.
Table 5 summarizes the relationship between thenumber of fetuses diagnosed by ultrasonography be-tween d 35 and 75 of gestation (left column) and theresulting type of birth. Of the cows diagnosed with asingle fetus, 6.0% aborted before calving, 92.2% pro-duced a single, and a few (1.8%) cows were diagnosedincorrectly and yielded a twin birth. Twice the percent-age of cows with twin vs single fetuses (i.e., 12.2 vs6.0%) aborted during gestation, 4.6% gave birth to asingle (possibly diagnostic errors), and 81.8% gave birthto twins. Several females were diagnosed incorrectlyand birthed triplets. Embryonic (fetal) mortality was
significantly increased with triplet fetuses. Of the cowsdiagnosed with triplets, 50.0% aborted during gesta-tion, 14.3% produced twins, and 32.1% produced trip-let calves.
Gestation Length
Figure 2 illustrates the distribution of gestationlengths for cows gestating twins vs a single calf. Theprotocol was to record births if the calf was totally devel-oped and covered with hair. The mean for gestationlength was 7.6 d shorter for cows gestating twins com-pared with a single, but the distribution pattern wassimilar between the two groups.
Retained Placenta
A frequent consequence of twinning in cattle is anincreased incidence of retention of placental mem-branes after a twin birth (Pfau et al., 1948; Turman etal., 1971; Bellows et al., 1974). The incidence of placen-tal retention was further increased after a twin birthwith dystocia (type of birth × dystocia, P < 0.01; Table6). Premature induction of parturition in cattle in-creased the incidence of placental retention (Echtern-kamp et al., 1987). Gestation length was about a week
Figure 2. Distribution of gestation lengths for singleand twin births. Data from Echternkamp and Gregory(1999).

Echternkamp and Gregory6
Table 6. Incidence of retained placentaa
Variable nb %c
Type of birth (P < 0.01)Single 3,370 1.9Twin 1,014 27.9
Type of birth × dystocia (P < 0.01)Single without dystocia 2,630 1.7Single with dystocia 740 2.5Twin without dystocia 528 23.7Twin with dystocia 486 32.7
aData from Echternkamp and Gregory (1999).bNumber of parturitions.cMeans for percentage of parturitions with a retained placenta.
shorter for twin births (Figure 2), which may accountfor the increased incidence of retained placenta withtwins. A statistically significant relationship was notfound between gestation length and incidence of re-tained placenta among 672 twin births in the MARCherd (Table 7); however, gestation length only rangedfrom 270 to 284 d for the majority of the dams (i.e.,80.3%). Also, the increase (P < 0.01) in placental reten-tion associated with malpresentation dystocia (Table7) was substantially greater than the effect of gestationlength. In addition to increasing labor and veterinarycosts, retention of placental membranes also reducedsubsequent conception rates 7 to 8% after either a singleor twin birth (Table 8).
Dystocia
The incidence of dystocia was greater (P < 0.01) withtwin births and differed in cause between single andtwin births (Table 8). The MARC Twinner cattle arelarge-type cattle and produce calves with heavy birthweights (Gregory et al., 1996); thus, 17.7% of the single
Table 7. Effect of gestation length and dystocia onincidence of retained placenta (twin pregnancies)a
Variable nb %c
Gestation length, d≤ 264 40 52.5265–269 23 43.5270–274 97 26.8275–279 247 26.7280–284 196 24.5285–289 51 37.5≥ 290 18 38.8
Dystociad (P < 0.01)No assistance 352 28.9Traction 63 24.1Malpresentation 104 45.9Malpresentation with traction 153 42.1
aData from Echternkamp and Gregory (1999).bNumber of parturitions.cMeans for percentage of parturition with a retained placenta.dClassifications of dystocia were: no assistance, dystocia requiring
traction assistance, malpresentation of calf within the birth canal,or malpresentation followed by traction.
births required traction (Table 8). In contrast, thesmaller twin calves had a lower (P < 0.01) incidence ofbirths requiring traction (11.1%) but a higher (P < 0.01)incidence (38.6 vs 4.5%) of malpresentations due to ab-normal positioning of one or both calves in the birthcanal (Table 8). As reported previously (Bellows et al.,1971), major consequences of dystocia were reduced calfsurvival (Table 9) and fertility (type of birth × dystocia,P < 0.01; Table 8). Malpresentation of a twin calf atparturition further reduced its survival at birth com-pared with traction only (Table 9). Also, the incidenceof malpresentation was less (32.9 vs 46.7% for bilateralvs unilateral twins) and calf survival was increased(Table 10) when the twins were gestated in separateuterine horns. Dystocia with a twin birth (i.e., comparedwith no dystocia) did not affect (P > 0.10) subsequentfertility (Table 8).
Calf Survival
Table 9 illustrates differences in survival among sin-gle-, twin-, and triplet-born calves at birth, at 72 hafter birth, and at 200 d of age. Essentially all of thedifferences in calf survival among the three types ofbirth occurred at or within a few hours after birth;mortality rates from birth to 72 h and from 72 h to 200d were similar among the three birth groups. Dystociasignificantly reduced perinatal calf survival, especiallyfor twins (type of birth × dystocia, P < 0.01; Table 9).Age of dam did not affect calf survival but preliminaryobservations indicate that first-parity heifers may havedifficulty gestating triplets to term. Table 10 illustratesthe effect of uterine location on calf birth weight andsurvival. Of particular interest in this comparison wasthe increased (P < 0.01) calf weight and survival atbirth when the twins were located in separate uterinehorns. A possible contributing factor to the increasedsurvival of bilateral twins was the lower (P < 0.01)incidence of fetal malpresentations for bilateral twins(32.9%) compared with unilateral twins (46.7%).
Body Weight, ADG, and Carcass Traits: Steers
A comparison of growth traits (Table 11) betweensingle- and twin-born male calves revealed that the

Productivity of twin-producing cattle 7
Table 8. Effect of type of birth, retained placenta, and dystocia on fertility
Variable n %a
Retained placenta (RP; P < 0.05)Single birthb
Without RP 1,716 83.0*With RP 39 76.1
Twin birthc
Without RP 694 75.2*With RP 275 67.9
Type of birth × dystocia (P < 0.01)Single birth
No assistance 1,365 (77.8)d 84.8**Traction 311 (17.7)d 77.2Malpresentatione 79 (4.5)d 76.1
Twin birthNo assistance 487 (50.3)d 73.1Traction 108 (11.1)d 78.7Malpresentatione 374 (38.6)d 70.9
aPercentage of dams subsequently calving.b,cSuperscripts denote an effect of type of birth on fertility (P = 0.06).dDistribution (%) of dystocia in parenthesis.eMalpresentation with and without traction.*,**Means differ within type of birth; *P < 0.05, **P < 0.01.
twin calves were about 20% lighter (P < 0.01) at birthand about 10% lighter (P < 0.01) at weaning (Gregoryet al., 1996). Not only were the twin calves lighter (P< 0.01), but they were also 3 wk older (P < 0.01) atslaughter. The males were weaned at 172 d of age,castrated at 200 d of age, and fed a diet of 2.69 Mcalof ME/kg of DM and 12.88% CP until an average BWof 276 kg, then a diet of 3.12 Mcal ME and 11.50% CPuntil slaughter. Likewise, the larger single-born calves
Table 9. Effect of type of birth and of dystocia on calf survival (%)a
Age of calf
Variable nb Birth 72 h 200 d
Type of birth (P < 0.01)Single 2,045 96.4 94.2 88.6Twin 2,274 85.9 83.0 76.2Triplet 123 71.5 66.7 60.2
Type of birth × dystociac (P < 0.01)Single birth
No assistance 1,581 98.0 96.9 91.9Traction 369 93.5 88.1 80.2Malpresentation 11 54.5 36.4 36.4Malpresentation with traction 84 84.5 78.6 69.0
Twin birthNo assistance 1,104 90.8 88.2 80.8Traction 270 88.9 85.6 78.9Malpresentation 358 84.4 81.0 76.3Malpresentation with traction 542 75.5 72.3 65.5
Triplet birthNo assistance 48 79.2 72.9 66.7Traction — — — —Malpresentation 42 64.3 59.5 54.8Malpresentation with traction 33 69.7 66.7 57.6
aPercentage of calves alive at birth, 72 h, and 200 d of age.bNumber of calves born.cClassifications of dystocia were: no assistance, dystocia requiring traction assistance, malpresentation
of calf within the birth canal, or malpresentation followed by traction.
had greater (P < 0.01) ADG both before (1.08 vs 1.01kg/d) and after weaning (1.44 vs 1.39 kg/d) comparedwith twins, presumably reflecting both pre- and postna-tal maternal effects on calf growth.
Table 11 also provides a comparison of carcass traitsbetween the single- and twin-born steers. The heavierslaughter weight of the singles was reflected in a heav-ier (P < 0.01) carcass weight. Dressing percentage andestimated subcutaneous and perirenal fat (KPH) mea-
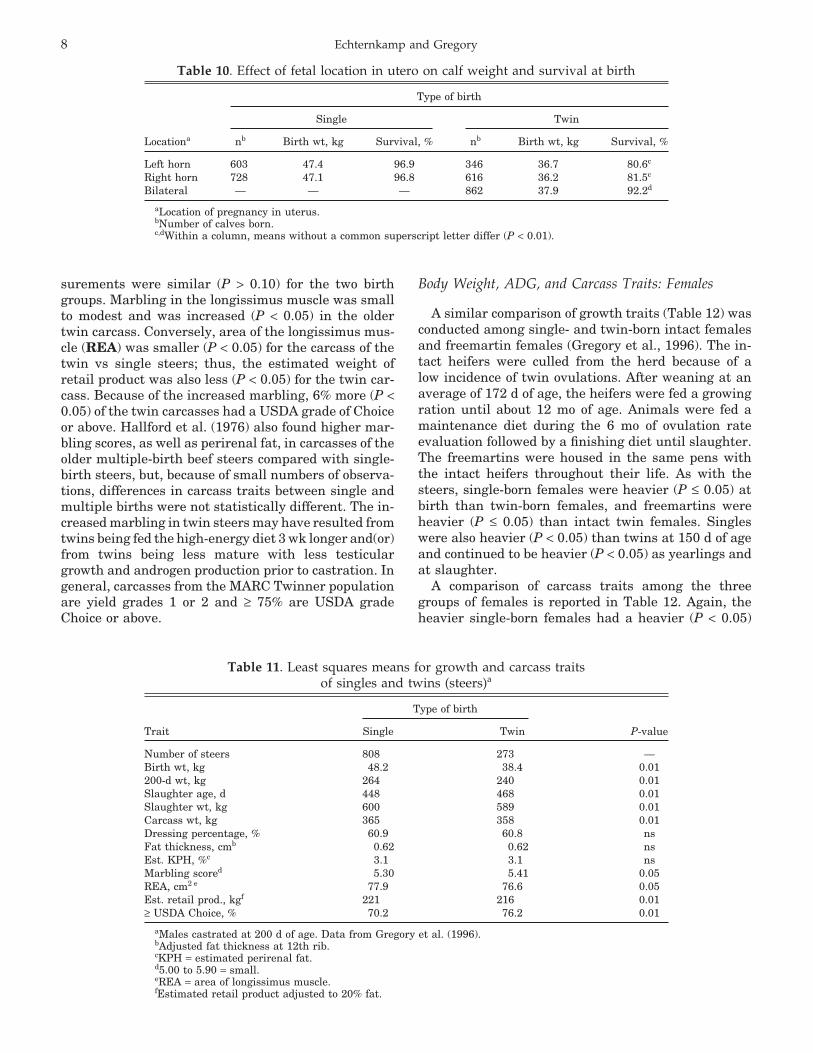
Echternkamp and Gregory8
Table 10. Effect of fetal location in utero on calf weight and survival at birth
Type of birth
Single Twin
Locationa nb Birth wt, kg Survival, % nb Birth wt, kg Survival, %
Left horn 603 47.4 96.9 346 36.7 80.6c
Right horn 728 47.1 96.8 616 36.2 81.5c
Bilateral — — — 862 37.9 92.2d
aLocation of pregnancy in uterus.bNumber of calves born.c,dWithin a column, means without a common superscript letter differ (P < 0.01).
surements were similar (P > 0.10) for the two birthgroups. Marbling in the longissimus muscle was smallto modest and was increased (P < 0.05) in the oldertwin carcass. Conversely, area of the longissimus mus-cle (REA) was smaller (P < 0.05) for the carcass of thetwin vs single steers; thus, the estimated weight ofretail product was also less (P < 0.05) for the twin car-cass. Because of the increased marbling, 6% more (P <0.05) of the twin carcasses had a USDA grade of Choiceor above. Hallford et al. (1976) also found higher mar-bling scores, as well as perirenal fat, in carcasses of theolder multiple-birth beef steers compared with single-birth steers, but, because of small numbers of observa-tions, differences in carcass traits between single andmultiple births were not statistically different. The in-creased marbling in twin steers may have resulted fromtwins being fed the high-energy diet 3 wk longer and(or)from twins being less mature with less testiculargrowth and androgen production prior to castration. Ingeneral, carcasses from the MARC Twinner populationare yield grades 1 or 2 and ≥ 75% are USDA gradeChoice or above.
Table 11. Least squares means for growth and carcass traitsof singles and twins (steers)a
Type of birth
Trait Single Twin P-value
Number of steers 808 273 —Birth wt, kg 48.2 38.4 0.01200-d wt, kg 264 240 0.01Slaughter age, d 448 468 0.01Slaughter wt, kg 600 589 0.01Carcass wt, kg 365 358 0.01Dressing percentage, % 60.9 60.8 nsFat thickness, cmb 0.62 0.62 nsEst. KPH, %c 3.1 3.1 nsMarbling scored 5.30 5.41 0.05REA, cm2 e 77.9 76.6 0.05Est. retail prod., kgf 221 216 0.01≥ USDA Choice, % 70.2 76.2 0.01
aMales castrated at 200 d of age. Data from Gregory et al. (1996).bAdjusted fat thickness at 12th rib.cKPH = estimated perirenal fat.d5.00 to 5.90 = small.eREA = area of longissimus muscle.fEstimated retail product adjusted to 20% fat.
Body Weight, ADG, and Carcass Traits: Females
A similar comparison of growth traits (Table 12) wasconducted among single- and twin-born intact femalesand freemartin females (Gregory et al., 1996). The in-tact heifers were culled from the herd because of alow incidence of twin ovulations. After weaning at anaverage of 172 d of age, the heifers were fed a growingration until about 12 mo of age. Animals were fed amaintenance diet during the 6 mo of ovulation rateevaluation followed by a finishing diet until slaughter.The freemartins were housed in the same pens withthe intact heifers throughout their life. As with thesteers, single-born females were heavier (P ≤ 0.05) atbirth than twin-born females, and freemartins wereheavier (P ≤ 0.05) than intact twin females. Singleswere also heavier (P < 0.05) than twins at 150 d of ageand continued to be heavier (P < 0.05) as yearlings andat slaughter.
A comparison of carcass traits among the threegroups of females is reported in Table 12. Again, theheavier single-born females had a heavier (P < 0.05)

Productivity of twin-producing cattle 9
Table 12. Least squares means for growth and carcass traitsof intact and freemartin femalesa
Type of birth
Trait Single Twin Freemartin
Number of animals 808 37 150Birth wt, kg 44.6g 35.2h 37.6i
150-d wt, kg 190g 164h 168h
368-d wt, kg 365g 335h 340h
Slaughter wt, kg 623g 603h 608h
Carcass wt, kg 365g 358h 367h
REA, cm2 b 86g 86g 79h
Marbling scorec 5.58g 5.47g 6.30h
Fat thickness, cmd 0.86g 0.79gh 0.73h
Est. KPH, %e 3.4 3.4 3.5Est. retail prod., kgf 225g 217h 212h
≥ USDA Choice, % 80.2g 76.6g 90.6h
aData from Gregory et al. (1996).bREA = area of longissimus muscle.c5.00 to 5.90 = small; 6.00 to 6.90 = modest.dAdjusted fat thickness at 12th rib.eKPH = estimated perirenal fat.fEstimated retail product adjust to 20% fat.g,h,iWithin a row, means without a common superscript letter differ (P < 0.05).
carcass than twins at slaughter. The REA of freemartincarcasses was consistently smaller (P < 0.05) comparedwith those of the intact females; REA did not differ (P> 0.10) between intact single- and twin-born heifers.The longissimus muscle of the freemartin had notice-ably more (P < 0.05) marbling, but subcutaneous fatthickness over the 12th rib was less (P < 0.05) for free-martin carcasses than for the single-born carcasses.The gonads of most freemartins are very small, undif-ferentiated, and nonfunctional; gonads from 28 of 34freemartins weighed ≤ 0.5 g per pair at 15 mo of age(Echternkamp et al., 1997). Estradiol was nondetect-able in the blood of these 15-mo-old freemartins, butserum testosterone concentrations were similar be-tween freemartin and intact females (0.21 ng/mL) andgreater (P = 0.09) than for steers (0.14 ng/mL). Absenceof the anabolic and metabolic effects of the gonadalsteroids on muscle development and fat deposition wasevident in the carcass of the freemartin. Similar differ-ences have been observed in comparisons between car-casses of intact and castrated animals. Estimated per-centage of perirenal fat was similar (P > 0.10) for thethree groups. Again, the smaller twin carcass yieldedless (P < 0.05) estimated retail product. Increased mar-bling in the longissimus muscle of the freemartin re-sulted in a high percentage (P < 0.05) of the freemartin
Table 13. Effect of type of birth on total calf weight produced per cow calving
Type of birth n Birth wt, kg 200-d wt, kg No. weaned
Single 2,045 47.1a 226.6a 0.89a
Twin 1,137 74.1b 335.7b 1.52b
Triplet 41 90.5c 377.9c 1.80c
a,b,cWithin a column, means without a common superscript letter differ (P < 0.01).
carcasses being USDA Choice or above. Hallford et al.(1976) found no difference in carcass characteristicsbetween single- and multiple-birth heifers whenslaughtered at a similar BW, but the younger singleheifers tended to have more lean and less fat.
Cow Productivity
A summary of the effect of single, twin, and tripletbirths on cow productivity is provided in Table 13. In-cluded in the comparison were means for total birthweight, number of calves weaned, and total weaningweight. Total weaning weight was the total calf weightweaned per cow calving; dams not weaning a calf wererecorded as 0 kg. Grafted calves (e.g., triplets) werecredited to their biological dam. Total birth weight was57.3% greater for a set of twins and 92.1% greater fora set of triplets compared with a single birth. Althoughtwinning reduced calf survival, dams producing a twinbirth weaned 70.8% more calves than dams with a sin-gle birth, which resulted in a 48.1% increase in totalweaning weight (335.7 vs 226.6 kg). Dams producing atriplet birth weaned twice as many calves (102.2%) asdams with a single birth for a 66.8% increase in totalkilograms of calf weaned. However, because of the in-creased mortality of triplets, the increase in weaning

Echternkamp and Gregory10
weight of triplets over twins was relatively small (i.e.,12.5%). Using results from experimentation and pro-duction systems simulation, Guerra-Martinez et al.(1990) estimated that twinning increased the efficiencyof producing beef 24%. An economic assessment of twin-ning in beef cattle has not been conducted for the MARCTwinner herd.
Implications
Collectively, these results indicate that a twinningtechnology can increase productivity of beef cattle.However, the final assessment of the potential benefitof twinning awaits an economic assessment of twin pro-duction in cattle. Because the Twinner animals aremanaged with other research herds at the Center, accu-rate data on actual labor, feed, and overhead costs ofthe Twinner animals have not been collected. In con-trast, the increased fetal and calf mortality for a tripletpregnancy questions the potential application of tripletbirths in cattle.
Literature Cited
Bellows, R. A., R. E. Short, D. C. Anderson, B. W. Knapp, and O. F.Pahnish. 1971. Cause and effect relationships associated withcalving difficulty and calf birth weight. J. Anim. Sci. 33:407–415.
Bellows, R. A., R. E. Short, J. J. Urick, and O. F. Pahnish. 1974.Effects of early weaning on postpartum reproduction of the damand growth of calves born as multiples or singles. J. Anim. Sci.39:589–600.
Echternkamp, S. E. 1992. Fetal development in cattle with multipleovulations. J. Anim. Sci. 70:2309–2321.
Echternkamp, S. E. 1998. Freemartin. In: E. Knobil and J. D. Neill(ed.) Encyclopedia of Reproduction. pp 406–417. Academic Press,San Diego, CA.
Echternkamp, S. E., and K. E. Gregory. 1999. Effects of twinning ongestation length, retained placenta, and dystocia. J. Anim. Sci.77:39–47.
Echternkamp, S. E., K. E. Gregory, G. E. Dickerson, L. V. Cundiff,R. M. Koch, and L. D Van Vleck. 1990. Twinning in cattle: II.Genetic and environmental effects on ovulation rate in puberal
heifers and postpartum cows and the effects of ovulation rateon embryonic survival. J. Anim. Sci. 68:1877–1888.
Echternkamp, S. E., K. E. Gregory, and M. Koohmaraie. 1997. Com-parison of growth and carcass traits between freemartin and co-twin males. J. Anim. Sci. 75(Suppl 1):180 (Abstr.).
Echternkamp, S. E., G. W. Hays, and W. G. Kvasnicka. 1987. Synchro-nization of parturition in beef cattle with prostaglandin anddexamethasone. Theriogenology 28:337–347.
Fricke, P. M. 2001. Review: Twinning in dairy cattle. Prof. Anim.Sci. 17:61–67.
Gregory, K. E., G. L. Bennett, L. D. Van Vleck, S. E. Echternkamp,and L. V. Cundiff. 1997. Genetic and environmental parametersfor ovulation rate, twinning rate, and weight traits in a cattlepopulation selected for twinning. J. Anim. Sci. 75:1213–1222.
Gregory, K. E., S. E. Echternkamp, and L. V. Cundiff. 1996. Effectsof twinning on dystocia, calf survival, calf growth, carcass traits,and cow productivity. J. Anim. Sci. 74:1223–1233.
Gregory, K. E., S. E. Echternkamp, G. E. Dickerson, L. V. Cundiff,R. M. Koch, and L. D. Van Vleck. 1990. Twinning in cattle: I.Foundation animals and genetic and environmental effects ontwinning rate. J. Anim. Sci. 68:1867–1876.
Guerra-Martinez, P., G. E. Dickerson, G. B. Anderson, and R. D.Green. 1990. Embryo-transfer twinning and performance effi-ciency in beef production. J. Anim. Sci. 68:4039–4050.
Hallford, D. M., E. J. Turman, G. E. Selk, L. E. Walters, and D. F.Stephens. 1976. Carcass composition in single and multiple birthcattle. J. Anim. Sci. 42:1098–1103.
Hunter, R. H. F. 1995. Anomalous sexual development in domesticspecies. In: Sexual Determination, Differentiation and Intersex-uality in Placental Mammals. Cambridge Univ. Press, New York.
Jost, A., B. Vigier, J. Prepin, and J. P. Perchellet. 1973. Studieson sex differentiation in mammals. Recent Prog. Horm. Res.29:1–41.
Pfau, K. O., J. W. Bartlett, and C. E. Shuart. 1948. A study of multiplebirths in a Holstein-Friesian herd. J. Dairy Sci. 31:241–254.
Rutledge, J. J. 1975. Twinning in cattle. J. Anim. Sci. 40:803–815.Scanlon, P. F. 1972. Frequency of transuterine migration of embryos
in ewes and cows. J. Anim. Sci. 34:791–794.Turman, E. J., D. B. Laster, R. E. Renbarger, and D. F. Stephens.
1971. Multiple births in beef cows treated with equine gonadotro-pin (PMS) and chorionic gonadotropin (HCG). J. Anim. Sci.32:962–967.
Van Vleck, L. D., K. E. Gregory, and S. E. Echternkamp. 1991. Predic-tion of breeding values for twinning rate and ovulation rate witha multiple trait, repeated records animal model. J. Anim. Sci.69:3959–3966.
Vigier, B., D. Tran, L. Legeai, J. Bezard, and N. Josso. 1984. Origin ofanti-Mullerian hormone in bovine freemartin fetuses. J. Reprod.Fertil. 70:473–479.

The influence of uterine function on embryonic and fetal survival1
J. L. Vallet2, K. A. Leymaster, and R. K. Christenson
USDA, ARS, Roman L. Hruska U.S. Meat Animal Research Center, Clay Center NE 68933-0166, USA
ABSTRACT: The secretion rate of growth factors andthe delivery rate of nutrients by the uterus to the con-ceptus affects the growth rate, development, and sur-vival of the conceptus. For most growth factors andnutrients, passage into the uterus is not simply con-trolled by diffusion. Many growth factors are productsof uterine tissue. Transport of some nutrients is aidedby specific transporter molecules on the uterine endo-metrial epithelial cell, whereas others (e.g., retinol,iron, and folate) are incorporated into uterine-secretedproteins (e.g., retinol binding protein, uteroferrin, andfolate binding protein). The rate of production of theseproteins during pregnancy profoundly affects preg-nancy outcome. Uterine gland knockout experimentsin sheep demonstrate that pregnancy fails in the ab-sence of uterine glands, the source of many uterine-secreted proteins. In pigs, both global and specific ef-fects of uterine products on aspects of conceptus devel-opment can influence litter size. The provision of growthfactors and nutrients by the uterus plays a role in en-
Key Words: Embryo, Fetus, Mortality, Perinatal, Progesterone, Stillbirth
2002 American Society of Animal Science. All rights reserved. J. Anim. Sci. 80(E. Suppl. 2):E115–E125
Introduction
Studies indicate that the rate of conceptus loss indomestic livestock during early pregnancy (i.e., embry-onic mortality occurring before implantation) rangesfrom 20 to 40% (Hanly, 1961; Perry and Rowlands,1962). When attempts are made to increase the numberof conceptuses in the uterus of pigs (Day et al., 1967;Bazer et al., 1969; Vallet, 2000), further losses occurduring later gestation, primarily due to the effects ofintrauterine crowding. This same phenomenon also oc-curs in cattle as the number of conceptuses in uterois increased to triplets (Echternkamp, 1992). Losses
1Names are necessary to report factually on available data; how-ever, the USDA neither guarantees nor warrants the standard of theproduct, and the use of the name by USDA implies no approval ofthe product to the exclusion of others that may also be suitable.
2Correspondence: P. O. Box 166, State Spur 18D (phone: 402-762-4187; fax: 402-762-4382; E-mail: [email protected]).
Received July 27, 2001.Accepted February 4, 2002.
E115
training conceptus development, so that the uterineenvironment and the developmental stage of the con-ceptus match. This uterine-dependent control of concep-tus development influences pregnancy success. For ex-ample, the uterus of the Meishan pig secretes less pro-tein prior to elongation, which slows conceptusdevelopment, results in smaller placentas and smallerfetuses, and allows for greater litter size. Furthermore,in Occidental pig breeds, an earlier rise in progesteroneat the beginning of pregnancy accelerates the onset ofprotein secretion, increases estrogen secretion by theconceptus, increases the size of the fetus in later preg-nancy, and decreases litter size. Studies of fetal erythro-poiesis also indicate that specific uterine products (ute-roferrin and folate binding protein) are required for thisimportant aspect of fetal development and that greaterlitter size is associated with improved erythropoiesis.Thus, manipulation of uterine function can modify con-ceptus development and affect pregnancy success indomestic livestock.
resulting from intrauterine crowding in swine are dueto limitations in uterine capacity, which has been func-tionally defined as the number of conceptuses that canbe maintained by the uterus until term (Christensonet al., 1987). In the past, fully formed fetuses, whetheralive or stillborn, were included when estimating uter-ine capacity (Christenson et al., 1987; Christenson andLeymaster, 2000). Thus, a final component of conceptusloss during gestation is the incidence of stillbirths. Still-births occur at a rate of around 5 to 10% in domesticlivestock (Christianson, 1992; Nix et al., 1998; Meyeret al., 2000).
Background
Although embryonic mortality occurs naturally, itcan be induced using a variety of treatments, whichhave led to improvements in our understanding of thisprocess. Conceptus-uterine asynchrony will cause em-bryonic loss (Rowson and Moor, 1966; Newcomb andRowson, 1975; Polge, 1982). Some nutritional manipu-lations also increase embryonic loss (Foxcroft, 1997).

Vallet et al.E116
Furthermore, in ruminants, embryonic loss occurswhen the progesterone corresponding to a previous cy-cle or the estrogen corresponding to estrus is omitted(Miller and Moore, 1976a). Several factors also influ-ence mortality caused by limitations in uterine capac-ity. In the Meishan pig, increased uterine capacity isassociated with slower conceptus growth during earlypregnancy (Ford and Youngs, 1993) and later preg-nancy (Christenson, 1993; Wilson et al., 1998). The effi-ciency of fetal erythropoiesis may also influence uterinecapacity (Vallet, 2000). Finally, it has been shown thatthe risk of stillbirth is negatively correlated with pigletweight at birth (Christianson, 1992). Small piglets areat greatest risk of loss during parturition, again sug-gesting that conceptus growth rate during pregnancyinfluences conceptus loss. Unfortunately, effects of fe-tal/piglet weight on uterine capacity and the incidenceof stillbirth appear to oppose each other, and litter sizemay be the result of a compromise between these twomechanisms. In sheep and cattle, large offspring areassociated with increased dystocia and stillbirths (Nixet al., 1998; Meyer et al., 2000). Various components ofuterine function contribute to each of these mecha-nisms. However, it is not yet clear how uterine functionis controlled during various stages of pregnancy andwhat may be done to improve conceptus survival duringearly pregnancy, midgestation, and the perinatalperiod.
Embryonic Mortality
The detrimental effect of asynchrony between theembryo and the uterine environment on embryo sur-vival has been shown through the use of embryo trans-fer experiments in each domestic livestock species(Rowson and Moor, 1966; Newcomb and Rowson, 1975;Wilmut et al., 1985). For all domestic livestock, theseexperiments indicated that asynchrony between theembryo donor and the recipient results in failure ofpregnancy. In general, embryonic loss due to asynch-rony is less when embryo development is advanced com-pared to uterine stage (Polge, 1982). In addition, theeffect of the naturally occurring variation in embryodevelopment on embryo mortality in pigs has been con-vincingly demonstrated (Pope, 1990). Embryos re-sulting from ova that ovulate last are the ones mostlikely to be lost. If these embryos from late-ovulatingova are transferred into a recipient that was in estrus1 d later than the donor of the embryos, the embryosdevelop appropriately. In ruminants, because multipleovulations are less common, variation in synchrony be-tween the embryo and the uterus and any effect it mighthave on embryo survival is more difficult to demon-strate. However, asynchronous embryo transfer sug-gests at least the possibility that asynchrony betweenthe embryo and uterine environment may be responsi-ble for embryonic loss in ruminants. Thus, componentsof uterine function must be responsible for the embryoloss due to asynchrony.
Nutritional manipulation also increases embryonicloss (Foxcroft, 1997). Increased feeding just prior toestrus results in an increase in ovulation rate, but italso increases embryo mortality (Ashworth et al., 1989;Ashworth, 1991). Other studies indicate that restrictedfeeding followed by unrestricted feeding near the timeof expected estrus also increases embryo mortality (Jin-dal et al., 1997; Almeida et al., 2000). These effects havebeen associated with decreased progesterone secretionduring early pregnancy (Ashworth et al., 1989; Jindalet al., 1996, 1997; Almeida et al., 2000). However, theeffect of exogenous progesterone during early preg-nancy on embryo survival depends on the nutritionalmodel used (Ashworth, 1991; Jindal et al., 1997; Maoand Foxcroft, 1998), sometimes increasing and some-times decreasing embryonic mortality. Nevertheless,the timing of the increase in progesterone influencesthe function of both the uterus and the embryo (seebelow), supporting the possibility that some of the nutri-tional effects on embryo mortality are due to progester-one-controlled changes in uterine function.
Embryo mortality also occurs in ovariectomized ewesunless progesterone corresponding to a previous cycleand estrogen corresponding to estrus is included in thesteroid replacement regimen (Miller and Moore, 1976;Miller et al., 1977). These results indicate that the cor-rect endocrine sequence is required in sheep to preparethe uterus for pregnancy, again suggesting a potentialrole for the uterus in embryo losses. However, this re-quirement does not appear to be present in pigs, be-cause the first cycle after weaning in pigs is fertiledespite the lack of progesterone.
Components of uterine function responsible for em-bryonic mortality resulting from asynchrony, nutritionor improper endocrine patterns are not fully under-stood. However, the uterus plays a key role in maternalrecognition of pregnancy, embryo elongation, implanta-tion, and support of the developing embryo during thisperiod of early pregnancy. Faults in any of these mecha-nisms could be responsible for embryonic mortality.
Maternal recognition of pregnancy in pigs (d 11) hasbeen well studied. Corpus luteum (CL) regression iscaused by uterine prostaglandin (PG) F2a secretion intothe uterine venous drainage (Moeljono et al., 1976). Therelease of PGF2a into the uterine venous drainage isabrogated in pregnancy (Moeljono et al., 1977). Theeffect of the embryo on PGF2a release is caused by em-bryonic estrogen secretion (Frank et al., 1977, 1978;Marengo et al., 1986). It has been suggested that embry-onic estrogen accomplishes this by redirecting PGF2asecretion into the uterine lumen and away from theuterine vascular drainage (Bazer and Thatcher, 1977;Bazer et al., 1984), a hypothesis that has not been con-vincingly disproved to date. However, recent resultsfrom several laboratories suggest that many compo-nents involved in CL regression in ruminants, mostnotably oxytocin and oxytocin receptors (see below), arealso present in the pig. Treatment of pigs with oxytocinstimulates PGF2a secretion by the uterus (Carnahan et
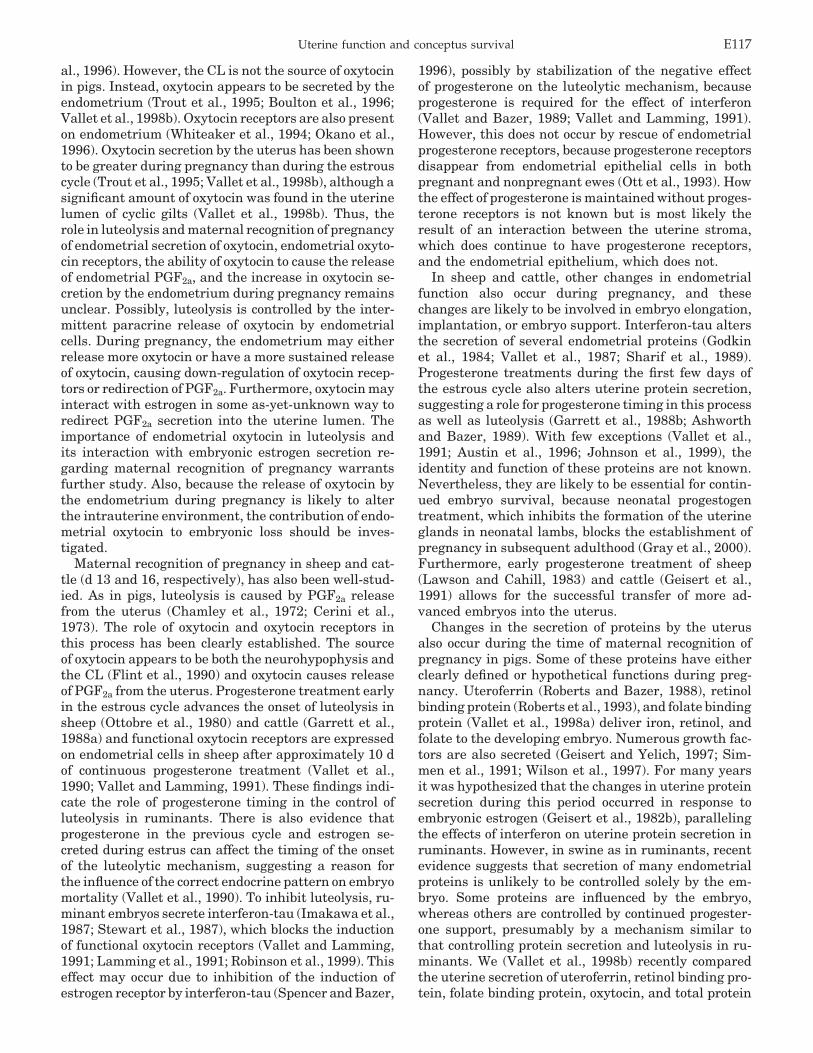
Uterine function and conceptus survival E117
al., 1996). However, the CL is not the source of oxytocinin pigs. Instead, oxytocin appears to be secreted by theendometrium (Trout et al., 1995; Boulton et al., 1996;Vallet et al., 1998b). Oxytocin receptors are also presenton endometrium (Whiteaker et al., 1994; Okano et al.,1996). Oxytocin secretion by the uterus has been shownto be greater during pregnancy than during the estrouscycle (Trout et al., 1995; Vallet et al., 1998b), although asignificant amount of oxytocin was found in the uterinelumen of cyclic gilts (Vallet et al., 1998b). Thus, therole in luteolysis and maternal recognition of pregnancyof endometrial secretion of oxytocin, endometrial oxyto-cin receptors, the ability of oxytocin to cause the releaseof endometrial PGF2a, and the increase in oxytocin se-cretion by the endometrium during pregnancy remainsunclear. Possibly, luteolysis is controlled by the inter-mittent paracrine release of oxytocin by endometrialcells. During pregnancy, the endometrium may eitherrelease more oxytocin or have a more sustained releaseof oxytocin, causing down-regulation of oxytocin recep-tors or redirection of PGF2a. Furthermore, oxytocin mayinteract with estrogen in some as-yet-unknown way toredirect PGF2a secretion into the uterine lumen. Theimportance of endometrial oxytocin in luteolysis andits interaction with embryonic estrogen secretion re-garding maternal recognition of pregnancy warrantsfurther study. Also, because the release of oxytocin bythe endometrium during pregnancy is likely to alterthe intrauterine environment, the contribution of endo-metrial oxytocin to embryonic loss should be inves-tigated.
Maternal recognition of pregnancy in sheep and cat-tle (d 13 and 16, respectively), has also been well-stud-ied. As in pigs, luteolysis is caused by PGF2a releasefrom the uterus (Chamley et al., 1972; Cerini et al.,1973). The role of oxytocin and oxytocin receptors inthis process has been clearly established. The sourceof oxytocin appears to be both the neurohypophysis andthe CL (Flint et al., 1990) and oxytocin causes releaseof PGF2a from the uterus. Progesterone treatment earlyin the estrous cycle advances the onset of luteolysis insheep (Ottobre et al., 1980) and cattle (Garrett et al.,1988a) and functional oxytocin receptors are expressedon endometrial cells in sheep after approximately 10 dof continuous progesterone treatment (Vallet et al.,1990; Vallet and Lamming, 1991). These findings indi-cate the role of progesterone timing in the control ofluteolysis in ruminants. There is also evidence thatprogesterone in the previous cycle and estrogen se-creted during estrus can affect the timing of the onsetof the luteolytic mechanism, suggesting a reason forthe influence of the correct endocrine pattern on embryomortality (Vallet et al., 1990). To inhibit luteolysis, ru-minant embryos secrete interferon-tau (Imakawa et al.,1987; Stewart et al., 1987), which blocks the inductionof functional oxytocin receptors (Vallet and Lamming,1991; Lamming et al., 1991; Robinson et al., 1999). Thiseffect may occur due to inhibition of the induction ofestrogen receptor by interferon-tau (Spencer and Bazer,
1996), possibly by stabilization of the negative effectof progesterone on the luteolytic mechanism, becauseprogesterone is required for the effect of interferon(Vallet and Bazer, 1989; Vallet and Lamming, 1991).However, this does not occur by rescue of endometrialprogesterone receptors, because progesterone receptorsdisappear from endometrial epithelial cells in bothpregnant and nonpregnant ewes (Ott et al., 1993). Howthe effect of progesterone is maintained without proges-terone receptors is not known but is most likely theresult of an interaction between the uterine stroma,which does continue to have progesterone receptors,and the endometrial epithelium, which does not.
In sheep and cattle, other changes in endometrialfunction also occur during pregnancy, and thesechanges are likely to be involved in embryo elongation,implantation, or embryo support. Interferon-tau altersthe secretion of several endometrial proteins (Godkinet al., 1984; Vallet et al., 1987; Sharif et al., 1989).Progesterone treatments during the first few days ofthe estrous cycle also alters uterine protein secretion,suggesting a role for progesterone timing in this processas well as luteolysis (Garrett et al., 1988b; Ashworthand Bazer, 1989). With few exceptions (Vallet et al.,1991; Austin et al., 1996; Johnson et al., 1999), theidentity and function of these proteins are not known.Nevertheless, they are likely to be essential for contin-ued embryo survival, because neonatal progestogentreatment, which inhibits the formation of the uterineglands in neonatal lambs, blocks the establishment ofpregnancy in subsequent adulthood (Gray et al., 2000).Furthermore, early progesterone treatment of sheep(Lawson and Cahill, 1983) and cattle (Geisert et al.,1991) allows for the successful transfer of more ad-vanced embryos into the uterus.
Changes in the secretion of proteins by the uterusalso occur during the time of maternal recognition ofpregnancy in pigs. Some of these proteins have eitherclearly defined or hypothetical functions during preg-nancy. Uteroferrin (Roberts and Bazer, 1988), retinolbinding protein (Roberts et al., 1993), and folate bindingprotein (Vallet et al., 1998a) deliver iron, retinol, andfolate to the developing embryo. Numerous growth fac-tors are also secreted (Geisert and Yelich, 1997; Sim-men et al., 1991; Wilson et al., 1997). For many yearsit was hypothesized that the changes in uterine proteinsecretion during this period occurred in response toembryonic estrogen (Geisert et al., 1982b), parallelingthe effects of interferon on uterine protein secretion inruminants. However, in swine as in ruminants, recentevidence suggests that secretion of many endometrialproteins is unlikely to be controlled solely by the em-bryo. Some proteins are influenced by the embryo,whereas others are controlled by continued progester-one support, presumably by a mechanism similar tothat controlling protein secretion and luteolysis in ru-minants. We (Vallet et al., 1998b) recently comparedthe uterine secretion of uteroferrin, retinol binding pro-tein, folate binding protein, oxytocin, and total protein

Vallet et al.E118
from d 10 to 15 of the estrous cycle and pregnancy inuntreated and progesterone-treated gilts (d 2 and 3 ofthe cycle or pregnancy). The early progesterone treat-ment accelerated the changes in secretion of total pro-tein, uteroferrin, retinol binding protein, and folatebinding protein but did not affect oxytocin secretion.Only uteroferrin and oxytocin were altered in the pres-ence of the embryo. Thus, total protein, uteroferrin,retinol binding protein, and folate binding protein rep-resent uterine products that are controlled substan-tially by continued progesterone support. The effect ofprogesterone timing could thus mediate the effect ofnutrition on progesterone secretion and embryo mortal-ity during early pregnancy. Only uteroferrin and oxyto-cin were influenced by the presence of the embryo. Itis, therefore, likely that many uterine-secreted pro-teins, and probably other uterine factors such as ionsand prostaglandins, also differ in whether they are con-trolled by progesterone timing, the presence of the em-bryo, or both. Because these changes dramatically alterthe intrauterine environment, possibly creating a hos-tile environment for slower-developing embryos, deter-mination of the control of these changes is essential inunderstanding mechanisms of embryo loss.
Another major milestone in embryo development dur-ing this period that can influence embryo survival iselongation. Sheep, cattle, and swine embryos all un-dergo a transition from a spherical embryo to filamen-tous embryo at around the time of maternal recognitionof pregnancy. This process is clearly uterine-dependent,because embryo elongation has never been accom-plished in vitro. Control of this process is close to acomplete mystery. The onset of elongation appears tocorrespond with the developmental stage of mesoder-mal outgrowth within the embryo (Stroband and VanDer Lende, 1990), but details regarding uterine factorsthat may initiate and(or) support elongation are lack-ing. One can speculate that elongation must involvesome interaction between the surface of the embryo andthe endometrial luminal epithelium, but the details ofthis interaction are not known. Nevertheless, evidencesuggests that variation in elongation may influence em-bryonic survival in swine. Embryo survival is knownto be greater in the Meishan pig (Galvin et al., 1993).It has been shown that embryo development occursslower in the Meishan (Anderson et al., 1993), and thatthis is a uterine-dependent phenomenon (Youngs et al.,1994). Reciprocal embryo transfer studies indicate thatdevelopment of both Occidental and Meishan embryosoccurs more slowly in the uterine environment of Meis-han gilts than in the uterine environment of Occidentalgilts (Ford and Youngs, 1993), although there was alsoan effect of genotype of the embryo as well. However,embryos in the uterine environment of Meishan giltselongate at the same time as those in the uterine envi-ronment of Occidental gilts (Rivera et al., 1996), despitetheir smaller size, confirming that elongation is notnecessarily controlled by the size of the embryo (Fordand Youngs, 1993). The uterine environment of the
Meishan also causes the embryos to secrete less estro-gen (Ford and Youngs, 1993; Kaminski et al., 1997;Vallet et al., 1998b). However, it remains unclearwhether differences in elongation and(or) estrogen se-cretion play a role in embryo survival.
Despite the fact that the smaller Meishan embryosand larger Occidental embryos elongate at the sametime in the Meishan uterine environment, within a lit-ter, more advanced pig embryos clearly elongate earlierthan their slower-developing littermates, because em-bryos in various stages of elongation are observed on d11 to 12 of pregnancy (Geisert et al., 1982a; Pope etal., 1990). The extent of embryo elongation of moreadvanced embryos can negatively affect slower-devel-oping littermates because embryos do not appear toelongate past each other even under crowded intrauter-ine conditions. Thus, elongation appears to cease whenthe ends of the elongating embryos approach each other.Because of this, one possible mechanism for embryonicloss may be that the early-elongating embryos take upand(or) modify the uterine surface, effectively pre-venting the elongation of less-advanced embryos. Thispotentially leaves the slower-developing embryo withinsufficient access to the uterine surface and it may belost for this reason. Thus, elongation to a smallerlength, as occurs in the Meishan, could improve sur-vival of the whole litter by decreasing competition forspace. How one embryo alters the uterine surface toprevent the continued elongation of its littermate is notknown, but results suggest that this is unlikely to bedue to embryonic estrogen secretion on the uterus. Es-trogen treatment given to pregnant gilts before the nor-mal time of maternal recognition of pregnancy disruptspregnancy (Morgan et al., 1987a,b) but does not inhibitembryo elongation, and instead the embryos degener-ate some time after elongation (Geisert et al., 1991).This degeneration of the embryos occurs coincidentlywith changes in the endometrial surface epithelium andin uterine protein secretion, suggesting that early estro-gen treatment may block implantation or interfere withthe nutritional support of the embryo (Gries et al., 1989;Blair et al., 1991). This result suggests that early estro-gen treatment influences uterine mechanisms otherthan elongation that can have a negative impact on theembryo. However, it is still unclear whether embryonicloss in the early estrogen-treated model results in phys-iological changes in the uterine environment. Neverthe-less, these data suggest that both embryo elongationand embryonic estrogen secretion represent potentiallyseparate mechanisms that influence embryonicsurvival.
Meishan pigs appear to increase embryonic survivalby reducing the growth rate and estrogen productionof the embryo and, as previously indicated, this is auterine-dependent phenomenon. Examination of uter-ine function during the period surrounding embryoelongation indicates that the secretion of many uterineproteins is reduced in Meishans, including IGF-I (Wil-son et al., 1997), total protein, uteroferrin, and retinol

Uterine function and conceptus survival E119
binding protein (Ford and Youngs, 1993; Vallet et al.,1998). In contrast, other proteins, such as secreted fo-late binding protein, are similar between the Meishanand white crossbred pigs (Vallet et al., 1999a). Lowerproduction of some uterine proteins by the Meishan giltis likely responsible for the slower growth and lowerestrogen production by the embryo, but because thesecretion of many proteins is decreased in the Meishanduring this period, identification of those factors respon-sible will be difficult. It has also been reported thattreating Meishan pigs with exogenous estrogen duringthis period increases placental weights during laterpregnancy (Wilson and Ford, 2001), suggesting thatlower embryonic estrogen secretion in the Meishan pigmay reinforce the decrease in uterine protein secretionfor some proteins. However, it is not yet clear whichproteins are influenced by embryonic estrogen, nor isit clear which proteins influence embryonic growthand development.
Uterine Capacity
Changes in embryonic development in response tothe uterine environment during early pregnancy haveanother consequence in addition to modifying the riskof embryonic loss during the time of maternal recogni-tion of pregnancy. This is because the extent of elonga-tion of the embryo during the time of maternal recogni-tion of pregnancy influences the subsequent size of theplacenta, and, in turn, the subsequent growth of the fe-tus. The sizes of the placenta and fetus affect both thespace taken up by the developing conceptus within theuterus and the amount of nutrients required to main-tain the fetus and placenta during the rest of gestation.In support of this concept, Meishan pigs have smallerplacentas and fetuses during later gestation (Chris-tenson, 1993; Biensen et al., 1998), and it is likely thatthis effect contributes to increased uterine capacity inthis breed. In addition, selection of pigs resulting in areduction in the size of the placenta increased littersize (Wilson et al., 1999). Furthermore, in a recent ex-periment that examined factors contributing to uterinecapacity in a group of half-Meishan, half-White cross-bred gilts, fetal weights, even after adjusting for placen-tal weight, which should remove much of the influenceof litter size on fetal weights, remained negatively cor-related with uterine capacity (Figure 1). Although thiscorrelation cannot be used to assign cause and effect,it confirms that large fetuses are associated with loweruterine capacity (Vallet et al., 2002). This negative asso-ciation has been further demonstrated using early pro-gesterone treatment of unilaterally hysterectomized-ovariectomized (UHO) gilts. As previously indicated,early progesterone treatment has been shown to accel-erate both the onset of uterine protein secretion andembryonic estrogen secretion in pigs (Vallet et al.,1998b). Early progesterone treatment decreased littersize in UHO gilts (an experimental model used to esti-mate uterine capacity) and increased fetal weight but
Figure 1. A scatterplot of the relationship between uter-ine capacity and residual fetal weight is illustrated. Resid-ual fetal weight was obtained by adjusting fetal weightfor placental weight and the square of placental weightusing regression.
did not change placental weight (Table 1). One possibleexplanation for these results is that fetal growth isaccelerated by early progesterone treatment, which hasalso been observed in ruminants (Kleemann et al., 1994;2001). This faster growth rate may put greater demandon delivery of nutrients by the placenta, and may putconceptuses at greater risk for loss. Although it is possi-ble that early progesterone treatment may also havereduced litter size by interfering with either fertiliza-tion or early embryonic mortality, half the difference inlitter size between the control and progesterone-treatedgilts was accounted for by the difference in the number
Table 1. Least squares means for uterine capacity,number of mummies, placental and fetal weights, andplacental efficiency (fetal weight/placental weight) for
unilaterally hysterectomized gilts treated with either notreatment (control), estradiol treatment (5 mg estradiol
valerate given on d 11 and 12 of gestation), orprogesterone treatment (200 mg/d on d 2 and 3 of
gestation) and then slaughtered on d 105 of gestation
Trait Control Estradiol Progesterone
Uterine capacitya 6.9 ± 0.5 6.2 ± 0.6 5.6 ± 0.4Number of mummies 0.8 ± 0.3 0.7 ± 0.4 1.4 ± 0.3Placental weight 203 ± 10.6 197.6 ± 12.6 201.3 ± 9.8Fetal weightb 848 ± 21 840 ± 25 926 ± 19Placental efficiencyc 4.28 ± 0.11 4.28 ± 0.14 4.64 ± 0.11
aControl vs progesterone treatment (P = 0.05).bControl vs progesterone treatment (P = 0.01) after correction for
placental weight.cControl vs progesterone treatment (P < 0.05).

Vallet et al.E120
of mummified fetuses between the two groups (Table1). These results suggest that at least a portion of thelosses associated with early progesterone treatment oc-curred during later pregnancy, not during the time offertilization or embryonic development. Taken to-gether, these results indicate that placental and fetalgrowth rates influence uterine capacity, and thatchanges in uterine function in response to early proges-terone treatment is one component influencing thesegrowth rates.
Evidence from progesterone-treated gilts and fromMeishan gilts suggests that uterine function can affectfetal weight, but how much of the normal variation infetal/piglet birth weight can be attributed to variationin uterine function? A partial answer to this questioncan be obtained by dividing the variation in fetal/pigletweights into those portions corresponding to fetal directgenetic effects, maternal genetic effects, and maternalenvironmental effects. The proportion of the variancein d-105 fetal weights due to direct genetic effects ofthe fetus (i.e., heritability) was 0.05 ± 0.07 (Vallet etal., 2001). The proportion of the variance in neonatalbirth weight due to piglet direct genetic effects wasestimated at 0.02 and 0.06 in two different populationsof pigs (Cassady et al., 2002). In this latter analysis,the proportion of the variance in birth weights due tomaternal genetic effects was 0.09 and 0.29 for the samepopulations. The proportion of the variance due to ma-ternal random environmental effects, nongenetic in na-ture, was 0.22 and 0.17 for the same populations. Thus,direct genetic effects of the fetus account for a smallproportion of the variation in piglet weight, and thusby inference the variation in fetal growth and develop-ment. Combining the maternal genetic and maternalenvironmental variance components of piglet birthweight indicates that from 30 to 46% of the variationin birth weight is due to the sow, 7- to 14-fold morethan that attributable to the genotype of the piglet.Unfortunately, it is not possible to conclude from thisanalysis what components of the maternal environmentare responsible for the variation in piglet weight, butit seems likely from the previous discussion that a por-tion is due to uterine function.
The fact that early progesterone treatment of sheep,cattle, and swine accelerates both uterine function andembryo development indicates the central role of pro-gesterone in timing changes in uterine function duringearly pregnancy, and the influence of those changeson embryo development. Evidence that the presence ofprogesterone continues to effect the timing of changesin uterine function during later pregnancy also existsin both pigs and sheep. Progesterone treatment of ovari-ectomized pigs for 60 d induces uteroferrin secretion tolevels qualitatively similar to those in pregnant pigs(Roberts et al., 1987). In sheep, similar long-term treat-ment of ovariectomized sheep with progesterone in-duces the secretion of the uterine milk proteins (Ing etal., 1989), again to levels qualitatively similar to thoseoccurring during midpregnancy. How progesterone
Figure 2. Scatterplots of the relationship between hema-tocrit and fetal plasma iron (a) and fetal plasma folate(b) in unilaterally hysterectomized-ovariectomized giltsare illustrated.
times both early (i.e., those at the time of maternalrecognition of pregnancy) and late (i.e., those occurringafter implantation and placentation) events is not fullyunderstood. Paradoxically, as previously indicated insheep, in both sheep (Ott et al., 1993) and swine (Geisertet al., 1994) endometrial epithelial progesterone recep-tors disappear during early pregnancy, coincident withthe major changes in uterine function associated withthe onset of luteolysis and uterine protein secretion.Furthermore, endometrial epithelial cells lack proges-terone receptors apparently for the remainder of preg-nancy. In spite of this, progesterone treatment some-how induces later increases in uteroferrin and the uter-ine milk proteins in pigs and sheep, respectively.Progesterone may continue to control these events viaparacrine effects of stromal cells, which do maintainprogesterone receptors.
Aside from effects on overall fetal and placentalgrowth rates, there are other aspects of uterine functionthat may influence the health and survival of the fetus.By providing nutrients to the conceptus, the uterusinfluences the development of specific organ systemsthat are necessary for fetal survival. One fetal systemnecessary for survival and requiring input from theuterus is the development of the fetal blood supply.

Uterine function and conceptus survival E121
Table 2. Least squares means for traits measured on d35 of pregnancy in White crossbred (WC)
and Meishan (ME) gilts
Traits WC ME
CL 14.4 ± 0.6 15.1 ± 0.6Litter size 11.4 ± 0.6 12.7 ± 0.7Placental weight, g 32.7 ± 1.8 21.5 ± 2.0**Fetal weight, g 3.7 ± 0.1 3.1 ± 0.2**Hematocrit, % 20.3 ± 0.8 21.2 ± 0.9Hemoglobin, g/dL 5.2 ± 0.2 4.2 ± 0.2**Red blood cells, × 106/mL 1.08 ± 0.08 1.71 ± 0.09**Nucleated blood cells, % 29.5 ± 2.2 17.2 ± 2.4**Reticulocytes, % 45.1 ± 1.7 32.9 ± 1.8**
**Mean was different from WC-INT group (P < 0.01).
Both iron and folate are required for erythropoiesis(Bowering et al., 1980; Rodriguez, 1980). As previouslyindicated, these compounds are provided to the devel-oping conceptus in the form of uteroferrin and secretedfolate binding protein, respectively. Thus, the amountof uteroferrin and folate binding protein available tothe conceptus is likely to have an influence on the effi-ciency of this process. In support of this, intrauterinecrowding increased the incidence of underweight fe-tuses, and fetal hematocrits, fetal plasma iron, and fetalplasma folate concentrations are all lower in these fe-tuses (Figure 2). Also, selection for uterine capacity for11 generations raised uterine capacity by about one pigper uterine horn and resulted in higher hematocrits infetuses at 105 d of gestation (Vallet et al., 2001), againsuggesting that the two may be associated. Finally, ithas also been shown that fetal erythropoiesis duringearly pregnancy is accelerated in Meishan pigs, possiblycontributing to the greater uterine capacity in thisbreed (Pearson et al., 1998; Table 2). Taken together,
Table 3. The number, percentage stillborn, and relative risk (relative to overall risk) of stillbirths in weight classesof neonatal pigs born to gilts from lines selected either at random (CO)
or for ovulation rate (OR) or uterine capacity (UC)
Treatment/trait ≤0.45 kg 0.49 to 0.9 kg 0.95 to 1.36 kg 1.41 to 1.81 kg 1.86 kg Total
CONumber of piglets 2 139 780 706 49 1676Percentage stillborn 50 10 8 4 4 6Relative risk stillborn 7.25 1.45 1.16 0.58 0.58 0.87
ORNumber of piglets 7 197 796 497 24 1521Percentage stillborn 57 15 7 3 0 6Relative risk stillborn 8.26 2.17 1.01 0.43 0 0.89
UCNumber of piglets 4 121 684 539 40 1388Percentage stillborn 50 19* 10 4 3 8*Relative risk stillborn 7.25 2.75 1.45 0.58 0.43 1.18
OverallNumber of piglets 13 457 2260 1742 113 4585Percentage stillborn 54 15 8 3 3 7Relative risk 7.83 2.17 1.16 0.43 0.43 1
*Chi-square analysis indicated that UC differs from control (P < 0.05).
these results are consistent with the hypothesis that theimpairment of fetal blood development under crowdedintrauterine conditions may contribute to fetal lossesdue to uterine capacity. It also suggests that improvedsecretion of uteroferrin and folate binding protein bythe pig uterus may be one way to improve fetal erythro-poiesis, in turn influencing the health and survival offetuses in crowded intrauterine conditions.
Uteroferrin secretion by the uterus increases 20-foldfrom d 20 to 40 of pregnancy, coincident with the matu-ration of the fetal blood supply (Vallet et al., 1996;Pearson et al., 1998). As previously indicated, uterofer-rin secretion is largely controlled by continued proges-terone support. However, a comparison between preg-nant and pseudopregnant pigs indicated that uterofer-rin secretion in pregnant pigs is approximately doublethe rate in pseudopregnant pigs, indicating that theconceptus also modulates uteroferrin secretion duringlater pregnancy (Vallet and Christenson, 1996). Thismay or may not be due to placental estrogens, becauseestrogen stimulated uteroferrin secretion in pseudo-pregnant pigs, but not in pregnant pigs (Vallet andChristenson, 1996). A recent report suggested that anunidentified low molecular weight factor from the con-ceptus may be responsible for the effect of the conceptuson protein secretion (Reed et al., 1998). Thus, methodsthat can alter uteroferrin secretion during midpreg-nancy are not currently available. Clues to possiblemethods to modify uteroferrin secretion await furtherstudies defining how the dramatic changes in uterofer-rin during pregnancy are controlled by progesteroneand the conceptus.
Even less is known about the control of folate bindingprotein during midpregnancy. Uterine secretion of fo-late binding protein has only been characterized up tod 15 of the estrous cycle and pregnancy. Unfortunately,

Vallet et al.E122
uterine secretion of folate binding protein during earlypregnancy does not correlate with folate binding proteinmRNA (Vallet et al., 1998a, 1999a,b), making analysisof endometrial secretion of folate binding protein afterimplantation much more difficult. An overall under-standing of folate transport in the pig is further con-founded by the presence of a placental folate bindingprotein, which also has not been well characterizedthroughout pregnancy (Vallet et al., 1999b). How se-creted folate binding protein and placental folate bind-ing protein interact with each other to accomplish folatetransport to the developing conceptus, as well as theidentification of factors and mechanisms governing theproduction of each protein, requires further study.
Stillbirths
As previously indicated, fetal weights are negativelyassociated with uterine capacity but positively corre-lated with perinatal survival (Christianson, 1992). Ourrecent results confirm that lower piglet weight is associ-ated with greater risk of stillbirths (Table 3). Interest-ingly, selection for uterine capacity for 11 generationsmay have increased the incidence of stillbirths in theline selected for uterine capacity. However, selectionhad no effect on either placental or fetal weights (Chris-tenson and Leymaster, 2000). Thus, mechanisms of con-ceptus losses due to limitations in uterine capacity andlosses due to stillbirth may oppose each other, and finallitter size may be a balance between these factors. Incontrast to pigs, in ruminants, difficulty during deliveryhas been shown to increase the risk of stillbirths, anddifficulty in delivery in turn has been shown to be corre-lated with heavier offspring (Nix et al., 1998; Meyer etal., 2000). Thus, in all domestic species, an understand-ing of those aspects of uterine function that result indifferences in offspring weight at birth could potentiallyalter the incidence of stillbirths and reduce perinatallosses.
Implications
Recent evidence suggests that embryonic mortality,uterine capacity, and stillbirths are influenced by con-ceptus size, and that this in turn is modulated by uter-ine function. Results suggest that both uterine functionand conceptus development throughout pregnancy indomestic livestock can be manipulated by alterationsin progesterone during the first few days after ovula-tion. The consequences of these changes in conceptusdevelopment require further study but potentially offerways to influence embryonic, fetal, and neonatal sur-vival of domestic livestock. The potential also exists forfurther alterations in conceptus survival by focusingspecifically on uterine function that influences develop-ment of the fetal blood supply. Taken together, theseresults suggest that manipulation of uterine functionis one avenue that could be used to decrease conceptuslosses during pregnancy in all livestock species.
Literature Cited
Almeida, F. R. C. L., R. N. Kirkwood, F. X. Aherne, and G. R. Foxcroft.2000. Consequences of different patterns of feed intake duringthe estrous cycle in gilts on subsequent fertility. J. Anim. Sci.78:1556–1563.
Anderson, L. H., L. K. Christenson, R. K. Christenson, and S. P. Ford.1993. Investigations into the control of litter size in swine: II.Comparisons of morphological and functional embryonic diver-sity between Chinese and American breeds. J. Anim. Sci.71:1566–1571.
Ashworth, C. J. 1991. Effect of premating nutritional status and post-mating progesterone supplementation on embryo survival andconceptus growth in gilts. Anim. Reprod. Sci. 26:311–321.
Ashworth, C. J., and F. W. Bazer. 1989. Changes in ovine conceptusand endometrial function following asynchronous embryo trans-fer or administration of progesterone. Biol. Reprod. 40:425–433.
Ashworth, C. J., D. I. Sales, and I. Wilmut. 1989. Evidence of anassociation between the survival of embryos and the periovula-tory plasma progesterone concentration in the ewe. J. Reprod.Fertil. 87:23–32.
Austin, K. J., S. K. Ward, M. G. Teixeira, V. C. Dean, D. W. Moore,and T. R. Hansen. 1996. Ubiquitin cross-reactive protein is re-leased by the bovine uterus in response to interferon duringearly pregnancy. Biol. Reprod. 54:600–606.
Bazer, F. W., S. R. Marengo, R. D. Geisert, and W. W. Thatcher.1984. Exocrine versus endocrine secretion of prostaglandin F2ain the control of pregnancy in swine. Anim. Reprod. Sci.7:115–132.
Bazer, F. W., and W. W. Thatcher. 1977. Theory of maternal recogni-tion of pregnancy in swine based on estrogen controlled endo-crine versus exocrine secretion of prostaglandin F2? by the uter-ine endometrium. Prostaglandins 14:397–401.
Bazer, F. W., O. W. Robison, A. J. Clawson, and L. C. Ulberg. 1969.Uterine capacity at two stages of gestation in gilts followingembryo superinduction. J. Anim. Sci. 29:30–34.
Biensen, N. J., M. E. Wilson, and S. P. Ford. 1998. The impact ofeither a Meishan or Yorkshire uterus on Meishan or Yorkshirefetal and placental development to days 70, 90, and 110 of gesta-tion. J. Anim. Sci. 76:2169–2176.
Blair, R. M.; R. D. Geisert, M. T. Zavy, T. Yellin, R. W. Fulton, andE. C. Short. 1991. Endometrial surface and secretory alterationsassociated with embryonic mortality in gilts administered estra-diol valerate on days 9 and 10 of gestation. Biol. Reprod.44:1063–1079.
Boulton, M. I., T. J. McGrath, J. A. Goode, K. D. Broad, and C. L.Gilbert. 1996. Changes in content of mRNA encoding oxytocinin the pig uterus during the oestrous cycle, pregnancy, at parturi-tion and in lactational anoestrus. J. Reprod. Fertil. 108:219–227.
Bowering, J., A. M. Sanchez, and M. I. Irwin. 1980. Iron requirementsof man. In: M. I. Irwin (ed.) Nutritional Requirements of Man.pp 307–396. The Nutrition Foundation, Inc., Washington, DC.
Carnahan, K. G., B. C. Prince, and M. A. Mirando. 1996. Exogenousoxytocin stimulates uterine secretion of prostaglandin F2a incyclic and early pregnant swine. Biol. Reprod. 55:838–843.
Cassady, J.-P., L. D. Young, and K. A. Leymaster. 2002. Heterosisand recombination effects on pig growth and carcass traits. J.Anim. Sci. (In press).
Cerini, J. C., M. D. Cain, W. A. Chamley, I. A. Cumming, J. K. Findlay,and J. R. Goding. 1973. Luteolysis in the ewe: A study using aradioimmunoassay for prostaglandin F. J. Reprod. Fertil.32:326–327.
Chamley, W. A., J. M. Brown, M. D. Cain, J. C. Cerini, M. E. Cerini,I. A. Cumming, J. R. Goding, and C. Kragt. 1972. Luteolysisfollowing intra-arterial infusion of prostaglandin F2 directly intothe ovine autotransplanted ovary. J. Reprod. Fertil. 28:153–155.
Christenson, R. K. 1993. Ovulation rate and embryonic survival inChinese Meishan and white crossbred pigs. J. Anim. Sci.71:3060–3066.
Christenson, R. K., and K. A. Leymaster. 2000. Effects of selectionfor ovulation rate or uterine capacity on gravid uterine, far-

Uterine function and conceptus survival E123
rowing, and weaning traits in swine. J. Anim. Sci. 78(Suppl.1):202 (Abstr.).
Christenson, R. K., K. A. Leymaster, and L. D. Young. 1987. Justifica-tion of unilateral hysterectomy-ovariectomy as a model to evalu-ate uterine capacity in swine. J. Anim. Sci. 65:738–744.
Christianson, W. T. 1992. Stillbirths, mummies, abortions and earlyembryonic death. Vet. Clin. N. Amer. Food Anim. Pract.8:623–639.
Day, B. N., D. E. Longenecker, S. C. Jaffe, E. W. Gibson, and J. F.Lasley. 1967. Fertility of swine following superovulation. J.Anim. Sci. 26:777–780.
Echternkamp, S. E. 1992. Fetal development in cattle with multipleovulations. J. Anim. Sci. 70:2309–2321.
Flint, A. P., E. L. Sheldrick, T. J. McCann, and D. S. Jones. 1990.Luteal oxytocin: Characteristics and control of synchronous epi-sodes of oxytocin and PGF2 alpha secretion at luteolysis in rumi-nants. Domest. Anim. Endocrinol. 7:111–124.
Ford, S. P., and C. R. Youngs. 1993. Early embryonic developmentin prolific Meishan pigs. J. Reprod. Fertil. (Suppl.) 48:271–278.
Foxcroft, G. R. 1997. Mechanisms mediating nutritional effects onembryonic survival in pigs. J. Reprod. Fertil. (Suppl.) 52:47–61.
Frank, M., F. W. Bazer, W. W. Thatcher, and C. J. Wilcon. 1977. Astudy of prostaglandin F2alpha as the luteolysin in swine: III.Effects of estradiol valerate on prostaglandin F, progestins, es-trone and estradiol concentrations in the utero-ovarian vein ofnonpregnant gilts. Prostaglandins 14:1183–1196.
Frank, M., F. W. Bazer, W. W. Thatcher, and C. J. Wilcox. 1978. Astudy of prostaglandin F2alpha as the lutbolysin in swine: IV.An explanation for the luteotrophic effect of estradiol. Prosta-glandins 15:151–160.
Galvin, J. M., I. Wilmut, B. N. Day, M. Ritchie, M. Thomson, and C.S. Haley. 1993. Reproductive performance in relation to uterineand embryonic traits during early gestation in Meishan, LargeWhite and crossbred sows. J. Reprod. Fertil. 98:377–384.
Garrett, J. E., R. D. Geisert, M. T. Zavy, L. K. Gries, R. P. Wetteman,and D. S. Buchanan. 1988a. Effect of exogenous progesteroneon prostaglandin F-2a release and the interestrous interval inthe bovine. Prostaglandins 36:85–96.
Garrett, J. E., R. D. Geisert, M. T. Zavy, and G. L. Morgan. 1988b.Evidence for maternal regulation of early conceptus growth anddevelopment in beef cattle. J. Reprod. Fertil. 84:437–446.
Geisert, R. D., J. W. Brookbank, R. M. Roberts, and F. W. Bazer.1982a. Establishment of pregnancy in the pig: II. Cellular remod-eling of the porcine blastocyst during elongation on day 12 ofpregnancy. Biol. Reprod. 27:941–955.
Geisert, R. D., T. C. Fox, G. L. Morgan, M. E. Wells, R. P. Wetteman,M. T. Zavy. 1991. Survival of bovine embryos transferred toprogesterone-treated asynchronous recipients. J. Reprod. Fertil.92:475–482.
Geisert, R. D., G. L. Morgan, M. T. Zavy, R. M. Blair, L. K. Gries,A. Cox, and T. Yellin. 1991. Effect of asynchronous transfer andoestrogen administration on survival and development of porcineembryos. J. Reprod. Fertil. 93:475–481.
Geisert, R. D., T. N. Pratt, F. W. Bazer, J. S. Mayes, and G. H.Watson. 1994. Immunocytochemical localization and changesin endometrial progestin receptor protein during the porcineoestrous cycle and early pregnancy. Reprod. Fertil. Dev.6:749–760.
Geisert, R. D., R. H. Renegar, W. W. Thatcher, R. M. Roberts, andF. W. Bazer. 1982b. Establishment of pregnancy in the pig: I.Interrelationships between preimplantation development of thepig blastocyst and uterine endometrial secretions. Biol. Reprod.27:925–939.
Geisert, R. D., and J. V. Yelich. 1997. Regulation of conceptus develop-ment and attachment in pigs. J. Reprod. Fertil. (Suppl.)52:133–149.
Godkin, J. D., F. W. Bazer, and R. M. Roberts. 1984. Ovine trophoblastprotein 1, an early secreted blastocyst protein, binds specificallyto uterine endometrium and affects protein synthesis. Endocri-nology 114:120–130.
Gray, C. A., F. F. Bartol, K. M. Taylor, A. A. Wiley, W. S. Ramsey,T. L. Ott, F. W. Bazer, and T. E. Spencer. 2000. Ovine uterinegland knock-out model: effects of gland ablation on the estrouscycle. Biol. Reprod. 62:448–456.
Gries, L. K., R. D. Geisert, M. T. Zavy, J. E. Garrett, and G. L. Morgan.1989. Uterine secretory alterations coincident with embryonicmortality in the gilt after exogenous estrogen administration.J. Anim. Sci. 67:276–284.
Hanly, S. 1961. Prenatal mortality in farm animals. J. Reprod. Fertil.2:182–194.
Imakawa, K., R. V. Anthony, M. Kazemi, K. R. Marotti, H. G. Polites,and R. M. Roberts. 1987. Interferon-like sequence of ovine tro-phoblast protein secreted by embryonic trophectoderm. Nature(Lond.) 330:377–379.
Ing, N. H., H. Francis, J. J. McDonnell, J. F. Amann, and R. M.Roberts. 1989. Progesterone induction of the uterine milk pro-teins: Major secretory proteins of sheep endometrium. Biol. Re-prod. 41:643–654.
Jindal, R., J. R. Cosgrove, F. X. Aherne, and G. R. Foxcroft. 1996.Effect of nutrition on embryonal mortality in gilts: Associationwith progesterone. J. Anim. Sci. 74:620–624.
Jindal, R., J. R. Cosgrove, and G. R. Foxcroft. 1997. Progesteronemediates nutritionally induced effects on embryonic survival ingilts. J. Anim. Sci. 75:1063–1070.
Johnson, G. A., T. E. Spencer, T. R. Hansen, K. J. Austin, R. C.Burghardt, and F. W. Bazer. 1999. Expression of the interferontau inducible ubiquitin cross-reactive protein in the ovine uterus.Biol. Reprod. 61:312–318.
Kaminski, M., S. P. Ford, and A. J. Conley. 1997. Differences in theexpression of cytochromes P450 17α-hydroxylase and aromatasein Meishan and Yorkshire conceptuses at days 10.5–14.0 of ges-tation. J. Reprod. Fertil. 103:213–219.
Kleeman, D. O., S. K. Walker, K. M. Hartwich, L. Fong, R. F. Seamark,J. S. Robinson, and J. A. Owens. 2001. Fetoplacental growth insheep administered progesterone during the first three days ofpregnancy. Placenta 22:14–23.
Kleeman, D.O., S. K. Walker, and R. F. Seamark. 1994. Enhancedfetal growth in sheep administered progesterone during the firstthree days of pregnancy. J. Reprod. Fertil. 102:411–417.
Lamming, G. E., A. P. F. Flint, and J. L. Vallet. 1991. Trophoblastinterferons act locally to suppress the uterine oxytocin receptorin sheep. J. Reprod. Fertil. Abstr. Ser. 8:24 (Abstr.).
Lawson, R. A. S., and L. P. Cahill. 1983. Modification of the embryomaternal relationship in ewes by progesterone treatment earlyin the estrous cycle. J. Reprod. Fertil. 67:473–475.
Mao, J., and G. R. Foxcroft. 1998. Progesterone therapy during earlypregnancy and embryonal survival in primiparous weaned sows.J. Anim. Sci. 76:1922–1928.
Marengo, S. R., F. W. Bazer, W. W. Thatcher, C. J. Wilcox, and R.P. Wetteman. 1986. Prostaglandin F2 alpha as the luteolysinin swine: VI. Hormonal regulation of the movement of exogenousPGF2 alpha from the uterine lumen into the vasculature. Biol.Reprod. 34:284–292.
Meyer, C. L., P. J. Berger, and K. J. Koehler. 2000. Interactionsamong factors affecting stillbirths in Holstein cattle in theUnited States. J. Dairy Sci. 83:2657–2663.
Miller, B. G., and N. W. Moore. 1976. Effects of progesterone andoestradiol on endometrial metabolism and embryo survival inthe ovariectomized ewe. Theriogenology 6:636.
Miller, B. G., N. W. Moore, L. Murphy, and G. M. Stone. 1977. Earlypregnancy in the ewe: effects of oestradiol and progesterone onuterine metabolism and on embryo survival. Aust. J. Biol. Sci.30:279–288.
Moeljono, M. P. E., F. W. Bazer, and W. W. Thatcher. 1976. A studyof prostaglandin F2 alpha as the luteolysin in swine: I. Effect ofprostaglandin F2 alpha in hysterectomized gilts. Prostaglandins11:737–741.
Moeljono, M. P. E., W. W. Thatcher, F. W. Bazer, M. Frank, L. J.Owens, and C. J. Wilcox. 1977. A study of prostaglandin F asthe luteolysin in swine: II Characterization and comparison ofprostaglandin F, estrogens and progestin concentrations in

Vallet et al.E124
utero-ovarian vein plasma of nonpregnant and pregnant gilts.Prostaglandins 14:543–555.
Morgan, G. L., R. D. Geisert, M. T. Zavy, and A. T. Fazleabas. 1987a.Development and survival of pig blastocysts after oestrogen ad-ministration on day 9 or days 9 and 10 of pregnancy. J. Reprod.Fertil. 80:133–141.
Morgan, G. L., R. D. Geisert, M. T. Zavy, R. V. Shawley, and A. T.Fazleabas. 1987b. Development of pig blastocysts in a uterineenvironment advanced by exogenous oestrogen. J. Reprod. Fer-til. 80:125–131.
Newcomb, R., and L. E. A. Rowson. 1975. Conception rate after uter-ine transfer of cow eggs, in relation to synchronization of oestrusand age of eggs. J. Reprod. Fertil. 43:539–541.
Nix, J. M., J. C. Spitzer, L. W. Grimes, G. L. Burns, and B. B. Plyler.1998. A retrospective analysis of factors contributing to calfmortality and dystocia in beef cattle. Theriogenology 49:1515–1523.
Okano, A., K. Okuda, M. Takahashi, and D. Schams. 1996. Oxytocinreceptors in the porcine endometrium during the estrous cycleand early pregnancy. Anim. Reprod. Sci. 41:61–70.
Ott, T. L., Y. Zhou, M. A. Mirando, C. Stevens, J. P. Harney, T.F. Ogle, and F. W. Bazer. 1993. Changes in progesterone andoestrogen receptor mRNA and protein during maternal recogni-tion of pregnancy and luteolysis in ewes. J. Mol. Endocrinol.10:171–183.
Ottobre, J. S., G. S. Lewis, W. V. Thayne, and E. K. Inskeep. 1980.Mechanism by which progesterone shortens the estrous cycle ofthe ewe. Biol. Reprod. 23:1046–1053.
Pearson, P. L., H. G. Klemcke, R. K. Christenson, and J. L. Vallet.1998. Uterine environment and breed effects on erythropoiesisand liver protein secretion in late embryonic and early fetalswine. Biol. Reprod. 58:911–918.
Perry, J. S., and I. W. Rowlands. 1962. Early pregnancy in the pig.J. Reprod. Fertil. 4:175–188.
Polge, C. 1982. Embryo transplantation and preservation. In: D. J.A. Cole and G. R. Foxcroft (ed.) Control of Pig Reproduction. pp277–291. Butterworth Scientific, London.
Pope, W. F., S. Xie, D. M. Broerman, and K. P. Nephew. 1990. Causesand consequences of early embryonic diversity in pigs. J. Reprod.Fertil. 40:251–260.
Reed, K. L., L. L. Blaeser, V. Dantzer, M. L. Green and R. C. Simmen.1998. Control of secretory leukocyte protease inhibitor gene ex-pression in the porcine periimplantation endometrium: a caseof maternal-embryo communication. Biol. Reprod. 58:448–457.
Rivera, R. M., C. R. Youngs, and S. P. Ford. 1996. A comparisonof the number of inner cell mass and trophectoderm cells ofpreimplantation Meishan and Yorkshire pig embryos at similardevelopmental stages. J. Reprod. Fertil. 106:111–116.
Roberts, R. M., and F. W. Bazer. 1988. The functions of uterinesecretions. J. Reprod. Fertil. 82:875–892.
Roberts, R. M., M. K. Murray, M. G. Burke, C. M. Ketcham, andF. W. Bazer. 1987. Hormonal control and function of secretoryproteins. In: Cell and Molecular Biology of the Uterus. pp 137–150. Plenum Publishing, New York.
Roberts, R. M., S. Xie, and W. E. Trout. 1993. Embryo-uterine interac-tions in pigs during week 2 of pregnancy. J. Reprod. Fertil.(Suppl.) 48:171–186.
Robinson, R. S., G. E. Mann, G. E. Lamming, and D. C. Wathes. 1999.The effect of pregnancy on the expression of uterine oxytocin,oestrogen and progesterone receptors during early pregnancy inthe cow. J. Endocrinol. 160:21–33.
Rodriguez, M. S. 1980. Folacin requirements of man. In: M. I. Irwin(ed). Nutritional Requirements of Man. pp 397–492. The Nutri-tion Foundation, Inc., Washington, DC.
Rowson, L. E. A., and R. M. Moor. 1966. Embryo transfer in thesheep: The significance of synchronizing oestrus in the donorand recipient animal. J. Reprod. Fertil. 11:207–212.
Sharif, S. F., H. Francis, D. H. Keisler, and R. M. Roberts. 1989.Correlation between the release of ovine trophoblast protein-1 by the conceptus and the production of polypeptides by thematernal endometrium of ewes. J. Reprod. Fertil. 85:471–476.
Simmen, F. A., and R. C. M. Simmen. 1991. Peptide growth factorsand proto-oncogenes in mammalian conceptus development.Biol. Reprod. 44:1–5.
Spencer, T. E., and F. W. Bazer. 1996. Ovine interferon tau suppressestranscription of the estrogen receptor and oxytocin receptorgenes in the ovine endometrium. Endocrinology 137:1144–1147.
Stewart, H. J., S. H. McCann, P. J. Barker, K. E. Lee, G. E. Lamming,and A. P. Flint. 1987. Interferon sequence homology and receptorbinding activity of ovine trophoblast antiluteolytic protein. J.Endocrinol. 115:R13–R15.
Stroband, H. W. J., and T. Van der Lende, T. 1990. Embryonic anduterine development during early pregnancy in pigs. J. Reprod.Fertil. 40:261–277.
Trout, W. E., G. W. Smith, P. C. Gentry, J. M. Galvin, and D. H.Keisler. 1995. Oxytocin secretion by the endometrium of thepig during maternal recognition of pregnancy. Biol. Reprod. 52(Suppl. 1):189 (Abstr.).
Vallet, J. L. 2000. Fetal erythropoiesis and other factors which influ-ence uterine capacity in swine. J. Appl. Anim. Res. 17:1–26.
Vallet, J. L., P. J. Barker, G. E. Lamming, N. Skinner, N. S. Huskis-son. 1991. A low molecular weight endometrial secretory proteinwhich is increased by ovine trophoblast protein-1 is a β2-micro-globulin-like protein. J. Endocrinol. 130:R1–R4.
Vallet, J. L., and F. W. Bazer. 1989. Effect of ovine trophoblast protein-1, oestrogen and progesterone on oxytocin-induced phosphatidyl-inositol turnover in endometrium of sheep. J. Reprod. Fertil.87:755–761.
Vallet, J. L., F. W. Bazer, and R. M. Roberts. 1987. The effect of ovinetrophoblast protein-one on endometrial protein secretion andcyclic nucleotides. Biol. Reprod. 37:1307–1316.
Vallet, J. L., and R. K. Christenson. 1996. The effect of estrone andestradiol treatment on endometrial total protein, uteroferrin,and retinol-binding protein secretion during midpregnancy ormidpseudopregnancy in swine. J. Anim. Sci. 74:2765–2772.
Vallet, J. L., R. K. Christenson, and H. G. Klemcke. 1998a. Purifica-tion and characterization of intrauterine folate-binding proteinsfrom swine. Biol. Reprod. 59:176–181.
Vallet, J. L., R. K. Christenson, and H. G. Klemcke. 1999a. Technicalnote: A radioimmunoassay for porcine intrauterine folate bind-ing protein. J. Anim. Sci. 77:1236–1240.
Vallet, J. L., R. K. Christenson, and W. J. McGuire. 1996. Associationbetween uteroferrin, retinol-binding protein, and transferrinwithin the uterine and conceptus compartments during preg-nancy in swine. Biol. Reprod. 55:1172–1178.
Vallet, J. L., R. K. Christenson, W. E. Trout, and H. G. Klemcke.1998b. Conceptus, progesterone, and breed effects on uterineprotein secretion in swine. J. Anim. Sci. 76:2657–2670.
Vallet, J. L., H. G. Klemcke, and R. K. Christenson. 2002. Interrela-tionships among conceptus size, uterine protein secretion, fetalerythropoiesis and uterine capacity. J. Anim. Sci. In Press.
Vallet, J. L., and G. E. Lamming. 1991. Ovine conceptus secretoryproteins and bovine recombinant interferon α1-1 decrease endo-metrial oxytocin receptor concentrations in cyclic and progester-one-treated ovariectomized ewes. J. Endocrinol. 131:475–482.
Vallet, J. L., G. E. Lamming, and M. Batten. 1990. Control of endome-trial oxytocin receptor and uterine response to oxytocin by pro-gesterone and oestradiol in the ewe. J. Reprod. Fertil. 90:625–634.
Vallet, J. L., T. P. L. Smith, T. Sonstegard, P. L. Pearson, R. K.Christenson, and H. G. Klemcke. 1999b. Isolation of complemen-tary deoxyribonucleic acids encoding putative secreted and mem-brane-bound folate binding proteins from endometrium of swine.Biol. Reprod. 61:372–379.
Vallet, J. L., K. A. Leymaster, J.-P. Cassady, and R. K. Christenson.2001. Are hematocrit and placental efficiency selection tools foruterine capacity in swine? J. Anim. Sci. 79(Suppl. 2):64 (Abstr.).
Whiteaker, S. S., M. A. Mirando, W. C. Becker, and C. E. Hostetler.1994. Detection of functional oxytocin receptors on endometriumof pigs. Biol. Reprod. 51:92–98.
Wilmut, I., D. I. Sales, and C. J. Ashworth. 1985. The influence ofvariation in embryo stage and maternal hormone profiles onembryo survival in farm animals. Theriogenology 23:107–119.

Uterine function and conceptus survival E125
Wilson, M. E., N. J. Biensen, and S. P. Ford. 1999. Novel insight intothe control of litter size in pigs, using placental efficiency as aselection tool. J. Anim. Sci. 77:1654–1658.
Wilson, M. E., N. J. Biensen, C. R. Youngs, and S. P. Ford. 1998.Development of Meishan and Yorkshire littermate conceptusesin either a Meishan or Yorkshire uterine environment to day90 of gestation and to term. Biol. Reprod. 58:905–910.
Wilson, M. E., and S. P. Ford. 1997. Differences in trophectodermmitotic rate and P450 17β-hydroxylase expression between late
preimplantation Meishan and Yorkshire conceptuses. Biol. Re-prod. 56:380–385.
Wilson, M. E., and S. P. Ford. 2001. Effect of estradiol-17 beta admin-istration during the time of conceptus elongation on placentalsize at term in Meishan pigs. J. Anim. Sci. 78:1047–1052.
Youngs, C. R., L. K. Christenson, and S. P. Ford. 1994. Investigationsinto the control of litter size in swine: III. A reciprocal embryotransfer study of early conceptus development. J. Anim. Sci.72:725–731.

Muscle wasting and protein metabolism1
C. Castaneda2
Jean Mayer USDA Human Nutrition Research Center on Aging at Tufts University, Boston, MA 02111
ABSTRACT: Accelerated muscle proteolysis is theprimary cause of muscle wasting in many catabolic dis-eases such as diabetes mellitus, renal and liver failure,HIV infection and AIDS, and cancer. In individualswith catabolic diseases, as is the case with fasting states(anorexia and starvation), protein breakdown increaseswhile protein synthesis declines, resulting in negativemuscle protein balance. The pathway responsible foraccelerated proteolysis in catabolic conditions is theubiquitin-proteosome-dependent system. Muscle prote-olysis increases under conditions of acidosis, up-regula-tion of branched-chain ketoacid dehydrogenase, the
Key Words: Protein Turnover, Muscle Wasting, Nutritional Status, Chronic Infections
2002 American Society of Animal Science. All rights reserved. J. Anim. Sci. 80(E. Suppl. 2):E98–E105
Introduction
Malnutrition and muscle wasting are common fea-tures of many catabolic chronic diseases associated withimpaired protein homeostasis. Protein homeostasistakes place through a fine balance between the aminoacid flow into the plasma pool coming from dietary in-take (exogenous) and muscle protein degradation (en-dogenous) primarily, and the amino acid flow out of thepool to be used for synthesis and catabolism (transami-nation and oxidation). Thus, reutilization of aminoacids constitutes a major factor of protein metabolism.
Protein and amino acids are not stored in the body,like fat and glucose are in adipocytes and as glycogen,respectively. The largest reservoir of protein, however,is skeletal muscle mass. Thus, muscle mass is the bestindicator of protein homeostasis. Inadequate dietaryintake of protein and energy due to anorexia or starva-tion, and the altered metabolic and physiologic pro-cesses resulting from increased catabolic stimuli andreduced anabolic stimuli, results in muscle wasting.
1This work was funded in part by the USDA, ARS, underagreement contract 58-1950-9-001. Any opinions, findings, conclu-sion, or recommendations expressed in this publication are those ofthe author(s) and do not necessarily reflect the view of the USDA.
2Correspondence: 711 Washington St. (phone: 617-556-3081; fax:617-556-3083; E-mail: [email protected]).
Received July 24, 2001.Accepted February 21, 2002.
E98
presence of catabolic hormones (glucocorticoids, thyro-toxic states), insulin resistance, and multiple cytokines(interleukin-1 and -6 and tumor necrosis factor). In con-trast, factors that suppress muscle proteolysis andwasting, leading to a state of adaptation, include di-etary protein deficiency with adequate energy intake,use of anabolic agents, and resistance exercise training.The understanding of the biochemical adaptations thatreduce protein degradation and improve nitrogen bal-ance are important for the development of effectivetherapies to combat muscle wasting and improve pro-tein homeostasis with catabolic illnesses.
Muscle wasting is characterized by unintentional lossof body weight (5 to 10%) due to accelerated muscleprotein degradation and reduced protein synthesis andrepresents a clinically significant complication of manychronic diseases.
The mechanisms of muscle wasting in different dis-ease processes are poorly understood. Regardless of itscause, muscle wasting affects disease outcome, leadingto weakness, disability, impaired quality of life, andincreased hospitalization days. Muscle wasting is prev-alent in disease states characterized by conditions suchas metabolic acidosis, the presence of increased cata-bolic hormones (glucocorticoids, thyrotoxic states) orcytokines (interleukin-1 and -6 and tumor necrosis fac-tor-α), and insulin resistance.
Timely recognition of muscle wasting is critical if weare to intervene successfully while treating the underly-ing condition. Intervention strategies include nutri-tional support; hormonal treatment with insulin,growth hormone, and anabolic steroids; and resistanceexercise training. This review will describe some of themediators of and interventions for muscle wasting. Itwill emphasize the need for further research. Ulti-mately, the goal of this review is to point out the impor-tance of early detection and intervention of chronic dis-eases leading to muscle wasting to prevent poor diseaseoutcome, co-morbidity, and mortality.
Protein Metabolism
In a normal 70-kg adult, about 280 g of protein issynthesized and degraded each day, the majority of

Muscle wasting and protein metabolism E99
Figure 1. Role of protein metabolism in muscle wasting.
which are intracellular proteins (Young, 1990; Crimand Munro, 1994). The balance between synthesis andbreakdown is such that any alteration in the supply(intake) or demand (utilization) could drastically altercell function (Figure 1). Traditionally, protein nutri-tional status and homeostasis is determined by the ni-trogen balance technique (NRC, 1989). However, con-ventional measures of nitrogen balance alone may notnecessarily reflect the processes of adaptation or accom-modation that take place in order to reach nitrogenequilibrium. Accommodation takes place when signifi-cant losses in important body tissues or functions occuras a result of an environmental, physical, or metabolicstress to maximize protein homeostasis and survival.In contrast, adaptation to such stress occurs while bodytissues and functions are maintained (WHO/FAO/UNU, 1985; Young, 1990). In its simplest form, accom-modation to a low-protein diet (providing between 0.4and 0.6 g�kg−1�d−1) was tested in healthy elderly womenconsuming adequate energy intakes (Castaneda et al.,1995a,b, 2000), as well as in patients with chronic renalinsufficiency prescribed moderately low-protein diets(Castaneda et al., 1995a). The results from these stud-ies showed that a marginal-to-low protein intake com-promises body cell mass and muscle size and function,despite a near-zero nitrogen equilibrium. This suggeststhat other measures of protein nutritional status maybe better indicators of protein homeostasis and ade-quacy, particularly in the situation of accelerated pro-tein degradation.
Assessment of Protein Metabolism
Nitrogen Balance. Nitrogen balance is the most com-monly used method to assess protein homeostasis(WHO/FAO/UNU, 1985). However, it is not a sensitivemethod to determine the continuous exchange of aminoacids between tissues, which depends on the metabolicstatus of the organism (WHO/FAO/UNU, 1985; Mu-nro, 1989).
Amino Acid Kinetics and Protein Turnover. Proteinturnover is characterized by the dynamics of aminoacids used for synthesis or degradation. In measuringprotein turnover, the inward amino acid flow into theplasma pool comes from dietary intake (exogenous) andprotein degradation (endogenous). These should bal-ance with the outward flow of amino acids from the poolused for synthesis and catabolism (transamination andoxidation) (Crim and Munro, 1994). Because the contri-bution of endogenous amino acids to the pool is sever-alfold greater than the amino acid intake, reutilizationof amino acids is a major contributing factor for pro-tein metabolism.
Recently, more sophisticated measures of amino acidkinetics and protein turnover have allowed a more pre-cise measurement of synthesis and breakdown in skele-tal muscle. This is the case with measures of fractionalsynthetic rate (Nair et al., 1988), protein synthesis us-ing the three-compartment pool (Biolo et al., 1995), anddegradation using a single-pool model (Wolfe, 1992).
Body Composition. During the course of adult life,body protein in the form of lean tissue diminishes pro-gressively and body fat increases (Munro, 1989; Young,1990). During severe malnutrition the loss in musclemass ranges from 8 to 12% (Heymsfield et al., 1982),and loss of about 40% of lean mass is fatal (Winick,1979). The structural protein component of muscle isthe main constituent of muscle mass that determinesfunction and clinical outcome; it constitutes the mainsource of protein for antibody and enzyme production,wound healing, and immune response (Forbes, 1987).The loss of muscle protein is roughly proportional tothe loss in muscle mass. Because protein is targeted tomuscle and muscle mass represents the largest tissuein the body, protein nutrition plays a significant rolein muscle metabolism. Thus, a reduced supply of aminoacids from the diet or increased demand for amino acidsfrom catabolic diseases will contribute to increased pro-tein degradation from muscle, the largest reservoir ofprotein, to ensure bodily functions.
Body cell mass is the metabolically active body com-partment constituted by muscle, viscera, brain, and thereproductive system where protein is targeted. Total-body potassium, 95% of which is intracellular, is moreclosely related to actively metabolizing nitrogen thantotal-body nitrogen (Cohn et al., 1980, 1983; Womersleyet al., 1976) and thus may be a more appropriate refer-ence value for estimating protein metabolism. The un-derstanding of protein turnover and the role of musclemass for protein homeostasis is important to explain

CastanedaE100
Table 1. Muscle wasting conditions and their postulated mediators
Condition Possible mediators
Anorexia and starvation Fasting, inadequate supplyRenal disease Metabolic acidosisDiabetes Insulin deficiency and(or) resistance
IGF-I resistanceIncreased TNF-αIncrease counter-regulatory hormones
Sex and growth hormone deficiency IGF-I resistanceIncreased TNF-α and IL-6
HIV and AIDS Increased myostatinIncreased Il-6Increased leptin
Inflammation Increased TNF-α and IL-1β
Increased glucagon
muscle wasting characterized by a negative nitrogenbalance and increased muscle protein degradation(Clague et al., 1983; Rennie and Harrison, 1984).
Muscle Wasting
Muscle wasting is defined as unintentional loss ofbody weight (5 to 10%) (Roubenoff et al., 1997) due toaccelerated muscle proteolysis, resulting in loss of bodycell mass. Body weight can be divided, at the simplestlevel, into mass and fat-free mass. Precise methods toevaluate loss of muscle mass are important to assessboth baseline muscle mass and changes over time, par-ticularly in the case of disease processes and interven-tions intended to reduce muscle wasting. Body cell massestimated from total body potassium (Cohn et al., 1983;Kehayiaas et al., 1997) may be the best single measureclosely linked to prognosis and survival (Keys et al.,1950; Kotler et al., 1989). The mechanisms of musclewasting in different disease processes are poorly under-stood. However, regardless of its cause, muscle wastingaffects disease outcome, leading to weakness, disability,impaired quality of life, increased hospitalization days,morbidity, and mortality.
Mediators of Muscle Wasting
At the whole-body level, the unexplained loss of bodyweight with wasting may be associated with low foodintake, high levels of energy expenditure, or a combina-tion of both. Starvation-induced malnutrition is thepure example of the detrimental effect of reduced aminoacid supply and loss of muscle mass (Grant, 1983). Mus-cle wasting is accelerated in many disease states suchas diabetes mellitus, renal and liver failure, HIV infec-tion, and cancer. Muscle proteolysis increases underconditions of acidosis, up-regulation of branched-chainketoacid dehydrogenase, the presence of catabolic hor-mones (glucocorticoids, thyrotoxic states) and cataboliccytokines (interleukin-1 and -6 and tumor necrosis fac-tor), and insulin resistance (Table 1). Possible mecha-nisms of increased protein degradation include activa-tion of the intracellular ubiquitin proteasome ATP-de-
pendent pathway (Mitch, 1996) and thedecarboxylation of branched-chain amino acids (Gerberand Mitch, 1992), both resulting in increased proteincatabolism and loss of lean body mass. Discussion ofthese mediators is outside the scope of this review andwill be presented elsewhere.
Insulin Resistance. Insulin is an important regulatorof protein synthesis (Kimball et al., 1994) and proteoly-sis (Tessari et al., 1987) in skeletal muscle. Insulinresistance or deficiency results in impaired muscle pro-tein turnover (Garibotto et al., 1994) and muscle wast-ing (Kaysen, 1996). Poorly controlled diabetes is associ-ated with severe muscle wasting (Gougeon et al., 1997).Insulin’s action on muscle appears to be primarily oneof inhibiting protein degradation, but it has been diffi-cult to demonstrate a sustained effect of insulin in in-creasing muscle protein synthesis (Nair et al., 1995;Charlton et al., 1997). Insulin resistance increases withage, fat mass, and physical inactivity (Muller et al.,1996; Eriksson et al., 1997; Cafalu, 1998), all contribut-ing factors for muscle loss.
Insulin-Like Growth Factor I. In skeletal muscle, cir-culating plasma IGF-I concentrations stimulate intra-cellular amino acid and glucose transport as well asprotein synthesis while suppressing protein degrada-tion (Musey et al., 1993). Plasma IGF-I levels vary ac-cording to nutrient intake (Clemmons et al., 1985b;Unterman et al., 1985). Insulin-like growth factor I hasbeen proposed as a biochemical marker in assessingearly responses to dietary changes in protein and en-ergy (Clemmons et al., 1985a; Sullivan and Carter,1994). We observed that a low-protein diet adequatein energy resulted in atrophy of type I muscle fibersassociated with significant declines in plasma IGF-Ilevels in older women consuming a protein diet equiva-lent to one-half the protein Recommended Dietary Al-lowance (RDA) for 10 wk (Castaneda et al., 2000). Theloss of high-turnover type I muscle fibers under condi-tions of dietary protein restriction suggests the need toincrease protein degradation of these fibers to provideamino acid substrate for other essential functions.
Metabolic Acidosis. Metabolic acidosis in both pre-dialysis and dialysis patients constitutes a major stimu-

Muscle wasting and protein metabolism E101
lus for protein degradation and muscle wasting, themost devastating complication of chronic uremia (Kop-ple et al., 2000). It has been suggested that specialattention to nutrient needs can help prevent the wast-ing syndrome of renal failure (Kopple et al., 1989; Lo-catelli et al., 1991). Thus, the consumption of adequateamounts of protein to maintain nutritional status, re-duce nitrogenous by-products leading to uremia, andpreserve renal function is a challenge for medical careof renal patients.
Metabolic acidosis stimulates the intracellular ubi-quitin proteasome ATP-dependent pathway, which cat-alyzes the breakdown of abnormal and short-lived pro-teins (Mitch, 1996). Acidosis enhances the decarboxyl-ation of branched-chain amino acids (BCAA) andcauses protein catabolism, suppresses albumin synthe-sis, promotes negative nitrogen balance, and inducesprotein degradation. The consequences may be severebecause BCAA, particularly leucine, constitute therate-limiting step for protein synthesis. The ketoacidof leucine, α-ketoisocaproate (KIC), exhibits a nitrogen-sparing effect by inhibiting protein degradation (Gerberand Mitch, 1992). Thus, metabolic acidosis hinders ad-aptation to a low-protein diet, blocks the protein-spar-ing effect of KIC, and encourages the loss of musclemass in renal patients.
Hormones. Both estrogen and testosterone have im-portant anabolic effects on muscle, although the effectof estrogen may also be mediated through its conversionto testosterone (Grinspoon et al., 1996, 1997). In elderlymen, low testosterone levels have been associated withreduced protein synthesis (Perrone et al., 1995) andloss of muscle mass and function (Baumgartner et al.,1999). In hypogonadal men, replacement doses of tes-tosterone for 12 wk increased muscle mass and strength(Morley et al., 1993; Sih et al., 1997). The anaboliceffects of testosterone therapy result from both systemicand local changes on protein metabolism that seem tobe indirectly mediated by the regulatory effects of IGF-I in skeletal muscle.
Growth hormone has been shown to increase proteinsynthesis and decrease protein oxidation rates (Jorgen-sen et al., 1994). A study of recombinant human growth(rGH) supplementation in growth hormone-deficientadults showed that nonoxidative leucine Rd (a measureof protein synthesis) increased whereas leucine oxida-tion decreased with rGH treatment (Russell-Jones etal., 1993). Similarly, lean body mass and circulatingIGF-I and insulin levels were significantly increasedafter 2 mo of treatment compared to placebo controls.These results suggest that growth and sex hormoneactions on accretion of skeletal muscle are mediated byincreases in protein synthesis rather than by reductionsin protein degradation.
Cytokines. Cytokines, endogenous products of the im-mune system, are important mediators of some of thechanges in protein metabolism and body composition(Roubenoff, 1993). The catabolic roles of interleukin(IL) I-β and IL-6 and tumor necrosis factor-α (TNF-α)
on resting metabolic rate and protein metabolism havebeen observed in wasting and cachexia (Dinarello, 1999;Abad et al., 2001) resulting from immunodeficiency vi-rus (HIV) infection and the acquired immunodeficiencysyndrome (AIDS). Similarly, a number of studies sug-gest that increased circulating levels of TNF-α (Nilsson,1998) as well as elevated skeletal muscle expression ofTNF-α mRNA (Saghizadeh, 1996) and increasedplasma IL-6, are associated with insulin resistance andmuscle wasting in diabetes (Fernandez-Real et al.,2001). In patients with rheumatoid arthritis the loss ofbody cell mass and function associated with increasedresting energy expenditure has been directly associatedwith production of TNF-α and IL-1-β by peripheralblood mononuclear cells (Roubenoff, 1993).
Other growth factors to consider include myostatin(growth differentiation factor 8, GDF-8) a member ofthe transforming growth factor (TGF)-β family(McPherron et al., 1997) implicated in the regulationof skeletal muscle growth (Grobet et al., 1997). In HIV-infected men with wasting, serum and intramuscularmyostatin-immunoreactive protein has been found tobe significantly higher than that of healthy men andcorrelates inversely with the fat-free-mass index (FFM/ht2) (Gonzalez-Cadavid et al., 1998). The mechanismsby which myostatin may contribute to muscle wastingare not known. However, the presence of significantcirculating levels of myostatin-immunoreactive proteinsuggests that receptors for this protein might exist inthe muscle and other sites that are involved in themetabolic regulation of body composition.
Anorexia and Starvation. Protein and energy insuffi-ciency are of concern primarily in circumstances inwhich needs are not being met due to lower intake (lowincome, anorexia, prescription) in combination withstress conditions due to surgery, hospitalization, andchronic diseases. In the case of protein deficiency, aminoacids generated from endogenous tissue degradation,namely muscle, become the main source of amino acidsupply for protein synthesis and the obligatory nitrogenlosses (WHO/FAO/UNU, 1985). In prolonged starvation(Keys et al., 1950; Winick, 1979) a significant decreasein body weight is accompanied by reduced total proteinconcentrations. The sustained loss of body cell massreaching about 60% of baseline is fatal (Winick, 1979),muscle protein synthesis is extremely dependent onexternal supplies of essential amino acids.
Interventions to Suppress Muscle Wasting
Timely recognition of muscle wasting is critical if weare to intervene successfully while treating the underly-ing condition. Furthermore, the amelioration of nutri-tional problems related to wasting may prove to beone strategy for increasing quality of life, enhancingfunctional independence, and possibly lessening theburden of a specific disease.
Nutritional Support. Nutritional support is an ex-treme measure to provide exogenous substrate (amino

CastanedaE102
acids and energy) needed to promote nitrogen retentionand net protein synthesis. For example, in the case ofburn and trauma patients, there is an accelerated rateof protein degradation in response to the lack and im-pairment in amino acid transport into muscle associ-ated with increased expression of catabolic cytokineexpression in the short term and elevated stress hor-mones (i.e., glucagon, cortisol, and epinephrine) in thelong term. In these cases, the enhanced outward fluxof amino acids leads to reduced intracellular amino acidconcentrations, which in turn stimulate more muscledegradation as a means to maintain normal amino acidconcentrations (Wolfe, 1996).
Physical Activity and Resistance Training. Exerciseand physical activity enhance protein utilization andcontribute to the prevention of and recovery from wast-ing (Butterfield et al., 1992). Resistance exercise train-ing, in particular, has been shown to delay or reversethe loss of muscle mass and function (Fiatarone et al.,1994; Campbell et al., 1995). The anabolic effects ofresistance training on nitrogen retention and musclemass are not observed with endurance exercise. Al-though the mechanisms whereby resistance trainingimproves protein utilization are not well understood,several studies have shown that this exercise modalitymay in fact be more effective and safe in counteractingmuscle wasting than pharmacological treatment.
Studies examining the response of insulin-deficientstates in muscle mass and muscle function with exer-cise are very limited. Mandroukas et al. (1986) showedthat patients with type 1 diabetes increased isokinetictorque and type IIa muscle fiber area after 20 wk ofendurance training. Durak (1990) found significant in-creases in strength in patients with type 1 diabetesundergoing resistance training for 10 wk. More re-cently, a study of patients with type 2 diabetes enrolledin a progressive resistance training program for 16 wkshowed positive results. Compared to controls, patientsin the exercise group exhibited significant increases inglycemic control as measured by a reduction in glycosyl-ated hemoglobin (17%) and plasma insulin levels (33%),accompanied by an absolute gain in lean body mass(1.5 kg), an increase in muscle strength (25%), and atwofold increase in muscle IGF-I gene expression (Cas-taneda et al., 2001b; Gordon, 2001). The change in mus-cle IGF-I was significantly associated with the changein muscle strength. These findings suggest that theanabolic effect of resistance training at the cellular levelmay be driven by improved insulin action and the com-pensatory actions of IGF-I in skeletal muscle.
Following 12 wk of resistance training, patients withmoderate chronic renal insufficiency not on dialysis suc-cessfully adapted to a low-protein diet equivalent to0.6 g�kg body weight−1�d−1. Successful adaptation wasevidenced by significant improvement in nitrogen re-tention, as shown by gains in total body potassium,hypertrophy of type I and II muscle fibers, increasedplasma prealbumin levels, maintenance of body weight,and increased protein utilization, as measured by
higher leucine oxidation rates, compared to subjectsconsuming the low-protein diet alone. The anabolic ef-fects of resistance training were observed despite sub-jects’ age, uremia, self-reported low energy intakes,anemia, low aerobic capacity, and co-morbid diseases(Castaneda et al., 2001a).
These studies suggest that resistance training is aneffective counter-measure to the negative effects of pro-tein restriction, insulin resistance, and uremia on mus-cle mass accretion, protein utilization and nutritionalstatus, and muscle function among these patients.
Anabolic Agents
Insulin. Exogenous insulin was administered to agroup of obese subjects with type 2 diabetes provideda weight-maintaining liquid formula containing 95 gprotein/d for 15 d (treatment group) compared to con-trols (those not receiving exogenous insulin) (Gougeonet al., 1998). Nitrogen balance improved significantlyfrom −0.6 ± 0.6 to +2.6 ± 0.6 g N/d, and nitrogen flux,synthesis, and breakdown rates were reduced by 18to 23% in hyperglycemic subjects treated with insulincompared to controls. The combined treatment of exoge-nous insulin and generous protein intake help normal-ized whole-body protein kinetics and nitrogen balancein these patients (Gougeon et al., 1998). These resultsare similar to those observed by Nair et al. (1995) show-ing inhibition of protein degradation in type 1 diabeticpatients during insulin repletion.
Although insulin’s anti-catabolic effect on protein me-tabolism in type 1 diabetes has been shown to be relatedto inhibition of protein degradation, insulin’s effect onmuscle protein synthesis remains controversial. In astudy by Charlton et al. (1997), fractional synthetic rateof myosin heavy chain in patients with type 1 diabetes(during both insulin treatment and acute insulin depri-vation) was similar to that measured in healthy sub-jects. Myosin heavy chain was chosen because of itsrole as the major protein of the contractile apparatusof muscle, responsible for the conversion of chemicalenergy (adenosine triphosphate) to mechanical energy.However, these findings are not conclusive and morestudies are needed to better understand the effects ofexogenous insulin administration on protein metabo-lism at the cellular level.
Growth Hormone. Human recombinant growth hor-mone (rGH) treatment in chronically malnourished he-modialysis patients resulted in a 25% increase in phe-nylalanine disposal, an index of protein synthesis,whereas phenylalanine’s rate of appearance, an indexof protein degradation, was unchanged. Sixty-two per-cent of the variation in forearm net phenylalanine bal-ance during treatment was accounted for by thechanges in IGF-I and the IGF-binding protein(IGFBP)-1 levels. These findings suggest that the resis-tance to growth hormone occurring in malnourishedend-stage renal patients may be overcome with phar-macologic doses of growth hormone (Garibotto et al.,

Muscle wasting and protein metabolism E103
1997). However, the administration of rGH (0.10 ± 0.02mg�kg body weight−1�d−1) vs a placebo in critically illadults (who had been in an intensive care unit for 5 to7 d and who were expected to require intensive care forat least 10 d) was evaluated in a randomized controlledstudy of 247 Finnish patients and 285 patients in otherEuropean countries. The patients received either rGHor placebo for a maximum of 21 d. The results from thisstudy showed that in-hospital mortality rate was 40%higher in the patients who received growth hormonethan in those randomized to the placebo (20%, P <0.001), suggesting an increased morbidity and mortal-ity in patients with prolonged critical illness receivinghigh doses of rGH (Takala et al., 1999). This informa-tion underlines the need of further investigation in or-der to understand the risks associated with rGH admin-istration in different populations.
Anabolic Steroids. In AIDS wasting, endogenous se-cretion of testosterone is decreased by 30 to 50% inmen. Hypogonadal patients with AIDS wasting havebeen found to have reduced muscle mass and IGF-Ilevels and increased mean growth hormone levels com-pared to eugonadal controls (Grinspoon et al., 1996).Testosterone levels have been found to be positivelyassociated with total body potassium, muscle mass, andfunctional capacity, suggesting that testosterone levelsplay an important role in the development of AIDSwasting. Furthermore, testosterone can inhibit the pro-duction of IL-1β and IL-6 (Pottratz et al., 1994), sug-gesting possible direct and indirect effects of this hor-mone in muscle.
In a study of testosterone supplementation to eugona-dal men with AIDS wasting vs placebo and progressiveresistance training (3 times per week) vs no trainingfor 12 wk, Grinspoon et al. (2000) found significanthypertrophy of muscle cross-sectional area of the arm(142%) and leg (111%) with training compared to notraining. Similar increases were observed for the arm(164%) and leg (210%) muscle fibers in response to tes-tosterone therapy compared with placebo. These find-ings are similar to others (Roubenoff et al., 1998) andsuggest that supervised resistance exercise and phar-macological treatment effectively increase muscle massto a similar degree; however, exercise is associated withsignificant health benefits in quality of life that extendbeyond those seen with hormone treatment.
Similarly, the effect of 6 mo of therapy with nandro-lone decanoate was tested in end-stage renal patients.Nandrolone decanoate resulted in increased lean bodymass and peak oxygen consumption and reduced walk-ing and stair-climbing time compared to placebo con-trols (Johansen et al., 1999). Although the short-termeffects of this pharmacological therapy were positive,the combination of such therapies with resistance train-ing as a means to improve energy intake and reduceanorexia remains to be determined given the beneficialeffects of resistance training on muscle mass and func-tion as well as quality of life and morale.
Implications
The balance between muscle protein synthesis anddegradation determines muscle mass and function. Un-derstanding the role of mediators of muscle wasting onnutritional and metabolic end points of protein homeo-stasis is critical to reducing morbidity and mortalityassociated with chronic diseases and to developing ap-propriate interventions. There is considerable interestin modulating protein metabolism with hormonesand(or) resistance training in several protein-wastingconditions. Further research is needed to elucidate themolecular and cellular mechanisms that contribute tothe maintenance of muscle mass, to understand theresponsiveness of muscle to different treatment inter-ventions, and to determine possible interactions be-tween treatment modalities. In addition, catabolic re-sponse may differ by disease condition, such that someinterventions tested in a group of patients may notnecessarily be safe and effective in another group.
Literature Cited
Abad, L. W., H. R. Schmitz, R. Parker, and R. Roubenoff. 2001.Cytokine responses differ by compartment and wasting statusin patients with HIV infection and healthy controls. FASEBJ. 15:A64.
Baumgartner, R. N., D. L. Waters, D. Gallagher, J. E. Morley, andP. J. Garry. 1999. Predictors of skeletal muscle mass in elderlymen and women. Mech. Ageing Dev. 107:123–136.
Biolo, G., S. P. Maggi, B. D. Williams, K. D. Tipton, and R. R. Wolfe.1995. Increased rates of muscle protein turnover and amino acidtransport after resistance exercise in humans. Am. J. Physiol.31:E514–E520.
Butterfield, G., C. Cady, and S. Moynihan. 1992. Effect of increasedprotein intake on nitrogen balance in recreational weight lifters.Med. Sci. Sports Exerc. 24:S71.
Campbell, W. W., M. C. Crim, V. R. Young, L. J. Joseph, and W. J.Evans. 1995. Effects of resistance training and dietary proteinintake on protein metabolism in older adults. Am. J. Physiol.268:E1143–E1153.
Castaneda, C., J. M. Charnley, W. J. Evans, and M. C. Crim. 1995a.Elderly women accommodate to a low protein diet with lossesof body composition, muscle function, and immune response.Am. J. Clin. Nutr. 62:30–39.
Castaneda, C., G. E. Dallal, W. J. Evans, and M. C. Crim. 1995b.Protein turnover and energy metabolism of elderly womenchronically fed a low protein diet. Am. J. Clin. Nutr. 62:40–48.
Castaneda, C., P. L. Gordon, R. A. Fielding, W. J. Evans, and M. C.Crim. 2000. Marginal protein intake results in reduced plasmaigf-i levels and skeletal muscle fiber atrophy in elderly women.J. Nutr. Health Aging 4:85–90.
Castaneda, C., P. L. Gordon, K. L. Uhlin, A. S. Levey, J. J. Kehayias,J. T. Dwyer, R. Roubenoff, R. A. Fielding, and M. A. FiataroneSingh. 2001a. Resistance training to counteract the catabolismof a low protein diet in chronic renal insufficiency: A randomized,controlled trial. Ann. Intern. Med. 135:965–976.
Castaneda, C., L. Munoz-Orians, J. Layne, J. Walsmith, M. Foldvari,R. Roubenoff, K. L. Tucker, and M. Nelson. 2001b. A randomizedtrial of resistance exercise training to improve glycemic controlin Hispanic elders with diabetes. Diabetes. 50(Suppl. 2):A221(Abstr.).
Cefalu, W. T. 1998. Insulin resistance and fat patterning with aging:Relationship to metabolic risk factors for cardiovascular disease.Metabolism 47:401–408.

CastanedaE104
Charlton, M. R., P. Balagopal, and K. S. Nair. 1997. Skeletal musclemyosin heavy chain synthesis in type 1 diabetes. Diabetes46:1336–1340.
Clague, M. B., M. J. Keir, and P. D. Wright. 1983. The effects ofnutrition and trauma on whole-body protein metabolism in man.Clin. Sci. (Lond.) 65:165–175.
Clemmons, D., M. M. Seek, and L. E. Underwood. 1985a. Supplemen-tal essential amino acids augment the somatomedin-C/insulin-like growth factor I: Response to refeeding after fasting. Metabo-lism 34:391–394.
Clemmons, D. R., L. E. Underwood, R. N. Dickerson, R. O. Brown,L. J. Hak, M. R. D., and W. D. HeizEr. 1985b. Use of plasmasomatomedin-C/insulin-like growth factor I measurements tomonitor the response to nutritional repletion in malnourishedpatients. Am. J. Clin. Nutr. 41:191–198.
Cohn, S. H., A. N. Vartsky, and E. J. Ellis. 1983. Indexes of body cellmass: Nitrogen versus potassium. Am. J. Physiol. 244:E305–310.
Cohn, S. H., D. Vartsky, S. Yasamura, A. Savintski, I. Zansi, A.Vaswani, and K. J. Ellis. 1980. Compartmental body compositionbased on total body nitrogen, potassium and calcium. Am. J.Physiol. 239:E524–530.
Crim, M. C., and H. Munro. 1994. Proteins and amino acids. In: M.E. Shils, J. A. Olson, and M. Shike (ed.) Modern Nutrition inHealth and Disease. pp 1–30. Lea & Febiger, Philadelphia, PA.
Dinarello, C. A. 1999. Cytokines as endogenous pyrogens. J. Infect.Dis. 179(Suppl. 2):S294–304.
Durak, E. P. 1990. Randomized cross-over study of effect of resistancetraining on glycemic control, muscular strength, and cholesterolin type i diabetic men. Diabetes Care 13:1039–1043.
Eriksson, J., S. Taimela, and V. A. Koivisto. 1997. Exercise and themetabolic syndrome. Diabetologia 40:125–135.
Fernandez-Real, J. M, M. Vayreda, C. Richart, C. Gutierrez, M. Broch,J. Vendrell, and W. Ricart. 2001. Circulating interleukin 6 levels,blood pressure, and insulin sensitivity in apparently healthymen and women. J. Clin. Endocrinol. Metab. 86:1154–1159.
Fiatarone, M. A., E. F. O’Neill, and N. D. Ryan. 1994. Exercise train-ing and nutritional supplementation for physical frailty in thevery elderly people. N. Engl. J. Med. 330:1769–1775.
Forbes, G. B. 1987. Human Body Composition: Growth, Aging, Nutri-tion, and Activity. Springer-Verlag, New York.
Garibotto, G., A. Barreca, R. Russo, A. Sofia, P. Araghi, A. Cesarone,M. Malaspina, F. Fiorini, F. Minuto, and A. Tizianello. 1997.Effects of recombinant human growth hormone on muscle pro-tein turnover in malnourished hemodialysis patients. J. Clin.Investig. 99:97–105.
Garibotto, G., R. Russo, A. Sofia, M. R. Sala, C. Robaudo, P. Moscatelli,G. Deferrari, and A. Tizianello. 1994. Skeletal muscle proteinsynthesis and degradation in patients with chronic renal failure.Kidney Int. 45:1432–1439.
Gerber, S., and W. Mitch. 1992. Mechanisms for protein catabolismin uremia: Metabolic acidosis and activation of proteolytic path-ways. Miner. Electrolyte Metab. 18:233–236.
Gonzalez-Cadavid, N. F., W. E. Taylor, K. Yarasheski, I. Sinha-Hikim,K. Ma, S. Ezzat, R. Shen, R. Lalani, S. Asa, M. Mamita, G.Nair, S. Arver, and S. Bhasin. 1998. Organization of the humanmyostatin gene and expression in healthy men and HIV-infectedmen with muscle wasting. Proc. Natl. Acad. Sci. USA95:14938–14943.
Gordon, P. L. 2001. Expression of TNF-alpha mRNA in skeletal mus-cle of Hispanic elders with type 2 diabetes mellitus: Effect ofstrength training. Univ. of Maryland, College Park.
Gougeon, R., E. B. Barliss, P. J. Jones, P. B. Pencharz, and J. A.Morais. 1998. Effect of exogenous insulin on protein metabolismwith differing nonprotein energy intakes in type 2 diabetes melli-tus. Int. J. Obes. Relat. Metab. Disord. 22:250–261.
Gougeon, R., P. B. Pencharz, and R. J. Sigal. 1997. Effect of glycemiccontrol on the kinetics of whole-body protein metabolism in obesesubjects with non-insulin dependent diabetes mellitus duringiso- and hypoenergetic feeding. Am. J. Clin. Nutr. 65:861–870.
Grant, J. O. 1983. Clinical impact of protein malnutrition on organmass and function. In: G. L. Blackburn, J. P. Grant and V. R.
Young (ed.) Amino Acids: Metabolism and Medical Applications.pp 347–358. John Wright/PSG Inc., Boston, MA.
Grinspoon, S., C. Corcoran, K. Lee, B. Burrows, J. Hubbard, L. Katz-nelson, M. Walsh, A. Guccione, J. Cannan, H. Heller, N. Basgoz,and A. Klibanski. 1996. Loss of lean body and muscle masscorrelates with androgen levels in hypogonadal men with ac-quired immunodeficiency syndrome and wasting. J. Clin. Endo-crinol. Metab. 81:4051–4058.
Grinspoon, S., C. Corcoran, K. Miller, B. M. Biller, H. Askari, E.Wing, J. Hubbard, E. J. Anderson, N. Basgoz, H. M. Heller, andA. Klibanski. 1997. Body composition and endocrine function inwomen with acquired immunodeficiency syndrome wasting. J.Clin. Endocrinol. Metab. 82:1332–1337.
Grinspoon, S., C. Corcoran, K. Parlman, M. Costello, D. Rosenthal,E. Anderson, T. Stanley, D. Schoenfeld, B. Burrows, D. Hayden,N. Basgoz, and A. Klibanski. 2000. Effects of testosterone andprogressive resistance training in eugonadal men with aids wast-ing. A randomized, controlled trial. Ann. Intern. Med.133:348–355.
Grobet, L., L. H. Martin, D. Poncelet, D. Pirottin, R. Brouwers, J.Riquet, A. Schoeberlein, S. Dunner, F. Menissier, J. Massa-banda, R. Fries, R. Hanset, and M. Georges. 1997. A deletionin the bovine myostatin gene causes the double-muscled pheno-type in cattle. Nat. Genet. 17:4–5.
Heymsfield, S. B., C. McManus, V. Stevens, and J. Smith. 1982.Muscle mass: Reliable indicator of protein-energy malnutritionseverity and outcome. Am. J. Clin. Nutr. 35:1192–1199.
Johansen, K. L., K. Mulligan, and M. Schambelan. 1999. Anaboliceffects of nandrolone decanoate in patients receiving dialysis: Arandomized controlled trial. J. Am. Med. Assoc. 281:1275–1281.
Jorgensen, J. O., J. Muller, J. Moller, T. Wolthers, N. Vahl, A. Juul,N. E. Skakkebaek, and J. S. Christiansen. 1994. Adult growthhormone deficiency. Horm. Res. (Basel) 42:235–241.
Kaysen, G. 1996. Derangements of protein metabolism in chronicrenal failure. Blood Purif. 14:373–381.
Kehayias, J. J., M. A. Fiatarone, H. Zhuang, and R. Roubenoff. 1997.Total body potassium and body fat: Relevance to aging. Am. J.Clin. Nutr. 66:904–910.
Keys, A., J. Brozek, A. Henschel, O. Mickelson, and H. L. Taylor.1950. The Biology of Human Starvation. Univ. MinnesotaPress, Minneapolis.
Kimball, S. R., T. C. Varyl, and S. Jefferson. 1994. Regulation ofprotein synthesis by insulin. Annu. Rev. Physiol. 56:321–348.
Kopple, J. D., R. Berg, H. Houser, T. I. Steinman, and P. Teschan.1989. Nutritional status of patients with different levels ofchronic renal insufficiency. Kidney Int. 36(Suppl. 27):S184–S194.
Kopple, J. D., T. Greene, W. C. Chumlea, D. L. Hollinger, B. J. Maroni,D. Merrill, L. K. Scherch, G. Schulman, S-R. Wang, and G. S.Zimmer. 2000. Relationship between nutritional status and theglomerular filtration rate: Results from the MDRD study. KidneyInt. 57:1688–1703.
Kotler, D. P., A. R. Tierney, J. Wang, and R. N. Pierson. 1989. Magni-tude of body-cell-mass depletion and the timing of death fromwasting an AIDS. Am. J. Clin. Nutr. 50:444–447.
Locatelli, F., D. Alberti, G. Graziani, G. Buccianti, B. Redaelli, andA. Giangrande. 1991. Prospective, randomized, multicentre trialof effect of protein restriction on progression of chronic renalinsufficiency. Lancet 337:1299–1304.
Mandroukas, K., G. Krotkiewski, G. Holm, G. Stromblad, G. Grimby,H. Lithell, Z. Wroblewski, and P. Bjorntrop. 1986. Muscle adap-tations and glucose control after physical training in insulindependent diabetes mellitus. Clin. Physiol. 6:39–52.
McPherron, A., A. M. Lawler, and S. J. Lee. 1997. Myostatin or growthdifferentiation factor 8. Nature (Lond.) 387:83–90.
Mitch, W. 1996. Mechanisms causing muscle wasting in uremia. J.Renal Nutr. 6:75–78.
Morley, J. E., H. M. Perry, 3rd, F. E. Kaiser, D. Kraenzle, J. Jensen,K. Houston, M. Mattammal, and H. M. Perry, Jr. 1993. Effectsof testosterone replacement therapy in old hypogonadal males:A preliminary study. J. Am. Geriatr. Soc. 41:149–152.

Muscle wasting and protein metabolism E105
Muller, D. C., D. Elahi, J. Tobin, and R. Andres. 1996. The effect ofage on insulin resistance and secretion. A review. SeminarsNephrol. 16:289–298.
Munro, H. 1989. Protein nutriture and requirements of the elderly.In: H. Munro and D. Danford (ed.) Human Nutrition a Compre-hensive Treatise. Nutrition, Aging, and the Elderly. 6th ed. pp153–181. Plenum Press, New York.
Musey, V., S. Goldstein, P. Farmen, P. Moore, and L. Phillips. 1993.Differential regulation of igf-1 and IGF-binding protein-I by di-etary composition in humans. Am. J. Med. Sci. 305:131–138.
Nair, K. S., G. C. Ford, K. Ekberg, E. Fernqvist-Forbes, and J. Wah-ren. 1995. Protein dynamics in whole body and in splanchnicand leg tissues in type I diabetic patients. J. Clin. Investig.95:2926–2937.
Nair, K. S., D. Halliday, and R. C. Griggs. 1988. Leucine incorporationinto mixed skeletal muscle protein in humans. Am. J. Physiol.254:E208–213.
NRC. 1989. Recommended dietary allowances. 10th ed. NationalAcademy Press, Washington, DC.
Nilsson, J. 1998. Relation between plasma tumor necrosis factor-alpha and insulin sensitivity in elderly men with non-insulin-dependent diabetes mellitus. Ather. Thromb. Vas. Biol.18:1199–1202.
Perrone, C. E., D. Fenwick-Smith, and H. H. Vandenburgh. 1995.Collagen and stretch modulate autocrine secretion of insulin-likegrowth factor-1 and insulin-like growth factor binding proteinsfrom differentiated skeletal muscle cells. J. Biol. Chem.270:2099–2106.
Pottratz, S. T., T. Bellido, H. Mocharla, D. Crabb, and S. C. Manola-gas. 1994. 17 beta-estradiol inhibits expression of human in-terleukin-6 promoter-reporter constructs by a receptor-depen-dent mechanism. J. Clin. Investig. 93:944–950.
Rennie, M., and R. Harrison. 1984. Effects of injury, disease, andmalnutrition on protein metabolism in man. Lancet 11:323–325.
Roubenoff, R. 1993. Hormone, cytokines, and body composition: Canlessons from illness be applied to aging? J. Nutr. 123:469–473.
Roubenoff, R., S. B. Heymsfiled, J. J. Kehayias, J. Cannon, and I.H. Rosenberg. 1997. Standardization of nomenclature of bodycomposition in weight loss. Am. J. Clin. Nutr. 64:192–196.
Roubenoff, R., A. McDermott, M. Wood, J. Suri, J. Fauntleroy, andA. Shevitz. 1998. Feasibility of increasing lean body mass in
HIV-infected adults using progressive resistance exercise. Med.Sci. Sports Exerc. 30:S183 (Abstr.).
Russell-Jones, D. L., A. J. Weissberger, S. B. Bowes, J. M. Kelly, M.Thomason, A. M. Umpleby, R. H. Jones, and P. H. Sonksen.1993. The effects of growth hormone on protein metabolism inadult growth hormone deficient patients. Clin. Endocrinol.38:427–431.
Saghizadeh, M. 1996. The expression of TNF-alpha by human muscle.J. Clin. Investig. 97:1111–1116.
Sih, R., J. E. Morley, F. E. Kaiser, H. M. Perry, 3rd, P. Patrick, andC. Ross. 1997. Testosterone replacement in older hypogonadalmen: A 12-month randomized controlled trial. J. Clin. Endocri-nol. Metab. 82:1661–1667.
Sullivan, D. H., and W. J. Carter. 1994. Insulin-like growth factor ias an indicator of protein-energy undernutrition among metabol-ically stable hospitalized elderly. J. Am. Coll. Nutr. 13:184–191.
Takala, J., E. Roukonen, N. R. Webster, M. S. Nielsen, D. F. Zandstra,G. Vundelinckx, and C. J. Hinds. 1999. Increased mortality asso-ciated with growth hormone treatment in critically ill adults.N. Engl. J. Med. 341:785–792.
Tessari, P. S., I. G. Giolo, R. Trevisan, G. Fantin, M. M. C. E. Iori,A. Tiengo, and A. G. Crepaldi. 1987. Differential effects of hyper-insulinemia and hyperaminoacidemia on leucine-carbon metab-olism in vivo. J. Clin. Investig. 79:1062–1069.
Unterman, T., R. M. Vazquez, A. Slas, and P. Martyn. 1985. Nutritionand somatomidin-C. Am. J. Med. 78:228–234.
WHO/FAO/UNU. 1985. Energy and protein metabolism. WorldHealth Organization, Geneva.
Winick, M. 1979. Hunger Disease: Studies by Jewish Physicians inthe Warsaw Ghetto. John Wiley & Sons, New York.
Wolfe, R. 1992. Calculation of substrate kinetics: Single model pool.In: R. Wolfe (ed.) Radioactive and Stable Isotope Tracers Biomed-icine. Principles and Practice of Kinetic Analysis. pp 119–144.Wiley-Liss, New York.
Wolfe, R. 1996. Herman award lecture, 1996: Relation of metabolicstudies to clinical nutrition—the example of burn injury. Am.J. Clin. Nutr. 64:800–808.
Womersley, J., A. Durnin, K. Boddy, and M. Mahaffy. 1976. Influenceof muscular development, obesity, and age on fat-free mass inadults. J. Appl. Physiol. 41:223–228.
Young, V. R. 1990. Amino acids and protein in relation to the nutritionof elderly people. Age Ageing 19:510–524.

Variation in the response of multiple genetic populationsof pigs to ractopamine
A. P. Schinckel1, B. T. Richert, and C. T. Herr
Animal Sciences Department, Purdue University, West Lafayette, IN 47907-1151
ABSTRACT: Several research trials have evaluatedthe impact of ractopamine on barrows and gilts of vari-ous genetic populations. Overall, the desirable responseof ractopamine to increase daily carcass lean gain, im-prove feed efficiency, and increase carcass lean percent-age has been observed in genetic populations of sub-stantially different lean growth rates and carcass leanpercentages. Six trials have evaluated the magnitudeof genetic populations × ractopamine interactions. Inone trial, carcass muscle accretion (g/d) increased withractopamine to a greater extent in high-lean-gain(High-Lean) barrows than in low-lean-gain (Low-Lean)barrows (P < 0.02). Dissected fat accretion (g/d) wasreduced by a greater magnitude in the High-Lean thanin the Low-Lean barrows (P < 0.04). A second trialevaluated the ractopamine response in five genetic pop-ulations of barrows and found significant ractopamine× genetic populations interactions (P < 0.05) for dailycarcass lean gain. Regression of the carcass lean gainof pigs fed ractopamine on the mean carcass lean gain
Key Words: β-Adrenergic Agonists, Genetics, Lean, Growth, Pigs
2002 American Society of Animal Science. All rights reserved. J. Anim. Sci. 80(E. Suppl. 2):E85–E89
Introduction
Ractopamine is a β-adrenergic agonist that, when fedto pigs, increases carcass leanness by increasing muscleaccretion and decreasing fat deposition (Watkins et al.,1990). Carcass muscle accretion is increased to agreater extent than visceral organ growth, causing anincrease in dressing percentage. With small (0 to 5%)decreases in daily feed intake, ractopamine substan-tially improves both live weight and lean efficiency(Watkins et al., 1990; Gu et al., 1991a,b).
Genetic selection has substantially increased carcassmuscle accretion rates and decreased carcass fat accre-tion rates (Schinckel and De Lange 1996; Schinckel,1999). It is possible that genetic populations selected
1Correspondence: E-mail: [email protected] July 28, 2001.Accepted February 22, 2002.
E85
of the controls for the five genetic populations indicatedthat the ractopamine effects could be described as aconstant percentage (25%) increase in daily lean gainabove the controls. The third trial evaluated the re-sponse of Paylean in 300 gilts in a 3 × 4 factorial withthree genetic populations (commercial terminalcrosses) and four ractopamine levels (0, 5, 10, and 20ppm). The genetic populations had similar carcass leanpercentage. No genetic populations × ractopamine in-teractions were found (P > 0.10). Overall, the researchindicates that ractopamine has a positive impact onbarrows and gilts with substantially different geneticpotentials for lean growth and carcass lean percentage.The ractopamine response to increase lean growth hasbeen found to be proportional to the genetic potentialof the genetic populations. Recent research has foundsignificant genetic populations × environmental inter-actions for pigs reared in different health status envi-ronments. Environment × ractopamine and environ-ment × ractopamine × genetic populations interactionsfor compositional growth in pigs need to be evaluated.
for increased carcass lean gain may express a greaterresponse to dietary ractopamine because of their in-creased DNA concentration, which may allow increasedractopamine response for increased carcass muscle ac-cretion (Bark et al., 1992). Selection for reduced fataccretion has altered fatty acid metabolism (Mills etal., 1990). It is possible that the responsiveness of thefat tissue to dietary ractopamine could differ amonggenetic populations of pigs. The objectives of this paperare 1) to review the literature, 2) to discuss potentialgenetic populations × ractopamine interactions, and 3)to identify areas where future research is warranted.
Evaluation of Ractopamine inDifferent Genetic Populations
The response to ractopamine (20 ppm) was evaluatedin two lines of pigs that were fed either high- or low-protein diets from 60 to 90 kg live weight (Mitchell etal., 1990). The two genetic populations of barrows had

Schinckel et al.E86
been selected for seven generations for rapid leangrowth when fed either the high- (HS line) or low- (LSline) protein diet. Pigs of the HS line were leaner andmore feed-efficient than LS pigs when fed the control12 or 24% protein diets. Line × diet × ractopamine treat-ment interactions (P < 0.05) were noted for whole car-cass lipid, backfat thickness, dissected fat growth, andlongissimus muscle area. This trial supports the conclu-sion that it is possible that genetic population × racto-pamine interactions can be produced by the essentialamino acid or crude protein levels used in the trial.
Yen et al. (1990) conducted a trial using obese andlean barrows produced by multiple generations of selec-tion for high or low backfat thickness. The two geneticpopulations were Duroc obese × Yorkshire obese andDuroc lean × Yorkshire lean pigs. The pigs (14 obeseand 12 lean) were fed a 16% crude protein diet for a48-d feeding period. Dietary supplementation with 20ppm ractopamine reduced the feed intake and improvedfeed efficiency in both genetic populations (P < 0.05).Ractopamine decreased 10th rib fat depth of both ge-netic populations (P < 0.05) 6.7 to 5.9 cm in the obesepigs and 2.5 to 1.9 cm the lean pigs.
Pigs fed ractopamine had higher dressing percentage(76.4 vs 75.3%, P < 0.05), longissimus muscle area (32.7vs 26.3 cm2, P < 0.05), predicted muscle mass (35.7 vs33.0 kg, P < 0.05), and dissected ham lean mass (15.5vs 13.1 kg, P < 0.05) than the control pigs. Ractopamineincreased the percentage of moisture (70 vs 69.5%, P <0.05), reduced the percentage of lipid (8.45 vs 10.35%,P < 0.05), and increased the percentage of crude protein(20.25 vs 19.30%, P < 0.05) in the dissected ham lean.Although genetic populations and ractopamine effectswere significant, no significant genetic population × rac-topamine interactions were found (P > 0.05).
The effect of ractopamine in contemporary U.S. cross-bred, purebred Chinese Meishan, and Meishan-crosspigs was evaluated by Yen et al. (1991). Twenty-fourU.S. crossbred (Duroc × White composite), 24 purebredMeishan and 24 Meishan × White composite crossbredbarrows were fed 16% CP corn-soybean meal diets witheither 0 or 20 ppm ractopamine for 52 d. Ractopamineincreased average daily gain, feed efficiency, dressingpercentage, and predicted carcass muscle in all threegenotypes. A significant genetic population × ractopam-ine interaction was found for longissimus muscle area(LMA). Ractopamine increased LMA in the Duroc ×White composite pigs from 37.9 to 45.1 cm2 (P < 0.01)and increased the LMA of the Meishan-cross pigs from28.0 to 32.3 cm2 (P < 0.05). However, ractopamine didnot increase LMA in the pure Meishan pigs (19.0 and17.8 cm2 for the control and ractopamine-fed pigs, re-spectively). Although the lean growth rates were notcalculated by the original authors, Bark et al. (1992)predicted that ractopamine increased carcass leangrowth by 79 g/d in the U.S. crossbred pigs and only29 g/d in the purebred and crossbred Meishan pigs.
To evaluate the responses of pigs of different geneticpotential for carcass lean growth to ractopamine treat-
ment, Bark et al. (1992) used two genetic populationsof pigs representing low (Low-Lean) and high (High-Lean) genetic potential for lean growth. Within eachgenetic population, two littermate barrows from eightlitters were given ad libitum access to a lysine-supple-mented corn-soybean diet (1.08% lysine) containing 0or 20 ppm of ractopamine from 63 to 104 kg. Barrowsof the High-Lean line had higher average daily gain(0.89 vs 0.63 kg/d, P < 0.05), and carcass lean growth(282 vs 132 g/d, P < 0.05) and had better feed conversion(3.25 vs 4.28, P < 0.05) than the Low-Lean barrows onthe control diets. Ractopamine increased average dailygain (0.83 to 0.76 kg/d, P < 0.01) and improved feed:gain(3.33 vs 3.77, P < 0.01). Ractopamine enhanced carcassmuscle accretion rate to a greater extent in the High-Lean barrows (282 to 476 g/d) than in the Low-Leanbarrows (132 vs 173 g/d). Ractopamine also reducedthe accretion rate of dissectible fat tissue by a greaterextent in the High-Lean barrows (132 vs 273 g/d) thanin the Low-Lean barrows (205 vs 292 g/d, P < 0.04).Lean feed efficiency, calculated as the muscle gain (kg)per feed intake (kg), was increased more in the High-Lean pigs (0.102 to 0.179) than in the Low-Lean pigs(0.048 to 0.066, P < 0.01).
As in past trials, ractopamine increased the percent-age of protein in the dissected muscle (19.0 to 20.0% inthe Low-Lean pigs and 20.0 to 21.4% in the High-Leanpigs). The percentage of lipid in the muscle was de-creased (P < 0.01) by ractopamine from 14.0 to 12.9%in the Low-Lean pigs and from 10.4 to 7.8% in the High-Lean pigs. Genetic population × ractopamine interac-tions were not significant for the changes in the chemi-cal composition of the dissected muscle tissue (P = 0.49),dissected muscle mass, or on a lipid-free basis (P = 0.61).
It is important to note that for this trial pigs werefed ractopamine on a weight-constant basis (63 to 104kg live weight). The ractopamine response diminishedwith time. The Low-Lean barrows required an addi-tional 21 d (63 vs 42 d) to reach the designated finalweight. Ractopamine increased average daily gain ap-proximately 0.20 kg/d during the initial 14-d period inboth genetic populations. From 14 to 28 d, the racto-pamine response for average daily gain was approxi-mately halved and then became close to zero from 28to 42 d on test. The Low-Lean barrows fed ractopaminehad a numerically lower average daily gain than thecontrol pigs from 42 to 63 d of age.
If the impact of ractopamine to increase lean growthand decrease fat accretion also diminishes with thenumber of days on test, then the genetic population ×ractopamine interactions were increased in magnitudeby the 63- vs 42-d test period for Low-Lean and High-Lean pigs. When different genetic populations with dif-ferent growth potentials are evaluated on control andractopamine-supplemented diets, the relative magni-tude of the ractopamine response may be different whenthe ractopamine treatment is targeted for a specificduration of time (e.g., 28 or 42 d) vs a constant weightinterval (e.g., 70 to 100 kg live weight).

Response of pigs to ractopamine E87
Table 1. Ractopamine (ractopamine) × genotype (GT)least squares means for average daily fat
standardized lean growth (g/d)
ADSLGa
ADSLGa, 20 ppmGT 0 ppm ractopamine ractopamine
1 303 ± 19 318 ± 202 305 ± 18 391 ± 203 333 ± 18 422 ± 204 289 ± 18 342 ± 195 313 ± 18 452 ± 19
aADSLG = average daily fat standardized lean growth (Gu et al.,1992).
A factorial experiment using 183 individually fed bar-rows was conducted by Gu et al. (1991a,b, 1992). Bar-rows of five genetic populations with two levels of racto-pamine (0 and 20 ppm) were fed for one of three treat-ment periods (59 to 100, 73 to 114, and 86 to 127 kglive weight). Pigs were fed a high-energy 18.5% CP(0.95% lysine) diet with 3,594 cal of ME/kg. As in pasttrials, ractopamine improved feed conversion (3.17 vs3.27, P = 0.07), increased dressing percentage (75.8 vs74.5%), increased fat-standardized (10% fat) carcasslean percentage (51.1 vs 48.1%), and increased longissi-mus area (35.3 vs 32.5 cm2). There were no significant(P > 0.10) ractopamine × genetic population interactionsfor these variables except for percentage of fat-stan-dardized lean (P < 0.10).
Ractopamine increased fat-standardized lean gain(10% fat) by 25% (385 vs 308 g/d) and increased leanfeed efficiency (fat-standardized lean gain/feed intake)by 25.5% (0.1270 vs 0.1012). There were significantractopamine × genetic population interactions for fat-standardized lean gain (P = 0.03) and fat-standardizedlean efficiency (P = 0.08). The fat-standardized leangain for the pigs of the five genetic populations fedractopamine were regressed on the mean of the fivegenetic populations fed control diets with the effects ofreplicate and weight interval included in the model(Table 1). The regression coefficient was 1.25, indicatingthat a multiplicative adjustment of 1.25 times the con-trol could be used to predict lean gain for ractopamine-fed pigs.
The data from Bark et al. (1992) were also addedto the regression analyses. The overall model for theconstant weight interval ractopamine response for leangrowth resulted in 1) a greater absolute magnitude inhigh-lean-growth genetic populations and 2) a constantpercentage increase in lean growth as a simple meansto predict the response to ractopamine unless actualresearch data are available.
Recently, a trial was conducted in which gilts of threemodern high-lean gain terminal crosses were fed fourlevels of ractopamine (0, 5, 10, and 20 ppm) for a 4-wkfeeding period (Herr et al., 2001a). Gilts started on testat 81.6 kg live weight and were fed diets formulated tocontain 18.6% CP and 1.1% lysine. The three genetic
populations had similar carcass lean percentage. Onegenetic population had a 7.0% higher average daily gainthan the other two genetic populations. Three hundredgilts were blocked by weight into 60 pens (five pensper ractopamine level × genetic population treatment).Overall, ractopamine increased average daily gain by14.5% and improved feed conversion by 14.6%. No sig-nificant genetic population × ractopamine treatmentinteractions were found.
Variation in the Response to theLevel of Ractopamine
The responses of pigs fed 5 to 20 ppm ractopaminehave been summarized (Watkins et al., 1990; Elanco,1999; Table 2). In the initial trials completed in the late1980s to early 1990s, pigs were fed 16% corn-soybeanmeal diets from 67 to 104 kg live weight. The durationon test was approximately 41 to 42 d. The control pigsaveraged 2.74 cm 10th rib backfat depth at 104 kglive weight.
In a recent trial (Herr et al., 2001a) gilts were fedfor a 4-wk period starting at 83.5 kg live weight. Themodern high-lean pigs were substantially leaner (1.78cm backfat at 112 kg) and had better feed conversionand lower feed intakes than pigs of the past trials. Inthe recent trial, the proportion of maximal response (20ppm) achieved by the gilts fed 5 ppm was greater thanin the past trials conducted with lower-lean-growth,lower-percentage-lean pigs (Table 2). The environment,health status, and other factors may have changed suchthat the pigs’ relative response to the lower level ofractopamine changed. It is important to note that thelength of feeding was much shorter in the recent trial,and that may have affected the relative response toractopamine. However, it is also possible that pigs se-lected 10 yr for lean growth and lean efficiency are moresensitive to lower levels of ractopamine (5 ppm).
Variation in the Response to Ractopamine
The response to ractopamine also changes with dura-tion of feeding (Bark et al., 1992; Williams et al., 1994;Herr et al., 2001b,c). The greatest response occurs dur-ing the first 14 to 21 d and declines slowly thereafter. Inpast research, pigs fed ractopamine had higher growthrates than control pigs in both wk 5 (0.85 vs 0.73 kg/d) and wk 6 of ractopamine feeding (0.90 vs 0.86 kg/d,N = 141 per mean, Williams et al., 1994). By wk 7, theimprovement in growth rate diminished (0.81 vs 0.79kg/d). In two recent trials, pigs fed a constant level of11.6 or 20 ppm had slower growth rates and poorer feedefficiency than control pigs by the 5th wk on test (Herret al., 2001b,c). Only increasing the level of ractopaminecan increase the growth rate after 5 and 6 wk on racto-pamine (Herr et al., 2001b; Schinckel et al., 2001). Itis possible that high-lean-growth pigs have a shorterduration of response to ractopamine. Only research tri-als evaluating past and current genetic populations of

Schinckel et al.E88
Table 2. Relative responses of feeding 5 ppm vs 20 ppm ractopamine in past and recent research trials
Past trialsa Recent trialsb
Response ResponseGrowth variable 0 ppm 5 ppm 20 ppm SE 5 ppm/20 ppm 0 ppm 5 ppm 20 ppm SE 5 ppm/20 ppm
Average daily gain, g/d 834 894 916 5 0.72 884 993 1,025 13 0.90Average feed intake, kg/d 2.99 2.95 2.87 0.02 0.33 2.61 2.55 2.48 0.05 0.55Feed conversion 3.62 3.33 3.16 0.02 0.63 2.95 2.56 2.43 0.05 0.75Carcass variablesDressing percentage 73.3 73.7 74.4 0.1 0.36 73.3 74.3 74.4 0.2 0.90Percentage lean 51.8 53.9 57.5 0.1 0.37 54.7 55.3 56.2 0.3 0.5510th Rib backfat depth, cm 2.74 2.69 2.41 0.05 0.24 1.78 1.68 1.65 0.05 0.77
aSummary of 20 trials with 479, 486, and 469 pigs per ractopamine level. Percentage dissected muscle tissue. Pigs fed from 67 to 104 kgon 16% CP diets (Watkins et al., 1990; Elanco, 1999).
bSummary of 75 gilts per ractopamine level of three terminal crosses (Herr et al., 2001a). Gilts fed 18.6% CP, 1.1% lysine diets for 4 wk,starting at 83.5 kg. Percentage lean was predicted from optical probe measurements.
pigs can evaluate whether genetic selection has alteredthe ractopamine response relative to time or weighton test.
Genetic Population × Ractopamine ×Environmental Interactions
Pigs reared under average commercial conditionshave live weight growth rates from 0.70 to 0.80 kg/d, compared to 0.90 to 1.10 kg/d when reared in less-limiting, almost ideal research facilities (Holck et al.,1998; Schinckel, 1999). Lines selected for increased leanfeed efficiency, increased carcass lean percentage, andreduced feed intake can be substantially more sensitiveto poorer health status environments in terms of growthrate, feed conversion, morbidity, and mortality (Franket al., 1997; Kendall et al., 1999).
What is the expected response to ractopamine in pigsonly achieving 60% to 70% of their maximal geneticpotential observed under more ideal conditions? Willractopamine allow greater expression of the high-lean-growth pigs and overcome the environmental effects?Or will the ractopamine response be limited by theenvironment? In this case, the response to ractopaminemay be greater in the less-sensitive genetic populationsof pigs that achieve a higher percentage of their maxi-mal genetic potential of lean growth when raised undertypical commercial conditions.
Swine growth models assume that ractopamine pro-duces a consistent percentage improvement in carcasslean growth and protein accretion. The model assumesa consistent increase based on the commerciallyachieved performance levels (phenotype). The effectsof the pigs’ maximal genetic potential for lean growth(protein accretion), the environmental effects, and ge-netic × environmental interactions are not taken intoaccount.
Ractopamine by Sex Interactions
Several trials have evaluated the effect of ractopam-ine in barrows and gilts (Uttaro et al., 1993; Williams
et al., 1994; Elanco, 1999). In general, similar responsesto ractopamine on growth rate, feed intake, lean gain,and carcass measurements for barrows and gilts werefound. The responses of barrows and gilts to 20 ppmdietary ractopamine were similar for carcass character-istics, processing yields, and measures of pork quality(Uttaro et al., 1993).
One 6-wk trial evaluated the ractopamine responsewhen the levels of ractopamine increased (5, 10, and20 ppm), decreased (20, 10, and 5 ppm), or remainedconstant (11.65 ppm) for the three biweekly periods(Herr et al., 2001a). No sex × ractopamine treatmentinteractions were significant for any growth perfor-mance or carcass trait.
Another trial evaluated the effect of 20 ppm dietaryractopamine on boars, barrows, and gilts (Dunshea etal., 1993). The pigs were fed from 60 to 90 kg live weight.Ractopamine increased average daily gain in barrows(1,399 vs 1,156 g/d, P < 0.05) and gilts (1,204 vs 1,031g/d, P < 0.05), but not in boars (1,268 vs 1,276 g/d;20 ppm/0 ppm). Dietary ractopamine increased dailyprotein accretion by 26, 51, and 53 g/d in boars, gilts,and barrows, respectively.
The ratio of daily empty body lipid to protein deposi-tion was affected by sex (P < 0.001) and ractopamine(P < 0.001) without any significant sex × ractopamineinteractions. No significant sex × ractopamine interac-tions were found for empty body composition, carcassmeasurements, or organ weights. One possible explana-tion for the smaller live weight growth and protein ac-cretion response in the boars is that the dietary lysine(18.3% CP, 1.1% lysine formulated, 17.7% CP, 1.07%lysine actual values) may have been limiting (Dunsheaet al., 1993).
Summary
Overall, ractopamine has increased the carcass leangrowth rate and feed efficiency of pigs with substan-tially different genetic backgrounds. The average dailygain, feed efficiency, and carcass muscle growth variesfrom trial to trial, depending on the duration of the

Response of pigs to ractopamine E89
trial and the lysine level fed. In general, the impact ofractopamine to increase lean growth rate is greaterin genetic populations of pigs selected for increasedlean growth.
The 5 ppm level of ractopamine is effective in produc-ing substantial improvements in performance in mod-ern high-lean-gain pigs. However, the duration of theresponse to ractopamine may have decreased as a resultof genetic selection. Also, modern high-lean-gain pigsmay require diets containing higher concentrations oflysine and other essential amino acids to allow maxi-mum performance levels to be achieved.
Implications
The desirable response of ractopamine to increasedaily carcass lean gain, improve feed efficiency, andincrease carcass lean percentage has been observed ingenetic populations of substantially different leangrowth rates and carcass lean percentages. The magni-tude of the ractopamine responses increases in geneticpopulations selected for increased lean growth. Thepork industry can incorporate the use of ractopaminewith the use of selected genetic populations and im-proved management to further increase the efficiencyof pork production.
Literature Cited
Bark, L. J., T. S. Stahly, G. L. Cromwell, and J. Miyat. 1992. Influenceof genetic capacity for lean tissue growth on rate and efficiencyof tissue accretion in pigs fed ractopamine. J. Anim. Sci.70:3391–3400.
Dunshea, F. R., R. H. King, R. G. Campbell, R. D. Sainz, and Y. S.Kim. 1993. Interrelationships between sex and ractopamine onprotein and lipid deposition in rapidly growing pigs. J. Anim.Sci. 71:2919–2930.
Elanco. 1999. Paylean� Swine Nutrition Guide for Industry Profes-sionals. Elanco Animal Health, Indianapolis, IN.
Frank, J. W., B. T. Richert, A. P. Schinckel, B. A. Belstra, and A. L.Grant. 1997. Environmental effects on genetic potential for leangain. J. Anim. Sci. 75(Suppl. 1)1:37 (Abstr.).
Gu, Y., A. P. Schinckel, J. C. Forrest, C. H. Kuei, and L. E. Watkins.1991a. Effects of ractopamine, genotype and growth phase onfinishing performance and carcass value in swine. I. Growthperformance and carcass merit. J. Anim. Sci. 69:2685–2693.
Gu, Y., A. P. Schinckel, J. C. Forrest, C. H. Kuei, and L. E. Watkins.1991b. Effects of ractopamine, genotype, and growth phase onfinishing performance and carcass value in swine: II. Estimationof lean growth rate and lean feed efficiency. J. Anim. Sci.69:2694–2702.
Gu, Y., A. P. Schinckel, T. G. Martin, J. C. Forrest, C. H. Kuei,and L. E. Watkins. 1992. Genotype and treatment biases inestimation of carcass lean of swine. J. Anim. Sci. 70:1708–1719.
Herr, C. T., S. L. Hankins, A. P. Schinckel, and B. T. Richert. 2001a.Evaluation of three genetic populations of pigs for response toincreasing levels of ractopamine. J. Anim. Sci. 79(Suppl. 2):73(Abstr.).
Herr, C. T., D. C. Kendall, A. P. Schinckel, and B. T. Richert. 2001c.Effect of nutritional level while feeding ractopamine to late-finishing pigs. J. Anim. Sci. 79(Suppl. 2):73 (Abstr.).
Herr, C. T., D. C. Kendall, K. A. Bowers, S. L. Hankins, T. E. Weber,A. P. Schinckel, and B. T. Richert. 2001b. Effect of a step-up orstep-down ractopamine sequence for late-finishing pigs. J. Anim.Sci. Suppl 1. 79(Suppl. 2):49 (Abstr.).
Holck, J. T., A. P. Schinckel, J. L. Colemena, V. M. Wilt, G. Chris-tenson, E. L. Thacker, M. Spurlock, A. L. Grant, M. K. Senn,and B. J. Thacker. 1998. The influence of environment on thegrowth of commercial finisher pigs. Swine Health Prod.6:141–149.
Kendall, D. C., B. T. Richert, J. W. Frank, B. A. Belstra, S. A. DeCamp,and A. P. Schinckel. 1999. Evaluation of genotype, therapeuticantibiotic an dhealth management effects on swine lean growthrate. J. Anim. Sci. 77 (Suppl. 1):37 (Abstr.).
Mills, S. E., C. Y. Liu, Y. Gu and A. P. Schinckel. 1990. Effects ofractopamine on adipose tissue metabolism and insulin binding infinishing hogs. Interaction with genotype and slaughter weight.Domest. Anim. Endocrinol. 7:251–264.
Mitchell, A. D., M. B. Solomon, and N. C. Steele. 1990. Response oflow and high protein select lines of pigs to the feeding of thebeta-adrenergic agonist ractopamine (phenethanolamine). J.Anim. Sci. 68:3226–3232.
Schinckel, A. P. 1999. Describing the Pig. In: I. Kyriazakis (ed.) AQuantitative Biology of the Pig. pp 9–38. CABI Publishing,New York.
Schinckel, A. P., and C. F. M. De Lange. 1996. Characterization ofgrowth parameters needed as inputs for pig growth models. J.Anim. Sci. 74:2021–2036.
Schinckel, A. P., M. E. Einstein, C. T. Herr, Y. Wang, K. A. Bowers,S. L. Hankins, T. E. Weber, and B. T. Richert. 2001. Developmentof models to describe the weekly response of ractopamine. J.Anim. Sci. 79(Suppl. 1):54 (Abstr.).
Uttaro, B. E., R. O. Ball, P. Dick, W. Rae, G. Vessie, and L. E.Jeremiah. 1993. Effect of ractopamine and sex on growth, carcasscharacteristics, processing yield and meat quality characteristicsof crossbred swine. J. Anim. Sci. 71:2439–2449.
Watkins, L. E., D. J. Jones, D. H. Mowrey, D. B. Anderson, and E.L. Veenhuizen. 1990. The effect of various levels of ractopaminehydrochloride on the performance and carcass characteristics offinishing swine. J. Anim. Sci. 68:3588–3595.
Williams, N. H., T. R. Cline, A. P. Schinckel, and D. J. Jones. 1994.The impact of ractopamine, energy intake, and dietary fat onfinisher pig growth performance and carcass merit. J. Anim. Sci.72:3152–3162.
Yen, J. T., H. J. Mersmann, D. A. Hill, and W. G. Pond. 1990. Effectsof ractopamine on genetically obese and lean pigs. J. Anim. Sci.68:3705–3712.
Yen, J. T., J. A. Nienaber, J. Klindt, and J. D. Crouse. 1991. Effectof ractopamine on growth, carcass traits, and fasting heat pro-duction of U.S. contemporary crossbred and Chinese Meishanpure- and crossbred pigs. J. Anim. Sci. 69:4810–4822.

Effects of manipulating protein and phosphorus nutrition of feedlot cattleon nutrient management and the environment1
T. J. Klopfenstein2 and G. E. Erickson
Department of Animal Science, University of Nebraska, Lincoln 68583-0908
ABSTRACT: Feedlot nutrition will play a role inmeeting challenges such as nutrient management. Ni-trogen and phosphorus are two nutrients that are cur-rently studied in this context. One nutritional methodis formulating diets not to exceed requirements for ni-trogen and phosphorus. Requirements are different forcalves and yearlings. The requirements also changeduring the finishing period. Phosphorus requirementshave not been extensively studied for feedlot cattle be-tween 270 and 600 kg. Therefore, P requirements stud-ies were conducted to determine the P requirement ofcalves (265 kg) and yearlings (385 kg). The requirementwas not detected with P levels as low as 0.14 (yearlings)and 0.16% (calves) of diet DM based on performanceand bone ash. Compared to NRC-predicted P require-ments, P intakes ranged from 76 to 190% (calves) and71 to 162% (yearlings). In separate nutrient balanceexperiments, decreasing dietary P to NRC-predictedrequirements (0.22 to 0.28%) did not influence gain butdecreased P input by 33 to 45% and excretion by 40 to
Key Words: Nitrogen, Phosphorus, Cattle Feeding, Nutrient Requirements, Waste Management
2002 American Society of Animal Science. All rights reserved. J. Anim. Sci. 80(E. Suppl. 2):E106–E114
Introduction
Cattle feedlots continue to increase in size. This con-centrates manure and the nutrients contained therein.For example, a feedlot with a 50,000-animal capacitywill feed over 5 × 10⁶ bushels of corn per year. Thisrequires over 12,141 ha (30,000 acres) of corn to meetthe needs of the cattle. In order to be environmentallysustainable, the manure from that feedlot should bespread back on that 12,141 ha. That is a radius of about6.4 km. So what is the problem?
There are many problems relating to manure distri-bution. Locally, one problem is that most corn is raised
1Published with the approval of the director as paper no. 13581,journal ser., Nebraska Agric. Res. Div.
2Correspondence: E-mail: [email protected] July 26, 2001.Accepted February 27, 2002.
E106
50% compared to the industry average (0.35% P). Themetabolizable protein (MP) system was recentlyadopted and may allow more accurate diet formulationfor protein, thereby decreasing N excretion. Comparedto the industry average (13.5% CP) and formulationwith the CP system, using the NRC model and phase-feeding not to exceed MP requirements over the feedingperiod decreased N inputs by 10 to 20% for calves andyearlings without affecting ADG. Decreasing N inputsled to a concomitant decrease in N excretion (12 to 21%)and volatilization (15 to 33%) in open-dirt feedlot pens.Nitrogen losses are variable with time of year, withaverages of 60 to 70% of excreted N lost during thesummer months and 40% lost from November to Mayfeeding periods. Protein requirements are continuallybeing refined as more research data are collected. How-ever, formulation to meet and not exceed protein re-quirements and removal of P supplements are im-portant nutritional management options to help feed-lots become more environmentally sustainable.
in a rotation with soybeans, which may increase thearea needed in our example. Further, many crop pro-ducers do not want to use manure for various reasons.An estimate in Nebraska is that only 30% of crop pro-ducers are willing to accept manure as a fertilizer. Inother situations, the feedlot may be surrounded by landthat is not cropland, such as pasture land.
Probably a bigger problem is the regional or nationalproblem of grain/manure distribution. For example, ifIowa or Nebraska corn is shipped to Texas for feedingto cattle there, the manure produced from those cattleshould logically be shipped back to the Iowa or Ne-braska cornfields.
There are two basic problems we face with feedlotmanure. First is the distribution problem mentionedabove. The second problem is the volatilization of nitro-gen in the form of ammonia from feedlot surfaces. Ifwe minimize nutrients fed to feedlot cattle, then logi-cally we minimize the nutrients excreted and minimizethe environmental impact.

Nutrition impact on nutrient management E107
Table 1. Effect of dietary P concentrations on finishing performance(Erickson et al., 1999)
Phosphorus, % of DM
Item 0.14 0.19 0.24 0.29 0.34 SE
P intake, g/d 15.9 19.7 27.6 32.1 36.4 0.7Initial wt, kga 385 384 390 385 385 11Final wt, kgab 567 553 568 566 545 15DMI, kg/da 11.4 10.4 11.4 11.1 10.7 0.3ADG, kg/da 1.76 1.62 1.71 1.75 1.53 0.09ADG:DMIa 0.154 0.157 0.149 0.158 0.142 0.007
aNo significant linear, quadratic, or cubic effects due to P (P > 0.10).bDetermined as hot carcass weight divided by 62% dress.
Results and Discussion
Phosphorus
Phosphorus does not volatilize from the pen surface,so whatever is excreted must be distributed to cropland. In order to minimize the amount fed, it is abso-lutely necessary to know the requirements for phospho-rus. The NRC (1996) requirements are calculated usingthe factorial approach. For feedlot cattle, it is the totalof P for maintenance and gain. The requirement formaintenance was determined with animals at mainte-nance and may be less per kilogram of BW for fattercattle. The requirement for gain is based on 50-yr-olddata on dairy cattle. It is based on the P content ofprotein gain. Further, the requirement assumes 68%true absorption of P, which is difficult to measure andmay be higher or lower and may depend on the diet(forage vs grain).
Erickson et al. (1999) attempted to determine the Prequirement of yearling cattle in the feedlot. We areunaware of other reports in which P requirement wasdetermined using a dose response in feedlot cattle. Be-cause corn is the primary ingredient in feedlot dietsand because it contains about 0.32% P, it was difficult todevelop diets deficient in P that still gave performancecomparable to commercial feedlot cattle. Two productswere used from corn milling industries: corn bran andbrewers grits. Neither contains the germ, which hasmuch of the P. A control diet was developed that con-tained 0.14% P and produced 1.76 kg/d gain and 0.154feed efficiency.
Phosphorus was added to the control diet as monoso-dium phosphate. There was no response in cattle perfor-mance to P additions (Table 1). Further, there was noeffect of P level on bone ash or bone breaking strength.This is strong evidence that yearling cattle (385 kginitial weight) have a P requirement of 0.14% or less.The NRC (1996) requirement for these cattle (avg wt= 476 kg) was 0.2% of diet dry matter.
These data were somewhat surprising, and it wasbelieved that younger and lighter cattle might (should)have higher requirements. A second experiment wasconducted (Erickson et al., 2002) with calves of 265 kg
initial weight. The control diet contained 0.16% P andgraded levels of P were added as monosodium phos-phate. There was no response in calf performance tolevels of P above 0.16% (Table 2). The NRC (1996) re-quirement for this average weight (418 kg) is 0.21% ofdiet dry matter.
We conclude that the P requirement is far below the0.32% P found in corn and that supplemental P shouldnever be added to corn-based feedlot diets. The problemis that corn contains too much P and there does notseem to be a logical way to overcome that problem.Perhaps corn hybrids can be selected or genetically en-gineered to be lower in P.
By-product feeding accentuates the problem of ov-erfeeding P. For example, in the production of distillersgrains from corn, the starch is fermented to alcoholand CO2. This concentrates the remaining nutrients,including P, by about three times. The resulting distill-ers grains have about 0.9% P. Because of increases innumbers of fuel alcohol plants, wet distillers grains areplentiful and can be fed up to 40% of the diet (Larsonet al. 1993). The resulting diet will contain about 0.55%P, which is three to four times the requirement. Thisemphasizes the manure distribution issue raised pre-viously. Because 75% of the corn now goes through thealcohol plant before the by-product is fed to the cattle,the land area needed to produce the corn has doubledand the area upon which to spread the manure hasdoubled.
Nitrogen
The metabolizable protein (MP) system presented inthe 1996 NRC allows us to more accurately balancefeedlot diets so that requirements are met but proteinis not oversupplied. Protein fed above the requirementmay be expensive and may lead to environmental prob-lems. The MP system separates protein needs into de-gradable intake protein (DIP) needs by the rumen mi-croorganisms and MP needs by the animal. The MP isthe sum of digestible microbial true protein and digest-ible undegraded intake protein (UIP). The challenge isto just meet both requirements without overfeeding.

Klopfenstein and EricksonE108
Table 2. Effects of dietary P on finishing performance for calves fedvarying levels of P (Erickson et al., 2002)
Phosphorus, % of DM
Item 0.16 0.22 0.28 0.34 0.40 SE Linear Quadratic
P intake, g/d 14.2 20.2 23.4 31.7 35.5 0.7 0.01 —Initial wt, kg 268 265 264 264 264 6 0.61 0.75Final wt, kga 579 578 538 592 564 11 0.69 0.33DMI, kg/d 8.9 9.0 8.2 9.3 8.8 0.2 0.92 0.32ADG, kg/d 1.52 1.53 1.34 1.61 1.47 0.04 0.86 0.28ADG:DMI 0.171 0.171 0.163 0.174 0.166 0.004 0.65 0.79
aDetermined as hot carcass weight divided by 62% dress.
DIP Requirements
Level 1 of the NRC (1996) model sets the dietaryDIP requirement equal to bacterial crude protein (BCP)production. Bacterial CP is calculated with the equationBCP = 0.13 (eNDFadj) (TDN; where 0.13 equals micro-bial N efficiency, eNDFadj is an adjustment factor thatlowers microbial N efficiency for diets that cause lowruminal pH because of low roughage levels, and TDNequals the total digestible nutrient content of the diet[g/d]). Adjusted microbial N efficiency values for typical90%-concentrate finishing diets are usually between0.08 and 0.09 of TDN, depending on the roughagesource.
Carbohydrate digestion in the rumen is likely themost accurate predictor of BCP synthesis and is usedin Level 2 of the NRC (1996) model. However, few dataare currently available for the rates of passage anddigestion of various carbohydrate fractions in feedstuffscommonly fed in feedlot diets. Therefore, dietary TDNis used in Level 1 of the NRC (1996) model because itis currently the most accurate and readily availableestimate of energy value for a diet. However, becauseLevel 1 of the NRC (1996) model uses TDN to predictthe dietary DIP requirement, factors that shift the siteof digestion of the dietary nutrients, such as grain pro-cessing, are not appropriately accounted for.
We have conducted several trials evaluating the ef-fect of corn processing method on the dietary DIP re-quirement of finishing steers. Shain et al. (1998) con-ducted two finishing trials with a total of 304 yearlingsteers. Steers were fed 92.5%-concentrate, dry-rolledcorn-based diets that were supplemented with 0, 0.88,1.34, and 1.96% urea (DM basis). Steers did not respondto dietary urea levels above 0.88%, indicating that thedietary DIP requirement for a dry-rolled corn-baseddiet was met at 6.4% of DM.
Cooper et al. (2001) conducted three trials to evaluatethe effect of corn processing on the dietary DIP require-ment of finishing steers. In Trial 1, 252 steers were fed90%-concentrate, high-moisture corn-based diets thatcontained 0, 0.4, 0.8, or 1.2% urea (DM basis). Nonlinearanalysis predicted maximal feed efficiency at 1.09%urea, which provided a dietary DIP value of 10.2% ofDM. In Trial 2, 264 steers were fed 90%-concentrate
steam-flaked corn-based diets that contained 0, 0.4, 0.8,1.2, 1.6, or 2.0% urea (DM basis). Nonlinear analysispredicted maximal feed efficiency at 0.83% urea, whichprovided a dietary DIP value of 7.1% of DM. In Trial3, 90 individually fed steers were fed 90%-concentratedry-rolled, high-moisture, or steam-flaked corn-baseddiets. Urea was factored across diets at 0, 0.5, 1.0, or2.0% of DM. Dietary CP, DIP, and finishing steer perfor-mance are shown in Table 3. For the dry-rolled corn-based diet, nonlinear analysis could not predict a re-quirement because feed efficiency was not improvedbeyond the first increment of urea, suggesting that theDIP requirement was met at 6.3% of DM. For the high-moisture corn-based diet, nonlinear analysis predictedmaximal feed efficiency at 1.14% urea, which provideda dietary DIP value of 10.0% of DM. For the steam-flaked corn-based diet, nonlinear analysis predictedmaximal feed efficiency at 1.64% urea, which provideda dietary DIP value of 9.5% of DM.
These data suggest that dietary DIP requirementsfor dry-rolled, high-moisture, and steam-flaked corn-based diets are approximately 6.3, 10.0, and 8.3% ofDM, respectively. Level 1 of the NRC (1996) model pre-dicts that the dietary DIP requirement for a 90%-con-centrate dry-rolled corn-based diet is approximately6.8% of DM. The value of 6.3% is in close agreementwith the predicted value. Milton et al. (1997), in twoseparate finishing trials, found dietary DIP require-ments of 6.9 and 7.1% of DM for 90%-concentrate dry-rolled corn-based diets. Therefore, it appears Level 1of the NRC (1996) model is relatively accurate in pre-dicting the dietary DIP requirement for dry-rolled corn-based diets. However, Level 1 does not appropriatelyaccount for the increased ruminal starch digestion, andthus BCP production, in high-moisture and steam-flaked corn-based diets. These data suggest that high-moisture and steam-flaked corn-based diets require upto 50% more dietary DIP than a comparable dry-rolledcorn-based diet.
UIP Requirements
Dietary UIP requirements are equal to the MP re-quirement of the animal minus MP supplied from BCP.Often, typical corn-based finishing diets do not need to

Nutrition impact on nutrient management E109
Table 3. Dietary protein composition and finishing performance for steers feddry-rolled, high-moisture, and steam-flaked corn-based diets (Cooper et al., 2001)a
Urea, % of DM
Treatment 0 0.5 1.0 1.5 2.0
Crude protein, % of DMb 9.5 10.9 12.4 13.8 15.3
DIP, % of DMb
DRC 4.8 6.3 7.7 9.2 10.6HMC 6.7 8.1 9.6 11.0 12.5SFC 4.7 6.1 7.6 9.0 10.5
DM intake, kg/dDRC 9.9 9.6 10.0 10.6 10.4HMC 10.5 9.6 9.7 9.9 9.5SFC 8.1 10.1 9.5 10.0 8.5
Daily gain, kg/dDRC 1.54 1.64 1.54 1.80 1.68HMC 1.68 1.57 1.60 1.70 1.51SFC 1.36 1.72 1.62 1.85 1.57
Gain/feedDRCc 0.156 0.172 0.154 0.170 0.162HMCc 0.161 0.163 0.165 0.172 0.160SFCc 0.168 0.171 0.179 0.186 0.186
aDRC = dry-rolled corn, HMC = high-moisture corn, SFC = steam-flaked corn.bBased on NRC tabular values.cNLIN predicts 6.3, 10.1, and 9.5% DIP requirement for DRC, HMC, and SFC, respectively.
be supplemented with additional UIP because base-dietUIP and MP from BCP are sufficient to meet the needsof the animal. Corn usually contains between 8 and10% CP, with up to approximately 60% of the CP asUIP. In diets containing 85% corn, this results in 4.1to 5.1% of the diet being UIP (NRC, 1996). We havefound that 4.6% UIP in addition to BCP is sufficient tomeet the MP needs of finishing yearling steers (Shainet al., 1994; Sindt et al., 1994), indicating supplementalUIP would not be needed in this case. However, supple-mental UIP may be needed in diets with lower inherentUIP such as high-moisture corn, or in animals with highMP needs such as rapidly growing, lightweight calves.
A good example of the difficulty in balancing for MP,without overfeeding, is shown in Table 4. This diet con-tained 25% wet corn gluten feed and 60% steam-flakedcorn. The UIP value of steam-flaked corn is at least ashigh as that of dry-rolled corn. As indicated previously,the site of starch digestion is shifted to the rumen whensteam-flaked corn is fed. This increases BCP production
Table 4. Effect of level of CP in feedlot diets containing corn gluten feedand steam-flaked corna
CP levelb
Item 13.0% 13.7% 14.4% SE
Initial wt, kg 288 288 287 —ADG, kgc 1.59 1.69 1.69 0.04DMI, kgc 9.23 9.51 9.47 0.14Gain:feedc 0.172 0.178 0.178 0.003
aBlock et al., 2002, average of 25% corn gluten feed in diet DM.bSupplemental protein supplied by urea.cLinear effect of CP level (P < 0.05).
and increases DIP requirement. The wet corn glutenfeed increases rumen pH (Krehbiel et al., 1995) andthereby increases microbial efficiency, further increas-ing BCP production and the DIP requirement.
Crude protein level was increased from 13% to 13.7%and to 14.4% by addition of urea. Gains and gain:feedincreased with added protein and we estimate the crudeprotein requirement to meet the DIP requirement isabout 14%. When these values are put into the NRC(1996) model, the supply of MP is much greater thanthat required by the cattle (Table 5). These were calf-fed steers and were about 318 kg when they reachedthe finisher diet following appropriate step-up diets. Atthat point the model predicts a surplus of 53 g/d of MP.This is equivalent to 0.58 percentage units of CP in thediet. At the midpoint of the feeding period, the calveswere getting 105 g/d more MP than they needed, whichwas equivalent to 1.12 percentage units of CP in thediet. At market weight (590 kg), the cattle were getting190 g/d more MP than they required, which was equiva-

Klopfenstein and EricksonE110
Table 5. Metabolizable protein supplies to calf-fed steers fed corn gluten feedand steam-flaked corna
Body weight, kg
Item 318 443 590
Degradable intake proteinSupply/required, g/d 830 874 916
Metabolizable proteinSupply, g/d 843 911 966Required, g/d 790 806 776Excess protein, g/d 53 105 190Excess protein, % DM 0.58 1.12 1.90
aNRC (1996).
lent to 1.90 percentage units of CP. It appears that itwas necessary to meet the DIP requirement eventhough MP was is excess.
MP Requirements
Level 1 of the NRC (1996) model predicts largechanges in protein requirements throughout the feed-ing period due to changes in intake, body weight, andcomposition of gain. The DIP requirement increasesdue to a gradual increase in intake as body weightincreases (Figure 1). The UIP requirement decreasesas body weight increases due to both a larger supplyof BCP and from a lower requirement because the com-position of gain is increasingly more fat and less lean(Figure 1). The overall MP requirement for the animaldoes not change significantly with time on feed becauseas the MP needed for gain decreases, the MP neededfor maintenance increases. Figure 1 was developed withperformance parameters described in Table 6, whichwill be discussed later, and assumes a 90%-concentratedry-rolled corn-based diet with alfalfa as the roughagesource. Because the type of protein needed (DIP vs UIP)to meet the MP requirement changes with days on feed,a single finishing diet fed through the feeding period
Figure 1. Metabolizable protein (MP), degradable in-take protein (DIP), and undergradable intake protein(UIP) requirements of calf-fed steers predicted by NRC(1996).
is inadequate, being deficient up to body weight forwhich it was balanced and excessive from that pointon. Therefore, a series of finishing diets fed in sequen-tial order in order to meet, but not exceed, both the DIPand UIP requirements throughout the feeding period(phase-feeding) should be beneficial.
There are several reasons for feeding protein levelsat, but not above, requirements. If UIP is supplementedto meet the MP requirements of finishing calves earlyin the feeding period, it is economically beneficial toremove this costly form of protein supplementationwhen it is no longer needed to maintain maximum per-formance. However, we feel the primary reason for feed-ing protein levels at, but not above, the requirement ispending environmental regulations. In trials conductedat the University of Nebraska (Erickson and Klop-fenstein, 2001) yearling steers were fed finishing dietscontaining 13.5% crude protein, which was approxi-mately 123% of the predicted requirement. During the137-d feeding period from May to September, each steerexcreted approximately 29 kg of nitrogen onto the pensurface, of which approximately 71% volatilized intothe air. In 192-d calf-finishing trials conducted fromOctober to May, steers excreted approximately 32 kgof nitrogen onto the pen surface, of which approximately41% volatilized into the air.
Figure 2. Relationship of N in manure to OM in manure(Bierman et al., 1999).

Nutrition impact on nutrient management E111
Table 6. University of Nebraska ARDC Beef Feedlot performanceparameters for finishing calves
Body weight, DM intake, DM intake, Daily gain,kg kg % of body weight kg Gain/feed
272 8.2 3.00 1.6 0.200318 8.6 2.71 1.6 0.189363 9.1 2.50 1.6 0.179408 9.5 2.33 1.6 0.172454 9.8 2.15 1.6 0.167499 10.0 2.00 1.6 0.164544 10.2 1.88 1.6 0.159590 10.4 1.77 1.6 0.156431a 9.5a 2.29a 1.6a 0.172a
aValues in this row are averages.
It is important to note that in order to utilize phase-feeding as a nutrient management strategy withoutadversely affecting performance, one must know or beable to accurately predict the performance of a givengroup of cattle. Past feeding history is likely the bestindication of future performance. We have summarizedthe performance of finishing calves at the University ofNebraska ARDC Beef Feedlot (Table 6). This summarycontains approximately 640 animals fed as calves from1994 to 1997 on a high-concentrate corn-based diet. Allanimals were implanted with at least one trenboloneacetate-combination implant and did not have a sig-nificant treatment effect in their respective trial. Inter-mediate performance was based on intake records andintermediate weights that were pencil-shrunk 4%. The1996 NRC model does not predict intake and NE re-quirement very well early and late in the feeding be-cause the equations are based on feeding period av-erages.
Erickson and Klopfenstein (2001) conducted four fin-ishing trials, two with calf-feds and two with yearlings,to evaluate phase-feeding diets in order to minimize Nexcretion vs feeding a typical high-concentrate finishing
Table 7. Performance of finishing yearlings and calves fed either a standard finishingdiet or phase-fed multiple finishing diets in order to match protein requirements
(Erickson and Klopfenstein, 2001)
Treatmenta
Urea, % of DM Conventional Phase-fed P-value
YearlingsDM intake, kg 11.4b 11.1c 0.03Daily gain, kg 1.81 1.85 0.27Gain/feed 0.158b 0.166c 0.01N intake, kg/steer 33.1 27.0 0.01
CalvesDM intake, kg 9.2 9.4 0.21Daily gain, kg 1.56 1.54 0.43Gain/feed 0.170b 0.164c 0.04N intake, kg/steer 37.0 32.8 0.01
aStandard diet balanced to contain 13.5% CP; phase-fed diets were fed in sequential order and werebalanced to match MP requirements throughout the feeding period.
b,cP < 0.05.
diet that was formulated to industry standards and fedthroughout the feeding period. The standard diet was92.5% concentrate and formulated to contain 13.5% CP.Phase-fed diets were also 92.5% concentrate and formu-lated to match DIP, UIP, and MP requirementsthroughout the feeding period. For yearlings, threephase-fed finishing diets were used that were fed for28, 28, and 54 d. For calves, eight phase-fed finishingdiets were used that were switched every 14 d, theeighth diet being fed for 73 d. Finishing performanceand N balance are shown in Table 7. In yearlings,phase-feeding diets to match protein requirements im-proved feed/gain by 5% compared to the standard 13.5%CP diet. Nitrogen excretion to the pen surface was re-duced by 22% and total N volatilized into the atmo-sphere was reduced by 32% for the phase-fed diets com-pared to the standard diet. In finishing calves, phase-feeding reduced feed efficiency by approximately 4%compared to the standard diet. Nitrogen excretion tothe pen surface was reduced by 13% and total N volatil-ized into the atmosphere was reduced by 15% for thephase-fed diets compared to the standard diet. Differ-ences in N volatilization between the yearlings and

Klopfenstein and EricksonE112
Table 8. Organic matter (OM) balance in the feedlot for the yearling and calfexperiments separated by dietary treatment (all values expressed as kg/steer
over the entire feeding period) (Erickson and Klopfenstein, 2001)
Yearlings (132 d) Calves (183 d)
Item Control Phase SE P-value Control Phase SE P-value
Intake 1,463 1,399 12 0.01 1,508 1,595 17 0.01Excreteda 302 418 3 0.01 339 425 4 0.01Manure 110 180 6 0.01 367 396 24 0.38Soilb 19 −34 14 0.02 −34 −39 17 0.83Runoff 20 15 2 0.08 8 13 1 0.02Volatilizedc 153 257 16 0.01 −2 55 26 0.13Manure + soild 129 146 15 0.43 333 358 25 0.50
aOM excretion calculated from digestibility data from corn and corn bran diets.bSoil is core balance on pen surface before and after each experiment; negative values suggest removal
of nutrient present before the experiment.cVolatilized calculated as excretion minus manure minus soil minus runoff.dManure + soil corrects what was hauled at cleaning by soil nutrients remaining or removed from pen
surface.
calves are likely due to cooler temperatures during thecalf-finishing studies (November to May) compared tothe yearling-finishing studies (May to October).
Bierman et al. (1999) studied the effect of level andsource of dietary fiber on mass balance of nutrients onfeedlot pens. They fed an all-concentrate diet to mini-mize organic matter excreted. A 7.5% roughage additionincreased fecal output, and adding 41.5% wet corn glu-ten feed further increased fecal output.
The authors hypothesized that fiber digestion in thehindgut would shift nitrogen excretion from urine tofeces. Only 19% of the nitrogen was excreted in thefeces by cattle fed the all-concentrate diet, whereas 31%was excreted by cattle fed the wet corn gluten feed diet.
The all-concentrate cattle produced about 88 kg or-ganic matter that was available for removal as manure.The cattle fed wet corn gluten feed produced about 189
Table 9. Nitrogen (N) balance in the feedlot for the yearling and calf experimentsseparated by dietary treatment (all values expressed as kg/steerover the entire feeding period) (Erickson and Klopfenstein, 2001)
Yearlings (132 d) Calves (183 d)
Item Control Phase SE P-value Control Phase SE P-value
Intake 33.1 27.0 0.3 0.01 37.0 32.8 0.4 0.01Retentiona 3.6 3.6 0.02 0.80 4.6 4.6 0.03 0.28Excretionb 29.5 23.4 0.3 0.01 32.4 28.2 0.4 0.01
Manure 5.9 8.9 0.3 0.01 19.8 18.9 1.2 0.60Soilc 1.7 0.4 0.6 0.03 −1.7 −2.9 0.8 0.28Runoff 1.0 0.7 0.1 0.07 1.0 1.0 0.1 0.74Volatilizedd 20.9 14.2 0.7 0.01 13.3 11.3 1.4 0.32% volatilized 70.9 60.7 — — 41.1 40.1 — —Manure + soile 7.6 8.5 0.7 0.39 18.1 15.9 1.3 0.24
aN retention based on ADG, NRC equation for retained energy and retained protein.bN excretion calculated as intake minus retention.cSoil is core balance on pen surface before and after each experiment; negative values suggest removal
of nutrient present before initiation of experiment.dVolatilized calculated as excretion minus manure minus soil minus runoff.eManure + soil corrects what was hauled at cleaning by soil nutrients remaining or removed from pen
surface when compared with nutrients on the pen surface before the experiment.
kg organic matter available for cleaning. The all-con-centrate diet has appeared as “good news” in the pastbecause less manure was available for “disposal.” How-ever, Bierman et al. (1999) showed that in order tobe able remove more nitrogen in the manure, it wasnecessary to remove more organic matter as well (Fig-ure 2).
Mass Balance in the Feedlot
The majority, but certainly not all, of the cattle arefed in the plains states of the United States. Thesefeedlots are nearly all outside dirt pens. Typically, pensare cleaned (manure removed) when cattle within thepens are sold and prior to a new lot of cattle beingplaced in the pen. That means that it is normal formanure to accumulate over a 120- to 140-d period.

Nutrition impact on nutrient management E113
Table 10. Phosphorus (P) balance in the feedlot for the yearling and calf experimentscombined across both years (values expressed as kg/steer; 132 d for yearlings
and 183 d for calves) (Erickson et al., 2000)
Yearlings Calves
Item Control Phase SE P-value Control Phase SE P-value
Intake 5.83 3.28 0.05 0.01 6.81 4.50 0.07 0.01Retentiona 0.87 0.88 0.01 0.82 1.12 1.11 0.01 0.24Excretionb 4.95 2.40 0.05 0.01 5.69 3.39 0.07 0.01
Manure 2.36 2.48 0.13 0.54 6.61 5.55 0.54 0.24Runoff 0.22 0.11 0.03 0.04 0.06 0.11 0.02 0.28Soilc 0.26 −1.40 0.15 0.01 −1.48 −2.36 0.15 0.02Differenced 2.12 1.21 0.11 0.01 0.50 0.10 0.41 0.52Manure + core 2.62 1.08 0.15 0.01 5.13 3.19 0.41 0.03
aP retention based on ADG, NRC equation for retained energy, retained protein and P.bP excretion calculated as intake minus retention.cSoil is core balance on pen surface before and after each experiment; negative values suggest removal
of phosphorus present before the experiment.dDifference calculated as excretion minus manure minus soil minus runoff. These values indicate that
not all the P that was excreted is being recovered.
Erickson et al. (2000) and Erickson and Klopfenstein(2001) have conducted mass balance studies to deter-mine the fate of the N and P prior to manure removal.The cattle used were referred to previously in the dis-cussion on phase-feeding. The cattle were fed conven-tional diets with 13.5% CP and 0.35% P. The phase-fedcattle were fed 11.6% CP and 0.23% P. Calves were fedfrom November to May and yearlings were fed May toOctober over 2 yr. Pens had eight steers each and therewere 12 pens for each yearlings and calves over the 2 yr.
Excretion of OM by the cattle was calculated frommeasured DMI and indigestibility measured in diges-tion trials. Retention of N and P was estimated fromactual steer gains and NRC (1996) equations. Runoffwas quantified and analyzed for N and P. Soil coresamples were taken from the pen surface prior to andat the conclusion of studies (after manure removal).The cores were analyzed for N and P to account for Nand P not removed or for soil removal with the manure.Finally, manure was sampled, weighed, and composted.
More OM was excreted by phase-fed than by controlcattle (Table 8). About 57% of the OM was volatilizedduring the summer (yearlings), whereas only 6% wasvolatilized in the winter (calves).
Phase-fed steers excreted less N than control steers(Table 9). Volatilization was greater (60 to 70%) in thesummer than in the winter (40%). When weighted fortime of year and cattle on feed at different times of theyear, we calculated the average volatilization loss to be50.8% of the N excreted for both control and phase-feddiets (Erickson and Klopfenstein, 2001). In the summer,phase feeding reduced N intake by 18%, which reducedexcretion by 21%. Because more OM was produced andremoved as manure, a greater percentage of N wasalso removed in the manure and volatilization lossesexpressed as total weight were reduced 32% by phasefeeding.
Phase feeding reduced P intake by 51% for the year-lings and 41% for the calves (Table 10). Because the P
is not volatilized, it is all recovered in the manure orrunoff. Phase feeding reduced P removal in the manureby 59% for yearlings and 38% for the calves. If P hadbeen fed at 0.16% of the diet, which is the level wepropose is the requirement, then the reduction in Pexcretion would have been 65 to 70% compared to thecontrol diet.
Conclusions
The phosphorus requirement for feedlot cattle is low(0.14 to 0.20%). Because corn and corn by-products con-tain more P than the cattle require, and because all ofthe P is recovered in runoff and manure, P becomes adistribution problem for cattle feedlots. With currenttechnology, it is not clear how to practically reduce Pexcretion in feedlot cattle below that provided from cornalone. The current best management practice is to re-move all supplemental P.
The excretion of N can be reduced from current levelsif the MP system is utilized. There may be too muchUIP in corn and corn by-products so that MP is overfed,excess N is excreted, and all of the excess is lost asammonia from dirt feedlots. Because the protein inhigh-moisture corn or barley is more degradable, theseenergy sources can be used to reduce MP supplied andtherefore N excreted and ammonia volatilized. Con-versely, steam-flaked corn and some by-products in-crease MP supplies, N excretion, and N volatilization.There is a limit to how much we can reduce ammoniaemissions through nutrition. Other means such as al-ternative waste handling systems may be necessary inorder to further reduce ammonia emissions.
Implications
Phosphorus and nitrogen present distribution prob-lems for concentrated cattle feedlots and nitrogen vola-tilization as ammonia is an air-quality concern. The P

Klopfenstein and EricksonE114
requirement is lower than previously believed, but cornand corn by-products have more P than is required,making it difficult to reduce P excretion. The metaboliz-able protein system allows us to minimize N (protein)fed in many situations but not all. Ammonia volatiliza-tion can be reduced through nutrition, but further tech-nology is needed to minimize losses.
Literature Cited
Bierman, S., G. E. Erickson, T. J. Klopfenstein, R. A. Stock, andD. H. Shain. 1999. Evaluation of nitrogen and organic matterbalance in the feedlot as affected by level and source of dietaryfiber. J. Anim. Sci. 77:1645–1653.
Block, H., C. Macken, T. Klopfenstein, R. Cooper, and R. Stock. 2002.Crude protein and wet corn gluten feed levels for steam flakedcorn finishing diets. Nebraska Beef Cattle Rep. MP 79-A:68–71, Lincoln.
Cooper, R. T. Milton, T. Klopfenstein, and D. Jordon. 2001. Effect ofcorn processing on degradable intake protein requirement offinishing cattle. Nebraska Beef Cattle Rep. MP 76-A:54–57,Lincoln.
Erickson, G. E., and T. Klopfenstein. 2001. Managing N inputs andthe effect on N volatilization following excretion in open-dirtfeedlots in Nebraska. Nitrogen in the Environment. ScientificWorld J. 52:830–835.
Erickson, G. E., T. J. Klopfenstein, C. T. Milton, D. Brink, M. W.Orth, and K. M. Whittet. 2002. Phosphorus requirements offinishing feedlot calves. J. Anim. Sci. (In press).
Erickson, G. E., T. J. Klopfenstein, C. T. Milton, D. Hanson, and C.Calkins. 1999. Effect of dietary phosphorus on finishing steerperformance, bone status, and carcass maturity. J. Anim. Sci.77:2832–2836.
Erickson, G. E., C. T. Milton, and T. J. Klopfenstein. 2000. Dietaryphosphorus effects on performance and nutrient balance in feed-lots. In: Proc. 8th Int. Symp. Anim. Agric. Food ProcessingWastes. Am. Soc. Agric. Eng., St. Joseph, MI. pp 10–17.
Krehbiel, C. R., R. A. Stock, D. W. Herold, D. H. Shain, G. A. Ham,and J. E. Carulla. 1995. Feeding wet corn gluten feed to reducesubacute acidosis in cattle. J. Anim. Sci. 73:2931–2939.
Larson, E. M., R. A. Stock, T. J. Klopfenstein, M. H. Sindt, and R.P. Huffman. 1993. Feeding value of wet distillers byproducts forfinishing ruminants. J. Anim. Sci. 71:2228–2236.
Milton, C. T., R. T. Brandt, Jr., and E. C. Titgemeyer. 1997. Ureain dry-rolled corn diets: finishing steer performance, nutrientdigestion, and microbial protein production. J. Anim. Sci.75:1415–1424.
NRC. 1996. Nutrient Requirements of Beef Cattle. 7th ed. NationalAcademy Press, Washington, DC.
Shain, D. H., R. A. Stock, T. J. Klopfenstein, and D. W. Herold.1998. Effect of degradable intake protein level on finishing cattleperformance and ruminal metabolism. J. Anim. Sci. 76:242–248.
Sindt, M. H., R. A. Stock, and T. J. Klopfenstein. 1994. Urea versusurea and escape protein for finishing calves and yearlings. Anim.Feed Sci. Technol. 49:103–117.

Cellular energy expenditure and the importance of uncoupling1
M.-E. Harper2, A. Antoniou, L. Bevilacqua, V. Bezaire, and S. Monemdjou
Department of Biochemistry, Microbiology and Immunology, Faculty of Medicine, andCentre for Catalysis Research and Innovation, University of Ottawa, Ottawa, Canada K1H 8M5
ABSTRACT: Just as total body energy expenditurein animals can be broken down into that which supportsresting energy metabolism, work, growth, and so on,cellular energy expenditure can similarly be subclassi-fied. The objective in this review is to examine the meta-bolic origins of cellular energy expenditure, with anemphasis on mitochondrial uncoupling. Mitochondrialuncoupling refers to the dissociation of energy substrateoxidation from the mitochondrial synthesis of ATP. Un-coupling can occur during states of high energy expendi-ture, as in brown adipose tissue (BAT), or during statesof metabolic rest, as in many other tissues. In BAT,uncoupling protein 1 (UCP1) activity can cause veryhigh rates of energy expenditure for the purpose ofthermogenesis (heat production). While mitochondrialuncoupling also occurs in other cells of the body, itis of greatest importance to fractional rates of energy
Key Words: Energy Expenditure, Heat Production, Metabolism, Mitochondria, Proton Pump, Proteins
2002 American Society of Animal Science. All rights reserved. J. Anim. Sci. 80(E. Suppl. 2):E90–E97
Introduction
Total body energy expenditure in animals can becategorized into subclasses of expenditure supportingbasal metabolic rate (BMR), growth, pregnancy andlactation, diet-induced thermogenesis, cold-inducedthermogenesis, and exercise-induced thermogenesis.BMR normally accounts for the largest single fractionof total energy expenditure in animals. The metabolicunderpinnings of BMR have been studied largely byexamining the major energy demands at the tissueand cellular levels and extrapolating the significanceof such processes to the level of the whole body.
The overall aim of this brief review is to examinethe metabolic origins of a component of cellular energy
1The authors acknowledge support from the Natural Sciences andEngineering Research Council of Canada (M.-E.H) and The CanadianFoundation for Innovation (M.-E.H).
2Correspondence: 451 Smyth Rd. (phone: 613 562-5800 x8235; fax:613 562-5440; E-mail: [email protected]).
Received July 25, 2001.Accepted March 4, 2002.
E90
expenditure during periods of relative metabolic rest.The latter form of uncoupling is referred to as mitochon-drial proton leak and is estimated to account for roughly20 to 25% of the resting metabolic rate. Leak activityis correlated with thyroid hormone status; scalesroughly in proportion with the well-known differencesin mass-specific basal metabolic rate in mammals ofdifferent body size, and is related to differences in basalmetabolic rate between ectothermic and endothermicanimals. Proposed functions for mitochondrial uncou-pling through proton leak include thermogenesis, en-ergy balance, control of oxidative phosphorylation effi-ciency, and protection from reactive oxygen species. Themechanisms of mitochondrial proton leak are not wellunderstood; the recently identified uncoupling proteinsmay play some role, but one or more of these proteinsmay have other physiological functions, such as fattyacid translocation.
expenditure. We will focus primarily on mitochondrialuncoupling and the role of mitochondrial proton leakand will differentiate between metabolic states inwhich cells are at relative rest (i.e., when ATP demandis minimal) and those in which cellular energy expen-diture is increased. The outcome of mitochondrial un-coupling, regardless of its molecular mechanism, isthe release of a significant proportion of the energy asheat. Recent findings suggest that the uncoupling thatis mediated by mitochondrial proton leak accounts for20 to 25% of BMR, making it the single most importantpredictor of BMR (Rolfe et al., 1999).
Cellular Energy Expenditure in theContext of the Whole Organism
To appreciate the significance and complexities ofuncoupled cellular energy expenditure, it would beuseful to first review some basic concepts underlyingwhole animal energy expenditure. At the level of thewhole animal, the term energy balance refers to a met-abolic state in which total body energy expenditure isequal to the energy that is absorbed from the diet and
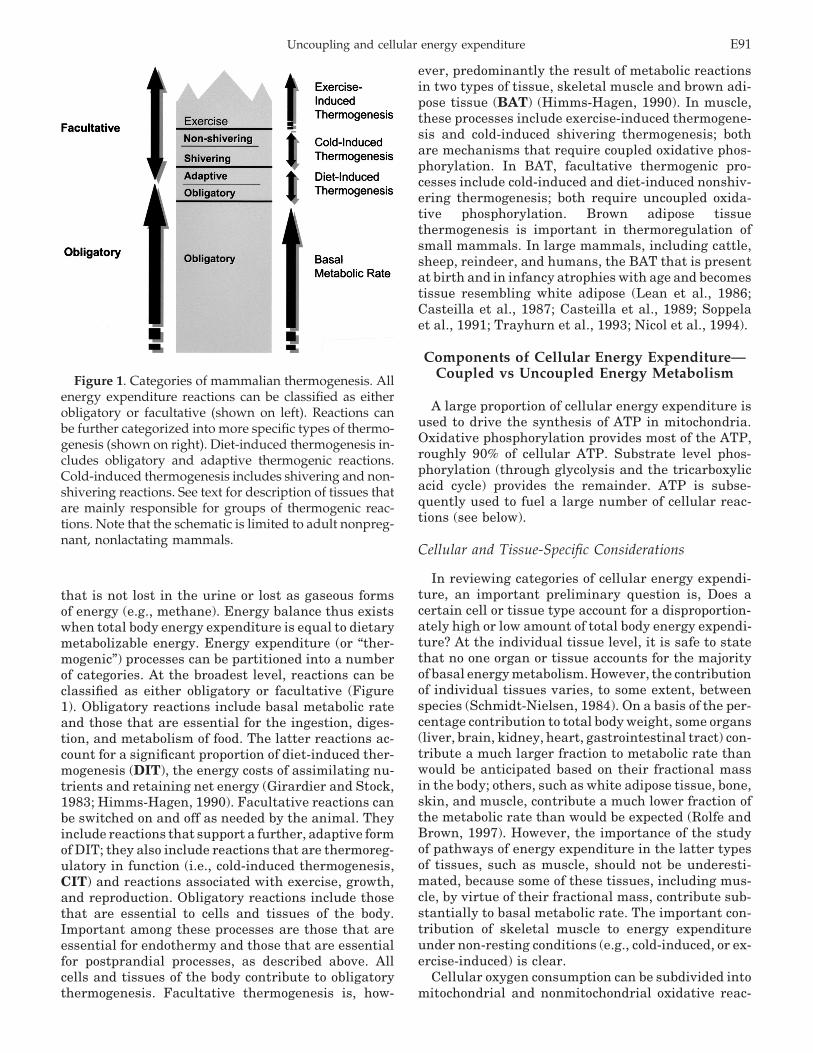
Uncoupling and cellular energy expenditure E91
Figure 1. Categories of mammalian thermogenesis. Allenergy expenditure reactions can be classified as eitherobligatory or facultative (shown on left). Reactions canbe further categorized into more specific types of thermo-genesis (shown on right). Diet-induced thermogenesis in-cludes obligatory and adaptive thermogenic reactions.Cold-induced thermogenesis includes shivering and non-shivering reactions. See text for description of tissues thatare mainly responsible for groups of thermogenic reac-tions. Note that the schematic is limited to adult nonpreg-nant, nonlactating mammals.
that is not lost in the urine or lost as gaseous formsof energy (e.g., methane). Energy balance thus existswhen total body energy expenditure is equal to dietarymetabolizable energy. Energy expenditure (or “ther-mogenic”) processes can be partitioned into a numberof categories. At the broadest level, reactions can beclassified as either obligatory or facultative (Figure1). Obligatory reactions include basal metabolic rateand those that are essential for the ingestion, diges-tion, and metabolism of food. The latter reactions ac-count for a significant proportion of diet-induced ther-mogenesis (DIT), the energy costs of assimilating nu-trients and retaining net energy (Girardier and Stock,1983; Himms-Hagen, 1990). Facultative reactions canbe switched on and off as needed by the animal. Theyinclude reactions that support a further, adaptive formof DIT; they also include reactions that are thermoreg-ulatory in function (i.e., cold-induced thermogenesis,CIT) and reactions associated with exercise, growth,and reproduction. Obligatory reactions include thosethat are essential to cells and tissues of the body.Important among these processes are those that areessential for endothermy and those that are essentialfor postprandial processes, as described above. Allcells and tissues of the body contribute to obligatorythermogenesis. Facultative thermogenesis is, how-
ever, predominantly the result of metabolic reactionsin two types of tissue, skeletal muscle and brown adi-pose tissue (BAT) (Himms-Hagen, 1990). In muscle,these processes include exercise-induced thermogene-sis and cold-induced shivering thermogenesis; bothare mechanisms that require coupled oxidative phos-phorylation. In BAT, facultative thermogenic pro-cesses include cold-induced and diet-induced nonshiv-ering thermogenesis; both require uncoupled oxida-tive phosphorylation. Brown adipose tissuethermogenesis is important in thermoregulation ofsmall mammals. In large mammals, including cattle,sheep, reindeer, and humans, the BAT that is presentat birth and in infancy atrophies with age and becomestissue resembling white adipose (Lean et al., 1986;Casteilla et al., 1987; Casteilla et al., 1989; Soppelaet al., 1991; Trayhurn et al., 1993; Nicol et al., 1994).
Components of Cellular Energy Expenditure—Coupled vs Uncoupled Energy Metabolism
A large proportion of cellular energy expenditure isused to drive the synthesis of ATP in mitochondria.Oxidative phosphorylation provides most of the ATP,roughly 90% of cellular ATP. Substrate level phos-phorylation (through glycolysis and the tricarboxylicacid cycle) provides the remainder. ATP is subse-quently used to fuel a large number of cellular reac-tions (see below).
Cellular and Tissue-Specific Considerations
In reviewing categories of cellular energy expendi-ture, an important preliminary question is, Does acertain cell or tissue type account for a disproportion-ately high or low amount of total body energy expendi-ture? At the individual tissue level, it is safe to statethat no one organ or tissue accounts for the majorityof basal energy metabolism. However, the contributionof individual tissues varies, to some extent, betweenspecies (Schmidt-Nielsen, 1984). On a basis of the per-centage contribution to total body weight, some organs(liver, brain, kidney, heart, gastrointestinal tract) con-tribute a much larger fraction to metabolic rate thanwould be anticipated based on their fractional massin the body; others, such as white adipose tissue, bone,skin, and muscle, contribute a much lower fraction ofthe metabolic rate than would be expected (Rolfe andBrown, 1997). However, the importance of the studyof pathways of energy expenditure in the latter typesof tissues, such as muscle, should not be underesti-mated, because some of these tissues, including mus-cle, by virtue of their fractional mass, contribute sub-stantially to basal metabolic rate. The important con-tribution of skeletal muscle to energy expenditureunder non-resting conditions (e.g., cold-induced, or ex-ercise-induced) is clear.
Cellular oxygen consumption can be subdivided intomitochondrial and nonmitochondrial oxidative reac-

Harper et al.E92
Figure 2. The oxidative phosphorylation system. Substrate oxidation reactions produce reducing equivalents that,in turn, fuel the electron transport chain and the production of protonmotive force (PMF) across the mitochondrialinner membrane. PMF is then used to support ATP synthesis, or proton leak.
tions. While mitochondrial reactions account for themajority of cellular oxygen consumption (roughly 80to 90%, depending on cell type), the 10 to 20% extrami-tochondrial oxygen consumption should be consideredwhen estimating effective P:O ratios in cells of thebody (Rolfe and Brown, 1997). Proportions of extra-mitochondrial oxygen consumption amount to approx-imately 21% in rat liver cells (Brown et al., 1990;Brand et al., 1994), 20% in perfused liver (Scholz andBucher, 1965), 14% in perfused skeletal muscle in rats(Dora et al., 1992; Rolfe and Brand, 1996), and 20%in rabbit reticulocytes (Siems et al., 1982), but only2% in isolated thymocytes (Lakin-Thomas and Brand,1988). Variation between cell types is evident.
Clearly, most of the oxygen consumed by cells isused to support mitochondrial reactions. Mitochon-drial oxygen consumption can be further partitionedinto that which supports ATP synthesis and thatwhich is uncoupled from ATP synthesis (Brand, 1990).In other words, not all mitochondrial oxygen consump-tion is coupled to ATP synthesis. Figure 2 depicts oxi-dative phosphorylation processes as a tripartite sys-tem including blocks of reactions representing the sub-strate oxidation reactions, ATP synthesis andturnover reactions, and proton leak reactions. The lat-ter two groups of reactions are fueled by mitochondrialprotonmotive force (PMF), which, in turn, is main-tained largely by the proton pumping components of
the electron transport chain. Because the ultimate re-action of the electron transport chain is cytochrome coxidase, the activity of the block of substrate oxidationreactions can be measured as oxygen consumption.Protonmotive force is used to support ATP synthesisand turnover reactions and mitochondrial protonleak reactions.
ATP Synthesis and Turnover Reactions
The focus in this brief review is on the importanceof uncoupling to the efficiency of energy metabolism,so we will acknowledge the importance of, but notelaborate on, the many subgroups of reactions com-prising the block of ATP turnover reactions. Moreover,several very useful reviews are available (Kelly andMcBride, 1990; Clausen et al., 1991; Buttgureit andBrand, 1995; Rolfe and Brown, 1997; Hulbert and Else,2000). As described in the excellent review by Rolfeand Brown (1997), the contributions of different ATP-consuming processes within a cell have often been de-termined by 1) assaying the rate of the process of inter-est, and then estimating the corresponding oxygenconsumption needed to support that rate or 2) specifi-cally inhibiting the process of interest and measuringthe degree of inhibition of oxygen consumption. Inmost instances, the application of either approach hasbeen flawed. With the first approach, a mechanistic

Uncoupling and cellular energy expenditure E93
P:O ratio of 3.0 (for NADH substrate-fueled mitochon-dria), or 2.0 (for succinate-fueled mitochondria) hascommonly been used. These values are incorrectlyhigh because they do not take into account either theproportion of cellular oxygen consumption that is ex-tramitochondrial (0 to 20%, depending on cell type,described above), or the proportion of mitochondrialoxygen consumption that is used to balance mitochon-drial proton leak (0 to 50%, depending on tissue, de-scribed below) (Rolfe and Brown, 1997). With the sec-ond approach, inhibitors that are used to specificallyinhibit a given process (e.g., ouabain, an inhibitor ofthe Na, K pump) often have secondary effects on othermetabolic processes (Himms-Hagen, 1976).
Nonetheless, the most important subgroups of ATP-consuming reactions in cells are thought to includeprotein synthesis; the activities of Na/K ATPase, CaATPase, and actinomysin ATPase; and the processesof gluconeogenesis (in liver and kidney), of ureagenesis(in liver), of mRNA synthesis, and of substrate cycling.The contributions of these processes toward total cel-lular ATP consumption are approximately 28% for pro-tein synthesis, 19 to 28% for Na/K ATPase, 4 to 8%for Ca ATPase, 2 to 8% for actinomysin ATPase, 7 to10% for gluconeogenesis, and 3% for ureagenesis(Rolfe and Brown, 1997). Clearly, the relative impor-tance of groups of ATP-demanding reactions can varysubstantially between cell types.
Uncoupled Oxidative Phosphorylation
The most pronounced example of uncoupled oxida-tive phosphorylation is found in BAT, in which theexclusive presence of uncoupling protein −1 (UCP1)allows the return of protons from the intermembranespace into the matrix, bypassing ATP synthase (Ni-cholls and Locke, 1984; Himms-Hagen 1985). Mito-chondrial protonmotive force decreases as a result,and the activity of the respiratory chain increases torectify protonmotive force. The consequence is the in-creased oxidation of fuel substrates, increased oxygenconsumption, and thermogenesis. UCP1-mediatedthermogenesis is significant, particularly in small ro-dents, and in neonatal mammals (see above, and,Himms-Hagen 1990). Brown adipose tissue thermo-genesis is controlled primarily through the activity ofthe sympathetic nervous system. Uncoupling is acti-vated by norepinephrine acting upon adrenergic re-ceptors. The capacity for thermogenesis in brown adi-pocytes is directly related to the concentration of mito-chondrial UCP1; both are inversely related to thetemperature at which the animal has been living(Himms-Hagen and Ricquier, 1998).
Uncoupling of another sort also occurs in tissues ofthe body. This uncoupling is referred to as mitochon-drial proton leak and has been studied extensivelyby Brand since the late 1980s (Brand, 1990). Severalphysiological functions have been proposed for protonleak, including a means for heat production, regula-
tion of the efficiency of oxidative phosphorylation, min-imizing the production of reactive oxygen species(ROS), and, finally, a means to maintain the NAD+/NADH ratio sufficiently high to support carbon fluxesin biosynthetic processes (Brand et al., 1994; Stuartet al., 1999). The bioenergetic implications of protonleak are that a finite amount of mitochondrial oxygenconsumption is not coupled to ATP synthesis, but isinstead released simply as heat. Estimates of protonleak-dependent oxygen consumption in isolated ratliver cells and perfused rat skeletal muscle show thatapproximately 26% of resting energy expenditure isdue to leak in liver cells (Brown et al., 1990; Nobes etal., 1990; Harper and Brand, 1993; Brand et al., 1994)and 52% in resting skeletal muscle (Brand et al., 1994;Rolfe and Brand, 1996). In the heart, Rolfe and Brown(1997) estimated that a maximum of 10 to 13% ofresting oxygen consumption is due to proton leak,based on studies in arrested heart (Challoner, 1968).At the level of the whole body, mitochondrial protonleak accounts for approximately 15 to 20% of basalenergy metabolism (Rolfe and Brown, 1997).
Results thus indicate that mitochondrial protonleak is a very significant contributor to resting cellularenergy metabolism. How does the proportion of leak-dependent oxygen consumption change with increasesin ATP demand in cells? In studies of isolated mito-chondria, it is possible to create metabolic situationsin which the demand for ATP synthesis ranges fromhigh to low. By incubating mitochondria in the pres-ence of an ADP-regenerating system, such as hexoki-nase and glucose, the rate of ATP synthesis is high,and mitochondria are said to be functioning in “state3.” When ATP demand is high, the rate of proton leakreactions is low (Brand, 1990). Conversely, when ATPdemand is low, the rate of leak is highest. Brand andcolleagues, using top-down metabolic control analyses,have further shown that control of leak, substrate oxi-dation, and ATP turnover reactions changes signifi-cantly when ATP demand changes (i.e., from state 4to state 3) (Brand et al., 1993). Overall, these resultsshow that the proportional contribution of leak to totalcellular oxygen consumption is highest when cells areat rest (i.e., when ATP demand is low). Leak, therefore,exerts a tonic effect on changes in oxygen consump-tion: when ATP demand is low, oxygen consumptiondrops, but it does not drop as much as it would if leakdid not occur.
Relationship Between Proton Leak Rates andFactors Known to Affect BMR
The absolute rate of mitochondrial proton leak isaffected by several factors that are related to BMR.These factors include body size in mammals, thyroidstatus, and endothermy.
Body Size in Mammals
In the 1930s and 1940s Kleiber and Brody exploredthe empirical relationships between body weight and

Harper et al.E94
BMR of mammals, ranging from mice to elephants,and showed that BMR was proportional to the three-quarters power of their body weight (W0.75) (reviewedin Kleiber, 1977; Schmidt-Nielsen 1984; Blaxter,1989). Later explored was the relationship betweenbody weight and mass-specific metabolic rate (i.e.,metabolic rate per unit body weight). Metabolic rate(per unit of body weight) varies inversely with bodyweight in mammals. As an example, the expected spe-cific metabolic rate of a 30-g mouse would be 168.2kcal�kg−1�d−1, whereas the value for a 300-kg cowwould be 16.82 kcal�kg−1�d−1 (Schmidt-Nielsen, 1984).In their studies of proton leak in liver mitochondriaof mammals having a wide range of body masses, Por-ter and Brand established that proton leak rate variesinversely with body mass (Porter and Brand, 1993).However, in their later studies it was demonstratedthat in intact cells (hepatocytes) the proportion of res-piration due to leak is remarkably constant at approxi-mately 20% in mammals of widely differing bodyweight (Porter and Brand, 1995). Thus, it has beensuggested that leak may be a general phenomenon ofhigh energetic cost, having common important physio-logical roles (Brand, 2000).
Thyroid Status
Thyroid hormones are important endocrine regula-tors of basal metabolic rate. Thyroid hormones pro-duce increases in proton leak and as well as in themitochondrial inner membrane surface area (Brandet al., 1992). In hypothyroid rats, the decrease in pro-ton leak in hepatocytes accounts for all of the decreasein mitochondrial oxygen consumption observed(Harper and Brand, 1993), and the effective P:O ratiois increased 10 to 15% (Brand et al., 1993). In hyper-thyroid rats, the increase in oxygen consumption ofhepatocytes was shown to be due to equal increasesin proton leak and ATP turnover, such that there wereno significant changes in effective P:O ratios (Harperand Brand, 1993, 1994).
Endothermy
There have been several studies supporting the ideathat proton leak significantly contributes to the costof endothermy (warm-bloodedness). Reptiles (ecto-therms) have resting metabolic rates that are four tofive times lower than those of mammals of the samebody weight. Experiments have shown that in the ecto-thermic bearded dragon lizard, which has about thesame body mass as a rat and a similar preferred bodytemperature (37°C), proton leak rate in liver mito-chondria is one-fifth of that in mitochondria from therat (Brand et al., 1991). However, intact hepatocytesof the lizard consume about one-fifth of the oxygenthat rat hepatocytes do (Brand et al., 1991). It is thusapparent that the contribution of proton leak to cellu-lar thermogenesis (about 20 to 25%) is conserved. The
conserved contribution of leak as a proportion of cellu-lar thermogenesis, and likely of BMR, is similar to theconservation observed for the effects of body mass inmammals (above).
The Question of Mechanism
Is proton leak mediated by a protein, or is it a prop-erty of the lipid-protein composition of the mitochon-drial inner membrane? Its mechanisms are the subjectof intense debate at this time, and much of the debatecenters on whether the recently identified uncouplingproteins mediate proton leak to any extent (Brand etal., 1999; Ricquier and Bouillaud, 2000). Since theidentification of the novel uncoupling proteins, includ-ing UCP2 (Fleury et al., 1997; Gimeno et al., 1997),UCP3 (Boss et al., 1997; Gong et al., 1997), BMCP1(Sanchis et al., 1998), and UCP4 (Mao et al., 1999),many studies have examined the hypothesis that pro-ton leak was mediated by these novel UCP (see reviewof Boss et al., 2000). The expectation has been thatthe novel uncoupling proteins caused uncouplingthrough a mechanism similar to UCP1, and that thesenovel uncoupling proteins were therefore very im-portant in controlling resting metabolic rate. Manytypes of experimental approaches have been used tostudy the function of the uncoupling proteins, includ-ing heterologous expression in yeast systems; reconsti-tution in liposomes; studies of human genetic linkage,association and variants; physiological induction ofexpression through means of diet composition, diet-restriction, and exercise; and creation of UCP knock-out and UCP overexpression mice. Unfortunately,none of these approaches has proven unequivocallythat the physiological function of the novel UCP iseither proton leak or uncoupling (see reviews ofHarper and Himms-Hagen, 2001; Himms-Hagen andHarper, 2001; Stuart et al., 2001).
The literature describing the physiological induc-tion of the uncoupling proteins includes a number ofparadoxical findings. The most pronounced paradoxis the significant increases in Ucp2 and Ucp3 geneexpression during fasting and severe food restriction,conditions in which the efficiency of energy metabo-lism is well recognized, not situations in which energywastage would be desirable. Cadenas et al. (1999) ex-amined the increased expression of Ucp3 mRNA andprotein caused by fasting in rats. While there weresignificant increases in Ucp3 expression in muscle,there were no changes in mitochondrial proton leak.Very recently, Bezaire and colleagues conducted a sim-ilar study in wild-type mice and Ucp3 knockout mice(Bezaire et al., 2001). Fasting caused a fourfold in-crease in Ucp3 and a twofold increase in Ucp2 in mus-cle of wild-type mice, but similar to the findings ofCadenas and colleagues (1999), there were no changesin mitochondrial proton leak reactions. Mitochondriaof Ucp3 knockout mice have higher protonmotive forcethan those from wild-type mice (Gong et al., 2000;

Uncoupling and cellular energy expenditure E95
Bezaire et al., 2001), and fasting results in furthersmall increases in protonmotive force (Bezaire et al.,2001). It seems that fasting exacerbates the metabolicaberrations occurring in the absence of Ucp3. Neder-gaard and colleagues have shown that norepineph-rine-induced thermogenesis in brown-fat cells is abso-lutely dependent on UCP1, despite the high levels ofUCP2/UCP3 mRNA observed in BAT of UCP1-ablatedmice (Nedergaard et al., 2001). Moreover, UCP1-ab-lated mice are cold-insensitive (Enerback et al., 1997),isolated brown-fat mitochondria are not uncoupled,and the kinetics of mitochondrial proton leak are simi-lar to those of wild-type mitochondria in the presenceof GDP, a well known inhibitor of UCP1-mediated un-coupling (Monemdjou et al., 1999). Perhaps Ucp2 andUcp3 cause uncoupling under some situations, but itis becoming increasingly clear that they have moreimportant physiological functions in the transport ofmetabolites (e.g., those related to fatty acid oxidation)(Samec et al., 1998).
In fact, there is a tight correlation between the ex-pression of Ucp3 and metabolic states in which fattyacid oxidation is high. Most prominent is the correla-tion of Ucp3 expression with fasting and food restric-tion. A mechanism to explain how UCP3 could enhancefatty acid oxidation was recently proposed (Himms-Hagen and Harper, 2001). This hypothesis describeshow UCP3 might facilitate rapid rates of fatty acidoxidation by acting as a mitochondrial fatty acid effluxprotein. It was proposed that UCP3 functions in con-cert with mitochondrial thioesterase(s) (MTE) to re-move free fatty acid (produced by MTE) from the ma-trix and liberate CoA-SH. The latter is in relative highdemand during fatty acid oxidation. That the directinteraction of fatty acid with UCP1 is necessary for itsfunction (Garlid et al., 1996; Klingenberg and Huang,1999) lends some support to the idea that its homo-logue, UCP3, interacts with fatty acid. A number ofvery recent studies are providing further support forthe idea that UCP3 may indeed function as a fattyacid efflux protein. In the mouse that overexpresseshuman UCP3 in muscle, Moore et al. (2001) studiedthe expression of carnitine palmitoyl transferase, lipo-protein lipase, MTE-1, CD36 (a fatty acid transporter,also referred to as FAT), among other genes, and founda threefold increase in MTE-1 mRNA. Lipoprotein li-pase expression also increased significantly, but to alesser extent (50%). Moreover, Bezaire and colleagues(2001) found impaired fatty acid oxidation, as reflectedin high respiratory quotients, in the Ucp3 knockoutmouse. Thus, the evidence supporting the idea thatUcp3 functions physiologically in fatty acid metabo-lism is accruing.
Summary and Conclusions
Basal metabolic rate normally accounts for thelargest single fraction of total body energy expenditurein mammals. Its metabolic origins are not well under-
stood, but many of the processes occurring in cells andtissues of the body have been widely studied and arebriefly reviewed here. The importance of uncoupledstates of cellular energy expenditure due to mitochon-drial proton leak reactions is becoming increasinglyappreciated. Proton leak is a process thought to occurin all cell types and is described as being the largestsingle contributor to BMR. The proportional contribu-tion of proton leak-dependent energy expenditure isgreatest when cells are in a relative state of rest (i.e.,when energy expenditure and ATP demand is low).This is in contrast to the situation in BAT, whoseprimary physiological function is heat production(thermogenesis). The unique presence of UCP1 inbrown adipocytes allows very high absolute rates ofuncoupled energy expenditure.
The mechanism(s) responsible for mitochondrialproton leak are poorly understood. The identificationwithin the last few years of novel uncoupling proteinsled immediately to the hypothesis that these proteinscaused mitochondrial proton leak. While they maycause proton leak under some conditions, it is becom-ing increasingly clear that they likely have other im-portant physiological functions. In particular, evi-dence suggests that UCP3 plays an important role infatty acid metabolism, and may act as a fatty acidanion translocator. Thus, the search for the molecularorigins of mitochondrial proton leak continues.
Literature Cited
Bezaire, V., W. E. Hofmann, J. K. G. Kramer, L. P. Kozak, and M-E. Harper. 2001. Effects of fasting on muscle mitochondrialenergetics and fatty acid metabolism in Ucp3−/− and wild-typemice. Am. J. Physiol. 281:E975–E982.
Blaxter, K. L. 1989. The minimal metabolism. In: Energy Metabo-lism in Animals and Man. pp 120–146. Cambridge UniversityPress, Cambridge, U.K.
Boss, O., T. Hagen, and B. B. Lowell. 2000. Uncoupling proteins 2and 3: potential regulators of mitochondrial energy metabo-lism. Diabetes 49:143–156.
Boss, O., S. Samec, A. Paolini-Giacobino, C. Rossier, A. G. Dulloo,J. Seydoux, P. Muzzin, and J.-P. Giacobino. 1997. Uncouplingprotein-3: A new member of the mitochondrial carrier familywith tissue-specific expression. FEBS Lett. 408:39–42.
Brand, M. D. 1990. The contribution of the leak of protons acrossthe mitochondrial inner membrane to standard metabolic rate.J. Theor. Biol. 145:267–286.
Brand, M. D. 2000. Uncoupling to survive? The role of mitochondrialinefficiency in ageing. Exp. Gerontol. 35:811–820.
Brand, M. D., K. M. Brindle, J. A. Buckingham, J. A. Harper, D.F. S. Rolfe, and J. A. Stuart. 1999. The significance and mecha-nism of mitochondrial proton conductance. Int. J. Obes. Relat.Metab. Disord. 23 (Suppl. 6):S4–S11.
Brand, M. D., L. F. Chien, E. K. Ainscow, D. F. S. Rolfe, and R. K.Porter. 1994. The causes and functions of mitochondrial protonleak. Biochim. Biophys. Acta 1187:132–139.
Brand, M. D., P. Couture, P. L. Else, K. W. Withers, and A. J.Hulbert. 1991. Evolution of energy metabolism. Proton perme-ability of the inner membrane of liver mitochondria is greaterin a mammal than in a reptile. Biochem. J. 275:81–86.
Brand, M. D., M.-E. Harper, and H. C. Taylor. 1993. Control ofeffective P:O ratio of oxidative phosphorylation in liver mito-chondria and hepatocytes. Biochem. J. 291:739–748.

Harper et al.E96
Brand, M. D., D. Steverding, B. Kadenbach, P. M. Stevenson, andR. P. Hafner. 1992. The mechanism of the increase in mitochon-drial proton permeability induced by thyroid hormones. Eur.J. Biochem. 206:775–781.
Brown, G. C., P. L. Lakin-Thomas, and M. D. Brand. 1990. Controlof mitochondrial respiration and ATP synthesis in isolated ratliver cells. Eur. J. Biochem. 192:355–362.
Buttgereit, F., and M. D. Brand. 1995. A hierarchy of ATP-consum-ing processes in mammalian cells. Biochem. J. 312:163–167.
Cadenas, S., J. A. Buckingham, S. Samec, J. Seydoux, N. Din, A.G. Dulloo, and M. D. Brand. 1999. UCP2 and UCP3 rise instarved rat skeletal muscle but mitochondrial proton conduc-tance is unchanged. FEBS Lett. 462:257–260.
Casteilla, L., O. Champigny, F. Bouillaud, J. Robelin, and D. Ric-quier. 1989. Sequential changes in the expression of mitochon-drial protein mRNA during the development of brown adiposetissue in bovine and ovine species. Biochem. J. 257:665–671.
Casteilla, L., C. Forest, J. Robelin, D. Ricquier, A. Lombet, and G.Ailaud. 1987. Characterization of mitochondrial uncouplingprotein in bovine fetus and newborn calf. Am. J. Physiol252:E627–E636.
Challoner, D. R. 1968. Respiration in myocardium. Nature (Lond.)217:78–79.
Clausen, T., C. Van Hardeveld, and M. E. Everts. 1991. Significanceof cation transport in control of energy metabolism, and ther-mogenesis. Physiol. Rev. 71:733–774.
Dora, K. A., S. M. Richards, S. Rattigan, E. Q. Colquhoun, and M.G. Clark. 1992. Serotonin and norepinephrine vasoconstrictionin rat hindlimb have different oxygen requirements. Am. J.Physiol. 262:H698–H703.
Enerback S., A. Jacobsson, E. M. Simpson, C. Guerra, H. Yamashita,M-E. Harper, and L. P. Kozak. 1997. Mice lacking mitochon-drial uncoupling protein are cold-sensitive but not obese. Na-ture (Lond.) 387:90–94.
Fleury, C., M. Neverova, S. Collins, S. Raimbault, O. Champigny,C. Levi-Meyrueis, F. Bouillaud, M. F. Seldin, R. S. Surwit, D.Ricquier, and C. H. Warden. 1997. Uncoupling protein—2: Anovel gene linked to obesity and hyperinsulinemia. Nat. Genet.15:269–272.
Garlid, K. D., D. E. Orosz, M. Modriansky, S. Vassanelli, and P.Jezek. 1996. On the mechanism of fatty acid-induced protontransport by mitochondrial uncoupling protein. J. Biol. Chem.271:2615–2620.
Gimeno, R. E., M. Dembski, X. Weng, N. Deng, A. W. Shyjan, C. J.Gimeno, F. Iris, S. J. Ellis, E. A. Woolf, and L. A. Tartaglia.1997. Cloning and characterization of an uncoupling proteinhomolog: A potential mediator of human thermogenesis. Diabe-tes 46:900–906.
Girardier, L., and Stock, M. J. 1983. Mammalian Thermogenesis:An Introduction. In: Mammalian Thermogenesis. pp 1–7.Chapman and Hall, Cambridge, U.K.
Gong D. W., Y. He, M. Karas, and M. Reitman. 1997. Uncouplingprotein-3 is a mediator of thermogenesis regulated by thyroidhormone, beta3-adrenergic agonists, and leptin. J. Biol. Chem.272:24129–24132.
Gong, D. W., S. Monemdjou, O. Gavrilova, L. R. Leon, B. Marcus-Samuels, C. J. Chou, C. Everett, L. P. Kozak, C. Li, C. Deng,M. E. Harper, and M. L. Reitman. 2000. Lack of obesity andnormal response to fasting and thyroid hormone in mice lackinguncoupling protein-3. J. Biol. Chem. 275:16251–16257.
Harper, M.-E., and M. D. Brand. 1993. The quantitative contribu-tions of mitochondrial proton leak and ATP turnover reactionsto the changed respiration rates of hepatocytes isolated fromrats of different thyroid status. J. Biol. Chem. 268:14850–14860.
Harper, M.-E., and M. D. Brand. 1994. Hyperthyroidism stimulatesmitochondrial proton leak and ATP turnover in rat hepatocytesbut does not change the overall kinetics of the substrate oxida-tion reactions. Can. J. Physiol. Pharmacol. 72:899–908.
Harper, M.-E., and J. Himms-Hagen. 2001. Mitochondrial efficiency:Lessons learned from transgenic mice. Biochim. Biophys. Acta1504:159–172.
Himms-Hagen, J. 1976. Cellular thermogenesis. Annu. Rev. Phys-iol. 38:315–351.
Himms-Hagen, J. 1985. Brown adipose tissue and thermogenesis.Annu. Rev. Nutr. 5:69–94.
Himms-Hagen, J. 1990. Brown adipose tissue thermogenesis: Rolein thermoregulation, energy regulation and obesity. In: E.Schonbaum and P. Lomax (ed.) Thermoregulation: Physiologyand Biochemistry. pp 327–414. Pergamon Press, New York.
Himms-Hagen, J., and M-E. Harper. 2001. Physiological role ofUCP3 may be export of fatty acids from mitochondria whenfatty acid oxidation predominates. Exp. Biol. Med. 226:78–84.
Himms-Hagen, J., and D. Ricquier. 1998. Brown adipose tissue. In:G. A. Bray, C. Bouchard, and W. P. T. James (ed.) Handbookof Obesity. pp 415–441. Marcel Dekker, New York.
Hulbert, A. J., and P. L. Else. 2000. Mechanisms underlying thecost of living in animals. Annu. Rev. Physiol. 62:207–235.
Kelly, J. M., and B. W. McBride. 1990. The sodium pump and othermechanisms of thermogenesis in selected tissues. Proc. Nutr.Soc. 49:203–215.
Kleiber, M. 1977. The Fire of Life: An Introduction to Animal Ener-getics. Krieger, Huntington, New York.
Klingenberg, M., and S. G. Huang. 1999. Structure and function ofthe uncoupling protein from brown adipose tissue. Biochim.Biophys. Acta 1415:271–296.
Lakin-Thomas, P. L., and M. D. Brand. 1988. Stimulation of respira-tion by mitogens in rat thymocytes is independent of mitochon-drial calcium. Biochem. J. 256:167–173.
Lean, M. E. J., W. P. T. James, G. Jennings, and P. Trayhurn. 1986.Brown adipose tissue uncoupling protein content in infants,children and adult humans. Clin. Sci. (Lond.) 71:291–297.
Mao, W., X. X. Yu, A. Zhong, W. Li, J. Brush, S. W. Sherwood, S.H. Adams, and G. Pan. 1999. UCP4, a novel brain-specificmitochondrial protein that reduces membrane potential inmammalian cells. FEBS Lett. 443:326–330.
Monemdjou, S., L. P. Kozak, and M-E. Harper. 1999. Mitochondrialproton leak in brown adipose tissue mitochondria of Ucp1-deficient mice is GDP insensitive. Am. J. Physiol.276:E1073–E1082.
Moore, G. B. T., J. Himms-Hagen, M-E. Harper, and J. C. Clapham.2001. Overexpression of UCP-3 in skeletal muscle of mice re-sults in increased expression of mitochondrial thioesterasemRNA. Biochem. Biophys. Res. Commun. 283:785–790.
Nedergaard, J., V. Golozoubova, A. Matthias, A. Asadi, A. Jacobs-son, and B. Cannon. 2001. UCP1: The only protein able tomediate adaptive non-shivering thermogenesis and metabolicinefficiency Biochim. Biophys. Acta 1504:82–106.
Nicol, F., H. Lefranc, J. R. Arthur, and P. Trayhurn. 1994. Charac-terization and postnatal development of 5′-deiodinase activityin goat perirenal fat. Am. J. Physiol. 267:R144–R149.
Nicholls, D. G., and R. M. Locke. 1984. Thermogenic mechanismsin brown fat. Physiol. Rev. 64:1–64.
Nobes, C. D., G. C. Brown, P. N. Olive, and M. D. Brand. 1990.Non-ohmic conductance of mitochondrial inner membrane ofhepatocytes. J. Biol. Chem. 265:12903–12909.
Porter, R. K., and M. D. Brand. 1993. Body mass dependence ofH+ leak in mitochondria and its relevance to metabolic rate.Nature (Lond.) 362:628–630.
Porter, R. K., and M. D. Brand. 1995. Cellular oxygen consumptiondepends on body mass. Am. J. Physiol. 269:R226–R228.
Ricquier, D., and F. Bouillaud. 2000. Mitochondrial uncoupling pro-teins: from mitochondria to the regulation of energy balance.J. Physiol. 529; Pt 1:3–10.
Rolfe, D. F. S., and M. D. Brand. 1996. The contribution of mitochon-drial proton leak to the rate of respiration in rat skeletal muscleand to SMR. Am. J. Physiol. 271:C1380–C1389.
Rolfe, D. F. S., and G. C. Brown. 1997. Cellular energy utilizationand molecular origin of standard metabolic rate in mammals.Physiol. Rev. 77:732–758.
Rolfe, D. F. S., J. M. B. Newman, J. A. Buckingham, M. G. Clark,and M. D. Brand. 1999. Contribution of mitochondrial proton

Uncoupling and cellular energy expenditure E97
leak to respiration rate in working skeletal muscle and liverand to SMR. Am. J. Physiol 276:C692–C699.
Samec, S., J. Seydoux, A. G. Dulloo. 1998. Role of UCP homologuesin skeletal muscles and brown adipose tissue: Mediators ofthermogenesis or regulators of lipids as fuel substrate? FASEBJ. 12:715–724.
Sanchis D., C. Fleury, N. Chomiki, M. Goubern, Q. Huang, M. Nev-erova, F. Gregoire, J. Easlick, S. Raimbault, C. Levi-Meyrueis,B. Miroux, S. Collins, M. Seldin, D. Richard, C. Warden, F.Bouillaud, and D. Ricquier. 1998. BMCP1, a novel mitochon-drial carrier with high expression in the central nervous systemof humans and rodents, and respiration uncoupling activity inrecombinant yeast. J. Biol. Chem. 273:34611–34615.
Schmidt-Nielsen, K. 1984. Metabolic rate and body size. In: ScalingWhy Is Animal Size So Important? pp 56–74. Cambridge Uni-versity Press, U.K.
Scholz, R., and T. Bucher. 1965. Hemoglobin-free perfusion of ratliver. In: B. Chance (ed.) Control of Energy Metabolism. pp393–414. Academic Press, New York.
Siems, W. M., M. Muller, R. Dumdey, H.-G. Holzhutter, J. Rath-mann, and S. M. Rapoport. 1982. Quantification of pathways ofglucose utilization and balance of energy metabolism of rabbitreticulocytes. Eur. J. Biochem. 124:567–576.
Sopela, P., M. Nieminin, S. Saarela, J. S. Keith, J. N. Morrison, S.MacFarlane, and P. Trayhurn. 1991. Brown fat-specific mito-chondrial uncoupling protein in adipose tissues of newbornreindeer. Am. J. Physiol. 260:R1229–R1234.
Stuart, J. A., K. M. Brindle, J. A. Harper, and M. D. Brand. 1999.Mitochondrial proton leak and the uncoupling proteins. J. Bi-oenerg. Biomembr. 31:517–525.
Stuart, J. A., S. Cadenas, M. B. Jacobsons, D. Roussel, and M. D.Brand. 2001. Mitochondrial proton leak and the uncouplingprotein 1 homologues. Biochim. Biophys. Acta 1504:144–158.
Trayhurn, P., M. E. A. Thomas, and J. S. Keith. 1993. Postnataldvelopment of uncoupling protein mRNA and GLUT4 in adi-pose tissues of goats. Am. J. Physiol. 265:R676–R682.

Mechanisms for conjugated linoleic acid-mediated reduction in fat deposition
H. J. Mersmann1,2,3
USDA/ARS Children’s Nutrition Research Center, Department of Pediatrics,Baylor College of Medicine, Houston, Texas 77030-2600
ABSTRACT: Potential mechanisms for the de-creased fat deposition observed after oral administra-tion of conjugated linoleic acids (CLA) to mice, rats,hamsters, humans, and pigs will be reviewed. Mostmechanisms are based on experiments with rodents orrodent-derived cells. Administration of CLA results inan increased metabolic rate in intact mice, but not inrats or sows. There is a decreased respiratory quotientin mice and rats, suggesting increased fat oxidation.Bovine milk-fat synthesis is decreased. Rat adipocytesize is smaller, but cell number is unchanged. In mice,there is increased adipocyte apoptosis. In 3T3-L1 pread-ipocytes, a clonal cell line derived from rodents, CLAdecreases proliferation. Human, but not porcine, pread-ipocyte proliferation was inhibited by CLA. Differentia-tion of 3T3-L1 preadipocytes was diminished by CLAin two laboratories, but increased in a third laboratory.In porcine and human preadipocytes, CLA acutely in-creased lipid deposition, but lipid content quicklyreached a plateau. Peroxisome proliferator-activatedreceptor-γ (PPARγ), a key transcription factor in adipo-
Key Words: Adipocytes, Dienoic Fatty Acids, Differentiation, Energy Metabolism,Lipid Metabolism, Tissue Proliferation
2002 American Society of Animal Science. All rights reserved. J. Anim. Sci. 80(E. Suppl. 2):E126–E134
1Correspondence: 1100 Bates Street (phone: 713/798-7128; fax:713/798-7130; E-mail: [email protected]).
2This presentation would not be possible without the generouscontribution of unpublished data by the following investigators: MikeAzain, Dale Bauman, Frank Dunshea, Ching-Yuan Hu, Michael Mc-Intosh, Scott Mills, Jess Miner, Jack Odle, Michael Pariza, FredParrish, and Steve Smith. I thank each of you. I also thank LeslieLoddeke for editorial assistance. This review does not pretend to becomprehensive, but presents the author’s interpretation of the cur-rent literature, including numerous unpublished observations. Thereview was completed in July, 2001. The reader should consult theliterature of 2001 and 2002 to learn of updates in this rapidly ex-panding field.
3This work is a publication of the USDA/ARS Children’s NutritionResearch Center, Department of Pediatrics, Baylor College of Medi-cine, Houston, Texas. This project has been funded in part withfederal funds from the USDA/ARS under Cooperative Agreement No.58-6250-6001. The contents of this publication do not necessarilyreflect the views or policies of the USDA, nor does mention of tradenames, commercial products, or organizations imply endorsementfrom the U.S. government.
Received July 27, 2001.Accepted April 25, 2002.
E126
cyte differentiation, requires an activating ligand; CLAare ligands for PPARγ. The concentration of PPARγmRNA increases during adipocyte differentiation. InCLA-treated differentiating preadipocytes in culture,the PPARγ mRNA concentration was decreased, in-creased, or not significantly changed, providing littleevidence for modulation of differentiation through thismechanism. However, CLA might act as an agonisticor antagonistic ligand for PPARγ to control differentia-tion. The primary CLA isomer in ruminant tissues iscis 9, trans 11-CLA. Most synthetic CLA preparationscontain a considerable amount of trans 10, cis 12-CLA,in addition to 9,11-CLA. The 10,12-CLA is responsiblefor the body composition changes in mice and for thedecreased bovine milk-fat synthesis. The two CLA iso-mers equally reduced lipid deposition in porcine preadi-pocytes, whereas there is evidence for both a preferen-tial effect of 10,12-CLA and no isomer distinction inhuman preadipocytes. Elucidation of the mechanism(s)for a CLA-mediated reduction in fat deposition remainselusive and may be species-specific.
Introduction
Conjugated linoleic acids (CLA) are geometric andpositional isomers of the 18-carbon fatty acid with twocis double bonds, linoleic acid (C18:2; cis9, cis12).Among the many CLA isomers, the two isomers moststudied for their biological effects are cis 9, trans 11-CLA (9,11-CLA), the predominant isomer produced inruminant mammals, and trans 10, cis 12-CLA (10,12-CLA), one of the two predominant isomers, along with9,11-CLA in most synthetic CLA preparations. TheCLA have many interesting and unique biological prop-erties compared to the common unsaturated fatty acids.Among the biological properties of CLA is the reductionof fat deposition in various mammalian species andchickens. Chemical and biological properties of CLAhave been reviewed (Pariza et al., 2000, 2001; Yuraweczet al., 1999).

Conjugated linoleic acid and fat deposition E127
Before exploring potential mechanisms that mightcontribute to the CLA-mediated decrease in fat depo-sition, it is important to understand that there areconflicting data regarding some of the variables mea-sured. This is not unexpected, because studies bothin vitro and in vivo have many subtle as well as andnot-so-subtle differences. In animal studies, the spe-cies varies, and, even within species, the breed orstrain varies. The age, sex, and husbandry conditions(cage/building type and size, temperature, lighting re-gime, etc.) may all be quite variable. The compositionof the feed is variable, even within species. Prepara-tions diverge in percentage of CLA, CLA isomer com-position and concentration, and the concentrations ofother fatty acids. In cell culture, the cell type, mediumcomposition, exogenous additions, and timing of vari-ous additions to the culture are highly variable. Fi-nally, the choice of measurement times (blood sam-pling, tissue harvest, cell harvest from cultures, etc.)is extremely variable. For measurement of some vari-ables, the timing may be critical (e.g., the changes insome mRNA and some enzymes are transient).
Fat Deposition
It might be expected that the response to CLA woulddiffer among species because the patterns of lipid me-tabolism are species-specific. This variability includessites of de novo fatty acid synthesis, composition oflipids and lipoproteins, concentration and dynamicsof individual lipoproteins, endocrine and genetic regu-lation of lipid metabolism, and depot sites for fat depo-sition. In spite of these qualifications, a CLA-mediatedreduction in fat deposition has been observed in sev-eral species.
In mice fed CLA, there was reduced fat depositionat multiple sites. The effects have been observed inmany laboratories, in several strains, and in bothmale and female mice.
The reduction in fat depot weight is approximately50% after feeding 0.5 or 1.0% CLA for 4 wk (Park etal., 1997; West et al., 1998; Miner et al., 2001). Inone study where mice were fed CLA for 5 mo, the fatweights in several depots were <5 to <30% of the fatweights in the control animals (Tsuboyama-Kasaokaet al., 2000).
Fat deposition decreased in rats fed CLA (Azain etal., 2000; Stangl, 2000; Yamasaki et al., 1999). In onestudy using both male and female rats, the decreasein fat deposition was restricted to female rats, withlittle or no response in male rats (M. J. Azain, personalcommunication). Reduced fat deposition has also beenreported in hamsters (de Deckere et al., 1999) andchickens (Simon et al., 2000; Szymczyk et al., 2001).
In pigs, feeding of CLA caused a reduction in fatdeposition (Dugan et al., 1997). Several additionalstudies, usually but not always conducted during thelatter portion of growth (−50 kg to −100 kg), confirmedthe decrease in fat deposition (Ostrowska et al., 1999b;
O’Quinn et al., 2000a,b) (F. R. Dunshea, personal com-munication). One study (Ostrowska et al., 1999b)clearly indicated that the decrease in fat depositionwas related to the dose of CLA fed. Several recent pigfeeding trials detected only a slight decrease or nodecrease in fat deposition (M. J. Azain; L. A. Gatlinand J. Odle; R. L. Thiel-Cooper and F. C. Parrish;each by personal communication). No distinguishingfeature in any of these trials suggests a reason for thelack of a substantial CLA effect. Perhaps in strains ofpigs with reduced backfat thickness, further reductiondoes not occur to preserve the important metabolicfunctions of adipose tissue, or a reduction is not detect-able. Regardless, a no-effect response is expected ina certain percentage of cases when an exogenous com-pound is administered. Such a lack of effects probablyis the consequence of variables that are not controlledbetween trials, and may lead to less than the initialfervor for the positive responses. I would judge that“the jury is still out” regarding the pragmatic efficacyof CLA in pigs, because both positive and no-responseresults have been observed. Certainly, CLA is effica-cious in pigs under some circumstances, as indicatedby multiple positive results, and especially by thedose-related response.
In human adults fed CLA for periods up to 100+ d,the decrease in both weight and body fat was marginalor nonexistent (Berven et al., 2000; Blankson et al.,2000; Zambell et al., 2000) (M. W. Pariza, personalcommunication). Compared to animal studies in sev-eral different species, the dose of CLA was low inhuman trials, being 3 to 4 g/d in most trials and <7g/d at the highest concentration administered. A 70-kg human with a CLA intake of 3 or 4 g/d can becompared to a 70-kg pig. The 70-kg pig is expected toeat 2.5+ kg/d, so that at 1% CLA in the diet, the CLAintake would be 25+ g/d. Even at 0.25% CLA, the low-est CLA dose used in experiments with multiple spe-cies, the pig would take in 6+ g CLA/d; the 0.25%CLA dose usually does not elicit a response in animalstudies and is above the dose in most human trials.Animal trials for testing effects of CLA on fat deposi-tion are in growing animals, whereas the human stud-ies are in adults; the question in human studies iswhether CLA administration will decrease existingfat depots, whereas the question in animal studies iswhether CLA will decrease deposition of fat in growinganimals. Of course, in growing humans, the questionalso is whether CLA will decrease fat deposition. I seeno evidence of efficacy for CLA use in humans to lowerfat stores, at least with the CLA doses used.
Isomers of CLA
There is increasing evidence that the CLA isomercausing changes in fat accretion and lipid metabolismis 10,12-CLA and not 9,11-CLA (Martin et al., 2000;Park et al, 1999; K. Hargrave and J. L. Miner, per-sonal communication). In addition, milk-fat in dairy

MersmannE128
cows was decreased by 10,12-CLA rather than by 9,11-CLA (Baumgard et al., 2000). Lipoprotein lipase(LPL) activity in 3T3-L1 cells was decreased by treat-ment of the cells with 10,12-CLA but not by treatmentwith 9,11-CLA (Lin et al., 2001; Park et al., 1999). Asadditional enzymatic or receptor systems are studied,it might be expected that all will not exhibit specificityfor a single CLA isomer. Furthermore, because of spe-cies variation in protein structure, the isotopic speci-ficity of a particular enzyme or receptor may be spe-cies-specific.
Mechanisms
Preadipocyte Proliferation
One mechanism to increase fat deposition is to in-crease the number of adipocytes. Differentiated adipo-cytes do not proliferate, but preadipocytes proliferateand have the potential to differentiate and then fillwith lipid to expand a fat depot. In rodent-derivedclonal preadipocytes (3T3-L1 cells), cell proliferation,measured by cell counts and DNA synthesis, was de-creased 10 to 50% by treatment with <25 to 100 �MCLA in a dose-related fashion. This has been observedin three different laboratories (Brodie et al., 1999;Satory and Smith, 1999; Evans et al., 2000). In humanpreadipocytes treated with 50 �M CLA in culture,there was a 25% decrease in cell proliferation (R. L.McNeel and H. J. Mersmann, unpublished data). Thesynthesis of DNA, during incubation in vitro of adi-pose tissue removed from pigs fed CLA, was decreased(V. L. Adams and S. B. Smith, personal communica-tion). On the other hand, cell proliferation in humanpreadipocytes treated with 10 �M CLA was not de-creased (J. M. Brown and M. McIntosh, personal com-munication). In cultured porcine preadipocytestreated with 50 �M CLA, there was no evidence of areduction in cell proliferation (R. L. McNeel and H.J. Mersmann, unpublished data). Thus, preadipocyteproliferation is decreased by CLA in some circum-stances. There is little evidence regarding this mecha-nism in vivo, although cell number in adipose depotswas not decreased in rats fed CLA (Azain et al., 2000).
Preadipocyte Differentiation
Adipocyte differentiation has been reviewed multi-ple times (Brun et al., 1997; Mandrup and Lane, 1997;Fajas et al., 1998). The generally accepted model foradipocyte differentiation indicates that when preadi-pocytes are presented with the appropriate milieu ofdifferentiation factors, i.e., growth factors and hor-mones, they begin to differentiate. Initially, the tran-scription factors, CCAAT/enhancer binding protein β(C/EBPβ) and C/EBPδ, are increased. These factorsstimulate an increase in another transcription factor,peroxisome proliferator-activated receptor γ (PPARγ),which in turn causes an increase in C/EBPα. Genes
for several proteins characteristic of the adipocytephenotype have response elements for either PPARγor C/EBPα so that transcription of these phenotypicgenes is initiated to increase differentiation. Aftertranslation of genes for anabolic adipocyte lipid me-tabolism, the cells begin to fill with lipid.
The transcription factor, PPARγ, does not functionalone, but forms a heterodimer with another tran-scription factor, retinoid × receptor α (RXRα). ThePPARγ-RXRα heterodimer must be activated. The na-ture of the physiological activator of PPARγ is unclear,but fatty acids bind to PPARγ and activate it (Tonto-noz et al., 1994; Kliewer et al., 1997). Because CLAbind to PPARγ and activate it (Houseknecht et al.,1998; Belury and Vanden Heuval, 1999), they mayfunction, at least in part, as ligands for PPARγ.
If fewer preadipocytes differentiate into mature adi-pocytes, there would be a decrease in the populationof cells with the potential to fill with lipid and conse-quently expand the fat mass. Two laboratories ob-served a dose-related decrease in preadipocyte differ-entiation of CLA-treated rodent-derived 3T3-L1clonal cells (Brodie et al., 1999; Evans et al., 2000; J.M. Brown and M. McIntosh, personal communica-tion). Differentiation was measured by accumulationof oil red O-stained material (OROSM), glycerol-Pdehydrogenase activity, cell size, or triacylglycerolconcentration. A decrease in these differentiation endpoints could also represent decreased triacylglycerolsynthesis in already differentiated cells. Human pre-adipocyte differentiation, using a thiazolidinedionecompound as a PPARγ ligand, was inhibited by treat-ment with 10 �M CLA, but treatment with 100 �MCLA did not inhibit differentiation (Brown et al.,2001b; J. M. Brown and M. McIntosh, personal com-munication). These latter data suggest the dose rela-tionship for CLA effects on differentiation may notbe linear or hyperbolic, but more complex in nature.Differentiation of porcine preadipocytes was not af-fected by addition of 5 to 35 �M CLA (C.-Y. Hu, per-sonal communication).
The mRNA concentrations for the key transcriptionfactors in adipocyte differentiation, PPARγ and C/EBPα, were decreased in 3T3-L1 cells differentiatingin the presence of CLA (Brodie et al., 1999), althoughresearchers in another laboratory did not observe adecrease in PPARγ mRNA concentration (Evans etal., 2001). The transcription factor, sterol regulatoryelement binding protein 1c, also known as adipocytedetermination and differentiation-dependent factor 1(ADD1), is also implicated in adipocyte differentia-tion. It increases PPARγ and enzymes associated withfatty acid and triacylglycerol synthesis (e.g., fatty acidsynthase and glycerol-phosphate dehydrogenase). Anincrease in fatty acids provides potential ligands forPPARγ, as well as substrates for membrane and triac-ylglycerol biosynthesis (Kim and Spiegelman, 1996;Kim et al., 1998). Porcine preadipocytes treated withCLA had reduced ADD1 mRNA and protein concen-

Conjugated linoleic acid and fat deposition E129
trations (S. T. Ding and H. J. Mersmann, unpub-lished data).
One laboratory (Satory and Smith, 1999) indicatedan increase in preadipocyte differentiation of 3T3-L1cells measured by glucose incorporation into lipidsand verified by OROSM. There is no obvious cause forthe opposite effects in different laboratories using thesame clonal cell line (i.e., CLA-induced inhibition vsstimulation of differentiation). The use of ethanol asa vehicle to add CLA to the culture medium by Satoryand Smith (1999) was suggested as a cause for thestimulation of lipid synthesis in CLA-treated cells (Sa-tory and Smith, 1999). I do not believe the presenceof ethanol can explain this observation because thestimulation is related to the CLA concentration andethanol was present at a low and constant concentra-tion in all plates, including the controls. Furthermore,in porcine stromal-vascular cells (i.e., preadipocytes),addition of 50 �M CLA (without ethanol) plus differ-entiation factors caused a 5+ times increase in OR-OSM after 2 d, compared to the control cells withoutCLA (R. L. McNeel and H. J. Mersmann, unpublisheddata). The OROSM did not continue to increase at 5or 7 d in the CLA-treated porcine cells as it did inthe control cells. Human preadipocytes treated withdifferentiation medium + CLA also acutely accumu-lated OROSM (R. L. McNeel and H. J. Mersmann,unpublished data). In this case, the human controlcells, i.e., without CLA, did not differentiate at all. Inboth porcine and human preadipocytes, there was avery slight numerical, but not statistical, increase inPPARγ mRNA concentration at the early stages ofdifferentiation when OROSM was dramatically in-creased. I propose that the stimulation of the porcineand human cell accumulation of OROSM results fromthe CLA acting as a ligand for PPARγ at the earlystages of differentiation when the capacity to synthe-size PPARγ ligands (perhaps fatty acids or fatty acidderivatives) is limited. This hypothesis is supportedby the observations that CLA can activate PPAR(Houseknecht et al., 1998; Belury and Vanden Heuval,1999); that the PPARγ mRNA (Ding et al., 1999) andprotein (Kim et al., 2000) are both present in porcinepreadipocytes at initiation of differentiation; and thathuman preadipocytes, in specific culture conditions,do not differentiate unless an exogenous PPARγ li-gand is added (Zen-Bio Inc., Research Triangle Park,NC; verified by R. L. McNeel and H. J. Mersmann,unpublished data).
At this time, the possibility cannot be excluded thatthe observed increase in OROSM does not representdifferentiation, but is the result of uptake of CLA bythe porcine and human cells with subsequent incorpo-ration into triacylglycerol, using existing enzymaticmachinery and measured as OROSM. If this hypothe-sis is valid, the capacity to synthesize triacylglycerolmust be considerable at the initiation of differentia-tion, because most cells have visible OROSM at 2 and7 d for porcine and human cells, respectively. The
hypothesis is not supported by the low amount of glyc-erol-P dehydrogenase activity (the initiating enzymefor triacylglycerol synthesis) at the beginning of dif-ferentiation in porcine preadipocytes (Suryawan etal., 1997).
I also speculate that the reason CLA does not con-tinue to stimulate differentiation in porcine preadipo-cytes is that as the cells differentiate, they have in-creased capacity to synthesize long-chain fatty acidsthat are more potent and(or) more efficacious ligandsfor PPARγ. Under this circumstance, the CLA be-comes an inhibitor through competitive binding toPPARγ. The human preadipocytes have only limitedor no capacity to synthesize fatty acids. However, thesame type of competition with CLA is possible if thecells’ capacity to take up fatty acids from the mediumincreases during differentiation, as expected by theincrease in LPL during differentiation. In 3T3-L1 cellsdifferentiated with a thiazolidinedione PPARγ ligand,CLA inhibited the differentiation, and the CLA inhibi-tion was reversed by addition of linoleic acid (Brownet al., 2001a; Evans et al., 2001). These observationsare compatible with the concept of competition be-tween CLA and other ligands, including fatty acids,for PPARγ. Another possible mechanism for CLA-me-diated inhibition of differentiation is a decrease inADD1 as observed in differentiating porcine preadipo-cytes (S. T. Ding and H. J. Mersmann, unpublisheddata).
Overall, I conclude that CLA decreases preadipo-cyte differentiation, at least under some circum-stances. Certainly there is evidence to the contraryand even evidence that CLA might stimulate differen-tiation under some circumstances. There is little orno evidence for CLA modulation of differentiation invivo, but the observations of decreased fat depositionin vivo suggest that there is no evidence for continuousCLA-mediated stimulation of differentiation in vivo.Of course, the pig growth trials with no change infat deposition in the presence of CLA suggest that ifdecreased differentiation is a mechanism in vivo, itmay not be consistent, at least in pigs.
Energy Expenditure
A potential mechanism, operative at the whole-ani-mal level, to decrease fat deposition would be an in-crease in energy expenditure. To be effective, thiswould have to occur without increased feed consump-tion. In mice fed both low-fat and high-fat diets, CLAtreatment caused an increase in energy expenditure(West et al., 1998, 2000). Several other laboratoriesreported no change in energy expenditure in mice(Tsuboyama-Kasaokaet et al., 2000; Miner et al.,2001), rats (Azain, et al., 2000), or pigs (Muller et al.,1999, 200).
Although not clearly established, uncoupling pro-tein 2 may function to disconnect energy conservationfrom substrate oxidation. Thus, heat production

MersmannE130
would increase and energy conservation would de-crease. This protein was increased in white and brownadipose tissue from mice fed CLA (Tsuboyama-Ka-saoka et al., 2000); however, in another study, theprotein was increased in brown, but not white adiposetissue (West et al., 2000).
Increased energy expenditure may be a mechanismto decrease fat deposition in some CLA-treated ani-mals, but it does not appear to be a universal mecha-nism operative across species or even a consistentmechanism in mice.
Fatty Acid Oxidation
An increase in fatty acid oxidation might be ex-pected to reduce the availability of fatty acids for syn-thesis of triacylglycerol, and consequently decreasefat deposition. A decreased respiratory quotient (RQ)represents increased fat oxidation. A decreased RQwas observed in mice fed a low-fat diet containingCLA, but not in mice fed a high-fat diet containingCLA (West et al., 1998). In pigs and sows, dietaryCLA did not affect the RQ (Muller et al., 1999, 2000).Carnitine palmitoyltransferase is the enzyme respon-sible for initiation of the transport of fatty acids intothe mitochondrion for oxidation. Activity of this en-zyme was increased in white and brown adipose tissueof rats fed CLA (Rahman et al., 2001) and in adiposetissue and muscle of mice fed CLA (Park et al., 1997).As with many potential mechanisms, the evidence forincreased fatty acid oxidation being a factor in theCLA-mediated reduction in fat deposition is restrictedto individual studies.
Adipose Tissue Lipid Synthesis
Because much of the growth of adipose tissue, inmany species, is by cell hypertrophy resulting fromincreased accretion of triacylglycerol in adipocytes,inhibition of adipocyte lipid synthesis would decreasefat deposition. There was decreased milk fat in dairycows (Loor and Herbein, 1998; Chouinard et al., 1999;Baumgard et al., 2000) and sows (M. J. Azain, per-sonal communication) fed CLA. There was decreasedglucose incorporation into adipose tissue lipids in av-erage-lean, but not high-lean pigs fed CLA (M. Heck-art, S.Donkin, and S. Mills, personal communication).The activity of glycerol-P dehydrogenase and(or) theamount of triacylglycerol deposited was decreased inCLA-treated 3T3-L1 cells (Brodie et al., 1999; Evanset al., 2000; J. M. Brown and M. McIntosh, personalcommunication). The activity of phosphatidate phos-phohydrolase, perhaps the rate-limiting enzyme intriacylglycerol synthesis, was decreased in adiposetissue of CLA-fed rats (Rahman et al., 2001). In sup-port of these observations of decreased lipid synthesis,the transcript concentrations for fatty acid synthaseand acetyl-CoA carboxylase were decreased in adiposetissue from mice fed CLA (Tsuboyama-Kasaoka et al.,
2000), and the fatty acid synthase mRNA was de-creased in adipose tissue from average-lean, but nothigh-lean pigs fed CLA (M. Heckart, S. Donkin, andS. Mills, personal communication).
Lipoprotein lipase (LPL) is synthesized in the adipo-cyte and migrates to the endothelial cell surface,where it functions to cleave fatty acids from circulat-ing lipoproteins. The fatty acids can then enter theadipocyte to be oxidized or to serve as building blocksfor complex lipid synthesis, including the storage de-pot lipid, triacyglycerol. A decrease in LPL activitywould decrease the fatty acid available for triacylglyc-erol synthesis and thus would decrease lipid deposi-tion. Although very low concentrations of CLA causean increase in LPL activity in 3T3-L1 cells, higherconcentrations inhibit the enzyme activity (Park etal., 1997, 1999; Lin et al., 2001). Plasma triacylglyc-erol concentration was increased in pigs fed CLA, sug-gesting less uptake of lipids (Ostrowska et al., 1999a).
Mouse (Tsuboyama-Kasaoka et al., 2000), rat(Azain et al., 2000), and pig (V. L. Adams and S. B.Smith, personal communication) adipocyte cell sizewas decreased in animals fed CLA. A decrease in adi-pocyte size suggests a decrease in anabolic lipid me-tabolism in those cells.
There are data that do not support the concept ofdecreased adipose tissue lipid synthesis. There wasno decrease in deuterated water incorporation intolipids in vivo, in mice fed CLA (West et al., 2000).Also, there was no decrease in adipose tissue malicenzyme or glucose-6P dehydrogenase activities (en-zymes supporting de novo fatty acid biosynthesis) inrats fed CLA (Rahman et al., 2001). Although LPLactivity decreased in 3T3-L1 cells treated with 100�M CLA, it increased in cells treated with 10 �M CLA(Lin et al., 2001). Glucose incorporation into lipidsincreased in 3T3-L1 cells treated with CLA (Satoryand Smith, 1999), and lipid deposition increased inporcine and human preadipocytes in vitro (R. L.McNeel and H. J. Mersmann, unpublished data).
Overall, there is a great deal of evidence that lipidsynthetic processes are decreased in adipose tissuefrom CLA-treated animals or cells. This suggests thatgenetic or metabolic regulation of these syntheticpathways may provide a mechanism by which CLAdecreases fat deposition, at least in many situations.It does not exclude the possibility that all of theseeffects are secondary responses and not the primarymechanism by which CLA lowers fat deposition.
Lipolysis
The sequential release of fatty acids from triacyl-glycerol, or lipolysis, is the highly regulated process oflipid degradation in the adipocyte. Increased lipolysiswould be expected to lead to decreased fat deposition.The lipolytic rate of CLA-treated 3T3-L1 cells wasalmost double that of control cells (Park et al., 1997,1999). Plasma nonesterified fatty acid concentration

Conjugated linoleic acid and fat deposition E131
was elevated in pigs fed CLA, suggesting an increasedrate of lipolysis (Ostrowska et al., 1999a). Acute incu-bation of human preadipocytes with CLA did not in-crease the lipolytic rate, although isoproterenol stim-ulated lipolysis in these cells, indicating they had thecapacity for lipolysis (J. M. Brown and M. McIntosh,personal communication). Increased lipid degradationmay contribute to decreased fat deposition in CLA-treated cells or animals, but at this time, there areonly a few studies.
Stearoyl-CoA Desaturase
This enzyme catalyzes the conversion of long-chainsaturated fatty acids to monounsaturated fatty acids.The usual substrates are palmitic acid (C16:0) andstearic (C18:0) acids, which are converted to palmito-leic acid (C16:1) and oleic acid (C18:1), respectively.The mRNA concentration for stearoyl-CoA desaturase(SCD) was decreased in mice fed CLA (Lee et al.,1998). The mRNA concentration was also decreasedin average-lean, but not in high-lean pigs fed CLA (M.Heckart, S. Donkin, and S. Mills, personal communi-cation). Numerous studies demonstrated modifiedfatty acid composition in various tissues of animalsfed CLA or cells treated with CLA. There was eitherincreased C16:0 and(or) C18:0 concentration coupledwith decreased C16:1 and(or) C18:1 concentration, ora decreased C16:1 to C16:0 and(or) a decreased C18:1to C18:0 ratio. This modification in fatty acid composi-tion strongly suggests inhibition of SCD activity in3T3-L1 cells (Satory and Smith, 1999), mice (Lee etal., 1998), rats (Yamasaki et al., 1999; Azain et al.,2000), pigs (O’Quinn et al., 2000a) (L. A. Gatlin andJ. Odle; V. L. Adams and S. B. Smith, personal commu-nications), and in dairy cow (Loor and Herbein, 1998;Chouinard et al., 1999; Baumgard et al., 2000) andsow (Bee, 2000) milk. The decrease in monounsatur-ated fatty acids coupled with an increase in saturatedfatty acids is expected to decrease membrane fluidity,and could modify the function of multiple membranebound structural and enzymatic proteins. Thus, inhi-bition of SCD may be a primary mechanism in CLA-fed animals, initiating many of the other metabolicchanges observed in specific aspects of metabolism ofthe adipocyte or of other tissues.
There is evidence of inhibited SCD in both male andfemale rats fed CLA (M. J. Azain, personal communi-cation). However, in these studies, only the femaleand not the male rats had decreased fat depositionafter feeding CLA. This observation suggests that in-hibition of SCD may not be pivotal to the mechanismfor decreasing fat deposition in CLA-fed animals.
Eicosanoids
These molecules are powerful, positive and negativeregulators of multiple aspects of metabolism. Linoleicacid (C18:2- cis 9, cis 12) is metabolized to arachidonic
acid (C20:4-cis 5, cis 8, cis 11, cis 14), a major precursorof eicosanoid molecules. One might postulate thatCLAs (cis 9, trans 11-C18:2 or trans 10, cis 12-C18:2)would be metabolized in a fashion similar to linoleicacid (cis9, cis12-C18:2). For example, 10,12-CLAmight be metabolized to the arachidonic acid analog,C20:4-cis 5, cis 8, trans 12, cis 14. Given this hypothe-sis, linoleic acid and CLA would compete for the sameenzymes. In animals deficient for linoleic acid, itwould be expected that more CLA would be convertedto eicosanoid molecules. If eicosanoids are the media-tors of CLA effects, the response to CLA would beexpected to be greater in animals that are linoleicacid-deficient than in control animals with adequatelinoleic acid. In mice deficient for linoleic acid, theCLA treatment led to a greater decrease in fat deposi-tion than in control mice, supporting the hypothesisthat eicosanoid molecules mediate at least some of theCLA effects (K. Hargrave and J. L. Miner, personalcommunication). At this time, there are too few datato firmly conclude that the mechanism for the CLA-mediated reduction in fat deposition is mediatedthrough eicosanoids.
Leptin
This protein is produced by the adipocyte, is se-creted into the plasma, and provides satiety signalsto the hypothalamus. The amount of leptin producedis related to the size of the adipocyte, and the plasmaconcentration is related to the adipose tissue mass.Plasma leptin was reduced in mice (DeLany et al.,1999), rats (Rahman et al., 2001), and humans (Me-dina et al., 2000) treated with CLA. However, there islittle evidence of increased feed consumption in CLA-treated mice or rats, as might be expected when theplasma leptin concentration is lowered. My interpre-tation is that the decreased leptin concentrations re-sult from the decreased adipocyte size and(or) de-creased adipose tissue mass present in CLA-treatedanimals.
Apoptosis
Increased adipocyte apoptosis, the process of cellu-lar degradation, could contribute or even be a primarycause for the decreased fat deposition in CLA-treatedanimals. Mice treated with CLA for 7 to 9 d had in-creased adipocyte DNA fragmentation, an evidencefor increased apoptosis (Tsuboyama-Kasaoka et al.,2000; Miner et al., 2001). Confluent 3T3-L1 clonalpreadipocytes treated with 100 �M CLA had morecells with condensed nuclei, also an evidence for in-creased apoptosis (Evans et al., 2000). Increasedapoptosis may be a fundamental mechanism to yieldan apparent decrease in cell proliferation and differ-entiation, and ultimately to decrease fat deposition inCLA-treated animals or cells. A word of caution mustbe inserted, because CLA can be quite toxic to cells,

MersmannE132
as observed by several investigators. Thus, at someconcentrations, CLA may produce a toxic environ-ment, so that increased apoptosis is a secondary mech-anism or perhaps an artifact. The role of CLA toxicityto cells in vivo has not been investigated.
Tumor Necrosis Factor-α
Tumor necrosis factor-α (TNFα) is a major media-tor of the inflammatory response, and has multiplebiological effects. Among these effects are decreasedadipocyte differentiation (Petruschke and Hauner,1993), increased lipolysis, and decreased LPL activity(Hauner et al., 1995). The TNFα mRNA concentrationwas decreased in adipose tissue from mice fed CLA,and might be a driving force for the increase inapoptosis (Tsuboyama-Kasaoka et al., 2000). A de-crease in TNFα would be expected to decrease lipolysisand increase LPL activity; potentially, both of theseeffects would produce more fat deposition, not less.Whether TNFα has a primary role in the CLA-medi-ated decrease in fat deposition awaits further investi-gation.
Conclusions
At this time, there is evidence for multiple mecha-nisms to execute the CLA-mediated reduction in fatdeposition observed in numerous species and in cul-tured cells. The evidence, so far, does not indicate aprimary mechanism to explain the effects of CLA onfat deposition. Some mechanisms are found only in asingle species or even in a single laboratory, sug-gesting they probably are not universal mechanisms,but may be applicable only under specific conditions.Although a potential mechanism, such as decreasedadipocyte lipid synthesis, that is, de novo fatty acidsynthesis, triacylglycerol synthesis, lipoprotein lipaseactivity, is observed in a considerable number of stud-ies across species, there are some negative results.Furthermore, a complex and multiple-step processsuch as lipid synthesis is probably not the focus for aprimary mechanism in cells and animals treated withCLA. The CLA-mediated modulation of lipid synthesisprobably is an effect rather than a cause. The bodyof evidence to support several possible mechanisms(decreased plasma leptin, increase adipocyteapoptosis, increased plasma TNFα) is very small atthis time. The generalized mechanism for CLA-medi-ated effects on fat deposition may lie in a more funda-mental step, such as modulation of the transcriptionfactors, PPARγ or ADD1, which in turn, could affectmultiple metabolic pathways. The inhibition of SCD,perhaps controlled by PPARγ, is an interesting possi-bility because it would alter membrane and complexlipid composition to potentially affect multiple meta-bolic processes. Species variation will have to be fac-tored into the description of CLA-mediated decreasedfat deposition. It is expected to complicate the picture
because of species-specific protein structure and func-tion, and metabolic pathway divergence, including in-tra- and interorgan processing of lipids and lipo-proteins.
Implications
Conjugated linoleic acid (CLA) decreases fat deposi-tion when fed to several mammalian species andchickens. The practicality of feeding CLA to a meat-producing animal, such as the pig, is yet to be deter-mined because there are both positive and negativedata. Among the mechanisms proposed to explain theCLA-mediated decreased fat deposition are increasedenergy expenditure, fat oxidation, fat cell lipid degra-dation, or fat cell destruction. Also, decreased fat cellprecursors, fat cell development, fat synthesis, or de-saturation of fats could decrease fat deposition. Somemechanisms appear to be species-specific. Othermechanisms may be secondary rather than the pri-mary cause. The primary mechanism probably residesin regulation of a few key genes that control a numberof aspects of metabolism. The transcription factor,PPARγ, is a candidate gene because it binds and isactivated by CLA. However, the mechanism by whichCLA reduces fat deposition remains unclear.
Literature Cited
Azain, M. J., D. B. Hausman, M. B. Sisk, W. P. Flatt, and D. E.Jewell. 2000. Dietary conjugated linoleic acid reduces rat adi-pose tissue cell size rather than cell number. J. Nutr.130:1548–1554.
Baumgard, L. H., B. A. Corl, D. A. Dwyer, A. Saebo, and D. E.Bauman. 2000. Identification of the conjugated linoleic acidisomer that inhibits milk fat synthesis. Am. J. Physiol.278:R179–184.
Bee, G. 2000. Dietary conjugated linoleic acids alter adipose tissueand milk lipids of pregnant and lactating sows. J. Nutr.130:2292–2298.
Belury, M. A., and J. P. Vanden Heuval. 1999. Modulation of diabe-tes by conjugated linoleic acid. In: M. P. Yurawecz, M. M.Mossoba, J. K. G. Kramer, M. W. Pariza, and G. J. Nelson (ed.)Advances in Conjugated Linoleic Acid Research. pp 404–411.AOCS Press, Champaign, IL.
Berven, G. A., A. Bye, O. Hais, H. Blankson, H. Fagerton, E. Thom,J. Wadstein, and O. Gudmundsen. 2000. Safety of conjugatedlinoleic acid (CLA) in overweight or obese human volunteers.Eur. J. Lipid Sci. Technol. 102:455–462.
Blankson, H., J. A. Stakkestad, H. Fagertun, E. Thom, J. Wadstein,and O. Gudmundsen. 2000. Conjugated linoleic acid reducesbody fat mass in overweight and obese humans. J. Nutr.130:2943–2948.
Brodie, A. E., V. A. Manning, K. R. Ferguson, D. E. Jewell, and C.Y. Hu. 1999. Conjugated linoleic acid inhibits differentiationof pre- and post-confluent 3T3-L1 preadipocytes but inhibitscell proliferation only in preconfluenct cells. J. Nutr.129:602–606.
Brown, M., M. Evans, and M. McIntosh. 2001a. Linoleic acid par-tially restores the triglyceride content of ocnjugated linoleicacid-treated cultures of 3T3-L1 preadipocytes. J. Nutr. Bio-chem. 12:381–387.
Brown, J. M., Y. D. Halvorsen, Y. R. Lea-Currie, C. Geigerman,and M. McIntosh. 2001b. Trans-10, cis-12, but not cis-9, trans-11, conjugated linoleic acid attenuates lipogenesis in primary

Conjugated linoleic acid and fat deposition E133
cultures of stromal vascular cells from human adipose tissue.J. Nutr. 131:2316–2321.
Brun, R. P., J. B. Kim, E. Hu, and B. M. Spiegelman. 1997. Peroxi-some proliferator-activated receptor gamma and the controlof adipogenesis. Curr. Opin. Lipidol. 8:212–218.
Chouinard, P. Y., L. Corneau, D. M. Barbano, L. E. Metzger, andD. E. Bauman. 1999. Conjugated linoleic acids alter milk fattyacid composition and inhibit milk fat secretion in dairy cows.J. Nutr. 129:1579–1584.
de Deckere, E. A., J. M. van Amelsvoort, G. P. McNeill, and P.Jones. 1999. Effects of conjugated linoleic acid (CLA) isomerson lipid levels and peroxisome proliferation in the hamster.Br. J. Nutr. 82:309–317.
DeLany, J. P., F. Blohm, A. A. Truett, J. A. Scimeca, and D. B.West. 1999. Conjugated linoleic acid rapidly reduces body fatcontent in mice without affecting energy intake. Am. J. Physiol.276:R1172–1179.
Ding, S. T., R. L. McNeel, and H. J. Mersmann. 1999. Expressionof porcine adipocyte transcripts: tissue distribution and differ-entiation in vitro and in vivo. Comp. Biochem. Physiol.123B:307–318.
Dugan, M. E. R., J. L. Aalhus, A. L. Schaefer, and J. K. G. Kramer.1997. The effect of conjugated linoleic acid on fat to lean repar-titioning and feed conversion in pigs. Can. J. Anim. Sci.77:723–725.
Evans, M., G. Geigerman, J. Cook, L. Curtis, B. Kuebler, and M.McIntosh. 2000. Conjugated linoleic acid suppresses triglycer-ide accumulation and induces apoptosis in 3T3-L1 preadipo-cytes. Lipids 35:899–910.
Evans, M., Y. Park, M. Pariza, L. Curtis, B. Kuebler, and M. McIn-tosh. 2001. Trans-10, cis-12 conjugated linoleic acid reducestriglyceride content while differentially affecting peroxisomeproliferator activated receptor gamma2 and aP2 expression in3T3-L1 preadipocytes. Lipids 36:1223–1232.
Fajas, L., J. C. Fruchart, and J. Auwerx. 1998. Transcriptionalcontrol of adipogenesis. Curr. Opin. Cell Biol. 10:165–173.
Hauner, H., T. Petruschke, M. Russ, K. Rohrig, and J. Eckel. 1995.Effects of tumour necrosis factor alpha (TNF alpha) on glucosetransport and lipid metabolism of newly-differentiated humanfat cells in cell culture. Diabetologia 38:764–771.
Houseknect, K. L., J. P. Vanden Heuvel, S. Y. Moya-Camarena, C.P. Portocarrero, L. W. Peck, K. P. Nickel, and M. A. Belury.1998. Dietary conjugated linoleic acid normalizes impairedglucose tolerance in the Zucker diabetic fatty fa/fa rat. Bio-chem. Biophys. Res. Commun. 244:678–682.
Kim, H. S., G. J. Hausman, D. B. Hausman, R. J. Martin, andR. G. Dean. 2000. The expression of peroxisome proliferator-activated receptor gamma in pig fetal tissue and primary stro-mal-vascular cultures. Obes. Res. 8:83–88.
Kim, J. B., and B. M. Spiegelman. 1996. ADD1/SREBP1 promotesadipocyte differentiation and gene expression linked to fattyacid metabolism. Genes Dev. 10:1096–1107.
Kim, J. B., H. M. Wright, M. Wright, and B. M. Spiegelman. 1998.ADD1/SREBP1 activates PPARgamma through the productionof endogenous ligand. Proc. Natl. Acad. Sci. USA 95:4333–4337.
Kliewer, S. A., S. S. Sundseth, S. A. Jones, P. J. Brown, G. B.Wisely, C. S. Koble. P. Devchand, W. Wahli, T. M. Wilson, J.M. Lenhard, and J. M. Lehmann. 1997. Fatty acids and eicosa-noids regulate gene expression through direct interactionswith peroxisome proliferator-activated receptors alpha andgamma. Proc. Natl. Acad. Sci. USA 94:4318–4323.
Lee, K. N., M. W. Pariza, and J. M. Ntambi. 1998. Conjugatedlinoleic acid decreases hepatic stearoyl-CoA desaturase mRNAexpression. Biochem. Biophys. Res. Commum. 248:817–821.
Lin, Y., A. Kreeft, J. A. E. Schuurbiers, and R. Draijer. 2001. Differ-ent effects of conjugated linoleic acid isomers on lipoproteinlipase activity in 3T3-L1 adipocytes. J. Nutr. Biochem.12:183–189.
Loor, J. J., and J. H. Herbein. 1998. Exogenous conjugated linoleicacid isomers reduce bovine milk fat concentration and yield
by inhibiting de novo fatty acid synthesis. J. Nutr.128:2411–2419.
Mandrup, S., and M. D. Lane. 1997. Regulating adipogenesis. J.Biol. Chem. 272:5367–5370.
Martin, J. C., S. Gregoire, M. H. Siess, M. Genty, J. M. Chardigny,O. Berdeaux, P. Juaneda, and J. L. Sebedio. 2000. Effects ofconjugated linoleic acid isomers on lipid-metabolizing enzymesin male rats. Lipids 35:91–98.
Medina, E. A., W. F. Horn, N. L. Keim, P. J. Havel, P. Benito, D.S. Kelley, G. J. Nelson, and K. L. Erickson. 2000. Conjugatedlinoleic acid supplementation in humans: effects on circulatingleptin concentrations and appetite. Lipids 35:783–788.
Miner, J. L., C. A. Cederberg, M. K. Nielsen, X. Chen, and C. A.Baile. 2001. Conjugated linoleic acid (CLA), body fat, andapoptosis. Obes. Res. 9:129–134.
Muller, H. L., G. I. Stangl, and M. Kirchgessner. 1999. Energybalance of conjugated linoleic acid-treated pigs. J. Anim. Phys-iol. Anim. Nutr. 81:150–156.
Muller, H. L., M. Kirchgessner, F. X. Roth, and G. I. Stangl. 2000.Effect of conjugated linoleic acid on energy metabolism in grow-ing-finishing pigs. J. Anim. Physiol. Anim. Nutr. 83:85–94.
O’Quinn, P. R., J. L. Nelssen, R. D. Goodband, J. A. Unruh, J. C.Woodworth, J. S. Smith, and M. D. Tokach. 2000a. Effectsof modified tall oil versus a commercial source of conjugatedlinoleic acid and increasing levels of modified tall oil on growthperformance and carcass characteristics of growing-finishingpigs. J. Anim. Sci. 78:2359–2368.
O’Quinn, P. R., J. L. Nelseen, J. A. Unruh, R. D. Goodband, J.C. Woodworth, and M. D. Tokach. 2000b. Effects of feedingmodified tall oil and supplemental potassium and magnesiumon growth performance, carcass characteristics, and meatquality of growing-finishing pigs. Can. J. Anim. Sci. 80:443–449.
Ostrowska, E., M. Muralitharan, R. F. Cross, D. E. Bauman, andF. R. Dunshea. The effect of dietary conjugated linoleic acidand fat on plasma metabolites in finisher pigs. In: P. D. Cran-well (ed.) 1999a. Australian Pig Science Association, Werribee.p 257.
Ostrowska, E., M. Muralitharan, R. F. Cross, D. E. Bauman, and F.R. Dunshea. 1999b. Dietary conjugated linoleic acids increaselean tissue and decrease fat deposition in growing pigs. J. Nutr.129:2037–2042.
Pariza, M. W., Y. Park, and M. E. Cook. 2000. Mechanisms of actionof conjugated linoleic acid: evidence and speculation. Proc. Soc.Exp. Biol. Med. 223:8–13.
Pariza, M. W., Y. Park, and M. E. Cook. 2001. The biologicallyactive isomers of conjugated linoleic acid. Prog. Lipid Res.40:283–298.
Park, Y., K. J. Albright, W. Liu, J. M. Storkson, M. E. Cook, andM. W. Pariza. 1997. Effect of conjugated linoleic acid on bodycomposition in mice. Lipids 32:853–858.
Park, Y., J. M. Storkson, K. J. Albright, W. Liu, and M. W. Pariza.1999. Evidence that the trans-10,cis-12 isomer of conjugatedlinoleic acid induces body composition changes in mice. Lipids34:235–241.
Petruschke, T., and H. Hauner. 1993. Tumor necrosis factor-alphaprevents the differentiation of human adipocyte precursor cellsand causes delipidation of newly developed fat cells. J. Clin.Endocrinol. Metab. 76:742–747.
Rahman, S. M., Y. Wang, H. Yotsumoto, J. Cha, S. Han, S. Inoue,and T. Yanagita. 2001. Effects of conjugated linoleic acid onserum leptin concentration, body-fat accumulation, and beta-oxidation of fatty acid in OLETF rats. Nutrition (Jpn)17:385–390.
Satory, D. L., and S. B. Smith. 1999. Conjugated acid inhibits prolif-eration but stimualtes lipid filling of murine 3T3-L1 preadipo-cytes. J. Nutr. 129:92–97.
Simon, O., K. Manner, K. Schafer, A. Sagredos, and K. Eder. 2000.Effects of conjugated linoleic acids on protein to fat proportions,fatty acids, and plasma lipids in broilers. Eur. J. Lipid Sci.Technol. 102:402–410.

MersmannE134
Stangl, G. I. 2000. Conjugated linoleic acids exhibit a strong fat-to-lean partitioning effect, reduce serum VLDL lipids and re-distribute tissue lipids in food-restricted rats. J. Nutr.130:1140–1146.
Suryawan, A., L. V. Swanson, and C. Y. Hu. 1997. Insulin andhydrocortisone, but not triiodothyronine, are required for thedifferentiation of pig preadipocytes in primary culture. J.Anim. Sci. 75:105–111.
Szymczyk, B., P. M. Pisulewski, W. Szczurek, and P. Hanczakowski.2001. Effects of conjugated linoleic acid on growth perfor-mance, feed conversion efficiency, and subsequent carcassquality in broiler chickens. Br. J. Nutr. 85:465–473.
Tontonoz, P., E. Hu, and B. M. Spiegelman. 1994. Stimulation ofadipogenesis in fibroblasts by PPAR gamma 2, a lipid-activatedtranscription factor. Cell 79:1147–1156.
Tsuboyama-Kasaoka, N., M. Takahashi, K. Tanemura, H. J. Kim,T. Tange, H. Okuyama, M. Kasai, S. Ikemoto, and O. Ezaki.2000. Conjugated linoleic acid supplementation reduces adi-pose tissue by apoptosis and develops lipodystrophy in mice.Diabetes 49:1534–1542.
West, D. B., J. P. Delany, P. M. Camet, F. Blohm, A. A. Truett, andJ. Scimeca. 1998. Effects of conjugated linoleic acid on bodyfat and energy metabolism in the mouse. Am. J. Physiol.275:R667–672.
West, D. B., F. Y. Blohm, A. A. Truett, and J. P. DeLany. 2000.Conjugated linoleic acid persistently increases total energyexpenditure in AKR/J mice without increasing uncoupling pro-tein gene expression. J. Nutr. 130:2471–2477.
Yamasaki, M., K. Mansho, H. Mishima, M. Kasai, M. Sugano, H.Tachibana, and K. Yamada. 1999. Dietary effect of conjugatedlinoleic acid on lipid levels in white adipose tissue of Sprague-Dawley rats. Biosci. Biotechnol. Biochem. 63:1104–1106.
Yurawecz, M. P., M. M. Mossoba, J. K. G. Kramer, M. W. Pariza,and G. J. Nelson. 1999. Advances in Conjugated Linoleic AcidResearch. AOCS Press, Champaign, IL.
Zambell, K. L., N. L. Keim, M. D. Van Loan, B. Gale, P. Benito, D.S. Kelley, and G. J. Nelson. 2000. Conjugated linoleic acidsupplementation in humans: effects on body composition andenergy expenditure. Lipids 35:777–782.
The role of nutrition in reducing nutrient output from ruminants1
L. D. Satter,*2 T. J. Klopfenstein†, and G. E. Erickson†
*U.S. Dairy Forage Research Center, USDA-ARS, Madison, WI 53706 and†Department of Animal Sciences, University of Nebraska, Lincoln 68583
ABSTRACT: Much of the effort expended on nutrientmanagement has focused on the post-excretion product.It is important to keep in mind that management ofthe diet can have important impacts on quantitativeand qualitative aspects of the excreted nutrients. Sur-veys of nutritionists and extension specialists show thatdairy producers are advised to feed 0.45 to 0.50% phos-phorus (P) (DM basis) in their lactating cow diets. Thisis 20% in excess of NRC (2001) requirements. Feedingto requirement would reduce P excretion by 25 to 30%and would reduce solubility and potential for runoff ofthe P that is applied to fields. Nitrogen (N) excretionby dairy cows can also be decreased, but by a lesseramount. Balancing ruminally undegraded and de-graded protein and use of protected methionine alongwith strategic selection of protein supplements that arerelatively rich in lysine, may permit a 10 to 15% reduc-tion in total N excretion, with most of the reductionoccurring in urinary N. Urinary urea, following conver-sion to ammonia, is the N excretion product most vul-nerable for loss to the environment. Feedlot cattle rou-
Key Words: Cattle Manure, Dairy Wastes, Feedlot Wastes, Nitrogen, Phosphorus, Ruminants
2002 American Society of Animal Science. All rights reserved. J. Anim. Sci. 80(E. Suppl. 2):E143–E156
Introduction
Public scrutiny of the impact of agricultural practiceson the environment is growing. The livestock and poul-try industries have been targeted for attention becauseof their visibility, and for real as well as perceivedabuses. Large concentrations of animals in relativelysmall areas create difficult challenges in terms of odorand nutrient management, but problems of nutrient
1Trade names and the names of commercial companies are usedin this report to provide specific information. Mention of a trade nameor manufacturer does not constitute a guarantee or warranty of theproduct by the USDA or University of Nebraska or an endorsementover products not mentioned.
2Correspondence: 1925 Linden Drive West (phone: 608-264-5353;fax: 608-264-5147; E-mail: [email protected]).
Received July 26, 2001.Accepted May 16, 2002..
E143
tinely consume P in excess of NRC (1996) predictedrequirements, and recent research suggests the NRCestimates of the P requirements are high. Decreasingdietary P from the industry average (0.35% P) to theNRC predicted requirement (0.22 to 0.28%) decreasedP input by 33 to 45% and excretion by 40 to 50% innutrient balance studies. With grain-based feedlotdiets, overfeeding P is inevitable. At minimum, supple-mental P sources should be removed from diet formula-tions. More accurate formulation of feedlot diets forprotein provides opportunity for reducing N excretion.By using the NRC model for metabolizable protein, andby employing phase-feeding, N inputs may be decreasedby 10 to 20% from the feedlot industry average of 13.5%dietary CP. This translates into a 12 to 21% reductionin N excretion, and 15 to 33% reduction in ammoniavolatilization in open-dirt feedlot pens. Diet formula-tion can have an important impact on the amount of Nand P excreted in both dairy and beef. It is much easierto control potential pollutants by managing their re-lease into the environment than to recover or confinethem once they are released.
management can plague small as well as large animaloperations. One of the fundamental challenges facingthe livestock/feed industries is to recycle the flow of feednutrients, particularly nitrogen (N) and phosphorus (P)from animal manure back to cropland where they canagain be used for crop production. Anything short ofthis is not sustainable, and will ultimately be unaccept-able to the broader public.
Many aspects of this fundamental challenge involvemanure management and application methods to crop-land, and are beyond the scope of this paper. Thereis an important role for nutrition, however, becausedietary content of N and P has a direct effect on thequantity of N and P excreted in manure. To achieveeffective nutrient recycling, and to minimize environ-mental damage, application of manure nutrients mustbe limited to an amount that crops can utilize. Areaswith high livestock densities will have to transport ma-nure nutrients over longer distances to avoid overappli-

Satter et al.E144
cation of nutrients, or alternatively, to relocate animalsto where cropland is available for manure application.Feeding less N and P, to the extent possible, will reducethe land area required for manure application.
The objective of this paper is to review protein andphosphorus nutrition of lactating dairy cows and feedlotbeef animals, with a view to decreasing the environmen-tal impact of N and P in dairy and feedlot manure.
Impact of dietary protein onnitrogen output in manure
Discussion will be limited to N and P in dairy and beeffeedlot situations. Seldom are N and P of environmentalconcern in extensive grazing operations. Also, an excel-lent review on P nutrition of grazing beef cattle is avail-able (Karn, 2001). Excess N can lead to nitrate contami-nation of groundwater and release of ammonia and ni-trous oxide to the atmosphere, resulting in acid rainand formation of small particles in the atmosphere.Phosphorus can be transported with eroded soil parti-cles or solubilized in surface runoff, fertilizing surfacewaters and hastening eutrophication of lakes andstreams.
Most proteins are highly digestible in the ruminantgastrointestinal tract, and true digestibility is usuallyin excess of 80%. Undigested protein is excreted in thefeces, while the digested protein is either converted intoanimal tissue or milk protein, or converted to urea inthe liver and excreted as urea by the kidney. Some ofthe urea is recycled back into the gastrointestinal tractand incorporated into gut microbes. Subsequently,some of the N incorporated into gut microbes is excretedin feces as microbial residue. The amount as well asthe route of N excretion can have an important effecton the environmental impact of manure N.
Dairy Cattle
It goes without saying that reducing dietary proteinto the minimum necessary to meet requirements willminimize excretion of N in urine and feces. Likewise,increasing milk production so more nutrients are parti-tioned to product (milk) formation relative to mainte-nance will have an impact on whether dietary N endsup in milk or in feces and urine. Clearly, improvementsin N utilization can be made in both diet formulationand in increasing the production level of lactating cows.The ensuing discussion, however, will focus on effect ofdiet on excretion of N at a given milk production level.
The relative high cost of protein has provided incen-tive for dairy producers to avoid excessive protein con-centrations in the diet. While overfeeding of proteindoes occur, it is somewhat less than overfeeding of someother nutrients, such as P.
Kohn et al. (1997) have done a sensitivity analysisof N losses from dairy farms, and concluded that thereis great potential to reduce N loading by improving herdnutritional efficiency, and by optimizing crop selection
to control the source of N input to the farm and toimprove crop nutrient uptake. They further concludedthat reducing losses of N from manure collection, stor-age and application would be about one-fourth as effec-tive as either improving herd nutritional efficiency oroptimizing crop selection.
In order to obtain some estimate of how much impactdietary manipulation of N can have on total N excretion,let us examine two situations. Situation A is wherehigh moisture alfalfa silage is the only forage (55%of diet DM), high moisture ground corn is the majorconcentrate ingredient, and the protein supplement issoybean meal, a relatively easily degraded proteinsource. Using the NRC (2001) model for estimating theprotein requirement, 20.8% CP is required in the dietfor cows producing 40.8 kg milk/d at 90 d in lactation.Situation B is again where forage constitutes 55% ofration DM, but the forage source is 50% alfalfa hay and50% corn silage, dry ground corn is the major concen-trate ingredient, and the protein supplement is primar-ily a mixture of corn distiller’s grains, meat and bonemeal, blood meal and expeller soybean meal, proteinsources with a relatively large proportion of RUP. Usingthe NRC (2001) model, 15.8% CP is required for 40.8kg milk/d at 90 d in lactation with this diet. In bothexamples, RUP supply was exactly matched with theRUP requirement. In the first example, however, excessRDP was fed in order to meet the RUP requirement.
While there is no assurance that the NRC model isaccurately portraying these examples, it does stronglysuggest that choosing between all alfalfa silage as theforage or a 50:50 mix of alfalfa silage:corn silage, alongwith an appropriate choice of protein supplements, canhave a large impact on the amount of CP needed in theration to supply adequate amounts of RUP. The CP inalfalfa silage is largely RDP, reflecting the fact that 50to 60% of total N in alfalfa silage is typically in nonpro-tein nitrogen form (Luchini et al., 1997). Studies whichshow that protein is more limiting for milk productionthan energy when diets high in alfalfa silage contentare fed (Dhiman and Satter, 1993; Dhiman et al., 1993)further augment the point that alfalfa silage is a poorsource of RUP. Diets high in alfalfa content are difficultto balance for efficient protein utilization.
Wu and Satter (2000) measured milk production re-sponse to four different amounts of protein supplemen-tation in a complete lactation study utilizing 58 multi-parous cows. Milk N secretion was estimated from milkproduction and milk composition measurements, andtotal manure N calculated as total N intake minus milkN. The four treatments were as follows, where the firstnumber is the dietary CP content (% of diet DM) duringthe first 16 wk of lactation, and the second number isthe protein content for wk 17 to 44 of lactation: 15.4 to16.0, 17.4 to 16.0, 17.4 to 17.9, and 19.3 to 17.9. Dietswere formulated to maximize the supply of amino acidsto the intestine. Alfalfa silage and corn silage (3:2 DMbasis) provided the forage. Results are in Table 1. MilkN as a percentage of intake N for the complete lactation

Nutrition and nutrient output E145
Table 1. Milk yield, intake N, milk N, and manure N of cows fed diets varying inCP content during 308-d lactation (Wu and Satter, 2000)
Treatmentx
Item 15.4–16.0 17.4–16.0 17.4–17.9 19.3–17.9
(kilograms)
N 15 15 14 14Milk yield 10,056c 10,832b 11,095a 11,132a
3.5% FCM 10,690b 11,628a 11,804a 11,559a
Intake N 177.8c 189.1b 213.7a 214.2a
Milk N 51.2 48.9b 51.5 53.0a
Manure Ny 126.6c 140.2b 162.2a 161.2a
a,b,cValues without superscripts do not differ (P > 0.15) from other values within a row.xTreatments varying in dietary CP content: 15.4% during lactation wk 1 to 16 and 16.0% during wk 17
to 44 (15.4–16.0), 17.4% during wk 1 to 16 and 16.0% during wk 17 to 44 (17.4–16.0), 17.4% during wk 1to 16 and 17.9% during wk 17 to 44 (17.4–17.9), and 19.3% during wk 1 to 16 and 17.9% during wk 17–44(19.3–17.9).
yCalculated from intake N − milk N, assuming no net deposition or mobilization of tissue N.
was 28.8, 25.9, 24.1, and 24.7% for the four treatments.The low-protein diet was deficient for cows of this pro-duction capacity (10,000 to 11,000 kg milk/308 d). Thehigh-protein diet appeared slightly in excess of require-ment. Reducing N intake by 17% in this experiment(from high treatment to the low treatment) resulted ina 21% reduction in manure N, but it also caused a 10%reduction in milk production.
Three other studies conducted under circumstancessimilar to this study, but only during early lactation,have been reported (Christensen et al., 1993; Cunning-ham et al., 1996; Komaragiri and Erdman, 1997). Inall cases, relatively high-producing Holstein cows wereused, and corn silage, alfalfa, or both provided the for-age. Corn was the major grain source, and protein sup-plements high in RUP were used to raise dietary proteinfrom an average of 16.7% to an average of 19.6% CP.Two (Cunningham et al., 1996; Komaragiri and Erd-man, 1997) of the three studies reported nonsignificantincreases in milk production, while the third studynoted a very small, nonsignificant decline in milk pro-duction as dietary protein was increased. Taking allfour studies into consideration, we conclude that anincrease in peak production from feeding more than17.5% CP is possible, but the increase from feedingmore than 17.5% CP in early lactation to high-produc-ing cows fed corn silage, alfalfa, corn grain, and proteinsupplements having relatively high RUP values will bemarginally profitable at best. Feeding diets with morethan 17.5% CP in early lactation (assuming diets aresimilar to what has been herein described) will simplyadd cost and unwanted amounts of N to urine andmanure.
Using extreme examples, it is possible to demonstratethat dietary CP could be reduced for high-producingcows from 20 to 21% of diet DM to approximately 16%through diet modification, without impairing milk pro-duction. This would result in 22% less dietary N andapproximately a 30% reduction in excreted N. Practi-cally speaking, however, reducing dietary protein from
about 17.5 to 18.5% to 16% through more precise rationbalancing for high-producing cows is a more likely goal.This would result in a 10 to 15% reduction in dietaryN, and a 13 to 20% reduction in excreted N.
Diet influences not only the amount of N excreted,but also the relative proportion of N in urine and feces.This can be important in that most of the urinary Nwill be in the form of urea, and urea can be quicklyhydrolyzed by fecal microbes to ammonia when urineand feces mix following excretion. Ammonia is veryvulnerable to being volatilized and lost to the atmo-sphere. Nitrogen in feces is more stable and less likelyto be volatilized. The objective, therefore, would be tominimize urinary N relative to fecal N. Feeding lessdietary N will likely decrease both fecal and urinary N,but will in most cases decrease urinary N the most.
Based on a compilation of 1801 nitrogen balance stud-ies conducted at the USDA-ARS energy metabolismunit in Beltsville, MD, Wilkerson et al. (1997) notedthe following distribution (%) of N between feces, urineand milk: for cows producing an average of 29 kg milk/d-34.8, 35.1, and 30.2%, respectively; for cows producingan average of 14 kg milk/d-36.9, 39.9, and 23.2%, respec-tively. For cows averaging 29 kg milk/d, average dietaryCP was 16.6%, and for cows averaging 14 kg milk/d,dietary CP averaged 15.5%. Normally urinary N willaccount for 45 to 60% of total N excreted, and feces 40to 55% (Knowlton et al., 2001; Tine et al., 2001), butthere can be significant deviation from these ranges(Krober et al., 2000).
Reducing N content of the diet is an efficient way toreduce gaseous N emissions from manure (Korevaar,1992). Release of ammonia from manure in a flask wasreduced by 32 and 40% when dietary CP content wasreduced from 18.3 to 15.3% and from 16.4 to 12.3%in dairy cows (Paul et al., 1998). A relatively smallreduction of an already low level of feed CP (11.0 vs9.6%) suppressed ammonia emission from fresh heifermanure by 28% (James et al., 1999). Smits et al. (1997)measured ammonia emissions in exhaust chimneys of

Satter et al.E146
a cattle barn and noted 39 and 24% lower emissionwhen reducing feed CP from 19.8 to 14.6% and from20.2 to 15.9%, respectively.
Several strategies can be used to lower dietary pro-tein, and one of these is to increase the amount of micro-bial protein synthesized in the rumen. Microbial proteinis potentially the most economical protein we can hopeto supply to the intestine. It is also a high-quality pro-tein supplying lysine and methionine in proportion totheir presence in milk (NRC, 2001). It is important todetermine just how much potential there is for increas-ing the yield of microbial protein in the rumen. High-producing cows, with their high DM intakes, have morerapid passage of digesta from the rumen than low-pro-ducing cows. That in itself promotes higher yields ofmicrobial protein per unit DM fermented. Finelyground high-moisture shelled corn, through its abilityto support microbial growth and protein synthesis, maybe the cheapest “protein source” we have. The starchin some feed grains is more completely fermented inthe rumen relative to the starch in corn, with barleystarch being an example. Increasing fermentability ofstarch in feed grains will increase microbial proteinproduction per unit of DM intake. Despite the fact thatmost of the corn produced is fed to livestock, and easilydigestible corn starch is desired, corn breeders haveselected grain that will resist shatter during handlingthrough augers or various loading/unloading equip-ment. Such selection may have reduced starch digest-ibility. Small gains in rumen digestibility of grainstarch are possible, and such change should translateinto small increases in microbial protein production.This would have the potential of increasing the effi-ciency of dietary N use only if there was an excesssupply of RDP. This is often the case with dairy diets,but probably not for feedlot beef diets. Improving digest-ibility of alfalfa through maceration (Broderick et al.,1999), and digestibility of corn silage, as in the exampleof brown midrib 3 corn (Oba and Allen, 1999), have thepotential for increasing microbial protein yield per unitof DM intake. Increasing digestibility of forage cellwalls through alterations in the chemical architectureof cell wall structure (Satter et al., 1999) has the poten-tial of not only increasing available energy from forages,but also of increasing microbial protein synthesis.
A second strategy for reducing dietary protein is tofine tune and balance the supply of RUP and RDP. Thenew NRC (2001) requirement for total CP assumes thatRUP and RDP will be provided in exactly the rightamount. In practice, of course, it is difficult to achieveprecise balance. The potential for use of high RUP sup-plements will depend to a significant extent upon therelative proportions of alfalfa silage and corn silageused in the dairy ration. If alfalfa silage makes up 30to 40% or more of the forage, it is very likely that mostor all of the supplemental protein should have a highRUP value. If 50% or more of the forage is corn silage,then it is likely that some or most of the supplementalprotein could be supplied by a more degradable protein
source, such as soybean meal. These are obviouslybroad generalizations, because other diet ingredientswill also have an influence on what type of proteinsupplement is needed.
A third strategy is to balance diets more precisely foressential amino acids. As with poultry and swine, somepotential exists for balancing dairy diets to provide theappropriate amounts of individual amino acids. Oppor-tunities for improving efficiency of protein utilizationthrough manipulation of dietary amino acid supply arenot as great with ruminants as with swine and poultry.The reason is that the large amount of microbial proteinproduced in the rumen, representing 40 to 70% of pro-tein reaching the intestine, is already well balancedregarding amino acids. Nonetheless, it is well docu-mented that lysine and methionine are usually the mostlimiting amino acids for milk production, and that un-der the appropriate dietary situations small improve-ments can be made in N utilization by supplementingrumen protected lysine and/or methionine.
Since supplemented amino acids for ruminants haveto be protected against degradation in the rumen, costof amino acid supplementation for ruminants is higherthan for poultry or swine. Supplementing two or moreprotected amino acids is generally cost prohibitive, butsupplementing one protected amino acid oftentimes isfeasible. It is less costly to provide the likely require-ment of protected methionine than it is for protectedlysine. An appropriate strategy is to formulate dietswith feeds that are relatively rich in rumen undegradedlysine, and if necessary, supplement with protected me-thionine (Garthwaite et al., 1998). These workers havesummarized a group of studies where either methio-nine, methionine plus lysine, or just lysine were usedto supplement lactating cows. Overall, supplementingrumen-protected amino acids increased dry matter in-take and milk production each by 0.5 kg/cow�day, milkprotein by 0.15 percentage units (68 g), and milk fatby 0.06 percentage units (45 g). While these are indeedmodest production increases, it is likely that some dietformulations will benefit from supplementation of ru-men-protected methionine, especially when high-RUPsoy supplements are fed. Further discussion of this topicis available (Garthwaite et al., 1998; Sloan et al., 1998).
There is no question that reducing dietary N contentof dairy diets can significantly reduce total N excretion,as well as the proportion of excreted N that is in a formvulnerable to volatilization. Realistically, a 10 to 15%reduction in total dietary N in typical dairy diets isperhaps the maximum we can hope for with applicationof improved feeding programs. This translates intoabout a 13 to 20% reduction in manure N, and perhaps30 to 35% reduction in N that is vulnerable to volatiliza-tion. These are significant improvements, and whencombined with appropriate crop rotations for feed pro-duction (where appropriate), and better manure han-dling, storage, and field application techniques, thecombined practices can have a very important impacton N dynamics on dairy operations.

Nutrition and nutrient output E147
Feedlot Beef
The majority (80 to 90%) of the N fed to feedlot cattleis excreted. Dependent on diet, 50 to 75% of total ex-creted N is excreted as urinary urea N and 25 to 50%as fecal N by feedlot cattle (Giger-Reverdin et al., 1991).If typical, 85% grain-based diets are fed, then urinaryN accounts for 75% or more of excreted N. If hindgutfermentation is stimulated by readily fermentable car-bohydrate sources reaching the large intestine, such assome corn by-product feeds, then route of excretion canshift to 50% fecal N and 50% urinary N (Giger-Reverdinet al., 1991; Larson, 1992; Bierman et al., 1999).
Once N is excreted, various transformations occurboth during storage and following manure applicationto cropping areas. Briefly, urea-N can be rapidly brokendown by urease yielding bicarbonate and two NH4+molecules. The following equation outlines urea hy-drolysis:
CO(NH2)2 + H+ + 2H2O → 2NH4+ + HCO3
−
This conversion is rapid because urease enzyme is ubiq-uitous and produced by both microbes excreted in thefeces and soil organisms on the pen surface (Mobley etal., 1995). Under optimal conditions, all the urea canbe hydrolyzed within hours (Muck and Richards, 1980;Beline et al., 1998). The bicarbonate and ammonia actas buffers to maintain high pH which enhances NH4
+
conversion to NH3 and subsequent volatilization (Varelet al., 1999).
Many of the processes that occur in the feedlot resultin a large pool of NH4
+ from urine and feces N. NH4+
is not volatile and must be converted to NH3 beforevolatilization occurs. The conversion of NH4
+ to NH3 iscontrolled primarily by temperature, pH, and concen-tration of NH4
+ (McCrory and Hobbs, 2001). WhetherNH3 volatilizes is dependent on conversion of NH3 insolution to gaseous form. Whether NH3 is ultimatelyemitted from or deposited on the surface is dependenton ambient atmospheric concentrations relative to itsconcentration in soil at the pen surface (ApSimon etal., 1987; McCrory and Hobbs, 2001). In feedlot pens,the concentration of NH3 usually leads to emission intothe atmosphere simply due to the concentration dif-ferences.
Two processes occur during manure decompositionthat influence NH3 volatilization: biotic (microorgan-ism-dependent) transformations or abiotic transforma-tions (conversion of NH4
+ to NH3 independent of micro-organisms; Dewes, 1996). Abiotic emissions are primar-ily controlled by concentration of NH4
+ andconcentration differences between NH3 in solution onthe surface relative to surrounding atmospheric NH3concentration.
As temperature increases, more NH4+ is converted to
NH3 resulting in greater volatilization losses (Dewes,1996; Hargrove, 1988). The pH of both manure and soilreceiving manure can have large impacts on N volatil-
ization. Dewes (1996) evaluated NH3 volatilization atthree pH values, 6.0, 7.5, and 9.0. Abiotic emission wasnonsignificant at pH 6.0 and 7.5, suggesting that verylittle NH4
+ was converted to NH3. At pH 6.0, less than1.0% of the N volatilized. At pH 9.0, abiotic emissionsaccounted for up to 73% of the total N volatilized andequaled 10% of the initial N. Total N lost at pH 9.0 wasonly 14%. Clearly, pH of manure, especially above 7.5can have a tremendous impact on N volatilization. Athigh pH, the increased volatilization appears to be di-rectly correlated to the ratio of NH4
+:NH3. The pKa ofthis equilibrium reaction is approximately 9. Relativeproportions of NH3 compared with NH4
+ are approxi-mately 0.1, 1, 10 and 50% at pH 6, 7, 8, and 9, respec-tively. The economics and application of acid or base-precipitating salts to lower pH of slurry or open-dirtfeedlot manure are not a suitable control strategy atthe current time (McCrory and Hobbs, 2001).
Nitrogen concentration in the diet can have a largeimpact on NH3 volatilization. As protein in the dietincreases above the requirement, protein is still ab-sorbed from the gut even though it is not needed. Theexcess protein (N) needs to be dealt with by the animaland is usually excreted in the urine as urea. Becauseurea is rapidly hydrolyzed, then reducing urea excre-tion should result in reduced ammonia volatilization.Erickson et al. (2000b) decreased N intake by 11.4 and18.4% for calves and yearling feedlot cattle, respectively(Table 2), by reducing dietary CP as animals progressedthrough the feeding period (phase feeding). The subse-quent decrease in N excretion of 13 and 20% decreasedN volatilization by 15 and 32% for calves fed in thewinter and yearlings fed during the summer, respec-tively. Animal performance was similar between con-trol and phase-fed groups despite lowering N intakes.Performance was maintained by utilizing the metabo-lizable protein (MP) system to meet and not exceeddegradable intake protein (DIP) and MP requirementspredicted by the beef NRC (1996). Using the MP systemallowed for diets to be formulated more accurately andprotein fractions provided in the diet to be changed asrequirements change over time (i.e., phase-fed).
If two diets differ in protein content, then the higherprotein diet will lead to increased urinary N excretion asurea (Merchen, 1993). The reason is that excess proteinabove the requirement must be metabolized to urea andexcreted in urine. In these experiments, similar fecalN was probably excreted between treatments, but lessurea N was excreted in urine by cattle on the Phasetreatment due to lower protein intake. In general, urineis the predominant contributor to volatilization of NH3when feces and urine are compared (Kellems et al.,1979). Because urea-N is rapidly converted to NH3 dueto prevalence of urease enzyme (Mobley et al., 1995),then presumably more N would be volatilized if proteinis overfed, such as with the Control group in Ericksonet al. (2000b).
Based on current feeding trends in Nebraska and theU.S. (Nebraska Agricultural Statistics, 2000), approxi-

Satter et al.E148
Table 2. Nitrogen balance determined in the feedlot for both yearling experimentsduring the summer and calves during the winter spring months repeated across
years (Erickson et al., 2000b). Diets contained 13.6% (Control) or variable(12.8–10.5%) protein depending on MP and DIP requirements Phase.
All values are expressed as kg/steer overthe entire feeding period
Yearlings (132 d) Calves (183 d)
Item Control Phase SE P= Control Phase SE P=
Intake 33.1 27.0 0.3 0.01 37.0 32.8 0.4 0.01Retentiona 3.6 3.6 0.02 0.80 4.6 4.6 0.03 0.28Excretionb 29.5 23.4 0.3 0.01 32.4 28.2 0.4 0.01
Manure 5.9 8.9 0.3 0.01 19.8 18.9 1.2 0.60Soilc 1.7 −0.4 0.6 0.03 −1.7 −2.9 0.8 0.28Runoff 1.0 0.7 0.1 0.07 1.0 1.0 0.1 0.74Volatilizedd 20.9 14.2 0.7 0.01 13.3 11.3 1.4 0.32% Volatilizede 70.9 60.7 41.1 40.1Manure+soilf 7.6 8.5 0.7 0.39 18.1 15.9 1.3 0.24
aN retention based on ADG and NRC (1996) equation for retained energy and retained protein.bN excretion calculated as intake minus retention.cSoil is core balance on pen surface before and after each experiment; negative values suggest removal
of N present before initiation of experiment.dVolatilized calculated as excretion minus manure minus soil minus runoff.e% volatilized calculated as percentage of total excreted N.fManure+soil corrects what was hauled at cleaning by soil N remaining or removed from pen surface
when compared with N on the pen surface before the experiment.
mately 64 to 70% of cattle are fed from November toMay. Only 30 to 36% of cattle were in the feedlot fromJune to October from 1995 to 1998. If yearly volatiliza-tion rates are based on weighted averages for cattle onfeed (65:35 ratio), then the amount of N that volatilizesis 53.5% of N excreted for the Control treatment. Simi-lar calculations for Phase feeding results in 48.2% ofN excreted being volatilized. The percentages are notgreatly different, but total kg of N volatilized was re-duced by 25% when Phase-fed cattle were comparedwith Control-fed cattle. Accounting for cattle inventorywhen calculating volatilization should be more accuratethan basing N volatilization on summer and winterfinishing systems separately. However, in these experi-ments, winter and summer finishing characteristics areconfounded by type of animal (calf vs yearling) whichhave unique feeding characteristics. Despite estimatesof 60 to 70% of N volatilizing in the summer experi-ments, the yearly volatilization rates using inventoryof cattle and measurements here are similar to previousestimates (Gilbertson et al., 1971; Eghball andPower, 1994).
Impact of Dietary Phosphorus onPhosphorus Output in Manure
Phosphorus is a critical element with numerous anddiverse functions in the body, including cell membranestructure (phospholipids), energy transfer (ATP), struc-ture of DNA, and as an important constituent of bone.Approximately 80 to 83% of total body P is in bone andteeth, and in a 318 kg steer this will equal approxi-mately 2,000 g (Wadsworth and Cohen, 1976). The nor-
mal Ca:P ratio in bone is 2.1:1 and is relatively constantacross species (Irving, 1963).
Maintaining adequate concentrations of P in soft tis-sue is critical to animal survival; thus maintenance ofblood plasma concentrations of P within an acceptablerange is of high priority for the animal. Plasma P con-centrations are usually maintained between 4.0 to 8.0mg/100 mL (Underwood and Suttle, 1999). Short-termP deficiencies are accommodated by mobilizing P frombone, and this readily occurs without apparent impacton animal productivity. Once the mobile reserve of boneP is exhausted, then deficiency symptoms can appear,including a drop in plasma P concentration below 4 mg/100 mL.
Dairy Cattle
There has been much confusion about the P require-ment of lactating cows. This is reflected in large differ-ences between feeding standards used by differentcountries in Europe and North America (Tamminga,1992). Some of the standards differ by as much as three-fold in their estimate of P maintenance requirements,and nearly twofold in the requirement for milk produc-tion. Likewise, large differences exist in estimates of Pavailability in the gut. It is noteworthy, however, thatthe standards differ relatively little in their final recom-mendations for P feeding, as extreme differences inmaintenance and lactation requirements tend to canceleach other. The NRC (2001) presents an excellent sum-mary of P utilization by dairy cows, and does much toclarify what has been a murky area in the past.
The literature on P utilization and P requirementsof lactating cows has been surprisingly consistent. It is

Nutrition and nutrient output E149
in the interpretation of published reports where muchconfusion has arisen. This confusion has led to feedingof unrealistically large amounts of P in dairy diets.Several surveys (Bertrand et al., 1999; Sansinena et al.,1999; Satter, unpublished information) in the UnitedStates show that dairy diets are formulated to containapproximately 0.45 to 0.50% P (DM basis), an amountthat is about 20% in excess of the requirement (NRC,2001). This oversupplementation of P is costing the U.S.dairy industry about $100 million annually, as wellas increasing risk of environmental damage througheutrophication of lakes and streams.
How have we come to this point of excessive P feed-ing? There are at least three factors which have playeda role. Perhaps most significant is the notion that in-creasing dietary P will improve reproductive perfor-mance. Studies in South Africa (Theiler and Green,1932) demonstrated that supplementing bone meal tobeef cows grazing dry season rangeland improved repro-ductive performance, as well as growth rates and sur-vival rates. A widely cited field study in England (Hig-nett and Hignett, 1951) involving 802 dairy cows in 39herds showed improved first-service conception rateswhen P was supplemented to those herds in the studyhaving the lowest dietary P content. In both of theseclassic studies, dietary P levels were much lower thancurrent NRC (2001) recommendations, and likely pro-vided insufficient P for maximum rumen microbialgrowth. Durand and Kawashima (1980) suggested themaximum P requirement for ruminal microbes is 4 gP/kg digestible organic matter in the diet. This wouldbe equivalent to less than 0.30% dietary P. Extremelylow dietary P can inhibit microbial growth, leading toreduced protein and energy supply to the host animal.It is well known that energy and protein supply caninfluence reproductive performance. Modern dairy dietsnever approach the low dietary P concentrations thatcan result in impaired microbial growth in the rumen.There is no evidence that feeding P in excess of NRC(2001) requirements will influence reproductive per-formance.
Another factor contributing to the overfeeding of Pto dairy cows has been the absence of lactation trialsshowing the absolute minimum of P required to supportmoderate to high levels of milk production. Withoutknowing the bare minimum of P needed to support milkproduction, arriving at a reasonable margin of safetyin formulating diets becomes problematic. This uncer-tainty has led to overly large margins of safety andexcessive P in the dairy diet. Information is now avail-able to show that moderate- to high-producing dairycows (7,700 to 13,000 kg milk/lactation) are likely toexhibit beginning signs of P deficiency following long-term feeding (1 to 3 lactations) of diets containing about0.3% P (Brintrup et al., 1993; Valk and Ebek, 1999; Wuet al., 2000; Wu et al., 2001).
A third factor contributing to overfeeding of P hasbeen aggressive marketing of P supplements. This has
probably been less important than the first two fac-tors mentioned.
Figure 1 is a summary of the status of P nutrition oflactating dairy cows producing >9,000 kg milk/305 dlactation (Wu et al., 2001). The bare minimum of dietaryP consistent with normal or near-normal animal perfor-mance is 0.30%. At this dietary concentration, symp-toms of P deficiency may begin to occur. At the otherextreme of the continuum in Figure 1 is what mostdairy producers in the United States are actually feed-ing. Figure 1 also shows the requirements for P asindicated by the NRC (1989, 2001). For ease of illustra-tion, the NRC requirements are expressed in terms ofpercentage P in the diet. This is based on dry matterintakes suggested by the NRC. The most recent NRC(2001) publication has lowered slightly the requirementfor P feeding, a change that is fully justified by researchresults. The NRC (2001) presents requirements, anddoes not include a margin of safety. In calculating therequirement, however, it appears the NRC (2001) com-mittee used a somewhat conservative estimate for Pavailability, or the P absorption coefficient. The NRC(2001) model used P absorption (availability) coeffi-cients of 64 and 70% for forages and concentrates, re-spectively. Recent unpublished research is suggestingthat these values may be low. The long-term lactationstudies mentioned earlier would confirm that the NRC(2001) requirements are more than sufficient, and onemight in fact consider the NRC (2001) requirement toinclude a reasonable margin of safety.
It is difficult to determine what a reasonable marginof safety is with regard to P feeding. It will depend onuniformity of milk production of cows within the feedinggroup, variability of P content of diet ingredients, andhow quickly cows exhibit P-deficiency symptoms. Vari-ability in DM intake between animals of comparablemilk production will also be a factor. The NRC (2001)suggests that Holstein cows weighing 680 kg, having abody condition score of 3.0, that are 65 mo of age, andproducing milk containing 3.5% fat and 3.0% true pro-tein will have a dietary requirement (using a samplediet) of 0.32, 0.35, 0.36, and 0.38% P for milk productionamounts of 25.0, 35.0, 45.0, and 54.4 kg/d, respectively.Certainly grouping cows by milk-production level wouldenable a closer match between dietary P and P re-quirement.
Based on information in NRC (2001) feed compositiontables, it appears that the coefficient of variation for Pcontent within a feedstuff listed is about 15%. The NRC(2001) tabular values for P content of feedstuffs appearmore accurate relative to the NRC (1988) tabular val-ues, as the older NRC values for P content were system-atically lower than recent laboratory analysis (Berger,1995). This may be a reflection of increased soil P levelsin more recent years, since high soil P concentrationscan result in elevated plant P content.
Cows lose both calcium and P from bone to help sup-ply these elements in early lactation. Ternouth (1990)suggested that up to 30% of bone P can be removed

Satter et al.E150
Figure 1. Current status of P nutrition of lactating dairy cows milking >9,000 kg/305 d of lactation.
during early lactation. Based on this estimate for beefcows, a dairy cow weighing 600 kg could mobilize 600to 1000 g of P in early lactation. Phosphorus mobilizedfrom bone would need to be restored in later lactation,but the sizeable bone reserve provides a buffer againstshort-term P deficiencies that might result from under-estimating P content of a batch of feed. Also, mobilizedbone P reduces the need for elevated dietary P levelsin the first weeks of lactation when feed intake lagsbehind milk production.
With this background, a reasonable approach mightbe to formulate group rations using NRC (2001) recom-mendations to match the average production level ofthe top 25% of cows in a feeding group. If this is done,then high production groups in the highest producingherds would have their P requirement met, with a rea-sonable margin of safety, with diets containing 0.36 to0.40% P. This amount of dietary P can be supplied withlittle or no use of P supplements, and it represents a20% reduction in P content of the average dairy diet inthe United States.
Phosphorus fed in excess of the requirement is ex-creted, with the vast majority appearing in the feces.Typically cows fed just enough P to meet their require-ment will excrete <1 g P/d in urine. Cows fed P 20 to30% in excess of their requirement may excrete 3 to 5g P/d in urine (Wu et al., 2000). Table 3 contains resultsfrom a lactation study where cows were fed diets con-taining 0.31, 0.39, or 0.47% P for a 308-d lactation (Wuet al., 2001). Based on bone P and ash content, cowsfed the 0.31% P diet were marginally deficient. Phos-
Table 3. Performance of cows fed diets differing in phosphorus contentfor an entire lactation (Wu et al., 2001)
Dietary P (% of DM)
Item 0.31 0.39 0.47
Number of cows 10 14 13Dry matter intake, kg/d 25.0 25.0 24.6Milk, kg/308 d 13,038 11,909 12,126Milk fat, % 3.64 3.50 3.64Milk protein, % 3.16 3.13 3.10P intake, g/d 77.5 97.5 115.6Fecal P excretion, g/da 43 66 88
aEstimated using 68% as the diet DM digestibility, and the means for DMI and fecal P concentrations(0.538, 0.829, and 1.12% for the three treatments, respectively).
phorus fed in excess of the requirement, which in thisexample was close to 0.31%, was excreted. Referring toFigure 1, reducing P content of average U.S. dairy dietsfrom 0.45 to 0.50 to 0.36 to 0.40% represents a 20%reduction in dietary P, and at least a 25% reduction inmanure P.
Reducing dietary P concentration not only reduces Pcontent of manure, but it reduces the vulnerability ofP in manure from being solubilized in runoff waterfollowing field application. Ebeling et al. (2002) ob-tained manure from lactating cows fed dietary P concen-trations of 0.32 or 0.48%. These dietary levels resultedin feces with P concentrations of 0.48 and 1.28%, respec-tively. This manure was surface applied to field plotswithout incorporation. Phosphorus load in water runofffrom the plots was about ten times greater in plotsamended with manure derived from cows fed the high-P diet than manure from cows fed the low-P diet. Whenthese manures were applied at equivalent rates of P(40 kg/ha), the high-P manure had P runoff loads aboutfour times that of the low-P manure. A related studywas reported by Dou et al. (2001). They measured watersolubility of P in manure obtained from cows fed differ-ent amounts of dietary P. Their study indicated thatmost of the P fed in excess of the requirement ended upas water-soluble P in the manure. Therefore, reducingdietary P not only reduces P content of manure, butalso greatly reduces the amount of soluble P in manureand the potential for field runoff of what manure Pis applied.
Reducing dietary P can have a very significant effecton the amount of land required to effectively utilize

Nutrition and nutrient output E151
Table 4. Amount of phosphorus fed and excreted by a lactating cow producing9,090 kg milk in 305 day, and the amount of land required to effectively
utilize the manure phosphorusa
Dietary P Estimated Land area needed Change inconcentration Supplemental P Manure P to recycle manure P land area(%) (kg/lactation) (kg/lactation) (ha) (%)
0.35 0 15.8 0.53 Base0.40 3.4 19.2 0.65 230.48 8.9 24.7 0.81 530.55 13.7 29.5 0.97 83
aAssumptions: Cow is consuming average of 22.5 kg DM daily, and milk contains 0.09% P. There is nonet change in P content of the cow. The cropping area (ha) is comprised of 37% corn for grain, 7% corn forsilage, 47% alfalfa, and 9% soybeans. Crop yields are typical for the midwest US, and remove 29.9 kg Pper ha per year.
manure P (Table 4). Most lactation diets that are notsupplemented with an inorganic P source contain 0.35to 0.40% P. This of course depends on the ration ingredi-ents used. Since this concentration is similar to the Prequirement for lactating cows, it follows that essen-tially all of the supplemental P fed above the require-ment will be excreted in the manure. Assuming a cropuptake of 29.9 kg P/ha � yr, the requirement for landincreases proportionally with the increase in manureP. Reducing dietary P to an amount that the lactatingcow requires often means complete elimination of min-eral P supplements. It can also result in a major reduc-tion in the amount of land required to effectively utilizemanure P.
The dairy industry utilizes large amounts of by-prod-uct feeds, many of which serve as important sources ofprotein in the dairy diet. There is a tendency for feed-stuffs that are high in protein content to also containhigh concentrations of P, but there are significant devia-tions from this generalization. Table 5 shows the N:Pratio of some common dairy supplements that are oftenbrought into the ration because of their protein content.Bloodmeal and meat and bone meal represent the ex-tremes in this table. Both feedstuffs are high in RUP
Table 5. Protein and phosphorus content of some common feeds (NRC, 2001)
Protein Phosphoruscontent N content content
Feed % of DM % of DM % of DM N:P
Bloodmeal 95.5 15.3 0.30 51.0Soybean meal (48% CP) 49.9 8.0 0.70 11.4Soybean (roasted) 43.0 6.9 0.64 10.8Brewer’s grains 29.2 4.7 0.67 7.0Cottonseed 23.5 3.8 0.60 6.3Corn distillers grains 29.7 4.8 0.83 5.8Canola meal 37.8 6.0 1.10 5.5Corn gluten feed 23.8 3.8 1.00 3.8Wheat midds 18.5 3.0 1.02 2.9Wheat bran 17.3 2.8 1.18 2.4Meat and bone meala 54.2 8.7 4.73 1.8
aThe NRC (2001) does not distinguish between porcine and ruminant meat and bone meal. Some analysessuggest that porcine meat and bone meal tends to have more protein and less P than ruminant meat andbone meal, resulting in a N:P ratio between 2 and 3.
content, but bloodmeal supplies a very large amount ofprotein per unit of P. Meat and bone meal, on the otherhand, supplies relatively little protein per unit of P.The NRC (2001) values presented in Table 5 for meatand bone meal are not identified by the NRC publicationas being of porcine or ruminant origin. It appears thaton average porcine meat and bone meal containsslightly more protein and less P than ruminant meatand bone meal, and that the N:P ratio of porcine mealmay typically range between 2 and 3. This might beworth noting since only porcine meat and bone mealcan be fed to ruminants.
For dairy producers that are having trouble manag-ing P, choice of a protein supplement or by-product feedcan be an important decision affecting P management.A growing number of dairy producers have discontinuedusing P supplements, but because they utilize largeamounts of by-product feeds high in P concentration,overall dietary P content may still be excessive (0.40 to0.45%). It is important that least-cost ration formula-tion programs do not give credit for P content of a feed-stuff if the diet does not need P. A significant part ofthe dollar value of meat and bone meal is associatedwith its P content. If P is not needed, then meat and

Satter et al.E152
bone meal should not be given credit for the P it contri-butes in excess of the requirement. In fact, a negativevalue might be appropriately assigned in some cases.
Ruminal microorganisms are a source of phytase forruminants, and unlike poultry and swine, ruminantsare able to utilize nearly all of the phytate P present ingrains (NRC, 2001). It is possible, however, that smallamounts of phytate P can escape the rumen and not beavailable for absorption in the intestine. Corn mutantsthat have 33 to 66% less phytate P, but the sameamount of total P (Raboy and Gerbasi, 1996), mayslightly increase P availability in ruminants. At best,use of low-phytate corn in dairy diets would only mar-ginally reduce the dietary P requirement.
Reducing dietary P in lactating cow diets is perhapsone of the most effective steps that can be taken toreduce the environmental threat of dairy manure. It is astep that reduces cost as well as provides environmentalbenefits. The P content of most dairy diets can be re-duced by about 20%, thus lowering manure P by 25to 30%.
Feedlot Beef
Requirements. A factorial approach, dividing the Prequirement between maintenance and growth, is typi-cally used. The NRC (1996) requirement for mainte-nance is 16 mg/kg of body weight in beef cattle. There-fore, for typical feedlot cattle weighing 300 to 600 kg,the maintenance requirement is predicted as 4.8 to 9.6g/d. This amount of P must be absorbed, which is differ-ent than the amount required in the diet. To accuratelydetermine dietary requirement, availability and digest-ibility must be considered. The NRC (1996) assumesthat 68% of dietary P will be absorbed. Therefore, thedietary P requirement for maintenance is 7.1 to 14.1 g/d for feedlot cattle weighing 300 to 600 kg.
The requirement for growth is calculated as 3.9 g forevery 100 g of retained protein (NRC, 1996). Calculatedretained protein for feedlot cattle gaining between 1.5to 2.2 kg/d is approximately 150 to 220 g/d. As gainincreases, amount of P required increases. The require-ment for gain is based on an experiment conducted byEllenberger et al. (1950), where 129 entire carcasses(dairy breed) from the fetus through 12 yr of age wereanalyzed for P. Phosphorus retention was then esti-mated from whole-body analyses to correlate P withprotein retained. The study was quite extensive andrepresents the only experiment conducted to obtain ac-curate estimates of P retention. Inherent in the require-ment for gain is the assumption that P retention isequal to the requirement for gain.
Durand and Komisarczuk (1988) concluded that un-der normal situations when dietary phosphorus andcalcium are sufficient to meet the animal’s requirement,plasma phosphorus concentration is adequate to main-tain saliva concentrations, and the microbial phospho-rous requirement is met. During severe deficiency, lowplasma concentration will limit phosphorus supplied
by saliva (Challa et al., 1989). A severe phosphorusdeficiency will also decrease feed intake causing salivaflow to decrease as well. This scenario will limit micro-bial growth, decrease digestibility, and volatile fattyacid production.
Feeding Trials. Tillman et al. (1959) conducted anexperiment with calves 6 mo old and weighing 160 kgand gaining approximately 0.5 kg/d. Gain increasedlinearly when P was increased from 5.3 (0.14%) to 8.9(0.20%) g/d. Wise et al. (1958) conducted two experi-ments with 90-kg Holstein male calves approximately3 mo of age. Concentrations of dietary P evaluated were0.09, 0.12, 0.18, and 0.30% (experiment I) and 0.14,0.22, 0.30, and 0.38% (experiment II). In experiment I,calf gains were improved linearly up to 0.18% from 0.38to 0.62 kg/d, and then increased to 0.69 kg/d with the0.30% dietary P. Efficiencies and femur growth followedsimilar trends. In experiment II, weight gain, efficiency,and bone growth were improved with animals supple-mented with 0.22% P; however, there was no furtherimprovement in performance or bone status with thehigher levels of dietary P. Long et al. (1957) conductedtwo experiments with 180-kg calves to evaluate threelevels of P for growth (0.09, 0.14, and 0.18% of diet DM).Gains (0.09 to 0.61 kg/d) and efficiencies were improvedby supplementation of phosphorus.
When cattle get both older and larger, presumablythe P requirement decreases. A limited number of Prequirement studies have been conducted with year-lings or larger animals. Burroughs et al. (1956) evalu-ated diets containing 0.18, 0.25, 0.33% P fed to yearlingsteers receiving a 60% concentrate diet until market.Gains and efficiencies were improved up to 0.25% P.No further improvement was noted when P was in-creased to 0.33%. Similarly, Long et al. (1956) evaluatedthe P required for developing yearling heifers. The au-thors found linear increases in intake, weight gain, andplasma P over the range of 0.07, 0.11, and 0.15% di-etary P.
Call et al. (1978) conducted a two-year experimentwith maturing heifers. One group was fed a diet thatcontained 66% of NRC-predicted requirement for P(0.16%), whereas the other group was supplementedwith monosodium phosphate to increase dietary P to0.41%. Feed intake, weight gain, pregnancy rate, andlive calf percentage were not different between thetwo treatments. These data suggest that P supple-mentation for cows may be an unnecessary cost ifdietary phosphorus exceeds 0.16% of DM. Phosphorusretention was also similar between treatments andthe authors concluded that urine and fecal excretionof P was significantly greater for P-supplemented heif-ers. Average phosphorus intakes were 9.0 and 11.6 g/d for yr 1 and 2 with the 0.16% P treatment. Thesupplemented group received 21.6 and 30.6 g/d for yr1 and 2. This experiment was continued for 10 yr withP intakes varied over time to determine the amountrequired by the beef cow (Call et al., 1986). The au-thors concluded that the amount of phosphorus re-

Nutrition and nutrient output E153
Figure 2. Feed efficiency scatterplot showing relationship to P intake for yearling steers fed 0.14, 0.19, 0.24, 0.29, or0.34% P for 105 d (Erickson et al., 1999). Phosphorus intake expressed in g/d based on DMI, % P of diet DM, and Prefused. Each dot represents individual steer performance.
quired was between 7.8 and 8.9 g/d. Cows fed 5.1 to 6.6g/d of phosphorus gradually developed clinical signs ofdeficiency within 6 mo.
Because of a lack of data for feedlot cattle commonlyfed today, Erickson et al. (1999) conducted a P require-ment study with individually fed yearling steers. Treat-ments consisted of 0.14, 0.19, 0.24, 0.29, or 0.34% di-etary P (DM basis). Phosphorus intakes ranged from14 to 36 g/d, or 71 to 160% of current NRC predictedrequirements. Based on animal performance and bonecharacteristics, no treatment effects were detected overthe 105-d experiment with these larger (380 kg) year-ling steers. Feed efficiency was not related to P intake(Figure 2). However, the steers used in this experiment
Figure 3. Feed efficiency scatterplot showing relationship to P intake for steer calves fed 0.16, 0.22, 0.28, 0.34, or0.40% P for 204 d (Erickson et al., 2002). Phosphorus intake expressed in g/d based on DMI, % P of diet DM, and Prefused. Each dot represents individual steer performance.
were larger. Smaller, younger calves that may be placedin feedlots today could conceivably require P supple-mentation. Therefore, a similar experiment was con-ducted with steer calves weighing 265 kg. Calves werefed 0.16, 0.22, 0.28, 0.34, or 0.40% P. Phosphorus intakeranged from 14 to 36 g/d, or 76 to 190% of NRC recom-mendations for these animals. Performance and bonemineral content were unaffected by P intake (Ericksonet al., 2002). However, plasma inorganic P did respondquadratically with the lowest concentrations observedin steers fed 0.16% P. Feed efficiency was not relatedto P intake (Figure 3).
These data suggest that animals consuming highgrain finishing diets do not require supplementation of

Satter et al.E154
Table 6. Phosphorus (P) balance in the feedlot for the yearling and calf experimentscombined across both years (values expressed as kg/steer; 132 d for yearlings
and 183 d for calves; Erickson et al., 2000a)
Yearlings Calves
Control Low P Control Low PItem 0.37% 0.25% SE P= 0.37% 0.25% SE P=
Intake 5.83 3.28 0.05 0.01 6.81 4.50 0.07 0.01Retentiona 0.87 0.88 0.01 0.82 1.12 1.11 0.01 0.24Excretionb 4.95 2.40 0.05 0.01 5.69 3.39 0.07 0.01
aP retention based on ADG and NRC (1996) equation for retained energy, retained protein and P.bP excretion calculated as intake minus retention.
phosphorus. Assuming low feed intakes (8 kg DM/d)and no P supplementation (minimum of 0.2% phospho-rus from grain alone), then the animal would consume16 g/d of P. Therefore, P supplementation is an unneces-sary monetary and environmental cost to the producer.The data that are available suggest the NRC recom-mendations for P are too high. Despite the conclusionthat NRC recommendations are too high, the industrycommonly supplements feedlot diets with inorganic Pand criticizes the NRC predictions as being too low.Consequently, diets are commonly formulated with alarge safety margin (Spears, 1996).
Table 6 illustrates the impact dietary P concentrationhas on P excretion by steer calves and yearlings (Erick-son et al., 2000a). A diet formulated to meet and notexceed NRC recommendations (Low P) was comparedwith diets containing conventional concentrations of P(Control). Based on P analysis, diets contained 0.25 and0.37% P for Low P and Control, respectively. Comparedwith the Control groups, feeding Low P decreased (P <0.01) P intake without affecting (P > 0.24) P retainedby the animal. Based on NRC equations, retention isdirectly related to ADG. In these experiments, ADGwas not affected by dietary P. Calves did retain moreP than yearlings, probably due to greater bone growthduring the feeding period. Compared with the Controlgroup, feeding Low P decreased P excretion by 55%(2.55 kg/steer or 19.3 g/d during the 132-d experiment)for the yearling steers, and 40% (2.30 kg/steer or 12.4g/d during the 183-d experiment for the steer calves.
The P requirement for growing beef animals is easilymet by the usual feed ingredients in the feedlot diet.In many instances it would be cost prohibitive to lowerP content of feedlot diets beyond the obvious step ofremoving all supplemental P. It is very clear, however,that inorganic P supplements are not necessary in feed-lot diets, and they contribute only added cost and envi-ronmental risk.
Implications
The potential for reducing dietary N through moreprecise formulation of diets for rumen undegraded pro-tein and rumen degraded protein, and phase feedingor grouping of animals more closely according to produc-
tion level, will enable reduction of 10 to 15% of dietaryN. This results in about 13 to 20% reduction in N excre-tion, and potential reduction of 25 to 35% in the amountof N lost as NH3 to the atmosphere. Dietary P levelscan be reduced somewhat more, with reductions of 20%or more quite possible. All mineral P supplementsshould be removed from beef feedlot diets, and most ifnot all supplemental P removed from lactating dairycow diets. The requirement for P by feedlot beef animalsis likely to be somewhat below the P supplied by grainin feedlot diets. Reducing P content of dairy diets by20% will reduce excretion of P in manure by more than25%. In addition, the P that is excreted in manure whenreduced P diets are fed is less susceptible to field runoff.
Literature Cited
ApSimon, H., M. M. Kruse, and J. N. B. Bell. 1987. Ammonia emis-sions and their role in acid deposition. Atmos. Environ.21:1939–1946.
Beline, F., J. Martinez, C. Marol, and G. Guirand. 1998. Nitrogentransformation during anaerobically stored 15N-labelled pigslurry. Bioresour. Technol. 64:83–88.
Berger, L. L. 1995. Why do we need a new NRC data base? Anim.Feed Sci. Technol. 53:99–107.
Bertrand, J. A., J. C. Fleck, and J. C. McConnell, Jr. 1999. Phosphorusintake and excretion on South Carolina Dairy Farms. Prof. Anim.Sci. 15:264–267.
Bierman, S., G. E. Erickson, T. J. Klopfenstein, R. A. Stock, andD. H. Shain. 1999. Evaluation of nitrogen and organic matterbalance in the feedlot as affected by level and source of dietaryfiber. J. Anim. Sci. 77:1645–1653.
Brintrup, R., T. Mooren, U. Meyer, H. Spiekers, and E. Pfeffer. 1993.Effects of two levels of phosphorus intake on performance andfecal phosphorus excretion of dairy cows. J. Anim. Physiol. Anim.Nutr. 69:29–36.
Broderick, G. A., R. G. Koegel, M. J. C. Mauries, E. Schneebergen,and T. J. Kraus. 1999. Effect of feeding macerated alfalfa silageon nutrient digestibility and milk yield in lactating dairy cows.J. Dairy Sci. 82:2472–2485.
Burroughs, W., A. Raun, E. Cheng, and C. C. Culbertson. 1956. Differ-ent kinds and amounts of phosphorus in fattening cattle rations.Iowa State College A.H. Leaflet 209:1–5.
Call, J. E., J. W. Butcher, J. T. Blake, R. A. Smart, and J. L. Shupe.1978. Phosphorus influence on growth and reproduction of beefcattle. J. Anim. Sci. 47:216–225.
Call, J. W., J. E. Butcher, J. L. Shupe, J. T. Blake, and A. E. Olson.1986. Dietary phosphorus for beef cows. Am. J. Vet. Res.47:475–481.
Challa, J., G. D. Braithwaite, and M. S. Dhanoa. 1989. Phosphorushomeostasis in growing calves. J. Agric. Sci. 112:217–226.

Nutrition and nutrient output E155
Christensen, R. A., G. L. Lynch, and J. H. Clark. 1993. Influence ofamount and degradability of protein on production of milk andmilk components by lactating Holstein cows. J. Dairy Sci.76:3490–3496.
Cunningham, K. D., M. J. Cecava, T. R. Johnson, and P. A. Ludden.1996. Influence of source and amount of dietary protein on milkyield by cows in early lactation. J. Dairy Sci. 79:620–630.
Dewes, T. 1996. Effect of pH, temperature, amount of litter andstorage density on ammonia emissions from stable manure. J.Agric. Sci. 127:501–509.
Dhiman, T. R., C. Cadorniga, and L. D. Satter. 1993. Protein andenergy supplementation of high alfalfa silage diets during earlylactation. J. Dairy Sci. 76:1945–1959.
Dhiman, T. R., and L. D. Satter. 1993. Protein as the first-limitingnutrient for lactating dairy cows fed high proportions of goodquality alfalfa silage. J. Dairy Sci. 76:1960–1971.
Dou, Z., K. Knowlton, G. Zhang, Z. Wu, and R. Kohn. 2001. Loweringdietary P in dairy rations reduces the vulnerable P fraction inmanure. J. Dairy Sci. 84 (Suppl.1):254 (Abstr.)
Durand, M., and R. Kawashima. 1980. Influence of minerals in rumenmicrobial digestion. Pages 375–408 in Digestive Physiology andMetabolism in Ruminants. Y. Ruckebusch and P. Thivend, ed.MTP Press Ltd., Lancaster, England.
Durand, M., and S. Komisarczuk. 1988. Influence of major mineralson rumen microbiota. J. Nutr. 118:249–260.
Ebeling, A. M., L. G. Bundy, J. M. Powell, and T. W. Andraski. 2002.Dairy diet phosphorus effects on phosphorus losses in runofffrom land-applied manure. Soil Sci. Soc. Am. J. 66:284–291.
Eghball, B., and J. F. Power. 1994. Beef cattle feedlot manure manage-ment. J. Soil Water Conserv. 49:113–132.
Ellenberger, H. B., J. A. Newlander, and C. H. Jones. 1950. Composi-tion of the bodies of dairy cattle. Vt. Agric. Exp. Sta. Bull. 558,Univ. Vermont, Burlington.
Erickson, G. E., T. J. Klopfenstein, and C. T. Milton. 2000a. Dietaryphosphorus effects on performance and nutrient balance in feed-lots. Pages 10–17 in Proc. 8th Int. Symp. Animal, Agric., andFood Processing Wastes. ASAE, St. Joseph, MI.
Erickson, G. E., T. J. Klopfenstein, and C. T. Milton. 2000b. Dietaryprotein effects on nitrogen excretion and volatilization in open-dirt feedlots. Pages 297–304 in Proc. 8th Int. Symp. Animal,Agric., and Food Processing Wastes. ASAE, St. Joseph, MI.
Erickson, G. E., T. J. Klopfenstein, C. T. Milton, D. Brink, M. W. Orth,and K. M. Whittet. 2002. Phosphorus requirement of finishingfeedlot calves. J. Anim. Sci. 80:1690–1695.
Erickson, G. E., T. J. Klopfenstein, C. T. Milton, D. Hanson, and C.Calkins. 1999. Effect of dietary phosphorus on finishing steerperformance, bone status, and carcass maturity. J. Anim. Sci.77:2832–2836.
Garthwaite, B. D., C. G. Schwab, and B. K. Sloan. 1998. Amino acidnutrition of the early lactation cow. Pages 38–50 in Proc. ofthe Cornell Nutr. Conf. for Feed Manufacturers. Cornell Univ.,Ithaca, NY.
Giger-Reverdin, S., D. Sauvant, J. Hervieu, and M. Dorleans. 1991.Fecal and urinary nitrogen losses as influenced by the diet carbo-hydrate and protein fractions in goats. Pages 358–360 in 6th Int.Symp. Protein Metabolism and Nutrition. Herning, Denmark.
Gilbertson, C. B., T. M. McCalla, J. R. Ellis, O. E. Cross, and W. R.Woods. 1971. Runoff, solid wastes, and nitrate movement in beeffeedlots. J. Water Pollut. Control Fed. 43:483–493.
Hargrove, W. L. 1988. Evaluation of ammonia volatilization in thefield. J. Prod. Agric. 1:104–111.
Hignett, S. L., and P. G. Hignett. 1951. The influence of nutrition onreproductive efficiency in cattle. I. The effect of calcium andphosphorus intake on the fertility of cows and heifers. Vet Rec.63:603–609.
Irving, J. T. 1963. Dynamics and functions of phosphorus. Page 249in Mineral Metabolism. vol 2. Academic Press, New York.
James, T., D. Meyer, E. Esparza, E. J. DePeters, and H. Perez-Monti.1999. Effects of dietary nitrogen manipulation on ammonia vola-tilization from manure from Holstein heifers. J. Dairy Sci.82:2430–2439.
Karn, James F. 2001. Phosphorus nutrition of grazing cattle: a review.Anim. Feed Sci. Technol. 89:133–153.
Kellems, R., J. R. Miner, and D. C. Church. 1979. Effect of ration onwaste composition and length of storage on the volatilization ofammonia, hydrogen sulfide and odors from cattle waste. J. Anim.Sci. 48:436–445.
Knowlton, K. F., J. H. Herbein, M. A. Meister-Weisbarth, and W. A.Wark. 2001. Nitrogen and phosphorus partitioning in lactatingHolstein cows fed different sources of dietary protein and phos-phorus. J. Dairy Sci. 84:1210–1217.
Kohn, R. A., Z. Dou, J. D. Ferguson, and R. C. Boston. 1997. Asensitivity analysis of nitrogen losses from dairy farms. J. Envi-ron. Manag. 50:417–428.
Komaragiri, M. V. S., and R. A. Erdman. 1997. Factors affecting bodytissue mobilization in early lactation dairy cows. 1. Effect ofdietary protein on mobilization of body fat and protein. J. DairySci. 80:929–937.
Korevaar, H. 1992. The nitrogen balance on intensive Dutch dairyfarms: a review. Livest. Prod. Sci. 31:17–27.
Krober, T. F., D. R. Kulling, H. Menzi, F. Sutter, and M. Kreuzer.2000. Quantitative effects of feed protein reduction and methio-nine on nitrogen use by cows and nitrogen emissions from slurry.J. Dairy Sci. 83:2941–2951.
Larson, E. M. 1992. Corn Byproducts for Finishing Cattle. M.S. thesis,Univ. Nebraska, Lincoln.
Long, T. A., A. D. Tillman, A. B. Nelson, B. Davis, and W. D. Gallup.1956. Dicalcium phosphate and soft phosphate with colloidalclay as sources of phosphorus for beef heifers. J. Anim. Sci.15:1112–1118.
Long, T. A., A. D. Tillman, A. B. Nelson, W. D. Gallup, and B. Davis.1957. Availability of phosphorus in mineral supplements for beefcattle. J. Anim. Sci. 16:444–450.
Luchini, N. D., G. A. Broderick, R. E. Muck, N. F. Makoni, and R.L. Vetter. 1997. Effect of storage system and dry matter contenton the composition of alfalfa silage. J. Dairy Sci. 80:1827–1832.
McCrory, D. F., and P. J. Hobbs. 2001. Additives to reduce ammoniaand odor emissions from livestock wastes: A review. J. Environ.Qual. 30:345–355.
Merchen, N. R. 1993. Digestion, absorption, and excretion in rumi-nants. Pages 172–201 in The Ruminant Animal: Digestive Physi-ology and Nutrition. D. C. Church, ed. Waveland Press, Inc.,Prospect Hills, IL.
Mobley, H. C. T., M. D. Island, and R. P. Hansinger. 1995. Molecularbiology of microbial ureases. Microbiol. Rev. 59:451–480.
Muck, R. E., and B. K. Richards. 1980. Losses of manurial nitrogenin free stall barns. Agric. Manure 7:65–93.
NRC. 1989. Nutrient Requirements of Dairy Cattle. 6th rev ed. Natl.Acad. Press, Washington, DC.
NRC. 1996. Nutrient Requirements of Beef Cattle. 7th rev ed. Natl.Acad. Press, Washington, DC.
NRC. 2001. Nutrient Requirements of Dairy Cattle. 7th rev ed. Natl.Acad. Press, Washington, D.C.
Nebraska Agricultural Statistics Service. 2000. Nebraska Agricul-tural Statistics. Nebraska Department of Agriculture, in cooper-ation with U.S.D.A., Lincoln.
Oba, M., and M. S. Allen. 1999. Effects of brown midrib 3 mutationin corn silage on dry matter intake and productivity of highyielding dairy cows. J. Dairy Sci. 82:135–142.
Paul, J. W., N. E. Dinn, T. Kannangara, and L. J. Fisher. 1998.Protein content in dairy cattle diets affects ammonia losses andfertilizer nitrogen value. J. Environ. Qual. 27:528–534.
Raboy, V., and P. Gerbasi. 1996. Genetics of myo-inositol phosphatesynthesis and accumulation. Pages 257–285 in Subcellular Bio-chemistry: MyoInositol Phosphate, Phosphoinositides, and Sig-nal Transduction. vol. 26. Plenum Press, New York.
Sansinena, M., L. D. Bunting, S. R. Stokes, and E. R. Jordan. 1999. Asurvey of trends and rationales for phosphorus recommendationsamong Mid-South nutritionists. Pages 51–54 in Proc. Mid-SouthRuminant Nutr. Conf. Dallas, TX.
Satter, L. D., H. G. Jung, A. M. van Vuuren, and F. M. Engels. 1999.Challenges in the nutrition of high-producing ruminants. Pages

Satter et al.E156
609–646 in Nutritional Ecology of Herbivores. Proc. 5th Int.Symp. Nutr. of Herbivores. H. G. Jung and G. C. Fahey, Jr., ed.Am. Soc. Anim. Sci., Savoy, IL.
Sloan, B. K., B. D. Garthwaite, and C. G. Schwab. 1998. Practicalformulation of dairy cow diets for digestible amino acids to im-prove nitrogen efficiency and the bottom line. Pages 51–61 inProc. of the Cornell Nutr. Conf. for Feed Manufacturers. CornellUniv., Ithaca, NY.
Smits, M. C. J., H. Valk, G. J. Monteny, and A. M. van Vuuren.1997. Effect of protein nutrition on ammonia emission from cowhouses. Pages 101–107 in Gaseous Nitrogen Emissions fromGrasslands. S. C. Jarvis and B. F. Pain, ed. CAB International,Wallingford, Oxon 0X10 8DE U.K.
Spears, J. W. 1996. Optimizing mineral levels and sources for farmanimals. Pages 259–275 in Nutrient Management of Food Ani-mals to Enhance and Protect the Environment. E. T. Kornegay,ed. CRC Press, Boca Raton, FL.
Tamminga, S. 1992. Nutrition management of dairy cows as a contri-bution to pollution control. J. Dairy Sci. 75:345–357.
Ternouth, J. H. 1990. Phosphorus and beef production in northernAustralia. 3. Phosphorus in cattle—a review. Trop. Grassl.24:159–169.
Theiler, A., and H. H. Green. 1932. Aphosphorosis in ruminants.Nutr. Abstr. Rev. 1:359–385.
Tillman, A. D., J. R. Brethour, and S. L. Hansard. 1959. Comparativeprocedures for measuring the phosphorus requirement of cattle.J. Anim. Sci. 18:249–255.
Tine, M. A., K. R. McLeod, R. A. Erdman, and R. L. Baldwin. 2001.Effects of brown midrib corn silage on the energy balance ofdairy cattle. J. Dairy Sci. 84:885–895.
Underwood, E. J., and N. F. Suttle. 1999. The Mineral Nutrition ofLivestock. Food and Agricultural Organization of the UnitedNations. CABI Publishing, Wallingford, Oxon, UK.
Valk, H., and L. B. J. Ebek. 1999. Influence of prolonged feedingof limited amounts of phosphorus on dry matter intake, milkproduction, reproduction and body weight of dairy cows. J. DairySci. 82:2157–2163.
Varel, V. H., J. A. Nienaber, and H. C. Freetly. 1999. Conservationof nitrogen in cattle feedlot waste with urease inhibitors. J.Anim. Sci. 77:1162–1168.
Wadsworth, J. C., and R. D. H. Cohen. 1976. Phosphorus utilizationby ruminants. Pages 143–153 in Prospects for Improving Effi-ciency of Phosphorus Utilization. Reviews in Rural Science. vol1. Univ. New England Press, Australia.
Wilkerson, V. A., D. R. Mertens, and D. P. Casper. 1997. Predictionof excretion of manure and nitrogen by Holstein dairy cattle. J.Dairy Sci. 80:3193–3204.
Wise, J. B., S. E. Smith, and L. L. Barnes. 1958. The phosphorusrequirement of calves. J. Anim. Sci. 17:89–99.
Wu, Z., and L. D. Satter. 2000. Milk production during the completelactation of dairy cows fed diets containing different amountsof protein. J. Dairy Sci. 83:1042–1051.
Wu, Z., L. D. Satter, A. J. Blohowiak, R. H. Stauffacher, and J. H.Wilson. 2001. Milk production, estimated phosphorus excretion,and bone characteristics of dairy cows fed different amounts ofphosphorus for two or three years. J. Dairy Sci. 84:1738–1748.
Wu, Z., L. D. Satter, and R. Sojo. 2000. Milk production, reproductiveperformance, and fecal excretion of phosphorus by dairy cowsfed three amounts of phosphorus. J. Dairy Sci. 83:1028–1041.

Nutritional regulation of protein metabolism
P. J. Garlick1, G. Caso, D. Mynarcik, M. A. McNurlan and M. E. Gelato
Departments of Surgery and Medicine, Health Sciences Center,Stony Brook University, Stony Brook, NY 11794-8191
ABSTRACT: Protein homeostasis depends on thebalance between protein synthesis and protein degra-dation. In muscle of growing animals, and in the wholebody of human preterm infants, protein synthesis isespecially sensitive to nutrient intake. This effect hasbeen shown to depend on amino acid supply and insulinsecretion. In healthy adults there is no growth, butalthough there is a need to retain protein, muscle pro-tein synthesis appears to be less sensitive to food intakeor insulin infusion. In humans, there has been muchinterest in the responses to pathological conditions,such as trauma and infection, when protein is lost frommuscle. Much effort has been spent on strategies for
Key Words: Diseases, Insulin, Muscle Tissue, Stable Isotopes, Somatotropin, Trauma
2002 American Society of Animal Science. All rights reserved. J. Anim. Sci. 80(E. Suppl. 2):E135–E142
Introduction
During growth, there is an accumulation of tissueprotein, whereas in the adult, the tissue protein contentis in balance. On the other hand, injury and diseaseare frequently accompanied by loss of protein from bodytissues, and one of the aims of treatment is to minimizethis loss and promote its recovery by nutritional andother therapies. A better understanding of the pro-cesses that influence tissue protein gain and loss canbe achieved by direct measurement of protein synthesisand degradation in tissues. These two complex and op-posing processes are controlled by a variety of hor-monal, chemical and physical signals, resulting ingrowth in the immature, and maintenance of proteinbalance in the healthy adult individual. An imbalanceresulting from modulation of either synthesis or degra-dation is the cause of protein gain or loss. However, inthis article we will concentrate mainly on the role ofprotein synthesis in growth and wasting of muscle, andits modulation by nutritional factors in health and inpathological states.
1Correspondence: Health Sciences Center, T19 020 (phone: 631-444-1790; fax: 631-444-6039; E-mail: [email protected]).
Received July 24, 2001.Accepted May 14, 2002.
E135
reversing muscle wasting by nutritional and pharmaco-logical means. However, nutritional support supple-mented with branched-chain amino acids or glutaminehas not been shown to restore protein synthesis aftersurgery. Although treatment of healthy subjects withgrowth hormone (GH) stimulated muscle protein syn-thesis, GH may not be effective for reversing proteinwasting in AIDS patients, as it inhibited muscle proteinsynthesis in those patients who were most wasted, per-haps through a TNF-related mechanism. Acidosis isalso a factor which is often associated with wasting,and has been shown in humans and animals to inhibitmuscle protein synthesis.
Measurement of Protein Synthesis
Rates of protein synthesis have been measured formany years in cells and tissues in vitro and in animalmodels using radioactively labeled amino acids. Thesestudies have made an invaluable contribution to ourunderstanding of protein metabolism, but their rele-vance to human disease can only be assessed by directmeasurements in humans, using isotopic labeling tech-niques. Risk of radiation limits the use of radioactiveisotopes in humans, however, and they have now beenlargely replaced by their stable isotope counterparts.The limitations of tissue sampling in humans and thecontinual improvement of the mass spectrometers usedto measure stable isotopes have resulted in the develop-ment of a variety of approaches for measuring rates ofprotein synthesis and degradation in the whole body.These techniques have been used extensively (Wa-terlow et al., 1978; Young, 1987; Garlick et al., 1994)and have given rise to much useful information, butsuffer from the limitation that changes in whole bodyrates of protein turnover cannot be ascribed with anycertainty to any particular organ, tissue, or body com-partment. For example, animal studies have shownthat inflammation resulting from subcutaneous injec-tion of turpentine is associated with a fall in proteinsynthesis in skeletal muscle, but a rise in the liver(Ballmer et al., 1991). These changes would not be de-

Garlick et al.E136
tected by the whole-body technique. Over the last de-cade or so, therefore, there has been an increasing inter-est in measurements of protein synthesis rates in indi-vidual tissues of human subjects.
The general procedure for measuring protein synthe-sis in an individual tissue or organ in vivo is to injector infuse an amino acid labeled with the chosen isotopeinto the bloodstream and to make measurements dur-ing the period that it is incorporated into tissue protein.To determine rates of protein synthesis directly, a tis-sue sample is taken at the end of a period of time t(days) and the enrichment of the amino acid in protein(Ep) is determined. The fractional rate of synthesis (ks,in % per day) is then calculated from the equation: ks× Ef × t = Ep × 100. The other necessary information isthe average enrichment of the free amino acid thatis being incorporated into protein. This latter measure-ment has given rise to much debate. Theoretically thismeasurement should be made on the pool of aminoacyltRNA in the tissue, but this is complicated by the ex-tremely rapid rate of turnover of this pool and its smallsize, requiring large tissue samples. For most practicalpurposes the alternative is to use either the plasma orthe tissue (intracellular) free amino acid. However, theisotopic enrichment in these two compartments is notnecessarily the same, which has led to uncertainty inthe calculated values for protein synthesis and has beeninfluential in determining the way in which the labeledamino acid is administered. Both of the procedures com-monly used today were originally suggested by the workof R. B. Loftfield in the 1950s (Loftfield and Harris,1956). When a labeled amino acid was given to rats bycontinuous intravenous infusion, the isotopic enrich-ments (specific radioactivities) in the plasma and tis-sues rapidly rose to constant (plateau) values, but in thetissues the values remained substantially lower than inthe plasma (Loftfield and Harris, 1956). The interpreta-tion made was that the intracellular pool was derivedpartially by transport of amino acid into the cell fromthe plasma and partially from the degradation of unla-beled protein. Moreover, it would be difficult to calculaterates of protein synthesis with confidence, because itwas not known which, if either, of these two valueswould be appropriate as the precursor enrichment.Rates of protein synthesis were not therefore calcu-lated, and instead a different method of label adminis-tration was devised, with the aim of making the intra-and extracellular enrichments the same, thus minimiz-ing the ambiguity. This was achieved by injecting thelabeled amino acid together with a large amount ofunlabeled amino acid, sufficiently to dominate (flood)the small endogenous pool of unlabeled free amino acid(Loftfield and Eigner, 1958). This approach has becomeknown as the “flooding method.” Both of these ap-proaches have been used extensively in animals withradioactively labeled amino acids (McNurlan et al.,1979; Garlick et al., 1983), and in humans with stableisotopes (Garlick et al., 1994; Rennie et al., 1994; Gar-lick and McNurlan, 1998).
The constant infusion method has been used for manyinvestigations of muscle protein synthesis in volunteersand patients (Rennie et al., 1994). Its advantages arethat simultaneous measurement can also be made ofwhole-body protein turnover, and that the labeledamino acid is given as a tracer, unlike the floodingmethod, and therefore should not disturb metabolism.Its disadvantages are the need for a metabolic steadystate during the infusion, which might preclude obser-vations when acute metabolic changes are occurring(e.g., after a meal, in acute illness, or during surgery),and the uncertainty regarding the precursor enrich-ment when direct measurements of aminoacyl tRNAare not made. However, as most of the work describedhere employed the flooding approach, this method willbe described in more detail.
Early investigations with the flooding approach inrats showed that 0.1 mmol/100 g body weight of[14C]leucine or 0.15 mmol/100 g body weight of [3H]phe-nylalanine was adequate to equalize the plasma andtissue free amino acid specific radioactivities over a 10-min period following intravenous injection (McNurlanet al., 1979; Garlick et al., 1980). Similarly, preliminaryexperiments in human volunteers showed that 4 g of[1-13C]leucine per 80 kg body weight resulted in almostcomplete equalization of enrichment in the plasma andintracellular pools in muscle of healthy volunteers overa two 2-h period (Garlick et al., 1989). The rate of muscleprotein synthesis was calculated from the enrichmentof leucine in protein of a muscle biopsy taken at 90min and the average value for precursor enrichment,derived from serial measurements on plasma leucineor ketoisocaproate (KIC), the transamination productof muscle leucine (Matthews et al., 1982) at intervalsbetween 0 and 90 min (Garlick et al., 1989). The valueobtained for muscle protein synthesis rate was 1.86 sem0.12%/d when the precursor was taken to be the plasmaleucine and 1.95 sem 0.12%/d when the plasma KICwas used as an index of intracellular labeling (Garlicket al., 1989). These values are expressed as fractionalrates, in the units of % per day, which represent theamounts of protein synthesized as percentages of theamount in that tissue.
Although the flooding method successfully equalizesthe rates calculated from intracellular and plasma en-richments, these values are higher than those mea-sured by constant infusion of [1-13C]leucine using KICas the precursor, e.g., 1.10 sem 0.07%/day (Halliday etal., 1988). This discrepancy has led to much debateabout the validity of these two methods (Garlick et al.,1994; Rennie et al., 1994), which is not yet resolved(Garlick and McNurlan, 1998). However, the discrep-ancy is much lower when leucyl tRNA or intracellularleucine is used for the estimate of precursor enrichmentin muscle of humans (Watt et al., 1991; Ljungqvist etal., 1996; Adey et al., 1997) and dogs (Caso et al., 2001,2002). Deuterated phenylalanine ([2H5]phenylalanine),which has been used in more recent studies employingthe flooding method (McNurlan et al., 1994a), yields

Regulation of protein metabolism E137
Figure 1. Rates of protein synthesis in a range of human tissues, measured by flooding with [1-13C]leucine or[2H5]phenylalanine (Heys et al., 1991, Park et al., 1993, 1994). The fractional rate of synthesis (FSR) is the amount ofprotein synthesized per day as a proportion of the amount of protein in the tissue, or for plasma proteins the amountin the intravascular pool. The proteins of visceral tissues, particularly the gastrointestinal tract and liver, have farhigher turnover rates than those of the structural tissues, such as skeletal muscle.
rates of muscle protein synthesis that are comparableto those obtained by flooding with leucine (Garlick andMcNurlan, 1998).
The advantage of the flooding method is that thereis less uncertainty regarding the precursor enrichment,there is no strict requirement for a metabolic steadystate to be maintained during the measurement, andthe procedure is rapid, typically about 90 min, com-pared with 4 to 6 h for the infusion. The latter twoadvantages are important when studies are made onpatients who might be unstable, such as during theperioperative period (Essen et al., 1992b; Barle et al.,1999). Both the infusion and flooding methods havebeen used to investigate the control of protein synthesisin a variety of human tissues. Figure 1 illustrates thewide range of fractional rates of synthesis (FSR) ob-served in various healthy tissues taken from volunteersand from patients during surgery.
Nutritional Control of MuscleProtein Synthesis in Health
Much information about the control of muscle proteinsynthesis by food intake has been gained from studiesin small rodents. In growing rats, the effect of shortperiods of starvation on protein synthesis is muchgreater for skeletal and cardiac muscle than for liver,intestine, kidney, and brain (Garlick et al., 1975;McNurlan et al., 1979), demonstrating the high sensi-tivity of skeletal muscle to nutritional changes com-pared with other tissues. The mediators of the effects
of nutrients on muscle protein synthesis have been ex-amined by studying the responses of growing rats tothe consumption of meals. When postabsorptive (fooddeprived for 12 h) rats were refed, protein synthesis wasrapidly elevated, and this effect could be reproducedby infusion of insulin (Garlick et al., 1983). Moreover,administration of insulin antiserum before refeedingabolished the effect on protein synthesis (Preedy andGarlick, 1986). This suggested that insulin is an im-portant mediator of the response to feeding, but it couldnot be the only factor, as supraphysiological concentra-tions were needed to stimulate muscle protein synthesiswhen insulin alone was given. Similarly, infusion of amixture of amino acids did not affect protein synthesis,although amino acids plus insulin at a physiologicalconcentration resulted in a stimulation similar to thatinduced by feeding (Garlick and Grant, 1988). The con-clusion from these results was that amino acids en-hanced the sensitivity of muscle protein synthesis toinsulin. Later studies suggested that the main effect ofamino acids was the result of the branched-chain aminoacids, and possibly only leucine (Garlick et al., 1992).
Studies of feeding and insulin infusion have also beenperformed in adult rats (1-yr-old), showing that starva-tion periods of 12 or 36 h had little effect on muscleprotein synthesis, in stark contrast to the results fromgrowing animals (Baillie and Garlick, 1992). Moreover,there was little effect of refeeding or insulin infusionafter fasting. It has therefore been suggested that thesensitivity of muscle protein synthesis to nutrients inthe young animal might be related to the growth process

Garlick et al.E138
Figure 2. Effects of various pathological states on thefractional rate of protein synthesis (FSR) in human mus-cle. Values are expressed as percentage of the value mea-sured in the same subject prior to starvation or surgery,or as percentage of values obtained in normal healthysubjects for the AIDS and intensive care patients. Threedays of starvation result in a small depression in muscleprotein synthesis (Essen et al., 1992a), whereas gall blad-der surgery (cholecystectomy) either by the open (Essen etal., 1992b) or minimally invasive (laparoscopic) technique(Essen et al., 1993) causes an almost immediate 30% de-crease. Minor surgery (lump removed) has no effect, butmajor abdominal surgery results in no greater responsethan cholecystectomy (Tjader et al., 1993), suggesting an“all or nothing” type of response. Chronic infection(AIDS) does not influence muscle protein synthesis(McNurlan et al., 1997), whereas critically ill patients inthe ICU display both increased and decreased rates (Essenet al., 1998), probably as a result of their wide range ofmedical and surgical conditions, illustrated by the upperpart of the histogram bar.
(Baillie and Garlick, 1992). In the adult, by contrast,the much smaller retention of protein after feedingmight be brought about not by an increase in synthesis,but instead by a depression of protein degradation.Whether this distinction between responses in theyoung and adult is also true in humans is not yet clear.When measurements of whole-body protein synthesiswere made daily in preterm neonates over the firstfew days of life, during which the dietary intake wasincreased daily, there were corresponding increases inprotein retention, as a result of an increase in proteinsynthesis and a smaller increase in degradation (Mittonet al., 1991). This suggests the same sensitivity of pro-tein synthesis to feeding as in the growing rat. More-over, when measurements of the response of muscleprotein synthesis to feeding or short periods of starva-tion have been made in adult humans, only smallchanges have been demonstrated in some studies (Es-sen et al., 1992a; McNurlan et al., 1993) (Figure 2),similar to the adult rats. However, other studies havesuggested much larger effects of nutrient intake (Re-nnie et al., 1982; Biolo et al., 1997), and these differ-ences in response need to be resolved.
Muscle Protein Synthesis in Pathological States
Much of the work on human protein metabolism hasbeen directed toward an understanding of the mecha-nisms that underlie the loss of body protein, particu-larly from skeletal muscle, in pathological conditionssuch as injury and infection. In an attempt to elucidatethe muscle wasting that takes place after surgical in-jury, measurements of muscle protein synthesis weremade in patients before and after gall bladder surgery(cholecystectomy). A short period of anesthesia withoutsurgery did not affect muscle protein synthesis, butimmediately after the completion of surgery (open cho-lecystectomy, Figure 2), there was already a 30% fall(Essen et al., 1992b). By d 3 after surgery, the decreasein protein synthesis had enlarged to 50% (Essen et al.,1993). These data suggest that muscle wasting aftersurgery results at least in part from an immediate andsustained decrease in muscle protein synthesis. Fur-ther experiments were performed to see whether thischange was dependent on the degree of trauma. Minorsurgery for breast lump removal did not affect muscleprotein synthesis, but the effect of major surgery wasno greater than that of cholecystectomy (Figure 2)(Tjader et al., 1993). Moreover, the rates in criticallyill patients in the intensive care unit were on averageless depressed than those after surgery, although therange of values, shown in Figure 2 by the upper partof the bar, was in this case considerable (Essen et al.,1998). Surprisingly, laparoscopic cholecystectomy didnot produce a smaller depression of protein synthesisthan conventional, open surgery (Figure 2), eventhough its beneficial effects on recovery are well ac-cepted (Essen et al., 1993). Muscle wasting also occursin chronic diseases, such as HIV/AIDS. In this case wehave shown that protein synthesis is not depressed;even patients who show overt muscle wasting do nothave lower rates of muscle protein synthesis (Figure 2)(McNurlan et al., 1997).
The factors that cause the decrease in protein synthe-sis and protein wasting are therefore not clear at pres-ent, as the rate of protein synthesis does not appear tobe related to the degree of stress or trauma. This isparticularly apparent in critically ill patients, whomight display either reduced or elevated rates of proteinsynthesis (Figure 2), which do not relate well to theclinical condition of the patient (Essen et al., 1998; Ga-mrin et al., 2000). As modulation of protein degradationis also thought to be important in pathological states,combined measurements of synthesis and degradationmay be needed in future studies.
Because protein wasting contributes substantially tomorbidity and mortality, there has been much interestin the potential benefits of nutritional support. How-ever, studies in patients following cholecystectomyshowed that postoperative intravenous nutrition didnot diminish the inhibition of protein synthesis (Essenet al., 1993). The inability of conventional nutritionalsupport to stem protein wasting has led to the search

Regulation of protein metabolism E139
Figure 3. Fractional rates of muscle protein synthesis(FSR) before and 2 wk after growth hormone treatmentof healthy subjects and patients with asymptomatic HIVinfection, AIDS without wasting, and AIDS with wasting(McNurlan et al., 1997). The histogram illustrates the stim-ulation of muscle protein synthesis by GH in healthysubjects, which declines in magnitude in patients whoare HIV positive but asymptomatic or who are sufferingfrom AIDS. In patients with advanced AIDS who havemuscle wasting, the effect of GH is to inhibit rather thanstimulate, suggesting that treatment with anabolic factorssuch as GH might be counterproductive.
for new strategies, such as nutritional support supple-mented with specific amino acids, e.g., branched-chainamino acids (BCA) or glutamine, or treatment withgrowth hormone, which might be needed to minimizeprotein loss after surgery and to optimize recovery. Ingeneral, these strategies have not proved very success-ful. Although BCA have been shown in growing animalsto enhance the stimulation of muscle protein synthesisby insulin (see above), and in vitro to stimulate muscleprotein synthesis directly (Li and Jefferson, 1978), inpatients they have not consistently been shown to im-prove nitrogen balance (Brennan et al., 1986). More-over, in colorectal cancer patients, BCA-supplementednutrition did not enhance muscle protein synthesis(McNurlan et al., 1994b). Similarly, it has been sug-gested from work in animals that glutamine can stimu-late protein synthesis (Jepson et al., 1988), but directmeasurement of muscle protein synthesis in patientssupplemented with glutamine after surgery (Janusz-kiewicz et al., 1996) did not reveal any beneficial re-sponse. However, because of glutamine’s potential rolein preserving gut integrity and immune function (Jonaset al., 1999; Wilmore et al., 1999), this amino acid isstill under active investigation.
Protein wasting is also a characteristic of chronicinfectious diseases, in particular in patients with AIDS.However, as indicated above, muscle protein synthesisis not depressed. As shown in Figure 3, there are no
significant differences in postabsorptive rates of muscleprotein synthesis between healthy controls and pa-tients who are HIV positive but asymptomatic, or whohave AIDS with or without wasting. There have beena number of studies of the effectiveness of GH treatmentto restore muscle mass in AIDS patients, with varyingresults (Krentz et al., 1993; Mulligan et al., 1993;Schambelan et al., 1996). In the study illustrated inFigure 3, muscle protein synthesis was measured inpatients at various stages of HIV infection comparedwith healthy controls. When these patients were givena 2-wk course of treatment with growth hormone, thereason for the wasting became clear, as there was asignificant stimulation in muscle protein synthesis inthe healthy controls and in asymptomatic HIV patients,but an inhibition of protein synthesis in AIDS patients,particularly those who were wasted (Figure 3). Thissuggests that the trophic mechanisms involved in main-taining muscle mass, such as growth hormone and IGF-I, have become progressively deficient as the HIV dis-ease advances (McNurlan et al., 1997). In an attemptto discover the mechanisms involved, the plasma fromthese patients was analyzed for IGF-I and a number ofcytokines. The GH treatment caused a similar elevationof IGF-I levels in all groups, suggesting that decliningresponse to GH reflected a decreased responsiveness ofthe muscle to IGF-I. The plasma levels of TNFα did notdiffer between groups, but the level of the soluble TNFreceptor Type 2 (sTNFR-2) correlated negatively (P =0.01) with the stimulation of protein synthesis by GH(Gelato et al., 2002). The plasma concentration ofsTNFR-2 may be a measure of the ongoing level ofimmune activation, as its plasma half-life is muchlonger than that of TNFα. Hence, this correlation sug-gests that resistance to GH treatment, and hence thedecrease in muscle responsiveness to IGF-I, might bethe result of an inflammatory process involving TNF.
A number of pathological states involving wasting areassociated with acidosis, which has received relativelylittle attention as a possible mediator of protein wast-ing. In the study of protein synthesis in muscle of criti-cally ill patients (Figure 2) (Essen et al., 1998), the widevariation in rates was partially explained by variationsin the arterial pH. Also, there have been studies sug-gesting that acidosis causes negative nitrogen and leu-cine balance (Reaich et al., 1992; Ballmer et al., 1995)and that proteolysis in muscle is enhanced (Mitch etal., 1993). Our own work has led to the conclusion thatmuscle protein synthesis is inhibited by acidosis andmay also be stimulated by alkalosis. Seven days of met-abolic acidosis, induced in human volunteers by ammo-nium chloride administration, resulted in negative ni-trogen balance and a significant depression of rates ofsynthesis of serum albumin (Ballmer et al., 1995). Amore recent work has shown that human muscle pro-tein synthesis is depressed by 2 d of metabolic acidosis(Kleger et al., 2001). This phenomenon has also beendemonstrated in a rat model, involving intragastric ga-vage of ammonium chloride over 24 h (Figure 4) (Caso

Garlick et al.E140
Figure 4. The effect of acidosis induced by gavaging ratswith ammonium chloride on fractional rates of proteinsynthesis in gastrocnemius, plantaris, soleus, and heartmuscle (Caso et al., 1999, 2000b). After 24 h of acidosis,the rate of protein synthesis is significantly depressedin skeletal muscle, but not in other tissues (not shown),suggesting that the muscle wasting observed in renaldialysis and critically ill patients might in part be theresult of their acidosis.
et al., 1999, 2000a), showing that plantaris and gastroc-nemius muscles, containing mixed fiber types, are in-hibited more by acidosis than soleus, containing mainlyoxidative fibers, and that cardiac muscle is unaffected.In addition, no effects were found in liver, gut, spleen,and kidney. Moreover, muscle protein synthesis in ratsis also depressed by respiratory acidosis (Caso et al.,2000b). Figure 5 shows evidence that pH might be ofimportance in critically ill patients, and moreover, thatalkalosis might stimulate protein synthesis. Measure-ments of muscle protein synthesis were made in headtrauma patients, who were hyperventilated as part oftheir treatment, resulting in respiratory alkalosis. Themeasurement was then repeated shortly after hyper-ventilation was discontinued. The resulting fall in arte-rial pH was associated with a significant fall in the rateof muscle protein synthesis (Figure 5) (Vosswinkel etal., 2000), suggesting that pH might have an importantrole in modulating protein synthesis in pathologicalstates.
Conclusions
During growth, muscle protein synthesis is especiallysensitive to stimulation by nutrient intake, through thecombined actions of insulin and amino acids, particu-larly the branched-chain amino acids. However, theseanabolic responses appear to be blunted in adulthoodrats, and possibly in humans also. In the adult human,pathological states, such as injury and infection, resultin muscle protein wasting, which in the case of surgeryis associated with a fall in muscle protein synthesis.However, this defect in protein synthesis is not effec-tively reversed by provision of nutritional support, evenwhen supplemented with branched-chain amino acidsor glutamine. Moreover, attempts to enhance proteinsynthesis after surgery and in AIDS patients by treat-
Figure 5. The changes in muscle protein synthesis (FSR)and arterial pH (mean ± SEM) in head trauma patientsduring hyperventilation and shortly after normal respira-tory parameters had been restored. (Vosswinkel et al.,2000). Hypertension is employed to alleviate possiblebrain edema, but this also results in alkalosis. On cessationof hyperventilation the arterial oxygen saturation is main-tained but the pH falls, in association with the observedfall in muscle protein synthesis rate, which is consistentwith hypothesis that alkalosis enhances muscle proteinsynthesis.
ment with growth hormone have also been unsuccess-ful, possibly because the inflammatory process reducesthe responsiveness of muscle to anabolic factors such asGH and IGF-I. In addition to nutrients and hormones,physiological factors such as pH might also have a roleto play in the regulation of protein balance, especiallyin pathological states, as changes in arterial pH havebeen shown to alter protein synthesis in healthy ratsand humans, and also in critically ill patients.
Implications
A better knowledge of how the responses to nutrientsare modulated by hormones and by physiological factorssuch as inflammation and pH may lead to more effective

Regulation of protein metabolism E141
ways of preventing tissue wasting due to illness oraging.
Literature Cited
Adey, D., J. T. McCarthy, R. Kumar, and K. S. Nair. 1997. Mecha-nisms of muscle wasting in chronic renal failure. J. Investig.Med. 45:280A.
Baillie, A. G. S., and P. J. Garlick. 1992. Attenuated response ofmuscle protein synthesis to fasting and insulin in adult femalerats. Am. J. Physiol. 262:E1–E5.
Ballmer, P. E., M. A. McNurlan, H. N. Hulter, S. E. Anderson, P. J.Garlick, and R. Krapf. 1995. Chronic metabolic acidosis de-creases albumin synthesis and induces negative nitrogen bal-ance in humans. J. Clin. Investig. 95:39–45.
Ballmer, P. E., M. A. McNurlan, B. G. Southorn, I. Grant, and P. J.Garlick. 1991. Effects of human recombinant interleukin-1β onprotein synthesis in rat tissues compared with a classical acute-phase reaction induced by turpentine. Biochem. J. 279:683–688.
Barle, H. P., P. Essen, B. Nyberg, H. Olivecrona, M. Tally, M. A.McNurlan, J. Wernerman, and P. J. Garlick. 1999. Depressionof liver protein synthesis during surgery is prevented by GrowthHormone. Am. J. Physiol. 276:E620–E627.
Biolo, G., K. D. Tipton, S. Klein, and R. R. Wolfe. 1997. An abundantsupply of amino acids enhances the metabolic effect of exerciseon muscle protein. Am. J. Physiol. 273:E112–E119.
Brennan, M. F., F. Cerra, J. M. Daly, J. E. Fischer, L. L. Moldawer,R. J. Smith, E. Vinnars, R. Wannemacher, and V. R. Young.1986. Report of a research workshop: branched-chain aminoacids in stress and injury. J. Parenter. Enterol. Nutr. 10:446–52.
Caso, G., G. C. Ford, K. S. Nair, P. J. Garlick, and M. A. McNurlan.2002. Enrichment of phenylalanyl-tRNA after flooding with L-[2H5]phenylalanine: effect of insulin on muscle protein synthe-sis. Am. J. Physiol. (In press).
Caso, G., G. C. Ford, K. S. Nair, J. A. Vosswinkel, P. J. Garlick, andM. A. McNurlan. 2001. Increased concentration of trace affectsestimates of muscle protein synthesis. Am. J. Physiol.280:E937–E946.
Caso, G., B. Tyndall, D. Sasvary, G. Casella, and P. J. Garlick. 2000a.Muscle protein synthesis is depressed by acute respiratory acido-sis. FASEB J. 14:A768.
Caso, G., B. Tyndall, D. Sasvary, G. Casella, P. Kang, and P. J.Garlick. 1999. Inhibition of muscle protein synthesis in rats byacute metabolic acidosis. FASEB J. 13:A909.
Caso, G., B. Tyndall, D. Sasvary, G. Casella, J. Vosswinkel, andP. J. Garlick. 2000b. Acute metabolic acidosis inhibits muscleprotein synthesis in rats irrespective of the method used formeasurements. Diab. Nutr. Metab. 12:169.
Essen, P., M. A. McNurlan, L. Gamrin, K. Hunter, A. G. Calder, P.J. Garlick, and J. Wernerman. 1998. Tissue protein synthesisrates in critically ill patients. Crit. Care Med. 26:92–100.
Essen, P., M. A. McNurlan, T. Sonnenfeld, E. Milne, E. Vinnars, J.Wernerman, and P. J. Garlick. 1993. Muscle protein synthesisafter operation: the effects of intravenous nutrition. Eur. J. Surg.159:195–200.
Essen, P., M. A. McNurlan, J. Wernerman, E. Milne, E. Vinnars, andP. J. Garlick. 1992a. Short-term starvation decreases skeletalmuscle protein synthesis rate in man. Clin. Physiol. 12:287–299.
Essen, P., M. A. McNurlan, J. Wernerman, E. Vinnars, and P. J.Garlick. 1992b. Uncomplicated surgery, but not general anesthe-sia, decreases muscle protein synthesis. Am. J. Physiol.262:E253–E260.
Essen, P., A. Thorell, M. A. McNurlan, O. Ljungqvist, J. Wernerman,and P. J. Garlick. 1995. Laparoscopic cholecystectomy does notprevent the postoperative protein catabolic response in muscle.Ann. Surg. 222:36–42.
Gamrin, L., P. Essen, E. Hultman, M. A. McNurlan, P. J. Garlick, andJ. Wernerman. 2000. Protein-sparing effect in skeletal muscle ofgrowth hormone treatment in critically ill patients. Ann. Surg.231:577–586.
Garlick, P. J., A. G. S. Baillie, I. Grant, and M. A. McNurlan. 1992.In vivo action of insulin on protein metabolism in experimentalanimals. In: K. S. Nair (ed.) Protein Metabolism in DiabetesMellitus. pp 163–171. Smith Gordon and Co., London.
Garlick, P. J., M. Fern, and V. R. Preedy. 1983. The effect of insulininfusion and food intake on muscle protein synthesis in postab-sorptive rats. Biochem. J. 210:669–676.
Garlick, P. J., and I. Grant. 1988. Amino acid infusion increases thesensitivity of muscle protein synthesis in vivo to insulin: effectof branched-chain amino acids. Biochem. J. 254:579–584.
Garlick, P. J., and M. A. McNurlan. 1998. Measurement of proteinsynthesis in human tissues by the flooding method. Curr. Opin.Clin. Nutr. Metab. Care. 1:455–460.
Garlick, P. J., M. A. McNurlan, P. Essen, and J. Wernerman. 1994.Measurement of tissue protein synthesis rates in vivo: a criticalanalysis of contrasting methods. Am. J. Physiol. 266:E287–E297.
Garlick, P. J., M. A. McNurlan, and V. R. Preedy. 1980. A rapid andconvenient technique for measuring the rate of protein synthesisin tissues by injection of [3H]phenylalanine. Biochem. J.192:719–723.
Garlick, D. J., W. P. T. Millward, W. P. T. James, and J. C. Waterlow.1975. The effect of protein deprivation and starvation on therate of protein synthesis in tissues of the rat. Biochim. Biophys.Acta. 414:71–84.
Garlick, P. J., J. Wernerman, M. A. McNurlan, P. Essen, G. E. Lobley,E. Milne, A. G. Calder, and E. Vinnars. 1989. Measurement ofthe rate of protein synthesis in muscle of postabsorptive youngmen by injection of a ‘flooding dose’ of [1-13C]leucine. Clin. Sci.77:329–336.
Gelato, M. E., D. Mynarcik, and M. A. McNurlan. 2002. Soluble TNF-α Receptor 2, a serum marker of resistance to the anabolic ac-tions of growth hormone in subjects with HIV disease. Clin. Sci.(In press).
Halliday, D., P. J. Pacy, K. N. Cheng, F. D. Dworzak, J. N. A. Gibson,and M. J. Rennie. 1988. Rate of protein synthesis in skeletalmuscle of normal man and patients with muscular dystrophy;a reassessment. Clin. Sci. 74:237–240.
Heys, S. D., K. G. M., M. A. McNurlan, J. D. B. Miller, O. Eremin,and P. J. Garlick. 1992. Protein synthesis rates in colon andliver: stimulation by gastrointestinal pathologies. Gut 33:976–981.
Januszkiewicz, A., P. Essen, M. A. McNurlan, G. A. Calder, K. Anders-son, J. Wernerman, and P. J. Garlick. 1996. The effect of short-term infusion of glutamine on muscle protein synthesis postoper-atively. Clin. Nutr. 15:267–273.
Jepson, M. M., P. C. Bates, P. Broadbent, J. M. Pell, and D. J. Mill-ward. 1988. Relationship between glutamine concentration andprotein synthesis in rat skeletal muscle. Am. J. Physiol.255:E166–172.
Jonas C. R., C. F. Estivariz, D. P. Jones, L. H. Gu, T. M. Wallace, E.E. Diaz, R. R. Pascal, G. A. Cotsonis, and T. R. Ziegler. 1999.Keratinocyte growth factor enhances glutathione redox statein rat intestinal mucosa during nutritional repletion. J. Nutr.129:1278–1284.
Kleger, G. R., M. Turgay, R. Imoberdorf, M. A. McNurlan, P. J. Gar-lick., and P. E. Ballmer. 2001. Acute metabolic acidosis decreasesmuscle protein synthesis but not albumin synthesis in humans.Am. J. Kidney Dis. (In press).
Krentz, A. J., F. T. Koster, D. M. Crist, K. Finn, L. Z. Johnson, P. J.Boyle, and D. S. Schade. 1993. Anthropometric, metabolic, andimmunological effects of recombinant human growth hormonein AIDS and AIDS-related complex. J. AIDS 6:245–251.
Li, J. B., and L. S. Jefferson. 1978. Influence of amino acid availabilityon protein turnover in perfused skeletal muscle. Biochim. Bio-phys. Acta 544:351–359.
Ljungqvist, O., M. Persson, J. Schimke, G. C. Ford, and S. Nair.1996. Effect of meal-induced insulin on muscle protein synthesis:measurement using amino acyl tRNA as the precursor pool.Diabetes 45:103A.
Loftfield, R. B., and E. A. Eigner. 1958. The time required for thesynthesis of a ferritin molecule in rat liver. J. Biol. Chem.231:925–943.

Garlick et al.E142
Loftfield, R. B., and A. Harris. 1956. Participation of free amino acidsin protein synthesis. J. Biol. Chem. 219:151–159.
Matthews, D. E., H. P. Schwartz, R. D. Young, K. J. Motil, and R.Young. 1982. Relationship of plasma leucine and α-ketoisoca-proate during a L-[1-13C]leucine infusion in man: a method formeasuring human intracellular leucine tracer enrichment. Me-tabolism 31:1105–1112.
McNurlan, M. A., P. Essen, E. Milne, E. Vinnars, P. J. Garlick, andJ. Wernerman. 1993. Temporal responses of protein synthesisin human skeletal muscle to feeding. Br. J. Nutr. 69:117–126.
McNurlan, M. A., P. Essen, A. Thorell, A. G. Calder, S. E. Anderson,O. Ljungqvist, A. Sandgren, I. Grant, I. Tjader, J. Wernerman,and P. J. Garlick. 1994a. Response of protein synthesis in humanskeletal muscle to insulin: an investigation with L-[2H5]phenyla-lanine. Am. J. Physiol. 267:E102–E108.
McNurlan, M. A., P. J. Garlick, K. A. DeChristofaro, R. A. Frost, C.H. Lang, R. W. Johnson, A. M. Santasier, R. T. Steigbigel, J.Fuhrer, and M. C. Gelato. 1997. Responsiveness of muscle pro-tein synthesis to growth hormone administration in HIV infectedindividuals declines with severity of disease. J. Clin. Investig.100:2125–2132.
McNurlan, M. A., S. D. Heys, K. G. M. Park, J. Broom, D. S. Brown,O. Eremin, and P. J. Garlick. 1994b. Tumour and host tissueresponses to branched-chain amino acid supplementation of pa-tients with cancer. Clin. Sci. 86:339–345.
McNurlan, M. A., A. M. Tomkins, and P. J. Garlick. 1979. The effectof starvation on the rate of protein synthesis in rat liver andsmall intestine. Biochem. J. 178:373–379.
Mitch, W. E, C. Jurkovitz, and B. K. England. 1993. Mechanismsthat cause protein and amino acid catabolism in uremia. Am.J. Kidney Dis. 21:91–95.
Mitton, S. G., A. G. Calder, and P. J. Garlick. 1991. Protein turnoverrates in sick, premature neonates during the first few days oflife. Pediatr. Res. 30:418–422.
Mulligan, K., C. Grunfeld, M. K. Hellerstein, R. A. Neese, and M.Schambelan. 1993. Anabolic effects of recombinant humangrowth hormone in patients with wasting associated with humanimmunodeficiency virus infection. J. Clin. Endocrinol. Metab.77:956–962.
Park, K. G. M., S. D. Heys, M. A. McNurlan, P. J. Garlick, and O.Eremin. 1994. Lymphocyte protein synthesis in vivo: a measureof activation. Clin. Sci. 86:671–675.
Park, K. G. M., A. M. Thompson, A. Munro, N. Langlois, M. A. McNur-lan, O. Eremin, and P. J. Garlick. 1994. In vivo rates of mucosalprotein synthesis in patients with Barrett’s esophagus. Dis.Esophagus 7:107–111.
Preedy, V. R., and P. J. Garlick. 1986. The response of muscle proteinsynthesis to nutrient intake in postabsorptive rats: the role ofinsulin and amino acids. Biosci. Rep. 6:177–183.
Reaich, D., S. M. Channon, C. M. Scrimgeour, and T. H. J. Goodship.1992. Ammonium chloride-induced acidosis increases proteinbreakdown and amino acid oxidation in humans. Am. J. Physiol.263:E735–E739.
Rennie, M. J., R. H. Edwards, D. Halliday, D. E. Matthews, S. L.Wolman, and D. J. Millward. 1982. Muscle protein synthesismeasured by stable isotope techniques in man: effects of feedingand fasting. Clin. Sci. 63:519–523.
Rennie, M. J., K. Smith, and P. W. Watt. 1994. Measurement ofhuman tissue protein synthesis:an optimal approach. Am. J.Physiol. 266:E298–E307.
Schambelan, M., K. Mulligan, C. Grunfeld, E. S. Daar, A. LaMarca,D. P. Kotler, J. Wang, S. A. Bozzetti, and J. B. Breitmeyer. 1996.Recombinant human growth hormone in patients with HIV-associated wasting. Ann. Intern. Med. 125:873–882.
Tjader, I., P. Essen, A. Thorne, M. A. McNurlan, A. G. Calder, P. J.Garlick, and J. Wernerman. 1993. Minor surgery has no immedi-ate effect on protein synthesis rate in human skeletal muscle.Clin. Nutr. 12:7.
Vosswinkel, J. A., C. E. M. Brathwaite, T. R. Smith, J. M. Ferber,G. Casella, and P. J. Garlick. 2000. Hyperventilation increasesmuscle protein synthesis in critically ill trauma patients. J. Surg.Res. 91:61–64.
Waterlow, J. C., P. J. Garlick, and D. J. Millward. 1978. ProteinTurnover in Mammalian Tissues and in the Whole Body. p804 Amsterdam.
Watt, P. W., Y. Lindsay, C. M. Scrimgeour, P. A. F. Chiien, J. N.A. Gibson, D. J. Taylor, and M. J. Rennie. 1991. Isolation ofaminoacyl-tRNA and its labeling with stable isotope tracers:Use in studies of human tissue protein synthesis. Proc. Natl.Acad. Sci. USA. 88:5892–5896.
Wilmore, D. W., P. R. Schloerb, and T. R. Ziegler. 1999. Glutamine inthe support of patients following bone marrow transplantation.Current Opin. Clin. Nutr. Metab. Care. 2:323–327.
Young, V. R. 1987. Kinetics of human amino acid metabolism, nutri-tional implications and some lessons. Am. J. Clin. Nutr.46:709–725.
Challenges and opportunities facing animal agriculture: Optimizing nitrogenmanagement in the atmosphere and biosphere of the Earth1
E. B. Cowling*2 and J. N. Galloway†
*North Carolina State University, Raleigh 27695 and †University of Virginia, Charlottesville 22904
ABSTRACT: Humans need food. Humans use en-ergy. Production of food and combustion of fossil fuelsincrease concentrations of reactive nitrogen in the at-mosphere, soils, and surface and ground waters of theEarth. These increases are caused in part by agricul-tural practices aimed primarily at increasing food pro-duction: the use of synthetic nitrogen fertilizers, wide-spread planting of N-fixing legumes, increased demandfor animal protein in human diets, and increased useof fossil fuels. The world’s crops, forests, and fisheriesrespond to reactive nitrogen (defined in the body of thisarticle) enrichment with some positive benefits (suchas increased food, feed, timber, and fish production) andsome negative consequences (including acidificationand eutrophication of aquatic and terrestrial ecosys-tems, decreased biodiversity, increased regional haze,global warming, and such human health impacts asnitrate contamination of drinking water and increasedpulmonary and cardiac disease caused by exposure totoxic ozone and fine particulate matter).
So far, most pollution abatement strategies haveaimed at resolving one or another air or water pollutionproblem in which various oxidized, reduced, and or-
Key Words: Air Pollution, Ammonia, Emission, Environmental Impact, Nitrogen Cycle,Nutrient Management, Water Pollution
2002 American Society of Animal Science. All rights reserved. J. Anim. Sci. 80(E. Suppl. 2):E157–E167
Introduction
This review paper was prepared with the followinggeneral purposes in mind.
1The authors are indebted to Viney Aneja, Lee Allen, Anita Bahe,Leonard Bull, Kathy Cochran, Jan Willem Erisman, Cari Furiness,Barbara Glenn, Walter Heck, Sheila Holman, Steve Levitas, RobertMikkelsen, George Murray, Brock Nicholson, Wayne Robarge, JosephRudek, Jason Shih, Stan Smeulders, Henry Tyrrell, and Mike Wil-liams for their help in developing some of the ideas in this paper.
2Correspondence: 1509 Varsity Drive, Raleigh, NC 27606 (phone:919-515-7564; fax: 919-515-1700; E-mail: [email protected]).
Received October 10, 2001.Accepted August 16, 2002.
E157
ganic forms of reactive nitrogen play an important part.The time has come to consider more fully integratedstrategies by which reactive nitrogen managementpractices can be optimized to increase agricultural, for-est, and fish production while decreasing nitrogen-in-duced soil, air, and water pollution.
Contemporary challenges and opportunities facinganimal agriculture in the United States today includejoining with the U.S. Environmental Protection Agency,animal industry, university, and other scientists andpolicy makers in making realistic assessments of actualpositive and negative impacts of reactive nitrogen emis-sions and leaching from animal agriculture and devel-oping practical (economic) guidelines and strategies forthe following: a) improving nitrogen conversion effi-ciency in poultry, swine, beef/dairy, and fish production,b) minimizing reactive nitrogen losses from manures,c) conserving and reusing reactive nitrogen and othervaluable nutrients in animal wastes, d) developingmore cost-effective horizontally and vertically inte-grated systems of animal production and manure man-agement through production and marketing of value-added products, and e) minimizing use of fossil fuelsin agriculture.
1. Explore some general features of the nitrogen cycleof the Earth and how this cycle is being altered byhumans in their quest for food, energy, and otheramenities of modern life.
2. Explain how contemporary changes in animal agri-culture are increasing the circulation of biologicallyactive and chemically or physically reactive nitro-gen (Nr)3 among the atmosphere, soils, forests,
3The term reactive nitrogen as used in this paper includes allbiologically active, photochemically reactive, and radiatively active(climate changing) nitrogen compounds in the atmosphere and bio-sphere of the Earth. Thus, Nr includes a) inorganic reduced formsof N (such as NH3, NH4
+), b) inorganic oxidized forms of N (such asNOx, HNO3, N2O, NO3
−, NO2−), and c) organic compounds (such as
urea, uric acid, amino acids, amines, proteins, nucleic acids).

Cowling and GallowayE158
fish, surface and ground waters, and oceans of theEarth—mainly through atmospheric emissions ofammonia from animal feeding operations and ox-ides of nitrogen from fossil fuels used in transportof feed grains, animals, manures, and marketablefood products.
3. Consider how these increases in Nr circulation arecausing some positive benefits for agriculture, for-estry, and fisheries while also causing some nega-tive impacts on air and water quality, humanhealth, ecosystem productivity, and other air andwater quality-related values.
4. Explore the potential for enterprising farmers andranchers to join with other experts in animal nutri-tion, agricultural engineering, atmospheric chem-istry and meteorology, and agricultural economicsin universities, government agencies, and the pri-vate sector in developing alternative technologiesby which value-added products can be producedfrom animal manures and food-processing wastesto increase the profitability of animal agriculture.
5. Provide justification for adopting a Total ReactiveNitrogen Approach (Total Nr Approach) ratherthan continuing to try to decrease emissions of oxi-dized and reduced forms of nitrogen separately.
6. Propose a Concept of Optimum Nitrogen Manage-ment for Society in North America, Europe, andAsia.
7. Encourage animal scientists to continue their edu-cation about optimizing Nr management in foodproduction, energy use, and environmental protec-tion (see lists of additional references at the endof this article that pertain to continuing education).
The Nitrogen Cycle of the Earth
Nitrogen is the very stuff of life. It constitutes a majorpart of the nucleic acids that determine the geneticcharacter of all living things and the enzyme proteinsthat drive the metabolic machinery of every living cell.Triple-bonded gaseous dinitrogen (N2) makes up nearly80% of the total mass of the Earth’s atmosphere. Butnone of this huge reservoir of N is biologically available.Before N can be used by most plants, animals, insects,and microorganisms, the triple bonds between gaseousN2 molecules must be broken and the resulting singleN atoms must be bonded chemically with one or moreof three other essential nutrient elements—oxygen and/or hydrogen through N-fixation processes and carbonthrough N-assimilation processes.
Breaking the triple bonds between gaseous dinitro-gen molecules is an energy-requiring reaction. In na-ture, fixation of N2 is accomplished mainly by certainunique microorganisms that have developed the specialmetabolic machinery necessary to produce biologicallyactive reduced forms of nitrogen, such as ammonia,amines, and amino acids, which are the structural con-stituents of proteins and nucleic acids. These special-
ized organisms include a few free-living bacteria andblue-green algae, and also certain symbiotic bacteriathat have developed special metabolic relationshipswith the roots of leguminous crop plants such as soy-beans, clover, and N-fixing trees such as alder. Oxida-tive fixation of gaseous N2 also occurs in nature, butonly in such high-temperature natural processes aslightning strikes, volcanic eruptions, and wild fires thatlead to production and atmospheric emissions of nitro-gen oxides: NO, NO2, HNO3, NO3
−, N2O, HONO, N2O5,PAN (peroxyacetyl nitrate), and PPN (peroxypropio-nyl nitrate).
In the prehuman world, biological nitrogen fixation(BNF) was the dominant means by which new reactivenitrogen was made available to living organisms. Thetotal amount of Nr that circulated naturally amongvarious compartments of the atmosphere and the bio-sphere of the Earth was quite small. Thus, the awesomebiodiversity and intricate webs of relationships we findin nature evolved in part as a result of intensive compe-tition among many different life forms—most of themgrowing under Nr-limited conditions.
Human Alteration of the Nitrogen Cycle
Gradually during the past two centuries, and moremarkedly during the last few decades, various humanactivities have been adding larger and larger amountsof Nr to terrestrial and aquatic ecosystems and thusaugmenting the natural circulation of Nr through theatmosphere and the biosphere of the Earth. As de-scribed more fully by Vitousek et al. (1997) and Gallo-way (1998), two major human imperatives have driventhese recent changes in the N cycle of the Earth:
1. The need for food to sustain growing numbers ofpeople all over the world. This has been achievedprimarily through an increased use of synthetic Nrfertilizers, widespread planting of N-fixing le-gumes, and increases in animal agriculture to meetgrowing demand for animal protein in humandiets.
2. The seemingly insatiable human appetite for en-ergy and materials with which to create and trans-port many of the goods, services, and other ameni-ties of modern human life.
Figure 1 shows some important aspects of our histori-cal understanding of nitrogen: its inclusion as an ele-ment in the periodic table in 1789, its significance asan essential element for life processes in 1840, the dis-covery of biological nitrogen fixation in 1890, the inven-tion of the Haber-Bosch process for making syntheticnitrogen fertilizers in 1913, and the relationship be-tween this series of scientific discoveries and the spec-tacular growth in the human population during thetwentieth century (Galloway and Cowling, 2002; Gallo-way et al., 2002).

Optimizing N management in animal agriculture E159
Figure 1. The history of nitrogen and human popula-tion. Note the global human population trend from 1860to 2000 (billions of people, left axis). This figure is adaptedfrom Galloway and Cowling (2002).
Figure 2 shows the timelines of change in Nr addedto global circulation as synthetic Nr fertilizers throughthe Haber-Bosch process and other forms of Nr addedthrough widespread planting of N-fixing legumes andcombustion of fossil fuels. Over the last 150 yr, the rateof addition and partial accumulation of anthropogenicNr has increased from about 15 to about 160 Tg N/yr.Please note that both synthetic Nr fertilizers and N-fixing legumes are adding about six times more biologi-
Figure 2. Human alteration of the nitrogen cycle of theEarth. Note rates of Nr creation (in teragrams of Nr peryear) through various human activities: “Haber Bosch”= synthetic NH3 formation through the Haber-Bosch pro-cess, mainly for production of commercial fertilizers; “C-BNF” = Nr creation through widespread cultivation ofN-fixing legumes, paddy rice, and sugar cane; and “FossilFuel” = Nr creation through oxidative fixation of N duringcombustion of fossil fuels. “Total Nr” is the sum of allthree major anthropogenic sources (“Haber Bosch” + “C-BNF” + “Fossil Fuel”). “Natural Range" refers to the ap-proximate global biological fixation of Nr in the prehu-man terrestrial environment. This figure is adapted fromGalloway and Cowling (2002).
Table 1. Agricultural and forestry activities thataugment the nitrogen cycle of the Earth
Activity
• Harvesting of wild animals and fish
• Burning of natural vegetation to make way for agriculture
• Harvesting and utilization of timber
• Production of major food crops (especially cereal grains, beans,and potatoes, and various fruit, nut, and vegetable crops)
• Husbandry of domestic meat-producing and milk-producing ani-mals (especially poultry, swine, beef cattle, sheep, dairy cattle,and goats)
• Land application of animal manures
• Combustion of crop and logging residues
• Widespread cultivation of nitrogen-fixing legumes
• Increased production and use of synthetic N fertilizers
• Increased fish- and shellfish farming in ponds, lakes, streams,rivers, estuaries, and ocean waters
cally active, photochemically reactive, and radiativelyactive (climate altering) N to global circulation thanis the total worldwide combustion of fossil fuels. Animportant part of this Nr enrichment is caused by con-temporary changes in animal agriculture. There alsohave been significant changes in fluxes of Nr to theatmosphere and oceans and some human-inducedchanges in biological denitrification as well.
As indicated in Tables 1 and 2, many agriculturaland forestry activities—and many more industrial,commercial, and military activities—have increasedand are continuing to augment the N cycle of the Earth.In fact, the total amount of Nr circulating through the
Table 2. Industrial, commercial, and military activitiesthat augment the nitrogen cycle of the Earth
Activity
• Combustion of fossil fuels in:� Domestic space and water heating devices� Firing of pottery and manufacture of glass and ceramics� Smelting of metal-containing ores and processing of metals� Production of cement� Power plants for generation of electricity� Small and large industrial and commercial boilers� Construction and earth-moving equipment� Farm tractors and implements� Industrial machines powered by internal combustion engines� Transportation vehicles (including cars, trucks, railroads,
ships, aircraft, and space vehicles)• Production and refining of oil for liquid fuels and production of
petrochemicals• Other chemical industries• Pulp and paper manufacturing• Disposal of urban wastes in landfills• Incineration of household and municipal wastes (including gar-
bage, food-processing wastes, waste paper, plastics, medicalwastes, and construction and demolition debris)
• Operation of sanitary sewers and sewage treatment plants• Land applications of sewage sludges• Use of explosives in peace and war

Cowling and GallowayE160
atmosphere and the biosphere of the Earth is now un-precedented in human history and is increasing rapidly,especially in Asia.
The Changing Structure and Globalization ofAnimal Agriculture
During the last several decades, three dramaticchanges in the structure and organization of animalagriculture have occurred in many parts of the world.They are all resulting in an increased need for optimiza-tion of nutrient management plans for animal agricul-ture—especially as they pertain to handling and pro-cessing of manures and other food-processing wastesand use of fossil fuels. These three major changes areas follows. Intensification: development of increasinglylarge confined animal-feeding operations, in which hun-dreds or even thousands of live animals are reared inopen feedlots or enclosed housing units. Decoupling:physical separation of the land area where the feedgrains and other forage products are produced and thesite on which the food animals are fed and reared. Re-gionalization and globalization of markets: huge in-creases in the distance of transport of both feed grainsand other forages and marketable meat, eggs, dairy,and fish food products.
Driving these three trends are powerful economicforces, namely, economies of scale, efficiencies of spe-cialization, cheap food and transportation policies, andthe pressures of global competitiveness. These forceshave stimulated development of highly specialized,large-scale, vertically integrated livestock, poultry, andfish rearing, processing, and marketing systems. Thesesystems are designed to maximize conversion of feedgrains and other forages into the specialized and uni-form swine, beef/dairy, poultry, and fish food productsdemanded by price-conscious consumers. Unfortu-nately, as discussed more fully below, economic effi-ciency, often made possible by increased use of energyin the form of fossil fuels, frequently leads to somenutrient-use inefficiencies and largely unforeseen detri-mental environmental consequences.
The end result of intensification in confined animal-feeding operations is to concentrate animal rearing andmanure production on a very small land area. Here thedominant tendency is to regard manure as an “unpleas-ant waste material that must be disposed of by the leastcostly methods available.” The traditional alternative,of course, was to return the residual nutrients in ma-nure to the land where the feed grain or other forageswere produced. A second alternative—and a so far muchless widely accepted one—is to regard manure andother animal-harvesting wastes as “valuable naturalresources” from which additional products can be pro-duced and sold at a profit.
The end result of decoupling is to separate the landarea where feed grains and forages are produced fromthe sites where the food animals are reared. In tradi-tional mixed farming operations, this distance was a
few hundred meters and the same farmer who raisedthe livestock or fish also raised the feed grain or otherforages on the same land base. With today’s modernspecialized farming operations, however, many swine,beef/dairy, poultry, and fish farmers are specialistswho, more often than not, produce little if any of thefeed grains or other forages on their own land. In recentdecades, both specialization among food animal produc-ers and further decoupling of animal agriculture hasbeen facilitated by enterprising integrators. These en-trepreneurs are guided by knowledgeable animal-pro-duction scientists, agricultural engineers, economists,and extension agents in the universities and privateindustry. As a result, contracts are developed that linkfarmers; integrators; and meat, egg, dairy, and fishproduct-processing and -marketing companies. The in-tegrators provide engineering designs for new types ofhousing or other animal-rearing and manure-handlingequipment and facilities, genetically improved younganimals, feed rations specifically designed to maximizeweight gain per unit of feed or forage consumed, pre-scriptions for feeding and watering rates, disease man-agement counsel and advice, and, most importantly, aguaranteed price to farmers who deliver finished foodanimals to a specific food-processing plant on a specifiedtime schedule. The processing and marketing compa-nies then deliver uniform, high-quality food productsattractively packaged to meet the demands of price-conscious consumers.
The end-result of regionalization and globalizationof markets is to greatly enlarge the geographical scaleof production and marketing operations in the food-animal industry. Often there are remarkably long dis-tances of transport between the places where the feedgrains and forages are produced, the food animals arereared, the plant where the animals are slaughteredand processed, and the grocery stores and restaurantswhere the food products are delivered to consumers.Fossil fuel energy is consumed, and oxidized forms ofNr are produced at every step in these often far-flungtransportation processes. Powerful economic forces alsoare at work at all stages in these production, transport,and marketing systems. Thus high-quality and veryuniform animal food products are delivered to some-times distant markets at remarkably low consumerprices.
The major problem with all three of these contempo-rary trends is the lack of economic or other incentivesfor recycling—returning the valuable nutrients in ani-mal wastes back to the land that was used to producethe feed. As a result, much of the Nr and other valuablenutrients in animal manures and food-processingwastes is “disposed of by least cost methods,” that is,released into the environment in the vicinity of theanimal-rearing and food-processing facilities. The re-leased substances most often are volatile ammonia,amines, and nitrogen oxides that are emitted to theatmosphere where they form ammonium nitrate or am-monium sulfate aerosols or leach into ground water.

Optimizing N management in animal agriculture E161
Table 3. Beneficial and detrimental effects on society induced by increased circulation of reactive nitrogen (Nr) inthe atmosphere and biosphere of the Earth
Direct effects of Nr on humans
1. Increased yields and nutritional quality of foods needed to meet dietary requirements and food preferences for increasing humanpopulations all over the world
2. Respiratory and cardiac disease in people caused by exposure to high concentrations of:• Ozone• Other photochemical oxidants• Fine aerosol particles• (On rare occasions) direct toxicity of NO2
3. Nitrate and nitrite contamination of drinking water4. Blooms of toxic algae and decreased swimability of water bodies
Direct effects of Nr on ecosystems
1. Increased productivity of Nr-limited crops, forests, and natural ecosystems2. Enhanced overall soil productivity through greater microbial activity and improved soil health3. Ozone damage to crops, forests, and natural ecosystems and predisposition to attack by pathogens and insects4. Acidification effects on forests, soils, ground waters, and aquatic ecosystems5. Eutrophication of freshwater lakes and coastal ecosystems6. Stimulation of algal growth and productivity in coastal waters, with possible effects on coastal food webs and fisheries including
decreased concentrations of dissolved oxygen (hypoxia and anoxia), decline or elimination of submerged aquatic vegetation, promo-tion of certain algal species that are harmful because they produce toxins
7. Nitrogen saturation of soils in forests, grasslands, and other natural areas8. Loss of biodiversity through loss of N-poor habitats in terrestrial and aquatic ecosystems and shifts in ecosystems to domination
by nitrophilic species of plants9. Changes in abundance of beneficial soil organisms that alter ecosystem functions
10. Carbon sequestration can be increased in ecosystems where Nr is limiting, with possible amelioration of CO2 accumulation and re-sulting climate change
Indirect effects of Nr on other societal values
1. Increased wealth and well-being of human populations in many parts of the world2. Increased yield per unit of cultivated land has made it possible to preserve marginal and forested land for ecosystem maintenance3. Significant changes in patterns of land use4. Regional hazes that decrease visibility at scenic vistas and airports5. Odor problems associated with animal agriculture6. Damage to useful materials and cultural artifacts by ozone, other oxidants, and acid deposition7. Depletion of stratospheric ozone by N2O emissions8. Global climate change induced by emissions of N2O and formation of tropospheric ozone9. Long-distance transport of Nr, which causes harmful effects in regions or countries distant from emission sources and/or in-
creased background concentrations of ozone and fine particulate matter10. Increased cost of societal regulations necessary to avoid the detrimental effects of Nr
All of the volatile inorganic and organic forms of Nrare carried by wind and deposited in precipitation oras dry deposition of gases and aerosols wherever thewind blows—sometimes in the vicinity of the animal-rearing or -processing facilities rather than returnedto the sometimes distant land where the feed was pro-duced. In North America, highly competitive demandfor low-cost animal food products and absence of sig-nificant economic penalties or regulations prohibitingimproper animal waste management have been majorimpediments to optimizing management of Nr andother nutrients in animal agriculture.
Beneficial and Detrimental Effects of NrEmissions from Animal Agriculture
Every increment in the amount of total Nr circulatingthrough the atmosphere, soils, sediments, standing bio-mass, and oceans of the Earth brings a correspondingpotential increase in the productivity of agriculture,forestry, and aquatic ecosystems (see the beneficial ef-fects listed in Table 3). As shown in Figure 3, however,
each increment of Nr beyond a certain optimal rangebrings an increased likelihood of at least some amonga long list of Nr-induced detrimental effects on society(see also the detrimental effects listed in Table 3).
Unfortunately, many voluntary recommended man-agement practices or mandated rules and regulationshave been focused around one specific air- or water-pollution problem at a time. In some cases, decisionsabout abatement strategies for one problem have inter-fered with measures intended to resolve another orhave affected some other social or economic aspect ofsociety. For example, regulations in the Netherlandsthat require farmers to inject animal manures into soilincrease the likelihood of nitrate contamination ofdrinking water (Erisman and Monteny, 1998). Also,decreases in emissions of nitrogen oxides have some-times led to increases in ambient concentrations ofozone in the central core of some cities in North America(USEPA, 1997). In the United States, “non-discharge”permits intended to prevent pollution of surface andground waters by confined animal-feeding operationsignored volatile emissions of ammonia and amines from
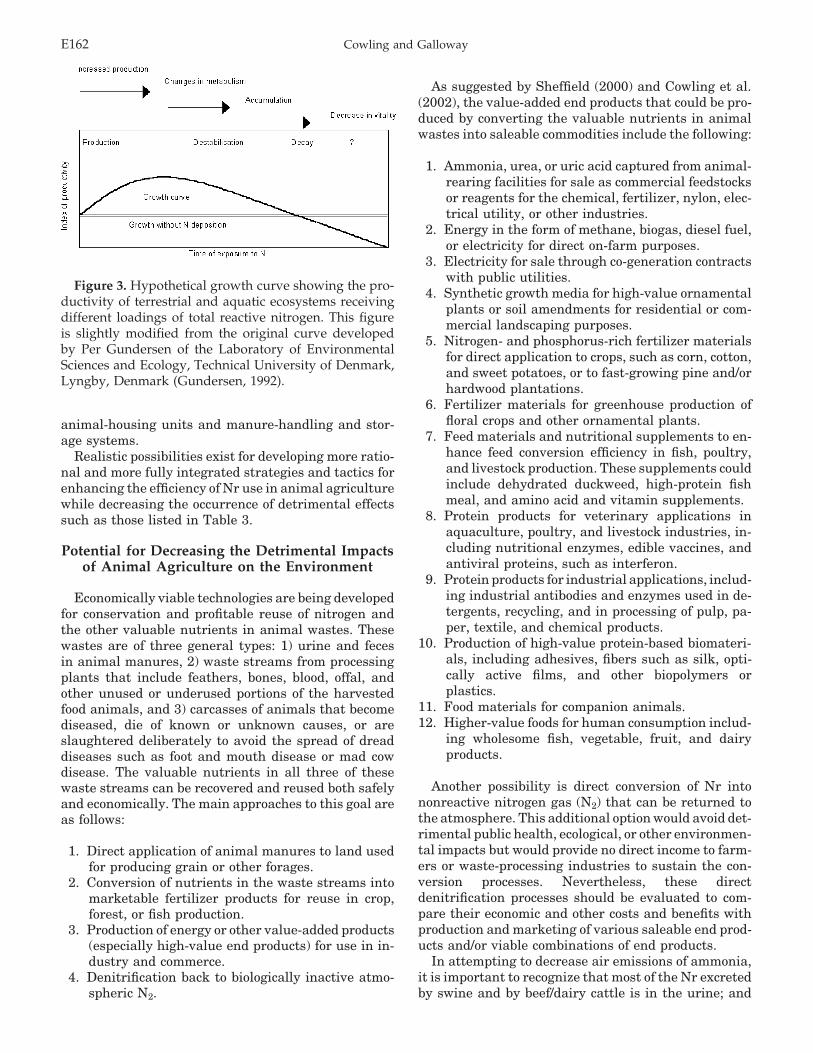
Cowling and GallowayE162
Figure 3. Hypothetical growth curve showing the pro-ductivity of terrestrial and aquatic ecosystems receivingdifferent loadings of total reactive nitrogen. This figureis slightly modified from the original curve developedby Per Gundersen of the Laboratory of EnvironmentalSciences and Ecology, Technical University of Denmark,Lyngby, Denmark (Gundersen, 1992).
animal-housing units and manure-handling and stor-age systems.
Realistic possibilities exist for developing more ratio-nal and more fully integrated strategies and tactics forenhancing the efficiency of Nr use in animal agriculturewhile decreasing the occurrence of detrimental effectssuch as those listed in Table 3.
Potential for Decreasing the Detrimental Impactsof Animal Agriculture on the Environment
Economically viable technologies are being developedfor conservation and profitable reuse of nitrogen andthe other valuable nutrients in animal wastes. Thesewastes are of three general types: 1) urine and fecesin animal manures, 2) waste streams from processingplants that include feathers, bones, blood, offal, andother unused or underused portions of the harvestedfood animals, and 3) carcasses of animals that becomediseased, die of known or unknown causes, or areslaughtered deliberately to avoid the spread of dreaddiseases such as foot and mouth disease or mad cowdisease. The valuable nutrients in all three of thesewaste streams can be recovered and reused both safelyand economically. The main approaches to this goal areas follows:
1. Direct application of animal manures to land usedfor producing grain or other forages.
2. Conversion of nutrients in the waste streams intomarketable fertilizer products for reuse in crop,forest, or fish production.
3. Production of energy or other value-added products(especially high-value end products) for use in in-dustry and commerce.
4. Denitrification back to biologically inactive atmo-spheric N2.
As suggested by Sheffield (2000) and Cowling et al.(2002), the value-added end products that could be pro-duced by converting the valuable nutrients in animalwastes into saleable commodities include the following:
1. Ammonia, urea, or uric acid captured from animal-rearing facilities for sale as commercial feedstocksor reagents for the chemical, fertilizer, nylon, elec-trical utility, or other industries.
2. Energy in the form of methane, biogas, diesel fuel,or electricity for direct on-farm purposes.
3. Electricity for sale through co-generation contractswith public utilities.
4. Synthetic growth media for high-value ornamentalplants or soil amendments for residential or com-mercial landscaping purposes.
5. Nitrogen- and phosphorus-rich fertilizer materialsfor direct application to crops, such as corn, cotton,and sweet potatoes, or to fast-growing pine and/orhardwood plantations.
6. Fertilizer materials for greenhouse production offloral crops and other ornamental plants.
7. Feed materials and nutritional supplements to en-hance feed conversion efficiency in fish, poultry,and livestock production. These supplements couldinclude dehydrated duckweed, high-protein fishmeal, and amino acid and vitamin supplements.
8. Protein products for veterinary applications inaquaculture, poultry, and livestock industries, in-cluding nutritional enzymes, edible vaccines, andantiviral proteins, such as interferon.
9. Protein products for industrial applications, includ-ing industrial antibodies and enzymes used in de-tergents, recycling, and in processing of pulp, pa-per, textile, and chemical products.
10. Production of high-value protein-based biomateri-als, including adhesives, fibers such as silk, opti-cally active films, and other biopolymers orplastics.
11. Food materials for companion animals.12. Higher-value foods for human consumption includ-
ing wholesome fish, vegetable, fruit, and dairyproducts.
Another possibility is direct conversion of Nr intononreactive nitrogen gas (N2) that can be returned tothe atmosphere. This additional option would avoid det-rimental public health, ecological, or other environmen-tal impacts but would provide no direct income to farm-ers or waste-processing industries to sustain the con-version processes. Nevertheless, these directdenitrification processes should be evaluated to com-pare their economic and other costs and benefits withproduction and marketing of various saleable end prod-ucts and/or viable combinations of end products.
In attempting to decrease air emissions of ammonia,it is important to recognize that most of the Nr excretedby swine and by beef/dairy cattle is in the urine; and

Optimizing N management in animal agriculture E163
that urease, the enzyme that converts urea to ammonia,is mainly in the feces (Kaspers et al., 2000). Thus, ma-nure-handling systems for swine and cattle that sepa-rate liquid from solid wastes will have substantiallylower ammonia emission rates.
It is also important to recognize that urea conversionand ammonia volatilization continue from the time ofexcretion by the animals, during manure storage andtreatment, and before and after possible land applica-tion. In the well-ventilated barn and lagoon and spray-field system widely used in swine production in NorthCarolina, for example, about 40% of the ammonia islost through the ventilation system of the houses, about30% from the surface of the lagoons, and about 30%during and after application onto the spray fields andfrom decomposing bales of Bermuda hay left at thesides of the spray fields (there is little market demandfor Bermuda hay) (Aneja et al., 2000; 2001).
The most serious obstacles to overcoming the conse-quences of intensification, decoupling, and regionaliza-tion and globalization of markets in the food animalindustry are as follows: 1) the distances over which feedgrains are transported before delivery to animal rearingfacilities—sometimes in another state or even a far-distant country; 2) reluctance and doubt among farm-ers, integrators, and their extension-service and privateconsultant advisors about the technical and/or eco-nomic feasibility of alternative systems for nutrientmanagement, animal production, and waste utilization;3) lack of convenient and reliable processes for combin-ing manure-based fertilizer products with syntheticchemical fertilizer in intensively managed croppingsystems.
Especially as confined animal-feeding operations be-come more common, conversion of animal manures andanimal-processing waste materials into value-addedproducts for profitable sale is a logical strategy. It willsimultaneously achieve several desirable environmen-tal, public health, and economic goals:
• Recovery and reuse of the nutrient resources in thewaste streams.
• Decrease or elimination of detrimental effects onpublic health and environment.
• Development of profitable private-sector businessand employment opportunities.
• Enhancement of the economic and environmentalsustainability and the social acceptability of foodanimal industries and the social, economic, andenvironmental well-being of the rural and near-urban communities in which these facilities arelocated.
• Decrease in regulatory costs (education, permitting,inspection, and enforcement) associated with cur-rent waste-processing systems.
Justification for a “Total Reactive NitrogenApproach” in Air- and Water-Quality
Management
So far, most of the voluntary recommended manage-ment practices and the mandated rules and regulations
for management of Nr have been developed and admin-istered separately. Moreover, most of the guidance forprevention of water discharges from confined animal-feeding operations have been developed and adminis-tered without regard for the associated air emissionsof volatile ammonia and amines. Air emissions of NOx
were first regulated because NOx is an important pre-cursor of ozone and later because it also contributes toacidification of soils and surface waters. Similarly, airemissions of ammonia first became a pollutant of con-cern because ammonia contributes to acidification pro-cesses. All forms of Nr participate in a variety of chemi-cal and physical transformations in the atmosphere. Asindicated in Table 3, they also can have a long seriesof beneficial and detrimental biological effects once theyare deposited in terrestrial and aquatic ecosystems.
Thus, the time has come to develop and implement aTotal Reactive Nitrogen Approach (Total Nr Approach)rather than continue to consider nitrogen-oxide pollu-tion and ammonia pollution in isolation from each otherand from other aspects of air quality management. Asdiscussed more fully by Grennfelt et al. (1994), a TotalNr Approach is especially important in the context ofcurrent discussions about multiple-pollutant/multiple-effects perspectives in air- and water-quality manage-ment and should become integral parts of Nr manage-ment in both crop and animal agriculture and in for-estry, fisheries, and watershed management. A TotalNr Approach is firmly grounded in the following biologi-cal principles (Linder, 1995; Gundersen, 1992; Vitouseket al., 1997):
1. All oxidized, reduced, and carbon-bound (organic)forms of Nr are biologically active. When trans-ferred into ecosystems in less than optimalamounts, they increase the productivity of the sys-tem (see the ascending part of the curve in Figure3 and the beneficial effects listed in Table 3).
2. When applied in more than optimal amounts, how-ever, all biologically active forms of N contribute tothe wide variety of Nr-induced pollution problemslisted in Table 3 (see the descending part of thecurve in Figure 3).
3. The biologically important oxidized forms of Nr in-clude NO, NO2, HNO3, NO−, HONO, N2O5, PAN(peroxyacetyl nitrate), and PPN (peroxypropionylnitrate). Biologically important reduced forms ofNr include gaseous ammonia, dissolved and aero-sol forms of ammonium ion, and a wide variety oforganic Nr compounds, including urea, uric acid,amines, and amino acids.
4. The total supply of Nr in terrestrial and aquaticecosystems is a complex function of the following:
a) The amounts of nonreactive N2 gas removed fromthe atmosphere by free-living N-fixing microor-ganisms in soils and by symbiotic N-fixing micro-organisms in the roots of some crop plants anda few species of forest trees.

Cowling and GallowayE164
b) The amounts of oxidized and reduced forms of Nrin the soil solution and in decomposing organicmatter in soil.
c) The total amounts of Nr transferred from theatmosphere into ecosystems by wet and dry de-position processes.
d) The amounts of Nr applied to land as syntheticfertilizers and animal wastes.
e) The runoff of Nr compounds from the land tosurface waters.
f) Microbial processes in soils that transform oxi-dized, reduced, and organic forms of Nr and re-lease them back into the atmosphere as NO,NO2, NO3
−, HNO3, N2O, and N2.5. Although there are transitory differences in rates
of uptake and assimilation of oxidized, reduced,and organic forms of Nr by different organisms,both oxidized and reduced forms of Nr ultimatelyhave substantially similar influences on the gen-eral productivity of the terrestrial, aquatic, andlivestock-dominated ecosystems in which they areassimilated. This is true because at least one oranother (and sometimes many) of the variousplants, animals, microbes, and insects in terres-trial or aquatic ecosystems take up all oxidized,reduced, and organic forms of Nr.
After initial uptake and assimilation, these variousforms of Nr are readily transformed and exchangedwith other organisms and compartments within a givenlandscape or watershed so that all Nr molecules havea series of cascading biological effects within the natu-ral or managed ecosystems in which they are incorpo-rated (Galloway, 1998; Vitousek et al., 1997).
These linkages and biological principles providestrong justification for adoption and implementation ofa Total Nr Approach in air quality management. Asdiscussed below, they also set the stage for developmentof a Concept of Optimum Nitrogen Management forSociety.
Development of a Concept of Optimum NrManagement for Society
In his most famous book, Future Shock, Toffler (1970)identified three types of futures that he believed innova-tive democratic societies should consider very carefully.Probable futures—hopes and aspirations of society thatare largely an extension of a business-as-usual senseof what the future might hold. Possible futures—explo-ration of all possible outcomes that a given societymight wish to consider as possibilities for its future.Preferable futures—optimum outcomes that probablycan be achieved only as a result of focused and well-disciplined efforts to fulfill mutually agreed upon goalsand dreams that are consonant with the natural andhuman resources available to society.
In evaluating alternatives about the management ofair and water quality in the context of other important
societal goals, enlightened societies will want to con-sider Toffler’s suggestions and thus go beyond “busi-ness-as-usual” perspectives, to look earnestly at a widerange of “possibilities,” and to work hard to define andimplement “preferable” options that are both prudentand realistic for the long-term as well as for the short-term futures of society. In thinking further about howso-called preferable futures might be identified in thecase of Nr, we found valuable theoretical guidance inthe Theory of Optimum Nutrition developed by In-gestad (1987). We also found valuable practical guid-ance in the Gundersen (1992) concept of Optimum Eco-system Productivity.
Ingestad (1987) first theorized, and later establishedexperimentally, that maximum growth and productionof both agricultural crops and forest trees can be ob-tained by optimizing, in all stages of growth and devel-opment, the availability of each of the 16 nutrient ele-ments that are required for the growth of plants (andby inference, the 27 elements that are essential foranimals). Since Nr is the essential nutrient that mostoften limits growth of crops and forests, Ingestad rea-soned and expressed his experimental findings as ratiosbetween the amounts of each of the other essential nu-trients and the amount of Nr available to the organismof interest. Thus, Ingestad confirmed the central rolethat Nr plays in determining the health and productiv-ity of plants. He also established procedures for de-termining optimum amounts of Nr and other nutrientsto ensure maximum growth. Similar principles alsoapply to the growth and development of livestock andfish.
Gundersen (1992) extended these ideas to show thatNr plays a central role in determining the productivityand stability of whole ecosystems. A very slightly modi-fied version of the Gundersen (1992) original graph isshown in Figure 3. This figure shows that growth withina whole ecosystem receiving no significant input of Nrfrom the atmosphere or other external sources has arelatively constant "index of productivity," that an eco-system receiving moderate amounts of added Nr re-sponds by increasing the productivity of the whole sys-tem, that there is a maximum (optimal) productivityfor any given living system; and that additions of morethan optimal amounts of Nr eventually cause destabili-zation, decrease in vitality, and eventual decline in theproductivity of the whole ecosystem.
The Gundersen (1992) concept of Optimum Produc-tivity applies to many different types of land use (andsurely also to livestock-feeding operations). Thus, eachtype of land use follows its own unique (but similarlyshaped) productivity/Nr-input curve—with productiv-ity first increasing, then going through a maximum,and eventually decreasing with increasing inputs oftotal Nr. This idea is illustrated in Figure 4, whereecosystem-productivity/Nr-input relationships areshown for five general types of land use in the Neth-erlands.

Optimizing N management in animal agriculture E165
Figure 4. Hypothetical growth curves for five typesof terrestrial ecosystems: natural moorland pools, forestbiodiversity, timber production, and production of cornand grass crops. This figure is adapted from the conceptof Optimum Ecosystem Productivity advanced by Gund-ersen (1992) (see Figure 3).
Please note that each particular type of land useshowed its own relationship between the productivityof the system and the total Nr input to that systemfrom all sources. As discussed earlier, these sourcesinclude wet and dry deposition from the atmosphere(in all cases), applications of Nr in synthetic fertilizers(where applied), and application of animal manures andother Nr-containing waste materials (where applied).It is possible to further extend this idea of a curvilinearrelationship between the productivity of various usesof land and inputs of Nr and to adapt and apply the ideain making nutrient management recommendations forvarious crops, species of livestock, and thus for thewhole of society.
In essence, a curvilinear relationship of the generalform shown in Figures 3 and 4 can be defined betweenwhat might be called an Index of Societal Sustainabilityand the total amount of Nr transferred from the atmo-sphere and other external sources into different geo-graphical areas within a given society. This proposedIndex of Societal Sustainability would be analogous fora whole community or society with the Gundersen(1992) Index of Productivity for a whole ecosystem.
The construction of such a sustainability index willrequire the development of a series of land-use-specificand food-animal-specific productivity/Nr-input curvesfor each type of natural resource use that is common-place within society. From the Nr-input values for maxi-mum productivity for each natural resource system, itshould be possible to determine an approximate total–Nr-input ceiling for maximum productivity of each typeand locality of resource use. These values then can beused as inputs to gridded atmospheric-source/resource-use receptor models to establish area-specific and ani-mal agriculture–specific input ceilings for each majorsource of Nr. With this information as background, itthen should be possible for each community, state, or
country to determine (negotiate) an optimum total Nrloading for the various sectors within society and thento consider alternative measures by which to adjustnutrient input rates accordingly. Thus, each particulargeographical and economic sector within a given com-munity, state, or country could adjust its own importsand exports of Nr and thus do its part toward achievinga preferable total nutrient management system withina more sustainable and equitable society.
In an attempt to illustrate how this proposed conceptcould be used, the following suggestions are advanced.First, quantitatively defensible productivity/Nr-inputcurves should be developed for each type of naturalresource use on the basis of both experimental data andobservations of real-world production systems. Withineach locality or grid square within a given community,a selection should be made of the types of land use thatshould be considered most limiting or most significanteconomically, socially, aesthetically, and so on. Thesechoices should be made very carefully because the landuse– and area-specific Nr input ceilings and correspond-ing emissions ceilings will be determined using recep-tor modeling.
After the emissions ceilings have been determined,comparisons must be made between actual emissionsand the calculated emissions ceilings for each localityor grid square. If actual emissions are lower than thecalculated optimum, then some increase in Nr emis-sions could be considered, so long as the allowed in-crease in emissions does not lead to exceedances of theoptimum Nr loads in other grid squares. This means, inagricultural areas, for example, that additional animalmanure or synthetic Nr fertilizers could be applied toincrease crop production. If actual emissions exceedthe calculated optimum, however, then decreases inemissions should be undertaken. The total Nr emis-sions ceiling can be achieved by decreasing the amountsof reduced Nr compounds emitted or by decreasingamounts of oxidized Nr compounds, or both.
If it appears that the Nr emissions ceilings are solow that it will not be economically feasible to meetthem, the target position on the optimum curve shouldat least be shifted in the direction of optimum Nr load-ing. If the optimum loading is exceeded, then hardchoices will need to be made between economical inter-ests and ecological interests. In this way, the Conceptof Optimum Nitrogen Management for Society providesa tool for visualizing the consequences of economicallydetermined and ecologically determined futures. Theadvantage of this concept is that the measures neededto achieve optimum Nr deposition can be chosen as atrade-off between policies and procedures designed todecrease or increase inputs of Nr, depending on whatis economically feasible, socially acceptable, and envi-ronmentally sound in the short and the long run.
This Concept of Optimum Nitrogen Management forSociety has been applied in a pilot case study of ammo-nia emissions in the province of Friesland (Erisman andvan Egmond, 1997) using ammonia-emissions ceilings

Cowling and GallowayE166
and maximum Nr-application rates for several munici-palities in the Netherlands (Erisman et al., 1996). Por-tions of the concept, especially those dealing with spa-tial planning as a tool for decreasing Nr loads in natureareas, are also discussed by Bleeker and Erisman (1998)and most recently by Erisman et al. (2001).
Further development and especially implementationof the Concept of Optimum Nr Management for Societywill require substantially increased knowledge of thegrowth, development, sustainability, and possibilitiesor realities of detrimental effects on various ecosystemsand other values related to air quality and water-qual-ity (Erisman et al., 2001). Adoption and implementationalso will require substantially increased understandingand a more widely shared sense of ecological bioethicswithin farming, forestry, industrial, regulatory, and po-litical communities. Various aspects and implicationsof some of these ideas are further discussed by Leopold(1968), Brundtland (1987), Potter (1988), and Cowlingand Nilsson (1995).
Science and Policy Implications
Contemporary changes in animal agriculture are in-creasing the circulation of reactive nitrogen (Nr) in theenvironment, which creates some positive benefits foragriculture and forestry, while also causing negativeimpacts on air and water quality, human health, andecosystems. In most ecosystems, the result of increasedloads of Nr will be substantially the same whether Nremissions occur as oxidized, reduced, or organic forms.Instead of dealing with different forms of Nr separately,the Total Reactive Nitrogen Approach is justified. TheConcept of Optimum Nr Management for Society is alsoproposed. Implementation will require determinationof deposition and emission ceilings for each type of landuse. Alternatives by which to adjust Nr loadings thencan be considered. This will facilitate decisions by whichvarious sectors of society can adjust their emissionsof total Nr, and so do their part toward achieving apreferable total Nr emissions load within a more sus-tainable society.
Literature Cited
Aneja, V. P., J. P. Chauhan, and J. T. Walker. 2000. Characterizationof atmospheric ammonia emission from swine waste storage andtreatment lagoons. J. Geophys. Res. Atmos. 105:11535–11545.
Aneja, V. P., P. A. Roelle, G. C. Murray, J. Southerland, J. W. Erisman,D. Fowler, W. A. H. Asman, and N. Patni. 2001. Atmosphericnitrogen compounds II: Emissions, transport, transformation,deposition and assessment. Atmos. Env. 35:1903–1911.
Bleeker, A., and J. W. Erisman. 1998. Spatial planning as a tool forreducing nitrogen loads in nature areas. Environ. Poll.102(S1):649–655.
Brundtland, G. H. 1987. Our Common Future. Report of the WorldCommission on Environment and Sustainable Development. Ox-ford University Press, Cambridge, England.
Cowling, E. B., D. Botts, K. Cochran, J. Rudek, and S. Levitas. 2002.Concept Paper: A Strategy to Facilitate the Transition of theNorth Carolina Swine Industry to an Economically and Environ-
mentally Sustainable System of Pork Production and WasteManagement Through Nutrient Reutilization. North CarolinaState University, Raleigh.
Cowling, E. B., J. N. Galloway, C. S. Furiness, M. Barber, T. Bresser,K. Cassman, J. W. Erisman, R. Haeuber, R. Howarth, J. Melillo,W. Moomaw, A. Mosier, K. Sanders, S. Seitzinger, S. Smeulders,R. Socolow, D. Walters, F. West, and Z. Zhu. 2001. OptimizingNitrogen Management in Food and Energy Production and Envi-ronmental Protection: Summary Statement 2nd Int. NitrogenConf. Ecological Soc. Am., Washington, DC.
Cowling, E. B., and J. Nilsson. 1995. Acidification research: Lessonsfrom history and visions of environmental futures. Water AirSoil Poll. 85:279–292.
Erisman, J. W., A. Bleeker, P. S. C. Heuberger, A. H. Bakema, G. B.Makaske, and A. F. Bouwman. 1996. Ammonia emissions ceil-ings and maximum nitrogen application rates estimated for eachmunicipality in the Netherlands. RIVM report no. 722108019.RIVM, Bilthoven, The Netherlands.
Erisman, J. W., W. de Vries, H. Kros, O. Oenema, L. van der Eerden,H. van Zeijts, and S. Smeulders. An outlook for a national inte-grated nitrogen policy. 2001. Environ. Sci. Policy 4:87–95.
Erisman, J. W., and G. J. Monteny. 1998. Consequences of new scien-tific findings for future abatement of ammonia emissions. Envi-ron. Poll. 102(S1):275–282.
Erisman, J. W., and N. D. van Egmond. 1997. Changing the depositionapproach into an emission approach for ammonia abatement.Millieu 12:25–35.
Galloway, J. 1998. The global nitrogen cycle: Changes and conse-quences. Environ. Poll. 102(S1):15–24.
Galloway, J. N., J. D. Aber, J. W. Erisman, S. P. Seitzinger, R. H.Howarth, E. B. Cowling, and E. B. Cosby. 2003. The nitrogencascade. Bioscience (In press).
Galloway, J. N., and E. B. Cowling. 2002. Reactive nitrogen and theworld: 200 years of change. Ambio 31:64–71.
Galloway, J. N., E. B. Cowling, S. P Seitzinger, and R. H. Socolow.2002. Reactive nitrogen: Too much of a good thing? Ambio31:60–63.
Grennfelt, P., Ø. Hov, and R. G. Derwent. 1994. Second generationabatement strategies for NOx, NH3, SO2, and VOC. Ambio23:425–433.
Gundersen, P. 1992. Mass balance approaches for establishing criticalloads for nitrogen in terrestrial ecosystems. p. 56–81. In: NordicCouncil of Ministers Rep. Copenhagen, Denmark.
Ingestad, T. 1987. New concepts in soil fertility and plant nutritionas illustrated by research on forest trees and stands. Geoderma40:237–252.
Kaspers, B, P. Burnette, J. Koger, M. van Kempen, and T. van Kem-pen. 2000. Separating urine and feces may be key to flexibility.Feedstuffs 74:11–13.
Leopold, A. 1968. A Sand County Almanac. Oxford UniversityPress, U.K.
Linder, S. 1995. Foliar analysis for detecting and correcting nutrientimbalances in Norway spruce. Ecol. Bull. 44:178–190.
Potter, V. R. 1988. Global Bioethics: Building on the Leopold Legacy.Michigan State University Press, East Lansing.
Sheffield, J. 2000. Evaluation of Comprehensive Approaches Neededto Improve the Handling of Farm Animal Manure and Benefitthe Environment and the Farming Industry. Joint Inst. EnergyEnviron., Univ. Tennessee, Knoxville.
Toffler, A. 1970. Future Shock. Random House, New York.USEPA. 1997. Nitrogen Oxides: Impacts on Public Health and Envi-
ronment. Report EPA 452R-97-002. U.S. Environmental Protec-tion Agency, Office of Air and Radiation, Washington, DC.
Vitousek, P. M., J. Aber, R. W. Howarth, G. E. Likens, P. A. Matson,D. W. Schindler, W. H. Schlesinger, and G. D Tilman. 1997.Human alteration of the global nitrogen cycle: Causes and conse-quences. Issues Ecol. 1:1–17.
Additional References of Value for ContinuingEducation about Nr Use in Animal AgricultureASAE. 1996. International Conference on Air Pollution from Agricul-
tural Operations. Proceedings of a Conference. Midwest PlanService, Ames, Iowa.

Optimizing N management in animal agriculture E167
ASAE. 1999. Swine Housing: Proceedings of the First InternationalConference. American Society of Agricultural Engineers, St. Jo-seph, Michigan.
ASAE. 2000. Air Pollution from Agricultural Operations. Proceedingsof the Second International Conference. American Society ofAgricultural Engineers, St. Joseph, Michigan.
Asimov, I. 1962. The World of Nitrogen. Collier Books, New York.Brown, L. R. Who Will Feed China? Wake-up Call for a Small Planet.
W. W. Norton, New York.CAST. 1999. Animal Agriculture and Global Food Supply. Task Force
Report No. 135. Council for Agricultural Science and Technology,Ames, Iowa.
Gollehon, N., M. Caswell, M. Ribaudo, R. Kellogg. C. Lander, and D.Letson. 2001. Confined animal production and manure nutri-ents. Agricultural Information Bulletin Number 771, Agricul-tural Research Service, US Department of Agriculture, Washing-ton DC.
Cowling, E. B., J. W. Erisman, S. M. Smeulders, S. C. Holman, andB. M. Nicholson. 1998. Optimizing air quality management inEurope and North America: Justification for integrated manage-ment of both oxidized and reduced forms of nitrogen. Environ.Poll. 102(S1):599–608.
Cowling, E. B., J. N. Galloway, C. S. Furiness, and J. W. Erisman.2002. Optimizing Nitrogen Management in Food and EnergyProduction and Environmental Protection: Report from the Sec-ond International Nitrogen Conference. Ecological Society ofAmerica, Washington DC.
Donham, K. 1999. A historical overview of research on the hazardsof dust in livestock buildings. International Symposium on DustControl in Animal Production Facilities, Aarhus, Denmark.
Ecological Society of America. 2001. Program and Abstracts–N001–The Second International Nitrogen Conference–Optimizing Ni-trogen Management in Food and Energy Production and Envi-ronmental Protection. Bolger Conference Center, Potomac,Maryland October 14-18, 2001. Ecological Society of America,Washington, DC.
Erisman, J. W., T. Brydges, K. Bull, E. Cowling, P Grennfelt, L.Norberg, K. Satake, T. Schneider, S. Smeulders, K. van derHoek, J. R. Wisniewski, and J. Wisniewski. 1998. SummaryStatement. Nitrogen, the Confer-N-s. The First InternationalNitrogen Conference. Environ. Poll. 102(S1):1–12.
Galloway, J. N., E. B. Cowling, J. W. Erisman, J. Wisniewski, andC. Jordan (eds). 2001. Optimizing Nitrogen Management in Foodand Energy Production and Environmental Protection: Contrib-uted Papers from the Second International Nitrogen Conference(Electronic Version). TheScientificWorldJOURNAL 2001 Vol.1(S2). pp 1–996. http://www.thescientificworld.com
Galloway, J. N., E. B. Cowling, J. W. Erisman, J. Wisniewski, andC. Jordan (eds). 2002a. Optimizing Nitrogen Management inFood and Energy Production and Environmental Protection.:Contributed Papers from the Second International NitrogenConference, Potomac, MD, 14–18 October 2001 (Printed Ver-sion). A.A. Balkema Publishers, Lisse/Abingdon/Exton, PA/Tokyo.
Galloway, J. N., E. B. Cowling, S. P. Seitzinger, and R. Socolow (eds).2002b. Optimizing Nitrogen Management in Food and EnergyProduction, and Environmental Change. Special Issue. Ambio31:59–199.
Hawken, P. 1998. The Ecology of Commerce: A Declaration of Sus-tainability. Harper Collins Publishers, New York.
Howarth, R., D. Anderson, J. Cloem, C. Elfring, C. Hopkinson, B.Lapointe, T. Malone, N. Marcus, K. McGlathery, A. Sharpley,and D. Walter. Nutrient Pollution of Coastal Rivers, Bays, andSeas. Issues in Ecology 7:1–15.
IFPRI. 1999. Livestock to 2020: The Next Food Revolution. Food,Agriculture and the Environment Discussion Paper 28. Interna-tional Food Policy Research Institute, Washington, DC.
Kellogg, R. L., C. H. Lander, D. C. Moffit, and N. Gollehon. 2000.Manure Nutrients Relative to the Capacity of Cropland andPastureland to Assimilate Nutrients: Spatial and TemporalTrends for the United States. US Department of Agriculture,Washington DC. See also http://www.nhq.nrcs.usda.gov/land/pubs/manntr.html.
Miner, J. R. 1995. A review of the literature on the nature and controlof odors from pork production facilities. National Pork ProducersCouncil, Des Moines, Iowa.
National Oceanic and Atmospheric Administration. 2000. Atmo-spheric Ammonia: Sources and Fate: A Review of Ongoing Fed-eral Research and Future Needs. Air Quality Research Subcom-mittee Meeting Report. Aeronomy Laboratory, National Oceanicand Atmospheric Administration, Boulder, CO.
Schiffman, S. S. 1997. Health impacts of large livestock farms onneighbors. Proceedings of the 1997 Livestock Waste Manage-ment Conference, Champaign-Urbana, Illinois.
Schlesinger, W. H. 1997. Biogeochemistry: An Analysis of GlobalChange. Academic Press, San Diego. (See especially Chapter 12).
Shusterman, D. 1992. Critical Review: The health significance ofenvironmental odor pollution. Archives of Environ. Health47:76–87.
USDA-NRCS. Comprehensive Nutrient Management Planning Tech-nical Guidance. Part 600.5. Natural Resources ConservationService, US Department of Agriculture, Washington DC.
Van der Hoek, K, J. W. Erisman, S. Smeulders, J. R. Wisniewski, andJ. Wisniewski (eds.). 1998. Proceedings of the First InternationalNitrogen Conference. Noordwijkerhout, The Netherlands,March 1998. Environ. Poll. 102(S1):1–799.
Vukina, T. 2002. The relationship between contracting and livestockwaste pollution. White Paper produced for the National Centerfor Manure and Animal Waste Management, Department ofAgricultural and Resource Economics, North Carolina State Uni-versity, Raleigh, NC.
White, D. 1998. Emissions of Aerial Pollutants in Livestock Buildingsin Northern Europe. Special Issue, J. Agric. Eng. Res.70(1):1–129.
Websites relating to nitrogen emissions,deposition, and management
Second International Nitrogen Conference, October 14-18, 2001.Bolger Center near Washington DC. Available: http://n2001.es-a.org/. Accessed June 2002.
National Atmospheric Deposition Program, Precipitation ChemistryData for the USA, Illinois State Water Survey, University ofIllinois, Champaign-Urbana. Available: http://nadp.sws.un-ic.edu/. Accessed July 2002.

Ultrasound applications in beef cattle carcass research and management
A. R. Williams
Department of Animal and Dairy Science, Mississippi State University, Mississippi State 39762
ABSTRACT: Application of ultrasound as a researchtool to study bovine carcass characteristics, includinggrowth and development physiology, represents a tech-nological breakthrough that has revolutionized our ba-sic understanding of biology in cattle. However, practi-cal applications of ultrasound to the beef industry holdtremendous potential to enhance overall managementand improve beef production systems. Estimation ofcarcass characteristics in live animals, including back-fat thickness, longissimus muscle area, percent intra-
Key Words: Cattle, Carcass Grading, Management, Ultrasound
2002 American Society of Animal Science. All rights reserved. J. Anim. Sci. 80(E. Suppl. 2):E183–E188
Introduction
The beef industry has experienced dramatic changesin the past decade. The advent of value-based market-ing and increased emphasis on carcass quality and ten-derness have brought about a paradigm shift in geneticselection of beef cattle. Collection of carcass data for usein genetic selection has historically been accomplishedthrough progeny testing. This is a slow, tedious, andexpensive process. It typically takes a minimum of 3 to5 yr and $5,000 to “prove” a sire’s genetics throughprogeny testing.
Reliable information and accurate standardized mea-surements are required to evaluate carcass composi-tion, body condition score, and growth of beef cattle.Ultrasound provides a noninvasive method for estimat-ing fat and muscle accretion and body composition onlive cattle. It is a fast, reliable technology with a highdegree of repeatability, and provides a nondestructivemeasure of carcass components in the live animal(Faulkner et al., 1990). By using ultrasound technologyto collect carcass data on live animals, progeny testingcan be completed in less than 2 yr at a cost of approxi-mately $450 per sire.
Current research indicates that correlations betweencarcass and ultrasound traits are positive and moderate
1Correspondence: P.O. Box 9815 (phone: 662-325-7466; fax: 662-325-8873; E-mail: [email protected]).
Received October 8, 2001.Accepted August 21, 2002.
E183
muscular fat, rump fat, and gluteus medius depth,allow for sorting and selecting cattle for carcass merit.These practical applications of ultrasound hold greatpotential to return substantial net income on a peranimal basis in the beef industry. Development of inte-grated management systems that combine ultrasoundwith new and existing technologies, such as linear mea-surement, video imaging, and thermal imaging, mayfurther enhance practical applications.
to high in magnitude. Moser et al. (1997) concluded thatyearling ultrasound measurements of breeding cattlecould be useful in predicting breeding values for carcasstraits. Ultrasound measurements can also be very accu-rate predictors of carcass yield, and reasonable pre-dictors of carcass quality (Perkins et al., 1997). Otherstudies found that ultrasonic measurements of carcasstraits can be used to sort steers prior to the finishingphase and to predict optimal slaughter endpoints (Wil-liams and Trenkle, 1997; Brethour, 2000; Field et al.,2000).
Estimation of carcass characteristics in live animalspotentially allows for sorting and selecting cattle forcarcass merit. Collectively, current and future applica-tions of ultrasound hold tremendous potential to en-hance management for improved carcass production ef-ficiency in beef cattle. As ultrasound equipment be-comes increasingly portable and less costly, it is only amatter of time until widespread implementation of thistechnology occurs in the beef industry.
Veterinary Ultrasound Equipment
Most ultrasound machines consist of a console unitthat contains the electronics, controls, and a screenupon which the ultrasound image is visualized by theoperator, and a transducer, which emits and receiveshigh-frequency ultrasound waves. Linear-array trans-ducers consist of a series of piezo electric crystals ar-ranged in a row. These crystals emit high-frequencysound waves upon being energized. Linear-array trans-ducers of 3.5-, 5.0-, and 7.5-MHz frequency ranges are

WilliamsE184
most commonly used in cattle to perform ultrasound,and most veterinary ultrasound scanners are compati-ble with probes of different frequencies. Depth of tissuepenetration of sound waves and image resolution isdependent upon and inversely related to the frequencyof the transducer. Thus, a 3.5-MHz transducer resultsin greater tissue penetration and less image detail,whereas a 7.5-MHz transducer results in less tissuepenetration and greater image detail. Body compositionscanning typically requires the use of a 3.5-MHz trans-ducer, such as that used in the collection of live-animalcarcass ultrasound measures. In collecting images ofthis type, depth of tissue penetration is a key factor inobtaining interpretable images.
Ultrasound Estimation of Carcass Traits in Live Cattle
There are currently four primary carcass traits thatare measured in the live animal via ultrasound technol-ogy. These traits include backfat thickness, longissimusmuscle area, percentage intramuscular fat, and rumpfat.
Backfat Thickness. Ultrasound measurements havebeen shown to represent thickness of subcutaneous fatin studies with slaughtered beef cattle (Faulkner et al.,1990; Otto et al., 1991). backfat represents the subcuta-neous fat thickness between the 12th and 13th rib overthe longissimus muscle. This is the most common mea-sure of subcutaneous fat on a carcass and is directlyrelated to carcass yield grade. Ultrasound measure-ment of backfat is a single-plane, linear measure. Be-cause of this, it is the most accurate of the carcassultrasound measurements. Correlation estimates be-tween ultrasound and actual carcass backfat have beenfound to range from 0.76 to 0.93 (Perkins et al., 1992a,b;Perkins et al., 1997). Ultrasonic backfat determinationsare fairly accurate, but may underestimate actual back-fat in fatter cattle and overestimate backfat in leanercattle (Brethour, 1992; Perkins et al., 1997; Charaguet al., 2000). However, ultrasound estimates of backfathave been within 2.54 mm of actual backfat in 70 (Per-kins et al., 1992a), 72 (Perkins et al., 1992b), 62 (Wal-dner et al., 1992), and 56% (Hassen et al., 1995) of allanimals scanned. Brethour (1992) found repeatabilitybetween consecutive ultrasound backfat measurementsto be 0.975, with an average difference between ultra-sound and carcass backfat of 1.19 mm. Genetic correla-tions between actual backfat and ultrasound backfathave been estimated at 0.57, with a heritability esti-mate for ultrasound backfat of 0.38 (Moser et al., 1997).Furthermore, ultrasonic measurement of subcutaneousfat is highly correlated with subjective body conditionscores in Holstein cattle (Domecq et al., 1995). The useof ultrasound to standardize and objectively measurebody condition scores in lactating dairy cows and inbeef cattle may improve nutritional and reproductivemanagement in dairy production systems.
Longissimus Muscle Area. Longissimus muscle arearepresents a cross-sectional area of the longissimus
muscle at a point between the 12th and 13th rib. It isthe most common estimator of total carcass muscle andis used in yield grade calculation. Ultrasonic longissi-mus muscle area determination is two-dimensional innature (length, depth). Therefore, it is more difficult toget as accurate an estimate for longissimus muscle areathan it is for backfat. Correlation estimates betweenultrasonic longissimus muscle area and actual longissi-mus muscle area are more variable and range from 0.43(Smith et al., 1992) to 0.85 (Waldner et al., 1992) to ahigh of 0.95 (Perkins et al., 1997). The average absolutedifference between ultrasound estimates and actualcarcass measures have been found to be 7.15 cm2 or less(Perkins et al., 1992b). Genetic correlations betweenultrasonic longissimus muscle area and actual longissi-mus muscle area and heritability for ultrasound longis-simus muscle area have been estimated at 0.59 and0.28, respectively (Moser et al., 1997).
Several other studies have shown similar correla-tions between ultrasound and carcass measurementsfor backfat (r = 0.81 to 0.86) and longissimus musclearea (r = 0.61 to 0.76) (Henderson-Perry et al., 1989;Stouffer et al., 1989; May et al., 2000; Realini et al.,2001).
Intramuscular Fat. Percentage of intramuscular fat ismeasured in the longitudinal image of the longissimusmuscle directly over the 11th, 12th, and 13th rib. Per-centage of intramuscular fat provides an estimate ofthe degree of marbling or intramuscular fat depositedin the longissimus dorsi muscle. The USDA marblingcategories range from devoid to abundant. Devoid rep-resents lean muscle tissue with less than 2% intramus-cular fat, whereas abundant represents a fat percent-age of greater than 10%. Recently, computer softwarehas been developed to aid in the ultrasonic determina-tion of marbling or percentage of intramuscular fat(Brethour, 1994;2000; Herring et al., 1998). Estimationof intramuscular fat percentage is accomplished withspecialized software, which analyzes longitudinal im-ages of the longissimus muscle. Marbling is determinedby two phenomena: “backscatter” and “attenuation.”Backscatter results from the impinging of sound waveson tissue with small or irregular surfaces, such as mar-bling. Attenuation results from the weakening of thesound wave as it passes through tissue (Brethour,1991). Brethour (1990) found that ultrasound speckle,the random graininess or mottling in ultrasound im-ages resulting from impinging of sound waves on rough,irregular tissue surfaces, was an accurate way to esti-mate carcass marbling score and grade. Correlationsbetween ultrasound intramuscular fat and actual mar-bling scores have ranged from 0.35 to 0.87 (Wilson,1992; Izquierdo et al., 1994; Hassen et al., 1995; Perkinset al., 1997). Perkins et al. (1997) found correlationsbetween ultrasound intramuscular fat and actual car-cass quality grade to be 0.69. Brethour (2000) indicatedcorrelations between serial ultrasound marbling scoresto be as high as 0.85. Duckett and Klein (1997) foundthat carcass quality grade was accurately predicted

Ultrasound applicatons E185
from ultrasound intramuscular fat content for 75% ofsteers used in their project. In a study conducted withstocker steers, steers were scanned at the end of astocker grazing period prior to shipment to the feed-yard. Correlations between actual carcass quality gradeand prefeeding period ultrasound intramuscular fatwere estimated at 0.49 (Field et al., 2000).
Rump Fat and Gluteus Medius Depot. Rump fat andgluteus medius depth measurements are taken overthe rump between the hooks and the pins. Rump fat isnegatively correlated to percent retail product and isan additional indicator of total carcass fat. Therefore,the greater the rump fat, the lower the percent retailproduct. Rump fat measures may be most useful forpredicting percent retail product in leaner cattle, whichhave less 12th-rib fat. Realini et al. (2001) found ultra-sound to be an effective method of measuring 12th-rib backfat and longissimus muscle area. Their studyindicated that these measurements could be combinedwith other live measurements, particularly rump fatand gluteus medius depth, to estimate retail yield.Johns et al. (1993) suggested that prediction accuracyof retail product yield could be improved through themeasurement of gluteus medius depth utilizing thesame image as the rump fat. Tait et al. (2000) indicatedthat inclusion of gluteus medius depth ultrasound esti-mates in the rump fat image in multiple regressionequations could increase prediction accuracy for weightof retail product from the beef round. Other studieshave also indicated that live-animal ultrasound mea-surements, such as rump fat and gluteus medius depth,are reasonably accurate predictors of retail yield andpercentage lean of the beef carcass compared to actualcarcass measurements (Bullock et al., 1991; Herring etal., 1994b; Williams et al., 1997).
Technician Accuracy and Repeatability
Technician training and experience is critical inproper ultrasound image collection and image interpre-tation, if accurate measures of live animal 12th-ribbackfat and longissimus muscle area are to be obtained(Robinson et al., 1992; Herring et al., 1994a). Typically,ultrasound is more accurate at predicting backfat, aone-dimensional measurement, than at predicting lon-gissimus muscle area (Houghton and Turlington, 1992;Perkins et al., 1992a). Herring et al. (1994a) statedthat the two main sources of error in ultrasound datacollection are image acquisition and image interpreta-tion. Hassen et al. (1998) used data from two cattlefeeding trials to estimate accuracy and repeatability ofultrasound measurements of backfat and longissimusmuscle area. Two certified technicians collected andinterpreted images from steers just prior to slaughter.Repeatability of ultrasound backfat was similar for bothtechnicians (0.96 vs 0.97). However, one technician ex-hibited better repeatability at longissimus muscle areathan the other technician (0.92 vs 0.79). The authorsconcluded that the degree of experience did not show
a consistent difference in accuracy of the estimation ofultrasound backfat and longissimus muscle area, thustechnicians could be readily trained to make accuratepredictions of these traits.
System and Software Reliability
The ultrasound system used to capture and interpretimages can have a significant impact on the accuracyand reliability of ultrasound-based carcass measure-ment estimates. Herring et al. (1994a) evaluated theeffect of machine, technician, and interpreter on ultra-sonic measures of backfat and longissimus muscle area.Technicians measured steers using an Aloka 210DXwith a model 5034, 10.7-cm, 3.5-MHz transducer, andan Aloka 500V with a model 5044, 17.2-cm, 3.5 MHz-linear transducer (both distributed by CorometricsMedical Systems, Wallingford, CT), and interpreted im-ages captured by both. The results show an interactionbetween machine and technician for both traits mea-sured. Accurate longissimus muscle area estimationwith ultrasound was found to be more difficult withmachines requiring split-screen imaging comparedwith machines that allow for complete longissimusmuscle area imaging on a single screen. However, tech-nicians with a high degree of experience and skill canmeasure longissimus muscle area accurately with thesplit-screen machines, such as Aloka 210DX. Correla-tions between measurements ranged from 0.36 to 0.90for longissimus muscle area and 0.69 to 0.90 for backfat.In a comparison of four ultrasound systems, Herringet al. (1998) looked at the effectiveness of software sys-tems for the prediction of percentage intramuscular fat.The four systems included Animal Ultrasound Services,Inc. (Ithaca, NY); Cattle Performance Enhancement Co.(CPEC) (Kansas State University [KSU] technology)(Oakley, KS); Critical Vision, Inc., Atlanta, GA (CVIS);and Classic Ultrasound Equipment, Tequesta, FL.Their study showed the CPEC and CVIS systems to bethe most precise at estimating percentage intramuscu-lar fat in finished steers. Charagu et al. (2000) evalu-ated the Aloka SSD-1100 and Tokyo Keiki CS 3000ultrasound machines for accuracy of backfat and longis-simus muscle area prediction in steers, heifers, andbulls. Their study revealed sex differences between themachines for both backfat and longissimus muscle area.Regardless of sex of animal, both machines had similaraccuracy in cattle with larger longissimus muscle area,but significantly differed in lighter muscled cattle. Has-sen et al. (2001) evaluated the accuracy of two ma-chines, the Aloka 500V and the Classic Scanner 200,at predicting intramuscular fat in beef steers prior toslaughter. They concluded that both machines could beused to accurately predict intramuscular fat in livecattle.
Practical Applications
Using ultrasound technology to sort and select cattlefor carcass merit has the potential to return substantial

WilliamsE186
net income on a per animal basis. Ultrasound technol-ogy is used in two basic categories: 1) sorting and select-ing seedstock, and 2) sorting feedlot cattle at reimplantfor optimal carcass quality and yield grade endpoints.
Live-animal carcass ultrasound is being employedextensively in the seedstock industry to select purebredreplacement cattle with genetics for superior carcassmerit. These cattle are usually scanned and data col-lected at 1 yr of age (320 to 440 d). It is importantthat the data be collected on contemporary groups andcomparisons made only within similar managementsystems. The ability to select replacement seedstock forcarcass trait characteristics at 1 yr of age, rather thanwaiting to obtain actual progeny carcass data, can sig-nificantly impact the rate of genetic progress. In fact,several breed associations are actively developing car-cass EPD based on live-animal carcass ultrasound mea-surements, allowing producers to use these ultrasound-generated EPD to make important selection decisions.
Live-animal carcass ultrasound offers advantages tothe feeding industry in terms of sorting feeder cattle atreimplant for optimal endpoint results. Prior researchindicates substantial gains may be made from sortingfeeder cattle prior to marketing. A decision supportsystem within an ultrasound cattle-sorting system(KSU/CPEC) was developed and used to sort feedercattle at reimplant for prediction of optimal endpoints(Brethour, 1989; 1994; 1995). The KSU/CPEC systemuses carcass development models to make sorting deci-sions by projecting additional days on feed to obtainmaximal profitability. It is a stochastic model that esti-mates the future likelihood for an animal’s carcass tobe placed in the cells of a typical three-dimensional(quality grade, yield grade, carcass weight) price grid.These probabilities are multiplied by correspondingpremiums and discounts to determine an estimate offuture carcass value. In the KSU/CPEC system, mar-ginal feed cost is determined through feed performanceassumptions. Using these assumptions, sorting offersreturns of $11 to $25 per animal, depending on thenumber of groups into which cattle are sorted. Thegreater the number of sorts, the better the return, upto five sorts (Koontz et al., 2000). With industry averagereturns to cattle feeding ranging from $10 to $15 peranimal, sorting can offer excellent economic benefits.Basarab et al. (1997) evaluated the use of video imagingand ultrasound in feeder steers to improve carcass uni-formity. Ultrasound measures of backfat and longissi-mus muscle area were used along with animal weight,rump height, frame score, and muscle score (obtainedthrough video imaging techniques) in the Musculo-Skeletal Imaging sorting system. A separate sortingsystem (Oltjen sorting system) combined the use of ul-trasound with initial body weight, rump height, feedinginputs, and a computer model of cattle growth. Allsteers were fed and evaluated at three different Alberta,Canada feedlots. Results were variable between feed-lots, but indicated a potential to use sorting systemscombining ultrasound with other technologies to sort
steers for increased uniformity and enhanced profit-ability. In a separate study, Basarab et al. (1999) evalu-ated the KSU sorting system in two Alberta, Canada,feedlots. This system combines initial body weight, ul-trasound backfat and intramuscular fat, and computer-modeled economic data to project the number of dayson feed that maximize profitability. This was comparedwith the conventional system of sorting cattle for har-vest by weight and visual appraisal. The KSU-sortedsteers gained faster, had a reduced incidence of darkcutters, increased carcass quality grade, and a reduc-tion in over-fat carcasses. Overall profitability was in-creased by $15.22 per steer in one feedlot and by $27.67per steer in the other feedlot. Field et al. (2000) indi-cated the potential to sort steers at the end of thestocker grazing period prior to shipment to the feed-yard. A commercial system (ACCU-TRAC ElectronicCattle Management System, or ECM; Micro Beef Tech-nologies, Amarillo, TX) that combines the use of ultra-sound with video imaging and computer modeling tosort feeder cattle for optimal returns on a value-basedgrid pricing system is currently in place in severalfeedlots.
Future Applications
Presently in the beef industry, ultrasound technologyis not used to evaluate seedstock cattle for carcass merituntil 1 yr of age. The thinking behind this has beenthat cattle needed to achieve at least this level of physio-logical maturity before adequate evaluation could oc-cur. However, if seedstock cattle could be reasonablyevaluated at the time of weaning, substantial economicimpact could result. Brethour (2000) measured 144weaning-age (219 d) calves for determination of intra-muscular fat and correlated that measurement withactual carcass marbling at harvest. Analysis indicatedthat the initial intramuscular fat estimates were 78± 4% accurate in classifying future quality grade andpredicting whether an animal would grade USDAChoice. Since it typically requires an additional $150per animal to develop a calf from weaning to yearlingage, the ability to obtain accurate measurements atweaning could be economically beneficial. There arealso no current methods in place to determine potentialtenderness in the live animal. The National Cattle-men’s Beef Association National Beef Tenderness Sur-vey identified beef tenderness problems as one of themajor contributors to customer dissatisfaction (NCBA,1999). In addition, Huffman et al. (1996) found thatconsumer eating satisfaction is highly correlated to thedegree of tenderness as assessed by Warner-BratzlerShear force. The ability to determine potential tender-ness of a carcass via live-animal carcass ultrasoundcould tremendously enhance genetic selection and ulti-mate uniformity of beef. Recently, a novel automatedimage interpretation software, Beef Image Analysis,was introduced that may allow for sorting of calves atweaning, determine rankings for potential tenderness,

Ultrasound applicatons E187
and remove much of the current subjectivity in imageinterpretation (developed by Designer Genes, Harrison,AR). This new software uses conventional cross-sec-tional and longitudinal images of the longissimus dorsimuscle to make potential tenderness determinations inindividual animals. Preliminary data indicate signifi-cant positive correlations between ultrasound-deter-mined tenderness estimates and actual Warner-Brat-zler shear force estimates in steers sampled (unpub-lished data). The software must be validated foraccuracy and repeatability, and if proven reliable, couldlead to the production of a more uniform, consistentbeef product and enhance consumer satisfaction.
The future of live-animal carcass ultrasound relieson the continued verification of software and algorithmupdates. In addition, as machines are updated or newmachines introduced, future studies will be needed forunbiased comparisons among systems. Research willfocus on the utilization of carcass ultrasound to moreaccurately and economically select cattle that will meetor exceed beef industry and consumer expectations.New measurements will be developed that will allowfor quantification of tenderness, ribeye shape, indica-tions of stress, and more accurate estimation of percentretail product. Other potential uses include the applica-tion of ultrasound in determining designated implantstrategies in feeder cattle. Models could be developedusing ultrasound intramuscular fat estimates, expecteddays to harvest, cost of gain, implant impact on carcassquality grade, and impact on gain response due toimplant.
Implications
Ultrasound technology has advanced rapidly in thelast two decades and will become an increasingly im-portant tool in all segments of the beef industry. As aresearch and management tool, ultrasound will in-crease understanding of the growth and developmentcurves of the various beef breeds, including patterns offat deposition. It will also enhance the ability to accu-rately select seedstock for improved carcass merit andto properly sort cattle in the feedlot for improved feed-ing efficiency and targeted marketing. Future applica-tions of ultrasound could also aid in selection of replace-ment females requiring lower production inputs, andin the development and calculation of cow maintenanceexpected progeny differences.
Literature Cited
Basarab, J. A, J. R. Brethour, D. R. ZoBell, and B. Graham. 1999.Sorting feeder cattle with a system that integrates ultrasoundbackfat and marbling estimates with a model that maximizesfeedlot profitability in value-based marketing. Can. J. Anim. Sci.79:327–334.
Basarab, J. A., D. Milligan, J. J. McKinnon, and B. E. Thorlakson.1997. Potential use of video imaging and real-time ultrasoundon incoming feeder steers to improve carcass uniformity. Can.J. Anim. Sci. 77:385–392.
Brethour, J. R. 1989. Using ultrasound technology to increase cattlefeeding profits. Kansas Agric. Exp. Stn., Prog. Rep. No.570, Man-hattan.
Brethour, J. R. 1990. Relationship of ultrasound speckle to marblingscore in cattle. J. Anim. Sci. 68:2603–2613.
Brethour, J. R. 1991. Estimating quality grade in cattle with ultra-sound. Kansas Agric. Exp. Stn., Prog. Rep. No.627, Manhattan.
Brethour, J. R. 1992. The repeatability and accuracy of ultrasoundin measuring backfat of cattle. J. Anim. Sci. 70:1039–1044.
Brethour, J. R. 1994. Estimating marbling score in live cattle fromultrasound images using pattern recognition and neural networkprocedures. J. Anim. Sci. 72:1425–1432.
Brethour, J. R. 1995. Tracking marbling development in feedlotsteers. Kansas Agric. Exp. Stn., Prog. Rep. No.731, Manhattan.
Brethour, J. R. 2000. Using serial ultrasound measures to generatemodels of marbling and backfat thickness changes in feedlotcattle. J. Anim. Sci. 78:2055–2061.
Bullock, K. D., J. K. Bertrand, L. L. Benyshek, S. E. Williams, andD. G. Lust. 1991. Comparison of real-time ultrasound and otherlive measures to carcass measures as predictors of beef cowenergy stores. J. Anim. Sci. 69:3908–3916.
Charagu, P. K., D. H. Crews Jr., R. A. Kemp, and P. B. Mwansa.2000. Machine effects on accuracy of ultrasonic prediction ofbackfat and ribeye area in beef bulls, steers, and heifers. Can.J. Anim. Sci. 80:19–24.
Domecq, J. J., A. L. Skidmore, J. W. Lloyd, and J. B. Kaneene. 1995.Validation of body condition scores with ultrasound measure-ments of subcutaneous fat of dairy cows. J. Dairy Sci.78:2308–2313.
Duckett, S. K., and T .A. Klein. 1997. Monitoring lipid and muscledeposition in feedlot steers of different breeds using real-timeultrasound. J. Anim. Sci. 75(Suppl. 1):113 (Abstr.).
Faulkner, D. B., D. F. Parrett, F. K. McKeith, and L. L. Berger. 1990.Prediction of fat cover and carcass composition from live andcarcass measurements. J. Anim. Sci. 68:604–610.
Field, C. M., A. R. Williams, W. B. McKinley, L. R. Jefcoat, and R.G. Smith. 2000. Use of live animal carcass ultrasound in stockergrazing in Mississippi. J. Anim. Sci. 78 (Suppl. 1):43 (Abstr.).
Hassen, A., D. E. Wilson, V. R. Amin, G. H. Rouse, and C. L. Hays.2001. Predicting percentage of intramuscular fat using two typesof real-time ultrasound equipment. J. Anim. Sci. 79:11–18.
Hassen, A., D. E. Wilson, G. H. Rouse, A. Trenkle, D. Bleile, H. Zhang,R. L. Wilham, and C. Crawley. 1995. Accuracy evaluation ofreal- time ultrasound measurement for fat thickness and ribeyearea on feedlot cattle. Pages 10–14 in Beef Research Report.Iowa State Univ. Extension Pub. AS-630, Ames.
Hassen, A., D. E. Wilson, R. L. Williams, G. H. Rouse, and A. H.Trenkle. 1998. Evaluation of ultrasound measurements of fatthickness and longissimus muscle area in feedlot cattle: Assess-ment of accuracy and repeatability. Can. J. Anim. Sci.78:277–285.
Henderson-Perry, S. C., L. R. Corah, and R. C. Perry. 1989. The useof ultrasound in cattle to estimate subcutaneous fat thicknessand ribeye area. J. Anim. Sci. 67(Suppl. 1):433 (Abstr.).
Herring, W. O., L. A. Kriese, J. K. Bertrand, and J. Crouch. 1998.Comparison of four real-time ultrasound systems that predictintramuscular fat in beef cattle. J. Anim. Sci. 76:364–370.
Herring, W. O., D. C. Miller, J. K. Bertrand, and L. L. Benyshek.1994a. Evaluation of machine, technician, and interpreter effectson ultrasonic measures of backfat and longissimus muscle areain beef cattle. J. Anim. Sci. 72:2216–2226.
Herring, W. O., S. E. Williams, J. K. Bertrand, L. L. Benyshek, andD. C. Miller. 1994b. Comparison of live and carcass equationspredicting percentage of cutability, retail product weight, andtrimmable fat in beef cattle. J. Anim. Sci. 72:1107–1118.
Houghton, P. L., and L. M. Turlington. 1992. Application of ultra-sound for feeding and finishing animals: A review. J. Anim. Sci.70:930–941.
Huffman, K. L., M. F. Miller, L. C. Hoover, C. K. Wu, H. C. Brittin,and C. B. Ramsey. 1996. Effect of beef tenderness on consumer

WilliamsE188
satisfaction with steaks consumed in the home and restaurant.J. Anim. Sci. 74:91–97.
Izquierdo, M. M., H. Zhang, D. E. Wilson and G. H. Rouse. 1994.Development and validation of a model to predict percentage ofintramuscular fat in live animals by using ultrasound tech-niques. In: Beef Research Report. Pages 1–3 in Iowa State Univ.Extension Pub. AS-624, Ames.
Johns, J. V., P. O. Brackelsberg, and M. J. Marchello. 1993. Use ofreal-time ultrasound to determine carcass lean and fat in beefsteers from various live and carcass measurements. Iowa StateUniv. Beef and Sheep Res. Rep. A.S. Leaflet R1020, Ames.
Koontz, S. R., D. L. Hoag, J. L. Walker, and J. R. Brethour. 2000.Returns to market timing and sorting of fed cattle. NCR-134Conference on Applied Price Analysis, Forecasting, and MarketRisk Management, Chicago, IL.
May, S. G., W. L. Mies, J. W. Edwards, J. J. Harris, J. B. Morgan,R. P. Garrett, F. L. Williams, J. W. Wise, H. R. Cross, and J.W. Savell. 2000. Using live estimates and ultrasound measure-ments to predict beef carcass cutability. J. Anim. Sci.78:1255–1261.
Moser, D. W., J. K. Bertrand, I. Mitsztal, L. A. Kriese, and L. L.Benyshek. 1997. Genetic parameter estimates for carcass andyearling ultrasound measurements in Brangus cattle. J. Anim.Sci. 75(Suppl. 1):149 (Abstr.).
NCBA. 1999. National Beef Tenderness Survey. National Cattlemen’sBeef Association. Available at: http://www.beef.org/dsp/dsp_locationContent.cfm?locationld=885. Accessed August,2001.
Otto, K. L., J. D. Ferguson, D. G. Fox, and C. J. Sniffen. 1991. Relation-ship between body condition score and composition of the ninthto eleventh rib tissue in Holstein dairy cows. J. Dairy Sci. 74:852.
Perkins, T .L., R. D. Green, and K. E. Hamlin. 1992a. Evaluation ofultrasonic estimates of carcass fat thickness and longissimusmuscle area in beef cattle. J. Anim. Sci. 70:1002–1010.
Perkins, T. L., R. D. Green, K. E. Hamlin, H. H. Shepard, and M. F.Miller. 1992b. Ultrasonic prediction of carcass merit in beef cat-tle: Evaluation of technician effects on ultrasonic estimates of
carcass fat thickness and longissimus muscle area. J. Anim. Sci.70:2758–2765.
Perkins, T. L., J. C. Paschal, N. C. Tipton, and M. J. De La Zerda.1997. Ultrasonic prediction of quality grade and percent retailcuts in beef cattle. J. Anim. Sci. 75(Suppl. 1):178 (Abstr.).
Realini, C. E., R. E. Williams, T. D. Pringle, and J. K. Bertrand. 2001.Gluteus medius and rump fat depths as additional live animalultrasound measurements for predicting retail product andtrimmable fat in beef carcasses. J. Anim. Sci. 79:1378–1385.
Robinson, D. L., C. A. McDonald, K. Hammond, and J. W. Turner.1992. Live animal measurement of carcass traits by ultrasound:Assessment and accuracy of sonographers. J. Anim. Sci.70:1667–1676.
Smith, M. T., J. W. Oltjen, H. G. Dolezal, D. R. Gill, and B. D. Behrens.1992. Evaluation of ultrasound for prediction of carcass fat thick-ness and longissimus muscle area in feedlot steers. J. Anim. Sci.70:29–37.
Stouffer, J. R., T. C. Perry, and D. G. Fox. 1989. New techniquesfor real-time ultrasonic evaluation of beef cattle. J. Anim. Sci.67(Suppl. 1):120 (Abstr.).
Tait, J. R., G. H. Rouse, D. E. Wilson, C. L. Hays. 2000. Predictionof lean in the round using ultrasound measurements. 2000 IowaState Univ. Beef and Sheep Res. Rep. A.S. Leaflet R1733, Ames.
Waldner, D. N., M. E. Dikeman, R. R. Schalles, W. G. Olson, P. L.Houghton, J. A. Unruh, and L. R. Corah. 1992. Validation ofreal-time ultrasound technology for predicting fat thickness, lon-gissimus muscle area, and composition of Brangus bulls from 4months to 2 years of age. J. Anim. Sci. 70:3044–3054.
Williams, A. C., and A. Trenkle. 1997. Sorting feedlot steers usingultrasound estimates of backfat at the 12th and 13th rib priorto the finishing phase. J. Anim. Sci. 75(Suppl. 1):55 (Abstr.).
Williams, R. E., J. K. Bertrand, S. E. Williams, and L. L. Benyshek.1997. Biceps femoris and rump fat as additional ultrasoundmeasurements for predicting retail product and trimmable fatin beef carcasses. J. Anim. Sci. 75:7–13.
Wilson, D. E. 1992. Application of ultrasound for genetic improve-ment. J. Anim. Sci. 70:973–983.

Nutritional strategies to reduce environmental emissions from nonruminants1,2
P. R. Ferket*3, E. van Heugten†, T. A. T. G. van Kempen†, and R. Angel‡
*Departments of Poultry Science and †Animal Science, North Carolina State University, Raleigh 27695 and‡Department of Animal and Avian Sciences, University of Maryland, College Park, 20742
ABSTRACT: The amount of nutrients (i.e., N, P, Zn,and Cu) and associated odors emitted from productionanimals into the environment can be modulated by sev-eral different nutritional strategies, but their practicalapplication is dependent on costs and biological limita-tions. In general, nutrient excretion may be reduced byavoiding the overfeeding of specific nutrients or by us-ing nutritional manipulations to enhance nutrient utili-zation in the animal. Loss to the environment can beavoided by manufacturing and handling the feed in apelletized form that will minimize waste and improvefeed/gain. Other strategies for minimizing nutrientlosses include: 1) the development of feeding programsthat are specific for sex and strain of the animal; 2)increasing the number of feed phases to better meetthe animal’s age-related requirements; 3) formulatingdiets to include the minimal amounts of nutrients re-quired to satisfy production goals; 4) meeting the ani-mal’s amino acid requirements; 5) using syntheticamino acid supplements to feed to reduce N emission;6) using feed ingredients with high digestibility and
Key Words: Nutrients, Nutrition, Odor Emission, Pigs, Poultry, Waste Management
2002 American Society of Animal Science. All rights reserved. J. Anim. Sci. 80(E. Suppl. 2):E168–E182
Introduction
Increased regulatory pressures are being imposed onanimal agriculture to minimize P, N, Zn, and Cu emis-sions. The amount of mineral emission from a givenanimal production facility is the difference between theamount that is fed to the animals and the amount thatis retained in the meat, milk, or egg products that aredestined for human consumption. Mineral emission
1Salaries and research support provided by state and federal fundsappropriated to the North Carolina ARS, North Carolina State Uni-versity.
2Use of trade names in this publication does not imply endorsementof the products nor similar ones not mentioned by the North Caro-lina ARS.
3Correspondence: Phone: 919-515-5409; fax: 919-515-7070; E-mail:[email protected].
Received September 14, 2001.Accepted September 5, 2002.
E168
nutrient bioavailability; and 7) formulating diets basedon nutrient availability instead of total nutrient con-tent. Nutrient digestibility of feedstuffs is dependenton processing conditions, genetic characteristics of thegrains and oilseeds, and the presence of nutritionalantagonists in specific feedstuffs used in the diet. Feedingredients that lead to odor production can be avoided(e.g., fishmeal and some easily fermentable feed ingre-dients). Feed additives, such as antibiotics, nonstarchpolysaccharides, direct-fed microbials, organic acids,microbial enzymes (i.e., phytase, carbohydrases, andproteases) can be used to increase the digestibility andabsorption of nutrients or to modulate the microflora.Finally, a cost factor for the control or disposal of nutri-ents or odor should be considered in the feed formula-tion to optimize the various nutritional strategies dis-cussed above. Regardless of biological and economiclimitations, significant reductions in nutrient and odoremission from nonruminants can be achieved by appro-priate nutritional strategies, but response may differfor swine and poultry.
poses environmental pollution risks only when the nu-trients in the manure produced exceed the amount thatcan be used locally by crops and pastures. If excessnutrients are applied to the land, they can run off intowaterways and water bodies or be emitted into the air,causing disruptions in the ecological balance.
In their review, Williams et al. (1999) listed five basicstrategies to reduce mineral emissions from intensiveanimal production in an environmentally challengedarea: 1) reduce animal production; 2) collect and trans-port animal waste nutrients out of the nutrient exces-sive areas to nutrient deficient areas; 3) collect andrecycle the minerals back through animal feeds,thereby reducing the need to import more minerals; 4)grow crops that consume more nutrients from animalmanures and harvest them as grain, forage, or otheruses; and 5) improve the efficiency of nutrient use byanimals. Among these strategies, improving animalmineral use is the most feasible approach to minimizenutrient emission problems in most geographical areas,

Nutritional strategies to reduce emissions E169
Table 1. Efficiency of dietary mineral utilizationamong food animal species (Verstegen, 1995)
Food animal species Nitrogen Phosphorus
Mineral retention, %Cattle 15 21.3Swine 28 26.5Poultry 33 20.8
although the amount of reduction that can be achievedis biologically limited. Kornegay and Verstegen (2001)reviewed the literature on nutritional methods to re-duce environmental pollution and odor in swine. Theobjectives of this review are to characterize the nutrientemissions from intensive animal production facilitiesthat are critical to environmental safety, and discussnutritional strategies that enhance nutrient use andminimize the emissions of nutrients and associatedodors by poultry and swine.
Emission of Critical Nutrients
Phosphorus. Eutrophication of lakes and streams isthe major concern for surface water quality. Surfacewater becomes eutrophic when mineral and organic nu-trients reduce dissolved oxygen to levels that favorplants over animal life. Phosphorus is the limiting nu-trient for algae and other aquatic plant growth(Sharpley et al., 1994). Too much P input into a bodyof water leads to plant overgrowth, shifts in plant varie-ties, interference with recreational and commercialnavigation, discoloration, shifts in pH, clogging of wa-ter-treatment plant filters, and a depletion of oxygenupon decomposition of the plants. A drop in dissolvedoxygen levels in surface water has deleterious effectson fish populations. Overgrowth of certain blue-greenalgae is a concern because they produce toxins thatare potential health hazards for animals and humans(Kotak et al., 1993).
Although P emission is greatest from ruminant spe-cies (64% of total P from food animals), P emissionconcerns are mostly associated with swine and poultryproduction because of the intensive nature of these sec-tors and the concentration of P in the manure. Forexample, swine and poultry produce about 20% of thetotal manure produced by U.S. animal agriculture, butthey excrete about 36% of the total P produced (Crens-haw and Johanson, 1995). The general efficiency of uti-lization of dietary P is relatively low (Table 1), and asignificant amount of P is contained in litter and ma-nure (Table 2), so there is great potential for improve-
Table 2. Average nitrogen and phosphorus contents of manure samples collected byArkansas Producers (Daniel et al., 1998)
Nitrogen P2O5 Phosphorus N/P2O5 Concentration
Broiler litter 56 54 23.6 1.04 lb/tonDairy manure 6 4 1.75 1.50 lb/1,000 galSwine manure 14 13 5.68 1.08 lb/1,000 gal
ment. However, high rates of P utilization (>50%) inanimals are not possible because of biological limi-tations.
Nitrogen. Excessive N emissions from animal produc-tion adversely influence water quality (both surface andgroundwater) and have been deemed responsible foracid rain. Like P, N emission from animal productionis a problem when amounts exceed plant utilizationand it migrates to water supplies. The problem is alsocomplicated by N emissions as airborne N from animalproduction facilities. Nitrogen excretion rates from dif-ferent food animal species in the United States areillustrated in Figure 2. On a national basis, ruminantspecies emit the greatest amount of N into the environ-ment (71%), primarily concentrated in Texas, Ne-braska, Kansas, and Iowa (100,000+ tones/yr). How-ever, nonruminant animal production generally posesa greater risk of N emission pollution because of theintensive nature of the industry, particularly in NorthCarolina, Arkansas, Alabama, Mississippi, and Georgia(50,000+ tonnes/yr).
The efficiency of dietary N utilization varies amongspecies, and it is dependent upon the degree of proteinN digestibility, amino acid N absorption or availability,metabolic N demands, and dietary amino acid imbal-ance. Poultry are most efficient at utilizing dietary Nin the form of protein, followed by swine and cattle(Table 1). These differences in N utilization among spe-cies are partly due to the partitioning of N used formaintenance, metabolism, and growth. The efficiencyof N utilization decreases as maintenance requirementsfor N increase; and the larger the body size, the greaterthe maintenance requirement for N. Moreover, dietaryN utilization in ruminants is low because of the com-plexities of fermentation by rumen microflora.
Losses associated with N metabolism in nonrumi-nants are illustrated in Figure 3. Dietary protein is thepredominant form of N entering the body. Digestion ofprotein begins in the stomach by the combined actionof gastric secretions of hydrochloric acid and pepsinand is completed in the small intestines by pancreaticproteases, such as trypsin and chymotrypsin, and bybrush border peptidases. These and other digestive en-zymes and sloughed-off enteric cells are endogenousproteins, which will contribute to the fecal excretion ofN. Typically, for every 100 g of protein consumed, a pigwill secrete about 30 g of endogenous protein into thedigestive tract. About 25% of these endogenous secre-tions escape absorption in the small intestine and arepassed to the large intestine (Souffrant et al., 1993).

Ferket et al.E170
Therefore, endogenous losses account for about 8% ofthe dietary protein consumed. Approximately 15% ofthe N consumed by an animal is lost in the feces, butthis amount can be modified up or down by the degreeof protein and amino acid digestibility. About 50% ofthe N consumed by nonruminants is lost via the urinaryexcretions (urea in mammals and uric acid in birds)as a product of metabolism. Urinary N losses can bemodified by the balance between dietary amino acidsand the amino acid requirement for maintenance andgrowth. In general, fecal and urinary N excretion frompoultry and swine account for about 65% of the N con-sumed, of which about 20% is lost to the atmosphereas volatized ammonia and the balance is deposited intothe manure (van Heugten and van Kempen, 2000).
Manure and litter are valuable sources of organic Nfor crops. Poultry litter is especially valuable as a sourceof N per unit of litter in comparison to other species(Table 2). After excretion, microorganisms in the ma-nure or soil degrade nitrogenous compounds to produceammonia as the major end product. Ammonia can enterthe environment as a volatile emission or be convertedto nitrate by nitrification or to gaseous N by denitrifica-tion during storage and after its application as an or-ganic fertilizer. Verstegen and Tamminga (1995) re-ported that ammonia emission from food animals issignificant (Table 3). As a percentage of total N intake,ammonia emission is lowest for poultry and highest forswine, primarily due to the way the manure is handledand land applied. Poultry manure is applied to land asa dry litter, whereas most swine manure is treated inan anaerobic lagoon and the effluent is applied to landby spray irrigation.
Zinc and Copper. Land that has received repeatedapplications of poultry and swine manure might even-tually accumulate excessive levels of Cu and Zn, whichare toxic to many plants and some foraging animals.Unlike excess land application of N and P, Zn and Curemain bound to soil and do not migrate to water sup-plies except during soil erosion. Therefore, unless Znand Cu are removed from the land via plant products,
Table 3. Losses of nitrogen as excreta and ammonia emission relative to nitrogenintake (Verstegen and Tamminga, 1995)
Ammonia emission
Total N During During landSpecies emission storage application kg�animal−1�yr−1
/Emission as a percentage of total dietary N
Beef cattle 94.7 11.6 13.2 5.7Dairy cows 85.6 10.4 12.0 8.8Sows + piglets 83.8 12.7 14.1 8.1Piglets (to 10 kg) 62.5 12.5 10.4 —Finishing hogs 76.8 14.9 12.5 2.5Laying hensa 75.8 7.6 8.8 0.035Broilersb 69.7 6.3 8.3 0.05Turkeysb — — — 0.4
aLaying hens reared in cages and droppings removed by conveyer belt.bBroilers and turkeys reared on litter floors.
accumulation will occur and will eventually result inan unsustainable situation for some crops. Currently,unsustainable crop production due to excessive Zn orCu accumulation from long-term manure application isisolated to just a few fields. In most cases, proper min-eral accounting and nutrient management can avoidexcessive Zn and Cu accumulation.
Nutritional Strategies to Enhance Nutrient Utilization
Minimize Feed and Water Waste. Although often over-looked, a significant amount of feed nutrients may endup in manure or litter simply because it was not con-sumed by the animal. In general, N and P content inthe manure will increase by 1.5% for each 1% increasein feed waste. Poor feeder design and positioning andfeed form can result in significant animal feed waste,which ultimately ends up in manure or litter. Gonyouand Lou (1998) reported that pigs wasted about 5% oftheir feed, but up to 20% of feed waste has been reportedin some field conditions. Each time a pig leaves a feeder,it spills about 1.5 g of feed. Assuming a pig accesses afeeder 60 times per day, it could waste 90 g of feed/d.Pigs tend to root in their feed, leading to significantfeed spillage from poorly designed feeders. Poultry willalso waste a significant amount of feed if feeders areoverfilled, adjusted too low, or poorly designed (Beyeret al., 2001). Small birds will climb into feeders andscratch out feed, and larger birds will fling feed outwith their beaks or bills if the feeder is poorly designedor adjusted. For both swine and poultry, feeders shouldbe designed such that it is difficult for the animal topush the feed out of the feeder. For pigs, the feed levelshould be managed such that only 50% of the bottomof the feeder is covered. For poultry, the feeder heightshould be adjusted such that the top of the feed pan islevel with the base of the bird’s neck, and the feed filllevel to only 25% of the feeder pan.
Water is one of the primary nutrients required by allliving beings. Water waste does not affect the amountof minerals emitted, but it will adversely affect manure
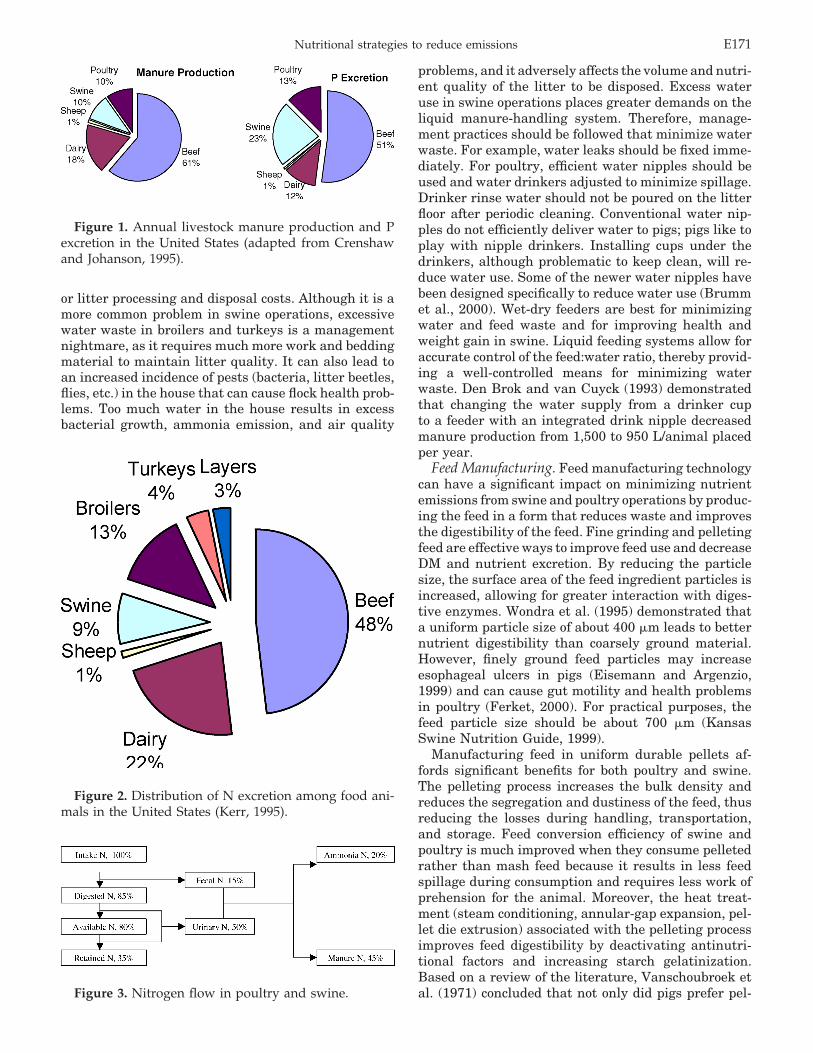
Nutritional strategies to reduce emissions E171
Figure 1. Annual livestock manure production and Pexcretion in the United States (adapted from Crenshawand Johanson, 1995).
or litter processing and disposal costs. Although it is amore common problem in swine operations, excessivewater waste in broilers and turkeys is a managementnightmare, as it requires much more work and beddingmaterial to maintain litter quality. It can also lead toan increased incidence of pests (bacteria, litter beetles,flies, etc.) in the house that can cause flock health prob-lems. Too much water in the house results in excessbacterial growth, ammonia emission, and air quality
Figure 2. Distribution of N excretion among food ani-mals in the United States (Kerr, 1995).
Figure 3. Nitrogen flow in poultry and swine.
problems, and it adversely affects the volume and nutri-ent quality of the litter to be disposed. Excess wateruse in swine operations places greater demands on theliquid manure-handling system. Therefore, manage-ment practices should be followed that minimize waterwaste. For example, water leaks should be fixed imme-diately. For poultry, efficient water nipples should beused and water drinkers adjusted to minimize spillage.Drinker rinse water should not be poured on the litterfloor after periodic cleaning. Conventional water nip-ples do not efficiently deliver water to pigs; pigs like toplay with nipple drinkers. Installing cups under thedrinkers, although problematic to keep clean, will re-duce water use. Some of the newer water nipples havebeen designed specifically to reduce water use (Brummet al., 2000). Wet-dry feeders are best for minimizingwater and feed waste and for improving health andweight gain in swine. Liquid feeding systems allow foraccurate control of the feed:water ratio, thereby provid-ing a well-controlled means for minimizing waterwaste. Den Brok and van Cuyck (1993) demonstratedthat changing the water supply from a drinker cupto a feeder with an integrated drink nipple decreasedmanure production from 1,500 to 950 L/animal placedper year.
Feed Manufacturing. Feed manufacturing technologycan have a significant impact on minimizing nutrientemissions from swine and poultry operations by produc-ing the feed in a form that reduces waste and improvesthe digestibility of the feed. Fine grinding and pelletingfeed are effective ways to improve feed use and decreaseDM and nutrient excretion. By reducing the particlesize, the surface area of the feed ingredient particles isincreased, allowing for greater interaction with diges-tive enzymes. Wondra et al. (1995) demonstrated thata uniform particle size of about 400 �m leads to betternutrient digestibility than coarsely ground material.However, finely ground feed particles may increaseesophageal ulcers in pigs (Eisemann and Argenzio,1999) and can cause gut motility and health problemsin poultry (Ferket, 2000). For practical purposes, thefeed particle size should be about 700 �m (KansasSwine Nutrition Guide, 1999).
Manufacturing feed in uniform durable pellets af-fords significant benefits for both poultry and swine.The pelleting process increases the bulk density andreduces the segregation and dustiness of the feed, thusreducing the losses during handling, transportation,and storage. Feed conversion efficiency of swine andpoultry is much improved when they consume pelletedrather than mash feed because it results in less feedspillage during consumption and requires less work ofprehension for the animal. Moreover, the heat treat-ment (steam conditioning, annular-gap expansion, pel-let die extrusion) associated with the pelleting processimproves feed digestibility by deactivating antinutri-tional factors and increasing starch gelatinization.Based on a review of the literature, Vanschoubroek etal. (1971) concluded that not only did pigs prefer pel-

Ferket et al.E172
leted feed over mash feed, but feed efficiency was im-proved by 8.5%, mainly due to a reduction in feed waste.Protein digestibility was also improved by 3.7%. Similarresponses were observed in poultry (Beyer et al., 2001).Based on turkey data reported by Brewer and Ferket(1989), there is a loss of about one point in feed conver-sion for every additional 10% increase in fines in pel-leted feed. Expanders, extruders, and extended steamconditioners are used mainly to provide flexibility iningredient selection and to improve pellet quality anddurability rather than to improve nutrient digestibility.Because these machines can expose feed mash to hightemperatures, their effect on digestibility dependgreatly on the composition of the feed, and digestibilitymay decrease in some cases.
Formulate Feeds That Closely Match Nutritional Re-quirements of the Target Animal. In order to avoid and/or minimize mineral emissions, one must first feed theanimals according to their nutritional requirements.Over- or underfeeding nutrients relative to require-ments will increase mineral emission. Animals will ex-crete all of the minerals they are unable to assimilateas tissue growth. Therefore, accurate estimates of nutri-tional requirements are essential to optimize dietarynutrient balance and to minimize mineral emission.Unfortunately, obtaining these estimates is difficult be-cause nutritional requirements are moving targets in-fluenced by many factors in addition to the yearlychanges of genetic characteristics. There are severalreferences and models available to estimate nutritionalrequirements and these models are constantly beingevaluated and modified.
The nutritional requirements of poultry (NRC, 1994)and swine (NRC, 1998) have been defined under labora-tory-type conditions where animals are well cared forand the environmental conditions are maintained asclose to optimum as possible. However, these require-ment data are usually not applicable under field condi-tions where animals are exposed to various environ-mental and disease challenges. For example, poultryand swine tend to eat less, yet require extra energy forheat dissipation during hot weather than when they areexposed to temperatures within their thermal comfortzone (Waibel and MacLeod, 1995). Therefore, a high-nutrient density diet with a lower protein:energy ratioshould be fed when animals are exposed to tempera-tures above their thermal comfort zone.
The accuracy of nutritional requirement estimates isdependent upon the nutrient. The National ResearchCouncil (NRC) publications include fairly good mini-mum requirement estimates for Zn and Cu. However,many animals are fed diets containing greater than10 times the NRC recommended levels for Zn and Cubecause producers observe advantages in health andassociated growth promotion. Emission concerns arisefrom feeding animals high dietary levels of inorganicsources of Zn and Cu to promote growth and healthrather than supplying actual nutritional requirements.In order to reduce Zn and Cu emission significantly,
use of alternative growth promoters is necessary. Thesealternatives include antibiotics, pharmaceuticals, en-zymes, and organic mineral complexes; however, someof these compounds pose other disadvantages fromtheir use.
Phosphorus requirements are more difficult to definethan those for Zn and Cu. Although NRC recommenda-tions are available for all food animals, some estimatesare based on a few out-of-date research publications oron unconfirmed models. Mineral requirement estimatesare particularly weak for growing and finishing ani-mals, which are the animals that excrete the greatestamount.
Dietary amino acid requirements for animals are con-tinually being evaluated, yet it is the N utilization ofanimals that still requires the greatest attention be-cause it is complicated by many factors, including ge-netic growth characteristics, management, and physio-logical status. Estimates of amino acid requirementsfor maintenance for growing pigs (Fuller et al., 1989),gestating gilts (Baker et al., 1966a,b,c), and broilerchicks (Leveille and Fisher, 1960; Fernandez et al.,1995) are sparse while estimates for turkeys or layersare absolutely unavailable. The amino acid require-ments for growth can be estimated from the amino acidcomposition of animal output products (i.e., meat, milk,eggs, feathers, etc.). Both amino acid requirements formaintenance and growth change daily as the animalages.
Estimating Amino Acid Requirements by the Ideal Pro-tein Concept. Understanding amino acid utilization forprotein synthesis and maintenance are critical to theformulation of an accurate ideal protein profile and thusfor minimizing N excretion. Thus, the ideal protein con-cept can play an integral role in animal production,particularly as nontraditional protein-containing ingre-dients become increasingly available. The Illinois IdealProtein was conceptualized by the early work of Mitch-ell (1964) and Dean and Scott (1965) and later refinedfor poultry and swine by Baker and coworkers (Baker,1997). All of the indispensable amino acids are ex-pressed as a percentage of lysine, which is the referenceamino acid. Lysine is a good reference amino acid be-cause good requirement data for most indispensableamino acids other than lysine are not available. Usingan established set of ideal ratios of other indispensableamino acids to lysine, it is possible to formulate anideal protein without having to independently establishrequirements for each indispensable amino acid. Baker(1997) clearly explained the application of the idealprotein concept for poultry and swine.
Separate-Sex and Phase Feeding. Even if accurate dailynutrient requirement estimates can be made, they areimpossible to fully implement in practice. However,split-sex and phase feeding strategies can optimize thenutritional needs according to changes in age, sex, andgrowth potential. For split-sex feeding of swine, differ-ences in nutrient requirements among gilts, barrows,and boars should be considered. Barrows typically have

Nutritional strategies to reduce emissions E173
Figure 4. Effect of number of feed phases on nutrientexcess relative to nutrient requirement.
a higher feed intake capacity with a lower potential forlean gain than boars, and they should be fed diets witha somewhat lower amino acid concentration (van Kem-pen, 2000b). Likewise in poultry, females require lessdietary protein than males (NRC, 1994), but the costof gender separation at the hatchery is often not eco-nomically feasible unless broilers are raised to the heav-ier market weights. Split-sex feeding has been a stan-dard feeding practice in the turkey industry for manyyears because of the large difference if weight gain be-tween hens and toms (Ferket, 2001).
Phase feeding programs match the animal’s nutrientrequirements as they change with the animal’s age orsize and reduce the time animals are fed a deficient orexcessive amount of nutrients. Figure 4 illustrates theconcept of how phase feeding affects mineral emission.Nutrient requirements change daily; thus, animals arefed diets with excess (or deficient) nutrients when onlya few feed phases are used, in contrast to when severalfeed phases are used. Boisen et al. (1991) demonstratedthat N excretion could be reduced by 5 to 8% simply byincreasing the number of feed phases for growing pigsfrom two to four (Table 4). For pigs between 25 and 115kg, changing the number of feed phases from one totwo should reduce N and P excretion by 13% (Koch,1990), while going to a three-phase feeding programshould reduce N excretion by 17.5% (van Kempen,2000b). van der Peet-Schwering and Voermans (1996)reported that multiphase feeding reduced urinary Nexcretion by 14.7% and ammonia emission by 16.8%. Inaddition to significant reductions in mineral emissions,feed cost per animal decreases as the number of feed
Table 4. Impact of phase feeding and limiting-amino acid supplementation on growthperformance and nitrogen excretion of pigs (Boisen et al., 1991)
Standard protein Low protein + amino acids
Pig, 20 to 95 kg 27/23 30/25/21/16 14/10 18/13/9/5
ADG, kg 0.90 0.96 0.92 0.88Gain:feed 0.43 0.41 0.40 0.40Lean, % 59.50 57.50 56.20 57.90Nitrogen excreted, kg 3.40 3.25 2.56 2.48
phases increases if performance is equal among allphase feeding programs (Bell, 1998). Increasing thenumber of phases in poultry feeding programs yieldsbenefits similar to those observed in swine. However,most companies cannot utilize more than four diets forbroilers and six diets for turkeys because of feed millingconstraints. Some of the new mills have overcome thisconstraint by blending finished feeds at the point ofload-out and by essentially delivering a new feed formu-lation with every feed delivery to the poultry farm. Us-ing this strategy, one company in North Carolina isable to deliver up to 17 different feed phases to theirturkey flocks and thereby minimize nutrient deficienc-ies or excesses.
A phase-feeding approach could also be used to sig-nificantly reduce P emission, since P requirements areclosely associated with skeletal development. Becauseskeletal development decreases substantially as ani-mals grow older, the potential for reducing P excretionincreases correspondently. To illustrate this concept,several trials were conducted at the University of Mary-land to determine more accurately the nonphytate-P(nPP) needs of broilers in a four phase feeding systems(Angel et al., 2000a,b; Dhandu et al., 2000; Ling et al.,2000). The four phases studied were: starter; hatch to18 d of age; grower, 18 to 32 d of age; finisher, 32 to 42d of age; and withdrawal, 42 to 49 d of age. In compari-son to average commercial usage levels, nPP can bereduced by 5% in the grower diet (18 to 32 d of age)and by 15% in the finisher diet (32 to 42 d of age) withoutaffecting bone strength or performance. Withdrawal-phase (42 to 49 d of age) nPP levels can be reduced by40%. A subsequent study was done to determine theeffects of decreasing the level of nPP in the diet ofbroilers in the grower, finisher, and withdrawal phaseson bone breakage at the processing plant. Resultsshowed that 0.45, 0.36, 0.18 and 0.14% of nPP in thestarter, grower, finisher, and withdrawal phases, re-spectively, resulted in no increase in the number ofbirds with broken wings or legs at processing in compar-ison to birds fed industry-average nPP levels of 0.43,0.36, 0.32, and 0.28% nPP in the starter, grower, fin-isher, and withdrawal phases, respectively. Therefore,formulating diets based on accurate nPP requirementinformation can potentially reduce the amount of nPPin broiler feeds, and the amount of P excreted into thelitter by at least 10%. Having more accurate P require-

Ferket et al.E174
ment information would also allow us to more fully usefeed additives, such as phytase, to decrease P excretioninto the litter.
Feed Formulation Techniques
Once nutritional requirements are established, feedsmust be formulated as close to the requirements aspossible and formulation safety margins must be mini-mized to avoid nutrient excesses. The accuracy of thefeed formulation is dependent upon the following fac-tors: 1) accurate feedstuff nutrient composition data;2) minimal feed nutrient variability; 3) accurate ingre-dient weighing and feed batching; and 4) digestible nu-trient formulation.
Use Accurate Feedstuff Nutrient Composition Data.The value of a feed formula is only as good as the feed-stuffs that go into the formula. Accurate nutrient com-position data in the feed formulation matrix is para-mount to the formulation of dietary nutrients withinspecified limits. Use of “book” values, such as thosefound in NRC (1994; 1998), for routine feed formulationwill usually result in feed formulations that do not con-tain the desired level of nutrients. Frequent and accu-rate nutrient analysis and quality control measures asingredients are received at the feed mill are necessaryto confirm feed formulation matrix values. Follow-upnutrient analysis of finished feed will then identifyproblems in the feed mixing and manufacturing pro-cesses. Use of near infrared reflectance (NIR) technol-ogy or other rapid nutrient analysis techniques priorto feed batching could allow for “real-time” feed formu-lation and significant reductions in safety margins ofnutrients critical to environmental safety (van Kempen,2000a). Other potential applications for NIR are deter-minations of organically bound Ca and P and determi-nation of feed-mixing uniformity (Mendez et al., 1999).In contrast, many quality control programs at commer-cial feed manufacturers only measure N (crude protein)and moisture content in feed ingredients. These simplemeasurements are poorly correlated with availableamino acid content of feedstuffs, resulting in greatervariation than is desirable for precision nutrition. Re-ducing this variation by appropriate quality controlmeasures could reduce N excretion by 13 to 27% (vanKempen and Simmins, 1997).
Minimize Feed Nutrient Variability. Ingredient orfeed nutrient variability is a hidden cost of feed formula-tion as well as a liability from a mineral emission per-spective. If feed ingredients, and therefore feed nutri-ents, vary significantly from batch to batch and day today, then nutrient excesses and deficiencies will occurunless appropriate methods are taken to accommodatenutrient variability. Safety margins commonly placedon top of formulation specifications or matrix valuesare commonly used to remedy the adverse effects ofnutrient variability on the productive performance ofanimals, and the greater the nutrient variability, thegreater the safety margin must be. As formulation
safety margins increase, the chances and amount ofmineral emission increase. Therefore, the cost benefitof using formulation margins should be optimized rela-tive to the consequences of mineral emissions.
Weigh Ingredients and Batch Feed Accurately. Accu-rate ingredient weighing and feed batching is necessaryto minimize variability in the nutrient composition offeed. Inaccurate ingredient weighing is usually precipi-tated by the use of the wrong scales for certain ingredi-ents, or using scales that are not precise enough foraccurately weighing the call being made on them bythe batching computer. Under practical conditions, thisproblem leads to an increase in weighing variation andoverdosing of ingredients (van Kempen et al., 1999).
Formulate Diets on an Available-Nutrient Basis. Ani-mals require nutrients that can truly be assimilatedinto the body. Therefore, one must consider dietary nu-trient availability when formulating diets using preci-sion nutrition techniques. Formulating diets based onchemical analysis may result in greater variability inlevels of critical nutrients that are actually availableto the animal, which then requires greater safety mar-gins. As mentioned above, large safety margins willresult in greater mineral emissions. In contrast, formu-lation on an available-nutrient basis will allow nutri-tionists to more confidently formulate diets closer torequirements, especially if food byproducts are usedas feed ingredients. Depending on the degree of heatprocessing, many food and animal byproducts have lowor variable amino acid digestibility. Including aminoacid digestibility of feed ingredients, unique for eachspecies, is the preferred method used for formulation.The validity of digestibility assays is based on two as-sumptions: 1) the difference between input and outputis a valid indication of overall bioavailability; and 2)digestion is likely to be the rate-limiting step in totalamino acid availability. In contrast, minerals (P, Cu,and Zn) are typically formulated on a bioavailabilitybasis using mineral retention levels in critical tissues,namely bone.
Amino acid digestibility assays are done by one oftwo methods in which the output is measured on eitherfecal or ileal collections. Amino acid digestibility datafor poultry are available using either one of these meth-ods, whereas ileal digestibility values are the only ac-cepted method for swine. The excreta method usingprecision-fed caecectomized roosters (Sibbald, 1979) iswidely used to report true amino acid digestibility val-ues in Canada, the United States, France, and theUnited Kingdom. Extensive databases of amino aciddigestibilities of various ingredients have been reportedfor chickens (Parsons, 1990) and turkeys (Firman andBoling, 1998). Though the ileal method requires surgi-cal modifications, ileal amino acid digestibility has adistinct advantage over total or fecal amino acid digest-ibility because ileal amino acid digestibility estimatesreflect a point where absorption of amino acids is com-plete and the potential impact of hindgut microorgan-isms on the metabolism of amino acids is avoided. In
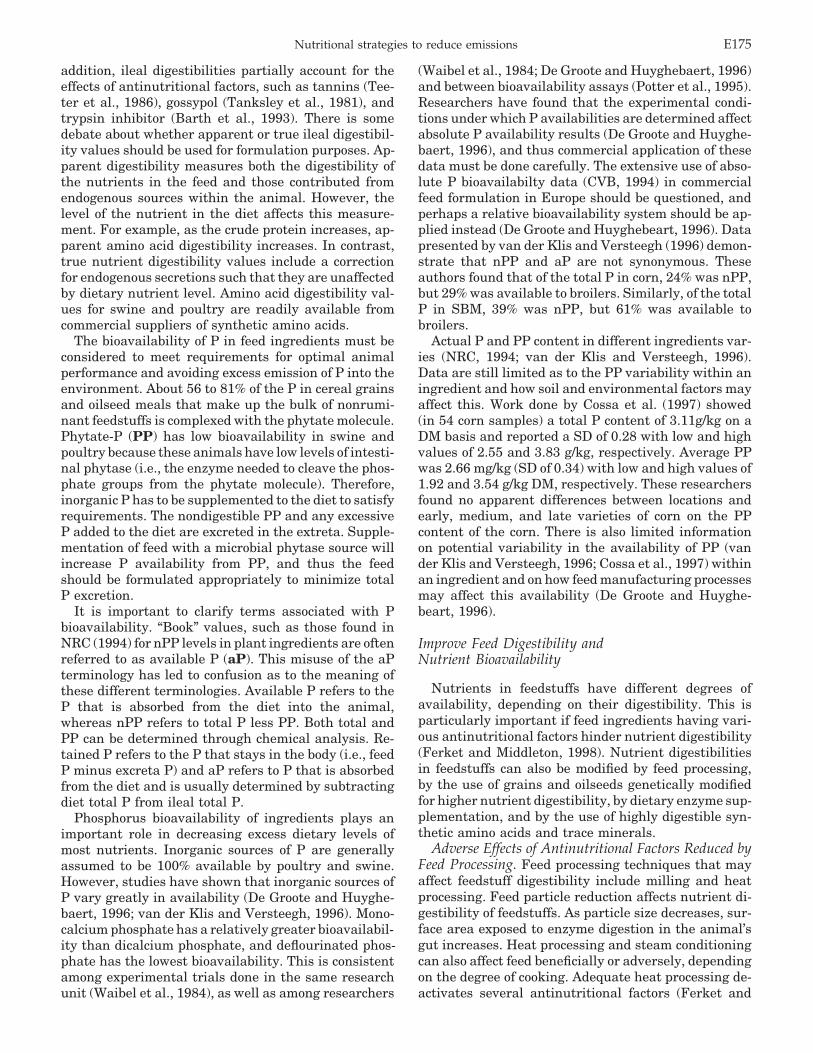
Nutritional strategies to reduce emissions E175
addition, ileal digestibilities partially account for theeffects of antinutritional factors, such as tannins (Tee-ter et al., 1986), gossypol (Tanksley et al., 1981), andtrypsin inhibitor (Barth et al., 1993). There is somedebate about whether apparent or true ileal digestibil-ity values should be used for formulation purposes. Ap-parent digestibility measures both the digestibility ofthe nutrients in the feed and those contributed fromendogenous sources within the animal. However, thelevel of the nutrient in the diet affects this measure-ment. For example, as the crude protein increases, ap-parent amino acid digestibility increases. In contrast,true nutrient digestibility values include a correctionfor endogenous secretions such that they are unaffectedby dietary nutrient level. Amino acid digestibility val-ues for swine and poultry are readily available fromcommercial suppliers of synthetic amino acids.
The bioavailability of P in feed ingredients must beconsidered to meet requirements for optimal animalperformance and avoiding excess emission of P into theenvironment. About 56 to 81% of the P in cereal grainsand oilseed meals that make up the bulk of nonrumi-nant feedstuffs is complexed with the phytate molecule.Phytate-P (PP) has low bioavailability in swine andpoultry because these animals have low levels of intesti-nal phytase (i.e., the enzyme needed to cleave the phos-phate groups from the phytate molecule). Therefore,inorganic P has to be supplemented to the diet to satisfyrequirements. The nondigestible PP and any excessiveP added to the diet are excreted in the extreta. Supple-mentation of feed with a microbial phytase source willincrease P availability from PP, and thus the feedshould be formulated appropriately to minimize totalP excretion.
It is important to clarify terms associated with Pbioavailability. “Book” values, such as those found inNRC (1994) for nPP levels in plant ingredients are oftenreferred to as available P (aP). This misuse of the aPterminology has led to confusion as to the meaning ofthese different terminologies. Available P refers to theP that is absorbed from the diet into the animal,whereas nPP refers to total P less PP. Both total andPP can be determined through chemical analysis. Re-tained P refers to the P that stays in the body (i.e., feedP minus excreta P) and aP refers to P that is absorbedfrom the diet and is usually determined by subtractingdiet total P from ileal total P.
Phosphorus bioavailability of ingredients plays animportant role in decreasing excess dietary levels ofmost nutrients. Inorganic sources of P are generallyassumed to be 100% available by poultry and swine.However, studies have shown that inorganic sources ofP vary greatly in availability (De Groote and Huyghe-baert, 1996; van der Klis and Versteegh, 1996). Mono-calcium phosphate has a relatively greater bioavailabil-ity than dicalcium phosphate, and deflourinated phos-phate has the lowest bioavailability. This is consistentamong experimental trials done in the same researchunit (Waibel et al., 1984), as well as among researchers
(Waibel et al., 1984; De Groote and Huyghebaert, 1996)and between bioavailability assays (Potter et al., 1995).Researchers have found that the experimental condi-tions under which P availabilities are determined affectabsolute P availability results (De Groote and Huyghe-baert, 1996), and thus commercial application of thesedata must be done carefully. The extensive use of abso-lute P bioavailabilty data (CVB, 1994) in commercialfeed formulation in Europe should be questioned, andperhaps a relative bioavailability system should be ap-plied instead (De Groote and Huyghebeart, 1996). Datapresented by van der Klis and Versteegh (1996) demon-strate that nPP and aP are not synonymous. Theseauthors found that of the total P in corn, 24% was nPP,but 29% was available to broilers. Similarly, of the totalP in SBM, 39% was nPP, but 61% was available tobroilers.
Actual P and PP content in different ingredients var-ies (NRC, 1994; van der Klis and Versteegh, 1996).Data are still limited as to the PP variability within aningredient and how soil and environmental factors mayaffect this. Work done by Cossa et al. (1997) showed(in 54 corn samples) a total P content of 3.11g/kg on aDM basis and reported a SD of 0.28 with low and highvalues of 2.55 and 3.83 g/kg, respectively. Average PPwas 2.66 mg/kg (SD of 0.34) with low and high values of1.92 and 3.54 g/kg DM, respectively. These researchersfound no apparent differences between locations andearly, medium, and late varieties of corn on the PPcontent of the corn. There is also limited informationon potential variability in the availability of PP (vander Klis and Versteegh, 1996; Cossa et al., 1997) withinan ingredient and on how feed manufacturing processesmay affect this availability (De Groote and Huyghe-beart, 1996).
Improve Feed Digestibility andNutrient Bioavailability
Nutrients in feedstuffs have different degrees ofavailability, depending on their digestibility. This isparticularly important if feed ingredients having vari-ous antinutritional factors hinder nutrient digestibility(Ferket and Middleton, 1998). Nutrient digestibilitiesin feedstuffs can also be modified by feed processing,by the use of grains and oilseeds genetically modifiedfor higher nutrient digestibility, by dietary enzyme sup-plementation, and by the use of highly digestible syn-thetic amino acids and trace minerals.
Adverse Effects of Antinutritional Factors Reduced byFeed Processing. Feed processing techniques that mayaffect feedstuff digestibility include milling and heatprocessing. Feed particle reduction affects nutrient di-gestibility of feedstuffs. As particle size decreases, sur-face area exposed to enzyme digestion in the animal’sgut increases. Heat processing and steam conditioningcan also affect feed beneficially or adversely, dependingon the degree of cooking. Adequate heat processing de-activates several antinutritional factors (Ferket and

Ferket et al.E176
Middleton, 1998): it gelatinizes starches and breakssome chemical bonds that hinder digestion. In contrast,excess heat processing results in the formation of indi-gestible complexes (i.e., Maillard reaction complexes ofthe ε-amino group of lysine with a hydroxyl group of areducing sugar).
Genetic Modification of Grains and Oilseeds for BetterNutrient Availability. New sources of highly digestiblefeedstuffs are being developed by crop breeders that willhave a remarkable impact on the efficiency of nutrientutilization of nonruminants. Examples of such productsare low-phytate or high-aP (HAP) corn (Stillborn, 1998)that contains the lpa21 gene. This new genotype con-tains the same level of total P as normal corn varieties,but only 35% of the total P is PP compared to about80% in other corn varieties. The P in HAP corn is indeedmore nutritionally available to poultry (Waldroup etal., 2000) and swine (Cromwell et al., 1998; Spencer etal., 1998). Other key ingredients are currently beingselected for high availability of P. Soybean phytic acidcontent could be reduced (Raboy and Dickinson, 1993)with a concomitant decrease in PP from 70 to 24% oftotal P through breeding efforts (Raboy et al., 1985).
Another strategy being implemented is the incorpora-tion of fungal phytase gene(s) into plants such thatphytase is expressed at high levels in the seed (Still-born, 1998). Results from chick trials (Denbow et al.,1998) showed that soybean meal with phytase trans-genically inserted and added supplemental phytasewere effective in improving PP utilization. Processingis still a concern in terms of inactivation of phytase,regardless of how it is added to the diet. Postexpansionand/or pelleting application of exogenous phytase tofeed can be done (Aicher, 1998) thus avoiding heat inac-tivation of the enzyme. This would not be possible withtransgenically incorporated phytase. From a practicalstandpoint, the use of new ingredients in commercialdiets poses some challenges. New ingredients must beidentified from planting to actual incorporation intodiets, but the logistics and economics of accomplishingthis must still be worked out. The simplest solutionso far is for feed manufacturers to contract fields forplanting specific genotypes. This solution leaves someof the logistical and economic challenges unanswered.In a feed mill, ingredient bin space is always limited,and new ingredients would displace other ingredients.
Supplemental Enzymes Improve Nutrient Availability.The use of supplemental enzymes has great potentialfor improving nutrient availabilities from feedstuffsand for reducing mineral emissions from animal pro-duction. Assuring that the appropriate enzyme blendsare properly applied to the feed is essential to reap thebenefits of enzyme technology. In a literature review,Ferket (1993) identified four practical uses of feed en-zymes to improve nutrient availability: 1) enzymes canincrease the availability of storage polysaccharides andproteins that would otherwise be inaccessible to endoge-nous enzymes; 2) enzymes can break down specificbonds in feedstuffs not usually degraded by endogenous
enzymes, thus releasing more nutrients; 3) exogenousfeed enzymes can help overcome inadequate digestionof young animals where endogenous enzyme produc-tion might be limiting; and 4) some supplemental en-zymes break down various antinutritional factors inmany feedstuffs, thus increasing the nutritional value.
Dietary Stabilizers of Enteric Microflora. Microorgan-isms within the gastrointestinal tract affect the growthperformance and nutrient utilization efficiency of thehost animal. The enteric microflora ecosystem charac-teristics can affect the morphology of the intestinal lu-men, metabolically modify exogenous and endogenousnutrients within the lumen, alter immune function,play an active role in pathogen control, and influencethe animal’s nutritional requirements (Visek, 1978). Ifan animal’s microflora ecosystem is unstable due toclinical or subclinical pathology, nutrient retention iscompromised and mineral emissions increase. Diarrheaand poor feed digestion associated with a destabilizedenteric ecosystem also increases odor and manure orlitter handling problems. The historically preferredmethod to stabilize or favorably modify the gut mi-croflora is with feed-grade antibiotics, including themacrolides, fluoroquinolones, β-lactams, glycopeptides,and streptogramins, among others. The practice of feed-ing subtherapeutic levels of antibiotics to productionpoultry and swine has been in use since the late 1940sto maintain animal health, improve feed conversion,and increase profitability. Antibiotic agents control thegrowth and activity of certain microorganisms by in-terfering with the cellular machinery necessary for cellgrowth and metabolism, thus decreasing the influenceof the microorganism on the host animal. The primarybenefits of antibiotic agents are the suppression of sub-clinical disease and the sparing of dietary nutrients.Indeed, research has shown the positive effects of anti-biotic feeding on the digestion of carbohydrates and fats(Eyssen and DeSomer, 1963a,b), the sparing of glucose(Vervaeke et al., 1979), the increased efficiency in theabsorption and utilization of calorigenic nutrients (Nel-son et al., 1963), and on the improvement of proteinutilization (Douglas et al., 1982). The significant impactof these antibiotic growth promoters on reducing nutri-ent emissions cannot be ignored. Assuming that an an-tibiotic growth promoter will improve feed conversionby an average of 3%, N and P emission will decreaseby about 4.5%.
Competitive exclusion alternatives to antibiotics,such as prebiotic enteric modifiers, have been developedto counter the growth-depressing effects that certainstrains of bacteria elicit on poultry. Competitive exclu-sion is defined as “a process by which beneficial bacteriaexclude pathogenic bacteria” within the gut ecosystem(Spring, 1997). Prebiotics are any food ingredients clas-sified as: 1) neither hydrolyzed nor absorbed in theupper GI of the host animal; 2) providing a selectivesubstrate for one or a limited number of host-beneficialbacteria; 3) able to modulate the normal flora in favorof a healthier composition; and 4) inducing systemic or

Nutritional strategies to reduce emissions E177
Table 5. Potential reduction in the excretion of nitrogen and phosphorusby various nutritional strategies in poultry and swine
Strategy Reduction in nutrient excretion
Formulation closer to requirements 10 to 15% for N and PReducing feed spillage/waste 1.5% for all nutrients for every 1% reductionPelleting 5% for N, P, Zn, Cu700 to 1,000 �m (fineness of grind) 5% for N, P, Zn, CuUse of highly digestible feed ingredients 5% for N and PReduce variability by quality control 10 to 25% for N and P
10 to 25% for N in poultry; 20 to 40% for N in swine;Reduced protein/amino acid supplementation 9% for N for every 1% reduction in dietary CPLow-phytate (HAP) corn 25 to 50% for PPhytase/low dietary P 2 to5% for N, Zn, and 20 to 30% for PPhytase/HAP corn 2 to 5% for N, Zn, and 20 to 40% for PPhytase/enzyme cocktails 5 to 8% for N, An, and 20 to 40% for PPhytase/1,25(OH)2D3
a 2 to 5% for N, An, and 20 to 60% for PPhytase/probiotics 2 to 5% for N, An, and 20 to 40% for PCellulases, xylanases, pentosanase, β-glucanase 5% for N and P for appropriate dietGrowth promotion feed additives 5% for all nutrientsPhase feeding 5 to 10% for N and PSplit-sex feeding 5 to 8% for NReducing microminerals/organic minerals Up to 50% for Zn, Cu, Mn
a1,25(OH)2D3 = 1,25-dehydroxycholecalciferol.
gastrointestinal effects beneficial to the host animal(Gibson and Roberfroid, 1994). Two popular classes ofoligosaccharide prebiotics include the mannanoligosac-charides and the fructooligosaccharides, both of whichhave been shown to improve feed efficiency and theefficient utilization of dietary nutrients such as calciumand magnesium (Baba et al., 1996; Ohta et al., 1998;Parks et al., 2001).
Digestible Nutritional Supplements. Digestible nutri-tional supplements include amino acids, highly digest-ible protein sources (e.g., whey, egg white, plasma, iso-lated soy protein, etc.), highly digestible inorganic Psources (e.g., mono- and dicalcium phosphates, phos-phoric acid), and highly digestible organic and inorganictrace minerals supplements. These supplements shouldbe used to balance dietary nutritional requirements andavoid mineral excesses that could increase emissionsinto the environment. Application costs of these supple-ments must be considered as with the other methodsof reducing mineral emission.
Dietary Modifications to Minimize Nitrogen Emission
Nitrogen Excretion. Assuming protein and amino aciddigestibility of ingredients, ingredient quality varia-tion, and the ideal protein (amino acid) requirementsare known, significant reductions in N emission can beachieved by reducing the dietary crude protein levelsand balancing the digestible amino acid profile require-ments with synthetic amino acid. Synthetic forms ofthe four most limiting amino acids (lysine, methionine,threonine, and tryptophan) are commercially availableat a price that is competitive with intact digestible pro-tein costs. According to Lenis and Schutte (1990), theCP level of a typical swine ration can be reduced by 3percentage points (e.g., from 16 to 13% CP) by replacing
soybean meal with synthetic amino acids and corn with-out negative effects on animal performance. Similarresults were observed in poultry (Firman, 1994). Boisenet al. (1991) demonstrated that low-protein diets sup-plemented with amino acids reduced N excretion byabout 24% without affecting growth performance inpigs, regardless of the number of feed phases (Table 4).Kerr (1995) conducted an exhaustive review of over 35studies of amino acid supplementation in swine andpoultry rations and found that N excretion could bereduced from 2.3 to 22.5% for each percentage unitdecrease in dietary crude protein. On average, aminoacid supplementation of low-protein diets for both poul-try and swine reduced N excretion by 8.5% per onepercentage unit reduction in CP, regardless of bodyweight. Schutte et al. (1993) determined that for eachpercentage point that N is reduced in feed, N excretionis reduced by 10%.
Although low-protein diets can be supplemented withsynthetic amino acid to match the theoretical aminoacid requirement profile and significantly reduce Nemission, it may not always be economically feasible.First, there is a limit to how much dietary CP can bereduced before it starts to adversely affect growth per-formance and/or meat yield. For example in turkeys,Parks et al. (1996) demonstrated that amino acid sup-plemented diets with CP at 90% of NRC (1994) reducedN excretion by 16.4% without adversely affectinggrowth performance, but breast meat yield decreasedfrom 26.5 to 25.5%. This reduced meat yield (a measureof protein retention) could be related to deficiencies inN (Jackson et al., 1983), arginine:lysine imbalance (Vel-dkamp et al., 2000), or differential efficiencies of syn-thetic amino acid and intact protein utilization and(Kerr, 1995). Second, the economic feasibility of aminoacid-supplemented low- protein diets is dependent upon

Ferket et al.E178
commodity market prices: The higher the market pricefor protein (namely soybean meal) relative to syntheticamino acids, the more least-cost feed formulation willfavor low protein diets. Ideally, the cost of disposal formanure or litter N should be considered along withleast-cost formulation of low-CP feeds.
Ammonia Emission. Ammonia emission is an environ-mental problem because it has been associated with thenitrification and acidification of rain. Moreover, highammonia levels in livestock and poultry facilities ad-versely affect pulmonary health of animals and live-stock and poultry workers. The way manure is storedand handled can have a significant effect on ammoniaemission, but precision amino acid nutrition and dietacidification can significantly reduce the amount of am-monia emission from animal waste. Ammonia emissioncan be reduced by feeding low-protein diets with supple-mental synthetic amino acids using the precision nutri-tion techniques described earlier. van der Peet-Schwer-ing et al. (1997) and Aarnink et al. (1993) demonstrateda 10% reduction in ammonia emission by reducing pro-tein by one percentage point. In swine, reducing the pHof urine is the most effective means to reduce ammoniaemission because most of the ammonia is derived fromurine (Aarnink et al., 1998). Mroz et al. (1996) demon-strated that ammonia emission could be reduced by 30,33, and 54% by replacing CaCO3 (limestone) in the dietwith CaSO4 (gypsum), CaCl2 (calcium chloride), or cal-cium benzoate, respectively. Urine pH dropped 1.3 pHunits with CaSO4 and CaCl2, and 2.2 pH units withcalcium benzoate. Den Brok et al. (1997) showed thatbenzoic acid in the feed decreased ammonia emissionby 40%, while also improving feed/gain in market pigsfrom 2.93 to 2.83. Urine pH and ammonia emission canalso be reduced by dietary addition of adipic acid andphosphoric acid, which can substitute for other Psources in the diet (Kim et al., 2000).
Feed Additives to Minimize Phosphorus Emission
As mentioned earlier, typical nonruminant diets con-tain a substantial amount of PP. Phytate chelates diva-lent cations, including Zn and Cu, and binds to proteinsand starches, making them unavailable to poultry. Kor-negay (1996) estimated that P excretion could be re-duced by 25 to 50% with the addition of 200 to 1,000U of phytase. Extensive information is available on phy-tate and phytase (Nelson, 1967). Phytase and factorsaffecting its activity and efficiency have been exten-sively discussed (Nelson et al., 1971; Simons et al., 1990;Ravindran et al., 1995), and thus the focus in this sec-tion will be on the potential use of several feed addi-tives together.
Work done by Zyla et al. (1997) demonstrated that,under in vitro conditions simulating turkey intestinalconditions, the use of an enzymatic “cocktail” could re-lease 100% of the PP contained in a corn'soy diet. Theenzymatic “cocktail” contained a microbial phytase,acid phosphatase, acid protease, citric acid, and A. niger
pectinase. From their work, it was clear that phytasealone could not release 100% of the PP present in acorn'soy diet. Only when the right balance between thedifferent components of the “cocktail” was obtained did100% release of PP from the corn'soy diet occur. Todetermine whether the enzymatic “cocktail” developedin vitro would work as effectively in vivo, an experimentwas done with 7- to 21-d-old turkeys (Zyla et al., 1996).These researchers fed a corn-soy-meat meal diet witha Ca level of 1.2% and an aP level of 0.6% that metNRC (1994) recommendations, a positive control dietcontaining 0.42% aP and 0.84% Ca (positive control),and diets containing 0.84% Ca and 0.16% aP, to whichenzyme preparations (1,000 U of phytase/kg of diet, anenzyme cocktail, or A. niger mycelium) were added.They found P retention from 31.0% in the NRC (1994)based diet, 42.8% in the positive control diet, 66.8% inthe diet with phytase, 77.0% in the diet with the enzyme“cocktail,” and 79.5% in the diet with the A. niger myce-lium. Addition of acid phosphatase, pectinase, and citricacid to phytase (enzyme cocktail) also increased P re-tention.
Other feed “additives” that need to be considered arevitamin D metabolites. Not only does vitamin D stimu-late P transport mechanisms in the intestine, it alsoappears to enhance phytase activity (Mohammed et al.,1991). Vitamin D, as well as its metabolites, 25-hydro-xycholecalciferol and 1,25-dehydroxycholecalciferol(1,25[OH]2D3) have been shown to enhance phytaseactivity (Edwards, 1993; Mitchell and Edwards, 1996).Phytase and 1,25(OH)2D3 appear to act in an additivemanner rather than in a synergistic one (Biehl et al.,1995; Mitchell and Edwards, 1996). Mitchell and Ed-wards (1996) found that the addition of 1,25(OH)2D3and phytase could replace 0.2% of the inorganic P addi-tion in the diet in 21-d-old chicks. Phytase and1,25(OH)2D3 alone could each only substitute for closeto 0.1% of added inorganic P. Vitamin D metaboliteshave a clear role in improving P retention and theiruse with other feed additives (phytase and enzyme“cocktails”) should be considered.
Some lactobacillus-based probiotics have been shownto improve growth and feed conversion in poultry andswine. Angel et al. (1999a,b) demonstrated in two stud-ies that broilers fed control diets (19.3% protein and0.37% nPP for grower; and 17% protein and 0.30% nPPfor finisher) and low-nutrient diets (where protein wasdecreased by 12% and nPP and Ca by 18%) from 18 to28 d (grower) and 28 to 42 d (finisher) of age had similarperformance and bone mineralization when the probi-otic was included. Broilers fed the low-nutrient diet hadpoorer performance than those fed the control and thosefed the low-nutrient diet with the probiotic. Birds fedthe low-nutrient diets with the probiotic were able toovercome the deficiency exhibited by birds fed the low-nutrient diet without the probiotic. In addition, P reten-tion was 22% higher and N retention was 10% higherin birds fed the low-nutrient diet with the probioticthan in the birds fed the control diet. The addition of

Nutritional strategies to reduce emissions E179
the probiotic to the low-nutrient diet allowed broilersto grow as well as those fed a control diet in part becausethey were more efficient in retaining nutrients. Feedinga low-nutrient diet with the probiotic decreased excretaP by 33% without adversely affecting performance orbone strength.
Nutritional Strategies to MinimizeOdor and Dust Emission
Where excessive mineral emissions may lead to envi-ronmental pollution problems, odor and dust emissionadversely affect the aesthetic and physical quality oflife of people living nearby. Odor and dust emission isa much greater problem for the swine industry, but itis also a problem for poorly managed poultry operations.Schiffman et al. (1995) found that people who live nearodorous swine operations reported more anger, confu-sion, tension, depression, fatigue, and less vigor thancontrol subjects did as measured by a scale called Profileof Mood States. Odors associated with livestock andpoultry operations come from fresh and decomposingmanure (and urine) and spilled feed. Odor perception byneighbors is augmented by dust emission from livestockand poultry facilities because odorous gasses are readilyabsorbed into the particles, which may easily travelgreat distances in an air plume. Excellent reviews ofodor emission and control were reported by the SwineOdor Task Force (1995) and Sutton et al. (1999).
The most objectionable odors arise from anaerobicmicrobial fermentation in the gut of animals, in thelagoon, or in litter. Fermentable carbohydrates yieldvolatile fatty acids, such as butyric acid. Proteins yieldvolatile fatty acids, phenolics, (e.g., para-cresol andskatole), mercaptans (e.g., hydrogen sulfide and ethyl-mercaptan), and amines (e.g., putrescine and cadav-erine). Therefore, one nutritional strategy to reduceodor emission is to decrease the availability of fer-mentable substrates for hindgut and fecal microbes byfeeding highly digestible feed ingredients and low pro-tein diets (Mackie et al., 1998). Hobbs et al. (1996)reported that finishing pigs fed a least-cost formulatedlow-protein diet (14.0% protein) decreased ρ-cresol by43% and other odorous compounds decreased from 40to 86% in comparison to pigs fed a conventional 18.9%protein diet. Schaefer (1977) reported that ρ-cresol wasthe main odor-causing agent in swine manure. Simi-larly, Zahn et al. (1997) reported that C2 through C9
organic acids demonstrated the greatest potential fordecreased air quality because these compounds exhib-ited the highest transport coefficients and highest air-borne concentrations.
Excessive dust emission in animal and poultry facili-ties not only augments odor emission problems, but italso can adversely affect the health of livestock andworkers. Dust is derived from feed, animal skin, feath-ers, manure, and bacteria. Feed dust can be reducedby improving pellet quality and adding fat to the pelletsafter the cooling process. Feed handling equipment
should be adjusted to minimize the damage of feed pel-lets and limit the amount of dust generated, especiallyinside the production facility. In swine, liquid feedingsystems and wet-dry feeders can greatly reduce theamount of dust generated. Skin health can be signifi-cantly affected by nutrition, particularly as related todietary fat quality and Zn.
Implications
In order to increase efficiency, swine and poultry pro-duction has become more intensive, causing environ-mental problems in some geographical areas. Althoughfeed is the primary input source of nutrients, theamount of nutrients ultimately emitted into the envi-ronment is dependent on the efficiency of nutrient utili-zation of the animal. Several nutritional strategies toreduce nutrient emissions from nonruminants were dis-cussed and their potential impact is summarized inTable 5. The impacts of these methods may not be fullyadditive, but strategic combinations will result in sig-nificant reductions in nutrient emissions. The mostcost-effective methods that are relatively easy to imple-ment include reducing feed waste, separate-sex andphase feeding, and formulating diets based on nutrientavailability. Many of the progressive poultry and swineenterprises have already implemented many of the nu-tritional strategies, but more research is needed to fur-ther refine the applications.
Literature Cited
Aarnink, A. J. A., P. Hoeksma, and E. N. J. van Ouwerkerk. 1993.Factors affecting ammonium concentrations in slurry from fat-tening pigs. Pages 413–420 in Nitrogen Flow in Pig Productionand Environmental Consequences. M. W. A. Verstegen, L. A.den Hartog, G. J. M. van Kempen, and J. H. M. Metz, ed. PudocScientific Publishers, Wageningen, The Netherlands.
Aarnink, A. J. A., A. L. Sutton, T. T. Cahn, M. W. A. Verstegen, andD. J. Langhout. 1998. Dietary factors affecting ammonia andodour release from pig manure. Pages 45–59 in Biotechnologyin the Feed Industry. Proc. Alltech’s 14th Annu. Symp. T. P.Lyons and K. A. Jacques, ed. Nottingham Univ. Press, Notting-ham, U.K.
Aicher, E. 1998. Post pelleting liquid systems for enzymes. Pages 35–46 in Use of Natuphos Phytase in Broiler Nutrition and WasteManagement. Proc. BASF Tech. Symp., BASF Corp., Mt. Ol-ive, NJ.
Angel, R., T. J. Applegate, and M. Christman. 2000a. Effect of dietarynon-PP (nPP) on performance and bone measurements in broil-ers fed on a four-phase feeding system. Poult. Sci. 79(Suppl.1):21. (Abstr.)
Angel, R., T. J. Applegate, and M. Christman. 2000b. Effect of dietarynon-PP (nPP) level on broiler performance and bone measure-ments in the starter and grower phase. Poult. Sci. 79(Suppl.1):22. (Abstr.)
Angel, C. R., R. A. Dalloul, N. M. Tamim, T. A. Shellem, and J. A.Doerr. 1999a. Performance and nutrient use in broilers fed alactobacillus-based pro-biotic. Poult. Sci. 78(Suppl. 1):98.(Abstr.)
Angel, C. R., P. Melvin, R. A. Dalloul, N. M. Tamim, T. A. Shellem,and J. A. Doerr. 1999b. Performance and nutrient retention inbroilers fed a lactobacillus-based pro-biotic. Poult. Sci. 78(Suppl.1):58. (Abstr.)

Ferket et al.E180
Baba, S., A. Ohta, M. Ohtsuki, T. Takizawa, T. Adachi, and H. Hara.1996. Fructooligosaccharides stimulate the absorption of magne-sium from the hindgut in rats. Nutr. Res. 16:657–666.
Baker, D. H. 1997. Ideal amino acid profiles for swine and poultryand their application in feed formulaton. Biokyowa TechnicalReview-9. Biokyowa Inc., Chesterfield, MO.
Baker, D. H., D. E. Becker, H. W. Norton, A. H. Jensen, and G.G. Harmon. 1966a. Quantitative evaluation of the threonine,isoleucine, valine, and phenylalanine needs of adult swine formaintenance. J. Nutr. 88:391–396.
Baker, D. H., D. E. Becker, H. W. Norton, A. H. Jensen, and G.G. Harmon. 1966b. Quantitative evaluation of the tryptophan,methionine and lysine needs of adult swine for maintenance. J.Nutr. 89:441–447.
Baker, D. H., D. E. Becker, H. W. Norton, A. H. Jensen, and G. G.Harmon. 1966c. Some qualitative amino acid needs of adultswine for maintenance. J. Nutr. 88:382–390.
Barth, C., A. B. Lunding, M. Schmitz, and H. Hagemeister. 1993.Soybean trypsin inhibitors reduce absorption of exogenous andincrease loss of endogenous protein in miniature pigs. J. Nutr.123:2195–2200.
Bell, A. 1998. How many phases should you feed? Pork 98 May:34–38.Beyer, R. S., J. S. Moritz, K. J. Wilson, and K. R. Cramer. 2001. Feed
processing, feed form affects animal performance. Feedstuffs73:10–13.5-9.
Biehl, R. R., D. H. Baker, and H. F. De Luca. 1995. 1 alpha-hydroxyl-ated cholecalciferol compounds act additively with microbialphytase to improve phosphorus, zinc, and manganese utilizationin chicks fed soy-based diets. J. Nutr. 125:2407–2416.
Boisen, S., J. A. Fernandez, and A. Madsen. 1991. Studies on idealprotein requirement of pigs from 20 to 95 kg live weight. Page299 in Proc. 6th Int. Symp. Protein Metab. Nutr., Herning,Denmark.
Brewer, C. E., and P. R. Ferket. 1989. The effect of pellet integrityand lignosulfonate on performance of growing toms. Poult. Sci.68:18 (Abstr.).
Brumm, M. C., J. M. Dahlquist, and J. M. Heemstra. 2000. Impactof feeders and drinker devices on pig performance, water useand manure volume. J. Swine Health Prod. 8:51–57.
Cossa, J., K. Oloffs, H. Kluge, and H. Jeroch. 1997. Investigation intothe total phosphorus and PP content in different varietes ofgrain maize. Pages 444–446 in Proc. 11th Eur. Symp. Poult.Nutr., World’s Poult. Sci. Assoc., Faaberg, Denmark.
Crenshaw, T. D., and J. C. Johanson. 1995. Nutritional strategiesfor waste reduction management: Minerals. Pages 69–78 in NewHorizons in Animal Nutrition and Health. J.B. Longenecker andJ.W. Spears, ed. The Inst. of Nutr. of the Univ. North Carolina,Chapel Hill.
Cromwell, G. L., J. L. Pierce, T. E. Sauber, D. W. Rice, D. S. Ertl,and V. Raboy. 1998. Bioavailability of P in low-phytic acid cornfor growing pigs. J. Anim. Sci. 76(Suppl. 1):58. (Abstr.)
CVB. 1994. Voorlopig systeem opneembaar fosfor pluimvee. [InterimSystem of Available Phosphorus for Poultry.] Centraal Vee-voeder Bureau, Lelystad, The Netherlands, CVB-reeks nr.16:1–37.
Daniel, T. C., A. Sharpley, and N. Lemungon. 1998. Agriculturalphosphorus and eutrophications: A symposium overview. J. En-viron. Qual. 27:251–257.
De Groote, G., and G. Huyghebaert. 1996. The bio-availability ofphosphorus from feed phosphates for broilers as influenced bybio-aasay method, dietary calcium level, and feed form. Anim.Feed Sci. Technol 69:329–340.
Dean, W. F., and H. M. Scott. 1965. The development of an aminoacid reference diet for the early growth of chicks. Poult. Sci.44:803–808.
Den Brok, G., and J. van Cuyck.1993. Manure production and waterconsumption: Comparison between theory and practice. SwineRes. Stn. Rep., Rosmalen, The Netherlands.
Den Brok, G., C. van der Peet-Schwering, and M. Vrielink. 1997.Urine-pH, ammonia emission, and technical results of grow-
finish pigs after addition to the feed of organic acids, specificallybenzoic acid. Swine Res. Stn. Rep., Rosmalen, The Netherlands.
Denbow, D. M., E. A. Grabau, G. H. Lacy, E. T. Kornegay, D. R.Russell, and P. F. Umbeck. 1998. Soybeans transformed with afungal phytase gene improve phosphorus availability for broil-ers. Poult. Sci. 77:878–881.
Dhandu, A. S., R. Angel, T. J. Applegate, and B. Ling. 2000. Non-PPrequirement of broilers in the finisher phase of a four phasefeeding program. Poult. Sci. 79(Suppl. 1):10. (Abstr.)
Douglas, C. R., R. D. Miles, and R. H. Harms. 1982. Effects of virgin-iamycin on leghorn-type pullets fed optimal and sub-optimalprotein levels. Poult. Sci. 61:1453. (Abstr.) Edwards, H. M., Jr.1993. Dietary 1,25-dihidroxycholecalciferol supplementation in-creases natural PP utilization in chickens. J. Nutr. 123:567–577.
Eisemann, J. H., and R. A. Argenzio. 1999. Effects of diet and housingdensity on growth and stomach morphology in pigs. J. Anim.Sci. 77:2709–2714.
Eyssen, H., and P. DeSomer. 1963a. Effect of antibiotics on growthand nutrient absorption of chicks. Poult. Sci. 42:1373–1379.
Eyssen, H., and P. DeSomer. 1963b. The mode of action of antibioticsin stimulating growth of chicks. J. Exp. Med. 117:127–137.
Ferket, P. R. 1993. Practical use of feed enzymes for turkeys andbroilers. J. Appl. Poult. Sci. 2:75–81.
Ferket, P. R. 2000. Practical nutritional perspective on gut healthand development. Pages 74–86 in Proc. Carolina Poult. Nutr.Conf., Carolina Feed Industry Assoc., Raleigh, NC.
Ferket, P. R., and T. Middleton. 1998. Antinutrients in poultry feeds.Pages 43–52 in Proc. World Poult. Sci. Assoc. 10th Eur. Poult.Conf., Jerusalem, Israel.
Ferket, P. R. 2001. Growth rate continues to climb. Poult. USA,Jan.:40–50. Fernandez, S. R., C. M. Parsons, and D. H. Baker.1995. Maintenance requirements and efficiency of amino aciduse for protein accretion of six essential amino acids in broilerchicks. Poult. Sci. 74(Suppl. 1):64. (Abstr.)
Firman, J. D. 1994. Utilization of low protein diets for turkeys. Bioky-owa Technical Review-7, Biokyowa, Inc., Chesterfield, MO. Fir-man, J. D., and S. D. Boling. 1998. Ideal protein in turkeys.Poult. Sci. 77:105–110.
Fuller, M. F., R. McWilliam, T. C. Wang, and L. R. Giles. 1989.The optimum dietary amino acid pattern for growing pigs. 2.Requirements for maintenance and for tissue protein accretion.Br. J. Nutr. 62:255–267.
Gibson, G. R., and M. B. Roberfroid. 1994. Dietary modulation of thehuman colonic microflora: Introducing the concept of prebiotics.J. Nutr. 125:1401–1412.
Gonyou, H. W., and Z. Lou. 1998. Grower/finisher feeders: Design,behavior and performance. Page 77 in Monograph 97-01. PrairieSwine Centre, Inc., Saskatoon, Canada.
Hobbs, P. J., B. F. Pain, R. M. Kay, and P. A. Lee. 1996. Reductionof odorous compounds in fresh pig slurry by dietary control ofcrude protein. J. Sci. Food Agric. 71:508–514.
Jackson, S., R. J. Stas, and L. M. Potter. 1983. Relative deficienciesof amino acids and N per se in low protein diets for young turkeys.Poult. Sci. 62:1117–1119.
Kansas swine nutrition guide. 1999. Kansas State Univ. Agric. Exp.Stn. Coop. Ext. Serv. Available at: http://www.oznet.ksu.edu/library/lvstk2/s99.pdf. Accessed June 20, 1999.
Kerr, B. J. 1995. Nutritional strategies for waste reduction manage-ment: Nitrogen. Pages 47–68 in New Horizons in Animal Nutri-tion and Health. J. B. Longenecker and J. W. Spears, ed. TheInst. of Nutr. of the Univ. of North Carolina, Chapel Hill.
Kim, I. B., D. W. Kim, and T. van Kempen. 2000. Effects of differentsources of phosphorus and calcium on urine pH and ammoniaemission. J. Anim. Sci. 78(Suppl. 1):39. (Abstr.)
Koch, F. 1990. Amino acid formulation to improve carcass qualityand limit nitrogen load in waste. Pages 76–95 in Proc. CarolinaSwine Nutr. Conf., Carolina Feed Ind. Assoc., Raleigh, NC.
Kornegay, E. T. 1996. Nutritional, environmental, and economic con-siderations for using phytase in pig and poultry diets. Pages277–302 in Nutrient management of food animals to enhance

Nutritional strategies to reduce emissions E181
and protect the environment. E. T. Kornegay, ed. CRC Press,Boca Raton, FL.
Kornegay, E. T., and M. W. A. Verstegen. 2001. Swine nutritionand environmental pollution and odor control. Pages 609'630 inSwine nutrition. A. J. Lewis and L. L. Southern, ed. CRC Press,Boca Raton, FL.
Kotak, B. G., S. L. Kenefick, D. L. Fritz, C. G. Rousseaux, E. E.Prepas, and S. E. Hrudey. 1993. Occurrence and toxicologicalevaluation of cyanobacterial toxins in Alberta lakes and farmdugouts. Water Res. 27:495–506.
Lenis, N. P., and J. B. Schutte. 1990. Amino acid supply of pigletsand grow-finish pigs in relation to nitrogen excretion. Pages 79–89 in Manure Issues: Nutritional Solutions for Pigs and Poultry.A. W. Jongbloed and J. Coppoolse, ed. Service Agricultural Re-search, Wageningen, The Netherlands.
Leveille, G. A., and H. Fisher. 1960. Amino acid requirements formaintenance in adult rooster. III. The requirements of leucine,isoleucine, valine, and threonine, with reference to the utiliza-tion of the D-isomers of valine, threonine and isoleucine. J. Nutr.70:135–140.
Ling, B., R. Angel, T. J. Aplegate, N. G. Zimmerman, and A. S.Dhandu. 2000. The non-PP requirements of broilers in a four-phase feeding program. Poult. Sci. 79(Suppl. 1):11 (Abstr.).
Mackie, R. I., P. G. Stroot, and V. H. Varel. 1998. Biochemical identi-fication and biological origin of key odor components in livestockwaste. J. Anim. Sci. 76:1331–1342.
Mendez, A, N. Dale, G. M. Pestei, and R. Bakalli. 1999. Use of NIRsto evaluate feed mixing uniformity. Poult. Sci. 78(Suppl.1):115. (Abstr.)
Mitchell, H. H. 1964. Comparative Nutrition of Man and DomesticAnimals. Academic Press, New York.
Mitchell, R. D., and H. M. Edwards Jr. 1996. Effect of phytase and1,25-dihydroxycholecalciferol on phytate utilization and thequantitative requirement for calcium and phosphorus in youngbroiler chickens. Poult. Sci. 75:95–110.
Mohammed, A., M. J. Gibney, and T. C. Taylor. 1991. The effect ofdietary levels of inorganic phosphorus, calcium, and cholecalcif-erol on the digestability of PP by the chick. Br. J. Nutr.66:251–259.
Mroz, Z., A. W., K. Jongbloed, T. T. Vreman, J. T. M. Cahn, P. A.van Diepen, J. Kogut-Kemme, and A. J. A. Aarnink. 1996. Theeffect of different dietary cation'anion supplies on excreta compo-sition and nutrient balance in growing pigs. Report No. 96.028.Inst. Anim. Sci. and Health, Lelystad, The Netherlands.
NRC. 1994. Nutrient Requirements of Poultry. 9th ed. Natl. Acad.Press, Washington, DC. NRC. 1998. Nutrient Requirements forSwine. 10th ed. Natl. Acad. Press, Washington, DC.
Nelson, F. E., L. S. Jensen, and J. McGinnis. 1963. Studies on thestimulation of growth by dietary antibiotics on metabolizableenergy of the diet. Poult. Sci. 42:909–912.
Nelson, T. S. 1967. The utilization of phytate phosphorus by poultry–A review. Poult. Sci. 46:862–871.
Nelson, T. S., T. R. Sheih, R. J. Wodjinski and J. H. Ware. 1971.Effect of supplemental phytase on the utilization of PP by chicks.J. Nutr. 101:1289–1293.
Ohta, A., Y. Motohashi, M. Ohtsuki, M. Hirayama, T. Adachi, andK. Sakuma. 1998. Dietary fructooligosaccharides change the con-centration of calbindin-D9k differentially in the mucosa of thesmall and large intestine of rats. J. Nutr. 128:934–939.
Parks, C. W., P. R. Ferket, L. N. Thomas, and J. Grimes. 1996. Carcassyield and N balance of turkey toms fed high and low crudeprotein diets supplemented with menefee humate. Poult. Sci.75(Suppl. 1):116. (Abstr.)
Parks, C. W., J. L. Grimes, P. R. Ferket, and A. S. Fairchild. 2001.The effect of mannanoligosaccharides, bambermycins, and vir-giniamycin, on performance of large white male market turkeys.Poult. Sci. 80:718–723.
Parsons, C. M. 1990. Digestibility of amino acids in feedstuffs forpoultry. Pages 22–29 in Proc. Maryland Nutr. Conf., Univ. ofMaryland, College Park.
Potter, L. M., M. Potchanakorn, V. Ravindran, and E. T. Kornegay.1995. Bioavailability of phosphorus in different sources usingbody weight and toe ash as response criteria. Poult. Sci.74:813–820.
Raboy, V., and D. B. Dickinson. 1993. Phytic acid levels in seed ofGlycine max and G. soja as influenced by phosphorus status.Crop Sci. 33:1300–1305.
Raboy, V., S. J. Hudson, and D. B. Dickinson. 1985. Reduced phyticacid content does not have an adverse effect on germination ofsoybean seeds. Plant Physiol. (Bethesda) 79:323–325.
Ravindran, V., W. L. Bryden, and E. T. Kornegay. 1995. Phytate:Occurrence, bioavailability and implications in poultry nutri-tion. Poult. Avian Biol. Rev. 6:125–143. Schaefer, J. 1977. Sam-pling, characteristics and analysis of malodours. Agric. Environ.3:121–127.
Schiffman, S. S., E. A. S. Miller, M. S. Suggs, and B. G. Graham. 1995.The effect of environmental odors emanating from commercialswine operations on the mood of nearby residents. Brain Res.Bull. 37:369–375.
Schutte, J. B., J. de Jong, and G. J. M. van Kempen. 1993. Dietaryprotein in relation to requirement and pollution in pigs duringthe body weight range of 20–40 kg. Pages 259–263 in NitrogenFlow in Pig Production and Environmental Consequences. M.W. A. Verstegen, L. A. den Hartog, G. J. M. van Kempen, andJ. H. M. Metz, ed. Pudoc Scienfitic Publishers, Wageningen,The Netherlands.
Sharpley, A. N., S. C. Chapra, R. Wedepohl, J. T. Sims, T. C. Daniel,and K. R. Reddy. 1994. Managing agricultural phosphorus forprotection of surface waters: Issues and options. J. Environ.Qual. 23:437–451.
Sibbald, I. R. 1979. A bioassay for available amino acids and truemetabolizable energy in feedingstuffs. Poult. Sci. 58:668–675.
Simons, P. C., H. A. Versteegh, A. W. Jongbloed, P. A. Kemme, P.Slump, K. D. Bos, M. G. Wolters, R. F. Beudeker, and G. J.Verschoor. 1990. Improvement of phosphorus availability by mi-crobial phytase in broilers and pigs. Br. J. Nutr. 64:525–540.
Souffrant, W. B., A. Rerat, J. P. Laplace, B. Darcy-Vrillon, R. Kohler,T. Corring, and C. Gebhardt. 1993. Exogenous and endogenouscontributions to nitrogen fluxes in the digestive tract of pigs feda casein diet. III. Recycling of endogenous nitrogen. Reprod.Nutr. Dev. 33:373–382.
Spencer, J. D., G. L. Allee, T. E. Sauber, D. S. Ertl, and V. Raboy.1998. Grow-finish performance of high lean-growth pigs fed nor-mal and genetically modified low phytate (LP) corn. J. Anim.Sci. 76(Suppl. 1):58 (Abstr.).
Spring, P. 1997. Understanding the development of the avian gastro-intestinal microflora: An essential key for developing competitiveexclusion products. Pages 313–324 in Biotechnology in the FeedIndustry: Alltech’s 13th Annu. Symp. T. P. Lyons and K. A.Jacques, ed. Nottingham Univ. Press, Nottingham, U.K.
Stillborn, H. L. 1998. Cultivars: Utilizing plant genetics to reducenutrient loading in the environment. Pages 154–159 in Proc.Natl. Poultr. Waste Manage. Symp. North Carolina StateUniv., Raleigh.
Sutton, A. L., K. B. Kephart, M. W. A. Verstegen, T. T. Canh, andP. J. Hobbs. 1999. Potential for reduction of odorous compoundsin swine manure through diet modification. J. Anim. Sci.77:430–439.
Swine Odor Task Force. 1995. Options for managing swine odor.North Carolina ARS, North Carolina State Univ., Raleigh. Avail-able at: http://www.ces.ncsu.edu/whpaper/SwineOdor.html. Ac-cessed June 23, 1999.
Tanksley, T. D., Jr., D. A. Knabe, K. Purser, T. Zebrowska, and J.R. Corley. 1981. Apparent digestibility of amino acids and N inthree cottonseed meals and one soybean meal Growing-finishingswine diets. J. Anim. Sci. 52:769–777.
Teeter, R. G., S. Sarani, M. O. Smith, and C. A. Hibberd. 1986.Detoxification of high tannin sorghum grains. Poult. Sci.65:67–71.
van der Klis, J. D., and H. A. J. Versteegh. 1996. Phosphorus nutritionin broilers. Pages 71–83 in Recent Advances in Animal Nutrition.

Ferket et al.E182
P. C. Garnsworty, J. Wiseman, and W. Haresign, ed. NottinghamUniv. Press, Nottingham, U.K.
van der Peet-Schwering, C. P., N. Verdoes, and M. Voermans. 1997.Ammonia emission 10% reduced with phase feeding. Swine Res.Stn. Rep., Rosmalen, The Netherlands.
van der Peet-Schwering, C., and M. Voermans. 1996. Effect of feedingand housing on the ammonia emission of growing and finishingpig facilities [in Dutch]. Rep. Exp. Pig Stn., Rosmalen, The Neth-erlands 10:17–19.
van Heugten, E., and T. van Kempen. 2000. Understanding andapplying nutrition concepts to reduce nutrient excretion inswine. AG-608. North Carolina Coop. Ext. Serv., North CarolinaState Univ., Raleigh.
van Kempen T. 2000a. Quick QC tests for ingredients: Infrared tech-nology in animal production. Pages 32'58 in Proc. CarolinaPoultr. Nutr. Conf. Carolina Feed Ind. Assoc., Raleigh, NC.
van Kempen, T. 2000b. Reducing pig waste and odor through nutri-tional means. In Livestock and Poultry Environmental Steward-ship, USDA/EPA National Curriculum Project. Available at:http://www.public.iastate.edu/~mwps_dis/curriculum_project/homepage.htm. Accessed June 25, 1999.
van Kempen, T., and P. H. Simmins. 1997. Near infrared reflectancespectroscopy in precision feed formulation. J. Appl. Poult. Res.6:471–477.
van Kempen, T., B. Park, M. Hannon, and P. Matzat. 1999. Properweighing key in making a quality feed. Feedstuffs 71:12–13.
Vanschoubroeck, F., L. Coucke, and R. van Spaendonck. 1971. Thequantitative effect of pelleting feed on the performance of pigletsand fattening pigs. Nutr. Abstr. Rev. 41:1–9.
Veldkemp, T., P. R. Ferket, R. P. Kwakkel, C. Nixey, and J. P. T. M.Noordhuizen. 2000. Interaction between ambient temperatureand supplementation of synthetic amino acids on performanceand carcass parameters in commercial male turkeys. Poult. Sci.79:1472–1477.
Verstegen, M. 1995. Strategies in The Netherlands for animal wastereduction management. Pages 79–92 in New Horizons in AnimalNutrition and Health. The Inst. Nutr. Univ. of North Carolina,Chapel Hill, NC.
Verstegen, M. W. A., and S. Tamminga. 1995. Animal nutrition inthe ecosystem. Pages 464–477 in Nutztiernahurung. H. J. Abel,
G. Flachowsky, H. Jeroch, and S. Molnar, ed. Gustave FisherVerlag, Jena, Stuttgart, Germany.
Vervaeke, I., J., J. A. Decuypere, N. A. Dierick, and H. K. Henderickx.1979. Quantitative in vitro evaluation of the energy metabolisminfluenced by virginiamycin and spiramycin used as growth pro-moters in pig nutrition. J. Anim. Sci. 49:849–856.
Visek, W. J. 1978. The mode of growth promotion by antibiotics. J.Anim. Sci. 46:1447–1469.
Waibel, P. E., and M. G. MacLeod. 1995. Effect of cycling temperatureon growth, energy metabolism and nutrient retention of individ-ual male turkeys. Br. Poult. Sci. 36:39–49.
Waibel, P. E., N. A. Nohorniak, H. E. Dzuik, N. M. Walser, and W.G. Olson. 1984. Bioavailability of P in commercial phosphatesupplements for turkeys. Poult. Sci. 63:730–737.
Waldroup, P. W., J. H. Kersey, E. A. Saleh, C. A. Fritts, F. Yan, H.L. Stillborn, R. C. Crum, Jr., and V. Raboy. 2000. NonphytateP requirement and P excretion of broiler chicks fed diets com-posed of normal or high available phosphate corn with and with-out microbial phytase. Poult. Sci. 79:1451–1459.
Williams, C. M., J. C. Barker, and J. T. Sims. 1999. Managementand utilization of poultry wastes. Rev. Environ. Contam. Toxicol.162:105–157.
Wondra, K. J., J. D. Hancock, K. C. Behnke, and C. R. Stark. 1995.Effects of mill type and particle size uniformity on growth perfor-mance, nutrient digestibility, and stomach morphology in finish-ing pigs. J. Anim. Sci. 73:2564–2574.
Zahn, J. A., J. L. Hatfield, Y. S. Do, A. A. DiSpirito, D. A. Laird,and R. L. Pfeiffer. 1997. Characterization of volatile organicemissions and wastes from a swine production facility. J. Envi-ron. Qual. 26:1687–1696.
Zyla, K., D. R. Ledoux, M. Kujawski, and T. L. Veum. 1996. Theefficacy of an enzymatic cocktail and a fungal mycelium in depho-sphorylating corn-soybean meal-based feeds fed to growing tur-keys. Poult. Sci. 75:381–387.
Zyla, K., J. Koreleski., and S. Swiatkiewicz. 1997. Simultaneous appli-cation of phytase and xylanase to broiler feeds based on wheat.Pages 474–476 in Preliminary in vitro studies and feeding trial.Proc. 11th Eur. Symp. Poultr. Nutr., World’s Poultr. Sci. Assoc.,Beekbergen, The Netherlands.

Postmodernism for Animal Scientists1
K. K. Schillo*2 and P. B. Thompson†
*Department of Animal Sciences, University of Kentucky, Lexington 40546-0215and †Department of Philosophy, Purdue University, West Lafayette, IN 47907
ABSTRACT: Many scientists regard the term “post-modernism” as controversial. Because postmodern the-orists question whether science can be objective, somescientists view postmodernism as anti-scientific. In thispaper, we argue that traditional accounts of sciencedeveloped during the modern era (16th, 17th and 18thcenturies) are still influential in animal science, butare no longer plausible. In particular, the view thatscience automatically leads to human bettermentseems to be disingenuous. A postmodern view that por-trays science as a political activity seems more plausi-ble, and offers a means to better understand conten-tious policy issues that involve science. Although mostanimal scientists accept the view that theory selection,experimental designs, and technology development re-quire value-laden judgments, most fail to recognize thatsuch values may be politically motivated and embrace
Key Words: Politics, Research, Scientists, Society
2002 American Society of Animal Science. All rights reserved. J. Anim. Sci. 80(E. Suppl. 2):E189–E194
Introduction
In a recent article published in The Nation, columnistWin McCormack notes that during the past 20 years,“American conservative intellectuals” have launched anattack on postmodernism (McCormack, 2001). For exam-ple, in Telling the Truth, Lynne Cheney asserts that theviews of postmodernists such as Michel Foucault are“nothing less than an assault on Western Civilization”(Cheney, 1995). Overall, these critics portray postmod-ernism as an attempt to undermine traditional values
1This paper was presented at a symposium titled “Bioethics inAnimal Science” during the 2001 joint meeting of the American DairyScience Association, American Meat Science Association, AmericanSociety of Animal Science and Poultry Science Association. The sym-posium was developed by WCC 204 Regional Committee on animalBioethics and was sponsored by Elanco Animal Health. Publishedwith the approval of the Director of the Kentucky Agricultural Experi-ment Station as publication number 02-07-176.
2Correspondence: 807 Garrigus Building (Telephone: 859-257-7512; Fax: 859-257-3412; E-mail: [email protected]).
Received October 23, 2002.Accepted March 6, 2003.
E189
prevailing political structures. Postmodernists such asMichel Foucault argue that through the generation ofknowledge, scientific disciplines create a discourse thatserves to maintain a particular social structure thathas political implications. Viewed in this way, it be-comes clear how various interest groups can be criticalof certain scientific programs. For example, groups thatoppose research dealing with cloning, genetically modi-fied organisms, and intensive livestock production maynot be as much opposed to science as they are to thepolitical interests served by this science. In other words,such groups view these research agendas as promotingpolicies that place them at risk. Such a postmodernaccount of science, may help animal scientists betterunderstand the nature of contentious issues, and pro-vide a basis for reforming the animal science disciplinein ways that make it more responsive to the diverseinterests of a pluralistic society.
such as truth and objectivity and portray postmodernismas a doctrine of left-leaning academics. Gross and Leavitt(1994) embrace this view and suggest that postmodernperspectives are perpetuated in liberal arts programsand foster anti-science attitudes.
Recent protests against cloning, intensive livestockproduction and genetically modified organisms seem tosuggest that there may truly be a growing mistrust ofscience (Borlaug, 2000). Is postmodernism a political ide-ology of “tenured radicals” who wish to promote theirown political agendas, or is postmodernism a theory thatoffers new insights into understanding our culturallydiverse society? In this paper, we portray postmodernismas a perspective that addresses important shortcomingsof traditional, modernistic accounts of science. In addi-tion, we argue that a postmodern perspective offers ameans to enhance our understanding of the contentiousmoral issues that animal scientists encounter and offersuggestions for reforming animal science in ways thatembrace postmodern dialectics.
What is Postmodernism?
For anyone who grew up between 1900 and 1975, theword “modern” meant “new,” “recent,” and “up-to-date,”

Schillo and ThompsonE190
and of course it is still used that way in many situations.So to hear people speak about “postmodernism,” or tohear that the modern period is over is a little like hearingyour children or grandchildren talk about The Beatlesas “old school.” In fact historians have long used theterms “modern” and “modernity” to describe a historicalperiod that begins in about 1650, coinciding with the riseof modern science, and that ends in the mid-19th century.We can derive some comfort from the fact that “postmod-ernism” is then just a term that describes all historicalperiods after 1850, which makes all of us “postmodern-ists,” including The Beatles. These terms for historicalperiods are pretty confusing, however. “Modern art,” isgenerally thought to begin around 1880, and “modernarchitecture” refers to the “form follows function” schoolof thought that began in the 1930’s, gave us rectangularglass boxes for urban skylines in the 1960’s and, ac-cording to geographer David Harvey (1989), becamepasse in 1972.
However we define the dates for modernity, the term“postmodern” only comes to be widely used after Harvey’sendpoint of 1972. What it conveys is that the drivingideas behind modernity have played out, that we havecome to recognize that they have played out, and thatsomething new or at least different has or should taketheir place. Thus, if postmodernism has any relevancefor animal science, it is likely to be in the way that somedriving idea characteristic of modernism has played outand in our recognition that it is time to look for somethingdifferent. As noted already, modernism is associated withthe rise of science. Some key ideas associated with therise of science that no longer seem plausible or true havebeen and to some extent still are, we contend, influentialin animal science departments.
In our view, the belief that science would automaticallylead to human betterment best characterizes modernism.It is exactly this view that is expressed by the foundersof modern thought. For example, as noted by Merchant(1989), in Francis Bacon’s New Atlantis a scientist isportrayed as a priest who “had the power of absolvingall human misery through science.” It is this view thatis challenged by postmodern thought.
It is important to make clear that postmodernism isnot committed to the claim that science does not or cannot lead to improvement of the human condition. Thereare a few people who believe that, but they would bebetter characterized as “anti-modernists” than as post-modernists. For us, what is false about modernism cen-ters on the automatic or inexorable connection betweenscience and human betterment.
We still hear echoes of simple-minded modernism frompeople who tell us that pollution, industrial accidents,destruction of communities or natural areas, maldistri-butions of wealth and poverty that follow industrializa-tion are “just progress.” Perhaps more common is aslightly more sophisticated modernism that views suchaffronts as “costs” that are offset by the many obviousbeneficial changes that have been brought about by de-velopments in science and technology. In fact, a cost-
benefit analysis of technology has been advocated by sev-eral animal scientists (Schillo, 1999). It seems fair tosuggest that many animal scientists recognize the posi-tive and negative aspects of science and technology andtherefore have taken the first step toward postmodern-ism.
Although many animals scientists might understandthat science can have both beneficial and harmful effects,it appears reasonable to assume that most animal scien-tists lack a sophisticated understanding of how this canbe the case. We view such insight as pivotal in helpinganimal scientists cope with and address the numerouscontentious issues arising in livestock production. Withthis in mind, we discuss how postmodernism can illumi-nate how science can both help and harm people anddemonstrate how postmodern ideas might help us copewith contentious issues in animal science.
The Political Nature of Animal Science
Michel Foucault is one of several French philosopherswhose ideas contributed greatly to postmodern perspec-tives (Rabinow, 1984). His views concerning knowledge,power and the state seem particularly useful for under-standing the political dimensions of animal science. Fou-cault’s ideas were developed from historical analyses ofevents that occurred during the transition from the medi-eval to the modern era. Foucault noted that one of thechanges that characterized the modern state is its focuson preservation of the state through the growth and careof its populace (Rabinow, 1984). In order to do this, vari-ous state-sponsored institutions develop to support so-cial/political structures that perpetuate the interests ofthe state. From these structures arise various scientificdisciplines that generate knowledge that reinforces thesestructures. Therefore, power and knowledge are insepa-rable and there is no certainty or understanding that isexternal to history and society. Foucault portrays politi-cal struggle as battles between competing worldviewsthat emphasize different power relationships.
One of the most important features of Foucault’s analy-sis is the “objectification” of individual subjects in society(Rabinow, 1984). In other words, how individuals aredefined and categorized in ways that serve the state; howindividuals become the objects of state concern. Objecti-fication occurs in three ways. First, humans are objecti-fied by “dividing practices;” Procedures that assign socialidentities to individuals (insane, poor, senile, homosex-ual, laborer, farmer, etc.). Second, “scientific classifica-tion” of individuals serves as the basis for various disci-plines that study and gather knowledge about the popu-lation. For example, objectification of those who farmserves as the basis for agricultural sciences, whereasobjectification of those who eat gives rise to the disci-plines of food science and nutrition. Third, “subjectifica-tion” involves the process by which individuals definethemselves in society. Although this is understood to bea process of self-formation, involving “operations” on ourown “bodies, thoughts and conduct,” it is not immune

Postmodernism E191
from influence by the prevailing social norms and expec-tations.
Objectification of individuals serves as the foundationfor systems of knowledge that provide data or statisticsthat reinforce existing social structures (Rabinow, 1984).The disciplines that generate this knowledge require var-ious institutional technologies to support their work; e.g.,schools, prisons, laboratories, etc. Such technologies sup-port knowledge development, as well as a process called“normalization.” Normalization involves categorizing hu-mans in finely graded and measurable intervals arounda norm. Those individuals who fall too far away from thenorm are classified as “anomalies” of the social body andare isolated and normalized through various normalizingand/or corrective technologies. Examples of normalizingtechnologies include prisons, hospitals for the mentallyill, and schools.
Foucault’s analysis seems applicable to the disciplineof animal science. Dividing practices support the organi-zation of people into classes that produce, process, mar-ket and consume animal products. The animal sciencesdeveloped from this organization and a variety of institu-tional technologies now exist to sustain it (e.g., collegesof agriculture, government agencies, agribusiness). Theknowledge produced by animal scientists is heavily in-fluenced by, if not solely based on, this structure and theparticular historical events that shaped it.
It is beyond the scope of this paper to discuss the detailsof how the discipline of animal science evolved, or todescribe and critically analyze the particular power rela-tionships it supports. Our goal here is to illuminate thepolitical dimensions of scientific disciplines in order torefute the modern notion that science automatically ben-efits all humans. Foucault’s realization that sciencearises from and reinforces a particular social structurecharacterized by particular power relationships illumi-nates how science can benefit some groups and harmothers. In light of Foucault’s analysis, it seems appro-priate for animal scientists to ask: Whose world viewdoes their work support? What power relationships doestheir knowledge perpetuate? Who benefits and who suf-fers in these relationships?
Animal Science and a ChangingPolitical Landscape
The traditional goal of animal science has been to de-velop technologies to address the technical problems oflivestock production. In spite of geographic variations inagricultural conditions throughout the United States, theanimal science discipline has been enormously successfulin addressing many of the major problems facing live-stock producers. When the animal science discipline wasestablished during the early part of the 20th century,the majority (65%) of people living in rural areas farmed,and the lives of those who did not farm were directlyinfluenced by agriculture (Hart, 1995). Under these con-ditions, technologies that improved production practiceswere viewed as beneficial and were therefore well re-
ceived and adopted with little resistance. Today, only6.3% of the rural population live on farms (1.6% of thetotal population). Although the nation is still dependenton the goods and services produced in rural areas, theseareas are no longer viewed strictly as agricultural re-gions. Today, rural areas are considered to be areas forpreservation, recreation and development as well as forfarming. Therefore, rural and nonrural people havevested interests in how rural areas are managed. In thissense, rural America can be viewed as an “essential com-ponent of urban society” (Castle, 1995).
Demographic changes in rural regions pose difficultchallenges to the animal science profession. The fact thatthere are so few farmers may mean the traditional em-phasis on the technical problems encountered by full-time livestock producers may not seem relevant to themajority of citizens. Moreover continued investment indevelopment of technologies designed to enhance effi-ciency of livestock production may have little direct im-pact on the quality of life in rural communities. It maybe that rural people, including farmers, require morehelp dealing with complex social, political, legal and eco-nomic problems than with technical aspects of livestockproduction. In addition, the existence of an urban middleclass that has income to spend on enjoying the “naturalamenities” of rural areas adds another dimension to is-sues faced by rural communities (Castle, 1995). Thegrowing interest in preserving natural environments forrecreation creates tension with those who use these re-gions for traditional agricultural practices. The politicalupshot of all these changes is that the animal sciencesmay be out of step with existing social structure and itsaccompanying issues. Such a view may be the basis forrecent discussions concerning the future relevance ofLand Grant Colleges of Agriculture (Kunkel, 2000).
Animal science faculties are generally aware of chang-ing political environment in society. This change is re-flected in their student bodies and in the university envi-ronments. Students are increasingly likely to be skepticalabout traditional attitudes toward animals and agricul-ture alike, with many animal science departments expe-riencing an increase in majors who espouse vegetarianideals and aspire to become animal protectionists andsmall animal veterinarians (Cheeke, 1999). Within thelarger university, there has been a growing trend tostress racial and gender equality and representation inclassrooms, often coupled with criticisms of the sciencesas reflecting male-dominated values. Gross and Levitt(1994) argued that these trends reflect a growing liberal-ism especially within liberal arts department, and arguethat the anti-science attitudes associated with thesevalue perspectives. Thompson (2001) documents severalauthors who interpret contentious issues in animal agri-culture as symptoms of a growing rift between left andright.
As Gross and Levitt (1994) interpret the situation,those holding liberal views are likely to be more skepticalabout science and about its ability to deliver social bene-fits. They are more likely to disbelieve scientific evidence,

Schillo and ThompsonE192
and more likely to substitute emotion and value judg-ments for scientific evidence. However, a recent empiricalstudy by Trachtman and Perruci (2000) finds no supportfor Gross and Levitt’s view. Trachtman and Perucci stud-ied a number of groups across the political spectrum,including environmentalists, feminists, political conser-vatives and religious fundamentalists. In each case, thesegroups tended to distrust scientific findings that ran con-trary to specific political interests. Thus, environmental-ists distrusted science that failed to support strongerenvironmental protection, while fundamentalists dis-trusted science that failed to support the teaching ofcreation doctrines. However, all groups expressed contin-ued confidence in science in areas other than their specificpolitical interest.
The Trachtman and Perruci finding supports a generalanalysis offered by Ulrich Beck (1992,1997). Beck (1992,1997) argues that the political upshot of skepticism aboutscience will not be anti-science, but what he calls “riskpolitics,” the organization of political activism aroundfairly specific issues rather than the class interests orpolitical ideologies of the past. This suggests that we areentering a truly postmodern era, rather than merely anextension of left/right, cold-war political orientations. Ifso it is inappropriate to interpret changing student atti-tudes, university politics or any other sector of societyas evidence of either growing liberalism or deeply rootedanti-science attitudes. It is certainly true that attitudesare changing, but what is happening is a decline in theinfluence of sweeping generalizations of all kinds—bothleft and right, both modernist and anti-modernist—inframing opinions and attitudes. One implication of thischange in attitude is that unless animal scientists aligntheir perspectives with those of a postmodern era, animalscience may find it increasingly difficult to understand,let alone accommodate, the interests of a pluralistic soci-ety. Cheeke (1999) suggests that this already may bethe case and argues that one of the causes of shrinkingmembership in the American Society of Animal Scienceis that the interests of this profession may be too narrowto be considered relevant in greater society.
Postmodern Reform of Animal Science
The types of demographic changes cited above havehelped create a political landscape where diverse interestgroups call on scientists to become more responsive to avariety of contentious issues. There is little doubt thatsuch conditions place scientists in an uncomfortable posi-tion. For the most part, animal scientists appear to bestubbornly reluctant to engage in debate regarding avariety of contentious issues related to animal agricul-ture (Cheeke, 1999). Growing tension between scientistsand groups who question the authority of science maybe attributed to a disparity between the perspectives ofscience held by scientists and those held these othergroups. For example, animal scientists may view theirwork in terms of benefiting human beings, whereas othergroups may view research in this field as pandering to
the interests of dominant groups (Cheeke, 1999). As Fou-cault’s analysis suggests, these conflicts between scien-tists and critics of science amount to a battle of ideasabout how the world should be organized, and whatpower relationships should exist.
Reforming animal science to bridge this ideologicalgap will create its own amount of discomfort for animalscientists. Nevertheless, there appear to be several goodreasons for doing so. Cheeke (1999) offers a very practicalreason; the fate of the animal science discipline mayhinge on whether or not it can broaden its perspective ofanimal agriculture and engage in discussions regardinghow the concerns of a diverse populace can be addressed.
Schillo (1998) offers ethical and epistemological rea-sons for incorporating more diverse views into the animalscience discipline. First, disciplines that ignore the per-spectives of certain groups contribute to the perpetuationof attitudes, technologies and/or policies that subject suchgroups to various risks. There is little doubt that animalscience research has contributed greatly to improvingthe lives of rural and nonrural people. However, thereis also little doubt that their work has contributed to thechanging structure of society (e.g., urbanization), andthat people have suffered as a result of these changes.Second, excluding diverse perspectives may lead to in-complete understandings of complex research problems.Animal science research will become much more compli-cated as animal agriculture becomes more globalized.Variations in cultural and physical geography will makeit extremely difficult to develop research programs thatare universally applicable. If animal scientists are todevelop globally relevant research programs they willhave to collaborate with those who have understandingof the wide variety of contexts in which animal agricul-ture is practiced.
How should animal science be reformed? To answerthis question, we focus on broad structural changes thatare intended to involve animal scientists in open criticalanalysis of various policy issues affecting animal agricul-ture. We suggest two areas on which to focus: 1) recon-structing animal scientists’ perspectives regarding sci-ence praxis and 2) developing an ethic that is consistentwith this view.
The view that science is inexorably linked with humanbetterment appears to have been thoroughly refuted byvarious scholars. Moreover, the willingness of interestgroups to question scientific research programs suggeststhat a significant portion of the public reject the ideathat all science results in improvement of the humancondition. In support of this latter claim, Bauer (1994)argues that although the public is generally unfamiliarwith particular scientific facts and concepts, it has a goodunderstanding of how social and political interests deter-mine which research programs are pursued. Althoughextensive work has demonstrated that modern accountsof science are no longer plausible, there has been littlediscussion regarding how science should be framed ina postmodern era. Ihde (1998) recently addressed thisquestion by suggesting that the field of hermeneutics

Postmodernism E193
(i.e., interpretive activity) offers useful postmodern in-sights into the practice of science. Ihde notes that duringthe past 500 years science has become “techno-science”—science that is dependent on the use of technology toprocure data. Today, scientists rarely rely on direct obser-vations of their subject matter. Scientific experimentstypically involve a variety of instruments and techniquesto produce visual images of the things under study. Theseimages, like the texts of ancient documents, requiretranslation and interpretation. Ihde portrays this prac-tice as a “perceptualistic hermeneutics” A vision-basedsystem for interpreting the phenomena of nature.
Framing science as having a strong hermeneutic com-ponent addresses postmodern criticisms of modernisticaccounts of science. Specifically, viewing science as her-meneutic is compatible with the view that science canbe political. The phenomena scientists choose to study,the technologies they employ to study these phenomenaand how the images produced by these technologies areinterpreted are influenced by their experiences in the lifeworld. In other words, scientific knowledge is embodiedknowledge; the observer (the scientist) and the observedare inseparable. What scientists see and how they inter-pret what they see is a function of previous life experi-ences and these visions and interpretations, in turn, de-termine which images scientists will pursue in subse-quent experiments as well as how new images will beinterpreted. The life experiences of scientists are affectedby such things as: race, gender, class, personal interests,social interactions with colleagues, structure of institu-tions in which they work, regulations governing researchactivities, social norms, public policies, and funding op-portunities. Each of these factors plays a role in Fou-cault’s objectification, and shape the manner in which ascientist functions in society. Because of normalization,there is pressure on scientists to restrict their activitiesto those that are most consistent with power relation-ships that support their work.
Ihde’s analysis offers some useful insights into thevarious contentious issues surrounding animal science.As noted earlier, recent protests against various scientificenterprises, represent complaints about what science isfocusing on more so than a rejection of science as a systemof knowledge. According to Ihde’s perspective, such pro-tests can be understood as complaints about how thetechnologies of science are employed as well as the inter-pretation of the images produced by such technologies.It seems that scientists have become the subjects of criti-cism, not because they practice science, but because theirperspectives and research programs are too narrowlyfocused to suit the broader interests of a pluralistic soci-ety. Recent disagreements concerning the use of bST indairy cattle may be understood in this way. Whereas thescientists who developed this product may view applica-tion of this technology as a means to enhance profitabilityof milk production, others, with vastly different life expe-riences and perspectives, may view use of the productas perpetuating the demise of small farms, rural commu-nities and dairy products. The disagreement over the use
of bST in dairy cattle has less to do with whether or notthe hormone increased milk production than with thepolitical implications of its use. Assessment of technologyhas traditionally focused on whether it works, or whetherit is safe. A postmodern world may require that we alsoassess the political implications of technology.
Viewing animal science as an interpretive activityopens the door for reforming animal science in a postmod-ern framework. As indicated above, risk appears the dom-inant concern underlying recent protests concerning vari-ous policies and practices in animal agriculture. Resolu-tions of such issues require value judgments, and suchjudgments require not only scientific data, but also con-textual information that frames risk in terms of the inter-ests of those who could be affected by the technology(Thompson, 1999). Scientists do not usually consider thistype of knowledge when they interpret results of experi-ments or when they develop or assess technology. Ihde’shermeneutic framing of science is compatible with en-hancing interactions between scientists and those whodeal with other types of knowledge that may be requiredto make informed judgments about the risks of technolog-ies. Portraying science as a deeply interpretive activityplaces science on a level similar to other intellectualactivities, and serves to erode the science/nonscience di-chotomy that tends to isolate the scientific communityfrom other academic disciplines as well as nonacademicgroups. Such interactions can encourage a collective un-derstanding of issues and help scientists avoid the typesof criticisms levied against research on bST.
Although framing animal science in a postmodern waymay provide some incentive for changing the discipline,this alone will not lead to its transformation. In order toeffect change, the animal science community should en-act programs designed to change the way it operates. Theincentive for developing such programs is a professionalethic that reflects the current political landscape (Thomp-son, 1999). The specific codes of conduct comprising suchan ethic should evolve from a collective understandingthat consists of more than just the views of animal scien-tists, livestock producers and livestock industry repre-sentatives. To begin this process, Thompson (1999) sug-gests that the animal science profession should initiateefforts that encourage various groups to engage in theprocess of deconstruction; A process whereby a commu-nity analyzes an existing perspective for the purpose ofilluminating the implications of this perspective to thecommunity. This can be accomplished by inviting thepublic to engage in discussion and debate with the goalof developing a collective understanding of animal agri-culture. From such an understanding, a new perspectiveof animal agriculture can be reconstructed, and the ani-mal science community can develop codes of conduct thatare compatible with this view.
Conclusions
John Irving’s novel, The Cider House Rules, is a studyof conflict between ideals and real life. The setting of the
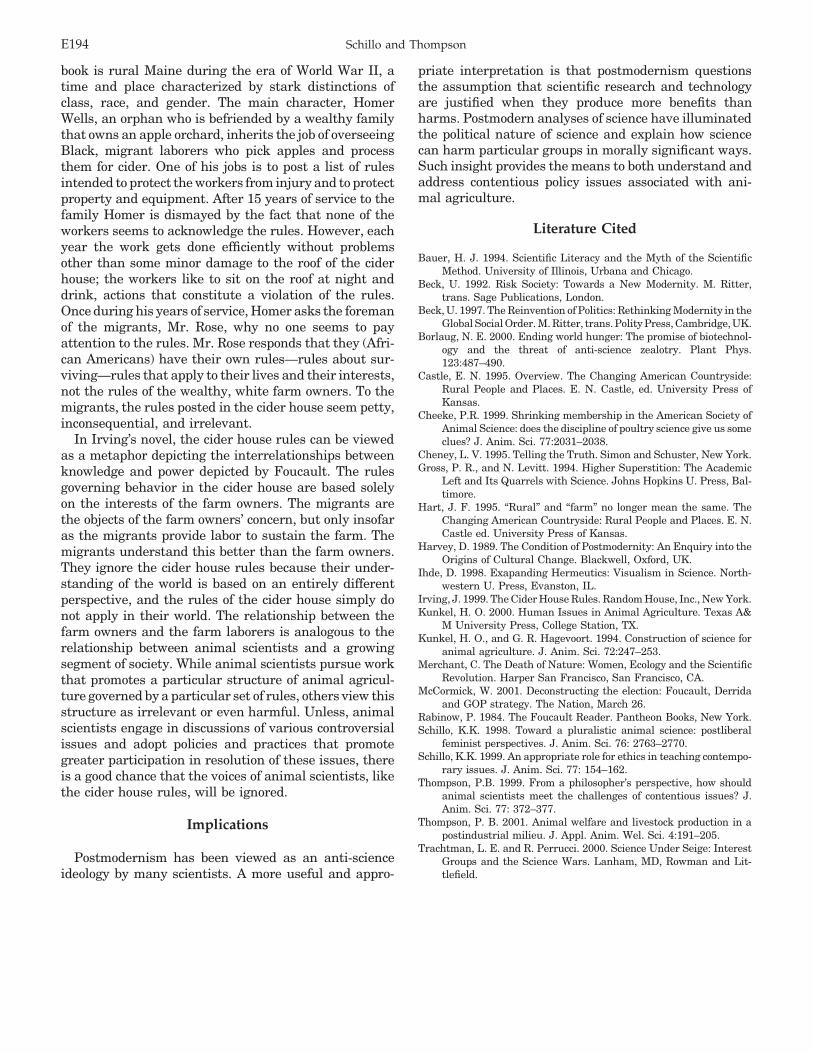
Schillo and ThompsonE194
book is rural Maine during the era of World War II, atime and place characterized by stark distinctions ofclass, race, and gender. The main character, HomerWells, an orphan who is befriended by a wealthy familythat owns an apple orchard, inherits the job of overseeingBlack, migrant laborers who pick apples and processthem for cider. One of his jobs is to post a list of rulesintended to protect the workers from injury and to protectproperty and equipment. After 15 years of service to thefamily Homer is dismayed by the fact that none of theworkers seems to acknowledge the rules. However, eachyear the work gets done efficiently without problemsother than some minor damage to the roof of the ciderhouse; the workers like to sit on the roof at night anddrink, actions that constitute a violation of the rules.Once during his years of service, Homer asks the foremanof the migrants, Mr. Rose, why no one seems to payattention to the rules. Mr. Rose responds that they (Afri-can Americans) have their own rules—rules about sur-viving—rules that apply to their lives and their interests,not the rules of the wealthy, white farm owners. To themigrants, the rules posted in the cider house seem petty,inconsequential, and irrelevant.
In Irving’s novel, the cider house rules can be viewedas a metaphor depicting the interrelationships betweenknowledge and power depicted by Foucault. The rulesgoverning behavior in the cider house are based solelyon the interests of the farm owners. The migrants arethe objects of the farm owners’ concern, but only insofaras the migrants provide labor to sustain the farm. Themigrants understand this better than the farm owners.They ignore the cider house rules because their under-standing of the world is based on an entirely differentperspective, and the rules of the cider house simply donot apply in their world. The relationship between thefarm owners and the farm laborers is analogous to therelationship between animal scientists and a growingsegment of society. While animal scientists pursue workthat promotes a particular structure of animal agricul-ture governed by a particular set of rules, others view thisstructure as irrelevant or even harmful. Unless, animalscientists engage in discussions of various controversialissues and adopt policies and practices that promotegreater participation in resolution of these issues, thereis a good chance that the voices of animal scientists, likethe cider house rules, will be ignored.
Implications
Postmodernism has been viewed as an anti-scienceideology by many scientists. A more useful and appro-
priate interpretation is that postmodernism questionsthe assumption that scientific research and technologyare justified when they produce more benefits thanharms. Postmodern analyses of science have illuminatedthe political nature of science and explain how sciencecan harm particular groups in morally significant ways.Such insight provides the means to both understand andaddress contentious policy issues associated with ani-mal agriculture.
Literature Cited
Bauer, H. J. 1994. Scientific Literacy and the Myth of the ScientificMethod. University of Illinois, Urbana and Chicago.
Beck, U. 1992. Risk Society: Towards a New Modernity. M. Ritter,trans. Sage Publications, London.
Beck, U. 1997. The Reinvention of Politics: Rethinking Modernity in theGlobal Social Order. M. Ritter, trans. Polity Press, Cambridge,UK.
Borlaug, N. E. 2000. Ending world hunger: The promise of biotechnol-ogy and the threat of anti-science zealotry. Plant Phys.123:487–490.
Castle, E. N. 1995. Overview. The Changing American Countryside:Rural People and Places. E. N. Castle, ed. University Press ofKansas.
Cheeke, P.R. 1999. Shrinking membership in the American Society ofAnimal Science: does the discipline of poultry science give us someclues? J. Anim. Sci. 77:2031–2038.
Cheney, L. V. 1995. Telling the Truth. Simon and Schuster, New York.Gross, P. R., and N. Levitt. 1994. Higher Superstition: The Academic
Left and Its Quarrels with Science. Johns Hopkins U. Press, Bal-timore.
Hart, J. F. 1995. “Rural” and “farm” no longer mean the same. TheChanging American Countryside: Rural People and Places. E. N.Castle ed. University Press of Kansas.
Harvey, D. 1989. The Condition of Postmodernity: An Enquiry into theOrigins of Cultural Change. Blackwell, Oxford, UK.
Ihde, D. 1998. Exapanding Hermeutics: Visualism in Science. North-western U. Press, Evanston, IL.
Irving, J. 1999. The Cider House Rules. Random House, Inc., New York.Kunkel, H. O. 2000. Human Issues in Animal Agriculture. Texas A&
M University Press, College Station, TX.Kunkel, H. O., and G. R. Hagevoort. 1994. Construction of science for
animal agriculture. J. Anim. Sci. 72:247–253.Merchant, C. The Death of Nature: Women, Ecology and the Scientific
Revolution. Harper San Francisco, San Francisco, CA.McCormick, W. 2001. Deconstructing the election: Foucault, Derrida
and GOP strategy. The Nation, March 26.Rabinow, P. 1984. The Foucault Reader. Pantheon Books, New York.Schillo, K.K. 1998. Toward a pluralistic animal science: postliberal
feminist perspectives. J. Anim. Sci. 76: 2763–2770.Schillo, K.K. 1999. An appropriate role for ethics in teaching contempo-
rary issues. J. Anim. Sci. 77: 154–162.Thompson, P.B. 1999. From a philosopher’s perspective, how should
animal scientists meet the challenges of contentious issues? J.Anim. Sci. 77: 372–377.
Thompson, P. B. 2001. Animal welfare and livestock production in apostindustrial milieu. J. Appl. Anim. Wel. Sci. 4:191–205.
Trachtman, L. E. and R. Perrucci. 2000. Science Under Seige: InterestGroups and the Science Wars. Lanham, MD, Rowman and Lit-tlefield.