the history of punjab is replete with its ... - idc india
TRANSCRIPT

COALITION POLITICS IN PUNJAB*
PRAMOD KUMAR
The history of Punjab is replete with its political parties entering into mergers, post-election coalitions and pre-election alliances. Pre-election electoral alliances are a more recent phenomenon, occasional seat adjustments, notwithstanding. While the mergers have been with parties offering a competing support base (Congress and Akalis) the post-election coalition and pre-election alliance have been among parties drawing upon sectional interests. As such there have been two main groupings. One led by the Congress, partnered by the communists, and the other consisting of the Shiromani Akali Dal (SAD) and Bharatiya Janata Party (BJP). The Bahujan Samaj Party (BSP) has moulded itself to joining any grouping as per its needs. Fringe groups that sprout from time to time, position themselves vis-à-vis the main groups to play the spoiler’s role in the elections.
These groups are formed around common minimum programmes which have been used mainly to defend the alliances rather than nurture the ideological basis. For instance, the BJP, in alliance with the Akali Dal, finds it difficult to make the Anti-Terrorist Act, POTA, a main election issue, since the Akalis had been at the receiving end of state repression in the early ‘90s. The Akalis, in alliance with the BJP, cannot revive their anti-Centre political plank. And the Congress finds it difficult to talk about economic liberalisation, as it has to take into account the sensitivities of its main ally, the CPI, which has campaigned against the WTO regime. The implications of this situation can be better understood by recalling the politics that has led to these alliances.
These contexts can be understood in the backdrop of nation-building projects in their interaction with Punjab’s political; economic and cultural specificities. This interaction has shaped and nurtured regional aspirations and political and electoral articulations. This can be categorised around three axes. Historically, Punjab has a culture and language which transcends religious group boundaries, unified politico-administrative unit and has promoted a modern culture which has
* Sponsored by: University of Pennsylvania Institute for the Advanced Study of India
(UPIASI), New Delhi And Ford Foundation, New Delhi.

44
initiated the integration process of diverse religious, caste and other ascriptive group identities. Inspite of the process of formulation and reformulation of the composite linguistic cultural consciousness, the tendency to evolve a unified sub-nationality with a common political goal remained weak in Punjab. This, in a way, provided sufficient space for a competitive multi-party system and emergence of coalition politics.
‘Dwarfed’ Identity Assertions
The state and its interaction with the structural conditions dwarfed, the articulations of a secular Punjabi identity and assertions of communal groups and distinct religious identities. All these identities co-existed.1 To illustrate, linguistic and regional issues were articulated within the communal frame, the most obvious examples, of this were the Hindi agitation, the Punjabi suba movement in the pre-reorganisation phase and Khalistan assertions in the mid-eighties. At the same time, a secular Punjabi identity also coexisted. For example, an estimated 47 per cent of the Punjabi Hindus, according to the 1971 census, mentioned their mother tongue to be Punjabi, even though the language question had got communalised and in 1991 it increased to 84 per cent2. The adoption of the Moga Declaration by the SAD and the BJP emphasising Punjab, Punjabi and Punjabiat is a testimony to this fact.3
Minority-Majority Persecution Complex
The second axis emerges out of the peculiar demographic composition which has provided space for this co-existence of competing identities. Of the three religious groups i.e. the Hindus, the Muslims and the Sikhs, as per the 1931 census, the Sikhs were in a minority. No doubt, the percentage share of the Hindus was 28, as compared to the Muslims 56 and the Sikhs 134. This configuration provided a conducive ground to coalition politics in the state as all religious groups considered themselves to be in a minority.5
To illustrate, in 1937 the Akali Dal fought the elections in alliance with the Congress on Congress-cum-Akal ticket. In the Legislative Assembly they shared seats with the Congress and their representative became the Leader of the Opposition. In 1942, difference arose between the parties on the issue of supporting the war. The Congress was opposed

45
to participation in the war. The Akali Dal decided on the contrary as they argued it would adversely affect the interests of the Sikhs in the Army. Consequently, a pact was signed between the Muslim League and the SAD and the Akali Dal representative, S. Baldev Singh, joined the Cabinet.
At the time of partition, the migration of population made a significant impact on the future course of political, economic and social events. The Sikh population increased from 13 per cent to 33 per cent and the Hindu population from 28 per cent to 64 per cent as per the 1961 census. During this period Punjab was divided in two regions i.e. Punjabi speaking and Hindi speaking. In eight of the 12 Punjabi speaking districts, the Sikhs were in a majority.6
Further with the reorganisation of the state in the mid-sixties, the Sikhs constituted a majority with 60 per cent and the Hindus were 37 per cent7. This introduced a situation as both the Hindus and the Sikhs continued to suffer from the minority persecution complex but with a difference.
Interestingly, the Hindus suffered from a majority-minority complex as they perceived themselves to the majority in India and a minority in the reorganised Punjab. Similarly the Sikhs perceived to have a minority-majority complex as they were majority in Punjab and minority in India. This complex was not based merely on numbers, but their involvement in diverse occupations provided the basis for interest articulation in secular spheres on religious group lines.
Caste-Religious and Class Axis
The third important aspect was the interaction of caste with politics within the broad boundary conditions reformulated by religious reform movements. Punjab has been known for its liberal ritualistic religious practices in relation to caste. Both Sikhism and the Arya Samaj liberated the Dalits from the stringent purity-pollution based behavioural patterns. This can be termed as regionalisation of caste. For example, the dalits, as per the 2001 census, constitute nearly 29 per cent of the total population of the state, perhaps the highest in the country8. A unique regional feature is that the dalits are sharing the common cultural reservoir to acquire social parity without getting assimilated into the hierarchical system9. This has provided them with a greater

46
political and social bargaining capacity without becoming hostage to a particular dalit party. Therefore, it would be appropriate to see the relationship of these axes with party dynamics and coalition politics.
Interface of ‘Axes’ with Party Dynamics
These characteristic features have shaped the politics of the state, whereby caste has yet to become an idiom of politics, and religious, linguistic and regional identities have got so much intermeshed that none of these parameters have emerged as an exclusive factor in electoral mobilisations and coalitions. A perusal of background of elected representatives and core support base shows that the major political parties represent the diversity despite changing political context since mid-sixties. For example, the Sikh majority was clearly reflected as nearly 70 per cent of Legislators belonged to this religion. However, the number of Sikh Legislators had been more than the average in 1969 (76 per cent), 1977 (74 per cent) and 1997 (74 per cent). In these elections the Akali Dal emerged as a majority party and formed the government. In contrast in 1992, the Akali Dal boycotted the elections and number of Sikh Legislators decreased to its lowest of 58 per cent. Of the total legislatures elected on the Akali Dal ticket, 97 per cent belonged to the Sikh religion. Its coalition partner the BJP averages 88 per cent in all the elections from the Hindu religion.
The Congress party maintained a more healthier representation with 55 per cent the Sikhs and the remaining being the Hindus. In the Congress party the selection of the candidates remained fluid in response to the political context. For instance, in 1985 the Congress returned to power with 69 per cent Hindus and in 1992, 62 per cent of the MLAs belonging to the Sikh community got elected on Congress ticket (the Akalis boycotted the elections).
The stunted dimension of caste politics in Punjab can be gauged from the fact that the BSP has almost equal number of its legislators from both the Hindus and the Sikhs.
The religious, caste and class dimensions are intermeshed, but the dominant formations are located in exclusive demographic spaces. For example, the Sikh-Jat-Peasant identity is predominantly rural and Hindus-Khatri-Trader is urban. The Akali Dal is dominated by the Sikh-Jat-Peasants and the BJP by the Hindu-Khatri-Traders. However, the
47
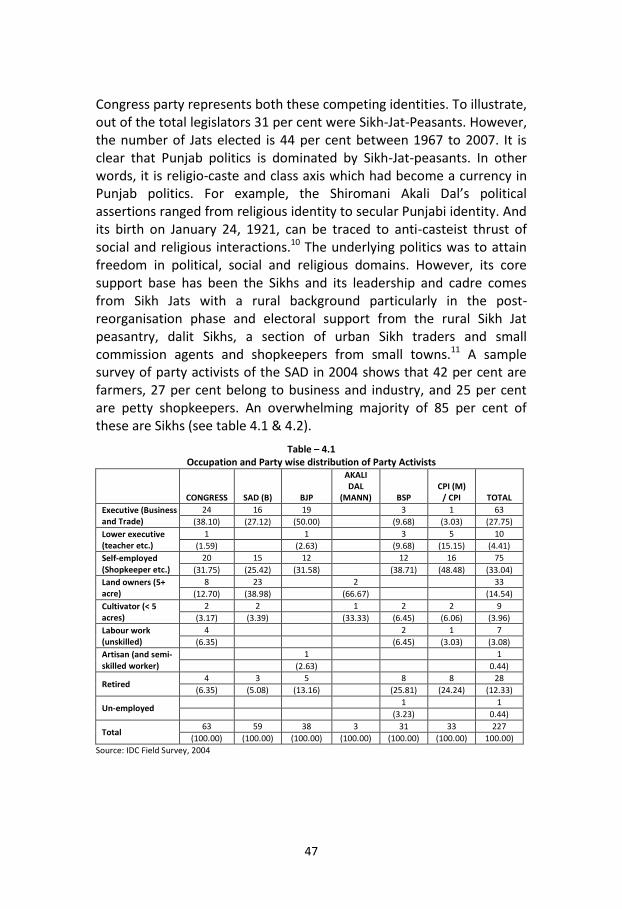
Congress party represents both these competing identities. To illustrate, out of the total legislators 31 per cent were Sikh-Jat-Peasants. However, the number of Jats elected is 44 per cent between 1967 to 2007. It is clear that Punjab politics is dominated by Sikh-Jat-peasants. In other words, it is religio-caste and class axis which had become a currency in Punjab politics. For example, the Shiromani Akali Dal’s political assertions ranged from religious identity to secular Punjabi identity. And its birth on January 24, 1921, can be traced to anti-casteist thrust of social and religious interactions.10 The underlying politics was to attain freedom in political, social and religious domains. However, its core support base has been the Sikhs and its leadership and cadre comes from Sikh Jats with a rural background particularly in the post-reorganisation phase and electoral support from the rural Sikh Jat peasantry, dalit Sikhs, a section of urban Sikh traders and small commission agents and shopkeepers from small towns.11 A sample survey of party activists of the SAD in 2004 shows that 42 per cent are farmers, 27 per cent belong to business and industry, and 25 per cent are petty shopkeepers. An overwhelming majority of 85 per cent of these are Sikhs (see table 4.1 & 4.2).
Table – 4.1 Occupation and Party wise distribution of Party Activists
CONGRESS SAD (B) BJP
AKALI DAL
(MANN) BSP CPI (M)
/ CPI TOTAL
Executive (Business and Trade)
24 16 19 3 1 63
(38.10) (27.12) (50.00) (9.68) (3.03) (27.75)
Lower executive (teacher etc.)
1 1 3 5 10
(1.59) (2.63) (9.68) (15.15) (4.41)
Self-employed (Shopkeeper etc.)
20 15 12 12 16 75
(31.75) (25.42) (31.58) (38.71) (48.48) (33.04)
Land owners (5+ acre)
8 23 2 33
(12.70) (38.98) (66.67) (14.54)
Cultivator (< 5 acres)
2 2 1 2 2 9
(3.17) (3.39) (33.33) (6.45) (6.06) (3.96)
Labour work (unskilled)
4 2 1 7
(6.35) (6.45) (3.03) (3.08)
Artisan (and semi-skilled worker)
1 1
(2.63) 0.44)
Retired 4 3 5 8 8 28
(6.35) (5.08) (13.16) (25.81) (24.24) (12.33)
Un-employed 1 1
(3.23) 0.44)
Total 63 59 38 3 31 33 227
(100.00) (100.00) (100.00) (100.00) (100.00) (100.00) 100.00)
Source: IDC Field Survey, 2004

48
Table – 4.2
Religion and Party wise distribution of Party Activists
CONGRESS SAD (B) BJP
AKALI DAL (MANN)
BSP CPI (M)
/ CPI TOTAL
Sikh 20 50 1 3 6 15 95
(31.75) (84.75) (2.63) (100.00) (19.35) (45.45) (41.85)
Hindu 42 9 36 25 18 130
(66.67) (15.25) (94.74) (80.65) (54.55) (57.27)
Christian 1 1 2
(1.59) (2.63 (0.88)
Total 63 59 38 3 31 33 227
(100.00) (100.00) (100.00) (100.00) (100.00) (100.00) (100.00)
Source: IDC Field Survey, 2004
An analysis of seats won by the SAD in all elections between 1967 and 2007 shows that it has a clear edge in 22 seats and a majority of these are predominantly rural (See map 1). A comparative analysis of the vote share shows that the Akali Dal has secured the maximum votes in rural constituencies i.e. 43 per cent in 1997 assembly elections and around 17 per cent in urban constituencies in 2007 assembly pre-election coalition phase (see table 4.3). As a consequence, it articulates the agrarian interests and appropriates Sikh religious symbols for blurring the emerging contradiction between the agrarian and other sectors of the economy. However, in the post-terrorism period, urban Hindu traders, in response to the pre-election alliance of the BJP based on Hindu-Sikh amity have shown preference for the Akali Dal. The Akalis urban vote share in 2007 increased to 17 per cent from 16 per cent in 1997 assembly elections in pre-election alliance with the BJP.
There have been qualitative shifts in the Akali support base. First shift took place at the time of reorganisation of Punjab coupled with green revolution, the rural Jat Sikhs constituted its main support and leadership also came from this section.12
Second shift to took place in the aftermath of Operation Blue Star and anti-Sikh riots in 1985. The Akalis urban vote revolved around 5 per cent but in 1985 it touched 12 per cent mark with the active support of urban Khatri Sikhs. (see table 4.3, 4.4 and 4.5)
Third shift took place after the resurgence of democracy in 1997, whereby a substantial number of urban Hindus supported the Akali Dal13. (See table 4.6,4.7,4.8 and 4.9)

49

50
Table – 4.3 Location wise Major Party and Year wise Vote Polled, Constituencies Contested and Won
BJS/ BJP CPI CPM INC SAD JP/JD BSP OTHERS
1997
Rural
1997 Won/ contested
4/6 2/9 0/17 7/62 53/62 0/10 1/41 3/155
Votes polled( %) 3.65 3.13 2.09 26.34 42.87 0.28 8.27 13.37
Semi-Urban 1997 Won/contested 9/9 0/5 0/8 4/32 19/26 0/10 0/18 3/112
Votes polled( %) 12.25 2.69 1.71 25.77 33.44 1.02 6.48 16.64
Urban 1997 Won/contested 5/7 0/1 / 3/11 3/4 0/8 0/8 1/72
Votes polled( %) 26.81 3.01 31.44 16.30 0.86 5.55 16.02
2002
Rural 2002 Won/contested 1/6 1/8 0/11 32/61 32/62 / 0/61 4/298
Votes polled( %) 2.76 2.22 0.45 34.63 35.99 6.26 17.69
Semi-Urban 2002 Won/contested 2/9 1/2 0/2 19/33 9/26 / 0/29 4/210
Votes polled( %) 8.16 1.86 0.27 35.46 27.16 4.65 22.45
Urban 2002 Won/contested 0/8 0/1 / 11/11 0/4 / 0/10 1/71
Votes polled( %) 18.41 2.75 46.51 8.57 5.52 18.25
2007
Rural 2007 Won/contested 5/6 0/15 0/8 25/70 35/64 / 0/69 5/336
Votes polled( %) 3.74 0.69 0.31 39.99 41.99 4.54 8.74
Semi-Urban 2007 Won/contested 7/9 0/9 0/5 17/35 11/26 / 0/35 0/235
Votes polled( %) 10.98 0.77 0.27 42.85 33.38 3.67 8.08
Urban 2007 Won/contested 7/8 0/1 0/1 2/12 3/4 / 0/12 0/95
Votes polled( %) 29.94 1.09 0.07 40.29 17.14 2.64 8.83
Source: Election Commission Reports Punjab, 1997-2007

51
Table – 4.4 Location wise Major Party and Year wise Vote Polled, Constituencies Contested and Won
Year of Election BJS/BJP CPI CPM INC SAD/ASD JP/JD BSP OTHERS
1967
Rural 1967 Won/contested /15 3/14 2/9 29/54 16/35 / / 6/182
Votes polled (%) 3.39 6.43 4.50 38.35 24.34 22.99
Semi-Urban 1967 Won/contested 2/25 1/4 1/3 19/38 8/24 / / 7/144
Votes polled (%) 12.10 3.16 2.02 37.80 19.74 25.18
Urban 1967 Won/contested 7/9 1/1 /1 /10 / / 2/34
Votes polled (%) 39.79 6.14 0.80 30.48 22.78
1969
Rural 1969 Won/contested 1/11 2/19 2/8 24/55 23/36 / / 4/117
Votes polled (%) 4.79 6.08 4.65 38.44 30.67 15.37
Semi-Urban 1969 Won/contested 5/11 1/8 0/2 9/38 19/27 / / 4/77
Votes polled (%) 9.56 2.81 1.47 39.63 33.23 13.28
Urban 1969 Won/contested 2/8 1/1 / 5/10 1/2 / / 1/41
Votes polled (%) 32.75 5.56 41.88 5.12 14.68
1972
Rural 1972 Won/contested 0/11 7/9 1/10 31/45 14/40 / / 3/121
Votes polled (%) 1.36 8.19 4.54 39.53 31.58 14.79
Semi-Urban 1972 Won/contested 0/13 2/3 0/7 26/35 10/24 / / 0/93
Votes polled (%) 4.93 3.96 2.16 46.81 27.21 14.94
Urban 1972 Won/contested 0/9 1/1 / 9/9 0/8 / / 0/30
Votes polled (%) 27.53 7.05 46.31 5.00 14.10
1977
Rural 1977 Won/contested 5/16 4/13 8/8 9/54 43/47 / / 1/241
Votes polled (%) 8.05 7.43 5.98 31.07 36.66 10.82
Semi-Urban 1977 Won/contested 12/15 2/4 / 6/31 14/21 / / 1/136
Votes polled (%) 19.43 5.18 36.95 30.05 8.40
Urban 1977 Won/contested 8/10 1/1 / 2/11 1/2 / / 0/72
Votes polled (%) 41.02 6.09 37.79 5.78 9.32 Source: Election Commission Reports Punjab, 1967-1977

52
Table – 4.5
Location wise Major Party and Year wise Vote Polled, Constituencies Contested and Won
BJS/BJP CPI CPM INC SAD JP/JD BSP OTHERS
1980
Rural 1980 Won/contested 1/18 7/10 4/11 30/70 28/45 / / 0/217
Votes polled( %) 3.24 6.39 6.15 44.59 30.56 9.07
Semi-Urban 1980 Won/contested 0/13 2/7 1/2 21/35 9/23 / / 2/159
Votes polled( %) 7.58 7.53 1.40 44.66 26.54 12.29
Urban 1980 Won/contested 0/10 0/1 / 12/12 0/5 / / 0/84
Votes polled( %) 22.59 3.37 50.62 5.98 17.45
1985
Rural 1985 Won/contested 1/5 1/23 0/20 12/70 53/64 / / 3/249
Votes polled( %) 1.58 4.84 2.62 35.96 42.40 12.61
Semi-Urban 1985 Won/contested 3/10 0/13 0/7 11/35 20/31 / / 1/188
Votes polled( %) 7.14 3.82 1.11 39.12 37.33 11.47
Urban 1985 Won/contested 2/11 0/2 0/1 9/12 0/5 / / 1/111
Votes polled( %) 19.47 4.07 0.18 45.67 12.03 18.57
1992
Rural 1992 Won/contested 1/31 3/15 1/13 51/70 2/36 1/21 9/63 2/81
Votes polled( %) 10.98 4.76 3.23 41.74 6.05 3.04 19.47 10.73
Semi-Urban 1992 Won/contested 3/23 0/4 0/4 27/34 1/19 0/11 0/33 4/51
Votes polled( %) 18.20 1.89 2.29 42.97 5.97 1.46 16.41 10.79
Urban 1992 Won/contested 2/12 1/1 / 9/12 0/3 0/5 0/9 0/28
Votes polled( %) 29.95 4.16 52.49 0.65 0.93 6.10 5.73
Source: Election Commission Reports Punjab, 1980-1992

53
Table – 4.6 Region wise Major Party and Year wise Vote Polled, Constituencies Contested and Won
Year of Election BJS/BJP CPI CPM INC SAD/ASD JP/JD BSP OTHERS
1967
Doaba 1967 Won/contested 2/8 /4 1/3 12/23 1/9 / / 7/87
Votes polled( %) 8.65 5.95 4.13 38.22 6.65 36.40
Majha 1967 Won/contested 4/13 1/3 1/2 12/22 5/15 / / 0/76
Votes polled( %) 15.15 3.93 3.40 37.82 22.43 17.27
Malwa 1967 Won/contested 3/28 4/12 1/8 24/57 18/35 / / 8/197
Votes polled( %) 8.16 5.42 2.86 36.99 25.19 21.38
1969
Doaba 1969 Won/contested 1/9 1/6 0/4 14/23 5/9 / / 2/58
Votes polled( %) 10.95 4.94 4.46 41.61 18.22 19.82
Majha 1969 Won/contested 3/8 1/6 1/2 7/23 10/14 / / 1/58
Votes polled( %) 12.31 12.31 5.28 4.16 40.01 10.44
Malwa 1969 Won/contested 4/13 2/16 1/4 17/57 28/42 / / 6/119
Votes polled( %) 6.90 6.90 4.61 2.08 37.89 14.11
1972
Doaba 1972 Won/contested 0/8 1/2 0/4 20/21 0/11 / / 2/47
Votes polled( %) 4.78 3.80 4.78 49.14 12.24 25.26
Majha 1972 Won/contested 0/13 3/3 0/3 18/19 2/15 / / 0/46
Votes polled( %) 9.85 7.50 3.00 46.96 23.19 9.50
Malwa 1972 Won/contested 0/12 6/8 1/10 28/49 22/46 / / 1/151
Votes polled( %) 3.22 7.12 2.80 39.03 34.85 12.97
1977
Doaba 1977 Won/contested 9/14 1/2 3/3 4/21 8/9 / / 0/117
Votes polled( %) 21.45 2.98 6.62 34.07 20.62 14.27
Majha 1977 Won/contested 6/10 1/5 2/2 3/22 14/15 / / 1/84
Votes polled( %) 18.77 7.45 3.32 35.02 27.77 7.66
Malwa 1977 Won/contested 10/17 5/11 3/3 10/53 36/46 / / 1/248
Votes polled( %) 11.06 7.59 2.42 32.83 36.90 9.20 Source: Election Commission Report, Punjab, 1967-1977

54
Table - 4.7 Region wise Major Party and Year wise Vote Polled, constituencies Contested and Won
BJS/BJP CPI CPM INC/ CONGRESS SAD JP/JD BSP OTHERS
1980
Doaba 1980 Won/contested 0/13 1/2 1/4 16/25 6/11 / / 1/90
Votes polled( %) 6.44 3.52 6.43 45.09 20.83 17.69
Majha 1980 Won/contested 0/11 2/3 1/3 15/27 9/18 / / 0/98
Votes polled( %) 9.76 5.17 3.49 46.13 27.16 8.29
Malwa 1980 Won/contested 1/17 6/13 3/6 32/65 22/44 / / 1/272
Votes polled( %) 5.22 8.03 3.42 44.87 29.06 9.41
1985
Doaba 1985 Won/contested 2/6 0/6 0/8 10/25 11/16 / / 2/119
Votes polled( %) 4.64 2.46 2.47 41.25 27.28 21.89
Majha 1985 Won/contested 2/8 0/7 0/7 10/27 14/21 / / 1/109
Votes polled( %) 9.23 4.56 1.78 39.25 35.07 10.12
Malwa 1985 Won/contested 2/12 1/25 0/13 12/65 48/63 / / 2/320
Votes polled( %) 3.61 5.12 1.76 36.14 42.92 10.45
1992
Doaba 1992 Won/contested 0/17 0/5 0/5 19/25 0/8 0/13 6/23 0/45
Votes polled( %) 13.04 2.14 3.54 42.35 1.80 2.85 25.18 9.11
Majha 1992 Won/contested 2/16 2/3 0/3 21/27 1/10 0/6 0/21 1/24
Votes polled( %) 26.39 4.25 1.60 51.93 2.52 2.57 5.60 5.15
Malwa 1992 Won/contested 4/33 2/12 1/9 47/64 2/40 1/18 3/61 5/91
Votes polled( %) 14.50 4.23 2.08 41.48 8.11 1.61 15.64 12.35
Source : Election Commission Report, Punjab, 1980-1992

55
Table – 4.8 Region wise Major Party and Year wise Vote Polled, constituencies Contested and Won
BJS/BJP CPI CPM INC/
CONGRESS SAD JP/JD BSP OTHERS
1997
Doaba 1997 ** Won/contested 5/8 0/1 0/4 5/25 13/16 0/9 1/22 1/66
Votes polled( %) 14.77 0.20 1.65 26.67 28.60 0.50 16.98 10.61
Majha 1997 ** Won/contested 7/8 0/3 0/8 0/24 18/18 0/6 0/13 2/69
Votes polled( %) 14.10 2.45 2.22 28.03 37.32 0.31 2.61 12.95
Malwa 1997 ** Won/contested 6/6 2/11 0/13 9/56 44/58 0/13 0/32 4/204
Votes polled( %) 4.07 4.12 1.68 26.05 40.81 0.67 6.02 16.58
2002
Doaba 2002 Won/contested 2/8 0/1 0/4 16/24 7/15 / 0/25 0/138
Votes polled( %) 10.36 0.33 0.81 39.02 23.34 13.91 12.22
Majha 2002 Won/contested 0/8 0/2 0/3 17/24 7/19 / 0/18 3/105
Votes polled( %) 9.00 1.21 0.17 37.58 31.80 1.48 18.75
Malwa 2002 Won/contested 1/7 2/8 0/6 29/57 27/58 / 0/57 6/336
Votes polled( %) 2.99 3.06 0.27 34.15 33.34 4.50 21.68
2007
Doaba 2007 Won/contested 7/8 0/1 0/5 4/25 13/17 / 0/25 1/125
Votes polled( %) 15.96 0.04 0.63 38.30 30.71 8.48 5.87
Majha 2007 Won/contested 7/8 0/7 0/2 3/27 17/19 / 0/27 0/120
Votes polled( %) 12.75 1.03 0.12 40.12 36.70 1.87 7.40
Malwa 2007 Won/contested 5/7 0/17 0/7 37/65 19/58 / 0/64 4/421
Votes polled( %) 4.27 0.88 0.22 42.02 39.36 3.50 9.75 Source : Election Commission Report, Punjab, 1997-2007

56
Table – 4.9 Caste-wise Party preference in 1997
RELIGION AKALI (B) BJP
Sikhs 38.00 34.00
Hindu SC 12.00 10.00
Sikh SC 23.00 11.00
Hindus 27.00 45.00
Source : IDC Sample Survey 1997
The BJP has been traditionally seen as a party of urban Hindus. Around 95 per cent of its party activists were Hindus. They are involved in trade and business (50 per cent) followed by small business (32 per cent) (See table 4.1 and 4.2).
An analysis of Assembly election results between 1967 and 2007 shows that the BJP has its presence in urban and semi-urban constituencies (See map 2). Traditionally, the BJP has opposed the Akali demands of Punjabi Suba and a Sikh homeland. However, in the post-terrorism phase, the shift in the stance of the BJP from strong Centre to greater autonomy for the states and its opposition to Operation Blue Star and the November 1984 riots increased its acceptability among the rural Jat peasantry. It was mainly political considerations, rather than electoral arithmetic which nurtured the pre-election alliance. S. Prakash Singh Badal, President of the SAD, was of the view that the SAD’s alliance with the BJP was historical and political. It was not an opportunistic alliance.14 Another senior leader of the SAD who was opposed to the alliance considered it as an electoral burden and which was diluting the ideological base of the Akali Dal.15 A quick glance at the data show that the SAD has gained in pre-election coalition. However, the Bharatiya Janata Party has suffered major losses.
The BJP’s loss has been the gain of the Congress as both parties compete for the same support base. The regionalisation of the Indian National Congress has ensured its continuation as a major political party in the state. In other words, its continuation has been shaped by meshing its nation-building ideological thrust with pragmatic responses of its regional leadership consisting of former Akalis and Hindu Maha Sabhites. This three dimensional dissonance i.e. pronouncements of its national leaders, Sikh leaders, and Hindu leaders not only provided the much needed electoral sustenance, but also contributed to the existing conflicts.16

57

58
Paradoxically, the Congress has to compete with a strong regional party, but within the boundaries defined by the national leadership. The only action which seems to have defied this has been the Punjab Agreement Repealing Act 2004 on SYL passed by the Punjab Assembly much to the annoyance of the national leadership of the Congress.17 The main architect of this was the Chief Minister, Capt. Amarinder Singh, who happens to be a former Akali.18 It was mainly focused on wooing the rural Jat peasantry. Traditionally, its core support base consists of a large majority of Hindu dalits with their ‘uncertain religious allegiance’, and urban Hindu traders, Sikh Khatris and migrant landless labourers. A small faction of the rural Jat peasantry also supports the Congress because of village level factionalism, kinship ties etc. An analysis of party activists shows that 67 per cent are Hindus. The activists are business men (38 per cent), petty shopkeepers (32 per cent), farmers (16 per cent) and unskilled workers (6 per cent). (See table 4.1)
An analysis of the percentage of seats won from 1967 to 2007 shows that it has a strong base in the urban constituencies and the dalit dominated Doaba region of the state (see map 3). Further, vote share analysis between 1997 and 2007 shows that the Congress secured maximum of 46 per cent of the votes in 2002 elections in the urban constituencies and 39 per cent in the Scheduled Caste dominated Doaba in 2002 elections (See table 4.4, 4.5, 4.3 and 4.6, 4.7, 4.8). However, Operation Blue Star and brutal riots against the Sikhs in 1984 provided content to anti-Sikh politics of the Congress19. Its alliance with the Communist Party in 1990s was to overcome the accusation of being anti-Sikh and therefore, communal.
The Congress party’s support base has kept changing in response to political developments in the state. In the initial years till the mid-sixties the rich and middle peasantry supported the Congress which under the leadership of Partap Singh Kairon initiated reforms in the rural areas.20
Between 1967 and 1980, the Congress support base shifted to urban Sikhs and Hindus, the Scheduled Castes and a small section of the peasantry. In post-Operation Blue Star period, in 1985 a section of urban Sikhs shifted to the Akali Dal.21 However, in 1992 elections held in the background of pervasive terrorism most of the elected MLAs were from rural background and were young. The change in leadership shaped the future politics and brought a qualitative shift in the agenda of the Congress Party.

59

60
In the 1997 elections, the urban and semi-urban vote bank of the Congress moved away from it (see table 4.3). The alliance of the Congress with the Communist Party of India (CPI) was termed as political rather than electoral. The CPI has influence among a section of small and marginal peasants and landless labourers in the districts of Faridkot, Sangrur, Bathinda and Ferozepur and among the industrial labourers in urban areas.
The Communist Party politics appropriated the pro-minority discourse in negation to Hindu communal assertions and highlighted the economic demands shorn of religious and communal content. It spearheaded tenant movements, the anti-water agitations in different areas of Punjab in the 1950s. It kept the discourse of social and economic justice alive in Punjab. It secured maximum 10 seats in 1972 elections and entered into an alliance with parties opposed to the Congress including BJS from 1967 to 1977. However, in the nineties, it formed a pre-election alliance with the Congress. The Congress and the Communists have a competing support base with the BSP. The BSP used the dalit castes as a political capital for the first time in 1992.22 The BSP is finding a declining response in Punjab. For example, in 1992 it secured 16 per cent votes in Punjab, which declined to 6 per cent and 4 per cent in the 2002 and 2007 assembly elections respectively (see table 10). The ideological content of the BSP has been unable to appropriate the regional culture and economic specificities of Punjab. The purity-pollution and Manuwad that constitute the BSP’s main ideological plank do not find expression in the socio-cultural domain of Punjab. The ‘uncertain religious allegiance’ of the dalits made them easy prey to the political parties in the state.23 A detailed analysis of the Dalit factor in Punjab politics can help understand the larger issue of caste dynamics in electoral politics. The ‘uncertain religious allegiance’ of the Dalits and in the absence of caste as a defining parameter for social position, Dalits found representation in all the political parties in the state. It is interesting to note that even the Jat dominated Shiromani Akali Dal gave substantial representation to the Dalits. For instance, in 1969, of the 25 Scheduled Caste elected legislators, 44 per cent were in the Akali Dal. Not only this, in 1977 (48 per cent), 1985 (62 per cent) and 1997 (77 per cent), a majority of the Scheduled Caste legislators were from the Akali Dal. Similarly, in 1967 (52 per cent),1972 (61 per cent), 1980(45 per cent), 1992(63 per cent) and 2002 (48 per cent) a majority of the elected Scheduled Caste legislators were from the Congress. Even the

61
Bharatiya Janata Party gave representation to the Dalits. For instance, in 1997, 13 per cent of the Scheduled Caste members belonged to the BJP. It is interesting that Dalit legislators have been elected from political parties other than the BSP and the Communist parties.
Table – 4.10 Election and Electoral Coalitions in Punjab 1967-2007
Year Parliament Assembly
Party Contested Won Vote % Party Contested Won Vote %
1967
BJS 8 1 12.49 BJS 49 9 9.84
ADM 7 0 4.42 ADM 61 2 4.2
ADS 8 3 22.61 ADS 59 24 20.48
CPI 3 0 4.28 CPM 13 3 3.26
CPM 2 0 1.89 RPI 17 3 1.79
INC 13 9 37.31 PSP 9 0 0.51
OTHERS 9 0 7.69 CPI 19 5 5.2
IND 25 0 9.32 INC 102 48 37.45
OTHERS 18 1 1.22
IND 255 9 16.05
1969
BJS 30 8 9.01
SAD 65 43 29.36
CPI 28 4 4.84
CPM 10 2 3.07
SSP 7 2 0.83
SP 6 1 0.91
INC 103 38 39.18
OTHERS 62 2 3.92
IND 160 4 8.89
1971
BJS 5 0 4.45
SAD 12 1 30.85
CPI 2 2 6.22
CPM 3 0 2.2
INC 11 10 45.96
OTHERS 11 0 5.82
IND 39 0 4.5
1972
BJS 33 0 4.97
SAD 72 24 27.64
CPM 17 1 3.26
CPI 13 10 6.51
INC 89 66 42.84
OTHRES 39 0 2.49
IND 205 3 12.29
1977
SAD 9 9 42.3 SAD 70 58 31.41
CPI 3 0 1.65 JNP 41 25 14.99
CPM 1 1 4.94 CPM 8 8 3.5
INC 13 0 34.85 CPI 18 7 6.59
OTHERS 8 3 12.97 INC 96 17 33.59
IND 45 0 3.29 OTHERS 14 0 0.33
IND 435 2 9.58

62
Year Parliament Assembly
Party Contested Won Vote % Party Contested Won Vote %
1980
JNP 9 0 9.97 BJP 41 1 6.48
SAD 7 1 23.37 SAD 73 37 26.92
CPI 1 0 1.27 CPI 18 9 6.46
CPM 1 0 2.53 CPM 13 5 4.06
INC(I) 13 12 52.45 INC 117 63 45.19
BSP 1 0 0.07 OTHERS 84 0 4.36
OTHERS 10 0 5.03 IND 376 2 6.52
IND 105 0 5.31
1985
BJP 3 0 3.39 BJP 26 6 4.99
SAD 11 7 37.17 SAD 100 73 38.01
CPI 3 0 3.84 CPI 38 1 4.44
CPM 3 0 2.98 CPM 28 0 1.92
INC 13 6 41.53 INC 117 32 37.86
OTHERS 2 0 2.24 OTHERS 6 1 1.09
IND 39 0 8.85 IND 542 4 11.69
1989
BJP 3 0 4.17
SAD(B) 9 0 5.38
SAD 4 0 1.27
SAD(M) 8 6 29.19
CPI 4 0 2.1
CPM 3 0 3.9
INC 13 2 26.49
BSP 12 1 8.62
JD 4 1 5.46
OTHERS 28 0 0.71
IND 139 3 12.72
1992
BJP 9 0 16.51 BJP 66 6 16.48
SAD 3 0 2.58 SAD 58 3 5.2
CPI 1 0 1.57 CPI 20 4 3.64
CPM 3 0 3.98 CPM 17 1 2.4
INC 13 12 49.27 INC 116 87 43.83
BSP 12 1 19.71 BSP 105 9 16.32
JD 4 0 1.3 JD 37 1 2.15
JP 1 0 0.93 OTHERS 9 2 0.74
OTHERS 3 0 0.13 IND 151 4 9.24
IND 32 0 4.01
1996
BJP 6 0 6.48
SAD(M) 7 0 3.85
SAD 9 8 28.72
BSP 4 3 9.35
CPI 3 0 1.6
CPM 3 0 2.68
INC 13 2 35.1
JD 1 0 2.66
JP 1 0 0.03
OTHERS 31 0 2.01
IND 181 0 7.51

63
Year Parliament Assembly
Party Contested Won Vote % Party Contested Won Vote %
1997
BJP 22 18 8.33
SAD 92 75 37.64
CPM 25 0 1.79
CPI 15 2 2.98
INC 105 14 26.59
BSP 67 1 7.48
JD 27 0 0.56
JP 1 0 0.01
SAD(M) 30 1 3.1
OTHERS 65 0 0.65
IND 244 6 10.87
1998
BJP 3 3 11.67
SAD 8 8 32.93
JD 1 1 4.18
CPI 1 3.4
CPM 3 1.06
INC 8 25.85
BSP 4 12.65
SAD(M) 4 2.73
OTHERS 21 0 0.64
IND 49 1 4.91
1999
BJP 3 1 9.16
SAD 9 2 28.59
DBSM 1 2.71
SAD(M) 1 1 3.41
CPI 1 1 3.74
CPM 1 2.18
INC 11 8 38.44
BSP 3 3.84
JD(S) 2 0.03
JD(U) 2 0.1
OTHERS 29 0 5.34
IND 57 2.45
2002
BJP 23 3 5.67
SAD 92 41 31.08
DBSM 2 0 0.33
SAD(M) 84 0 4.65
CPM 13 0 0.36
CPI 11 2 2.15
INC 105 62 35.81
BSP 100 0 5.69
JD(S) 4 0 0.03
JD(U) 2 0 0.01
OTHERS 213 0 2.94
IND 274 9 11.27

64
Year Parliament Assembly
Party Contested Won Vote % Party Contested Won Vote %
2004
BJP 3 3 10.48
SAD 10 8 34.28
SAD(M) 6 0 3.79
CPI 1 0 2.55
CPM 1 0 1.81
INC 11 2 34.17
BSP 13 0 7.67
JD(S) 1 0 0.01
OTHERS 26 0 2.5
IND 70 0 2.75
2007
BJP 23 19 8.21
SAD 94 49 37.19
CPI 25 0 0.75
CPM 14 0 0.28
BSP 116 0 4.10
INC 117 44 40.94
SAD(M) 37 0 0.51
OTHERS 191 0 1.23
IND 438 5 6.79
2009
BJP 3 1 10.06
SAD 10 4 33.85
SAD(M) 3 0 0.36
CPI 2 0 0.33
CPM 1 0 0.14
INC 13 8 45.23
BSP 13 0 5.75
OTHERS 59 0 1.94
IND 114 0 2.33
Source: Election Commission Reports 1967-2009
In fact, the Dalits could not emerge as a vote-bank for the BSP in Punjab. For instance, the Bahujan Samaj Party (BSP) could find a positive response in Uttar Pradesh (U.P.), whereas, in Punjab which has the highest percentage of Dalit population in the country, it could find a nominal response. To illustrate, the BSP vote share in Uttar Pradesh increased from 11 per cent in 1993 to 23 per cent in 2002. Both in Punjab and Uttar Pradesh the initial response of the Dalits was to identify themselves with the BSP as there was a low degree of representation of the Scheduled Castes. But in Punjab there is a trend to move away from the BSP. For instance, in 1989 BSP could win one seat out of 12 contested seats with 8.62 per cent of votes polled. It secured highest percentage of votes i.e. 19.7 per cent in 1992 elections and

65
could win only one seat. It secured highest number of seats in 1996 election when it entered into an alliance with Akali Dal (Badal). This was a new phenomenon and it adversely effected the performance of Congress party. In this election, BSP could win three seats of the four contested with 9.3 per cent votes polled. The BSP in Parliament as well as Assembly elections continued to act as spoilers mainly for Congress party. It acted as a spoiler in 14 and 11 constituencies in 1997 and 2002 elections respectively. In 1998 parliamentary elections BSP could not win any seat with 12.65 per cent of vote share.
In 1999, Lok Sabha elections witnessed the BSP as a major spoiler for Congress party. The BSP acted as spoiler for Congress in more than 20 assembly segments. In 2004 Parliamentary elections the BSP percentage of votes increased from 3.84 per cent in 1999 elections to 7.67 per cent. This increase was mainly due to all the 13 seats contested by the party.
Why could the BSP not make electoral inroads in the state? Punjab has been known for its liberal religious practices in relation to caste. Both Sikhism and the Arya Samaj have liberated the Dalits from the stringent purity-pollution based behavioural patterns. Further the political and ideological texture of the BSP has been unable to capture the regional, cultural and economic specificities of Punjab. The purity-pollution and Manuwad that are the BSP’s main ideological planks do not find expression in Punjab in view of the role of Sikhism and the Arya Samaj.
It is in this backdrop the BSP-Akali Dal alliance in 1996 parliamentary elections made a discernible impact in Doaba region which consists of Hoshiarpur, Jallandhar and Phillaur constituencies.
In Malwa region as well the alliance worked to the advantage of the Akalis, particularly in Ropar, Patiala, Faridkot, Bathinda, Sangrur and Ludhiana. This reinforces the religio-cultural ethos which negate the existence of exclusive caste categories for electoral mobilisations.
To sum up, the inter-party relationship can be contextualised in the three axes. The dwarfed identity assertions are signposts within which religious minority and caste along with demographic positioning shape the intra and inter party interactions. This has also led to the defining of regional space giving rise to a strong regional party. Regional interests became a filter for the national parties in the political competitive

66
context and found an escape route in mergers i.e. the Indian National Congress and the Akali Dal.
The national and regional parties in competition for sectional interests having a bearing on electoral arithmetic, resorted to post-election coalitions or pre-election alliances i.e. the Bharatiya Janata Party and the SAD.
COALITION POLITICS: ELECTORAL OVERVIEW
Coalition politics in Punjab follows a history of electoral alliances ranging from mergers in the post-partition phase to the more recent pre-election alliances. The electoral coalitions can be mapped in four distinct phases namely – (i) Politics of Mergers: 1947 to the mid-sixties; (ii) Reorganisation of Punjab: 1966 to 1980; (iii) From Autonomy to Secession: 1980 to 1992; and (iv) Resurgence of Democracy and Punjabi Identity: Post-1992 phase.
Politics in post-Independence India and partitioned Punjab was shaped by issues related to identity politics and access to political power. The question of separate religious identity, communal and sectarian mobilisation, secular, linguistic and strata based grouping remained dominant in the political discourse. The dynamic interaction of the state with the path of development in the background of co-existence of competing identities produced diverse political formations ranging from merger of political parties to post-election coalitions to pre-election alliances.
In the first phase between 1947 and the mid-sixties the two main competing political parties merged, whereas, parties representing sectional interests resorted to agitational politics. The Indian National Congress and the Shiromani Akali Dal merged in 1948 and in 1956. The merger was guided by the politics of accommodation by the dominant party and shifting the arena of political activity from popular movements to elite maneuvering. The parties that merged came out of this arrangement within a short span, but a majority of the leaders active in legislative politics continued to function in the Congress as was the case in the pre-Independence phase. The politics of merger reduced the Akali vote share from 15 per cent in 1952 to 12 per cent in 1962.24

67
The Communist Party of India (CPI) continued to agitate for the economic interests of the agriculturists and landless labourers. The Bharatiya Jana Sangh continued to agitate for the interests of urban Hindus. The support base of the Jana Sangh increased from 5 per cent in 1952 to 9 per cent in 1962. The Communist Party support base increased about 10 per cent in the Punjabi speaking rural areas. The overall increase was from 5 per cent in 1952 to 7 per cent in 1962.
The second phase marked the end of one-party dominance in Punjab. The re-organisation of the state in 1966, the introduction of the Green Revolution strategy and demographic transformation to a Sikh majority state, initiated a new process of political alliances and economic differentiation. Political discourse revolved around restructuring of Centre-State relations and anti-Congressism.
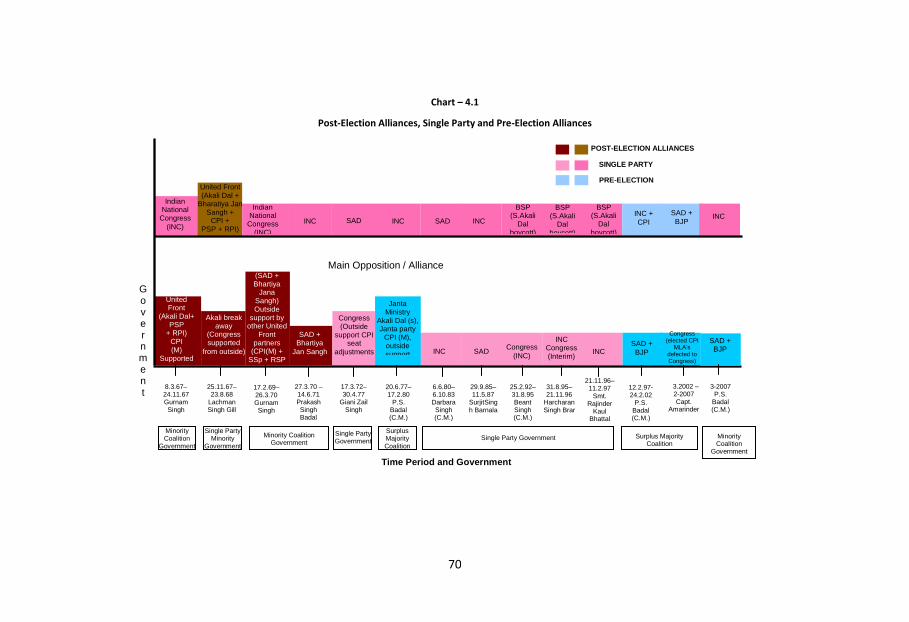
In this phase, four coalitions were formed and all during post-election. The first post-election coalition was formed after the fourth general election in 1967 under the Chief Ministership of Gurnam Singh consisting of a United Front of parties opposed to the Congress, with divergent ideological thrust. This minority coalition could last only eight months and fell after the defection of 17 SAD members of the Legislative Assembly (see graph – 4.4).
The main opposition party, the Congress gave outside support to the Akali break away group and a minority government under the Chief Ministership of Lachman Singh Gill was formed on November 25, 1967. It could last only nine months as the Congress withdrew support.
The third coalition was formed after the mid-term elections in February, 1969, in which the Akali Dal and the Jana Sangh were the main partners. The minority coalition government was headed by S. Gurnam Singh. The Jana Sangh withdrew support. It could last only 13 months. Differences among the coalition partners arose over issues like language, Centre-State relations and the status of Chandigarh.
The fourth minority coalition government came into being after the removal of S. Gurnam Singh as Chief Minister. S. Prakash Singh Badal was sworn in as Chief Minister on March 27, 1970, with a new agenda of the coalition government. The Jana Sangh withdrew from the coalition in June, 1970, on the question of the jurisdiction of Guru Nanak Dev

68
University. However, the main differences were on issues relating to the transfer of certain Panjabi-speaking areas to Punjab. This minority coalition could last for 15 months.
The post-election coalitions were formed either to keep a political formation out of power or by entering into convenient power-sharing arrangements. These coalitions were marriages of convenience between political parties and were tedious to sustain and relatively unstable.
The third phase in Punjab politics brought about a qualitative shift in the mechanics of government formation. The political discourse moved away from autonomy to secession on communal basis. Competitive electoral and moderate politics suffered a severe set-back and the culture of violence became the dominant mode of articulation of grievances. Popularly elected governments were dismissed and elections were postponed. Elections were held to legitimize non-democratic and communal politics in 1985, 1989 and 1992. An important lesson learnt was that democracy was the only antidote to terrorism.25 The revival of the democratic process witnessed a major shift in the political agenda.
The fourth phase witnessed a major shift in the political agenda of the parties. The Akali Dal shifted their stance from Sikh identity to Punjabi identity, from the human rights of ‘Khalistan’ activists to peace at any cost, from state autonomy to co-operative federalism. Similarly, the Bharatiya Janata Party moved from a strong centre to greater autonomy for states. The Congress apologised for Operation Blue Star and the brutal riots of 1984. In view of these shifts and lessons learnt from the decade of terrorism, the political parties entered into pre-election alliances.26
In 1997 Assembly elections the Akali Dal and the BJP on the one hand and the Congress and the Communist Party of India on the other, entered into pre-election coalitions. It was a ‘surplus majority coalition’ of the Akali Dal and the BJP. It completed its full term.27
The Akali Dal-BJP alliance performed better because it provided the Akali Dal with the much needed political space at the national level to shed its anti-national image, and to the BJP it gave a political plank to counter the Congress and the Left propaganda that its politics was anti-

69
minorities. The political parties having recovered from the terrorism phase, started carving out their own autonomous space. The SAD, which again started the pre-Blue Star politics of shaping the Sikh identity coupled with anti-incumbency suffered massive defeat in 1999 election.28
In the 2002 elections, a pre-election alliance as in 1997 took place between the Akali Dal and the BJP on the one hand and the Congress and the CPI on the other. The Congress formed the government with the outside support of the CPI. It was a single party majority government. The merger of the two-member legislative wing of the CPI into the Congress created fissures in the alliance between the two parties. Consequently, in 2007 assembly elections the Congress and the CPI did not enter into a pre-election alliance. However, the SAD and the BJP entered in a pre-election coalition and formed the minority coalition government.
The mergers, post-election coalitions and pre-election alliances have their own dynamics. A detailed analysis, in term of political economy of coalition, social matrix and representation, and mapping of party ideologies in terms of policies, legislative and executive decision making will be made. Above all, it would be relevant to analyse the impact of coalitions on governance, democracy, party dynamics, centre-state relations, conflicts and issues relating to the rights of vulnerable groups, distributive justice and identity politics.
POLITICS OF MERGER: 1947 to MID-SIXTIES
In the first phase, from 1947 to the mid-1960s, one party dominance negated the existence of regional interests and branded these assertions as anti-national. The aura of the national freedom movement led to the Congress Party hegemonizing the whole spectrum of Indian politics. The politics of co-option of regional interests was practised by the Congress to maintain its hold on power. It encouraged the Akali Dal to merge with the Congress for the first time in 1948 and then in 1956. The partition of Punjab necessitated consensus-based political governance, and the Akali Dal legislative wing elected in 1946 was invited to merge with the Congress.
The Akali Dal contested the 1946 elections in opposition to the Congress. In the 175 member Punjab Assembly the Akali Dal won 23 of
70
Chart – 4.1
Post-Election Alliances, Single Party and Pre-Election Alliances
United Front (Akali Dal +
Bharatiya Jan Sangh +
CPI + PSP + RPI)
United Front
(Akali Dal+ PSP
+ RPI) CPI (M)
Supported from
outside
Akali break away
(Congress supported
from outside)
(SAD + Bhartiya
Jana Sangh) Outside
support by other United
Front partners
(CPI(M) + SSp + RSP
+ S.P. +CPI)
SAD + Bhartiya
Jan Sangh
Indian National
Congress
(INC)
Indian National
Congress (INC)
INC SAD INC SAD INC
Congress (Outside
support CPI seat
adjustments
BSP (S.Akali
Dal boycott)
BSP (S.Akali
Dal boycott)
BSP (S.Akali
Dal boycott)
INC SAD Congress
(INC)
INC Congress (Interim)
INC
8.3.67– 24.11.67 Gurnam Singh (C.M.)
25.11.67– 23.8.68
Lachman Singh Gill
(C.M.)
17.2.69–26.3.70 Gurnam Singh (C.M.)
27.3.70 – 14.6.71 Prakash Singh Badal (C.M.)
17.3.72–30.4.77
Giani Zail Singh (C.M.)
20.6.77–17.2.80
P.S. Badal (C.M.)
6.6.80–6.10.83 Darbara Singh (C.M.)
29.9.85–11.5.87
SurjitSingh Barnala
25.2.92–31.8.95 Beant Singh (C.M.)
31.8.95–21.11.96
Harcharan Singh Brar
21.11.96–11.2.97
Smt. Rajinder
Kaul Bhattal
12.2.97-24.2.02
P.S. Badal (C.M.)
3.2002 – 2-2007 Capt.
Amarinder Singh
Janta Ministry
Akali Dal (s), Janta party
CPI (M), outside support
SAD +
BJP
Congress (elected CPI
MLA’s defected to Congress)
INC +
CPI
SAD +
BJP
Gove r nmen t
Main Opposition / Alliance
Time Period and Government
PRE-ELECTION ALLIANCES
POST-ELECTION ALLIANCES
SINGLE PARTY
Minority Coalition
Government
Minority Coalition Government
Single Party Minority
Government
Single Party Government
Single Party Government
Surplus Majority Coalition
Surplus Majority Coalition
SAD + BJP
3-2007 P.S.
Badal (C.M.)
INC
Minority Coalition
Government

71
the 33 seats reserved for Sikhs.29 The Congress won 51 seats including 10 reserved for Sikhs.
The Unionist Party won 21 seats including 15 reserved for Muslims. The Independent Christians won 1, Independent labour 2, Independent Dalit 1 and Anglo-Indians 2 seats. The Muslim League won 74 seats.
A coalition ministry was formed under the leadership of Sir Khizr Hayat Khan, consisting of the Unionist Party, the Congress and the Akali Dal. The ministry submitted its resignation on 3 March, 1947 and Governor’s rule was promulgated in the state. After independence, the Congress, the Akali representatives and six independent MLAs formed the ministry under the leadership of Dr. Gopi Chand Bhargava. The SAD passed a resolution on 22nd April 1949, to withdraw from the Congress Government after the Constituent Assembly turned down safeguards for the Sikhs30. Master Tara Singh in October 19, 1949, made a statement that ‘every minority except the Sikhs had been given justice. The Muslims demanded Pakistan and they got it.’31 The SAD adopted a resolution and directed its MLAs to leave the Congress on 20th July, 1950. Interestingly, only one MLA resigned from the Congress Legislative Party. The Akali Dal fought the 1952 general elections on the issue of Punjabi Suba with emphasis on the creation of a Punjabi speaking province.32 During this period in Punjab the issue of reorganisation of the state on linguistic basis acquired communal overtones. Though the Akali leaders emphasized language as the basis for a division of the state, at the popular plane they tended to mix religion with language.33
The indoctrination that the Sikhs were a single political entity and their secular interests were common, provided continuity to the pre-partition politics of the Akali Dal. The growing strength of Master Tara Singh among all occupational groups created the fear that the movement for a separate independent Sikh state might become stronger. To counter the demand for a Punjabi Suba raised by the Akali Dal led by Master Tara Singh, an agitation for Hindi was launched. This advocated a ‘Maha Punjab’ irrespective of language. Communal overtones in this were explicitly visible, though there was not much tension between the two communal groups. The increasing strength of the Akali Dal alarmed the Congress leadership.

72
In 1956 an understanding was reached between the ruling Congress Party and the Akali Dal. Subsequently the Akali Dal stalwarts joined the Congress.34 The Akalis accepted the regional plan at their meeting of 30th September, 1956. The new state was to be divided into so-called Punjabi-speaking and Hindi-speaking regions and two regional committees consisting of the members of the legislature belonging to the respective regions were to be constituted.
The Akalis did not contest the second general election held in 1957. But due to internal compulsions and dissensions among the Akalis, the understanding with the Congress did not last long. The Akali Dal decided to take part in politics on its own and asked its members in the Congress to return to their parent organisation. Of the 28 Akali MLAs who had joined the Congress, only 7 returned to the Akali fold.35 It is relevant to note that most of the Akalis who joined the Congress, in 1937, 1948 and 1956 did not return to the Akali fold. Prominent among them were Pratap Singh Kairon (later Chief Minister of the Congress Government), Gurmukh Singh Musafir, (later President of the Congress Party), S. Swaran Singh (later India’s Foreign Minister in the Congress Government), Baldev Singh (later India’s Defence Minister) etc. It is interesting that most of the ‘Sikh’ leaders in the Congress have had a stint in the Akali Dal.36 The success of the Akalis in the SGPC elections encouraged them to launch morchas for a Punjabi Suba in 1959 and 1961.37
The failure of the 1961 morcha discredited Master Tara Singh’s leadership. The 1962 general election was projected by the Congress as a referendum on the Punjabi Suba issue. This challenge was accepted by the Akali Dal. Its defeat in the general election demoralised its leadership. The Akalis won only 19 of the 154 seats and lost even in the Punjabi speaking areas. Master Tara Singh was held responsible for this defeat. He was also accused of sacrilege for he had broken his fast unto death.
The data indicate that the Akali Dal lost considerable electoral support in the 1962 elections. This erosion in the Akali support base led to renewed attempts by the Akalis to accelerate the process of communalisation. The demand for a Punjabi Suba was again raised. The political demarcation of Punjab was not considered favourable by the

73
Akali Dal to its bid to capture political power in the state; hence the demand for a Punjabi Suba.
The split of the Akali Dal in 1962 facilitated the concentration of power in the hands of those speaking in the name of the rural Jat peasantry in the organisation. In January 1965, the Sant Akali Dal won 95 of the 138 seats in SGPC elections, giving a crushing defeat to the Master Akali Dal. It also increased its share in political power.38 It coincided with the reorganisation of the state in September, 1966, on a linguistic basis and initiation of the Green Revolution. This was the beginning of coalition politics with anti-Congressism as its main plank.
REORGANISATION OF PUNJAB: 1967 TO 1980
In the period 1967 to 1980, the fourth and fifth Vidhan Sabha of Punjab witnessed four coalitions and one minority government. The three coalition governments were formed by the Akalis with the support of its main coalition partner, the Bharatiya Jana Sangh. The fourth coalition was that of a breakaway group of the Akalis supported by the Congress.
This phase is characterised by the establishment of a Sikh majority with the reorganisation of Punjab on the basis of language. The numerical dominance of the Sikhs as a single political entity was now unchallenged. The electoral dominance of the Congress receded. The other factor that had an overarching impact on the state politics during this period was the initiation of the Green Revolution strategy. The Green Revolution strategy empowered the Sikh Jat peasantry, but led to differentiations between the peasantry and the trading classes. This phase then witnessed a shift in political discourse from political deprivation of the ‘minorities’ to economic discrimination. Therefore, the demand for a separate Sikh state could not find expression, but greater state autonomy became an issue for the emerging agrarian interests. This issue was, however, raised by the Akalis in 1973 and acquired the character of a movement in 1978.
The first coalition was formed after the 4th General Election in 1967. In this election, the Congress won 48 seats in the 104-member state Legislative Assembly. The Akali Dal (Sant Fateh Singh) secured 24 seats, the Jana Sangh 9, the Communist Party of India 5, the Communist Party of India (Marxist) 3, the Republican Party 3, the Akali Dal (Master Tara Singh) 2 (see table 4.10). A united front of all parties was formed with S.

74
Gurnam Singh as their leader. A minority coalition government was formed. It was a combination of divergent ideological groups with the sole purpose of keeping the Congress out. A common programme was prepared and adopted at Khanna, and the resolution adopted read:
Whereas we stand for amity and goodwill among all sections of Punjabis irrespective of caste or creed, and promise to take steps to strengthen the new state of Punjab economically and politically, we resolve to oppose all separatist trends and moves aimed at weakening the unity and integrity of the country.39
The common minimum programme was evolved to provide stability to the government. Similarly, ministry formation was also guided by the principle of giving adequate representation to coalition partners.40
The election results mirrored the social matrix and respective support base of political parties and an effort was made to reflect this into in the government formation. For instance, the Akali Dal won the highest number i.e. 18 of the 24 seats from Malwa region and polled the highest votes i.e. 25 per cent from Malwa as compared to 7 per cent and 22 per cent from Doaba and Majha (see table 4.6). The Jana Sangh reflected its strong urban hold by securing 40 per cent of the votes polled from urban seats contested and with a negligible count of 3 per cent in rural and only 12 per cent in the semi-urban constituencies of Punjab (see table 4.4). The Communist Party made its mark in its pocket constituencies.
The exclusive support base of the coalition partners is further reflected in the MLAs’ backgrounds in terms of caste, occupation, religion and the formation of ministry. Around 67 per cent of the Akali Dal MLAs were from agricultural background and 75 per cent belonged to the rural Jat community (see table 4.11). Whereas, dalits including Mazhabis and Ramdasias were 25 per cent (see table 4.11). The representation of the urban Sikh trading community was merely 4 per cent.
The Bharatiya Jana Sangh, the post-coalition partner of the SAD, had more legislators coming from trading and industrial background. More than 56 per cent of its legislators belonged to the urban Khatri and 22 per cent to the Bania castes. This is a reflection of its support base among the urban Hindus.

75
The Communist Party of India had more legislators from agricultural background but belonging to the Mazhabi Sikh and Rai Sikh castes. The Congress had 44 per cent of its MLAs from among the rural Jat peasantry. The number of legislators coming from the Scheduled Caste group was twice that of the Akali Dal (see table 4.11). The representation of urban Khatri traders in the Congress was competing with the Jana Sangh. The coalition represented demarcated electoral support base in the allocation of ministerial berths. The negotiations between the SAD and Jana Sangh responded to leadership considerations of S. Gurnam Singh and consequently Jana Sangh got the best deal in Cabinet formation.41 With two ministers, it had the charge of the ministries of Finance, Industry, Excise and Taxation, Local Bodies and Health. This coalition proved unstable and could last only eight months.
According to Akali activists, the concentration of power in the Jana Sangh ministers led to discontentment among the Akali legislators. The Congress got an opportunity and assured their support to the disgruntled Akalis to defect and form their own ministry.42
In November, 1967, an Akali breakaway group led by Lachhman Singh Gill formed a single party minority government with the outside support of the Congress. The United Front with Akali Dal, the Bharatiya Jana Sangh, CPI, PSP and RPI formed the opposition. This government was also shortlived and survived nine months. The Congress withdrew support from the government.
The fifth Vidhan Sabha witnessed the third post-election coalition led by the Akali Dal with Gurnam Singh as Chief Minister. The main alliance partner was the Bharatiya Jana Sangh. It had outside support from other United Front partners of the CPI(M), SSP, RSP, SP and CPI. The Akali-Jana Sangh entered into an agreement on the language question.43 Technically, this coalition can be termed as a minority coalition government since the Akali Dal and the BJS had 51 of the 52 required seats to form the government, with outside support from the Left parties. The seat distribution in the government were 43 with SAD, 8 with BJS, 4 with CPI, 2 with CPI(M) and 38 with Congress. The percentage of votes obtained by the SAD in Punjab was 29.36, perhaps the only time that the semi-urban voters eclipsed the vote share of the
76
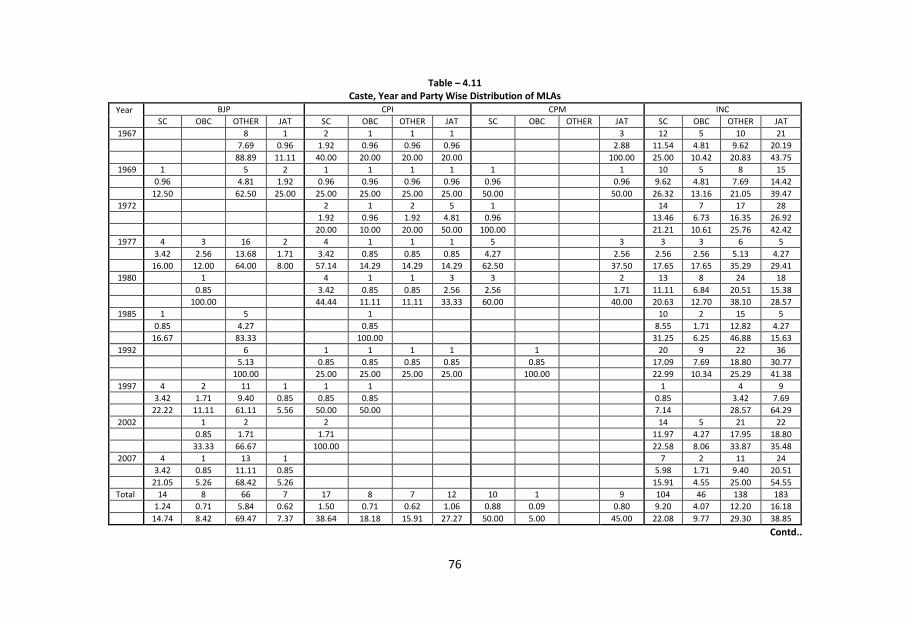
Table – 4.11 Caste, Year and Party Wise Distribution of MLAs
Year
BJP CPI CPM INC
SC OBC OTHER JAT SC OBC OTHER JAT SC OBC OTHER JAT SC OBC OTHER JAT
1967 8 1 2 1 1 1 3 12 5 10 21
7.69 0.96 1.92 0.96 0.96 0.96 2.88 11.54 4.81 9.62 20.19
88.89 11.11 40.00 20.00 20.00 20.00 100.00 25.00 10.42 20.83 43.75
1969 1 5 2 1 1 1 1 1 1 10 5 8 15
0.96 4.81 1.92 0.96 0.96 0.96 0.96 0.96 0.96 9.62 4.81 7.69 14.42
12.50 62.50 25.00 25.00 25.00 25.00 25.00 50.00 50.00 26.32 13.16 21.05 39.47
1972 2 1 2 5 1 14 7 17 28
1.92 0.96 1.92 4.81 0.96 13.46 6.73 16.35 26.92
20.00 10.00 20.00 50.00 100.00 21.21 10.61 25.76 42.42
1977 4 3 16 2 4 1 1 1 5 3 3 3 6 5
3.42 2.56 13.68 1.71 3.42 0.85 0.85 0.85 4.27 2.56 2.56 2.56 5.13 4.27
16.00 12.00 64.00 8.00 57.14 14.29 14.29 14.29 62.50 37.50 17.65 17.65 35.29 29.41
1980 1 4 1 1 3 3 2 13 8 24 18
0.85 3.42 0.85 0.85 2.56 2.56 1.71 11.11 6.84 20.51 15.38
100.00 44.44 11.11 11.11 33.33 60.00 40.00 20.63 12.70 38.10 28.57
1985 1 5 1 10 2 15 5
0.85 4.27 0.85 8.55 1.71 12.82 4.27
16.67 83.33 100.00 31.25 6.25 46.88 15.63
1992 6 1 1 1 1 1 20 9 22 36
5.13 0.85 0.85 0.85 0.85 0.85 17.09 7.69 18.80 30.77
100.00 25.00 25.00 25.00 25.00 100.00 22.99 10.34 25.29 41.38
1997 4 2 11 1 1 1 1 4 9
3.42 1.71 9.40 0.85 0.85 0.85 0.85 3.42 7.69
22.22 11.11 61.11 5.56 50.00 50.00 7.14 28.57 64.29
2002 1 2 2 14 5 21 22
0.85 1.71 1.71 11.97 4.27 17.95 18.80
33.33 66.67 100.00 22.58 8.06 33.87 35.48
2007 4 1 13 1 7 2 11 24
3.42 0.85 11.11 0.85 5.98 1.71 9.40 20.51
21.05 5.26 68.42 5.26 15.91 4.55 25.00 54.55
Total 14 8 66 7 17 8 7 12 10 1 9 104 46 138 183
1.24 0.71 5.84 0.62 1.50 0.71 0.62 1.06 0.88 0.09 0.80 9.20 4.07 12.20 16.18
14.74 8.42 69.47 7.37 38.64 18.18 15.91 27.27 50.00 5.00 45.00 22.08 9.77 29.30 38.85
Contd..

77
Year
SAD BSP OTHER ALL PARTY TOTAL
SC OBC OTHER JAT SC OBC OTHER JAT SC OBC OTHER JAT SC OBC OTHER JAT
1967 6 18 3 2 4 6 23 8 23 50 104
5.77 17.31 2.88 1.92 3.85 5.77 22.12 7.69 22.12 48.08 100.00
25.00 75.00 20.00 13.33 26.67 40.00 22.12 7.69 22.12 48.08
1969 11 3 2 27 1 2 1 5 25 11 17 51 104
10.58 2.88 1.92 25.96 0.96 1.92 0.96 4.81 24.04 10.58 16.35 49.04 100.00
25.58 6.98 4.65 62.79 11.11 22.22 11.11 55.56 24.04 10.58 16.35 49.04
1972 6 18 1 2 23 9 19 53 104
5.77 17.31 0.96 1.92 22.12 8.65 18.27 50.96 100.00
25.00 75.00 33.33 66.67 22.12 8.65 18.27 50.96
1977 15 2 2 39 2 31 9 25 52 117
12.82 1.71 1.71 33.33 1.71 26.50 7.69 21.37 44.44 100.00
25.86 3.45 3.45 67.24 100.00 26.50 7.69 21.37 44.44
1980 9 3 25 1 1 29 14 25 49 117
7.69 2.56 21.37 0.85 0.85 24.79 11.97 21.37 41.88 100.00
24.32 8.11 67.57 50.00 50.00 24.79 11.97 21.37 41.88
1985 18 4 17 34 2 3 29 9 40 39 117
15.38 3.42 14.53 29.06 1.71 2.56 24.79 7.69 34.19 33.33 100.00
24.66 5.48 23.29 46.58 40.00 60.00 24.79 7.69 34.19 33.33
1992 1 2 8 1 2 2 3 32 12 31 42 117
0.85 1.71 6.84 0.85 1.71 1.71 2.56 27.35 10.26 26.50 35.90 100.00
33.33 66.67 88.89 11.11 28.57 28.57 42.86 27.35 10.26 26.50 35.90
1997 23 7 4 41 1 1 1 5 30 11 20 56 117
19.66 5.98 3.42 35.04 0.85 0.85 0.85 4.27 25.64 9.40 17.09 47.86 100.00
30.67 9.33 5.33 54.67 100.00 14.29 14.29 71.43 25.64 9.40 17.09 47.86
2002 12 4 25 1 1 1 6 29 11 24 53 117
10.26 3.42 21.37 0.85 0.85 0.85 5.13 24.79 9.40 20.51 45.30 100.00
29.27 9.76 60.98 11.11 11.11 11.11 66.67 24.79 9.40 20.51 45.30
2007 16 6 2 25 2 2 1 29 11 26 51 117
13.68 5.13 1.71 21.37 1.71 1.71 0.85 24.79 9.40 22.22 43.59 100.00
32.65 12.24 4.08 51.02 40.00 40.00 20.00 24.79 9.40 22.22 43.59
Total 117 29 27 254 9 1 9 12 12 31 280 105 250 496 1131
10.34 2.56 2.39 22.46 0.80 0.09 0.80 1.06 1.06 2.74 24.76 9.28 22.10 43.85 100.00
27.40 6.79 6.32 59.48 90.00 10.00 14.06 18.75 18.75 48.44 24.76 9.28 22.10 43.85
Source: Punjab Vidhan Sabha Compendium of Who's Who of Members (1960-2002), Chandigarh: Punjab Vidhan Sabha Secretariat, 2003. Election commission Reports, Punjab (1967-2007) Note: Parenthesis figures pertain to percentage of representation of MLAs from party total

78
Table – 4.12 Year and Party wise Distribution of MLAs belonging to Hindu and Sikh Religion
YEAR OF ELECTION BJP BSP CPI CPM
HINDU SIKH OTHERS HINDU SIKH OTHERS HINDU SIKH OTHERS HINDU SIKH OTHERS
1967 9 1 4 3
% out of total MLAs 8.65 0.96 3.85 2.88
% out of party MLAs 100.00 20.00 80.00 100.00
1969 7 1 2 2 2
% out of total MLAs 6.73 0.96 1.92 1.92 1.92
% out of party MLAs 87.50 12.50 50.00 50.00 100.00
1972 3 7 1
% out of total MLAs 2.88 6.73 0.96
% out of party MLAs 30.00 70.00 100.00
1977 19 6 2 5 1 7
% out of total MLAs 16.24 5.13 1.71 4.27 0.85 5.98
% out of party MLAs 76.00 24.00 28.57 71.43 12.50 87.50
1980 1 1 8 5
% out of total MLAs 0.85 0.85 6.84 4.27
% out of party MLAs 100.00 11.11 88.89 100.00
1985 6 1
% out of total MLAs 5.13 0.85
% out of party MLAs 100.00 100.00
1992 6 4 5 2 2 1
% out of total MLAs 5.13 3.42 4.27 1.71 1.71 0.85
% out of party MLAs 100.00 44.44 55.56 50.00 50.00 100.00
1997 17 1 1 1 1
% out of total MLAs 14.53 0.85 0.85 0.85 0.85
% out of party MLAs 94.44 5.56 100.00 50.00 50.00
2002 2 1 1 1
% out of total MLAs 1.71 0.85 0.85 0.85
% out of party MLAs 66.67 33.33 50.00 50.00
2007 17 2
% out of total MLAs 14.53 1.71
% out of party MLAs 89.47 10.53
Total 84 11 5 5 13 31 1 19
% out of total MLAs 7.43 0.97 0.44 0.44 1.15 2.74 0.09 1.68
% out of party MLAs 88.42 11.58 50.00 50.00 29.55 70.45 5.00 95.00
Contd..

79
YEAR OF ELECTION INC OTHER JD SAD TOTAL
HINDU SIKH OTHERS HINDU SIKH OTHERS HINDU SIKH OTHERS HINDU SIKH OTHERS
1967 16 31 1 7 8 1 23 104
% out of total MLAs 15.38 29.81 0.96 6.73 7.69 0.96 22.12 100.00
% out of party MLAs 33.33 64.58 2.08 46.67 53.33 4.17 95.83
1969 13 25 2 7 42 1 104
% out of total MLAs 12.50 24.04 1.92 6.73 40.38 0.96 100.00
% out of party MLAs 34.21 65.79 22.22 77.78 97.67 2.33
1972 27 38 1 1 2 24 104
% out of total MLAs 25.96 36.54 0.96 0.96 1.92 23.08 100.00
% out of party MLAs 40.91 57.58 1.52 33.33 66.67 100.00
1977 8 9 2 1 57 117
% out of total MLAs 6.84 7.69 1.71 0.85 48.72 100.00
% out of party MLAs 47.06 52.94 100.00 1.72 98.28
1980 34 28 1 2 37 117
% out of total MLAs 29.06 23.93 0.85 1.71 31.62 100.00
% out of party MLAs 53.97 44.44 1.59 100.00 100.00
1985 22 10 3 2 2 70 1 117
% out of total MLAs 18.80 8.55 2.56 1.71 1.71 59.83 0.85 100.00
% out of party MLAs 68.75 31.25 60.00 40.00 2.74 95.89 1.37
1992 32 54 1 3 3 1 3 117
% out of total MLAs 27.35 46.15 0.85 2.56 2.56 0.85 2.56 100.00
% out of party MLAs 36.78 62.07 1.15 50.00 50.00 100.00 100.00
1997 6 8 2 5 3 71 1 117
% out of total MLAs 5.13 6.84 1.71 4.27 2.56 60.68 0.85 100.00
% out of party MLAs 42.86 57.14 28.57 71.43 4.00 94.67 1.33
2002 30 31 1 1 8 1 40 117
% out of total MLAs 25.64 26.50 0.85 0.85 6.84 0.85 34.19 100.00
% out of party MLAs 48.39 50.00 1.61 11.11 88.89 2.44 97.56
2007 7 36 1 1 4 4 45 117
% out of total MLAs 5.98 30.77 0.85 0.85 3.42 3.42 38.46 100.00
% out of party MLAs 15.91 81.82 2.27 20.00 80.00 8.16 91.84
Total 195 270 6 20 43 1 12 412 3 1131
% out of total MLAs 17.24 23.87 0.53 1.77 3.80 0.09 1.06 36.43 0.27 100.00
% out of party MLAs 41.40 57.32 1.27 31.75 68.25 100.00 2.81 96.49 0.70
Source: Punjab Vidhan Sabha Compendium of Who's Who of Members (1960-2002), Chandigarh: Punjab Vidhan Sabha Secretariat, 2003. Election commission Reports, Punjab (1967-2007) Note: Parenthesis figures pertain to percentage of representation of MLAs from party total Sikhs predominantly represented in Akali Party, while Hindus predominantly in the BJS/BJP. Both religions find representation in Congress, as also in BSP (Religion permeates the caste base in Punjab)

80
Table – 4.13 Election Year wise, Ministerial Representation according to Party and Region
Akali BJS/BJP INC Total(SAD+BJP+INC)
Majha Malwa Doaba Total Majha Malwa Doaba Total Majha Malwa Doaba Total Majha Malwa Doaba Total
1969 Ministers 4 15 5 24 2 1 1 4 6 16 6 28
MLAs 10 28 5 43 3 4 1 8 13 32 6 51
** 40.00 53.57 100.00 55.81 66.67 25.00 100.00 50.00 46.15 50.00 100.00 54.90
1972 Ministers 4 8 5 17 4 8 5 17
MLAs 18 28 20 66 18 28 20 66
22.22 28.57 25.00 25.76 22.22 28.57 25.00 25.76
1977 Ministers 1 7 3 11 1 2 2 5 2 9 5 16
MLAs 14 36 8 58 6 10 9 25 20 46 17 83
7.14 19.44 37.50 18.97 16.67 20.00 22.22 20.00 10.00 19.57 29.41 19.28
1980 Ministers 2 10 4 16 2 10 4 16
MLAs 15 32 16 63 15 32 16 63
13.33 31.25 25.00 25.40 13.33 31.25 25.00 25.40
1985 Ministers 6 18 4 28 6 18 4 28
MLAs 14 48 11 73 14 48 11 73
42.86 37.50 36.36 38.36 42.86 37.50 36.36 38.36
1992 Ministers 8 14 9 31 8 14 9 31
MLAs 21 47 19 87 21 47 19 87
38.10 29.79 47.37 35.63 38.10 29.79 47.37 35.63
1997 Ministers 9 17 7 33 2 3 3 8 11 20 10 41
MLAs 18 44 13 75 7 6 5 18 25 50 18 93
* 50.00 38.64 53.85 44.00 28.57 50.00 60.00 44.44 44.00 40.00 55.56 44.09
2002 Ministers 8 10 7 25 8 10 7 25
MLAs 17 29 16 62 17 29 16 62
47.06 34.48 43.75 40.32 47.06 34.48 43.75 40.32
2007 Ministers 5 6 2 13 2 3 5 7 6 5 18
MLAs 17 19 13 49 7 5 7 19 24 24 20 68
29.41 31.58 15.38 26.53 28.57 0.00 42.86 26.32 29.17 25.00 25.00 26.47
Note : Minister/MLAs. With Percentages the proportion of ministers to MLAs. (Data pertains to the time of the Constitution of Ministry) ** 5 MlA from Other Paries joined Akali in 1969 * 1 MLA from other party shifted to Akali in 1997 Source: Punjab Vidhan Sabha Compendium of Who's Who of Members (1960-2002), Chandigarh:Punjab Vidhan Sabha Secretariat, 2003 Election Commission Reports, Punjab (1967-2007)

81
rural constituencies when it drew 33 per cent of the votes in comparison with 31 per cent of the vote shared from the rural areas. The vote share of the Jana Sangh was in tune as a subsidiary partner with 9 per cent votes. (See table 4.10).
The elected members continued to showcase the traditional support base of their representative parties. The Akali Dal had as many as 60 per cent of its MLAs belonging to the peasantry. In contrast, the party already had only 5 per cent of its MLAs drawn from trading and industrial occupations. Slightly out of tune with its customary base, the Jana Sangh in 1969 elections had 37 per cent of its MLAs from agriculture background. Regionally also, the Jana Sangh had 50 per cent of its MLAs from Malwa rather than its domain of Majha or Doaba (See table 4.6). The demarcations on the basis of religion were most stark and most reflective of the social base of the party. None of the 43 Akali MLAs was Hindu and the BJS had a lone Sikh legislator and 87 per cent of its MLAs were Hindu (see table 4.12). The shift in the representation in Akali political leadership became apparent since 63 per cent of the legislators were rural Jat peasants and 25 per cent were dalits (see table 4.11). In contrast, in BJS a majority of 62 per cent MLAs were from the Hindu Bania/Khatri caste. The Congress reflected its wider social base as its elected members predominantly came from the Scheduled and Backward Castes (39 per cent), Hindu and Sikh Khatris (21 per cent) and Sikh Jats (39 per cent) (see table 4.11). While the Congress did have a dominant representation of the elites i.e. peasantry (53 per cent) it differed from the other parties by having an equitable distribution of votes polled among the rural, semi-urban and urban constituencies, increasing its vote share towards the urban areas (38 per cent in rural, 40 per cent in semi-urban and 42 per cent in urban) (see table 4.4). But its regional share in this election came starkly from Doaba with 42 per cent votes polled and a nominal of 4 per cent and 2 per cent in Majha and Malwa (see table 4.6). The 1969 coalition was shortlived with the Jana Sangh withdrawing its support within 13 months over differences on language, Centre-State relation and the status of Chandigarh.
This was a minority coalition government ridden with factionalism in the Akali Dal44, high expectations of the Jana Sangh and the fear of defections in the shadow of the numerical strength of the Congress.
82
There were 28 ministers at the time for the formation of the ministry. The Jana Sangh and the Akali Dal got around 50 per cent of its MLAs as ministers (see table 4.13). The allocation of portfolios to the Jana Sangh got reduced even though they had more ministers. Important departments of Finance, Excise and Taxation and Health were not allocated to them and later it seemed to have provided a reason for the withdrawal of support. The then Chief Minister Gurnam Singh made a statement on the floor of the Assembly which reinforced this interpretation.
My honourable Jana Sangh members created a lot of noise over the allocation of Finance to another colleague who does not belong to their party. I must take the House in confidence that at no stage it was agreed that Finance portfolio would be given to the Jana Sangh. It was my prerogative as the Chief Minister and I exercised it. Nevertheless, beneath this demand for key portfolios by the Jana Sangh, in reality is the desire to use the State machine to rehabilitate themselves among the people.45
Further executive business in the Assembly centred on the coalitions’ concern over economic development and on Centre-State relations and language.46 While economic development was the rallying point, the language issue and Centre-State relations remained contentious among the coalition partners. This along with factionalism within the Akali Dal led to the downfall of the Gurnam Singh ministry.
A fourth collation, also a minority coalition government, came into being within the fifth Vidhan Sabha itself after S. Gurnam Singh was replaced by Prakash Singh Badal as Chief Minister. He was sworn in with a new agenda for the coalition government.47
The Jana Sangh bargained for three cabinet berths and one minister of state. The Jana Sangh could get the Ministry of Finance and Industry with change in the leadership of the Akali Dal Legislature Party. Akali factions, clamouring for ministerial berths, threatened to destablise the government. The Chief Minister amended the rules to co-opt these legislators as chairpersons of financial corporations which were earlier treated as offices of profit.48 The Jana Sangh again withdrew support to the coalition on the issue of transfer of Punjabi-speaking areas to Punjab. The withdrawal was sparked by the question of Guru Nanak Dev

83
University’s jurisdiction and the exclusion of Hindi language by Punjabi University.
The 1977 election was unique in that it was an anti-emergency election that saw the Janata Party and its allies voted to power in the Lok Sabha and the Vidhan Sabha. A surplus majority coalition government was formed. The Akali Dal also fought under the banner of the Janata Party. The Akalis won 58 seats, the Janata Party 25, CPI 7 and CPI(M) 8 (see table 4.10). The Janata Party in Punjab was led by the SAD Chief Minister Prakash Singh Badal and had the smallest ministry (16) with only 20 per cent of its MLAs provided with ministerial berths, in contravention of the trend in coalition governments. The legislature saw dissentions on account of both intra-party Akali factionalism (Akali-Nirankari conflict, limits to state autonomy) as well as clash of interests between the Bharatiya Jana Sangh and the SAD.49
These post-election coalitions revolved around anti-Congress and anti-centralism. The Akali Dal supported by the Sikh majority of the newly organised state found itself within striking distance of forming a government. As an alternative to the Congress, the other parties of the state such as the Jana Sangh and the CPI rallied to ally with and support the Akalis in a post-election coalition. Such coalitions were marked with the co-option of leaders representing divergent ideological frameworks and regional interests. These were marriages of convenience of the leadership with the sole aim of capturing power with their ranks regarding each other with suspicion, and a clash of ideological moorings. Even in the CPI’s support base itself, the inherent contradiction between the landed peasantry and the landless workers resulted in a decline in this base. While the flavour of religious symbols was stark in its differentiation, economic issues cut across religious divides to regroup people according to their agrarian and trade interests.
The social matrix was represented in the power structure as a differentiated group in Akali led coalitions, whereas in the Congress government diverse elements were given representation. In other words, these elements were not presented as representing differentiations, but as articulating specific cultural and linguistic interests in the decision making process.

84
These coalitions brought a competition between a single party and multi-party alliance. For instance, this led to appropriation of the dominant political discourse of religious symbolism by the Congress Party.
The post-election coalition brought into focus elite manoeuvrings rather than massification of democracy. To illustrate, a large number of offices of profit were declared offices of non-profit in the 1970s to accommodate legislators. This distorted governance in the state with disproportionate discretion granted to the legislatures. The legislature became an arena to raise contentious ideological issues to appeal to differentiating support bases.
From autonomy to secession: 1980s to 1990s
This phase is characterised by an assertion for state autonomy. The differentiation in the economy was sharpened with the political assertion of the Sikh Panth. Three simultaneous trends emerged during this period and these included demand for state autonomy without unduly disturbing the existing political arrangements; the demand for self-determination within the constitutional framework and the slogan of Khalistan. The path of development and the denial of legitimate claims of people to access their own language, culture and resources produced conditions of structural disequilibrium. The differentiation in the economy sharpened political assertions. Their range, from state autonomy to the demand for Khalistan, reflected the factionalism in the Akalis and their inability to congregate under one banner. Political demagogues used communal and religious symbols and their forms to outdo and eliminate each other with a view to increasing their support base for greater leverage in politics. This provided an ideological cover to the use of violence. The differentiation in the economy sharpened political assertions but the political process represented sectional interests.
Demands were articulated by using methods ranging from peaceful to just short of physical violence to even violent acts. The first major agitation after 1980 was launched in February, 1982, against a bus fare hike by the Akalis, the CPM, the CPI and the Janata Party. These parties gheraoed the State Assembly and the Governor could not open the budget session for over two hours.

85
The Congress Party, which was faction ridden, allowed the situation to drift and then degenerate into communal conflict. In the meantime, sacrileges were committed in religious places, the demand was raised for relaying Gurbani from the Golden Temple, and banning the sale of tobacco, meat and liquor in Amritsar. However, all these assertions, to a very significant extent, could not adversely affect the four-party opposition alliance. In April, 1982, Indira Gandhi came to Kapoori village in Punjab to formally launch the Sutlej-Yamuna Link (SYL) project. The four-party alliance sensed Indira Gandhi’s strategy to use this to win the Haryana Assembly election to be held in May that year and, therefore, launched a morcha in Kapoori against the SYL.50
At the same time, the ruling party also started appeasing the extremist sections in the Akali Dal like Sant Jarnail Singh Bhindranwale, with disastrous consequences. The emergence of a strong Sikh leadership in the form of Sant Bhindranwale started questioning the SGPC leadership. In order to counter the threat posed by the extremists, moderates within the Akali Dal shifted the venue of the morcha from Kapoori to the Golden Temple. This was the end of the four-party alliance. This further led to the communalisation of the secular demand. The Akali Dal continued its morcha but called it dharma yudh from August 4, 1982. Akali volunteers continued to court arrest, off and on. Even after the arrest of over two lakhs persons, no compromise could be reached.
It is this state of affairs that enhanced the appeal of the militants among the middle and small peasantry. The morcha started waning because of increasing state repression and factional flights within the Akali Dal. Instead, the Akali leadership took recourse to specific programmes. On April 4, 1983, it organised a rasta roko agitation on July 17, a protest day and on August 29 a rail roko. Efforts were made to stop work in all offices with a kaam roko call.
On its part, the Congress allowed the situation to drift. It half-heartedly pressed for or offered negotiations and blamed the Opposition and the Akali Dal for blocking a solution to the economic and secular demands. However, the ruling party unilaterally accepted the religious demands of the Akali Dal on February 27, 1983. It was an attempt to shelve real issues such as the demand for more autonomy, water and territorial issues. This strategy produced two results:

86
(a) It made it difficult for the Akalis to mobilise support for other economic demands. Acceptance of religious demands further aggravated the problem, as the Akali Dal-L coined new demands to protect and promote the economic and political interests of the rural elite. For instance, in January, 1984, the Akali Dal-L raised the demand for the amendment of Article 25 of the Indian Constitution. This demand was not raised by the Akali Dal-L in any of its earlier resolutions or charter of demands; and
(b) It helped the Congress to establish its bona fides with the Akali support base.
The demand for an independent Sikh state could not find effective expression in political discourse as it was raised as a slogan by a marginal political leadership rather than the mainstream political forces. The demand for Khalistan did not acquire mass support despite the ruthless political and administrative initiatives and the brutal and senseless killings by its protagonists. The manifestations of this violence like Operation Blue Star of 1984, the assassination of Prime Minister Indira Gandhi in November 1984, and the subsequent anti-Sikh riots thwarted the democratic process.
However, attempts were made to hold elections to legitimize non-democratic and communal politics. The 1985, 1989, and 1992 elections were held in this background. The 1985 Assembly and Lok Sabha elections took place in the context of the Rajiv-Longowal Accord signed in 1984, while the 1989 Lok Sabha elections were held in the background of the failure to honour the same accord.51 In the 1985, Assembly elections, the Congress secured 32 seats with 38 per cent votes and the Akalis secured 73 seats with 38 per cent votes52 (see table 4.10). In the 1989 Lok Sabha elections, the Akali Dal (Mann) won 10 seats with 39 per cent votes.
Election to the State Assembly were postponed on the pretext that the gun would influence voting and the victorious militants would dictate terms. This was patently an afterthought to rationalize the success of the Mann-led Akali Dal in the 1989 election and to ward off future electoral losses of the same shattering magnitude. Incidentally, parties opposing the election secured more than 61 per cent of the votes. In these elections, the agenda of peace was dominant as was reflected in the signing of the Rajiv-Longowal accord in 1984, creating conditions for

87
political participation of the hardlines in Sikh politics in 1989 and providing a ‘façade’ of representative politics in 1992.
The 1992 elections were boycotted by the Akali Dal, resulting in a turnout of only 24 per cent. It was, therefore, rightly labelled as an “apology for a representative character of democratic polity.”53
During the destabilisation of the democratic polity in the violent phase of militancy and state control, the 1985-89 and 1992 elections were used to revive legislative politics. In fact the agenda for the 1992 elections was restoration of peace, unemployment, better returns for the crops rather than issues like state autonomy or the Anandpur Sahib Resolution.
Resurgence of democracy and Punjabi identity: Post- 1990 phase
The triumph of democracy and assertion of the people’s agenda for peace over that of party sectional interests characterised the politics of this period. The Akali Dal was quick to respond to the people’s demand for peace within the gamut of its identity-based politics by widening its agenda from politico-religious identity confined to the Sikh identity to the broader agenda of Punjabiyat.
The Shiromani Akali Dal President, Mr. Prakash Singh Badal, brought the notion of Punjabi unity to the centrestage of Punjab politics mainly to draw legitimacy for its slogan of ensuring lasting peace in the state.
This gave the Akali Dal an added advantage over the Congress which was seen as anti-Sikh due to its role in the November 1984 riots. It is in this background that the Akali Dal structured its campaign with a major thrust on anti-Congressism. In a statement the Akali Dal president, Prakash Singh Badal asked “All Punjabis to join hands in the massive task of social restructuring and economic rebuilding by making sure that anti-people and anti-Punjab Congress regime is routed in the state, lock stock and barrel.”54
The main plank of the Akali Dal was that the unity of all Punjabis could be the only true and dependable basis of lasting peace and there could be no social and political stability without Punjabi unity. This seems to have been prompted by the fact that during the phase of terrorism, legitimate demands like state autonomy, a greater share in river waters

88
and the transfer of Chandigarh to Punjab had degenerated into the movement for Khalistan which played havoc with the people’s lives.
Both the single party governments stuck to the people’s agenda of peace with the Beant Singh Government promoting prosperity with peace. The marginal shift in the Congress agenda in the post-Beant Singh phase was from an emphasis on liberal market reforms to an emphasis on economic subsidies for most sections of society. The concessions covered the peasantry, urban traders, landless labourers and dalits.
The revival of democratic politics and institutions was accompanied by a resurgence of Punjabi identity. Political parties, which had been historically articulating the language question on communal lines, shifted their stance. For instance, the Akali Dal-BJP in their Common Minimum Programme (1997) asserted, “Punjabi being our mother tongue is the state language of Punjab. Every Punjabi is proud of the richness of the Punjabi language and culture.” This was a major shift because the underlying thrust of the dominant political discourse in the pre-1992 phase was that Punjabi was the language of the Sikhs and the Hindus never owned Punjabi as their language.
In addition, the Akali Dal in its policy programme adopted on 14 April, 1995, emphasised disputes over the apportionment of river waters, allocation of Punjabi-speaking territories as a discrimination against Punjab rather than the Sikhs (as it used to be in pre-1992 resolutions), and linking the prices of agricultural products with the price index. To quote:
Over the decades, Punjab has continually been a victim of the discriminatory and repressive policies of the Centre, in particular the rights of Punjab in respect of its left-out territories and the river waters have been ruthlessly suppressed and undermined ... For pursuance of the above objectives, the spirit of Punjabiat would be strengthened so that these matters get projected as common problems of the entire Punjabis rather than a section thereof (emphasis added) 55.
The resolution indicated a shift in the Akali Dal stance from its earlier political pronouncements. The resolution reflected a change in the

89
social category of analysis from the Sikhs to the Punjabis. The resolution implies that the demands raised pertain to Punjabis and their non-acceptance is a discrimination against Punjabis rather than Sikhs. And the struggle for realisation of these demands has to be launched in the spirit of Punjabiat rather than as Khalistanis or Sikhs.
Another major shift in the political discourse was on issues relating to greater autonomy for the states. The BJP changed its position from a strong centre to greater autonomy for states. The BJP’s 1997 election manifesto reinforced this shift. To quote;
We [BJP] shall pursue with the centre for the implementation of the main recommendations of the Sarkaria Commission56,
(a) Restore the balance of resources in favour of the states,
(b) Ending the misuse of Art 356 of the Indian Constitution57,
(c) Consulting states on the choice of governors.
All these issues were incorporated in the Common Minimum Programme 1997 evolved by the Akali-BJP alliance. However, it was interesting to note that the thrust of the Akali Dal agenda changed from anti-centrism to co-operative federalism.
The Akali-BJP government has opened a new chapter in Centre-State relations, ushering in the age of co-operative federalism in the country. The era of confrontation has been effectively ended and replaced with a forward looking thrust on working together for the overall good of the state and the nation.58
This position marks a radical shift from the anti-centre stance as reflected in the 1973 autonomy resolution and later in its 1985 memorandum to the Sarkaria Commission. Further, there was a noticeable shift in the Akali Dal (Badal) resolutions and assertions with emphasis on human rights. The main plank of the Akali Dal was that the unity of all Panjabis would become a reality only if lasting peace was ensured.59 There was also a pragmatic consideration of cementing the Akali-BJP alliance which demanded human rights to be played down and peace at any cost to be reinforced.

90
Peace in Punjab is very dear to us. We will make all endeavours to ensure peace and harmony that will last. The unity of all Punjabis could be the only true and dependable basis of lasting peace and there could be no social and political stability without Punjabi unity.60
This gave the Akali-BJP alliance an advantage over the Congress which was seen as anti-Sikh due to its role in Operation Blue Star and the 1984 anti-Sikh riots. The Congress continued to harp on the restoration of peace as its main achievement; whereas the Akali Dal-BJP alliance presented the maintenance of peace as their main agenda. The Congress wanted to take credit for the restoration of peace, but was reluctant to own the manner in which peace was brought, particularly when a large number of policemen were being hauled up by the judiciary.61 This ambivalent position led to a shift in the mood of the electorate.
For the smooth functioning of the pre-election alliance between the Akalis and the BJP a committee was constituted to allocate seats. The main criterion listed by the committee was to allocate seats on the basis of ‘status-quo claim’ and ideological support base62. The BJP staked its claim to 34 seats and was allocated 22 for 1997 and 23 seats for 2002 and 2007 assembly elections. Thus most of the BJP seats were urban and had Hindu candidates. The Akalis, on the other hand, were confined to their traditional support base in the rural and semi-urban areas and the Malwa region of the state. The ‘status-quo claim’ was based on the following principles;
(a) Seats which have been contested by one of the coalition partners in previous elections. From this quota 14 and 42 seats were allocated to the BJP and the Akali Dal respectively
(b) Seats which the coalition partners have contested against each other in previous elections were allocated on the basis of the number of times a seat was contested by a party irrespective of the outcome.
There were 23 seats in this category. The BJP had contested more often from 9 constituencies as compared to the Akali Dal. In the 1997 elections it was allocated 8 seats and in 2002 elections it was allocated 9 seats from this category.

91
Of the remaining 14 seats, the BJP staked its claim on 7 seats. Its claim was not conceded. There were 3 seats which were contested by the both parties on equal occasions and the Akali Dal was ahead of the BJP in two and the remaining seats were rural and closer to the Akali ethos. The other four seats were contested more often by the SAD.
(c) There were 38 seats which the BJP and the SAD had contested, but not in opposition to each other. The BJP staked its claim to 4 constituencies. The SAD had contested three seats more often and therefore these were allocated to the SAD and one seat remained contentious.
An analysis of seat sharing in terms of bargaining of coalition partners shows that the BJP managed 12 seats (55 per cent) beyond its quota in 1997 elections as compared to its performance in 1996 parliamentary elections, whereas, the SAD managed 17 seats (18 per cent) beyond its quota. (See table - 4.14 )
Table – 4.14 Bargaining power of different alliance partners : Proportions of seats allocated
to alliance partners beyond normal quota (1997 Assembly Election based on 1996 Parliament Election)
Alliance in 1997 Assembly Election
No. of Seats Contested in 1997 Assembly Election
Performance in 1996 in Assembly Segments of Parliamentary Election
Winner Runner Seat managed to
get beyond Quota
BJP 22 2 8 12 (55%)
SAD 92 59 16 17 (18%)
CPI 15 0 0 15 (100%)
CONG 105 32 77 -4 (-4%) Source: Election Commission Reports, 1996-1997
The Akali Dal and the BJP pre-election coalition won the 1997 elections. This was a surplus majority coalition. It was for the first time in the electoral history of Punjab that the Akali Dal could have formed the government on their own.
The SAD won 75 seats out of 92 contested seats and was polled 38 per cent votes (see table 4.10). It maintained its dominance in rural areas with 53 legislatures (71 per cent) from semi-urban 19 MLAs (25 per cent) and from urban 3 MLAs (4 per cent) (see table 4.3). The BJP as a minor partner in the coalition won 18 of the 22 contested seats with 8 per cent votes. A majority of these were Sikh Jats (55 per cent) (see

92
table 4.11) and agriculturists (60 per cent). The urban Hindus, traders and professional were nominal. Interestingly, the 31 per cent of the MLAs belonged to scheduled castes and 9 per cent to backward castes (see table 4.11). The urban Khatris also found representation in Akali Dal. In other words, the SAD represented a wide spectrum of social matrix. Whereas, a majority of BJP legislators (i.e. 14 (78 per cent) were from urban and semi-urban areas and four could win from rural areas (see table 4.3). Among the BJP MLAs, a majority were Hindus belonging Khatri and Bania castes (61 per cent) involved in trading and professional work. It continued to provide representation to scheduled and backward castes constituting around 33 per cent of its legislatures.
It would be worthwhile to examine the linkage between social matrix and legislative representation with the ministerial representation. It was a jumbo cabinet with 41 ministers. The Chief Minister Prakash Singh Badal allocated berths to its pre-election coalition partner in proportion to the MLAs elected. The SAD had 81 per cent of the legislators and its share in the cabinet was 80 per cent. Similarly, the BJP had 19 per cent of the legislators and its share in the cabinet was 19 per cent (see table 4.13). The wide spectrum of social representation of its SAD MLAs influenced its decision for allocation of portfolios.
The portfolio on which the BJP has been traditionally staking its claim were kept with the SAD. The portfolios such as finance, industry, excise and taxation were not allocated to the BJP but were now shifted into the domain of the Chief Minister and his loyalists.
The BJP leadership did negotiate for allocation of their traditional portfolios to cater to their support base. To quote a senior BJP leader; ‘We have put forward our claims for Local Bodies, Industry, Finance, Housing and Urban Development, Food and Civil Supplies, Excise and Taxation and Health in this order of priority.’63
A senior Akali leader in an interview mentioned that the BJP’s claim for Finance Ministry was discussed in the Political Affairs Committee (PAC) of the Akali Dal which unanimously rejected it. The BJP could retain some of its traditional departments like Local Bodies, Health and Family Welfare. Other portfolios included Food and Supplies, Forest, Legislative and Legal Affairs, Education and Excise and Taxation (Minister of State), Rural Development and Panchayats (Minister of State).

93
This clearly indicated that the respective traditional support bases of political parties have branched into other sectors of economy and pre-election coalition works more to the advantage of major partner specially if its is surplus majority coalition. As is evident BJP’s bargaining capacity was much higher in post-election coalitions particularly when the Akali Dal was faction ridden.
The other competing political formation i.e. the Congress and the CPI could not register its presence in diverse social, economic and regional support base. The Congress could win 14 seats with 25 per cent votes (see table 4.10). It could win only 3 urban and 4 semi-urban seats (see table 4.3). Not only this, the Congress could only elect 7 per cent of its legislators from Scheduled Castes. Its vote share was lowest so far.
In 2002 election, the Congress and the CPI pre-election coalition formed the government. This was mainly because the Akali-BJP coalition formed around a common minimum programme, used to defend the alliance rather than nurture the ideological basis carved in 1997. The process of redefining the religious identities and building bridges with the Sikh fundamentalist fringe elements sharpened factionalism within the SAD and alienated a large section of urban voters.64 The noticeable shift from Punjabi identity to reinforcement of Sikh identity made urban Hindu voters align with the Congress party. The efforts of the SAD to represent a large section of scheduled caste in the 1997 legislature suffered a set back as its policies like free power to peasant landowners made rural based scheduled caste apathetic to the SAD-BJP alliance. A sample survey in 2004 of the SAD (39 per cent) and the BJP (34 per cent) party workers perceived that communal amity is the basis of coalition (see table 4.15).
Whereas, the Congress (27 per cent) and the CPI (52 per cent) party workers opined that this alliance was to exploit religion sentiments. The politics of confrontation of the then Chief Minister Prakash Singh Badal with Gurcharan Singh Tohra, the then SGPC President and Bhai Ranjit Singh, the Akal Takht Jathedar led to the division within the Akali support base.65 All these factors did not weaken the alliance. The BJP was allocated 23 seats as compared to 22 seats in 1997 elections.

94
Table - 4.15 Party Activist Perception on Basis of the Coalition between BJP + Akali Dal (Badal)
Party Amity Between
The Hindus
and Sikhs
Electoral Arithmetic
Anti Congress
Promote Interests of upper
castes
Exploit Religious
Sentiments
National Development
Traditional allies
No Idea Good
Governance Total
Congress 2 23 4 17 17 63
(3.17) (36.51) (6.35) (26.98) (26.98) (100.00)
SAD (B) 27 8 11 15 8 69
(39.13) (11.59) (15.94) (21.74) (11.59) (100.00)
BJP 15 2 4 12 7 4 44
(34.09) (4.55) (9.09) (27.27) (15.91) (9.09) (100.00)
Akali Dal (Mann)
1 2 3
(33.33) (66.67) (100.00)
BSP 1 14 5 5 6 31
(3.23) (45.16) (16.13) (16.13) (19.35) (100.00)
CPI (M) / CPI 9 3 17 4 33
(27.27) (9.09) (51.52) (12.12) (100.00)
Total 45 49 16 8 39 23 22 29 12 243
(18.52) (20.16) (6.58) (3.29) (16.05) (9.47) (9.05) (11.93) (4.94) (100.00)
Source : Party Activists Survey, 2004

95
The seat sharing principle was based on the status-quo claim as was the case in 1997 elections. The bargaining power of alliance partners indicates that the BJP could manage to get 3 seats (13 per cent) less than its quota as compared to its performance in assembly segments in the 1999 parliamentary elections. The SAD could manage to get 16 seats (17 per cent) beyond its quota.
The CPI and the Congress alliance proved to be more beneficial to the CPI as it could manage 2 seats (18 per cent) beyond its quota and the Congress could get 6 seats (6 per cent) beyond its quota (see table 4.16).
Table – 4.16 Bargaining power of different alliance partners: Proportions of seats allocated to alliance
partners beyond normal quota (2002 Assembly Election based on 1999 Parliament Election)
Alliance in 2002 Assembly Election
No. of Seats Contested in 2002 Assembly Election
Performance in 1999 in Assembly Segments of Parliamentary Election
Winner Runner Seat managed to get
beyond Quota
BJP 23 11 15 -3 (-13%)
SAD 92 22 54 16 (17%)
CPI 11 8 1 2 (18%)
CONG 105 66 33 6 (6%)
Source : Election Commission Reports, 1999-2002
The state Congress leadership was opposed to alliance with the CPI with so many seats allocated to it.66 It was the direct intervention of the Congress high command which made this alliance functional. On the other hand, the CPI leadership opined that it was allocated seats for which it did not stake its claim, for instance, Pakakalan instead of Khanna, Panjgrahin instead of Rampura Phul. In three constituencies67 the Congress rebel candidates were in the contest. Interestingly, 21 per cent of the Congress Party activists reported that the alliance was based on the decision of the central leadership. In contrast, 91 per cent of the CPI activists felt that the coalition was to fight communal forces (see table 4.17). The SAD (78 per cent) and the BJP (84 per cent) viewed the Congress-CPI coalition as mere electoral arithmetic.

96
Table – 4.17 Party Activist Perception on basis of the Coalition between Congress and CPI or CPI (M)
If yes, give name of the party
To remove communal
parties No idea
Electoral Arithmetics
No other party is
ready for coalition
Decision of Central Leadership
Natural allies / same
ideology
Ideological commonalties
Congress
30 2 8 2 13 12 67
(47.62) (3.17) (12.70) (3.17) (20.63) (19.05) (100.00)
SAD (B) 1 5 46 7 4 63
(1.69) (8.47) (77.97) (11.86) (6.78) (100.00)
BJP 4 32 2 4 42
(10.53) (84.21) (5.26) (10.53) (100.00)
Akali Dal (Mann)
2 1 3
(66.67) (33.33) (100.00)
BSP 1 8 20 2 3 34
(3.23) (25.81) (64.52) (6.45) (9.68) (100.00)
CPI (M) / CPI
30 3 33
(90.91) (9.09) (100.00)
Total 62 21 109 13 24 13 242
(27.31) (9.25) (48.02) (5.73) (10.57) (5.73) (100.00) Source: Party Activist Survey, 2004
If we analyse the election in terms of votes polled we find that the Akali vote bank has remained intact but it was divided between the SAD (Badal) which secured 31 per cent and the Akali Dal (Tohra) got 5 per cent votes in 2002 elections. The SAD could win 61 seats. There has been major shift in the vote banks of urban Hindus and Scheduled Castes. The shift adversely affected SAD’s main ally Bharatiya Janata Party as could win only 3 seats and 6 per cent votes. Shift in urban Hindu votes and the factionalism within the Akalis caused defeat to the Akali Dal (Badal) – BJP alliance.68 The SAD suffered defeat in the semi-urban and the BJP was routed the urban areas. There has been a major decline of Sikh Jat peasants and Scheduled Caste MLAs in SAD.
The Congress and the CPI alliance formed the government in the state with outside support of the CPI. This was a surplus majority coalition. The Congress could win 62 seats with 36 per cent votes. The Communist Party of India could win 2 out of 11 seats allocated (see table 4.10).
The Congress made significant improvement in all the three cultural zones. The Congress fielded 44 Sikh Jat candidates and 21 won in the elections. The Congress gained largely from the urban electorates as it was seen to pursue anti-Sikh extremist politics even though the urban votes polled itself declined. The Congress elected almost equal number of Sikh Jats and urban Khatri and Bania traders followed by Scheduled Castes.

97
In the 2007 election, the Congress and the CPI could not enter into an alliance. This was mainly because of the opposition of the state level Congress leadership, particularly the then Chief Minister, Capt. Amarinder Singh. Capt. Amarinder Singh in a press statement said that the Left parties had failed to transfer their votes to the Congress in the 2002 assembly elections. He further added that the Left parties had collected their workers from all over the state to work only in constituencies where their candidates had been fielded.69 The Left parties attributed the break in the alliance to the differences on policies. The CPI(M) General Secretary, Mr. Prakash Karat, said that the Left mantra for the polls would be to defeat the SAD-BJP combine and expose the Congress. “We will give a call for the defeat of the SAD-BJP combine and expose the Congress which for the past five years has been pursuing policies that have been harmful to the state as well as the people.”70 The impact of this break in alliance was visible in the political agenda advocated by the Congress. The Congress Party’s political campaign lost its aam admi thrust. For example, one of the advertisements released by the Congress Government claimed that it had “inspired top industrial houses to invest Rs. 86,161 crore in 282 mega projects, thereby generating 20 lakh jobs”. It was also claimed that if the opposition party, the Akali Dal was brought back to power, land prices would crash. A large section of the voters i.e. 53 per cent, as per a sample survey, mentioned that the increase in land prices had no impact on them as they had no stake in land. And 30 per cent opined that it had benefited land speculators and illicit businessmen. Around 12 per cent said that it had benefited rich peasants. Another 5 per cent were of the view that it had become impossible for the common man to own a shelter (see table 4.18).
Table – 4.18 Impact of rise in land prices
Frequency Per cent
No stakes in land 164 52.90
Rich land owners 39 12.58
Land speculators and illicit businessmen 93 30.00
Difficult to own a shelter 14 4.52
Field Survey, February, 2007
Such a claim was contrary to the ideological filter of aam admi used by the Congress-CPI alliance in the last elections. Those who did not have the means might be deprived by the rising prices of land of even their own shelter or a house. The irony of the situation was that the compensation received by the farmers, ranging from Rs. 40 lakh to Rs. 60 lakh for an acre

98
of land, was not adequate to get them a shelter of 5 marlas on the same land. Had the Congress Party, aligned with the Communists, it may not have marketed this as its main electoral plank. Further, alliance with the Communists might have checked the Congress Party’s vacillation between religious identity and a secular Punjabi identity. The Congress Party focused more on the rural Jat peasantry and the Sikh identity by highlighting the termination of river waters agreement and overactive participation in religious celebrations of the Sikhs and the SGPC elections. These policies and pronouncements had an adverse impact on the poll performance of the Congress in 2004 parliamentary elections. In these elections the urban and the dalit vote shifted away from the Congress. The 2007 assembly election results were a reflection of the 2004 parliamentary elections. The Congress Party’s vote share in the 2004 parliamentary elections in semi-urban constituencies decreased from 40 per cent to 35 per cent and in urban constituencies from 54 per cent to 48 per cent as compared to 1999 parliamentary elections. Similarly, in 2007, the Congress Party’s vote share in semi-urban constituencies decreased from 35 per cent to 43 per cent and in urban constituencies from 47 per cent to 40 per cent as compared to the 2002 assembly elections (see table 4.3). Traditionally, its core support base consists of a large majority of Hindu Dalits with their ‘uncertain religious allegiance’, urban Hindu traders and migrant landless labourers. The shift from Punjabi identity to a narrow religious identity testifies to the fluid response of the voters. In a sample survey conducted before the elections, around 26 per cent mentioned that the lack of alliance between the Congress and the Communist parties should work to the advantage of the SAD-BJP alliance. Ten per cent viewed that it would work to the advantage of the Congress, whereas, 64 per cent said that it would make no difference to the elections (see table 4.19).
Table – 4.19 On lack of Congress-CPI Alliance
Frequency Per cent
Advantage Congress 32 10.32
Disadvantage Congress and CPI 80 25.81
No impact 198 63.87
Total 310 100.00
Field Survey, February, 2007
The election results showed that the Congress Party had won 7 of the 11 seats which in the 2002 elections were allocated to the CPI, whereas, the Communists acted as a spoiler for the Congress in four seats i.e. Batala, Balachaur, Dina Nagar and Bhadaur. It is clear that the alliance between the

99
Congress and the Communists had political advantages rather than merely electoral. Therefore, the impact of the alliance should be measured in the political domain rather on an electoral arithmetic scale.
The Akali-BJP pre-election coalition formed the government after the 2007 assembly elections. The SAD-BJP alliance won 68 seats and 45 per cent of the total votes polled. The Congress could win 44 seats with 41 per cent votes. The Communist parties could not win a single seat, but could secure one per cent of the votes. The alliance articulated its 1997 election plank of Panjabiat, Punjabi identity and peace along with issues relating to price rise, corruption and mega projects.
The rise in the prices of essential commodities, food subsidy and poverty found mention perhaps for the first time since 1967, and emerged as the main issues in the elections. Other traditional issues such as danger to the “Sikh Panth”, federalism and Sikh identity could not find much space in the electoral discourse. To the discomfort of the Congress, a ‘Sikh’ Prime Minister could not emerge as a star campaigner and vote catcher. Most of the election rallies addressed by the Prime Minister were thinly attended and without the usual Punjabi enthusiasm. The fact that the Prime Minister has never presented himself as a ‘Sikh’, but as a professional economist, cannot be denied. Therefore, the extent to which he mirrors the economic reforms agenda and the price rise as its fall-out along with his opposition to free electricity and water to the farmers may have distanced him from the “aam admi”.
Similarly, the changed political context from Sikh identity to Punjabi identity has pushed leaders like Uma Bharti and Narendra Modi to the margins of electoral politics in Punjab.
In a sample survey in 2007, a majority of SAD supporters (72 per cent) considered alliance with the BJP a symbol of communal amity rather than an electoral arrangement (see table 4.20).
Table – 4.20 On SAD-BJP Coalition (SAD Supporters)
Frequency Per cent
Electoral liability 63 20.32
Electoral savvy 24 7.74
For communal amity 223 71.94
Total 310 100.00
Field Survey, 2007

100
On the contrary, a majority of BJP supporters (85 per cent) considered it an electoral necessity (see table 4.21).
Table – 4.21 On SAD-BJP Coalition (BJP Supporters)
Frequency Per cent
For community amity 43 13.87
Electoral liability 2 0.65
Electoral useful 265 85.48
Total 310 100.00
Field Survey, 2007
Seat sharing was based on the status-quo claim as was the case in 1997 and 2002 elections. The bargaining power of the alliance partners indicates that the BJP could manage to get 2 seats (9 per cent) beyond its quota share as compared to its performance in the assembly elections of 2002. The SAD could get 9 seats (10 per cent) beyond its quota (see table 4.22).
Table – 4.22 Bargaining power of different alliance partners: Proportions of seats allocated to alliance
partners beyond normal quota (2007 Assembly Election based on 2002 Assembly Election)
Alliance in 2007 Assembly Election
No. of Seats Contested in 2007 Assembly Election
Performance in 2002 Assembly Election
Winner Runner Seat managed to
get beyond Quota
BJP 23 3 18 2 (9%)
SAD 94 41 44 9 (10%)
Source : Election Commission Reports, 2002-2007
If we analyse the elections in terms of votes polled and seats won, the SAD managed to get 37 per cent votes and 49 seats and the BJP polled 8 per cent votes and got 19 seats. The Congress managed to get 41 per cent votes and 44 seats (see table 4.10). The SAD could not get a majority on its own and therefore became dependent on the BJP to form a government. The SAD could not perform in its traditional support base of the Malwa region of the state. In 1997, the SAD got 44 seats in this region which declined to 19 in the 2007 elections (see table 4.8). Many of the SAD stalwarts suffered defeat in this region. Support to the SAD in this region is continuously declining. However, in this elections an open support declared for the Congress by a popular religious sect (Dera Sacha Sauda)71 contributed to the defeat of the SAD. In the other

101
two regions i.e. the Doaba and the Majha, the trends of 1997 elections were repeated in 2007. The Congress did not learn from the Akali-BJP alliance in 2002 and its own defeat in the 2004 parliamentary elections that it was not electoral wisdom to cater to sectional interests and to indulge in overactive involvement in identity politics. It could make inroads into the Akali Dal bastion, but suffered a major loss in its own support base of dalits, urban traders, slum dwellers etc. The Congress suffered defeat in the semi-urban areas and was routed in the urban constituencies.
The SAD could get elected only 25 Sikh Jats in 2007 as compared to 41 in the 1997 elections. In 2007, the Congress could get elected almost an equal number of Sikh Jats as compared to the SAD. This clearly signifies that the Sikh Jats are not exclusive supporters of the SAD. This shift is significant in the post-Blue Star phase. On the contrary, the number of dalit MLAs in the Congress was reduced from 14 in 2002 to 7 in 2007. And the BJP could maintain in 2007 its 1997 tally of 4 dalits. The number of dalit MLAs in the SAD is 16 as compared to 23 in the 1997 elections (see table 4.11). It is interesting to note that the main political parties represent evenly the caste configuration. The linkages between the social matrix and legislative representation in terms of religious affiliation has shown that the number of MLAs who belonged to the Hindu religious group increased in the SAD in 2007 as compared to 2002 and 1997 elections. Whereas, a majority of BJP MLAs were Hindus belonging to Khatri, Brahmin and Bania castes (58 per cent), a majority of the SAD MLAs were rural based (71 per cent). It represented semi-urban (22 per cent) and urban constituencies (6 per cent). Interestingly, it has given increased representation to urban areas as compared to 1997 elections. The number BJP MLAs in the urban areas increased from 28 per cent in 1997 to 37 per cent in 2007 elections. It has also given more representation to rural areas which increased from 22 per cent in 1997 to 26 per cent in 2007. Both the parties could represent a wide spectrum of the social matrix. (See table 4.3)
Chief Minister Prakash Singh Badal was authorised to give representation to its coalition partner the BJP. The SAD has 72 per cent of the legislators and its share in the Cabinet is 72 per cent. Similarly, the BJP has 28 per cent of the legislators and its share in the Cabinet is 28 per cent. The number of legislators of the SAD decreased as

102
compared to 1997 elections and so in their representation in the Cabinet.
The BJP, however, did negotiate for such portfolios as were linked with urban areas.72 It was also reported in the Press that the BJP staked its claim to portfolios like Industries, Excise and Taxation, Local Bodies, Health, Transport and Urban Development. The BJP could retain portfolios like Local Bodies, Health and Family Welfare, Forests and Medical Education, Industries and Commerce. But it could not get Urban Development, Excise and Taxation. It also staked its claim to Deputy Chief Minister’s post.
In terms of representation of social coalition in the Ministry, 39 per cent were from Majha, 33 per cent from Malwa and 28 per cent from Doaba. The SAD, however, gave proportionately higher representation to Malwa (31 per cent), Doaba (15 per cent) and Majha (29 per cent). Whereas, the BJP gave higher representation to Doaba (43 per cent) and Majha (29 per cent) from among the MLAs elected from each region (see table 4.13).
The coalition gave higher representation to rural areas (50 per cent) followed by semi-urban (39 per cent) and urban (11 per cent). The SAD gave proportionately higher representation to semi-urban areas (36 per cent), followed by rural (26 per cent) from among the MLAs elected from these regions. It has not given any representation to urban MLAs in the ministry. The BJP has also given higher representation to MLAs from semi-urban areas (43 per cent) followed by urban (28 per cent) and no representation to rural MLAs from among the elected MLAs from these areas (see table 4.23).
Interestingly, the representation of the Jats continued to remain higher i.e. 55 per cent in the ministry. However, the representation of the dalits declined to 11 per cent from 22 per cent in 1997 and that of the backwards increased to 11 per cent from 7 per cent in 1997. The SAD gave proportionately higher representation to the Jats i.e. 40 per cent. But it has decreased from 49 per cent in 1997 ministry. There is a noticeable decrease in the dalit representation from 35 per cent in 1997 to 6 per cent in the 2007 ministry.

103
Table – 4.23 Election Year wise, Ministerial Representation according to Party and Location
Akali BJS/BJP INC Total(SAD+BJP+INC)
Rural Semi Urban
Urban Total Rural Semi Urban
Urban Total Rural Semi Urban
Urban Total Rural Semi Urban
Urban Total
1969 MINISTERS 13 10 1 24 1 1 2 4 14 11 3 28
MLAs 23 19 1 43 1 5 2 8 24 24 3 51
** 56.52 52.63 100.00 55.81 100.00 20.00 100.00 50.00 58.33 45.83 100.00 54.90
1972 MINISTERS 6 8 3 17 6 8 3 17
MLAs 31 26 9 66 31 26 9 66
19.35 30.77 33.33 25.76 19.35 30.77 33.33 25.76
1977 MINISTERS 6 5 0 11 1 2 2 5 7 7 2 16
MLAs 43 14 1 58 5 12 8 25 48 26 9 83
13.95 35.71 0.00 18.97 20.00 16.67 25.00 20.00 14.58 26.92 22.22 19.28
1980 MINISTERS 9 4 3 16 9 4 3 16
MLAs 30 21 12 63 30 21 12 63
30.00 19.05 25.00 25.40 30.00 19.05 25.00 25.40
1985 MINISTERS 22 6 28 23 6 28
MLAs 53 20 0 73 53 20 73
41.51 30.00 38.36 43.40 30.00 38.36
1992 MINISTERS 15 12 4 31 15 12 4 31
MLAs 51 27 9 87 51 27 9 87
29.41 44.44 44.44 35.63 29.41 44.44 44.44 35.63
1997 MINISTERS 23 10 33 0 6 2 8 23 16 2 41
MLAs 53 19 3 75 4 9 5 18 57 28 8 93
* 43.40 52.63 0.00 44.00 0.00 66.67 40.00 44.44 40.35 57.14 25.00 44.09
2002 MINISTERS 14 5 6 25 14 5 6 25
MLAs 32 19 11 62 32 19 11 62
43.75 26.32 54.55 40.32 43.75 26.32 54.55 40.32
2007 MINISTERS 9 4 13 3 2 5 9 7 2 18
MLAs 35 11 3 49 5 7 7 19 40 18 10 68
25.71 36.36 0.00 26.53 0.00 42.86 28.57 26.32 22.50 38.89 20.00 26.47 Note : Minister/MLAs. With Percentages the proportion of ministers to MLAs. (Data pertains to the time of the Constitution of Ministry) ** 5 MlA from Other Paries joined Akali in 1969 * 1 MLA from other party shifted to Akali in 1997 Source: Punjab Vidhan Sabha Compendium of Who's Who of Members (1960-2002), Chandigarh:Punjab Vidhan Sabha Secretariat, 2003 Election Commission Reports, Punjab (1967-2007)

104
The Akali-BJP coalition functioned smoothly in the first two years as the BJP central leadership decided to allow a free hand to the SAD chief Minister S. Prakash Singh Badal. In the midst of Parliamentary elections in 2009, the BJP central leadership also used SAD platform to present National Democratic Alliance (NDA) as a formidable and united forum, in a massive rally organised by SAD leadership in Ludhiana. However, in the background of 2009 parliamentary election results, weakening of L.K. Advani and nomination of Nitin Gadkari as BJP President, this coalition came under scrutiny. In Parliamentary elections, the SAD could win only four seats as compared to eight in 2004 Parliamentary elections, with 34 per cent votes while the BJP managed to retain only one seat out of four seats secured earlier in 2004 with 10 per cent votes. Interestingly, in 2009 Parliamentary elections, the BJP won only in one assembly segment as compared to 19 seats won in 2007 Assembly elections. However, the SAD could win in fifty-one assembly segments in 2009 Parliamentary elections as compared to forty-one assembly seats won in 2007 Assembly elections. Within the BJP, this defeat was attributed to indifferent attitude of the SAD leadership towards their urban support base and the party activists. The coalition partners bargained with each other to share the spoils of power in negation to the norms of secular and democratic governance. For instance, the State BJP core committee demanded a complete rollback of the revised power tariff in the State. And, it expressed concern over continuation of free power supply to farming sector and “that too at the cost of taxing other categories of consumers”. 73 Historically, the BJP has support amongst urban Hindus and the SAD support base is amongst the rural Jat-Sikh peasantry. The tinge of communal arithmetic is being increasingly invoked by a faction of the state BJP leadership. This faction has been nurtured and guided by the communal political ethos of the first four unsuccessful SAD-BJP coalition governments formed in the pre-Operation Blue Star phase.
It is worth noticing that in the post-2009 Parliamentary elections and in anticipation of the 2012 Assembly elections, political bargaining amongst the coalition partners for everyday governance is acquiring communal overtones.74
A comparative analysis of the SAD led coalition with the Congress led coalition in terms of reflection of social coalition in the cabinet shows following trends:

105
(a) The Akali-BJP coalition gave higher representation to the Sikh, whereas the Congress tried to balance it.
(b) The Akalis overrepresented their stronghold Malwa region and the Congress overrepresented Doaba and Majha regions.
The impact of pre-election coalitions brought exclusive support bases of political parties into the competitive spectrum. The major parties i.e. the Congress and the Akalis increased their vote share in other parties stronghold. For instance, the Akalis increased their support in urban and semi-urban, three cultural zones and other than Sikh Jat castes. The Congress could expand its base in rural Punjab. These two parties having diluted their ideological positioning, relied on policy interventions.75 The BJP could not compensate for their ideological compromise with proactive policy interventions to keep their support base intact. There has been a sense of neglect and perception of relative deprivation amongst the urban voters as compared to rural.
The social spectrum was represented in the legislative coalition but power sharing at the level of decision making was seen to be discriminatory by a section of dalits. Their assertions have become visible in non-electoral spaces.
The culture of coalition formation has its roots in the pre-independence phase. The Congress and the Muslim League were the two axes around which the coalition politics revolved. The Akali Dal and the Hindu Maha Sabha clearly stated that to protect the interests of their support base they might even form a coalition with the Muslim League. After independence, in partitioned Punjab, the SAD merged with the Congress twice and regionalised the national politics of the Congress. For instance, factions in the Congress supported the Punjabi Suba and Save Hindi agitations, whereas, the mandate of the Indian National Congress was to oppose both. This politics of merger was replaced by coalition politics in the reorganised Punjab.
Therefore, it would be appropriate to characterize the phase between 1967-1980 as the initiation of coalition politics which coincided with the decline of one-party dominance in legislative politics. The decline of one party dominance initiated two distinct trends in the party dynamics in Punjab. The effective number of parties by seats were more in post-

106
coalition phase i.e. 3.5 in 1967 and 3.2 in 1969. Whereas, in the pre-election coalition phase it was 2.4 in 2002 and 2.9 in 2007. The effective number of parties by votes was the highest i.e. 4.5 in 1967(see table – 4.24).
Table – 4.24 Taagepera and Shugart Index for General Assembly Elections of Punjab from 1967 to 2007
Election Year Effective Number of Parties by Votes
Effective Number of Parties by Seats
1967 4.5 3.5
1969 3.9 3.2
1972 3.5 2.1
1977 4.0 3.1
1980 3.4 2.5
1985 3.3 2.1
1992 3.9 1.8
1997 4.2 2.2
2002 4.1 2.4
2007 3.1 2.9
Source: Calculated from the data of Election Commission Report, 1967 - 2007
It can, therefore, be hypothesised that at the micro level political parties follow the strategy of expansion in post-election coalitions and the strategy of consolidation in pre-election coalition. However, the Congress remained capable of forming a government on its own, averaging above 30 per cent of the votes. Whereas, the SAD with consistent vote share needed a coalition partner to be electorally viable and more so politically stable.
It is interesting to note that only the SAD base which was 25 per cent of the vote share in post-election increased to 35 per cent in pre-election coalition formation (see graph – 4.1). Whereas, the support base of the Bharatiya Janata Party, the Communist Party of India, and the Indian National Congress decreased in pre-election coalition politics.

107
Graph – 4.1 Partywise Support Base [Post Election (1967 – 1969) to Pre Election Coalition (1997-2002-2007)]
GRAPH - 1
PARTY WISE SUPPORT BASE
[POST ELECTION (1967 - 1969) TO PRE ELECTION COALITION (1997-02-07)]
35.45
38.36
34.92
9.40
25.14
0.773.161.875.01
7.46
0.00
5.00
10.00
15.00
20.00
25.00
30.00
35.00
40.00
45.00
POST
ELECTION
PRE
ELECTION
POST
ELECTION
PRE
ELECTION
POST
ELECTION
PRE
ELECTION
POST
ELECTION
PRE
ELECTION
POST
ELECTION
PRE
ELECTION
SAD SUPPORT BASE BJS /BJP SUPPORT
BASE
CPI SUPPORT BASE CPM SUPPORT BASE INC SUPPORT BASE
PRE AND POST COILATION SUPPORT BASE
PE
RC
EN
TA
GE
OF
VO
TE
PO
LL
ED
Based on constituency wise
data for assembly elections
20.1
to 3
5.1
More
th
an
35
.1
0 to 1
0
0 to 1
0
0 to 1
0
0 to 1
0
0 to 1
0
0 to 1
0 More
th
an
35
.1
20.1
to 3
5.1
Source : Election Commission Report, Punjab 1967-2007
The Bharatiya Janata Party support base declined as it underplayed its ideological thrust and could not make policy interventions for its urban base through executive decisions. The Congress gained in urban areas not because of executive decisions but because it was seen to pursue anti-Sikh minority politics. In the absence of urban centric policy interventions the urban votes polled continued to decline (see graph – 4.2).
Graph – 4.2 Party wise Support Base - Location wise
40.39
6.25
38.76
14.36
36.12
25.56
39.24
4.58
34.11
38.40
0.901.92
3.414.13
27.6626.83
35.36
0.711.731.692.98
10.5010.77
31.49
36.43
0.030.382.20
5.842.67
0.00
5.00
10.00
15.00
20.00
25.00
30.00
35.00
40.00
45.00
(POST
ELECTION
1967 AND
1969)
(PRE
ELECTION
1997, 2002
AND 2007)
(POST
ELECTION
1967 AND
1969)
(PRE
ELECTION
1997, 2002
AND 2007)
(POST
ELECTION
1967 AND
1969)
(PRE
ELECTION
1997, 2002
AND 2007)
(POST
ELECTION
1967 AND
1969)
(PRE
ELECTION
1997, 2002
AND 2007)
(POST
ELECTION
1967 AND
1969)
(PRE
ELECTION
1997, 2002
AND 2007)
SAD BJP CPI CPM INC
RURAL
SEMI URBAN
URBAN
20.1
to 3
5.1
20.1
to
35.1
0 to 1
0
More
than 3
5.1
20.1
to
35.1
0 to 1
0
0 to 1
0
0 to 1
0
0 to 1
0
0 to 1
0
0 to 1
0
0 to 1
0
0 to 1
0
0 to 1
0
0 to 1
0
0 to 1
0
0 to 1
0
0 to 1
0
0 to 1
0
0 to 1
0
More
than 3
5.1
More
than 3
5.1
More
than 3
5.1
More
than 3
5.1
More
than 3
5.1
More
than
35.1
20.1
to 3
5.1
10.0
1 to
20.0
10.0
1 to
20.1
to 3
5.1
Source : Election Commission Report, Punjab 1967-2007

108
The pre-election coalition helped the SAD to increase its support base, outside its stronghold i.e. Malwa, i.e. in Doaba and Majha (see graph – 4.3).
Graph – 4.3 Party wise Support Base – Region wise
13.66
12.02
30.03
37.95
7.50
34.74
9.86
13.84
35.54
38.97
0.803.801.534.64
35.38
25.24
3.82
37.46
0.682.452.53
5.00
12.71
34.82
39.99
1.014.31
0.18
5.42
27.76
0.00
5.00
10.00
15.00
20.00
25.00
30.00
35.00
40.00
45.00
(POST
ELECTION
1967 AND
1969)
(PRE
ELECTION
1997, 2002
AND 2007)
(POST
ELECTION
1967 AND
1969)
(PRE
ELECTION
1997, 2002
AND 2007)
(POST
ELECTION
1967 AND
1969)
(PRE
ELECTION
1997, 2002
AND 2007)
(POST
ELECTION
1967 AND
1969)
(PRE
ELECTION
1997, 2002
AND 2007)
(POST
ELECTION
1967 AND
1969)
(PRE
ELECTION
1997, 2002
AND 2007)
SAD BJP CPI CPM INC
MAJHA
MALWA
DOABA
More
th
an
35
.1
More
th
an
35
.1
More
th
an
35
.1
More
th
an
35
.1
More
th
an
35
.1
More
th
an
35
.1
20.1
to 3
5.1
20.1
to 3
5.1
20.1
to 3
5.1
10.0
1 to
20.0
10.0
1 to
10.0
1 to
20.0 20.1
to 3
5.1
20.1
to 3
5.1
10.0
1 to 2
0.0
0 to 1
0
0 to 1
0
0 to 1
0
0 to 1
0
0 to 1
0
0 to 1
0
0 to 1
0
0 to 1
0
0 to 1
0
0 to 1
0
0 to 1
0
0 to 1
0
0 to 1
0
0 to 1
0
0 to 1
0
Source : Election Commission Report, Punjab 1967-2007
In so far as the representation of the social matrix in the legislature and cabinet formation is concerned, there are imbalances. For example, out of the 1131 MLAs in the state from 1967 to 2007, the plurality i.e. 44 per cent were from among the rural Jat peasants, whereas dalits were 25 per cent, OBC were 9 per cent and urban traders (Khatris) were 22 per cent (see table 4.11). The representation of rural Jat peasants is much higher than their population. The representation of various caste groups in the legislature in pre-election coalition became more distributive, for instance, in post-election coalition Sikh Jat peasants had a greater share than in pre-election coalition in the Akali Dal. In fact, in pre-election coalition the SAD had a more even representation of the dalits and OBCs. Similarly, the Bharatiya Janata Party had more dalits, OBCs and relatively reduced number of urban Khatri and Bania traders. It clearly shows that pre-election coalitions capture the social spectrum relatively in an even manner.
The SAD in 1969 gave less representation to BJP MLAs as compared to 1997 and 2007 pre-election coalitions. The BJP was in power at the Centre in 1997 which empowered the state BJP leadership to have a better bargain which

109
could not be reversed as survival of coalition in terms of number was dependent on the BJP. Interestingly, the share of ministers of the SAD was higher in pre-election coalitions rather than in post-election coalitions. However, the social matrix was better represented in the cabinet in pre-election coalition. The share of Jats in the ministry declined from 64 per cent in 1969 to 51 per cent in 1997 and 55 per cent in 2007 elections, (see table 4.25) whereas, the share of the dalits in the ministry increased in 1997 but again decreased to 11 per cent in 2007 elections.
Table -4.25 Year and Caste wise Distribution of Council of Ministers at the Initial Constitution of Ministries
YEAR Caste
Total SC OBC Other Jat
1969 4 4 2 18 28
14.29 14.29 7.14 64.29 100.00
1972 2 1 5 9 17
11.76 5.88 29.41 52.94 100.00
1977 2 2 3 9 16
12.50 12.50 18.75 56.25 100.00
1980 3 2 5 6 16
18.75 12.50 31.25 37.50 100.00
1985 6 1 9 12 28
21.43 3.57 32.14 42.86 100.00
1992 8 4 8 11 31
25.81 12.90 25.81 35.48 100.00
1997 9 3 8 21 41
21.95 7.32 19.51 51.22 100.00
2002 5 2 8 10 25
20.00 8.00 32.00 40.00 100.00
2007 2 2 4 10 18
11.11 11.11 22.22 55.56 100.00
Total 41 21 52 106 220
18.64 9.55 23.64 48.18 100.00 Source : Punjab Vidhan Sabha Compendium of Who’s Who of Members (1960-2007), Chandigarh:
Punjab Vidhan Sabha Secretariat, 2003. Election Commission Reports, Punjab (1967-2007) Resume, Punjab Legislative Assembly
In post-election coalition, the SAD gave higher representation to rural Jats as compared to dalits. The BJP tried to accommodate the dalits and Jats to increase its support base. However, in pre-election coalition the

110
Bharatiya Janata Party negotiated higher representation for urban traders.
Further, in post-election coalition higher representation was given to legislators from Doaba where the coalition base was weak whereas, in pre-election coalition regional representation was in proportionate to the number of MLAs.
The coalitions have tended to give relatively even representation to the active social spectrum in government formation, which in turn has made an impact on its durability. The post-election coalitions in Punjab were the least durable as is evident from the number of days the ministries could last. The pre-election coalitions have completed their full terms (see graph – 4.4).
Graph – 4.4 Durability of Government and Tenure
GRAPH - 4
DURABILITY OF GOVERNMENT AND TENURE
261 272
402444
1870
972
1217
589
1283
448
82
1838 1825
0
200
400
600
800
1000
1200
1400
1600
1800
2000
United Front
Gurnam
Singh
Akali Break
Away (INC
support)
Lachman
Singh Gill
SAD + BJS
(United
Front)
Gurnam
Singh
SAD + BJS
Parkash
Singh Badal
INC Giani
Zail Singh
Janta
Ministry
Parkash
Singh Badal
INC Darbara
Singh
SAD Surjit
Singh
Barnala
INC Beant
Singh
Interim
Harcharan
Singh Brar
INC Smt.
Rajinder Kaur
Bhattal
SAD + BJP
Parkash
Singh Badal
Cong + CPI
Capt.
Amrinder
Singh
Post Election Alliance . 4th Post Election Alliance. 5th Single Party .
6th
Pre election
Coalition .7th
Single Party
.8th
Single Party
.9th
Single Party
.10th
Single Party.
10th
Single Party
.10th
Pre Post
Election
coalition
.11th
Pre election
defection
.12th
VIDHAN SABHA NUMBER, CM AND TYPE OF GOVERNMENT
TIM
E S
PA
N I
N D
AY
S
VIDHAN SABHA STRENGTH, CM AND TYPE OF GOVERNMENT
Source : Resume of Punjab Assembly
Coalition politics has mirrored the changing character of Indian democracy. The dynamic relationship between electoral promises and performance of the party system has provided alternative space for coalition politics. During the phase of one party dominance, electoral promises were commensurate with the mandate of the government. Non-fulfilment of electoral promises, therefore, raised issues relating to the path of development and the nature of state and institutional arrangements. With the introduction of economic reforms electoral promises were not in convergence with the mandate of the government. In other words, in the earlier phase, electoral promises were ideologically in convergence and in the later phase these were ideologically divergent. This shift created a crisis of trust in the

111
leadership and the party system. Political parties stared relying excessively on electoral arithmetic through the appropriation of social differentiations and pro-poor discourse.76
Not only this the alliance of the Congress with the CPI was to provide content to its pro-aam admi and anti-communal stance. It is worth noticing that the Congress in Punjab is branded a communal party.
The Congress and the CPI alliance is guided more by immediate political and electoral needs. It is precisely because of this reason that the local Congress and the CPI leadership were not inclined to enter an electoral alliance and consequently in 2007 elections alliance could not materialise. Therefore, it is the political context which brings out differentiation between the behaviours of historical political coalitions and pragmatic coalitions. On the other hand, the Akali-BJP coalition has arisen from a historical context. It has shown a tendency to evolve broad boundary conditions for linkages between the social matrix, legislative and executive coalition. It is within these boundary conditions that dynamics of coalition takes place i.e. from seat allocation to cabinet formation.
Another trend which acquired currency in the coalition era is that multi-dimensional ideological spaces are increasingly replaced by social differentiations in a political space. These differentiations are articulated in policy interventions to compensate for the absence of ideological mobilisation. It has been noticed that if the interactive relationship between legislative policy interventions and social polarisation remains static, the coalition becomes weak and unstable. If the coalition partners become dynamic in legislative (policy compatibility) and social spectrum (ideological compatibility) the possibility of the coalition becoming more durable and stable increases. For instance, the SAD has formulated policies which are consistent with the social base. On the other hand, the BJP did not make much effort in this direction and lost its electoral base to the Congress, which led to the weakening of the Akali-BJP coalition.
It may be correct to state that democracies in transition have the tendency to register short-term power gains by forming coalitions, leading to a sharpening of social polarisation to maintain their exclusive electoral base.

112
ENDNOTES
1 This has posed a dilemma for political analysts to capture competing
identities. Although Punjab political history provides evidence to support contradictory viewpoints, namely, that political parties sometimes reflect communal antagonisms and sometimes moderate them, the predominating tendency in Punjab legislative politics has been towards political communal coalition-building, whether this is done by a single broadly aggregative party or by inter-party alliance and coalition.
Paul R. Brass, Language, Religion and Politics in North India. (London: Cambridge University Press, 1974), p. 362. 2 Even a pamphlet published by the Shiromani Akali Dal on May 19, 1960, held
the view that only a small minority of urbanite Hindus were opposed to the formulation of a Punjabi-speaking state. To quote:
“Recent agitation over the Punjabi-Hindi controversy has highlighted the fact that it is the Hindu urbanites living in the cities of Amritsar, Jullundur, Ludhiana and Ambala who alone appose the formation of the Punjabi-speaking state. These urbanite Hindus do not form the majority of the Hindu population and can in no way form a substantial minority in the Punjabi-speaking zone.”
A Plea for a Punjabi State. Amritsar: Shiromani Akali Dal, p. 27.
According to the 1971 Census, the total population was 13,472,972 with 37.54 per cent being Hindus, i.e. 5,057,754. The number stated Hindu as their mother tongue stood at 2,711,490; assuming all these to be Hindus, the percentage of Hindus mentioning Hindi as their mother tongue is estimated at 53.61.
Pramod Kumar et.al., Punjab Crisis: Context and Trends. Chandigarh: Centre for Research in Rural and Industrial Development, 1984, p. 39. 3 The Moga declaration was adopted on April 14, 1995. To quote, ‘the spirit of
Punjabiat would be strengthened so that these matters get projected as common problems of the entire Punjabis rather than a section thereof’.
Kanwaljit Singh, The Policy Programme of Shiromani Akali Dal. April 14, 1995, p. 4. 4 J.H. Hutton, Census of India 1931: India: Imperial Tables, 1933, Vol. 1, pt. II, p.
582. 5 The argument advanced that wherever, the Hindus, the Sikhs are in minority
and the Muslim League ministry is a possibility, it is desirable to join the coalition to protect ‘Hindu’ and ‘Sikh’ interests. Vir Savarkar the leader of Hindu Maha Sabha described its policy in 1943 and later in a telegram to the Master Tara Singh. To quote:

113
In the Hindu minorities provinces wherever a Muslim ministry seems inevitable – whether it was sponsored by the Muslim league or otherwise – and Hindu interest can be better by joining it, the Hindu Maha Sabha should try as a matter of right to capture as many seats as possible in the ministry and do their best to safeguard the interests of the Hindu minority.
He further added, “coalition ministry if they are actuated by just and patriotic motive can be an effective process which will train us in a team work, remove the sense of annihilation and lead to national consolidation in spite of differences of race and creed”.
Ajit Singh Sarhadi, Punjabi Suba: the Story of the Struggle. (Delhi: U.C. Kapur and Sons, 1970), p. 73. 6 Ibid. p. 152.
7 Census of India 2001. 2004. First Report on Religion Data. New Delhi: Registrar
General & Census Commissioner. 8 Census of India. 2001. India: Final Population Totals. Series 1, p.1.
9 Pramod Kumar and Rainuka Dagar, ‘Gender in Dalit Identity Construction in
Punjab’ in Harish K. Puri (ed.) Dalits in Regional Context. (Delhi: Rawat Publications, 2004). 10
In 1920, a religious conference where ‘Amrit Parchar’ took place and many of the members of congregation there belonged to the scheduled castes. Some of them had been baptised and they were later taken to Sri Darbar Sahib for ‘Ardasa’ (Prayer) and distribution of Karah Parashad. The irony of the situation was that the priests present at Sri Darbar Sahib refused to allow participation of these “Harijans” (scheduled castes) who had been baptised, in the Ardas, and this annoyed the congregation present there, who protested at this un-Sikh-like discrimination and insisted at the participation of the Harijans in the Ardasa and their sharing in the distribution of Karah Parshad.
Ajit Singh Sarhadi, op.cit., 1970, p. 20. 11
Till mid-sixties a coalition of the urban Sikh traders, peasantry and Sikh service class under the leadership of Master Tara Singh dominated the Akali politics. But in post-reorganisation phase rural Jat peasantry became dominant both in the Akali Dal and the SGPC. 12
The Jat Singh legislators in general and of the Akali Dal in particular belonged to the upper strata. The two groups into which the Akalis had split represented different tendencies and styles of functioning. Sant Fateh Singh represented the incremental-conformist group and a section of the religious fundamentalists, whereas the Master Akali Dal represented the extremists and a minority of the religious fundamentalists and incremental conformists.

114
H.S. Deol, Analysis of Political Elite in Punjab with special reference to the Legislature, (Ph.D. thesis submitted to Panjab University, 1979). 13
Pramod Kumar, ‘Transcending the Divide’. Deccan Herald, February 16, 1997. 14
Interview with Prakash Singh Badal, President Akali Dal, February 5, 2005. 15
Interview with senior Akali leader, December 7, 2005. 16
To illustrate, Sachar Formula was adopted by winning the support of the “Akali Congressmen” (who joined Congress in 1948) and was opposed by Arya Samajist Hindu Congressmen. Factional fight between Bhim Sen Sachar group and Gopi Chand Bhargava group kept on conceding demands of Akali or Hindu Congressmen. The national leadership seem to be distraught by this game. Sardar Patel reported having reprimanded the state leadership. You do not seem to understand... the political and religious game behind it.
Harish K. Puri, ‘Religion and Politics in Punjab’ in Moin Shakir (ed.) Religion, State and Politics in India. (Delhi: Ajanta Publications, 1989), p. 331. 17
‘SC orders centre to construct SYL canal’. The Tribune, June 4, 2004. 18
Stated in an interview by Amarinder Singh, Chief Minister, Punjab 10 September 2004, ‘I have to protect the interests of Punjab farmers’. 19
Pramod Kumar, ‘Electoral Politics in Punjab: From Autonomy to Secession’ in Paul Wallace and Ramashray Roy (eds.) India’s 1999 Elections and 20
th Century
Politics. (New Delhi: Sage Publication, 2003), p. 379. 20
Harish K. Puri, op.cit., 1989, p. 331. 21
M.S. Dhami, ‘Religio-Political Mobilisation and Shifts in the Party Support Base in 1985 Punjab Assembly Elections’ in Moin Shakir (ed.) Religion, State and Politics in India. (Delhi: Ajanta Publications, 1989), p. 352. 22
The BSP was founded in 1984 by Kanshi Ram.
Kanchan Chandra, Why Ethnic Parties Succeed: Patronage and Ethnic Head Counts in India. Cambridge: (Cambridge University Press, 2004), p. 145. 23
Paul R. Brass on the basis of his study of Punjab Assembly elections over the period 1952-1972 argues:
‘A thorough going polarization of Punjab politics has been prevented by the presence of a large Scheduled Caste population, of uncertain religious allegiance, to whom all parties must appeal. Second, the leading secular parties in Punjab, particularly Congress and the CPI, have successfully appealed to both Hindus and Sikhs in the past.’

115
Paul R. Brass, ‘Ethnic Cleavages in the Punjab Party System, 1952-72’ in Myron Weiner and J. Orgood Field (eds.) Electoral Political in the Indian States: Party Systems and Cleavages. (Delhi: Manohar Book Service, 1975), p. 60. 24
Pramod Kumar et.al., op.cit., 1984, p. 45. 25
Pramod Kumar, ‘Need for Reposing Faith in People’. The Tribune, May 13, 1990. 26
In the 1996 Lok Sabha elections, the Akali Dal entered into pre-election alliance with the Bahujan Samaj Party and seat adjustment with the Bharatiya Janata Party. The alliance adversely affected the Congress Party’s performance and resulted in an erosion of the support base of the Congress among the Scheduled Castes. (Of the 13 parliamentary seats, the SAD won 8 and the BSP 3). 27
The SAD and the BJP formed the ministry together irrespective of the fact that the SAD was in majority show that the alliance is based on mutual understanding and to advantage Punjab.
Interview with Sukhbir Singh Badal, SAD Member Parliament. January 2006.
In the 1998 parliamentary elections, the Akali Dal entered into an alliance with the BJP. The Shiromani Akali Dal won the largest number of seats i.e. 8 and polled 33 per cent of the votes. The Bharatiya Janata Party won 3 seats and polled 12 per cent of the votes. The Congress, the BSP, and the communists entered into a pre-election alliance and could not win even a single seat. 28
In the 1999 Lok Sabha elections, the pre-election alliance of SAD-BJP failed miserably with the Congress-CPI alliance winning nine seats. 29
Gur Rattanpal Singh, The Illustrated History of the Sikhs. (Chandigarh: Akal Printmatics, 1979), p.84
Paul R. Brass, op.cit., 1974, p. 358. 30
The Sikh members of the assembly prepared a charter of demands in November, 1948 which was not accepted.
1. Representation to be given to the Sikhs on the basis of 1941 census without excluding Sikhs who had migrated to other provinces.
2. They should be given 5 per cent representation in the Central Cabinet.
3. Sikhs should have one Minister and one Deputy Minister in the Central Cabinet.
4. The post of Governor and premier of the province should alternatively go to a Hindu or a Sikh.

116
5. 50 per cent representation in the Provincial Cabinet should be given to the Sikhs.
6. Gurgaon district and Loharu State should be separated from the East Punjab.
7. 40 per cent of the services be reserved for the Sikhs.
8. If the above demands were rejected the Sikhs should be allowed to form a New Province of 7 districts, i.e. Hoshiarpur, Jullundur, Ludhiana, Ferozepur, Amritsar, Gurdaspur and Ambala.
Ajit Singh Sarhadi, op.cit., 1970, p. 167. 31
Ibid. p. 190. 32
“The Shiromani Akali Dal is in favour of the formation of provinces on a linguistic and cultural basis throughout India, but holds it as a question of life and death for the Sikhs that a new Punjab be created immediately.”
Ajit Singh Sarhadi, op.cit., 1970, p. 221. 33
The SGPC which was under the control of Nationalist Sikhs which was captured by the Akalis. At the same time Government of India later its acceptance of regional formula paved the way for its merger in the Congress. In 1955, the Akali Dal won 112 seats and the Khalsa Dal supported by the Congress could win only 3 out of 132 contested seats. This convinced the Congress of the growing strength of the Akalis and the Government of India in December 1953 appointed the State Re-organisation Commission. In 1954 the Akalis launched a vigorous agitation for the Punjabi Suba demand. For example, processions were taken out, by Akalis at Ludhiana (on the eve of Guru Gobind Singh’s birthday) and at Amritsar (the Hola Mohalla procession) on December, 1954, and March, 1995, respectively. The continued and persistent agitations and protests worsened the situation. The morchas launched acquired communal colouring. 34
The State Reorganisation Commission recommended the merger of Punjab, PEPSU and Himachal Pradesh. PEPSU was merged in Punjab in 1956. The new State was divided into so-called Punjabi-speaking and Hindi speaking regions and two regional committees, consisting of the members of the legislature belonging to the respective regions, were provided. Thus in October, 1956, a convention was held at Amritsar. It was attended by the members of the Akali Dal Working Committee, the Akali MLAs from Punjab and PEPSU the Jathedars and other prominent leaders. It formally resolved to amend the Constitution of the Akali Dal so as to continue its activities towards the religious, educational and economic welfare of the Sikhs.
Interview with Capt. Kanwaljit Singh, General Secretary, SAD on December 7, 2005.

117
35
Baldev Raj Nayar, Minority Politics in the Punjab. (Princeton: Princeton University Press, 1966), p. 125. 36
Ibid. p. 129. 37
In January, 1960, elections to the Shiromani Gurdwara Prakandhak Committee were held. Giani Kartar Singh opposed Master Tara Singh but failed miserably. He could win only four seats against 132 of the Akali Dal out of the total number of 140 seats. 38
In the fifties, when Master Tara Singh (a Khatri himself) was President of the SGPC, the non-Jat Sikhs controlled 54.6 per cent of the key positions in this institution. Now, the SGPC came under the control of Jat Sikhs whereby the influence of non-Jat Sikhs diminished drastically. 39
‘Sangh-Akali Bid to Form Government: Complete Accord Reached’. The Tribune (Ambala), March 2, 1967. 40
S. Gurnam Singh speech in Punjab Vidhan Sabha on 26 March 1970. The Chief Minister emphasised that he made every effort to accommodate its coalition partner. 41
Interview of Balramji Das Tandon, senior BJP leader, October to December 2005.
“In 1967, the Jana Sangh had two minister but had all the relevant portfolio’s like Finance, Industry, Health, Excise and Taxation, Local Bodies etc.” 42
The C.M. preferred Jana Sangh Ministers over the Akali Ministers and did not care for the Akali Jathedars. It created resentment in senior Akali Minister and Akali Jathedars who were not prepared to tolerate it for a longer period… Congress Govt. in the centre contacted S. Lachhman Singh Gill the senior most Akali Minister in Front Govt. and assured him that if he defected with a considerable number of MLAs, the Congress Assembly party will give him an unconditional support and all the defectors will be designated as Ministers.
White Paper on Sikh Issues. Batala: S. Narinder Singh Bhuler, 1983, Vol. 1, p. 103. 43
Devinder Pal Sandhu, Sikhs in Indian Politics: Study of a Minority. (New Delhi: Patriot Publishers, 1992), p. 113. 44
Keeping in view the mandate and the decision of the Akali Dal, I brought the Bill in the Legislative Assembly for abolition of the Legislative Council. Sant Chanan Singh came to Chandigarh and persuaded the members not to abolish the Council…. Even after that both the Sants tried their utmost to flout the decision of the legislators and the Shiromani Akali Dal by persuading several members of the Parliament to see that Council was not abolished.

118
Speech made by outgoing CM Gurnam Singh on the floor of the assembly on 26.3.1970.
S.C. Arora, Turmoil in Punjab Politics. (New Delhi: Mittal Publications, 1990), p. 132. 45
Speech made by outgoing CM Gurnam Singh on the floor of the assembly on 26.3.1970. 46
I frankly tell the House that though the Jana Sangh in Punjab had staged right about turn on its attitude towards the Punjabi language after the creation of the Punjabi speaking State, their outlook on this crucial question is still revolving in the old grooves. Though they claim that Punjabi should be given the status of a State language and should be developed as a lever to unify the Punjabi speaking people irrespective of their religion, they in their own way are persisting in the policy of making Punjab a bi-lingual state. Naturally, I opposed all the attempts of the Jana Sangh leaders in this direction, though all along I did my best to promote Hindi as the National Language.
Speech made by outgoing CM Gurnam Singh on the floor of the assembly on 26.3.1970. 47
1. Besides steps to “restore Hindu-Sikh unity, the Government will develop and promote Punjabi as the state language and Hindi as the national language.
2. Educational facilities will be extended both in the rural and urban areas with a view to achieving hundred per cent literacy in the state within the next few years.
3. The Government will root out corruption from public life as well as from the administration.
4. And try to bridge the gap between the common man and the administration.
5. Special emphasis will be placed on schemes for the welfare of members of the Scheduled Castes and the Backward Classes.
6. Immediate steps will be taken to distribute the evacuee lands to landless Harijans. A sizeable revolving fund will be created for their welfare schemes.
7. In the field of agriculture, a new strategy will be evolved to maintain Punjab’s position as the granary of India and also to promote the cultivation of commercial crops. Small land-owners will be given special incentives.
8. The programme for rural electrification as also rural development works and construction of link roads in the state will be streamlined with a view

119
to electrifying every village and connecting every village with the main roads.
9. A blueprint for the growth of industries, particularly large and medium-scale industries, both in the private and public sectors, will be prepared and special incentives will be given to new industrial entrepreneurs.
10. Industrial workers, government employees and teachers will be given a fair deal, and all loopholes in the existing legislation relating to them will be plugged.
11. Efforts will be made to remove anomalies in the Pay Commission and Kothari Commission grades.
S.C. Arora, op.cit., 1990, p. 129 48
Ibid. p. 130. 49
It was primarily the intra-party conflict among the coalition partners which continued to rock the working of the ruling alliance. The inter-party differences and the ideological incompatibilities of the two partners did not pose a serious obstruction in the working of the coalition.
Arun Mehra, ‘Akali-Janata Coalition: An Analysis’. Punjab Journal of Politics, 1985, 9(1), p. 85. 50
Pramod Kumar, ‘Punjab Crisis: A Political Diagnosis’. Mainstream, Nov. 14, 1987, p. 18. 51
Mr. S.S. Barnala the then Akali Chief Minister, was alleged to be appeasing the militants and consequently the Congress government in the centre dismissed the ministry. The moderate leaders like Mr. Prakash Singh Badal and Mr. G.S. Tohra were arrested and hundred of others were sent to distant Jodhpur Jail to languish in detention for some years. Liberals who had full faith in the system were isolated and those nursing serious grievances against the system were patronised. This approach adopted to counter the people who were a potential threat to the legislative power of the ruling party at the centre. Political rivals (even when they subscribe to the same political beliefs) were attacked and political forces representing extreme views were patronized. President’s rule was thought to be the most conducive, if not the sure instrument, to put down militancy. That these measures failed is not a surprise. 52
The massive Akali victory of 1985 should not be termed as an expansion of the support base of the SAD. It is evident from the aggregate votes polled by the SAD and Cong. (I) that SAD polled only one per cent more votes than Cong. (I).

120
Jatinder Kaur, Punjab Crisis: The Political Perceptions of Rural Voters. (Delhi: Ajanta Publications, 1989), p. 126. 53
Pramod Kumar and Yogendra Yadav, ‘The Real Contest in Punjab’. The Tribune, February 9, 1992. 54
Statement issued by Sardar Prakash Singh Badal at meet the Press Club, November, 1996. 55
Kanwaljit Singh, op.cit., 1995. 56
The Sarkaria Commission was set up on June 9, 1983 to restructure India’s Centre-State Relations. 57
Art 356 of the Indian Constitution deals with the provision in case of failure of constitutional machinery in state. 58
Lok Sabha Election 1998: Manifesto of Akali Dal. 59
‘In the following year when elections for the state assembly were held, ‘peace’ continued to be the core issue. Recognising the changing political scene at the national level, and the growing significance of BJP, the Badal Akali Dal did everything possible to consolidate its alliance with the state unit of the BJP. It merely abandoned its politics of regional identity and spoke a very different language.’
Surinder S. Jodhka, ‘Return of the Region: Identities and Electoral Politics in Punjab’. Economic and Political Weekly, 2005, 41(3), p. 227. 60
Statement issued by Prakash Singh Badal at Meet the Press at Chandigarh Press Club, November 1996. 61
Sarbjit Pandher, ‘A Peace Card Which May Spell Trouble’. The Hindu (New Delhi), January 25, 1997. 62
For 1997 and 2002 assembly elections a committee consisting of Capt. Kanwaljit Singh and Sukhdev Singh Dhindsa of the SAD and Balramji Das Tandon and Madan Mohan Mittal of the BJP was constituted to decide about the seat sharing. The BJP asked for 35 seats. After number of meetings 22 seats were allocated to BJP. 63
In 1967s ministerial allocations were according to our choice.
In 1997 claims were registered but the portfolios of Industry and Finance could not be given to the Bharatiya Janata Party as the CM kept Industry and Finance was allocated to a senior Akali leader. The allocation of the Finance portfolio was not contested as the state finances were in doldrums.
Series of Interviews with Balramjit Das Tandon, Senior BJP leader, October to December, 2005.

121
64
Pramod Kumar, op.cit., 2003, p. 384. 65
P.S. Verma, ‘Akali-BJP Debacle in Punjab: Wages of Non-performance and Fragmentation’. Economic and Political Weekly, 1999, 34(50), pp. 3519-3531. 66
Capt. Amarinder Singh was not in favour of allocating 11 seats to CPI. He was of the view “Every Single seat allotted to the CPI is to add to the tally of the SAD”. Interview with Capt. Amarinder Singh, Chief Minister, Punjab, 10 September, 2004.
In a press statement on 23 August, 2006, Capt Amarinder Singh, Chief Minister of Punjab maintained, “I have told party president Sonia Gandhi that alliance with the left parties – CPI and CPI(M) would not benefit the Congress in any manner since their votes do not get transferred to us”.
“I was the PCC president then and I had a harrowing time trying the convince the left leaders to send their cadres for Congress support but they failed to do so”.
‘Capt., Dullo don’t See right on left’. Hindustan Times, August 24 , 2006. 67
These constituencies were Sri Hargobindpur, Mansa and Dhuri. 68
If the percentage of votes of the BJP, the Akali Dal (B) and the Akali Dal (Tohra) are added and converted into seats, the Akali Dal and the BJP would have formed the government. 69
Raveen Thukral, ‘Capt., Dullo don’t see right on left’. The Hindustan Times, August 24, 2006. 70
‘No Alliance with Congress: Karat’. The Hindustan Times, October 11, 2006. 71
Raveen Thukral, ‘Sirsa Dera Add Spice to Malwa Contest’. The Hindustan Times, February 9, 2007. 72
Gautam Dheer, ‘SAD-BJP Fissures on Portfolios’. The Indian Express. March 3, 2007. 73
‘BJP Demands Complete Power Tariff Rollback’, The Hindustan Times, December 23, 2009. 74
The BJP state leadership charged the SAD for discrimination of their support base in terms of allocation of funds, conferring ministerial status to their appointees as Chairpersons of boards and corporations and sharing of various other spoils of power.
Interview on February 12, 2010 with Sh. Balramji Das Tandon, Member BJP Core Committee. 75
The continuation of coalition politics in Punjab has not only witnessed the competitive populism but on a positive note has led to the ‘gradual discarding

122
of radical stances by political parties all over the state’. This has been evident in the form of the Manifestos of Akali Dal and its ally BJP to maintain ‘peace, brotherhood, communal harmony, socio-economic welfare, all round development and sustainable and profitable agriculture through diversification.
Ashutosh Kumar, ‘Electoral Politics in Punjab: Study of Akali Dal’. Economic and Political Weekly, 2004, 39(14-15), p. 1519. 76
For example, the Congress party in Punjab was caught between Assembly election (2002) and Parliamentary elections (2004) became victim of the paradox between electoral promises and government mandate. In the 2002 Assembly elections its promise of free electricity to farmers contributed to its victory over its opponent the Akali Dal. The election manifesto committee was headed by Dr. Manmohan Singh, present Prime Minister of India. After coming to power, it started implementing the mandate of government to introduce economic reforms and consequently it performed poorly in 2004 Parliamentary elections. The Congress party was quick to announce the implementation of sops like free electricity in the wake of forthcoming Assembly elections. This was opposed by Prime Minister Manmohan Singh. Not only this it also passed Punjab Repealing Act of 2004 on SYL much to the annoyance of the Central leadership. In other words, the Congress in competition with a regional alliance started appropriating anti-centre constituency in the state.