the homeownership experience of minorities during … · the homeownership experience of minorities...
TRANSCRIPT

The Homeownership Experience of Minorities During the Great Recession
Carlos Garriga, Lowell R. Ricketts, and Don E. Schlagenhauf
INTRODUCTION
During the financial crisis, often referred to as the “Great Recession,” most households suffered important income and wealth losses. The distribution of these losses was very asym-metric across racial and ethnic groups. For example, research by Emmons and Noeth (2015) suggests that higher education did not protect the wealth of all racial and ethnic groups equally during this period. Black and Hispanic families headed by someone with a college degree fared far worse than White and Asian college-educated families.1 More surprisingly, college- educated Black and Hispanic families fared worse than non-college-educated Black and Hispanic families. Emmons and Noeth suggest that the balance sheets of college-educated Black and Hispanic families had a higher concentration in residential real estate at the eve of the Great Recession.
It has been argued that during the Great Recession, wealth losses were more concentrated for college- educated Black and Hispanic families than for White and Asian college-educated families and their non-college-educated Black and Hispanic peers. This article explores the extent to which the home-ownership experience for families who purchased homes between 2004 and 2008 is a potentially impor-tant factor in explaining this finding. During the housing boom, the increase in homeownership for Blacks and Hispanics was very similar, but the second group had a smaller decline. Despite these differences, the Great Recession was far more destructive for these minorities regardless of income. Logit regressions show that underwriting standards and loan structure explain a significant amount of the non-White–White gap in foreclosures. However, geographic concentration was most significant in explaining the gap for Hispanic borrowers. Despite accounting for these factors, sizable gaps in the likelihood of foreclosure remain between Blacks and Hispanics relative to Whites. (JEL J15, R2)
Federal Reserve Bank of St. Louis Review, First Quarter 2017, 99(1), pp. 139-67. http://dx.doi.org/10.20955/r.2017.139-67
Carlos Garriga is a vice president and economist in the Research Division, and Lowell R. Ricketts is the senior analyst and Don E. Schlagenhauf is the chief economist at the Center for Household Financial Stability at the Federal Reserve Bank of St. Louis. The authors thank Stephen Ross and Molly Metzger for their insightful comments during the symposium and Lauren Lambie-Hanson for her assistance with the HMDA-McDash data. This article was prepared for the symposium, “Does College Level the Playing Field? Racial and Ethnic Differences in Family Wealth Among College- Educated Families,” sponsored by the Center for Household Financial Stability and the Research Division of the Federal Reserve Bank of St. Louis, May 25-26, 2016.
© 2017, Federal Reserve Bank of St. Louis. The views expressed in this article are those of the author(s) and do not necessarily reflect the views of the Federal Reserve System, the Board of Governors, or the regional Federal Reserve Banks. Articles may be reprinted, reproduced, published, distributed, displayed, and transmitted in their entirety if copyright notice, author name(s), and full citation are included. Abstracts, synopses, and other derivative works may be made only with prior written permission of the Federal Reserve Bank of St. Louis.
Federal Reserve Bank of St. Louis REVIEW First Quarter 2017 139

Garriga, Ricketts, Schlagenhauf
140 First Quarter 2017 Federal Reserve Bank of St. Louis REVIEW
Between 2007 and 2013, the average value of owner-occupied homes among college- educated Hispanic and Black families fell by 45 percent and 51 percent, respectively. In con-trast, the average value of owner-occupied homes declined 25 percent and 6 percent among White and Asian families, respectively.2 Highly leveraged debt, concentrated in housing on the eve of the recession, is a promising potential explanation for the differential experience of non-White college graduates.
This article explores the extent to which the homeownership experience for families who purchased homes between 2004 and 2008 is a potentially important factor in explaining these sizable wealth losses during the crisis. Table 1 shows the extent of the homeownership expan-sion prior to the housing crash. Homeownership rates increased for all racial and ethnic groups between 1994 and 2006. The gains were greatest among Hispanics and Asians, increasing by 8.5 and 12.2 percentage points, respectively. Homeownership rates relative to median family income (Table 2) suggest that families at or above the median income had greater entrance into homeownership.
The housing crash in 2007 and the Great Recession that followed collectively erased $13 trillion of assets from household balance sheets.3 This included $5.1 trillion in lost real estate assets or 39 percent of the total decline.4 In addition to lower home values, the decline in assets is representative of exits from housing, shown by the substantial reduction in homeownership
Table 1Homeownership Rates by Race and Ethnicity
Percent
Change Change Race 1994 2006 2015 (1994-2006) (2006-15)
Non-Hispanic White 70.0 75.9 71.9 5.9 –3.9
Black 42.3 47.8 42.3 5.5 –5.5
Hispanic, of any race 41.2 49.7 45.6 8.5 –4.1
Asian and other 47.7 59.9 53.8 12.2 –6.1
SOURCE: U.S. Census Bureau.
Table 2Homeownership Rates by Family Income
Percent
Change Change Relation to median income 1994 2006 2015 (1994-2006) (2006-15)
Equal or above 78.5 84.2 78.4 5.7 –5.8
Below 48.4 52.7 48.9 4.3 –3.8
SOURCE: U.S. Census Bureau.

Garriga, Ricketts, Schlagenhauf
Federal Reserve Bank of St. Louis REVIEW First Quarter 2017 141
rates. Table 1 shows that all of the gains among Black families were erased between 2006 and 2015, while approximately half of the gains were undone for Hispanics and Asians. Whites were also affected by the crisis with a larger net contraction in homeownership than Hispanics and Asians but less than Blacks. Relative to median income, the decline in homeownership during this period was more severe for families at or above the median, regardless of race. On net, homeownership activity contracted across all racial and ethnic groups, resetting much of the gains seen prior to the Great Recession. Surprisingly, declines in homeownership were not isolated to low- to moderate-income communities but more affluent families as well.
With the sizable decline in home values, in particular in areas populated by minorities, exits from homeownership were driven mainly by mortgage delinquencies and eventually foreclosures. What motivates an individual or a household to be delinquent/default on its mortgage obligations? The existing literature has proposed different competing mechanisms on mortgage default behavior. A traditional literature assumes that borrowers “ruthlessly” default on their mortgage to maximize their financial wealth (see, for example, the work of Kau, Keenan, and Kim, 1994, and the literature surveys of Quercia and Stegman, 1992, and Vandell, 1993). In the canonical framework, the presence of negative equity is a necessary, but not sufficient condition for default. This is due to the presence of additional costs associated with default, such as a threshold level of negative equity before a default occurs. In addition, this theory often assumes that the default decision has no future consequences in terms of the ability to access the credit market.
A more recent view of foreclosure behavior is based on the double-trigger hypothesis. According to this hypothesis, the presence of negative equity is only a necessary condition for default. The default decision is attributed to the joint occurrence of an underwater loan and a negative income shock to the household (i.e., a job loss, an illness, or a divorce). The view has been encapsulated in Campbell and Cocco (2015), Gerardi et al. (2015), and Schelkle (2014). Most recently, Garriga and Hedlund (2016) argue that a future default could occur even among sellers with positive equity who face selling delays and are unable to sell the house at a reasonable price influenced by their outstanding debt. The presence of selling uncertainty creates a new region that depends on how quickly homes can sell in the market.
For minority groups, recent research by Bayer, Ferreira, and Ross (2016) has suggested that mortgage delinquency was higher among Black and Hispanic borrowers. This result held even when detailed borrower and loan risk factors were considered. These differences held for homebuyers who purchased their homes near the peak of the market and individuals who refinanced their mortgages during this period. Bayer, Ferreira, and Ross argue that the findings are consistent with higher-risk borrowers, especially higher-risk minority borrowers, being drawn into the market during the housing market expansion. They use a unique panel dataset that links a representative sample of Home Mortgage Disclosure Act (HMDA) data to public records data on housing transaction and liens in seven major metropolitan housing markets, along with credit reporting data unique to each borrower.
Relative to the literature, our analysis conducted for this article evaluates whether a severe economic slowdown has a differential impact across different racial and ethnic groups by using a novel dataset that contains the monthly history of thousands of new home purchase

Garriga, Ricketts, Schlagenhauf
142 First Quarter 2017 Federal Reserve Bank of St. Louis REVIEW
mortgages originated in the years leading up to the financial crisis, along with the race or ethnicity and income of the borrowers. Aggregate delinquency and default rates for these groups illustrate how the homeownership experience during the Great Recession differed across families by race, ethnicity, as well as income.
The data show that serious delinquency and foreclosure rates were far greater for Black and Hispanic borrowers than White and Asian borrowers. Racial groups were split along income quartiles to assess the relationship between income and serious delinquency and foreclosure. For most racial groups, borrowers in the lowest earning quartiles had the greatest share of loans entering into foreclosure by the end of the sample. However, in the case of Hispanic borrowers, the largest foreclosure rates are distributed among the highest income quartiles.
The conventional view of the housing bubble, based on the work of Mian and Sufi (2009), suggests that the reallocation of mortgage debt to low-income or marginally qualified bor-rowers played a central role in fueling the housing boom and the foreclosure crisis. Some recent research based on micro data has established a new narrative (see Adelino, Schoar, and Severino, 2016; Foote, Loewenstein, and Willen, 2016; Albanesi et al., 2016) that shows that the credit expansion during the boom and subsequent default during the bust were at least as prevalent in the middle to high part of the income and credit score distributions as they were in the bottom part of the distributions. In the data, high-income borrowers tend to have more mortgage debt than low-income borrowers. At the aggregate level, when debt growth is uniform across groups, this means that in level terms, most of the new mortgage debt went to the wealthy.
Our findings offer some support for the new view of the housing bubble; foreclosures were not isolated to the low- to moderate-income segment of the population. It also suggests that Hispanic homebuyers with higher incomes, and likely higher educational attainment, fared worse during the recent recession than not only their White and Asian counterparts but also their lower-income peers. Evidence from logit regression analysis is considered that shows differences in outcomes can be partially explained by the geographic distribution of the racial and ethnic groups. For example, foreclosures among the Black share of the population were concentrated in metro areas such as Chicago, Detroit, and Atlanta, whereas foreclosures for Hispanics were predominantly in Miami, Los Angeles, Phoenix, and Las Vegas.
THE DATA
The research focus of this article requires loan-level data with explicit measurement of borrower race and ethnicity, income, and mortgage characteristics. The dataset is a match of McDash (a mortgage performance dataset owned by Black Knight Financial Services) loans and confidential HMDA datasets. For the purposes of this article, the matched dataset is referred to as “HMDA-McDash.” The universe of the matched dataset is over 89 million loans origi-nated between 1992 and 2014.5 The sample is restricted to first-lien home purchase loans for owner-occupied 1- to 4-family dwellings originated in the second or third quarter of 2004, 2005, 2006, 2007, or 2008. To ensure reliability of the match, only those loans with one poten-tial McDash and HMDA match candidate are used. This reduces the universe of HMDA-

Garriga, Ricketts, Schlagenhauf
Federal Reserve Bank of St. Louis REVIEW First Quarter 2017 143
McDash pairs to 70.3 million loans. The sample is a 1 percent random subsample of loans for which the applicants reported their race on the HMDA application as White and their ethnic-ity as not Hispanic, combined with a 7.5 percent random subsample of loans where the appli-cants reported their race as either Asian, Black, or any response for race along with ethnicity as Hispanic. All loans with missing applicant income, original FICO score, or the current interest rate are removed. This leaves 3.6 million monthly observations across 73,606 unique loans. The racial and ethnic distribution of unique loans in the sample is shown in Table 3. The oversample of minority borrowers offers a balanced blend of unique loans by racial and ethnic groups. Table 4 offers a comparison with a 2 percent random sample of HMDA-McDash matched loans that satisfy the previous filter conditions, regardless of race or ethnicity. This distribution is predominantly White, with the remaining shares concentrated among Hispanic, Black, and Asian borrowers in that order.
Table 5 provides summary statistics for the unique loans in the initial sample. Mean applicant income is significantly higher among Asians than other racial and ethnic groups. Around 29 percent of Asian borrowers in the sample hail from California, and close to 20 percent of the loans qualify as jumbo. Asian borrowers had the highest average FICO score (731) at loan origination, while Black borrowers had the lowest (659). Similarly, the standard deviation indicates that the variation of FICO scores was lowest for Asians and highest for Blacks. The average interest rate was highest among loans to Blacks and lowest among loans to Asians. Around 24 percent of Black and Hispanic borrowers in the sample owned a loan considered high-priced or subprime.6 In contrast, only 6 percent and 7 percent of Asian and White borrowers, respectively, had high-priced loans. Primary borrowers who were Asian, Hispanic, or White were much more likely to also be male, while the gender of primary Black borrowers was close to an even split between male and female. Twenty percent of Black and 22 percent of Asian and Hispanic borrowers had adjustable-rate mortgages, compared with only 14 percent of the White sample. Around 71 percent and 77 percent of Black and White borrowers, respectively, owned fixed-rate mortgages, compared with 63 percent and 61 per-cent of Asian and Hispanic borrowers, respectively. Interest-only loans (either adjustable or fixed) were owned by 15 percent of the Asian and Hispanic samples, while only 9 percent and 8
Table 3Unique Loans, by Race or Ethnicity
Race/ethnicity Loans Share of total (%)
Asian 12,369 17
Black/African-American 16,288 22
Hispanic/Latino, any race 23,683 32
Non-Hispanic White 21,273 29
Total 73,613 100
Table 4Unique Loans, by Race or Ethnicity (2 Percent Random Sample)
Race/ethnicity Loans Share of total (%)
Asian 3,269 6
Black/African-American 4,390 8
Hispanic/Latino, any race 6,245 11
Non-Hispanic White 43,241 76
Total 57,145 100
NOTE: Numbers are rounded.

Garriga, Ricketts, Schlagenhauf
144 First Quarter 2017 Federal Reserve Bank of St. Louis REVIEW
percent of the White and Black samples, respectively, had this loan product. An insignificant share of the sample owned balloon mortgages. Around 20 percent and 10 percent of loans were considered jumbo within the Asian and Hispanic samples, respectively. In contrast, 8 percent and 5 percent of White and Black borrowers, respectively, had jumbo loans.
INCOME AS A PROXY FOR EDUCATIONAL ATTAINMENT
Ascertaining whether individuals with different racial or ethnic characteristics, but similar education levels, had different mortgage outcomes requires some measure of educational attainment. Unfortunately, direct measurement of educational attainment is unavailable within the HMDA-McDash dataset. Given the focus of the conference on disparate outcomes by educational attainment, this is a significant challenge. In response, the loan applicant’s annual income is used, as reported on the HMDA form.7 Research shows that, on average, expected income increases monotonically with educational attainment (see, for example, Boshara, Emmons and Noeth, 2015, and Carnevale, Strohl, and Melton, 2014). Table 6 presents data on weekly earnings for various educational attainment groups. As shown, the data sup-port a positive relationship between educational attainment and earnings. This relationship was examined carefully by Becker (1964), Becker and Chiswick (1966), and Mincer (1958, 1962). Willis (1986, p. 526) states: “[Mincer’s earnings function] reveal(s) important empirical regularities in educational wage differentials and the life cycle pattern of earnings.” More recently, Heckman, Lochner, and Todd (2006) update Mincer’s earlier work.
Table 5Summary Statistics, by Race or Ethnicity
Standard Standard Standard Standard Mean Mean Mean Mean deviation deviation deviation deviation Variable (Asian) (Black) (Hispanic) (White) (Asian) (Black) (Hispanic) (White)
Applicant income 117.93 73.95 83.13 96.94 123.97 108.84 95.26 138.39 ($ thousands)
Loan amount ($ thousands) 323.33 190.38 226.98 220.33 222.32 136.21 157.31 193.75
FICO score (origination) 731.2 659.8 686.7 714.7 52.5 68.8 64.0 66.0
Interest rate (%) 5.98 6.64 6.47 6.21 1.13 1.23 1.21 0.97
Share male 0.68 0.53 0.7 0.7 — — — —
Share female 0.32 0.47 0.3 0.3 — — — —
Share adjustable 0.22 0.2 0.22 0.14 — — — —
Share fixed 0.63 0.71 0.61 0.77 — — — —
Share interest-only 0.13 0.07 0.12 0.08 — — — — adjustable
Share interest-only fixed 0.02 0.01 0.03 0.01 — — — —
Share balloon 0 0 0.01 0 — — — —
Share jumbo 0.2 0.05 0.1 0.08 — — — —

Garriga, Ricketts, Schlagenhauf
Federal Reserve Bank of St. Louis REVIEW First Quarter 2017 145
Under the assumption that income can serve as a proxy for educational achievement, the income distribution is partitioned into quartiles.8 Higher income quartiles should include a greater share of highly educated borrowers. To illustrate this, the income distributions for racial and ethnic groups in the HMDA-McDash sample are benchmarked to those of college- educated families in the SCF.9 The HMDA-McDash sample range used in this article contains two years with an SCF survey wave, 2004 and 2007. Real income cutoffs are estimated for nine percentiles within the SCF distribution for both college-educated and non-college-educated families, divided into race and ethnicity. Similar percentile cutoffs are also estimated for all of the loans originated within 2004 and 2007 in the HMDA-McDash sample, also separated by race and ethnicity. For illustrative purposes, the median is also included for the racial and ethnic groups across all years within the HMDA-McDash sample.10 For brevity, the results for 2004 are omitted. It is important to note that the college-educated and non-college-educated income distributions use all families that fit those educational criteria within the SCF, while the HMDA-McDash distribution includes only families that acquired a first-lien home pur-chase mortgage in 2007.11
As Figure 1 shows, income cutoffs for Asian borrowers in the HMDA-McDash data are consistent with those of college-educated families in the SCF, while the upper end of the dis-tribution is an exception.12 The overall HMDA-McDash median appears to offer reasonable stratification between the college and non-college distributions. In contrast, Figure 2 shows that the income cutoffs for college- and non-college-educated Black borrowers have less sep-aration and converge at the upper end of the distribution. The overall median appears to offer the least separation for Black families with and without a college education, compared with medians for other racial and ethnic groups. The overall income distribution for Hispanic college-educated borrowers (Figure 3) in the SCF conforms the least to the distribution within
Table 6Median Weekly Earnings, by Educational Attainment
Median weekly earnings Education attained ($ 2015)
Doctoral degree 1,623
Professional degree 1,730
Master’s degree 1,341
Bachelor’s degree 1,137
Associate’s degree 798
Some college, no degree 738
High school diploma 678
Less than high school diploma 493
NOTE: Data are for persons age 25 and older. Earnings are for full-time wage and salary workers.
SOURCE: Current Population Survey, U.S. Department of Labor, U.S. Bureau of Labor Statistics.

Garriga, Ricketts, Schlagenhauf
146 First Quarter 2017 Federal Reserve Bank of St. Louis REVIEW
0
50
100
150
200
250
300
350
0.1 0.2 0.3 0.4 0.5 0.6 0.7 0.8 0.9
College
No College
Overall Median (HMDA-McDash)
HMDA-McDash
Thousands of 2015 $
Percentiles
Figure 1Income Distribution of College-Educated Versus Non-College-Educated Asian Borrowers (2007)
SOURCE: Survey of Consumer Finances, HMDA-McDash, and authors' calculations.
0
20
40
60
80
100
120
140
160
180
200
0.1 0.2 0.3 0.4 0.5 0.6 0.7 0.8 0.9
College
No College
Overall Median (HMDA-McDash)
HMDA-McDash
Thousands of 2015 $
Percentiles
Figure 2Income Distribution of College-Educated Versus Non-College-Educated Black Borrowers (2007)
SOURCE: Survey of Consumer Finances, HMDA-McDash, and authors' calculations.

Garriga, Ricketts, Schlagenhauf
Federal Reserve Bank of St. Louis REVIEW First Quarter 2017 147
0
50
100
150
200
250
0.1 0.2 0.3 0.4 0.5 0.6 0.7 0.8 0.9
College
No College
Overall Median (HMDA-McDash)
HMDA-McDash
Thousands of 2015 $
Percentiles
Figure 3Income Distribution of College-Educated Versus Non-College-Educated Hispanic Borrowers (2007)
SOURCE: Survey of Consumer Finances, HMDA-McDash, and authors' calculations.
0
50
100
150
200
250
300
350
400
0.1 0.2 0.3 0.4 0.5 0.6 0.7 0.8 0.9
College
No College
Overall Median (HMDA-McDash)
HMDA-McDash
Thousands of 2015 $
Percentiles
Figure 4Income Distribution of College-Educated Versus Non-College-Educated White Borrowers (2007)
SOURCE: Survey of Consumer Finances, HMDA-McDash, and authors' calculations.
Garriga, Ricketts, Schlagenhauf
148 First Quarter 2017 Federal Reserve Bank of St. Louis REVIEW
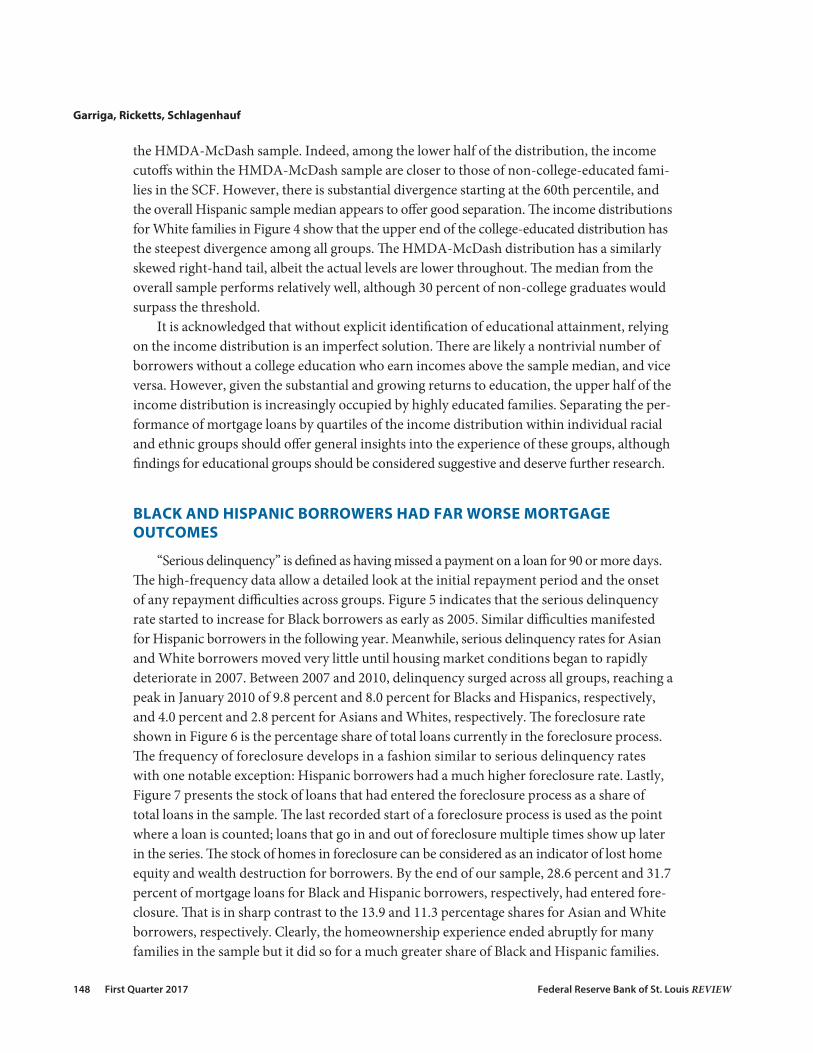
the HMDA-McDash sample. Indeed, among the lower half of the distribution, the income cutoffs within the HMDA-McDash sample are closer to those of non-college-educated fami-lies in the SCF. However, there is substantial divergence starting at the 60th percentile, and the overall Hispanic sample median appears to offer good separation. The income distributions for White families in Figure 4 show that the upper end of the college-educated distribution has the steepest divergence among all groups. The HMDA-McDash distribution has a similarly skewed right-hand tail, albeit the actual levels are lower throughout. The median from the overall sample performs relatively well, although 30 percent of non-college graduates would surpass the threshold.
It is acknowledged that without explicit identification of educational attainment, relying on the income distribution is an imperfect solution. There are likely a nontrivial number of borrowers without a college education who earn incomes above the sample median, and vice versa. However, given the substantial and growing returns to education, the upper half of the income distribution is increasingly occupied by highly educated families. Separating the per-formance of mortgage loans by quartiles of the income distribution within individual racial and ethnic groups should offer general insights into the experience of these groups, although findings for educational groups should be considered suggestive and deserve further research.
BLACK AND HISPANIC BORROWERS HAD FAR WORSE MORTGAGE OUTCOMES
“Serious delinquency” is defined as having missed a payment on a loan for 90 or more days. The high-frequency data allow a detailed look at the initial repayment period and the onset of any repayment difficulties across groups. Figure 5 indicates that the serious delinquency rate started to increase for Black borrowers as early as 2005. Similar difficulties manifested for Hispanic borrowers in the following year. Meanwhile, serious delinquency rates for Asian and White borrowers moved very little until housing market conditions began to rapidly deteriorate in 2007. Between 2007 and 2010, delinquency surged across all groups, reaching a peak in January 2010 of 9.8 percent and 8.0 percent for Blacks and Hispanics, respectively, and 4.0 percent and 2.8 percent for Asians and Whites, respectively. The foreclosure rate shown in Figure 6 is the percentage share of total loans currently in the foreclosure process. The frequency of foreclosure develops in a fashion similar to serious delinquency rates with one notable exception: Hispanic borrowers had a much higher foreclosure rate. Lastly, Figure 7 presents the stock of loans that had entered the foreclosure process as a share of total loans in the sample. The last recorded start of a foreclosure process is used as the point where a loan is counted; loans that go in and out of foreclosure multiple times show up later in the series. The stock of homes in foreclosure can be considered as an indicator of lost home equity and wealth destruction for borrowers. By the end of our sample, 28.6 percent and 31.7 percent of mortgage loans for Black and Hispanic borrowers, respectively, had entered fore-closure. That is in sharp contrast to the 13.9 and 11.3 percentage shares for Asian and White borrowers, respectively. Clearly, the homeownership experience ended abruptly for many families in the sample but it did so for a much greater share of Black and Hispanic families.

Garriga, Ricketts, Schlagenhauf
Federal Reserve Bank of St. Louis REVIEW First Quarter 2017 149
0
2
4
6
8
10
12
2004 2005 2006 2007 2008 2009 2010 2011 2012 2013
Asian
Black/African-American
Hispanic/Latino, Any Race
Non-Hispanic White
Percentage Share of Overall Loan Count
Figure 5Serious Delinquency Rate, by Race and Ethnicity
SOURCE: McDash data from Black Knight Financial Services, HMDA data from Board of Governors of the Federal Reserve System.
0
1
2
3
4
5
6
7
8
2004 2005 2006 2007 2008 2009 2010 2011 2012 2013
Asian
Black/African-American
Hispanic/Latino, Any Race
Non-Hispanic White
Percentage Share of Overall Loan Count
Figure 6Foreclosure Rate, by Race and Ethnicity
SOURCE: McDash data from Black Knight Financial Services, HMDA data from Board of Governors of the Federal Reserve System.

Garriga, Ricketts, Schlagenhauf
150 First Quarter 2017 Federal Reserve Bank of St. Louis REVIEW
DIFFERENTIAL EXPERIENCES BY INCOME RANK
Breaking out borrowers by income offers a more detailed look at how the homeowner-ship experience differed by financial capability within racial and ethnic groups. (See Table 8, which presents the income cutoffs used for each of the racial and ethnic income distributions as well as a 2 percent random sample that ignores race and ethnicity.) There is notable varia-tion across applicant incomes for each of the groups. This dispersion is useful given the inten-tion to stratify the sample into four income groups.
Asians
As shown in Figure 8, the serious delinquency rate among Asian borrowers progressed in a similar fashion across all four income groups. Interestingly, the rates remain virtually zero until the start of 2007. This is unique to this group, as all others showed financial duress prior to 2007 for at least one of the quartiles. Among Asians, borrowers in the first and sec-ond quartiles (lower half of income distribution) experienced greater repayment difficulties toward the end of 2009, but rates converged shortly thereafter. In Figure 9, the upper half of the income distribution had greater foreclosure rates between 2007 and 2010. Thereafter, the foreclosure rate for the lowest income group exceeded all others. This dynamic is also reflected in the foreclosure stock shown in Figure 10. Between 2008 and 2011, the highest-earning borrowers had more loans in foreclosure than the rest of the distribution. This inverts by 2012, when the foreclosure stock for first-quartile borrowers reaches 15 percent. Overall, there is relatively little separation between the delinquency and default history of the different income ranks.
0
5
10
15
20
25
30
35
2004 2005 2006 2007 2008 2009 2010 2011 2012 2013
Percentage Share of Cumulative Loans Entering Foreclosure
Asian
Black/African-American
Hispanic/Latino, Any Race
Non-Hispanic White
Figure 7Foreclosure Stock, by Race and Ethnicity
SOURCE: McDash data from Black Knight Financial Services, HMDA data from Board of Governors of the Federal Reserve System.

Garriga, Ricketts, Schlagenhauf
Federal Reserve Bank of St. Louis REVIEW First Quarter 2017 151
0
2
4
6
8
10
12
14
2004 2005 2006 2007 2008 2009 2010 2011 2012 2013
1st Quartile
2nd Quartile
3rd Quartile
4th Quartile
Percentage Share of Overall Loan Count
Figure 8Serious Delinquency Rate, Asian Borrowers, by Income Rank
SOURCE: McDash data from Black Knight Financial Services, HMDA data from Board of Governors of the Federal Reserve System.
0
2
4
6
8
10
2004 2005 2006 2007 2008 2009 2010 2011 2012 2013
Percentage Share of Overall Loan Count
1st Quartile
2nd Quartile
3rd Quartile
4th Quartile
Figure 9Foreclosure Rate, Asian Borrowers, by Income Rank
SOURCE: McDash data from Black Knight Financial Services, HMDA data from Board of Governors of the Federal Reserve System.

Garriga, Ricketts, Schlagenhauf
152 First Quarter 2017 Federal Reserve Bank of St. Louis REVIEW
Blacks
As Figure 11 shows, Black borrowers had the highest serious delinquency rates for each income quartile across all racial and ethnic groups. In addition, Black borrowers had the most heterogeneity in serious delinquency rates across income quartiles. Repayment difficulty within the sample began in late 2004 for the first, second, and third income quartiles. By the middle of 2005, borrowers in the highest income quartile also began to experience repayment difficulties. Throughout the time period, the severity of serious delinquency rates follows an intuitive rank ordering where the borrowers with the least income were the most delinquent, while those with the most income were the least delinquent. However, it is important to reit-erate that even the borrowers with the highest income levels were experiencing relatively high rates of delinquency. As Figure 12 shows, between 2006 and 2010 the foreclosure rate for the highest income quartile exceeded the rest. In 2010, the foreclosure rate among borrowers earning the least surpasses all others and remained so for the rest of the period. By 2011, the foreclosure rate was stagnant for the second quartile and falling for the third and fourth quar-tiles. In contrast, the foreclosure rate for the first quartile did not reach its zenith (6.8 percent) until July 2012. No other group experienced such a sustained and sizable increase in its respec-tive foreclosure rate between 2011 and 2012. Figure 13 shows the cumulative impact of the foreclosure rate as the stock of loans that had entered the foreclosure process. By this measure, Black borrowers earning the least within the sample suffered greatly. As of May 2013, 37.8 percent of the loans within the lowest income group had entered foreclosure, the highest rate among all racial and ethnic and income groups. Furthermore, based on the persistent and
0
5
10
15
20
25
30
35
40
2004 2005 2006 2007 2008 2009 2010 2011 2012 2013
Percentage Share of Cumulative Loans Entering Foreclosure
1st Quartile
2nd Quartile
3rd Quartile
4th Quartile
Figure 10Foreclosure Stock, Asian Borrowers, by Income Rank Within Racial/Ethnic Group
NOTE: We use the last date that the loan started a foreclosure process. Therefore, loans that go in and out of foreclosure show up later.
SOURCE: McDash data from Black Knight Financial Services, HMDA data from Board of Governors of the Federal Reserve System.

Garriga, Ricketts, Schlagenhauf
Federal Reserve Bank of St. Louis REVIEW First Quarter 2017 153
0
2
4
6
8
10
12
14
2004 2005 2006 2007 2008 2009 2010 2011 2012 2013
1st Quartile
2nd Quartile
3rd Quartile
4th Quartile
Percentage Share of Overall Loan Count
Figure 11Serious Delinquency Rate, Black Borrowers, by Income Rank
SOURCE: McDash data from Black Knight Financial Services, HMDA data from Board of Governors of the Federal Reserve System.
0
2
4
6
8
10
2004 2005 2006 2007 2008 2009 2010 2011 2012 2013
Percentage Share of Overall Loan Count
1st Quartile
2nd Quartile
3rd Quartile
4th Quartile
Figure 12Foreclosure Rate, Black Borrowers, by Income Rank
SOURCE: McDash data from Black Knight Financial Services, HMDA data from Board of Governors of the Federal Reserve System.

Garriga, Ricketts, Schlagenhauf
154 First Quarter 2017 Federal Reserve Bank of St. Louis REVIEW
steep upward trend, the stock of foreclosures may have increased further in the following months. Given the poignant results for the lowest-earning borrowers, it is easy to overlook the very poor outcomes across the remaining groups. By May 2013, 28 percent of the second quartile had entered foreclosure, while 24.7 percent and 23.9 percent of the fourth and third quartiles, respectively, entered foreclosure. These are remarkably high and similar foreclosure rates despite the considerable difference in income thresholds.
Hispanics, Any Race
Serious delinquency rates among Hispanic borrowers, as shown in Figure 14, began to escalate in the middle of 2005, starting with the lower income quartiles. By 2006, all income groups demonstrated increasing repayment difficulties. Similar to Asians, there was little separation between groups until early 2007 when, surprisingly, a greater share of borrowers in the upper income quartiles became seriously delinquent. This rank ordering continued until an inflection point in the middle of 2009, when greater repayment difficulties manifested for the lower income groups. As Figure 15 shows, the higher serious delinquency rates seen for the upper income quartiles were leading indicators of eventual default. Comparatively, the foreclosure rates among Hispanic borrowers in the second, third, and fourth quartiles were the highest across the respective income groups for all racial groups. Counter to intuition, the rank ordering runs from high- to low-income groups. In other words, the borrowers with the most income experienced much greater rates of foreclosure than borrowers with the least income. In addition to experiencing the highest overall foreclosure rates, Hispanic borrowers
0
5
10
15
20
25
30
35
40
2004 2005 2006 2007 2008 2009 2010 2011 2012 2013
Percentage Share of Cumulative Loans Entering Foreclosure
1st Quartile
2nd Quartile
3rd Quartile
4th Quartile
Figure 13Foreclosure Stock, Black Borrowers, by Income Rank Within Racial/Ethnic Group
NOTE: We use the last date that the loan started a foreclosure process. Therefore, loans that go in and out of foreclosure show up later.
SOURCE: McDash data from Black Knight Financial Services, HMDA data from Board of Governors of the Federal Reserve System.

Garriga, Ricketts, Schlagenhauf
Federal Reserve Bank of St. Louis REVIEW First Quarter 2017 155
0
2
4
6
8
10
12
14
2004 2005 2006 2007 2008 2009 2010 2011 2012 2013
Percentage Share of Overall Loan Count
1st Quartile
2nd Quartile
3rd Quartile
4th Quartile
Figure 14Serious Delinquency Rate, Hispanic Borrowers, by Income Rank
SOURCE: McDash data from Black Knight Financial Services, HMDA data from Board of Governors of the Federal Reserve System.
0
2
4
6
8
10
2004 2005 2006 2007 2008 2009 2010 2011 2012 2013
1st Quartile
2nd Quartile
3rd Quartile
4th Quartile
Percentage Share of Overall Loan Count
Figure 15Foreclosure Rate, Hispanic Borrowers, by Income Rank
SOURCE: McDash data from Black Knight Financial Services, HMDA data from Board of Governors of the Federal Reserve System.

Garriga, Ricketts, Schlagenhauf
156 First Quarter 2017 Federal Reserve Bank of St. Louis REVIEW
had the steepest rise in defaults. Between December 2006 and May 2009, foreclosure rates increased by 8.6, 7.4, 6.2, and 3.3 percentage points for the fourth, third, second, and first quar-tiles, respectively. This rapid deterioration in solvency is remarkable and raises further ques-tions regarding why episodes of serious delinquency quickly transitioned to default. Figure 16 reflects similar developments in the stock of loans entering foreclosure. By early 2007, the prospects of the upper and lower income groups of borrowers diverged considerably. By July 2007, around 25 percent of all loans to the highest-earning Hispanics in the sample had entered foreclosure.
Non-Hispanic Whites
Figure 17 shows that White borrowers in the sample had low serious delinquency rates throughout the housing boom and bust. Indeed, the rates shown here are far lower than the overall serious delinquency rate for mortgages recorded during this time. This is surprising given that these were loans acquired so close to the crash of the housing market. Those bor-rowers who did experience repayment difficulties had the lowest incomes within the sample. Only around 2 percent of loans to borrowers in the upper half of the income distribution became seriously delinquent during the peak of the recession. The foreclosure rates for Whites shown in Figure 18 also reveal a relatively low frequency of default in the sample. Once again, the borrowers with the lowest income levels experienced the greatest rate of foreclosure. They surpass the higher income quartiles by the close of 2009, and the foreclosure rate remains elevated for the remainder of the time period. Lastly, Figure 19 illustrates that White borrow-
0
5
10
15
20
25
30
35
40
2004 2005 2006 2007 2008 2009 2010 2011 2012 2013
Percentage Share of Cumulative Loans Entering Foreclosure
1st Quartile
2nd Quartile
3rd Quartile
4th Quartile
Figure 16Foreclosure Stock, Hispanic Borrowers, by Income Rank Within Racial/Ethnic Group
NOTE: We use the last date that the loan started a foreclosure process. Therefore, loans that go in and out of foreclosure show up later.
SOURCE: McDash data from Black Knight Financial Services, HMDA data from Board of Governors of the Federal Reserve System.

Garriga, Ricketts, Schlagenhauf
Federal Reserve Bank of St. Louis REVIEW First Quarter 2017 157
0
2
4
6
8
10
12
14
2004 2005 2006 2007 2008 2009 2010 2011 2012 2013
Percentage Share of Overall Loan Count
1st Quartile
2nd Quartile
3rd Quartile
4th Quartile
Figure 17Serious Delinquency Rate, White Borrowers, by Income Rank
SOURCE: McDash data from Black Knight Financial Services, HMDA data from Board of Governors of the Federal Reserve System.
0
2
4
6
8
10
2004 2005 2006 2007 2008 2009 2010 2011 2012 2013
Percentage Share of Overall Loan Count
1st Quartile
2nd Quartile
3rd Quartile
4th Quartile
Figure 18Foreclosure Rate, White Borrowers, by Income Rank
SOURCE: McDash data from Black Knight Financial Services, HMDA data from Board of Governors of the Federal Reserve System.

Garriga, Ricketts, Schlagenhauf
158 First Quarter 2017 Federal Reserve Bank of St. Louis REVIEW
ers had the lowest share of loans in foreclosure across racial and ethnic groups. As the Great Recession took hold, lower-income borrowers fell further behind. By the close of the sample, there is considerable separation between the lower and upper income quartiles. By May 2013, 17.1 percent, 12 percent, 8.6 percent, and 7.6 percent of loans had entered foreclosure for the first, second, third, and fourth quartiles, respectively.
ROBUSTNESS TO DIFFERENT INCOME THRESHOLDS
Given the counterintuitive results for Hispanic borrowers, how robust are these findings to different income thresholds? Table 7 offers a comparison between the income thresholds unique to the Hispanic sample and those of a 2 percent random sample that ignores race or ethnicity. The latter cutoffs are very close to those of the White sample. This is due to the fact that 76 percent of the HMDA-McDash distribution consists of White borrowers. Compared with Figure 14, Figure 20 shows that the highest income quartile had lower rates of serious delinquency throughout the reference period. The foreclosure rate (Figure 21) for the fourth quartile is lower across the reference period, while the rate for the third quartile rises consid-erably. This is evidence that some distressed borrowers who met the 75 percent income thresh-old unique to Hispanics moved to the third quartile. In Figure 22, the share of loans entering foreclosure is ultimately higher for the third quartile of borrowers by May 2013 than any other group. Previously, the third and fourth quartiles had roughly the same share of loans entering foreclosure. While the higher income thresholds reallocate some of the distressed borrowers
0
5
10
15
20
25
30
35
40
2004 2005 2006 2007 2008 2009 2010 2011 2012 2013
Percentage Share of Cumulative Loans Entering Foreclosure
1st Quartile
2nd Quartile
3rd Quartile
4th Quartile
Figure 19Foreclosure Stock, White Borrowers, by Income Rank Within Racial/Ethnic Group
NOTE: We use the last date that the loan started a foreclosure process. Therefore, loans that go in and out of foreclosure show up later.
SOURCE: McDash data from Black Knight Financial Services, HMDA data from Board of Governors of the Federal Reserve System.

Garriga, Ricketts, Schlagenhauf
Federal Reserve Bank of St. Louis REVIEW First Quarter 2017 159
0
2
4
6
8
10
12
14
2004 2005 2006 2007 2008 2009 2010 2011 2012 2013
Percentage Share of Overall Loan Count
1st Quartile
2nd Quartile
3rd Quartile
4th Quartile
Figure 20Serious Delinquency Rate, Hispanic Borrowers, by Income Rank (Thresholds for Total Sample)
SOURCE: McDash data from Black Knight Financial Services, HMDA data from Board of Governors of the Federal Reserve System.
0
2
4
6
8
10
2004 2005 2006 2007 2008 2009 2010 2011 2012 2013
Percentage Share of Overall Loan Count
1st Quartile
2nd Quartile
3rd Quartile
4th Quartile
Figure 21Foreclosure Rate, Hispanic Borrowers, by Income Rank (Thresholds for Total Sample)
SOURCE: McDash data from Black Knight Financial Services, HMDA data from Board of Governors of the Federal Reserve System.

Garriga, Ricketts, Schlagenhauf
160 First Quarter 2017 Federal Reserve Bank of St. Louis REVIEW
from the fourth to the third quartile, the results are largely robust. The highest- earning Hispanic borrowers remain those with the greatest share of loans that enter foreclosure.
LOGIT REGRESSION ANALYSIS
Logit regressions are estimated using the outcome of entering foreclosure within the pre-vious 12 months as the dependent variable. First, the outcome is regressed simply on racial and ethnic binary variables as a baseline. Coefficients are presented as odds ratios with White bor-rowers as the reference group. A coefficient of 1 would indicate no difference in likelihood of foreclosure between groups. Second, variables representing underwriting considerations are
0
5
10
15
20
25
30
35
40
2004 2005 2006 2007 2008 2009 2010 2011 2012 2013
Percentage Share of Cumulative Loans Entering Foreclosure
1st Quartile
2nd Quartile
3rd Quartile
4th Quartile
Figure 22Foreclosure Stock, Hispanic Borrowers, by Income Rank (Thresholds for Total Sample)
NOTE: We use the last date that the loan started a foreclosure process. Therefore, loans that go in and out of foreclosure show up later.
SOURCE: McDash data from Black Knight Financial Services, HMDA data from Board of Governors of the Federal Reserve System.
Table 7Real Income Distribution Cutoffs, by Race or Ethnicity (2013 $)
25th 75th Race/ethnicity Min Percentile Median Percentile Max
Asian 5,967 75,758 109,307 162,762 9,346,320
Black 7,160 48,555 68,208 98,876 12,329,223
Hispanic, any race 7,398 53,699 78,613 114,673 11,234,831
Non-Hispanic White 6,936 56,277 83,237 124,855 9,156,069
All (2% random sample) 1,124 56,180 82,614 124,459 12,329,223

Garriga, Ricketts, Schlagenhauf
Federal Reserve Bank of St. Louis REVIEW First Quarter 2017 161
introduced. Third, the model is adjusted to control for aspects of the loan structure. Lastly, state fixed effects are introduced to control for the impact of regional housing conditions on foreclosure rates. All results are presented in Table 8.
Baseline Results
In column 1 of Table 8, on average, Black and Hispanic borrowers were 171 percent and 209 percent more likely than Whites, respectively, to encounter foreclosure within the past year. This is in sharp contrast to Asians, who were only 24 percent more likely to enter foreclo-sure. Introducing explanatory variables in the following columns allows identification of the most salient predictors of foreclosure within the racial groups. If a set of variables lowers a coefficient for one racial and ethnic group considerably more than another, that set of variables explains a greater amount of variance in the foreclosure rate for that racial and ethnic group.
Underwriting
Column 2 of Table 8 shows the racial and ethnic coefficients after controlling for under-writing considerations. The variables include real income, FICO score at origination, the presence of a co-borrower, applicant gender, and the loan amount. Controlling for these fac-tors lowers the odds ratios considerably for Black and Hispanic borrowers. After controlling
Table 8Logit Regression of Foreclosure on Sets of Explanatory Variables
Variable (1) (2) (3) (4) (5)
Black 2.71** 1.70** 2.20** 2.76** 1.58**
Hispanic 3.09** 2.37** 2.34** 2.58** 1.75**
Asian 1.24** 1.12** 1.14** 1.11** 1.11**
Income ✓ ✓
FICO score ✓ ✓
Co-borrower present ✓ ✓
Female primary borrower ✓ ✓
Loan amount ✓ ✓
Interest-only fixed ✓ ✓
Interest-only ARM ✓ ✓
ARM ✓ ✓
Balloon ✓ ✓
Jumbo loan ✓ ✓
High spread ✓ ✓
State fixed effects ✓ ✓
NOTE: The dependent variable is a foreclosure event within the past year. Coefficients are presented as odds ratios with a White binary variable omitted for comparison. A coefficient of 1.00 would indicate no difference between groups. A check mark indicates the block of variables was included in the logit regression. ** denotes significance at the 1 per-cent level.

Garriga, Ricketts, Schlagenhauf
162 First Quarter 2017 Federal Reserve Bank of St. Louis REVIEW
for underwriting, Blacks and Hispanics have a 70 percent and 137 percent greater likelihood of foreclosure, respectively, than Whites. For Asians the likelihood is halved to a 12 percent greater likelihood of foreclosure. Compared with the baseline, the relative likelihood for Black borrowers declines by 101 percentage points. For Hispanic borrowers the likelihood falls by 72 percentage points. This suggests that underwriting standards explain a greater share of the Black-White gap in foreclosures within our sample.
Loan Structure
Column 3 of Table 8 shows results after controls for loan characteristics are added to the model. This includes whether the loan is interest only (fixed or adjustable rate), an adjustable- rate mortgage (fixed is the omitted group), a balloon loan, a jumbo loan, and whether the interest rate on the loan equals or exceeds 3 percentage points above a Treasury security of comparable maturity, our proxy measure of high-cost or subprime status. These controls again lower the foreclosure gaps between non-White and White borrowers. Black borrowers
0 50
100 150 200 250 300 350
Chicago
0 50
100 150 200 250 300 350
Phoenix
0 50
100 150 200 250 300 350
Tampa
0 50
100 150 200 250 300 350
Las Vegas
0 50
100 150 200 250 300 350
Los Angeles
0 50
100 150 200 250 300 350
Miami
0 50
100 150 200 250 300 350
Washington, D.C.
0 50
100 150 200 250 300 350
San Diego
0 50
100 150 200 250 300 350
San Francisco
1995 1997
1999 2001
2003 2005
2007 2009
2011 2013
2015
1995 1997
1999 2001
2003 2005
2007 2009
2011 2013
2015 1995
1997 1999
2001 2003
2005 2007
2009 2011
2013
2015
1995 1997
1999 2001
2003 2005
2007 2009
2011 2013
2015
1995 1997
1999 2001
2003 2005
2007 2009
2011 2013
2015
1995 1997
1999 2001
2003 2005
2007 2009
2011 2013
2015
1995 1997
1999 2001
2003 2005
2007 2009
2011 2013
2015
1995 1997
1999 2001
2003 2005
2007 2009
2011 2013
2015
1995 1997
1999 2001
2003 2005
2007 2009
2011 2013
2015
Low Middle High Composite
Figure 23Case-Shiller House Price Index
SOURCE: Standard & Poor's/Haver Analytics.

Garriga, Ricketts, Schlagenhauf
Federal Reserve Bank of St. Louis REVIEW First Quarter 2017 163
are 120 percent (51 percentage points lower) more likely to experience a foreclosure despite the controls. Hispanic borrowers have a 134 percent (75 percentage points lower) greater likelihood of foreclosure. The coefficient for Asians changes little and Asian borrowers have a 14 percent greater likelihood of foreclosure than Whites. Thus, loan structure goes further in explaining the Hispanic-White gap in foreclosure than for other racial and ethnic groups.
Regional Concentration
The housing bubble and crash were most severe in what Alan Greenspan referred to as frothy local housing markets.13 Figure 23 shows house price indexes, segmented into low, middle, and high values, for some of the most volatile housing markets. Many of these metro areas are collectively known as “Sunbelt” cities, including: Los Angeles, San Diego, Phoenix, Las Vegas, Miami, and Tampa. Across all of these areas the lower end of the housing market saw the greatest relative growth during the bubble. Conversely, after the bubble burst the declines in house prices were the most severe for the lower end. This incredible boom and bust severely destabilized borrowers, who likely expected further growth in house prices, much less a precipitous decline. Table 9 offers evidence that this regional volatility may be an important explanatory factor for the foreclosure gap. Specifically, among the foreclosures in our sample there is significant concentration within the most volatile metro areas, more so for non-White borrowers.
State fixed effects are introduced in column 4 of Table 8 to control for regional variation in housing markets and the geographic concentration of various racial/ethnic groups. The likelihood of foreclosure relative to Whites changes very little for Black borrowers and declines by 13 percentage points for Asians. In contrast, the gap declines by 13 percentage points and 51 percentage points for Asians and Hispanics, respectively. This reflects the greater geographic concentration seen for both Hispanics and Asians. Interestingly, regional concentration was
Table 9Top 10 Counties by Foreclosures in Sample, by Race and Ethnicity
Asian Black Hispanic White
County Share County Share County Share County Share
Los Angeles, CA 9.1 Cook, IL 5.5 Miami-Dade, FL 8.3 Maricopa, AZ 2.8
Clark, NV 4.8 Wayne, MI 3.2 Los Angeles, CA 6.8 Clark, NV 1.7
Alameda, CA 4.3 Fulton, GA 2.7 Riverside, CA 3.9 Cook, IL 1.7
Orange, CA 4.1 Broward, FL 2.5 Maricopa, AZ 3.6 Los Angeles, CA 1.7
Riverside, CA 3.4 Harris, TX 2.4 San Bernardino, CA 3.2 San Diego, CA 1.2
Sacramento, CA 2.9 Dallas, TX 2.3 Cook, IL 2.9 Broward, FL 1.0
Santa Clara, CA 2.7 Prince George's, MD 2.2 Broward, FL 2.9 Riverside, CA 1.0
Queens, NY 2.3 Los Angeles, CA 1.8 Clark, NV 2.2 Palm Beach, FL 0.9
Cook, IL 2.2 DeKalb, GA 1.8 Harris, TX 2.1 Lee, FL 0.9
San Diego, CA 2.2 Shelby, TN 1.7 San Diego, CA 2.0 Hillsborough, FL 0.9
Total 38.2 Total 26.0 Total 37.8 Total 13.9

Garriga, Ricketts, Schlagenhauf
164 First Quarter 2017 Federal Reserve Bank of St. Louis REVIEW
less relevant for the Black-White foreclosure gap. However, Black borrowers in our sample were less concentrated in California, Florida, and Nevada. House prices in Atlanta, Detroit, and Dallas (all areas with a greater concentration of Black borrowers) did not see the same level of volatility characteristic of the Sunbelt.
Full Model
Lastly, all of the explanatory variables are included in column 5 of Table 8 to explain as much of the non-White–White gap in foreclosure as possible. Comparing column 1 with column 5, 66 percent, 64 percent, and 54 percent of the gap for Black, Hispanic, and Asian borrowers, respectively, is explained by the observed explanatory variables. It appears that underwriting explains a large share of the gap for both Black and Hispanic borrowers, although it is more significant for Blacks. Loan structure also explains a great deal and captures relatively more variation among Hispanic borrowers. Lastly, regional variation explains a significant portion of the gap for Hispanics. This is reasonable given that over 51 percent of our Hispanic borrowers were located in California and Florida, two states that suffered severely during the housing crash. One source of potential omitted variable bias is that these models lack explan-atory variables for labor market developments. The dataset does not allow such a comparison, but studies have found that minority groups generally fare worse in the labor market (see Altonji and Blank, 1999) and had relatively worse labor market outcomes during the Great Recession (see Hoynes, Miller, and Schaller, 2012). Including measures of labor market out-comes could further reduce the gaps that remain.
CONCLUSION
The Great Recession wiped out much of the homeownership gains attained during the housing boom. However, the homeownership experience was very different across racial and ethnic groups. Black and Hispanic borrowers experienced substantial repayment difficulties that ultimately led to a greater share of homes in foreclosure. Given that home equity often represents a substantial share of household wealth, these foreclosure events severely damaged the balance sheets of minority families. The dynamics of delinquency and foreclosure func-tioned differently across the income distribution within racial and ethnic groups. For the majority, higher income was associated with lower delinquency rates and fewer foreclosures as a group. However, for Hispanic families this relationship was surprisingly reversed. Hispanics with the highest incomes fared worse than those with the lowest incomes. This counterintui-tive finding suggests how college-educated Hispanic families may have had worse wealth out-comes than their non-college-educated peers: Hispanic families with high income (potentially the result of high educational attainment) had a greater share of home equity lost in foreclo-sure than lower-income Hispanic families. Logit regressions suggest that underwriting stan-dards and loan structure explain a significant amount of the greater likelihood of foreclosure among Black and Hispanic borrowers. However, underwriting standards explained more of the gap for Black borrowers, while loan structure was a stronger factor among Hispanic bor-rowers. Regional concentration and variation in housing markets explained more of the

Garriga, Ricketts, Schlagenhauf
Federal Reserve Bank of St. Louis REVIEW First Quarter 2017 165
Hispanic-White foreclosure gap than any other group. This is understandable given that Hispanic borrowers in our sample were heavily concentrated in housing markets that experi-enced some of the largest volatility. Despite accounting for these important factors, sizable gaps remain in foreclosures among Blacks and Hispanics relative to Whites. Incorporating measures of labor market outcomes into the analysis may offer further insights. In sum, the homeownership experience during the Great Recession proved to be inimical for many fam-ilies, but far more so for Black and Hispanic families. For these families, financially destruc-tive foreclosure events delayed and potentially derailed the dream of homeownership. n
NOTES1 Using Survey of Consumer Finance (SCF) data, “Asian” in that report is the combined group of families in which
the household respondent identified most strongly as “Asian,” “American Indian/Alaskan Native,” “Native Hawaiian/ Pacific Islander,” and “Other.” The groups are combined in the public SCF data given small responses across the latter three groups. In this article, the authors refer to the overall group as “Asian” based on its majority share among these four groups in the overall population, as reported by the Census Bureau.
2 See Emmons and Noeth (2015).
3 See the Board of Governors of the Federal Reserve System Flow of Funds, FRED®, Federal Reserve Bank of St. Louis, accessed January 31, 2017; https://fred.stlouisfed.org/series/TABSHNO.
4 See FRED®, Federal Reserve Bank of St. Louis, accessed January 31, 2017; https://fred.stlouisfed.org/series/HNOREMQ027S.
5 The match was provided by the Federal Reserve Bank of Philadelphia’s Risk Assessment, Data Analysis, and Research (RADAR) program. The version of the match used is as of January 17, 2017.
6 High-priced loans refer to home loans with an annual percentage rate above a specific threshold. A first-lien loan is considered higher-priced if the interest on it exceeds the rate on Treasury securities of comparable maturity by at least 3 percentage points. Given that most subprime loans are higher-priced and most higher-priced loans originate in the subprime market, we use the higher-priced designation as a proxy for subprime.
7 The income reported on the HMDA application is what the financial institution providing the loan “relied on.” The report on HMDA reporting put forth by the Federal Financial Institutions Examination Council (FFIEC) states that, “If an institution relies on the income of a cosigner to evaluate credit worthiness, the institution includes this income to the extent relied upon” (FFIEC, 2004, p. D-13).
8 Note that the income of an applicant is static over the entire life of the loan given that it is recorded only at the start through the HMDA application. Therefore, income rankings are not dynamic and do not change based on events such as a job loss or reduced hours.
9 Applicant incomes are adjusted for inflation using the Consumer Price Index Research Series Using Current Methods (CPI-U-RS) with a base year of 2013. This is comparable to the figures reported in Emmons and Noeth (2015).
10 Income thresholds used to partition the sample in later analysis are estimated across all years.
11 While attempting to limit the SCF sample to families with a first-lien home purchase mortgage, the sample size for the three non-White racial and ethnic groups dropped to unreliable levels.
12 The HMDA-McDash sample defines Asians as primary borrowers who identified as “Asian.” It does not combine racial groups. Therefore, the SCF statistics for Asians reported here differ by definition. See note 2 for a descrip-tion of the SCF definition.
13 “Testimony of Chairman Alan Greenspan before the Joint Economic Committee.” June 9, 2005; https://www.federalreserve.gov/BOARDDOCS/TESTIMONY/2005/200506092/default.htm.

Garriga, Ricketts, Schlagenhauf
166 First Quarter 2017 Federal Reserve Bank of St. Louis REVIEW
REFERENCESAdelino, Manuel; Schoar, Antoinette and Severino, Felipe. “Loan Originations and Defaults in the Mortgage Crisis:
The Role of the Middle Class.” Review of Financial Studies, July 2016, 29(7), pp. 1635-70; https://doi.org/10.1093/rfs/hhw018.
Albanesi, Stefania; DeGiorgi, Giacomo; Nosal, Jaromir and Ploenzke, Matthew. “Credit Growth and the Financial Crisis: A New Narrative.” Presented at the National Bureau of Economic Research Program on Monetary Economics, New York, New York, March 4, 2016.
Altonji, Joseph G. and Blank, Rebecca M. “Race and Gender in the Labor Market,” in Orley C. Ashenfelter and David Card, eds. Handbook of Labor Economics. Volume 3C. Amsterdam: North-Holland, 1999, pp. 3143-259; https://doi.org/10.1016/S1573-4463(99)30039-0.
Bayer, Patrick; Ferreira, Fernando and Ross, Stephen L. “The Vulnerability of Minority Homeowners in the Housing Boom and Bust.” American Economic Journal: Economic Policy, 2016, 8(1), pp. 1-27; https://doi.org/10.1257/pol.20140074.
Becker, Gary S. Human Capital: A Theoretical and Empirical Analysis with Special Reference to Education. New York: National Bureau of Economic Research, 1964.
Becker, Gary S. and Chiswick, Barry R. “Education and the Distribution of Earnings.” American Economic Review, March 1966, 56(1/2), pp. 358-69.
Boshara, Ray; Emmons, William R. and Noeth, Bryan J. “Demographics of Wealth: How Education and Race Separate Thrivers from Strugglers in Today’s Economy.” Essay No. 2, Federal Reserve Bank of St. Louis, April 2015; https://www.stlouisfed.org/~/media/Files/PDFs/HFS/essays/HFS-Essay-2-2015-Education-and-Wealth.pdf.
Campbell, John Y. and Cocco, João F. “A Model of Mortgage Default.” Journal of Finance, August 2015, 70(4), pp. 1495-554; https://doi.org/10.1111/jofi.12252.
Carnevale, Anthony, P.; Strohl, Jeff and Melton, Michelle. What’s It Worth? The Economic Value of College Majors. Washington, DC: Georgetown University, Georgetown Public Policy Institute, Center on Education and the Workforce; https://cew.georgetown.edu/cew-reports/whats-it-worth-the-economic-value-of-college-majors/.
Emmons, William R. and Noeth, Bryan J. “Why Didn’t Higher Education Protect Hispanic and Black Wealth?” Federal Reserve Bank of St. Louis In the Balance, Issue 12, August 2015; https://www.stlouisfed.org/~/media/Publications/In%20the%20Balance/Images/Issue_12/ITB_August_2015.pdf.
Federal Financial Institutions Examination Council. A Guide to HMDA Reporting: Getting it Right! Arlington, VA: FFIEC, 2004; https://www.ffiec.gov/hmda/pdf/2004guide.pdf.
Foote, Christopher L., Loewenstein, Lara and Willen, Paul S. “Cross-Sectional Patterns of Mortgage Debt During the Housing Boom: Evidence and Implications.” NBER Working Paper No. 22985, National Bureau of Economic Research, December 2016; http://www.nber.org/papers/w22985.pdf.
Garriga, Carlos and Hedlund, Aaron. “Mortgage Debt, Consumption, and Illiquid Housing Markets in the Great Recession.” Working paper, November 21, 2016; https://faculty.missouri.edu/~hedlunda/research/housingQE_main.pdf.
Gerardi, Kristopher; Herkenhoff, Kyle F.; Ohanian, Lee E. and Willen, Paul S. “Can’t Pay or Won’t Pay? Unemployment, Negative Equity, and Strategic Default.” NBER Working Paper No. 21630, October 2015; http://www.nber.org/papers/w21630.pdf.
Heckman, James J.; Lochner, Lance J. and Todd, Petra E. “Earnings Functions, Rates of Return and Treatment Effects: The Mincer Equation and Beyond,” in Eric Hanushek and Finis Welch, eds., Handbook of the Economics of Education. Volume 1. Amsterdam: Elsevier, 2006, pp. 307-458; https://doi.org/10.1016/s1574-0692(06)01007-5.
Hoynes, Hilary; Miller, Douglas L. and Schaller, Jessamyn. “Who Suffers During Recessions?” Journal of Economic Perspectives, Summer 2012, 26(3), pp. 27-47; https://doi.org/10.1257/jep.26.3.27.
Kau, James B.; Keenan, Donald C. and Kim, Taewon. “Default Probabilities for Mortgages.” Journal of Urban Economics, May 1994, 35(3), pp. 278-96; https://doi.org/10.1006/juec.1994.1017.

Garriga, Ricketts, Schlagenhauf
Federal Reserve Bank of St. Louis REVIEW First Quarter 2017 167
Mian, Atif and Sufi, Amir. “The Consequences of Mortgage Credit Expansion: Evidence from the U.S. Mortgage Default Crisis.” Quarterly Journal of Economics, November 2009, 124(4), pp. 1449-96; https://doi.org/10.1162/qjec.2009.124.4.1449.
Mincer, Jacob. “Investment in Human Capital and Personal Income Distribution.” Journal of Political Economy, August 1958, 66(4), pp. 281-302; https://doi.org/10.1086/258055.
Mincer, Jacob. “On-the-Job Training: Costs, Returns, and Some Implications.” Journal of Political Economy, October 1962, 70(5 Part 2), pp. 50-79; https://doi.org/10.1086/258725.
Quercia, Roberto G. and Stegman, Michael A. “Residential Mortgage Default: A Review of the Literature.” Journal of Housing Research, 1992, 3(2), pp. 341-79.
Schelkle, Thomas. “Mortgage Default During the U.S. Mortgage Crisis.” Working paper, University of Cologne Working Paper Series in Economics, May 16, 2014; http://ockenfels.uni-koeln.de/fileadmin/wiso_fak/stawi-ockenfels/pdf/wp_series_download/wp0072.pdf.
Vandell, Kerry D. “Handing Over the Keys: A Perspective on Mortgage Default Research.” Real Estate Economics, September 1993, 21(3), pp. 211-46; https://doi.org/10.1111/1540-6229.00609.
Willis, Robert J. “Wage Determinants: A Survey and Reinterpretation of Human Capital Earnings Functions,” in Orley C. Ashenfelter and Richard Layard, eds., Handbook of Labor Economics. Volume 1. Amsterdam: North-Holland, 1986, pp. 525-602; https://doi.org/10.1016/s1573-4463(86)01013-1.

168 First Quarter 2017 Federal Reserve Bank of St. Louis REVIEW