the housing and other service needs of recently … housing and other service needs of recently...
TRANSCRIPT

The housing and other service needs of recently arrived immigrants authored by
Andrew Beer Sarah Morphett
Australian Housing and Urban Research Institute Southern Research Centre
June 2002
AHURI Final Report No. 17
ISSN: 1834-7223 ISBN: 1 877005 49 5

ACKNOWLEDGEMENTS This material was produced with funding from the Commonwealth of Australia and the Australian States and Territories. AHURI gratefully acknowledges the financial and other support it has received from the Commonwealth, State and Territory governments, without which this work would not have been possible.
DISCLAIMER AHURI Ltd is an independent, non-political body which has supported this project as part of its programme of research into housing and urban development, which it hopes will be of value to policy-makers, researchers, industry and communities. The opinions in this publication reflect the views of the authors and do not necessarily reflect those of AHURI Ltd, its Board or its funding organisations. No responsibility is accepted by AHURI Ltd or its Board or its funders for the accuracy or omission of any statement, opinion, advice or information in this publication.
AHURI FINAL REPORT SERIES AHURI Final Reports is a refereed series presenting the results of original research to a diverse readership of policy makers, researchers and practitioners.

iii
TABLE OF CONTENTS
Acknowledgements ii List of Figures iv List of Tables iv Appendix A Tables iv Appendix B Tables iv Executive Summary v CHAPTER ONE. INTRODUCTION 1 CHAPTER TWO. IMMIGRATION POLICY, WELFARE REGIMES AND SOCIAL
EXCLUSION 4 2.1 Welfare Regimes ...................................................................................................4
2.1.1 The Australian Welfare Regime and Immigration.................................................5 2.2 Social Exclusion and Social Inclusion ....................................................................5
2.2.1 Social Exclusion .............................................................................................5 2.2.2. Social Inclusion ..................................................................................................7
2.3 Conclusion .............................................................................................................7 CHAPTER 3. SERVICE PROVISION AND HOUSING FOR IMMIGRANTS TO AUSTRALIA
9 3.1 Entry into Australia.................................................................................................9 3.2 Immigrants and Access to Government Provided Services ..................................10 3.3 Housing and Immigrants in Australia....................................................................11 3.4 Conclusion ...........................................................................................................12
CHAPTER FOUR METHODOLOGY - THE LONGITUDINAL SURVEY OF IMMIGRANTS TO AUSTRALIA 14
4.1 The Longitudinal Survey of Immigrants to Australia .............................................14 4.2 The Analysis ........................................................................................................16
CHAPTER FIVE. HOUSING, SERVICES AND RECENT IMMIGRANTS TO AUSTRALIA 17 5.1 Housing and the Use of Services by Immigrants..................................................17 5.2 Patterns of Service Use Within Settlement...........................................................21
5.2.1 Non Users ....................................................................................................23 5.2.2 Early Users...................................................................................................24 5.2.3 Late Users ....................................................................................................25 5.2.4 High Users....................................................................................................26
5.3 Users of Housing Services...................................................................................27 5.4 Conclusion ...........................................................................................................29
CHAPTER SIX. CONCLUSION AND POLICY IMPLICATIONS 31 6.1 The Relationship Between Housing and The Use of Other Services....................31 6.2 Lessons for Policy Development and Program Delivery.......................................32
6.2.1 The Development of a ‘Whole of Government’ Perspective. .........................32 6.2.2 The Analysis of how Non-Shelter Outcomes Vary with the Different forms of
Housing Assistance ......................................................................................33 6.2.3 The Identification of Critical Housing Factors................................................33 6.2.4 Specification of Key Performance Indicators.................................................34 6.2.5 Implications of the Interaction between Housing Assistance and other
Government Interventions ............................................................................35 6.3 Conclusion ...........................................................................................................36
BIBLIOGRAPHY 37 APPENDIX A. Characteristics of Service User Groups....................................................40 APPENDIX B. Characteristics of Housing Service Users.................................................50
iv
LIST OF FIGURES
Figure 1. Settler Arrivals by Year, 1988-89 to 1999-00 2 Figure 2: Number of Times Services Used by Tenure, All Waves 18
LIST OF TABLES
Table 1. Number of Services Used by Wave and Type of Service, All PAs 19 Table 2. Mean Number of Services Used by Tenure at Wave Three, Users of Housing
Services and All Principal Applicants 21 Table 3. Visa Category by Pattern of Service Use 23
APPENDIX A TABLES
Table A1. Tenure by Wave 40 Table A2. Total Household Income by Wave 41 Table A3. Labour Force Status by Wave 43 Table A4. Origin of Settlers 45 Table A5. How Well English Spoken 46 Table A6. How Well Satisfied with Life in Australia 47 Table A7. Number of Services Used by Sector and Wave 48 Table A8. Number of Services Used by Service Type and Wave 49
APPENDIX B TABLES
Table B1. Users of Housing Services by Visa Category and Period of Housing Service Use 50
Table B2. Tenure, Users of Housing Services, All Waves 50 Table B3. Weekly Rent /Mortgage, Users of Housing Services, All Waves 50 Table B4. Labour Force Status, Users of Housing Services, All Waves 51 Table B5. Household Income, Users of Housing Services, All Waves 51 Table B6. How Well English Spoken, Users of Housing Services, All Waves 51 Table B7. Satisfaction with Life in Australia, Users of Housing Services, All Waves 51 Table B8. Services Used by Sector, Users of Housing Services, All Waves 52 Table B9. Type of Service Used, Users of Housing Services, All Waves 52 Table B10. Amount of Rent Assistance Received, Waves Two and Three 52 Table B 11. Source of Assistance in Finding a House, Users of Housing Services, All Waves 52

v
EXECUTIVE SUMMARY
This research has considered the use of housing and other services by recent immigrants to Australia. It has focussed on the relationship between housing, and housing assistance measures, and the use of other services by recent immigrants, as well as measures of their quality of life, vulnerability and satisfaction with Australia. The analysis was based on the examination of data from the Longitudinal Survey of Immigrants to Australia (LSIA), with three waves of surveys applied to immigrants who arrived in Australia between September 1993 and August 1995. The three waves captured the settlement experiences of recent immigrants after six months, 18 months and three and a half years post arrival. Once weighted, just under 52,000 immigrants participated in all three waves of the survey.
The research found that recent immigrants made considerable use of government and other services, with more than 250,000 uses of services reported over the three waves. The use of services varied considerably by tenure, with home owners and home purchasers having the least recourse to assistance, and public and private tenants the greatest. Education and language assistance was the largest single service used by recent immigrants, followed by social services, employment assistance and health and aged care services.
While it is possible to identify general trends in service use it is more important to recognise substantial variation in service use between different categories of immigrant. Visa category, educational qualifications, country of birth and age act in unison as a major cleavage amongst immigrants with respect both to housing circumstances and the requirement for government assistance or help from other sources.
Four patterns of service use were singled out for further investigation. These were the non users of services, the early users of services, the late users of services and high users of services. Each was considered to offer important insights into the interaction between housing and service use amongst recent immigrants. Discriminant analysis showed that while an immigrant’s position within these four categories varied according to tenure and the use of housing services, these factors reflected other more fundamental relationships, and did not play an independent determining role.
Non users of services were found to have relatively high incomes, most came to Australia under the Preferential Family program and the majority were home owners or home purchasers by Wave Three. Unemployment was not a problem for this group with 5.8 per cent looking for work at Wave One and no members of this group seeking employment at Wave Three. Home duties was an important primary activity for many members of this group, indicating the significance of either independent means, or other forms of income support, such as family members.
Early users of services were drawn from the Independent, Business Skills and Employer Nomination, and Concessional Family immigration streams. Household incomes were high, but not as high as for non-users. Upon first arrival, when they reported the use of government and other services, the majority of this group lived in private rental housing. The early user group were very successful in gaining access to paid employment and the data suggest the use of government services was important for them in securing jobs, gaining permanent accommodation and achieving independence from further government support. While originally accommodated in the private rental sector, significant numbers had entered home purchase after three and a half years in Australia.
Late users were almost entirely drawn from persons who immigrated to Australia under the Preferential Family scheme. They did not make use of government services by Wave One of the LSIA and this almost certainly reflects the impact of reforms introduced by the Keating Labor Government with effect from January 1993. These policy changes prohibited access to many services for the first six months of

vi
settlement but were found to merely delay the use of services. The immigrants in this group used approximately the same number, and same types, of assistance as the early users but their integration into Australian society was slowed. The Keating Government policies may have encouraged some immigrants out of the labour market. Late users commonly lived rent free early in their period of settlement and while almost 40 per cent were home owners or home buyers after three and a half years in Australia, this was less than the rate for early users. The unemployment rate rose for this group from Wave One to Wave Three, possibly a reflection of the change in their eligibility for Jobsearch and other unemployment benefits. The late user group received almost one third of the services they consumed from sources other than governments and the non-government sector. This was comprised, in the main, of assistance from friends, relatives and community workers.
High Users were the largest of the sub-groups examined and there were over 17,000 immigrants who made use of support services on four or more occasions. In aggregate this group consumed more than 150,000 services – and average of just under nine services per group member. High service users were notable with respect to their origins: immigrants from the United Kingdom and Ireland were much under-represented, while those from Europe, the Middle East and North Africa and South Asia were over-represented. This finding is consistent with earlier work on levels of service use by origin. Fully one quarter of the immigrants in this group came to Australia under the Humanitarian program. High service users were concentrated in public rental housing, though the majority rented privately. This applied through to Wave Three with 52 per cent still renting privately after three and a half years in Australia. Persons in this group reported high levels of use of education and language training; social security and childcare support; and, employment assistance.
The research also examined the characteristics of immigrants who made use of housing services. Housing assistance was a relatively minor part of the entire quantum of services used by recent immigrants, comprising less than five per cent of the total. However, housing assistance was a substantial component of the support received by immigrants helped with their accommodation. It amounted to 13 per cent of the total assistance received by this group, and was almost as important – with respect to the number of services used – as support aimed at securing employment. Immigrants who arrived under the humanitarian program constituted 36 per cent of the users of housing services, despite being just 14 per cent of the total pool of immigrants. Preferential family immigrants were the other over-represented group. Users of housing services were concentrated in the private rental market (almost two thirds of the total) and this indicates many Humanitarian immigrants depend upon Rent Assistance and other housing measures while they wait for access to public housing.
The analysis determined that support from community members such as friends, relatives, other persons born in the same country, or persons of the same faith was significant for successful settlement in Australia. Those without community support had to fall back on formal government assistance measures. It is argued that further policy development in the area of service provision for immigrants and their housing should pay closer attention to strategies aimed at mobilising social capital within immigrant communities. Such strategies are likely to result in a lesser cost for governments and more successful settlement.
The research found a consolidated approach to the provision of services to recent immigrants was absent. No single agency across the three tiers of government performs a co-ordinating role. This research argues that the providers of housing services are one logical avenue for the consolidation of service provision as an immigrant’s tenure is a strong indicator of their settlement status and probable future use of government assistance. Government policies should aim at assisting some households into home purchase. We draw this conclusion because home owners and home purchasers are much independent of

vii
government assistance than public or private tenants. Speeding the entry of immigrants who are able to sustain home ownership into the tenure is likely to reduce their use of other services. Governments should provide tenants in the private rental sector with a consolidated package of support that advances their immediate status in the labour market. Other policy interventions should offer immigrants in the public rental sector a more comprehensive and longer term framework of support. In the long run these programs would reduce government expenditures on services and enhance immigrant well being.
The research finds that a social exclusion perspective should be applied to the understanding of the housing and other service needs of immigrants. There is an imperative to develop whole-of-government approaches to the problems confronting settlers. Individual departments and each of the tiers of government are encouraged to find ‘joined up’ solutions to these issues. Rethinking housing and employment relationships will be critical. This may require those charged with the administration of public housing developing both formal labour market strategies for their immigrant tenants and community strengthening initiatives.

1
CHAPTER ONE. INTRODUCTION
This paper reports on research by the Southern Research Centre, Australian Housing and Urban Research Institute, into the housing and other service needs of recently arrived immigrants1. This research sets out to examine how housing interacts with other factors - including employment, visa status, and income support systems – to affect the use of government provided services by recently arrived immigrants.
The research presented in this report builds upon previous work into the housing experiences of recent settlers in Australia. Prior work has examined the role of housing in the settlement process (Beer and Cutler 1998; VandenHeuvel and Wooden 1999) as well as the impact of immigration on the Australian housing system (Janunkar et al 1993; Ferris and Silberberg 1982; Burnley, Murphy and Fagan 1997; Neilson and Associates 1982; National Population Council 1990). Other work has examined the housing of particular birthplace groups (Coughlan 1991; Social Planning Consortium 1985) or examined the impact of immigration on a particular tenure (Hassell and Hugo 1996). However, previous investigations have not examined the complex interactions between the housing of immigrants and their use of other services. This is a significant gap as housing is likely to exert a substantial influence on the relative ease or success of settlement in Australia. In addition, increased fiscal pressure on governments has forced governments to re-evaluate the cost of providing all types of services.
The housing of immigrants is a significant issue. Since 1945 Australia has accepted large numbers of immigrants. Approximately 22 per cent of the Australian population at the 1996 Census were immigrants and a similar percentage were the offspring of immigrants (Hugo 1999). Even in the 1990s there were just under 100,000 settler arrivals in most years (Figure 1), and this was despite a long-term decline (spanning several decades) in the number of immigrants accepted into Australia (Castles, Foster, Iredale and Withers 1998 p.6). Indeed, Australia remains one of the most significant immigrant receiving countries in the developed world and the continued growth, and indeed maintenance, of its population depends upon immigration (BIMPR 1995). Work by the OECD shows that Australia is the ninth largest recipient of foreigners amongst member countries (behind the USA, Germany, the United Kingdom, Japan, Canada, Italy, France and the Netherlands) and eighth most significant recipient when calculated per 1,000 population (Coppel, DuMont and Visco 2001). However, many of the movements documented by the OECD are non-permanent movements (such as guest-workers) and Australia is amongst only a handful of countries with substantial permanent settlement programs. The United Nations (1997) noted
Only a small number of countries admit a significant number of immigrants for permanent settlement - chiefly Australia, Canada, New Zealand and the United States. (United Nations Commission on Population and Development)
The settlement of immigrants in Australia is therefore noteworthy both with respect to national population growth and in comparison with other nations.
1 Through this study a ‘service’ refers to the receipt of assistance or support that contributes to the well being or development of the immigrant or their family. From this perspective, income support is considered a service, as is children attending school, a visit to a doctor or hospital, attending English language classes or help in finding a place to live. The term ‘service use’ refers to an immigrant reporting that they used a service. That is, the interviewer recorded that the immigrant reported the use of one or more services for a defined period. In most instances this covered the time since the previous interview, but for medical services it refers to the four weeks prior to the interview only. Finally, the term ‘housing’ is used to refer to the accommodation circumstances of the respondents. Housing services are those services used by the recent immigrants to enter and stay in a place of residence. Housing service users are those PAs who reported the use of housing services by themselves or one or more members of their household.

2
Figure 1. Settler Arrivals by Year, 1988-89 to 1999-00
Source: http://www.immi.gov.au/statistics/migrant.htm
This research has attempted to provide answers to questions about the relationship between housing and the use of other services by recently arrived immigrants. It asks if better housing results in a more satisfactory settlement experience for immigrants – as reflected in a lesser use of government provided and other services – and whether housing policy interventions can reduce the overall use of support services? In addition, the research asks, what is the most appropriate role for housing assistance – in all its forms – in meeting the settlement-related requirements of new arrivals? What position should housing providers take in attempting to meet the needs of new arrivals and how should housing assistance be integrated with other forms of support for this group?
This research inevitably raises questions about the use of services, the need for services and the use of services. The three are not synonymous, though they are often used as such, and in a strict sense this Final Report only discusses the use of services. However, it would be a nonsense to attempt to discuss the use of services without recognising that such uses arise out of both the needs and demands of recent immigrants. In this instance needs are assumed to be those goods and services perceived as necessary to support and sustain the individual, while demands are needs that are translated into the ‘purchase’ of a service. The latter definition raises an important issue: in many instances the system for the provision of services is a public sector allocation system rather than a market based exchange. All Australian residents and citizens, for example, are entitled to free (or heavily subsidised) medical services under Medicare. This means that both real and perceived needs can be expressed in the demand for a service without price impediments. Other services do come at a cost. There are user costs for most English language training courses and many forms of financial advice would carry a user charge. The use of services, therefore, reflects the needs of recent immigrants but it is a reflection distorted by the structures of provision.
Five issues are central to this investigation: 1. the development of a ‘whole of government’ perspective on the use of publicly-
provided services by recent immigrants and understanding of how housing conditions and opportunities affect the use of services;
2. an analysis of how non-shelter outcomes vary with the different forms of housing assistance and how the provision of housing assistance contributes to the well being of individuals, families and communities;
0
20,000
40,000
60,000
80,000
100,000
120,000
140,000
160,000
1988-89
1989-90
1990-91
1991-92
1992-93
1993-94
1994-95
1995-96
1996-97
1997-98
1998-99
1999-00
Year
Arr
ival
s

3
3. the identification of the critical housing-related factors that interact with non-shelter impacts (including employment, educational attainment, health outcomes and expenditures, family stability or breakup, use of income support, use of legal supports, well being and satisfaction with life) and specification of how the interaction between these determines quality of life and independence from government provided services;
4. specification of key performance indicators for the provision of housing for recent immigrants with respect to social sustainability or vulnerability;
5. the development of a statement of the implications of the interaction between housing assistance and other forms of government interventions for the housing and social policy programs of Commonwealth and State Departments.
This research has been undertaken for the Australian Housing and Urban Research Institute Ltd and as such this report is required to meet certain expectations, that is, it is expected to demonstrate that the key tasks in the research project have been completed, and report upon these in detail. It draws together into the one report the main aspects of the overall research project. The Final Report is required to be a full account of the research that has been undertaken: why it was done; how it was done; what was found out; and the implications of the findings for policy development. This report attempts to meet these objectives.

4
CHAPTER TWO. IMMIGRATION POLICY, WELFARE REGIMES AND SOCIAL EXCLUSION
Across the developed world each nation provides a different set of social security and income support for its citizens. The assistance provided by governments varies considerably and over the last decade these welfare regimes have attracted considerable attention from researchers. This chapter considers the Australian welfare regime and its role in meeting the service and housing needs of immigrants to Australia. The chapter begins with a brief discussion of the concept of welfare regimes, before moving on to consider the detail of Australia’s support for new settler arrivals. The chapter then considers the concept of social exclusion and its relationship to immigrants. Finally the chapter considers the implications for research into the impact of housing assistance on the use of other support services by recent immigrants.
2.1 Welfare Regimes Interest in welfare regimes was fuelled in the early 1990s by Esping-Andersen’s (1990) The Three Worlds of Capitalism. Esping-Andersen (1990) considers how social welfare support is provided across the developed world and concludes that it is possible to identify three major streams of welfare regime:
• First, the ‘liberal’ welfare state, ‘in which means tested assistance, modest universal transfers, or modest social insurance plans predominate. Benefits cater mainly to a clientele of low-income, predominantly working class, state dependents’ (Esping-Andersen, 1990, p. 26)’
• Second, nations such as Austria, Germany, Italy and France have a ‘corporatist’ model. This model accepts a higher level of government intervention than in the ‘liberal’ welfare state, but also acts to preserve income differentials between individuals. The Church is seen to play a strong ideological influence under this model, and there is a strong emphasis on family values and support;
• Third, the social-democratic welfare regime is embraced by a small number of countries, such as the Scandinavian nations, and accepts state intervention is justified to create a truly equal society.
Other researchers have identified a fourth type of welfare regime. This is the rudimentary welfare system, typically found in the Catholic/European rim nations, such as Greece, Portugal and Spain (see Geddes, 1999 for a useful review). This is a partially developed welfare system and one, which reflects an on-going agricultural tradition. This welfare regime is both weakly and unevenly developed with support for women, for example, often under-developed.
Australia falls within the ‘liberal’ welfare regime. Our income support measures tend to be tightly defined and in both Australia and the US government taxes represent approximately 27 per cent of GDP, compared with an average of 36 per cent across the European Union and up to 42 per cent in Sweden and Norway (OECD 2000). As Hamnett (1996) and other authors have noted, a nation’s welfare regime is shaped by a number of elements. Government-provided benefits are important, but so too are policies and practices with respect to minimum wage rates, the provision of social housing, and the general philosophy of government. The Australian welfare regime has been much influenced by the strength of centralised unions, which have ensured relatively high minimum rates of pay and wages regulated through a system of legally-enforced awards, though the introduction of Enterprise Bargaining has curtailed this influence. Tightly targeted income support measures are the second major feature of the Australian approach to welfare. Unemployment, age, sickness,

5
disability and other benefits are paid to persons meeting eligibility criteria. There is, however, no guaranteed minimum income and financial support is modest. Third, when compared with many European nations, Australian governments and especially the Federal Government has a very limited role in other areas of welfare assistance - such as housing.
2.1.1 The Australian Welfare Regime and Immigration
Australian governments do not have a history of generous financial support to their residents. Immigrants to Australia therefore arrive into a society where there is not a high level of support for individuals generally, and where new arrivals are expected – as much as possible – to meet their own needs via success in the labour market. There is neither a generous general welfare state that the new immigrant can gain access to, nor is there a well developed system of supports targeted to immigrants. Indeed, over the last decades supports have been withdrawn, as governments have rethought their immigration philosophies and placed a greater emphasis on self reliance by new arrivals (see, Birrell and Evans 1996; Castles et al 1998). Instances include the withdrawal of the Federal Government’s on-arrival accommodation, and the imposition of waiting times for access to some support services for some categories of immigrant.
2.2 Social Exclusion and Social Inclusion The discussion above of Australia’s welfare regime has highlighted that Australian governments do not provide comprehensive assistance to their citizens. The Australian system of welfare support is far less generous than either the ‘corporatist’ or ‘liberal democratic’ models. Immigrants are therefore potentially vulnerable: those unsuccessful in the labour market are confronted by low incomes and limited formal government assistance. Some will experience social exclusion because they are unemployed, have limited language skills, community support networks are absent, and services are either inappropriate or not available. This section reviews the concepts of social exclusion and social inclusion. The review reflects upon the importance of service provision for an individual’s full participation in society, and the relationship between labour market outcomes and access to services.
2.2.1 Social Exclusion
Over the last several years there has been considerable debate in academic and policy circles about social exclusion and strategies to combat it (see, for example, Mandanipour et al 1998) both within general society and within the arena of housing provision (Marsh and Mullins, 1998). However, relatively little attention has been given to social exclusion within Australian housing research and policy development. Potentially, social exclusion is a doubly useful concept within this research project. First, it is concerned with the complex and multi-layered causes of disadvantage and the impact – and interaction – they have with government-provided services. Social exclusion therefore directly addresses the sorts of interactions that must be understood in order to shed light on the relationship between the use of government provided housing assistance and other services. Second, in a number of European nations the concept of social exclusion has been applied and developed to explain the condition of immigrant groups and minorities – such as ‘travellers’ (Marsh and Mullins 1998).
Social exclusion is a concept that has been adopted in a variety of contexts (academic, policy development) and by a number of different types of organisations (national governments, supra-national organisations, non-government bodies) so it is not surprising that there has been a multiplication of definitions. The Social Exclusion Unit within the UK Cabinet Office suggested that
Social exclusion is a shorthand for what happens when individuals or areas suffer from a combination of linked problems such as unemployment, poor skills, low incomes, poor housing, high crime environments, bad health and family breakdown (Social Exclusion Website 1998).

6
While Mandanipour (1998 p.77) commented
The question of social exclusion and integration, it can be argued, largely revolves around access…to decision making, access to resources, and access to common narratives, which enable social integration.
The definition of social exclusion has been discussed more extensively elsewhere (see Beer and Maude 2001) but it is important to note that the term is generally used to refer to multiple and linked social, economic and cultural problems within an area or group. It is concerned with ‘joined up’ problems, to use the language of the social exclusion literature. It should be noted, however, that the concept of social exclusion has not received universal acceptance in academic and policy circles, even within Europe where its origins lie. Blanc (1998) observed that social exclusion was a problematic and sensitive issue in France, with many social scientists openly critical of the term. However, its adoption by the European Union, and its social policy programs, has ensured its widespread adoption.
Somerville (1998) reviewed policy documents and academic work on social exclusion and concluded that those suffering from social exclusion experience greater disadvantage than poverty alone
What all these groups have in common, and what lies at the heart of all processes of social exclusion, is a sense of social isolation and segregation from the formal structures and institutions of the economy, society and state (p. 762).
Somerville (1998) noted that social exclusion has three drivers within advanced economies: first, social exclusion can arise out of disadvantage within the labour market; second, it may be a consequence of political/legal structures that disadvantage some individuals or groups and disenfranchise them from publicly provided benefits, and, finally, exclusion may arise out of predominant ideologies. Institutionalised racism is one such ideology, as is the gendered division of our society, which forces many women out of the formal workforce and devalues their work within the domestic economy. Importantly, the socially excluded do not generally suffer the consequences of just one of these processes, but instead experience the impact of all three.
Legal entitlements and access to government provided assistance are important dimensions of social exclusion. They are one of the reasons this concept is so significant in attempting to illuminate the circumstances of immigrants. All members of society are vulnerable to the exigencies of the labour market but particular groups – such as immigrants – are often doubly disadvantaged because of their marginal position within the socio-legal system. The socially excluded are often denied government services because they are not legally-entitled (as foreign workers they may not have a legal right to help), are excluded by language, have been labelled as ‘problem’ cases within the social security system and therefore made invisible within the apparatus of government, or have been labelled as being different from the mainstream and are therefore treated separately to others. Ratcliffe (1998) paid particular attention to this latter set of processes, noting that some of the housing problems confronting South Asian immigrants in Bradford, England, reflected the fact that they had been directed into a ‘Black’ housing association, effectively denying them access to other housing support programs.
Accepting the importance of legal entitlements in the generation and incidence of social exclusion both highlights the impact of government policies and programs and raises questions about the status of immigrants. As the British sociologist Titmus showed almost 50 years ago in his work on the social division of welfare (Titmus 1958), government social welfare programs inevitably generate inequalities. Access cannot be equal, and some must be excluded if programs are to achieve their policy objectives. Debate over social exclusion has re-emphasised these processes, by showing how they interact with other processes within society. Indeed, Harrison (1998) commented

7
The social division of welfare…indicates that the welfare state includes complex channels through which people are empowered (or disempowered) to varying degrees…our perspective on the welfare state certainly helps locate exclusion, as part of the patterning of relative welfare and empowerment (pp. 800-801).
Immigration is particularly important in this respect as migrants often face both restricted access to government services (such as income support or publicly provided medical assistance) (Birrell and Evans 1998) and difficulty in gaining employment through local labour markets. Immigrants are one of the groups that stand out as being most vulnerable when a social exclusion perspective is adopted. Further, they are shown to have multiple disadvantage, and require government support in a number of dimensions of social and economic life.
2.2.2. Social Inclusion
The adoption of a social exclusion perspective implies – but does not necessarily guarantee – that the converse set of processes or relationships exist, that is, social inclusion. Unfortunately social inclusion, whatever that may be, has received much less attention within the social sciences. Blanc (1998) accepted that social inclusion is the opposite condition of social exclusion and presented it as an unproblematic concept. By contrast, Ratcliffe (1998) argued that social inclusion is not some simple condition reflecting integration within society. In his view
A common error is to see exclusion as by nature dichotomous, i.e. present or absent…. In the context of housing, exclusion in a narrow literal sense implies homelessness, or even rooflessness…this is not the key issue. Much more important is the question of access to good quality, affordable housing in areas in which it is safe to live. It is essentially a question of differential access to ‘ basic’ social citizenship rights (Ratcliffe 1988 p. 808).
Ratcliffe’s (1998) emphasis on the relative and relational nature of social exclusion is technically valid but somewhat unconvincing. Surely if we are willing to accept that one dimension of a spectrum of outcomes can be labelled ‘excluded’, it must be equally legitimate to identify the other end of the spectrum as ‘included’!
Having accepted that social inclusion is a potentially valuable concept, what are the conditions and processes that give rise to social inclusion rather than social exclusion? Ratcliffe (1998) suggests that success in one or more spheres of life could have a positive impact in reducing, or removing entirely, social exclusion. Ratcliffe (1998 p.816) observed that
‘non-exclusion’ in one institutional arena may lead to, or significantly increase the likelihood of, non-exclusion elsewhere. As is well known empirically, access to sufficient capital may well outweigh the negativity attached to minority ethnic status, put at its crudest, ‘money whitens’.
This perspective is particularly relevant in this context as it raises the possibility that successful housing outcomes could constitute an ‘institutional arena’ for social inclusion and effective housing policies could thereby reduce the degree and incidence of social exclusion.
2.3 Conclusion The material discussed in this chapter allows us to draw a number of conclusions. First, the Australian ‘liberal’ welfare regime is so structured that it is assumed that most new arrivals meet their needs through the labour market. In Australia, successful settlement is independence in settlement. Those who cannot meet their needs, and the needs of their household, through privately earned income or other resources, present a significant policy dilemma for Australian concepts of government. They are also likely to face difficult times personally because income and other supports are not comprehensive. Social exclusion is a

8
possibility for these households. These conclusions lead to a focus on the level of independence/dependence on government and other services. Persons who use fewer services are likely to be better integrated into Australian society and result in fewer public policy challenges.
The examination of social exclusion, in combination with the discussion of welfare regimes, has direct implications for the conduct of this research. While the quantity of services used is important, the nature and types of services used are also significant. Some types of services are unlikely to contribute to the immigrant’s ability to adjust to Australian society and find employment, while other types of services – such as English language training and employment assistance – will have a direct impact. We should be particularly concerned with patterns of service use that contribute either to a more economically active population of immigrants, or which appear to discourage participation in the formal labour market. The social exclusion literature also raises the possibility that successful housing outcomes could result in success in settlement in other spheres of social and economic life, and this too will be examined through this analysis.
The discussion above leads us to conclude that social sustainability, vulnerability and social exclusion are key concepts within this research project. Immigrants who are unable to maintain themselves and their households without the frequent use of government provided services are not socially sustainable and are at risk within the main stream of Australian society. The key issues are, therefore, what are the characteristics of vulnerable households? What are the characteristics of households that report high levels of independence? And, what are the defining features – housing and non-housing related - of immigrant households that make use of government provided services early in their period of settlement but not in later waves? If we can understand why some households do not use services, why some households make extensive use of government provided services and how some immigrants are able to move from dependence to independence, it should be possible to identify critical interventions and tailor future policies accordingly.
9
CHAPTER 3. SERVICE PROVISION AND HOUSING FOR IMMIGRANTS TO AUSTRALIA
Government policies and processes have a direct impact on the ability of immigrants to make use of support services. Some of these impacts are obvious. Prohibitions on some categories of immigrant using particular services are easily observed, but policies on the categories of immigrant accepted into Australia, the eligibility criteria for housing assistance measures, and charging policies will all affect service use. Housing outcomes are also affected by Federal and State Government policies which can influence the affordability of housing and the ability to gain access to housing support. This chapter considers some of the policy dimensions of immigrant settlement in Australia. It begins with an examination of the visa categories used when the Longitudinal Survey of Australia was undertaken, it then moves onto consider government policies on access to service use, before considering the housing circumstances of recent immigrants to Australia.
3.1 Entry into Australia The category of visa under which immigrants arrive in Australia is important in determining where and how easily new arrivals settle in Australia (Hugo 1995). There are significant differences amongst immigrants according to their category of visa entry with respect to wealth, English language skills, links with relatives and community members in Australia, qualifications and ability to find work. Some of the results presented in this report breakdown service use and tenure by visa category and it is therefore useful to briefly re-examine the major visa categories. The categories presented here are a summary and it is crucial to recognise that the categories – and their administration – have changed over time. In 1993, when the settlers interviewed as part of the LSIA arrived, the categories were: Preferential Family Migration; Concessional Family Migration; Business, Skill and Employer Nomination; Independent Migration; and Humanitarian Migration. Tonkin, Williams and Ackland (1993 pp. 45-46) provide the following summary:
• Preferential Family Migration covers persons who are a close relative to a sponsoring Australian resident. This includes a spouse; child; child under 18 years coming for adoption; parent; aged dependent relative; last remaining brother, sister or non-dependent child; orphaned unmarried relative under 18 years; special need relative;
• Concessional Family Migration includes more distant relatives to a sponsor including a non-dependent child; non-dependent brother or sister; non-dependent niece or nephew; a parent of working age not meeting the balance of family test.
• Business, Skill and Employer Nomination includes persons nominated for a specific skilled position by an Australian employer; while independent business skills is the visa category covering persons intending to establish a business in Australia;
• Independent migrants are ‘unsponsored applicants whose education, skills and ready employability will contribute to the Australian economy’ (Tonkin et al, 1993 p. 46); and,
• Humanitarian arrivals include refugees who apply outside Australia and are seeking protection from persecution in their country of origin. There has also been a special In-Country Special Humanitarian Program and Global Special Humanitarian Program for people outside their country seeking protection.
These four major visa categories are discussed throughout this report.

10
3.2 Immigrants and Access to Government Provided Services As discussed in Chapter One, Australia continues to have a significant program of immigrant settlement. Settler arrivals to Australia have enjoyed relatively unrestricted access to income support and other government programs. Indeed, Birrell and Evans (1998 p.2) noted that ‘Australia’s pre-Coalition Government welfare arrangements were relatively generous’ for newly arrived immigrants and that government support and welfare rights were withheld only when a person came to Australia as the sponsored parent of an existing resident. Under those circumstances the sponsor was required to post an Assurance of Support (AOS) and a bond to ensure that the parent did not use welfare services during their first two years of residence in Australia. However, as Birrell and Evans (1998) pointed out, this regulation had no teeth as there was ‘no legal basis for any action to recover the money from the sponsor’ (p.3). The assessment by Birrell and Evans (1998) is, perhaps, overly generous to past Australian governments. Castles (et al 1998 pp. 104-05) pointed out that in 1993 the Keating Labor Government introduced changes that meant
The principle of equal rights to welfare services for all Australian residents was broken when the government decided to deny unemployment and sickness benefits to immigrants for the first six months after their arrival. Also, fees were introduced for English language courses for adult migrants, although some categories such as refugees were exempted.
We should recognise that these changes only affected some categories of immigrants, namely those arriving under the Preferential stream. Restrictions on the use of welfare services were extended under the Howard Coalition Governments to include higher costs of English language courses and an increase in the waiting period from six months to two years for eligibility for income support programs such as Newstart, Sickness, Parenting, Youth Training, Special Benefit, Widow, Commonwealth Seniors and other allowances (Castles et al 1998 p. 105). It is important to bear in mind that these later restrictions do not have a direct bearing on the results reported in this study as they post-date the arrival of the settlers covered in the Longitudinal Survey of Immigrants to Australia (LSIA). Immigrants interviewed under the LSIA were affected by the changes introduced in January 1993.
The use of services by immigrants has been the subject of some considerable research in Australia, some of which has made use of the first waves of the LSIA. This research has been usefully summarised by Castles et al (1998). They identified a number of key findings from the work of others (for example, Whiteford 1991; Khoo, 1994; Murphy and Williams 1996) highlighting the significance of age structure, visa category, period since arrival, region of birth and English proficiency in determining the level of use of welfare services. They argued that:
• Age-structure. Once age differentials had been standardised immigrants were less likely than the Australian-born to use welfare services and older immigrants were more likely than younger immigrants to depend upon social security payments. Birrell and Jupp (2000) confirmed this finding through their analysis of the 1996 Census data and the records of the Department of Family and Community Services;
• Visa category. Type of visa exerts a critical influence on the use of welfare services. Persons arriving as refugees or under other humanitarian programs were far more likely to use government provided welfare services than immigrants arriving under other visa categories;
• Time since arrival. Reliance upon government services declines over time, though levels of service use may be high for up to five years. From their analysis of the Wave One LSIA data Murphy and Williams (1996) noted that 40 per cent of recently arrived immigrants had made use of income support such as Jobsearch, Newstart, Sole Parent Pension and Special Benefit payments. Some 70 per cent of Humanitarian arrivals and 30 per cent of Preferential Family immigrants had received some form of social security

11
by Wave One of the LSIA. Business Skills and Employer Nomination migrants made virtually no call on pensions or other income support. From their analysis of the 1996 Census data and Department of Family and Community Services data on social security payments, Birrell and Jupp (2000 p. vii) concluded that ‘welfare rates tended to be high for all recently arrived migrants regardless of English proficiency…Nevertheless, one of the important findings of this study is that, with settlement time in Australia, welfare levels fall significantly for all EP (English Proficiency) categories’;
• Region of birth. Some birthplaces stand out as being more commonly associated with high levels of welfare support. Whiteford (1991) found that the Viet Nam-born, the Turkey-born and the Lebanon-born had higher levels of use of social security and other supports while the United Kingdom-born, the New Zealand-born and the Ireland-born placed higher demands on income support amongst older immigrants. Birrell and Jupp (2000) noted that migrants from Southern Europe and the Middle East had a high level of dependence on Disability Pensions, an outcome they attributed to the concentration of persons from these backgrounds in blue-collar manufacturing;
• Use of health services. Immigrants tend to be healthier than the Australian-born, possibly because most immigrants need to pass a medical test prior to being accepted for immigration (VandenHeuvel and Wooden 2000; Hugo 1994; Powles and Birrell 1997). Migrants who arrived under humanitarian and preferential family visas tend to have poorer health and make greater use of health services and this is thought to reflect the fact that medical fitness requirements may be waived in these instances (VandenHeuvel and Wooden 2000);
• English proficiency. Being proficient in English is critical to economic success in Australia and those immigrants and immigrant groups for whom English is their first language had much lower rates for receiving Jobsearch Allowance (Murphy and Williams, 1996). English proficiency was the most critical factor in determining reliance on welfare payments in Birrell and Judd’s (2000) study on patterns of welfare receipts.
3.3 Housing and Immigrants in Australia Before concluding this chapter it is important to review what is already known about the housing of recent immigrants to Australia. The broad conditions within the housing market, and immigrant experiences within that market, exert a profound influence on the capacity of housing to serve as an intermediary institution in the integration of recent arrivals into Australian society. It also affects their likely call upon government support. Conceptually, this is important. Much of the discussion of social inclusion/social exclusion originating from Europe sees the housing market as one of the dimensions of life acting to marginalise immigrants. Australia has had a very different experience and history of housing immigrants. Many immigrant groups (such as the Southern Europeans) have high home ownership rates, partly because they were denied access to public housing in the 1950s and 1960s (Birrell and Jupp 2000). Perhaps paradoxically, forced insertion into home ownership acted as a powerful force for social inclusion for these groups. Key points to bear in mind include:
• Tenure. Upon first arrival almost 90 per cent of immigrants stay with Australian residents (VandenHeuvel and Wooden 1999). Boarding and the private rental market then becomes significant for the accommodation of many immigrants (Beer and Cutler 1998) while some move almost immediately into home ownership and home purchase. By Wave Three of the LSIA – some three and a half years post arrival – almost 40 per cent of immigrant households were either home purchasers or home owners; 43 per cent were renting privately; seven per cent were living rent free; and seven per cent were boarders. Public rental housing was not a significant tenure for immigrants, and by Wave Three of the LSIA it accommodated only five per cent of the total (VandenHeuvel and Wooden 1999). Almost all recent immigrants in public housing arrived in Australia via the Humanitarian program.

12
• Location. Most immigrants choose either Sydney or Melbourne as their place of initial settlement with almost 44 per cent of arrivals settling in NSW (Murphy 1996). Healey (1996 p.20) suggests that within Sydney and Melbourne ‘disadvantaged migrants are becoming more, rather than less, residentially concentrated’. His analysis of Department of Social Security Benefit Data at the level of individual Census Collector’s Districts (CDs) found, in Healey’s (1996) language, ‘enclaves’ where particular unemployed persons from particular birthplace groups were concentrated. This suggests that the location of housing, and the operation of local housing markets, is one of the ways housing may affect the use of services.
• Affordability. Housing is generally not affordable for recent immigrants. Beer and Cutler (1998) found 40 per cent of households spent more than 30 per cent of weekly income on accommodation at Wave One of the LSIA and 60.2 per cent spent in excess of 20 per cent. By Wave Two, the percentage paying more than 30 per cent of the household’s income on housing had fallen to 14 per cent, but 46.5 per cent still paid more than 20 per cent. Housing costs are differentiated by tenure: those purchasing a dwelling are less likely to devote a considerable percentage of their household budget to accommodation costs, largely because of their higher incomes. The highest level of “housing stress” confronted those in private rental accommodation. Housing for immigrants is no more affordable in the smaller States than in the larger housing markets, such as Sydney and Melbourne (Beer and Cutler 1998).
• Access to Home Ownership. Beer and Cutler (1998) found the “Great Australian Dream” of home purchase and ownership remains attractive and available to many immigrants. Some groups have high rates of owner occupation, with 38 per cent of UK-born immigrants, 34 per cent of North and West Europe-born immigrants, 31 per cent of the North and Central America-born, 28 per cent of the North East Asia-born and 24 per cent of the Eastern Europe-born achieving home purchase or ownership within 18 months of settlement in Australia. Entry to owner occupation varies significantly by visa category with 49 per cent of Business Skills and Employer Nomination immigrants in this tenure by Wave Two of the LSIA, compared with 24 per cent of Concessional Family arrivals, 25 per cent of Preferential Family arrivals, 20 per cent of Independent arrivals and four per cent of Humanitarian settlers.
• Discrimination. On the basis of their analysis of the first two waves of the LSIA data, Beer and Cutler (1998) concluded that discrimination was not a major problem in either the rental or home purchase markets.
3.4 Conclusion This chapter has considered the ways immigrants, housing and services interact. Immigrants to Australia tend to use fewer services than the Australian-born, and enjoy better health than those born in this country, but patterns of use are heavily mediated by visa category of migration to Australia, age and proficiency in the English language. These factors interact with the recognition of qualifications and marketable skills within the labour market to determine the housing experiences of recent immigrants.
It is also useful to link the material discussed in this chapter, with the concepts presented in the previous chapter. Making this connection allows us to envisage new approaches to dealing with established problems. It forces us to reconsider policies for low income immigrants in public housing by encouraging us to search for ‘joined up’ solutions. This was reflected in Blanc’s (1998) writings on public housing and social exclusion where he suggested that

13
The pauperisation of social housing tenants has another consequence. If they want tenants paying their rents without excluding the poorest, housing managers must become concerned with job training schemes, local economic developments, etc. They must become partners of local actors involved in a global strategy. However, some managers may be reluctant to become too involved in initiatives which are seen as distant from the traditional housing management role (p. 789).
His comments reinforce the point that we should not necessarily be looking for ‘housing’ solutions to the needs of immigrants. Instead we should examine the housing circumstances of disadvantaged immigrants as part of a broader exercise addressing social exclusion. Seen in this light, the policy instruments to be used are those normally applied to any other excluded group: the development of an informal labour market, the strengthening of community support networks and labour market training solutions (Haughton 1999; Maclennan 1998).
14
CHAPTER FOUR METHODOLOGY - THE LONGITUDINAL SURVEY OF IMMIGRANTS TO AUSTRALIA
This chapter considers the methods used to investigate the research questions outlined in the previous chapter. It discusses the Longitudinal Survey of Australia (LSIA), its purpose, structure, content and method of application. The chapter then goes on to consider how the analysis will be undertaken, as well as the specific questions to be examined.
4.1 The Longitudinal Survey of Immigrants to Australia The primary methodology for this research has been the analysis of the Longitudinal Survey of Immigrants to Australia (LSIA). The LSIA is a rich, but complex, data set. It is able to shed considerable light on the settlement processes of immigrants to Australia, but it has certain limitations due to the way in which the data was collected, the weighting process, the time of the analysis, who was interviewed within migrating households and changes in the questions asked. A sound understanding of the LSIA is therefore fundamental to the interpretation of the data it has produced.
The LSIA is a broad based, comprehensive questionnaire designed to provide data on a diverse range of issues to a number of Commonwealth and other agencies in order to assess, evaluate and monitor the wide variety of services and facilities designed for migrants. The survey questionnaire was developed over a number of years as a joint undertaking between Government and private agencies, first in the Bureau of Immigration Research, and its subsequent existences, and then by the Commonwealth Department of Immigration and Multicultural Affairs (DIMA).
The method of administering the questionnaire was through the selection of Principal Applicants (PAs) who immigrated to Australia between 1 September 1993 and 31 August 1995. Participants were interviewed within six months of their arrival and then again around a year later. It is worth noting that interviews for each wave extended over more than a year and that Wave 1 interview schedules were being applied to some households while other households were completing Wave 2. The median number of months between Wave 1 and Wave 2 interviews was 12.3 and the mode 12.1. The third wave of the questionnaire was applied between March 1997 and April 1998, that is three and a half years after arrival. Some 72 per cent of the original sample completed this wave of the LSIA and 3,618 participated in all three waves. The range of questions asked is very wide but those relevant to the current research relate to country of birth, visa category, family size, assets, income employment, levels of satisfaction with Australia, services used and housing.
There was great care taken in the initial selection of PAs (Gall 1994 p. 59) to ensure the final sample was fully representative of the total immigrant intake. The sample needed to cover all visa categories, countries of birth and states of intended residence to ensure that a full representation was identified. The tables and other data presented in this report are based on the weighted sample. When weighted, there are some 51,934 completed cases across all three waves of the LSIA. There are differences between the results produced by the weighted and unweighted data such that the weighted data only are presented. A full description of the weighting process can be found in the LSIA Documentation (DIMA 2000).
The LSIA is a unique data set and one singularly able to address the housing and service uses of immigrants after six months, 18 months and three and a half years of settlement in Australia. It is specifically targetted to the settlement experiences of recent immigrants and their housing. In addition, longitudinal data sets are able to navigate the changing housing circumstances of recent immigrants and shed light on how and why their service uses change over time. It should be noted, however, that the LSIA relates to a group of immigrants who arrived in the mid 1990s. While the LSIA has been carefully crafted to reflect the experiences and outcomes of arrivals from this period, caution must be applied in extending the results to more recent – or earlier – settlement.

15
The results reported in this publication reflect the responses of the interviewees to the LSIA survey instrument. This is significant as respondent perception, and recollection, of the use of services may be imperfect. In large measure this report discusses the use of services: interviewees either reported they used a service a number of times, or reported nil use. Questions on the use of services within the LSIA were set within the context of particular time frames. In Wave One the questionnaire introduced the questions on service use with the words
Now, I’d like to ask a few questions about help you … may have received since arriving in Australia….
For Wave Two, the questionnaire commenced the services section with the words
… Thinking only about the time since your last interview, which, if any, have you … needed help with…
And for Wave Three, the questionnaire specified
… Thinking only about the last 12 months, which if any…
It is clear from the above that the data on service use is – generally – meant to reflect the respondent’s use of services for that specific time period. That is, for Wave One, the period since arrival; for Wave Two, the period since the first interview; and, for Wave Three the time since the last interview.
Inevitably some types of government provided assistance were overlooked: a number of respondents, for example, reported that they had not made use of housing assistance despite the fact they occupied public housing at that time. In fact 80 per cent of public tenants (2,400 weighted cases) reported they had not used housing services. Even households in receipt of Rent Assistance from the Federal Government were likely to under-report their housing-related benefits. Rent Assistance payments are not identified separately and are paid as part of a wider package of income support. It is likely that many households would be genuinely unaware that Rent Assistance is part of the support they receive from the government and would not mention it during interviews. The use of Medicare services –which are paid for by the Federal Government – was also likely to be under-enumerated. The LSIA asked respondents ‘During the last four weeks, have you needed to visit a health centre, doctor or other medical practitioner about your health?’ (VandenHeuvel and Wooden 1999 p. 98). The fact that the use of health services is recorded for a four week period only must give rise to some potential bias, especially given the episodic nature of some illnesses. These caveats need to be applied when reviewing the results. They do not, however, bring into question the overall accuracy of the data, nor its value in understanding patterns of service use amongst recent immigrants. Few members of the general public would recognise public housing as a service and that particular failing within the data simply serves to underline the gap between the specialist housing literature and the general public.
We need to have an appreciation of the nature of the questions on service use asked by the LSIA. In Wave One interviewers lead into questions of service use by asking:
Looking at Card 29 (PAUSE), which of the Government agencies listed have you (or members of your family who immigrated with you) had contact with?
The respondents would then indicate which government agencies had provided support services. In many instances PAs had had contact with multiple agencies. The interview would then proceed to determine the types of services used:
Looking at Card 35 (PAUSE), which of these did (SAY NAME) provide assistance with?

16
Multiple responses would be recorded as individual agencies provided more than one support service and as respondents called upon more than one government agency. The same procedure was then followed for non-government service providers.
4.2 The Analysis In order to undertake this research a single record was created for each Principal Applicant (PA) who completed each of the three waves of the LSIA. This record makes it possible to track the changing housing and other circumstances over the first three and a half years of settlement. For example, it is possible to trace patterns in employment, occupation, housing status and service use over the three waves, and relate this data to factors such as country of origin, visa category for entry to Australia, age or marital status.
The number of services used by a PA can be broken down by type of service use. In each of the three waves the LSIA asked respondents to report the use of various categories of service. In most instances PAs were asked if they had used a service – such as English language training – since their arrival in Australia (for the first wave) or since the previous interview. In the case of medical services PAs were asked if they had been to visit a doctor or used other medical assistance in the four weeks prior to the interview.
The systematic collection of data on service use makes it possible to determine how many services have been used by immigrants under different circumstances. The analysis considers:
• The total number of services used;
• The type of services used by broad category – such as Social Security and child care services, employment services, health services etc;
• The relationship between tenure and service use;
• The number and types of services used by immigrants already in receipt of housing assistance; and,
• The housing and other characteristics of high and low service users.
Multivariate analysis – specifically discriminant analysis – was also used to investigate which factors determine patters of service use. The role of housing, and housing support services, was examined through this means. Discriminant analysis allows the building of predictive models of group membership based on the observed characteristics of each case. It can be used to develop an explanatory model where the membership of groups is known a priori (referred to as training samples) or to predict membership, known as test samples (Everitt and Graham 1997). The procedure generates a discriminant function based on linear combinations of the predictor variables that provide the best discrimination between groups. The grouping variable can have more than two values, but it must be a categorical variable. In this instance, the training samples approach was used to identify those variables, and combination of variables, likely to determine patterns of service use.
17
CHAPTER FIVE. HOUSING, SERVICES AND RECENT IMMIGRANTS TO AUSTRALIA
The relationship between housing and the use of government provided services by immigrants cannot be understood without reference to the settlement process. In general the success or difficulty of settlement in Australia reflects the impact of a number of structuring factors including: the state of the Australian economy and society at time of arrival; country of birth; English language proficiency; education; and the recognition of pre-existing qualifications within the labour market. The presence of other members of that birthplace community at the place of settlement can be important also (for a fuller discussion see Hugo 1989). Unfortunately it is not possible to predict the success of settlement on the basis of these factors, but they do need to be recognised as important in determining immigration outcomes.
There is a particular need to comprehend the role of housing within the settlement process. Housing is important both empirically and conceptually, as the housing circumstances of recent immigrants are dynamic. Over the three and a half years of settlement covered by the LSIA immigrant households could occupy two, three – or even more – tenures! Moreover, within the analysis presented here the group of home purchasers at Wave Three would include both persons who were home purchasers in previous waves, as well as those who were private tenants or boarders in Wave One or Wave Two. The role of housing in mediating the use of government provided services is also likely to change through the settlement process.
This chapter begins with a brief discussion of the various stages immigrants’ progress through upon settlement in Australia, as measured by the LSIA and reflected in their housing. The chapter then goes on to examine patterns of service use by all PAs within the LSIA and the relationship between housing factors – such as tenure – and service use. The next section then explores the housing circumstances and use of services by immigrants who fall within one of four groups defined according to their pattern of service use: non users, early users, late users and high users. Finally the chapter considers those PAs who reported the use of housing-related services.
5.1 Housing and the Use of Services by Immigrants Housing has a significant impact on the consumption of services provided by governments and other agencies. Over the three waves of the LSIA immigrants reported more than 250,000 uses of services provided by government agencies, the non-government sector or ‘other’ providers. Private tenants were the greatest users of services by number – accounting for over one third of the total - but this is to be expected given the dominance of this tenure amongst recent arrivals. Some 50 per cent of immigrants were in the private rental market in the first wave of interviews, 51 per cent at the second wave and 43 per cent at the third wave.
The relative propensity of households living in a tenure to use services, or have multiple uses of services, is critical when discussing the relationship between housing assistance and the use of other services. Tenure is pivotal as it determines the types of housing related assistance available to individual households, and it is an important indicator of income and wealth. As Figure 2 shows, over the three waves of the survey outright home owners made the least use of services, while persons paying board and public tenants were the groups most likely to make some call on service providers. Fifty one per cent of home owners made no use of government provided services over the period of the LSIA, while only 23 per cent of public tenants and 15 per cent of boarders did not use some form of support. Public tenants were more likely than other tenures to use services on multiple occasions: 34 per cent made use of services on four or more occasions, and this compared unfavourably with 27 per cent of private tenants, 10 per cent of home owners and 26 per cent of boarders. The

18
high use of services no doubt reflects the characteristics of the small number of households in this tenure. Previous research (Beer and Cutler 1998) found this group is comprised of persons who arrived on humanitarian and refugee visas, who tend to be persons with low formal skill levels, poor English language abilities and who suffer from high rates of unemployment.
There is a significant time dimension to the use of services by tenure. Persons in public rental housing reported continuing – and relatively high - use of services through the three waves of the LSIA. As might be expected given their greater wealth and superior position in the labour market (Beer and Cutler 1998), home owners and home purchasers had a limited
Figure 2: Number of Times Services Used by Tenure, All Waves
Source: LSIA
period of use of government-provided and other services. By Wave Three some 63 per cent of home owners and 55 per cent of home purchasers reported they had not made use of the services listed in the LSIA questionnaire. Persons paying board were slightly more likely than persons in the formal rental market to use government provided and other services on two or more occasions (76 per cent making multiple use, compared with 68 per cent) over the three waves. Importantly, the difference between boarders and persons in the private rental market was most acute in the first wave, and there was a tendency for the two groups to converge in their use of services through the subsequent waves.
There are substantial policy implications embedded within the pattern of service use by tenure. Public housing tenants clearly make the greatest use of government-provided and other services but they are a special group within the wider stream of settlers arriving in Australia. It appears inevitable that as long as there is a humanitarian and refugee component to Australia’s immigrant intake a proportion of settler arrivals will be accommodated in public housing and there will be substantial implications for the use of government provided services. In a policy sense there are extremely limited options if public housing and service providers continue to rely upon the current suite of policy interventions. There appear to be strong a priori grounds for adopting new policies and approaches. Boarders and private tenants also appear central to future policy development in this arena, especially given that most boarders enter the formal housing market via rental accommodation.
0%
20%
40%
60%
80%
100%
Hom
eO
wnership
Hom
eP
urchase
Public
Rental
Private
Rental
Paying
Board
Rent F
ree
Em
ployerP
rovided
Other
Tenure
Per
Cen
t
5+
5
4
3
2
1
0

19
The nature of the services used by recent immigrants is an important element of understanding the relationship between housing assistance and the use of non-housing services. A summary of the types of service used by LSIA respondents over the three and a half years of settlement is presented in Table 1. A number of points stand out in the data:
1. The data presented in Table 1 reinforce the significant – and expected - taper in the use of services as the period since arrival increases;
2. Housing services and housing assistance is less than five per cent of the total quantum of assistance provided to recent immigrants. However, we should note the level of use of housing assistance might be far greater than the level provided. There is undercount also due to the fact that all public tenants effectively receive housing assistance, even though they may not recognise this as a service;
3. The greatest level of service use is in the areas of education and language training, social services and childcare (including income support); employment assistance and health and aged care services.
Table 1. Number of Services Used by Wave and Type of Service, All PAs
The breakdown of types of services used by tenure reveals interesting patterns:
• Housing Services. Just over 14 per cent of immigrants who were public tenants reported the use of government provided housing assistance. Housing assistance here refers to the receipt of Commonwealth or State Government Rent Assistance; assistance in finding accommodation, payment of a bond by a State Housing Authority or service agency and direct provision of accommodation. Immigrants in employer provided accommodation were the next most likely users of government provided housing services. Some 13 per cent of this group used these services, though the small size of the group means the total use was small (just 130 instances). This compares with seven per cent of households in the private rental sector and five per cent of boarders. Only one and a half per cent of persons living free in another’s home made use of government-provided housing services and this no doubt reflected their limited eligibility for assistance. Outright home owners made virtually no use of housing services (less than half of one per cent) and only two per cent of home purchasers received assistance of this nature.
• Employment Assistance. All tenures made use of employment assistance, though only 11 per cent of outright home owners and 13 per cent of home purchasers used these services. Approximately 30-40 per cent of public tenants, private tenants and boarders used employment assistance services at least once. Just under 22 per cent of persons living rent free used employment services.
Wave 1 Wave 2 Wave 3 Total
Housing Assistance 3,026 2,930 2,072 8,028
Employment Assistance 19,552 13,013 8,158 40,723
Financial Advice/Tax Advice 9,357 8,687 4,612 22,656
Health and Aged Care Services 16,837 9,740 6,667 33,244
Social Services 25,142 14,949 12,100 52,191
Education and Language Assistance 32,560 27,448 13,433 73,441
Other Services 21,321 3,858 4,188 29,367
Total 127,795 80,625 51,230 259,650

20
• Financial Services/Tax Advice. Home purchasers were the biggest users of financial services and tax advice amongst the LSIA respondents, with some 17 per cent using these services on one or more occasions over the three and a half years of settlement. Persons paying board and private tenants were the next most significant users, with 16 per cent of immigrants in this tenure making use of these services, followed by those in employer provided housing (10 per cent), home owners (9.7 per cent), persons living rent free (9.3 per cent) and public tenants (8.7 per cent). It is noteworthy that public tenants had a relatively limited use of these services.
• Health and Aged Care Services. Health and aged care services were one of the most significant groups of government provided services. In percentage terms public tenants were by far the largest users, with 31 per cent using these services at least once during settlement. Persons paying board were the next largest users with 25.6 per cent using health and aged care services at least once, followed by persons in employer provided accommodation, living rent free and private tenants at 26, 24 and 20 per cent respectively. Outright home owners made the least use, with only 13.7 per cent, followed by home purchasers at 14.7 per cent.
• Social Services and Child Care. Social services and childcare assistance were the most frequently used category of government provided service. Public tenants were by far the group most likely to use these services, with almost 50 per cent of this group calling upon social security or childcare support. This was three times the rate for home owners and home purchasers, where only 15 per cent of immigrants used these services. Forty one per cent of private tenants, 40 per cent of boarders and 27 per cent of persons living rent free made some use of social services and child care support during their first three and a half years in Australia.
• Education and Language Assistance. Home owners and home purchasers had a limited use of government provided services in the areas of education and language assistance with approximately 25 per cent of owner occupants using these services. At the other extreme, over three quarters of public tenants (85 per cent) used these services, and seven per cent used three or more services over the period of the LSIA. This suggests substantial need in this area. Some 55.7 per cent of boarders, 55.3 per cent of private tenants and 41 per cent of persons living rent free used education and language services.
• Help Received from Other Sources. Other sources of assistance are a small but still significant category of service provision to immigrants. Private tenants were the largest users of services from this set of sources (21.5 per cent) followed by public tenants (20.7 per cent), boarders (18.4 per cent) and persons living rent free (17 per cent).
The ‘first cut’ analysis above has illuminated the relationships between housing and the use of services. It has shown that: • the call upon government provided services by recently arrived immigrants varies by
tenure; • virtually all boarders make some use of services and there is a continuum of levels of
use with boarders and public tenants at one end and outright home owners at the other; • that households in different tenures are inclined to use a different mix of services; • that housing services are a small part of the total use of services and this suggests that
formal housing interventions – such as the payment of Rent Assistance – would play a very limited role in influencing the total level of service use;
• households who enter public rental accommodation are – in percentage terms – large users of services and they continue to make frequent use of government-provided services well into their period of settlement. However, this high level of use reflects other factors (such as visa category, language skills, household structure and education) rather than any intrinsic feature of the tenure;
• with the exception of public tenants, immigrants use fewer publicly provided services as they move into more permanent housing arrangements.

21
While these results and the relationships they shed light on are important, they do not, in themselves, address all of the central concerns of this research project. That is, the development of a ‘whole of government’ perspective on the use of publicly-provided services by recent immigrants; the analysis of how non-shelter outcomes vary with the different forms of housing assistance; the identification of the critical housing related factors that interact with non-shelter impacts; the specification of key performance indicators for the provision of housing for recent immigrants with respect to social sustainability or vulnerability; and the development of a statement of the implications for the housing and social policy programs of Commonwealth and State Departments.
The analysis of service use patterns for the users of housing services relative to all users sheds some light on the relationship between housing interventions and the use of other services. As Table 2 shows, the users of housing services were more likely to use other services than the general population of LSIA respondents. This applied for virtually all tenures, except for home purchasers and households within the ‘other’ category.
Table 2. Mean Number of Services Used by Tenure at Wave Three, Users of Housing Services and All Principal Applicants
Tenure, Wave 3
Housing Service Users
All Principal Applicants
Mean No. of Uses Mean No. of Uses
Home Owners 8.3 3.1
Home Purchasers 4.9 9.7
Public Rental Tenants 8.0 7.8
Private Rental Tenants 9.5 6.2
Paying Board 6.1 4.3
Living Rent Free 7.6 3.9
Employer Provided Accommodation 4.9 3.3
Other 5.6 6.2
The data presented in Table 2 confirms that tenure is important in determining the number of services used by recently arrived immigrants. As noted previously, the number of services used by a settler arrival is related to their tenure. There are two possible explanations for the consistently higher levels of service use associated with those households that used housing assistance: in the first instance, these households may be vulnerable because of their intrinsic features. Under this hypothesis the use of housing support is part of a broader pattern of high service use. Second, the use of housing services may give new arrivals an opportunity to gain access to other assistance that in turn helps them achieve independence. These issues are considered in the next section.
5.2 Patterns of Service Use Within Settlement Observations within the LSIA data were divided into a number of categories in order better to understand the relationship between patterns of service use, housing and other variables. On the basis of the analysis presented above, four types of service users were identified: non-users, early users, late users and high users. The group, non users, was comprised of PAs who did not report the use of services in any of the three waves of the LSIA. This is the smallest of the groups (Table 2). The early users group included PAs who reported the use of services and/or benefits in the first wave of the LSIA but not the subsequent waves. The

22
late user group comprised households who reported that they used services in Wave Two or Wave Three, but not in the first wave, while the high user group used services in all three waves and reported the use of four or more services in total. Significantly, these groups do not, and are not intended to, cover all observations within the LSIA. They have been selected as patterns of service use that are significant in understanding the processes driving service use.
Each of these categories represents a conceptually important position for our understanding of immigrants, housing and the use of services. The non-user group are independent of government assistance and they are likely to be made up of socially included households. Understanding their characteristics and their housing circumstances vis-à-vis the other groups can shed light on the factors that result in nil use of services. The early users reflect an ideal type of service intervention by governments: the use of government services in the immediate period of settlement resulting in independence and social inclusion in the medium term. The late users represent the other end of the service use spectrum. They appear to have been independent – or at least not reliant on formal assistance – upon first arrival but have subsequently used government and other services. Finally, the high user group represents the most dependent population and the group most likely to suffer from social exclusion. Analysis of their traits sheds light on which housing factors interact with non-shelter impacts to determine levels of service use.
Discriminant analysis was used to determine which factors assigned an immigrant to one of the four categories outlined above. Discriminant analysis creates groups of variables (called canonical discriminant functions) that in combination explain a substantial part of the variation or model. Discriminant analysis typically defines three groups of canonical functions. Stepwise discriminant analysis was used to better understand the composition and characteristics of the four groups (see Baum et al 1999 p.13). Wilk’s lambda was used as the defining test and ten variables were included in the initial model (visa category; country of birth; age; expected annual income at Wave One; tenure at waves one, two or three; tenure Wave One, the receipt of housing assistance at waves one, two or three; highest educational qualifications of the PA). Membership of one of the four ideal types of service use (early users, late users etc) was the grouping variable. These ten variables reflected a mix of housing related functions, and the characteristics of the immigrants. Usually the selection of variables to be included in the model would be based on Hotelling’s T2. This test identifies which variables are most dissimilar – that is, have the greatest separation (Everitt and Dunn 1991). However, in this instance it was important to specifically test the influence of key housing variables (tenure, use of housing services). For this reason, discriminant analysis has been combined with Pearson’s Correlation Coefficient.
The discriminant analysis showed three variables (the receipt of housing assistance in Wave 2; age and country of birth) explained 68 per cent of the variation between groups. A further four factors (visa category; highest formal qualification received; tenure at Wave 3; housing help received at Wave 1) explained a further 23 per cent of the variance. A number of points stand out from the data. First, the receipt of housing assistance at Wave 2 was the best predictor of group membership. It was the last variable to be removed from the step-wise analysis. Second, visa category, formal qualifications and country of birth exerted a strong influence on group membership. These are non-housing related factors and reflect qualities largely brought to Australia by the settler arrival. Third, the receipt of housing assistance at Wave 2, tenure at Wave 3 and housing help received at Wave 1 all contributed to a PA’s place within the four groups. The correlation analysis showed that there were very strong correlations between the receipt of housing assistance in any wave and the other two waves (significant at the alpha = .01 level for a two tailed test). Importantly, the receipt of housing assistance at Wave 2 (which was part of the first canonical function) was strongly correlated to the other two important variables: age and country of birth. Similarly, the housing factors to appear in the second canonical discriminant function (housing helped received at Wave 1 and tenure at Wave 3) were strongly correlated with visa category and qualification level.

23
The analysis presented above suggests that the housing factors identified in the discriminant analysis were dependent, rather than independent factors. Whether an immigrant household had used housing support services in Wave 2 was an important predictor of the broader pattern of service use, but this variable reflected other factors and other processes that determined vulnerability and the potential for independence in settlement. The analysis suggests that the level of service use, and the propensity to use services, is largely determined by parameters that are completely independent of housing: the age and country of birth of the immigrant as well as their educational qualifications.
Table 3. Visa Category by Pattern of Service Use
Non-Users Early Users Late Users High Users All Immigrants
Preferential Family 73.5 56.8 77.0 49.1 57.3
Concessional Family 5.8 9.8 4.9 9.4 8.6
Business Skills and Employer Nomination
3.9 5 3.2 2.5 3.4
Independent 16.1 23.2 13.3 13.8 16.5
Humanitarian 0.5 5.2 1.7 25.2 14.3
Total (per cent) 100.0 100.0 100.0 100.0 100.0
Total (Number) 3,774 7,754 7,734 17,638 51,934
5.2.1 Non Users
PAs who reported no use of services during the three waves of services are the smallest of the four groups discussed here. Non-users of services typically arrived in Australia under a Preferential Family visa (73.5 per cent) and virtually no members of this group settled in Australia as part of the Humanitarian stream of immigrants. The representation of Independent immigrants within the non users category closely matched their percentage within the total of immigrants enumerated in the LSIA (Table 2).
At Wave One the median age of PAs within the non-user category was 29.1 years. When compared with all immigrants within the LSIA, and the other categories covered in this section, non users were over-represented amongst home owners and home purchasers (Table A1). Fully 56 per cent were home owners or home purchasers by Wave Three, with 20 per cent buying or owning their home outright at Wave One. Crucially, almost 25 per cent owned their dwelling outright by Wave Three.
The capacity of this group to enter owner occupation is a reflection of their position within the labour market and their income. Just over 30 per cent of non-users reported a total household income over $50,000 per year at Wave One, and this rose to 51 per cent by Wave Three (Table A2). The concentration of households with higher incomes may in fact be greater, but in all three Waves a significant percentage of households either did not state, or refused to state, their income. Only 12 per cent of non user PAs reported an income of less than $25,000 per year by Wave Three. Unemployment rates were low in all three Waves for PAs in the non user group (Table A3). At Wave One only 5.8 per cent were looking for full or part time work, while no members of this group were seeking employment at Wave Three. Employment patterns were complex: the percentage working as wage or salary earners was relatively high – but not as high as amongst early service users – and a notable percentage of non user PAs conducted their own business. A substantial percentage of PAs within this category were engaged in home duties: 29.1 per cent at Wave One, 18.6 per cent at Wave Two and 27.3 per cent at Wave Three. This suggests that PAs may not have been the primary income earner within the household.
24
Non user immigrants had a pattern of origin that largely reflected the total stream of immigrants. Arrivals from the United Kingdom and Ireland were the largest single group (26.3 per cent) followed by those from South East Asia (23.3 per cent), North East Asia (16.4 per cent) and then Europe (8.4 per cent) (Table A4). Most PAs within the non user category had good English language proficiency: 61 per cent reported they spoke English well or very well at Wave One, and 73 per cent reported they spoke English well or very well by Wave Three (Table A5). It is significant, however, that 34 per cent did not speak English well or at all at Wave One and 28 per cent still did not speak English well or at all by Wave Three. These data are significant as it shows that there is a substantial minority of non service using settler arrivals that do not speak English well, and are not part of the formal labour force. Levels of satisfaction with Australia, however, were high: 93.2 per cent of this group were satisfied or very satisfied with Australia at Wave One and this rose to 95.2 per cent at Wave Three (Table A6).
5.2.2 Early Users
There were 7,754 PAs who reported the use of government provided and other services in Wave One only. Early users of services were over-represented in the Independent, Business Skills and Employer Nomination, and Concessional Family visa categories when compared with all settler arrivals and the other categories of service use considered in this section. The Preferential Family and Humanitarian categories were significantly under-represented (Table 3). Upon first arrival – when this group reported recourse to services - most PAs (46.5 per cent) rented privately, while 20.5 per cent lived rent free with friends, relatives or members of their community and a further 14.2 per cent paid board. By Wave Two the percentage in rent free accommodation and boarding had declined significantly (by 8.4 percentage points and 8.2 percentage points respectively) while the percentage in home purchase climbed sharply from 11 per cent in Wave One, to 24.7 per cent in Wave Two (Table A1). This suggests that for this group the use of services is associated with entry into home ownership and more stable – and independent – accommodation arrangements.
The median age of PAs in the early user group was 30.2 years at Wave One. Total household incomes were high – though not as high as the non-users – with 25.7 per cent reporting a household income in excess of $50,000 at Wave One, and 41.1 per cent reaching this income level by Wave Three. Approximately 20 per cent of these households had an income of less than $25,000 per year at Wave One, and this fell to 16 per cent by Wave Three (Table A3). In all three waves of the LSIA the majority of early user PAs were wage or salary earners: at Wave One 50.3 per cent were wage or salary earners; by Wave Two this had crept up to 64.5 per cent; rising to 67.9 per cent in Wave Three. Significantly, 20 per cent of this group were looking for work at Wave One (either full time or part time) but only 3.6 per cent were seeking work at Wave Three. The data suggest for this group the use of government-provided and other services is likely to have played a role in securing work, finding permanent accommodation and freeing them from future dependence on government services. A low percentage of PAs who made use of services in Wave One were employed in home duties when compared with the non service using PAs.
PAs within the early user group reported strong proficiency in English, though this was not universally the case. Some 66 per cent of early users spoke English well or very well at Wave One and this rose to 72 per cent by Wave Three. Examining the converse, 34 per cent did not speak English well or at all at Wave One, and this fell to 28 per cent by Wave Three. The latter data suggest that early users were not all of English speaking origin and a substantial proportion had made the transition to independence from government services, despite limited ability in the English language. Immigrants within this group were very satisfied with life in Australia, with 91.2 per cent satisfied or very satisfied with life in Australia at Wave One, and 93.9 very satisfied or satisfied by Wave Three.

25
Early user PAs reported the use of 22,367 service uses over the three waves of the LSIA (Table A7). Government provided services constituted almost 90 per cent of the services used and health and aged care services were, as would be expected, the single largest category of assistance received with 22 per cent of the total. Housing assistance constituted less than two per cent of the services used by this group while services dealing with employment issues made up 16 per cent of the total, financial and tax matters constituted 13 per cent and education and language services comprised almost 15 per cent of total service use.
5.2.3 Late Users
There were 7,334 PAs within the late user group and they were overwhelmingly drawn from immigrants with Preferential Family visas. They constituted 77 per cent of this group (Table 2). This is significant as this group was affected by the changes in eligibility for social security and other assistance introduced by the Keating Labor Government, with effect from the 1st of January 1993. As discussed above, relatives arriving under the sponsorship of an Australian resident could not gain access to unemployment or sickness benefits for six months and had to pay for English language training. This six month period is precisely the timeframe covered by Wave One of the LSIA. This group, therefore, can be seen as a test of the impact of the Keating Government’s policies. All other categories of visa were under-represented amongst late users of government and other services. There are strong similarities between the early user and late user groups of PAs within the LSIA with respect to tenure. They had similar percentages in home ownership and private rental through the three waves of the LSIA, and neither group had a significant representation in the public rental sector. A significantly higher percentage of late users lived rent free at Wave One, and in subsequent Waves, and this may have contributed to the use of services later. Late users of services were less likely to be in owner occupation than those who used services early, with 39.5 per cent of the former group and 46.7 per cent of the former group, buying their house or owning it outright at Wave Three.
PAs in the late user category reported lower household incomes than early users of services, with 16 per cent reporting an income of between $8,000 and $16,000 per annum at Wave Three and 25.9 per cent earning between $16,000 and $25,000 per year (Table A2). Only 24.7 per cent earned more than $25,000 per year at Wave Three. Lower incomes reflected the more marginal position within the formal labour market of this group with relatively high percentages engaged in home duties (24.8 per cent, 23.5 per cent and 19 per cent at respective waves), retired (7.6 per cent, 6.9 per cent and 9.5 per cent) or looking for full or part time work (11.4 per cent, 10 per cent and 9.8 per cent) (Table A3). It is significant that the unemployment rate for the early users of services was much higher in Wave One, but dropped quickly. By contrast, late service users had a more modest unemployment rate at Wave One, but the unemployment rate slumped slightly by Wave Two and then rose above its original level at Wave Three. There was a rise in all four categories of labour force status outside the formal labour market (retired, home duties, aged pensioner and other pensioners) across the three waves of the LSIA. This suggests that some members of this group immigrated in the expectation of finding work, experienced difficulties in finding employment and then retired, or became occupied with home duties. At Wave One 13.1 per cent of PAs within this group reported they were students, and while this figure declined to 4.5 per cent by Wave Three. This labour force category was consistently higher then for either the non user or early user groups (Table A3).
The median age of PAs within the late user group was 30.9 years at Wave One. The United Kingdom and Ireland remained the single most significant source for this group with 23.5 per cent of the total (Table A4). Immigration from South East Asia was almost as important, with 22.7 per cent of all members of this category while arrivals from North East Asia constituted 16.3 per cent of the total. PAs in the late user group were less proficient in the use of the English language than either non users or early users: a majority (50.5 per cent) reported that they did not speak English well or at all at Wave One (Table A5). While their English

26
language ability had improved by Wave Three, 35.3 per cent still reported that they did not speak English well or at all. Despite difficulties with language, most immigrants in this group were very happy with their life in Australia with 90.2 per cent either satisfied or very satisfied at Wave One, and 93.9 per cent satisfied or very satisfied at Wave Three (Table A6).
The late user group reported the use of 18,693 services in total, with 9,195 services used in Wave Two and 9,498 services used in the period leading up to Wave Three. Government provided services comprised just over 60 per cent of the total, with most of the remainder received from ‘other’ providers, such as friends, family and community members (Table A7). The use of government provided services declined between Waves Two and Three, but total service use rose slightly because of an appreciable increase in the use of NGO provided services. Once again, housing assistance did not stand out as important, accounting for only three per cent of the total. Education services were the single largest category of service used, accounting for 26 per cent of the total. Social service support and childcare made up 20 per cent of the total, followed by financial/tax advice with 15 per cent and health and aged care with 14 per cent.
5.2.4 High Users
Some 17,638 PAs fell within the high users group, which means that this group is approximately the same size as the other three groups considered here combined (Table 3). Humanitarian stream immigrants were much over-represented amongst the high users of services, with just over one quarter coming to Australia under this category of visa. Concessional family immigrants were also slightly over-represented.
When compared against the other groups, high users were appreciably under-represented in home purchase, home ownership and the living rent free category and over-represented in the private rental sector and public rental housing. At Wave One only 7.8 per cent of PAs with a high use of services were in home ownership or home purchase and while this rate climbed to 28.9 per cent by Wave Three, it was still much lower than for the other groups (Table A1). By Wave One 5.2 per cent of households were already in public rental housing and this reached 8.3 per cent by Wave Three. This was higher than the rate for the general population of Australia. Over half (55.1 per cent) of this group rented at Wave One, and this tenure still accommodated the majority of PAs (52 per cent) by Wave Two. The percentage of immigrants in this group living rent free was lower than expected at Wave One (16.8 per cent) and the lowest of the four groups discussed here, and this indicates a lower level of community support and kinship networks for this group. This in turn suggests that government and other formal support services have been substituted for the assistance otherwise received from community members and relatives.
The high user group reported modest incomes with some increase through the three waves of the LSIA. At Wave One 32.8 per cent of PAs in this group reported an income of between $8,000 and $25,000 per year, and this declined only slightly to 24.2 per cent by Wave Three. Only 12.6 per cent of households earned more than $50,000 at Wave One, rising to 27.4 per cent by Wave Three (Table A2). The moderate incomes of this group were reflected in data on their labour force status: some 30.5 per cent of this group were looking for full or part time work at Wave One. Just over half that percentage (16.7 per cent) was still looking for work at Wave Three (Table A3). Some 22.6 per cent of this group were students at Wave One, 22.3 per cent at Wave Two and 8.4 per cent at Wave Three. Home duties were important at all three waves also (in turn, 17.2 per cent, 17.9 per cent and 19.4 per cent). Wage and salary earners comprised 22.1 per cent of the total at Wave One and 40.2 per cent by Wave Three. Only a small fraction of this group were engaged in their own business, even by Wave Three. Overall, the labour force data present a picture of a group only marginally attached to the formal labour market, especially in the first waves of the LSIA when less than a quarter of PAs could be considered to participate in the world of formal work (i.e., wage or salary earner, conducting own business or other employed). This percentage rose to just under 50 per cent by Wave Three, but the data still reflects a group largely outside the world of paid work.

27
The median age was 31.1 at Wave 1 for this group, making them the oldest of the four groups, but not substantially older than any other group. Immigrants from South East Asia were the largest single origin group with 23.3 per cent of the total, followed by those of European origin (20.4 per cent) the Middle East and North Africa (15.9 per cent) and Southern Asia (11.3 per cent). It is notable that the UK and Ireland was only the fifth largest source, despite its status as the largest single category when all immigrants are considered. As might be expected given their origins and their call upon government provided and other services, PAs in this group had a more limited capacity with the English language. At Wave One almost 65 per cent reported that they did not speak English well or at all. The proportion experiencing difficulty declined to 44.3 per cent by Wave Three, but still reflected a population struggling with the English language (Table A5).
PAs in the high user group were still overwhelmingly satisfied with their life in Australia. Fully 91.6 per cent reported they were satisfied or very satisfied with their life in Australia at Wave One, with 90.7 per cent returning the same response at Wave Three (Table A6).
The high user group of PAs reported the use of almost 150,000 services (Table A7) with government provided services accounting for two thirds of the total. A further 18,000 services were provided by the non-government sector and almost 22,000 services were provided by other sources, such as friends and community contacts. There was an identifiable taper in the use of sources, with 63,000 service uses reported in Wave One, approximately 49,000 in Wave Two and 37,000 at Wave Three. Education and language training accounted for almost 31 per cent of the total use of services, followed by social security and childcare support with 20.6 per cent, employment with 15 per cent and health and aged care services with 12.4 per cent.
5.3 Users of Housing Services2 Some 6,702 PAs reported the use of housing services across the three waves of the LSIA. As Table B1 shows, just 48 PAs could be considered high users of housing services – that is, they made use of housing services on four or more occasions across the three waves of the LSIA – and the following discussion will therefore focus on all users of housing services. PAs settling in Australia through the Humanitarian program were significantly over-represented amongst the users of housing services: they comprised 36.6 per cent of all users of housing services and 95 per cent of the high users. Preferential family immigrants were the other substantial group of housing service users.
Private rental housing was the dominant tenure amongst PAs who made use of housing assistance (Table B2). Home ownership was not an important tenure for this group, but public rental housing was significant and by Wave Three 13.1 per cent of households who had made use of housing assistance had entered State Housing Authority accommodation. Unlike the total pool of immigrants covered by the LSIA, boarding and living rent free accommodated minor percentages of those using housing assistance. Only 400 households in these two tenures received Rent Assistance and assistance from relatives in finding a house was the most important form of accommodation assistance with 833 households in receipt of this assistance at Wave One. Some 336 households boarding or living rent free reported they received housing assistance from ‘other government’ sources, and 352 received housing support from ‘other sources’. The low take up of Rent Assistance reflects the fact that persons living rent free would not be eligible for some forms of accommodation assistance. Most PAs who used housing services had relatively modest housing costs (Table B3) although housing costs rose over time. Some 10.1 per cent of PAs in this group paid more than $200 per week in rent or mortgage repayment at Wave One, 12.2 per cent paid more than $200 per week for their housing at Wave Two and 20.2 per cent paid more than $200 per week at Wave Three.
2 See footnote one for a definition of housing services.

28
As a group PAs who used housing assistance had no or a marginal attachment to the formal labour force (Table B4). At Wave One fully one quarter were unemployed, a further 22 per cent were students and 18 per cent were engaged in home duties. By Wave Three – roughly five years post settlement – 15.8 per cent were unemployed and looking for full or part time work, 15.4 per cent were engaged in home duties, 9.7 per cent were either retired or on some other pension and 8.4 per cent were students. Less than half the PAs in this group were wage or salary earners or engaged in their own business at Wave Three. Just over 13 per cent of PAs in this group had a household income of less than $16,000 per year at Wave One and 9.7 per cent still earned less $16,000 per year at Wave Three. Only a modest proportion – approximately one eighth and one quarter, had a household income in excess of $50,000 per year at Waves One and Three (Table B5).
Difficulty with the English language characterised this group of settler arrivals. Fully 58 per cent either did not speak English well, or did not speak it at all at Wave One, and 40.7 per cent still did not speak English well or at all at Wave Three (Table B6). Despite this trial, and their marginal position within the labour market, levels of satisfaction with Australia were high: 89.6 per cent were satisfied or very satisfied with life in Australia at Wave One, and 90.9 per cent were satisfied or very satisfied with life in Australia at Wave Three (Table B6).
PAs who used housing services over the three waves of the LSIA reported the use of 66,747 services in total, with 47,463 of these services provided by governments (Table B8). Just under half of these services were consumed by Wave One. Housing assistance was not the most significant form of service use amongst this group but it was far more important than for the total pool of LSIA respondents. Housing support measures accounted for 12.8 per cent of assistance received and was surpassed in significance by employment (13.4 per cent) by social security/childcare (18.8 per cent) and education and language (26.0 per cent) (Table B9). It is worth noting also that this group made relatively little use of financial and tax advice services, a circumstance that reflects their marginal position within the labour force.
Information was only collected on the receipt of Rent Assistance in Waves Two and Three of the LSIA and data on the amount received is presented in Table B10. Some 882 reported that they had received Rent Assistance since the last interview, and of that number 769 were receiving Rent Assistance at the time of interview. We should note, however, that the incidence of Rent Assistance is likely to be under-enumerated in any survey. It is clear from Table B10 that Rent Assistance payments were not in aggregate significant for the group who received housing assistance as the overwhelming majority did not receive it at either Wave Two or Wave Three. Those who reported the receipt of Rent Assistance payments received modest help, with 309 households receiving between $50 an $99 per week at Wave Two and 149 PAs receiving this amount at Wave Three. In all likelihood the decline between Waves Two and Three in the number of households receiving Rent Assistance reflects the movement of many of the recipients from the private rental sector to public housing.
Data on sources of assistance in finding accommodation are presented in Table B11 and the data highlights the complexity of settlement/accommodation interactions. ‘Other government agencies’ were the single most important source of help in finding a home (24.3 per cent), followed by friends in Australia (13.9 per cent) and relatives in Australia (11.8 per cent). However many other bodies – government and non-government – assisted significant numbers of settler arrivals. These include ethnic clubs, the churches, the Vietnamese Welfare Association, Migrant Resource Centres, DEET/Centrelink, and the Department of Immigration and Ethnic Affairs. More than anything else this emphasises the many and varied routes immigrants take in settling in Australia. The data also highlight the importance of community and kinship linkages. Family, friends, ethnic clubs, churches et cetera all constitute the community a migrant arrives into and in total 46.6 per cent of PAs who reported they received help in finding a house, got that assistance from their community. This highlights the difficult position confronting immigrants who arrive without community links. Without these avenues of assistance they are forced to rely upon government services and support.

29
5.4 Conclusion This chapter has considered the evidence from the LSIA on the relationship between housing and other service use amongst recent immigrants to Australia. A considerable body of data has been presented in this chapter and this reflects the complex pathways of immigrant settlement and adjustment – or integration to use Blanc’s (1998) term – to Australia. Settlement processes are made more complex by the fact that the immigration stream is divided into a number of component parts defined by the type of visa issued to settlers. There are significant differences between immigrants arriving under the various visa categories and these have far reaching implications for the use of housing and other services by recent arrivals.
That housing does not appear to be one of the driving or causative processes in determining the success of immigrant settlement in Australia is one of the fundamental insights to come out of the analysis presented in this chapter. Housing outcomes and interactions with other factors are a product of other processes at work within settlement, particularly visa category and the skills, education, wealth and English language ability of the immigrant. Housing is important for the success of immigrant settlement and the establishment of an independent life in Australia, but it is not determinant. Policy solutions need to address these causative forces, as well as their expression in the housing market. This has many implications, some of which are spelt out below. The analysis presented in this chapter indicates that
• Those immigrants who use government and other services on multiple occasions are poor and are marginally engaged with the formal labour market. They are also likely to have a poor command of the English language.
• There is a high probability that humanitarian settler arrivals will require either public housing or some other type of housing assistance. This assistance shoulds to be given in conjunction with a program that integrates the new arrival into mainstream social and economic life. This would include employment training, English language training, financial counseling et cetera.
• The analysis of the experience of early service users clearly shows that up-front provision of services can help some immigrants become integrated with mainstream society. This is especially true for those who are seeking to become wage and salary earners, rather than self employed business people or those who live outside the workforce in retirement or on some other form of benefit.
• The majority of immigrants to Australia will make multiple calls on government and other services. Imposing a six month moratorium on access to services for some categories of immigrant had little impact on the total level of service use, with the later user group using exactly the same number of services as early users. It did, however, result in a shift in the type of services used and may have contributed to a lower level of integration with Australian society.
• Kinship and community networks are very important for many immigrants. Those unable to make use of these networks because of geographic or social isolation substitute government provided services for supports otherwise gained from their community. Future policy development should therefore examine ways to mobilise community networks to better assist recent arrivals, perhaps picking up on recent writings on ways of making use of social capital (see, for example, Cox and Caldwell 2000).
• Outright home ownership and – to a lesser degree – home purchase, tend to be associated with lower levels of service use. The evidence is that home ownership does operate as an institution for social inclusion, promoting greater independence amongst recent immigrants. There is some suggestion in the data that this group makes greater use than usual of financial and tax services. This could simply reflect their greater wealth and income when compared with other PAs, but it also suggests that use of these services serves as a precursor to home purchase. Promoting financial planning services to new arrivals could speed integration with the rest of Australian society.

30
• Households in the private rental sector are most likely to seek assistance with housing and have a high propensity to use services overall. They make greater use of government provided and other services than immigrants in other tenures. This is because of their position in the labour market and their separation from community based supports, rather than a product of some inherent feature of private rental housing. That said, it shoulds to be recognised that some types of housing assistance – such as Rent Assistance – are only targetted to those in private rental housing. Individuals in other tenures – such as boarders and lodgers – may be socially excluded from assistance of this nature because they do not comply with bureaucratically-defined and administered criteria.
Housing is therefore an important dimension of the integration of settlers into Australia but it reflects other processes – such as labour market position, wealth and access to community support networks – rather than playing a determining role. Housing and other policies directed at assisting immigrants should be developed with this mind, and this may involve adopting a broader perspective on housing assistance.

31
CHAPTER SIX. CONCLUSION AND POLICY IMPLICATIONS
Immigration and migrant settlement in Australia is virtually unique: Australia remains one of a handful of developed nations with a program of permanent settlement and that program is in turn shaped by the visa categories for settlement, as well as the country of origin of the immigrants. The settlement process in turn is influenced by the ability of new arrivals to make use of government and other support services and develop links with birthplace and other communities. All these factors combine to ensure that while there are similarities between settlement in Australia and New Zealand or Canada, there are substantial differences also. This means that much of the international literature on the housing experiences of recent immigrants is of limited applicability to Australia. It appears self evident that housing is important in determining the use of support services but the precise nature of this process has been unclear. This research began by asking whether housing exerts an independent or mediating influence on successful settlement by immigrants to Australia. The data analysis presented in the previous chapter clearly shows that this is not the case. Housing outcomes, and the relationships between housing and the use of services, reflect the immigrant’s capacity to enter the labour market and their subsequent position within that market. However, housing remains an important dimension of immigrant settlement. There are also important implications for policy to arise out of this research.
This chapter concludes the report and seeks to answer the policy questions set out in the first chapter. It begins by reviewing the influence of housing on service use.
6.1 The Relationship Between Housing and The Use of Other Services
The relationship between housing and the use of other services lies at the core of this research project and it is therefore appropriate to ask, what can we conclude of this relationship on the basis of this research? This has both conceptual value and policy importance as a better understanding of processes can assist in recognising elements of merit in current policies, as well as their pitfalls.
In first instance we can conclude that housing performs a categorical function in determining service use. This is the simplest relationship and merely reflects the fact that some tenures – notably private rental – bestow access to government support, while others do not. No doubt there were many poor immigrants in boarding and lodging accommodation who did not receive assistance with their housing because they were ruled ineligible by their tenure or by the nature of their living arrangements where they board.
Second, we can conclude that tenure may serve as a signifier of the immigrant’s position and status in the labour market, as well as their degree of integration into Australian society. Put at its crudest, settler arrivals who have entered home purchase or outright home ownership are likely to be the most independent of government supports, have a good command of English and are able to support themselves financially. Those in public rental housing occupy the converse position. They are more likely to rely on government income support, make greater use of health services, have difficulties with the English language and have a weak attachment to the formal labour force. This conclusion raises the question whether housing tenure – or one of its components such as owner occupation – constitutes an institution for integration. The answer to this question is yes, if an institution for integration is taken to mean a catch-all or summary variable that reflects the coming together of a number of processes. The answer must be no, however, if it is used to imply some sort of separate and discrete process.
Third, and finally, housing is the centre of family or household life and the focus for receiving community support. The data presented in the previous chapter showed how important community, friendship and kinship networks are in the successful settlement of

32
many new arrivals. Housing therefore becomes a way of gaining access to these services. We should not be surprised that some authors found that immigrants are becoming more concentrated within metropolitan areas, as proximity would be central to gaining ready access to this support. It should be borne in mind also that this greater spatial concentration has taken place precisely when larger numbers of immigrants with multiple and complex needs have arrived in Australia, and when State and Federal governments have attempted to scale back publicly provided services.
Each of these three insights has policy implications. The first suggests governments should be mindful of who they are excluding when setting categories for public welfare or access to assistance. The second suggests that assistance measures should be targetted both with respect to the nature of the assistance and duration of support. Planning to assist public tenants, and those seeking access to public housing, should assume that support should address a number of dimensions of disadvantage and be offered over a longer time frame. The third insight leads us to conclude that attempts to help new arrivals should be community focussed and should accept on-going concentrations of some immigrant groups.
6.2 Lessons for Policy Development and Program Delivery This research began with five policy concerns:
1. the development of a ‘whole of government’ perspective on the use of publicly-provided services by recent immigrants and understanding of how housing conditions and opportunities affect the use of services;
2. an analysis of how non-shelter outcomes vary with the different forms of housing assistance and how the provision of housing assistance contributes to the well being of individuals, families and communities;
3. the identification of the critical housing-related factors that interact with non-shelter impacts (including employment, educational attainment, health outcomes and expenditures, family stability or breakup, use of income support, use of legal supports, well being and satisfaction with life) and specification of how the interaction between these determines quality of life and independence from government provided services;
4. specification of key performance indicators for the provision of housing for recent immigrants with respect to social sustainability or vulnerability;
5. the development of a statement of the implications of the interaction between housing assistance and other forms of government interventions for the housing and social policy programs of Commonwealth and State Departments.
Each of these will be addressed in turn, and wherever possible the results of this research will shed light on these policy challenges.
6.2.1 The Development of a ‘Whole of Government’ Perspective.
This research has demonstrated that an understanding of the relationship between housing and the use of services by immigrants can only be achieved when a broad perspective is applied. The body of research and writing on social exclusion highlights the need for ‘joined up’ solutions to the problems of marginal groups such as recently arrived immigrants. The research suggests that current policies are too limited. Housing assistance is not integrated with other forms of support and there is not a coherent strategy for meeting the requirements of the many immigrants marginalised by limited English proficiency or the absence of skills sought within the workplace. It is worth noting that as a group the users of housing services had nearly as great a recourse to accommodation assistance as to employment support. Specific policy implications include:
• The development of strategies for the early assistance of immigrants that are co-ordinated across all three tiers of government and incorporate the non-government sector and welfare groups;

33
• Cross government recognition that delaying access to government support does not reduce the total burden of service use by recent immigrants and may in fact encourage some to leave the formal labour market, retire or seek other primary activities;
• The inclusion of labour market training, community development schemes based around informal labour markets, and community capacity building programs within the activities of public housing authorities. These programs would be targetted at recent immigrants – especially those who arrived as part of the Humanitarian immigration stream – who may have limited life and employment skills within Australia. Such an initiative would imply looking beyond the traditional boundaries of a state government housing or human service department and building linkages with industry departments, local governments and Centrelink.
• Reviewing categories for access to housing and other assistance to include tenures – such as boarding and lodging – that are important for the immigrants but relatively insignificant for the wider community.
• Developing collaborative relationships between housing service providers, other service providers, Departments of Multicultural or Ethnic Affairs and communities of the overseas born to make best use of kinship and community support mechanisms.
6.2.2 The Analysis of how Non-Shelter Outcomes Vary with the Different forms of Housing Assistance
There are two significant types of government provided housing assistance evident within the LSIA. In the first instance, some individuals and their households receive Rent Assistance or other cash payments that assist them in meeting the costs of the private rental market. The analysis presented in the previous chapter showed that a small minority of PAs and their households received this support. The rents paid within the formal rental market were relatively modest, but as previous research (Beer and Cutler 1998) has shown, many immigrants occupy accommodation that costs more than 30 per cent of household income. Clearly in these instances access to Rent Assistance and other forms of cash housing support makes an important contribution to the well being of individuals, families and communities.
Access to public rental housing is the second major avenue for receiving government provided housing assistance. By Wave Three fully 13 per cent of households making use of housing assistance were in this tenure, and this no doubt reflects the complex and multiple disadvantage confronting households with limited abilities in the English language, no household members in the paid labour force, health problems and limited community support networks. On almost every measure of well being – such as unemployment rates, perception of Australia or household income – public tenants are the least well off, despite the fact that through their tenure they are receiving a far greater level of housing assistance than those in the private rental market. Secure accommodation and low cost housing in the public sector is insufficient compensation for their other disadvantages within society.
Overall we can conclude that housing assistance contributes to the well being of individuals and households and that formal government programs are tightly targetted to those most in need.
6.2.3 The Identification of Critical Housing Factors
The identification and discussion of critical housing factors requires clarification. First, the concepts of tenure and the use of housing services are somewhat tangled. By definition public tenants received housing support because of subsidies inherent within the sector. However, there are other forms of housing assistance, such as the provision of Rent Assistance, the provision of housing advice, assistance with a bond et cetera, and many public tenants receive these benefits also.

34
Second, while factors such as level of satisfaction with Australia, household income and labour force status vary according to tenure and use of housing support services, this research suggests that the variation has been caused by other factors, rather than housing circumstances. Employment status or position in the labour market illustrates this point well. PAs who did not use housing services quickly moved into owner occupation and had low unemployment rates at all three waves of the LSIA, but this was a product of factors aside from those within the housing market. Immigrants who called upon housing support services did so because of their generally disadvantaged position within Australia: they required assistance with their housing, but many of them also needed help in finding a job, with English-language training and or with income support.
Second, many of the indicators of success in settlement are almost unaffected by variation by tenure or use of housing services. Satisfaction with life in Australia, for example, was uniformly high – varying across tenures and service use categories by five or so percentage points at mos t– and this reflected the enthusiasm of immigrants for their new country, rather than any other circumstance.
While bearing these caveats in mind, some conclusions can be drawn about critical housing factors. Persons in owner occupation were much less likely to use other services provided by governments or other bodies. That is, they were much more independent and integrated into the centre of Australian society. This implies that policies that attempt to make it possible for immigrants to move into home purchase will, in the medium to long term, result in a more settled cohort of immigrants and a lesser use of income support and other services. The help required from governments to achieve this end may fall outside the traditional purview of government housing departments – with the possible exception of the development of appropriate financial instruments – but policy interventions aimed toward this goal will have both a general and a housing impact.
Households in the private rental sector appear to be very vulnerable. They do not have the security of tenure and other protections available to public tenants and, allowing for other factors such as visa category, make greater use of the full range of services available from governments, non-government organisations and other sources. This may – in part – reflect the fact that tenants in the formal market are unambiguously eligible for most forms of assistance while other tenures are not. However, the scale of the difference is such as to suggest they are genuinely excluded. Rents tend to be higher in the private rental sector than in the other tenures. Boarders and lodgers – and persons living rent free – are generally accommodated within their communities where they can receive assistance from family, friends and others from their country of origin.
We can also conclude that immigrants seeking housing assistance from government are likely to require other supports as well. This suggests a ‘package’ of assistance measures could be developed and offered in conjunction with housing-related help.
6.2.4 Specification of Key Performance Indicators.
Designing key performance indicators that reflect the social sustainability of recent immigrants raises a number of questions about philosophies of assistance. We have assumed that sustainability can be equated with independence from government support and that the type of assistance provided by the public sector was not affected by divisions between the three tiers of government. The latter is an important point as Australia’s federal system results in the division of responsibilities (and costs) between the different tiers of government and agencies operating in one sphere of social or economic life may have no responsibility in another.

35
The following indicators would measure the dependence/independence of various categories of immigrants and the effectiveness of programs seeking to assist them:
• Number and percentage of settler arrivals in home ownership and home purchase after one, three and five years of settlement. High rates of owner occupation would constitute a positive measure of independence;
• The percentage of arrivals receiving Rent Assistance or other cash housing assistance after one, three and five years of settlement. High levels of rent assistance to immigrants would reflect a dependent population, or a negative indicator of independence;
• Number and percentage of recent arrivals making use of employment and financial/tax assistance within six months and one year of arrival. High rates of this form of support would be a positive indicator of independence. High rates of this form of support would be a positive indicator of independence;
• Number and percentage of recent arrivals of Non-English Speaking Background using language education and training. High rates of this form of support would be a positive indicator of independence;
• Number of birthplace based community groups operating within the social housing sector and the number and quality of schemes in place attempting to build community linkages. High levels of birthplace group involvement in the advancement of the welfare of public housing tenants would be a positive indicator for the generation of a more independent immigrant cohort;
• The percentage of humanitarian arrivals in public rental housing. This indicator could be supplemented by data collected on –
a) the number and percentage still awaiting assignment of a public rental dwelling
b) the percentage engaged in, or having completed, English language training
c) the number and percentage actively seeking full or part time work
d) the number and percentage engaged in vocational or professional training
e) the number and percentage of humanitarian arrivals to have left public rental housing after five years.
In all instances except indicator a) and indicator e) a high score or figure would suggest a population moving toward a greater level of independence and adjustment to life in Australia.
6.2.5 Implications of the Interaction between Housing Assistance and other Government Interventions
The analysis throughout this report has demonstrated that some immigrants are socially excluded within Australian society and that in total immigrants use a substantial number of government provided and other services during their settlement period. The most vulnerable amongst them end up in public housing so that by three and a half years post settlement, persons who arrived in Australia on a humanitarian visa had greater representation in public housing than the general population.
There is a clear need to re-orient government programs at both the Commonwealth and State levels. ‘Joined up’ solutions must be found to the problems confronting recent immigrants. Public housing is one of the areas where these solutions will need to be developed as it accommodates many of the most marginalised arrivals. Key factors include:

36
• Building links with immigrant communities;
• Integrating English language assistance, employment assistance and financial counseling with meeting the accommodation needs of these people;
• Developing alternative, community-based solutions, to the housing needs of recent arrivals. There are already a number of housing co-operatives and housing associations based around immigrant communities. Further extension of their activities would offer new arrivals secure accommodation and community support.
Commonwealth Government policies also need to be recast. Rent Assistance payments help some of the most vulnerable immigrants outside the public rental sector, but are not sufficient to reduce their dependency on other services. Recipients of these forms of housing assistance tend to be more dependent on other services than all immigrants. Housing assistance payments should be integrated with advice and support aimed at bringing immigrants into the core of Australian society.
6.3 Conclusion This research began by asking whether housing assistance played an important mediating role in determining the success and independence of immigrants to Australia. The research has shown that this is not the case and that the factors the immigrants bring with them to Australia – such as English language ability, qualifications et cetera – how dependent they are on government and other forms of assistance. The housing circumstances of immigrants largely reflects their position within the labour market and their command over other resources – including social and financial capital. However, we do not conclude that housing is unimportant in the settlement process: housing is a signifier of the immigrant’s settlement status and assistance needs. Assistance with housing is also one way immigrant groups help new arrivals, and in so doing, reinforce community ties. Housing programs could be used to deliver a broad range of measures designed to integrate new arrivals into Australia as quickly as possible. They could be the focus for helping those most at risk within Australian society. For some households assistance in gaining access to home ownership or home purchase could help them become secure and independent more quickly.

37
BIBLIOGRAPHY
Baum, S. O’Connor, K, Mullins, P. and Davis, R. 1999 Community Opportunity and Vulnerability in Australia’s Cities and Towns: Characteristics, Patterns and Implications, University of Queensland Press, St Lucia.
Beer, A. and Cutler, C. 1998 Housing Needs and Preferences of Immigrants, Report prepared for the Department of Immigration and Multicultural Affairs, Canberra, Unpublished.
Beer, A. and Maude, A. 2001 Community Development and the Delivery of Housing Assistance in Non-Metropolitan Australia: A Literature Review and Pilot Study, Positioning Paper, AHURI, Unpublished.
Birrell, B. and Evans, S. 1996 Recently Arrived Immigrants and Social Welfare, People and Place, 4:2, pp 1-9.
Birrell, B. and Jupp, J. 2000 Welfare Recipient Patterns Among Migrants, Department of Immigration and Multicultural Studies, Canberra.
Blanc, M. 1998 Social Integration and Exclusion in France: Some Introductory Remarks from a Social Transaction Perspective? Housing Studies, 13:6, pp. 781-92.
Bureau of Immigration, Multicultural and Population Research 1995 Australia’s Population Trends and Prospects, BIMPR, Melbourne.
Burnley, I., Murphy, P. and Fagan, R. 1997 Immigration and Australian Cities, The Federation Press, New South Wales.
Castles, F. Foster, W. Iredale, R. and Withers, G. 1998 Immigration and Australia, Allen and Unwin, St Leonards.
Coppel, J. Dumont, J. and Visco, I. 2001 Trends in Immigration and Economic Consequences, OECD Economics Department Working Paper No. 284, OECD, Paris.
Coughlan, J. E. 1991 The Housing Characteristics of Australia’s Three Indo Chinese Communities, 1976-86, Griffith University, Brisbane.
Cox, E. and Caldwell, P. Making Policy Social, pp, 43-73 in Winter, I. (ed) Social Capital and Public Policy in Australia, Australian Institute of Family Studies, Melbourne.
Department of Immigration and Multicultural Affairs 1997 LSIA User Documentation Unpublished.
Everitt, B. and Dunn, G. 1991 Applied Multivariate Data Analysis, Edward Arnold, London.
Ferris, W. and Silberberg, R. 1982 Immigration and the Demand for Housing, Bureau of Immigration and Population Research, Bulletin No 12, p. 59.
Epsing-Andersen, G. 1990 The Three Worlds of Welfare Capitalism, Polity Press, Cambridge.
Hamnett, C. 1996 Social Polarisation, Economic Restructuring and Welfare State Regimes, Urban Studies, 33:8, pp 1407-30.
Harrison, P. 1998 Theorising Exclusion and Difference: Specificity, Structure and Minority Ethnic Housing Issues, Housing Studies, 13:6, pp. 793-806.
Hassell, in association with Hugo, G. 1996 Immigrants and Public Housing, Department of Immigration and Multicultural Affairs, Australian Government Publishing Service, Canberra.

38
Haughton, G. 1999 Community Economic Development: Challenges of Theory, Method and Practice, Chapter 1, in Haughton G (ed.) Community Economic Development, The Stationery Office / Regional Studies Association, London.
Healey, E. 1996 Welfare Benefits and Residential Concentrations Amongst Recently-Arrived Migrant Communities, People and Place, 4:2, pp. 20-31.
Hugo, G. 1989 Atlas of the Australian People, South Australia, Bureau of Immigration and Population Research, Canberra.
Hugo, G. 1995 Understanding Where Immigrants Live, Bureau of Immigration and Population Research, AGPS, Canberra.
Hugo. G. 1999 Atlas of the Australian People, National Overview, Department of Immigration and Multicultural Affairs, Canberra.
Junankar, P, Pope, D., Kapuscinski, C, Ma, G. & Mudd, W. 1993 Recent Immigrants and Housing, Bureau of Immigration and Population Research, AGPS, Canberra.
Khoo, S. 1994 Correlates of Welfare Dependency Among Immigrants in Australia, International Migration Review, 28:1, pp. 68-92.
Maclennan, D. 1998 Urban Regeneration in Britain: New Times, New Challenges, pp. 28-54 in Badcock, B. and Harris, K. (eds) Revitalising Areas: Proceedings of the 1998 National Urban Renewal Seminar, Australian Housing and Urban Research Institute, Melbourne.
Mandanipour, J. 1998 Social Exclusion and Space, in Mandanipour, A. Cars, G. and Allen, J. (eds) Social Exclusion in European Cities, Jessica Kingsley, London.
Mandanipour, A. Cars, G. and Allen, J. 1998 (eds) Social Exclusion in European Cities, Jessica Kingsley, London.
Marsh, D. and Mullins, D. 1998 The Social Exclusion Perspective and Housing Studies: Origins, Applications and Limitations, Housing Studies, 13:6, pp. 749-69.
Murphy, J. 1997 Initial Location Decisions of Immigrants, Department of Immigration and Multicultural Affairs, Canberra.
Murphy, J. and Williams, L. 1996 Social Security Support and Recently Arrived Immigrants, People and Place, 4:2, pp. 15-20.
National Population Council Migration Committee 1990 Immigration and Housing in the Major Cities, AGPS, Canberra.
Neilson Associates 1982 Study of Immigration and Housing Demand in New South Wales and Sydney, Australian Population and Research Program, Sydney.
OECD 2000 Revenue Statistics 1965-99, OECD, Paris.
Ratcliffe, P. 1998 ‘Race’, Housing and Social Exclusion? Housing Studies, 13:6, pp. 808-18.
Social Planning Consortium 1985 Multicultural Housing Preferences: A Report on the Housing Preferences of Polish, Turkish and Indo-Chinese People in Melbourne, AHRC, Canberra.
Somerville, P. 1998 Explanations of Social Exclusion: Where Does Housing Fit In? Housing Studies, 13:6, pp. 761-80.
Titmus, R. 1958 The Social Division of Welfare: Some Reflections on the Search for Equity, in R. Titmus (ed) Essays on the Welfare State, Unwin University Books, London.

39
Tonkin, S., Williams, L. S. and Ackland, A. 1993 The Relationship between Visa Category and the Demand for Housing, Bureau of Immigration and Population Research, Canberra.
United Nations Commission on Population and Development 1997 Concise report on world population monitoring: international migration and development Report of the Secretary-General http://www.itcilo.it/english/actrav/telearn/global/ilo/seura/migwod2.htm
VandenHeuvel, A. and Wooden, M. 1999 New Settlers Have their Say – How Immigrants Fare Over the Early Years of Settlement, Report prepared for the Department of Immigration and Multicultural Affairs, Canberra.
Whiteford, P. 1991 Immigrants and the Social Security System, Australian Government Publishing Service, Canberra.
Williams, L. Murphy, J. and Brooks, C. 1997 Initial Labour Market Experiences of Immigrants, Department of Immigration and Multicultural Affairs, Canberra.

40
APPENDIX A. CHARACTERISTICS OF SERVICE USER GROUPS
Table A1. Tenure by Wave
Non-Users
Wave 1 Per cent
Wave 2 Per cent
Wave 3 Per cent
Home Ownership 13.7 17.0 24.6 Home Purchase 6.6 18.6 31.6 Public Rental 0 0.4 0.5 Private Rental 45.4 40.8 31.3 Paying Board 7.1 6.5 5.7 Rent Free 23.0 13.9 6.1 Employer Provided 1.6 2.6 0 Other 2.6 0.3 0.2 Total 100.0 100.0 100.0
Early Users
Wave 1 Per cent
Wave 2 Per cent
Wave 3 Per cent
Home Ownership 5.1 7.6 11.3 Home Purchase 11.0 24.7 35.2 Public Rental 1.6 3.9 2.9 Private Rental 46.5 42.8 36.2 Paying Board 14.2 6.0 5.1 Rent Free 20.5 12.1 6.4 Employer Provided 0.3 0.6 2.4 Other 0.8 2.3 0.5 Total 100.0 100.0 100.0
Late Users
Wave 1 Per cent
Wave 2 Per cent
Wave 3 Per cent
Home Ownership 5.0 8.6 10.7 Home Purchase 5.7 18.2 28.8 Public Rental 2.6 2.2 3.4 Private Rental 46.5 42.9 35.0 Paying Board 8.5 11.0 9.4 Rent Free 29.2 16.6 12.1 Employer Provided 0.4 0.1 0 Other 2.1 0.5 0.5 Total 100.0 100.0 100.0

41
High Users
Wave 1 Per cent
Wave 2 Per cent
Wave 3 Per cent
Home Ownership 3.4 4.0 4.0 Home Purchase 4.4 11.6 24.9 Public Rental 5.2 6.1 8.3 Private Rental 55.1 57.2 52.0 Paying Board 13.9 9.5 4.6 Rent Free 16.8 10.2 5.5 Employer Provided 0.3 0.6 0.2 Other 0.9 0.7 0.5 Total 100.0 100.0 100.0
Table A2. Total Household Income by Wave
Non-Users
Wave 1 Per cent
Wave 2 Per cent
Wave 3 Per cent
Refused/Not stated 28.2 23.5 16.0 None, Nil 0.7 0.1 $1 to $8,000 a year 3.0 0.9 1.1 $8,001 to $16,000 a year 2.6 1.2 4.1 $16,001 to $25,000 a year 9.3 11.3 6.7 $25,001 to $35,000 a year 6.9 6.7 11.1 $35,001 to $50,000 a year 18.1 17.6 9.8 $50,001 or more a year 31.2 38.8 51.1 Total 100.0 100.0 100.0
Early Users
Wave 1 Per cent
Wave 2 Per cent
Wave 3 Per cent
Refused/Not stated 31.3 20.1 15.1 None, Nil 0.8 0.9 $1 to $8,000 a year 3.0 2.9 1.4 $8,001 to $16,000 a year 6.4 5.3 6.7 $16,001 to $25,000 a year 10.1 8.1 7.9 $25,001 to $35,000 a year 12.2 14.3 11.0 $35,001 to $50,000 a year 10.6 13.6 16.7 $50,001 or more a year 25.7 34.9 41.1 Total 100.0 100.0 100.0
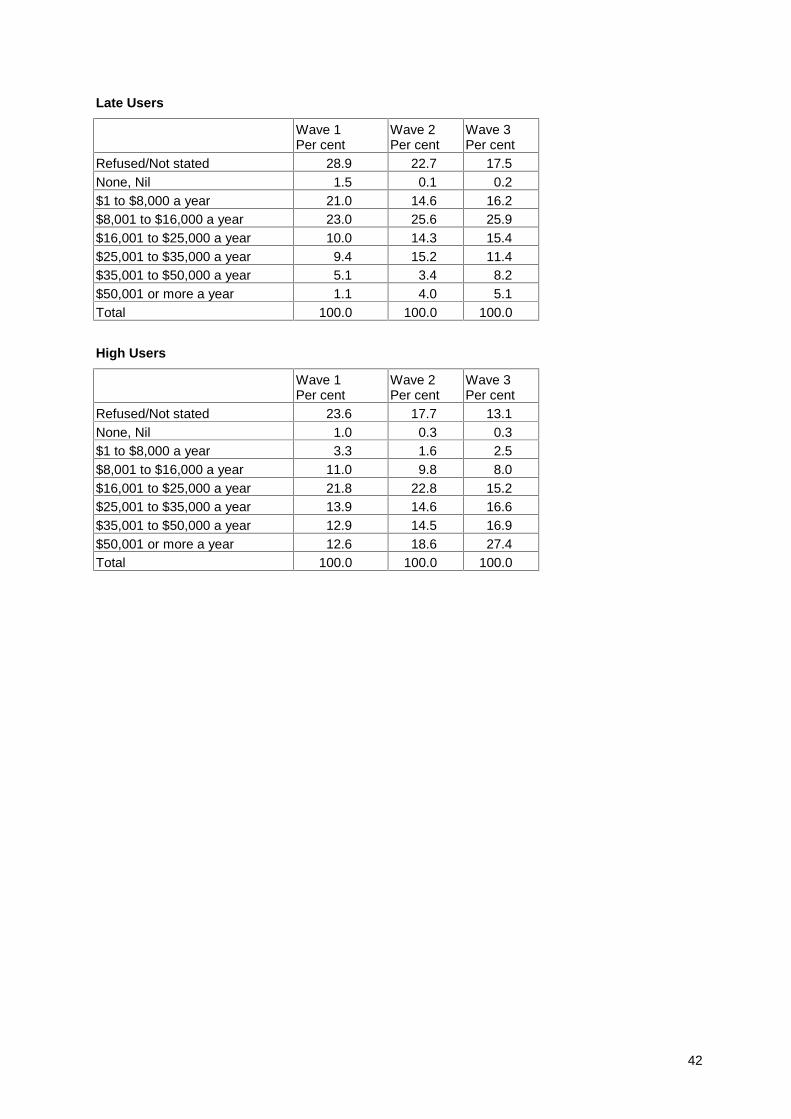
42
Late Users
Wave 1 Per cent
Wave 2 Per cent
Wave 3 Per cent
Refused/Not stated 28.9 22.7 17.5 None, Nil 1.5 0.1 0.2 $1 to $8,000 a year 21.0 14.6 16.2 $8,001 to $16,000 a year 23.0 25.6 25.9 $16,001 to $25,000 a year 10.0 14.3 15.4 $25,001 to $35,000 a year 9.4 15.2 11.4 $35,001 to $50,000 a year 5.1 3.4 8.2 $50,001 or more a year 1.1 4.0 5.1 Total 100.0 100.0 100.0
High Users
Wave 1 Per cent
Wave 2 Per cent
Wave 3 Per cent
Refused/Not stated 23.6 17.7 13.1 None, Nil 1.0 0.3 0.3 $1 to $8,000 a year 3.3 1.6 2.5 $8,001 to $16,000 a year 11.0 9.8 8.0 $16,001 to $25,000 a year 21.8 22.8 15.2 $25,001 to $35,000 a year 13.9 14.6 16.6 $35,001 to $50,000 a year 12.9 14.5 16.9 $50,001 or more a year 12.6 18.6 27.4 Total 100.0 100.0 100.0

43
Table A3. Labour Force Status by Wave
Non-Users
Wave 1 Per cent
Wave 2 Per cent
Wave 3 Per cent
A wage or salary earner 48.9 61.9 55.5 Conducting own business but not employing others
3.1 1.9 4.2
Conducting own business and employing others
1.4 5.0 2.8
Other employed 0.2 1.7 Unemployed looking for full time work 3.7 0.2 0 Unemployed looking for part time work 2.1 1.2 Student 2.2 1.4 1.4 Home duties 29.1 18.6 27.3 Retired 5.7 7.5 6.3 Aged pensioner 0.7 0.4 0.5 Other pensioner 0.3 0.2 Other 2.6 0.2 1.4 Refused/Not stated 0.3 Total 100.0 100.0 100.0
Early Users
Wave 1 Per cent
Wave 2 Per cent
Wave 3 Per cent
A wage or salary earner 50.3 64.5 67.9 Conducting own business but not employing others
2.0 3.8 3.4
Conducting own business and employing others
0.7 1.6 2.3
Other employed 0.3 0.2 0.3 Unemployed looking for full time work 19.4 2.9 2.6 Unemployed looking for part time work 0.6 0.1 1.0 Student 6.2 5.5 2.5 Home duties 11.5 13.9 11.8 Retired 5.5 6.1 4.3 Aged pensioner 2.0 1.1 2.8 Other Pensioner 0.8 Other 1.5 0.4 0.2 Total 100.0 100.0 100.0

44
Late Users
Wave 1 Per cent
Wave 2 Per cent
Wave 3 Per cent
A wage or salary earner 30.4 37.8 40.9 Conducting own business but not employing others
3.8 5.0 5.6
Conducting own business and employing others
0.6 0.9 1.7
Other employed 0.7 0.3 0.1 Unemployed looking for full time work 10.6 8.8 7.6 Unemployed looking for part time work 0.8 1.2 2.2 Student 13.1 9.8 4.5 Home duties 24.8 23.5 19.0 Retired 7.6 6.9 9.5 Aged pensioner 3.4 2.8 5.6 Other pensioner 0.1 1.6 1.4 Other 4.1 1.4 1.9 Refused/Not stated 0.2 Total 100.0 100.0 100.0
for Housing, in the Economics of Australian Immigration, Conference Proceedings, D. Douglas (ed) University Extension Program, Sydney, 8-9 Feb, pp. 117-23.
Gall, G. 1994 The Longitudinal Survey of Immigrants to Australia,
High Users
Wave 1 Per cent
Wave 2 Per cent
Wave 3 Per cent
A wage or salary earner 22.1 30.5 40.2 Conducting own business but not employing others
1.8 2.1 4.5
Conducting own business and employing others
0.2 0.5 1.4
Other employed 0.2 0.8 0.2 Unemployed looking for full time work 27.3 19.5 14.8 Unemployed looking for part time work 3.2 2.6 2.9 Student 22.6 22.3 8.4 Home duties 17.2 17.9 19.4 Retired 2.0 1.7 0.9 Aged pensioner 0.3 0.5 2.1 Other pensioner 0.4 0.9 2.3 Other 2.8 0.7 2.7 Refused/Not stated 0.2 Total 100.0 100.0 100.0

45
Table A4. Origin of Settlers
Non-Users
Per cent Oceania 3.5 UK/Ireland 26.3 Europe 8.4 Middle East/North Africa 4.8 South East Asia 23.3 North East Asia 16.4 Southern Asia 4.6 North, South and Central America 4.8 Africa 7.9 Total 100.0 Early Users
Per cent Oceania 4.1 UK/Ireland 23.6 Europe 16.0 Middle East/North Africa 5.4 South East Asia 20.5 North East Asia 9.5 Southern Asia 12.3 North, South and Central America 3.6 Africa 5.0 Total 100.0 Late Users
Per cent Oceania 3.5 UK/Ireland 23.5 Europe 9.7 Middle East/North Africa 6.8 South East Asia 22.7 North East Asia 16.3 Southern Asia 7.2 North, South and Central America 5.7 Africa 4.7 Total 100.0 High Users
Per cent Oceania 1.4 UK/Ireland 8.8 Europe 20.4 Middle East/North Africa 15.9 South East Asia 23.3 North East Asia 10.0 Southern Asia 11.3 North, South and Central America 3.9 Africa 4.8 Total 100.0

46
Table A5. How Well English Spoken
Non-Users
Wave 1 Per cent
Wave 2 Per cent
Wave 3 Per cent
Very well 24.9 25.2 30.1 Well 41.1 42.7 41.9 Not well 19.7 20.2 15.6 Not at all 14.3 11.9 12.4 Total 100.0 100.0 100.0
Early Users
Wave 1 Per cent
Wave 2 Per cent
Wave 3 Per cent
Very well 27.1 37.0 31.1 Well 44.8 40.5 50.9 Not well 22.1 20.4 13.7 Not at all 6.0 2.2 4.3 Total 100.0 100.0 100.0
Late Users
Wave 1 Per cent
Wave 2 Per cent
Wave 3 Per cent
Very well 17.3 18.9 17.6 Well 32.2 38.2 47.1 Not well 32.4 32.4 25.3 Not at all 18.1 10.5 10.0 Total 100.0 100.0 100.0
High Users
Wave 1 Per cent
Wave 2 Per cent
Wave 3 Per cent
Very well 10.4 10.5 13.4 Well 24.7 37.4 42.2 Not well 42.9 45.0 38.6 Not at all 22.0 7.1 5.7 Total 100.0 100.0 100.0

47
Table A6. How Well Satisfied with Life in Australia
Non-Users
Wave 1 Per cent
Wave 2 Per cent
Wave 3 Per cent
Very Satisfied 47.2 48.4 42.7 Satisfied 46.0 43.7 52.5 Neither satisfied nor dissatisfied 6.4 7.2 4.3 Dissatisfied 0.7 0.5 No opinion 0.4 Total 100.0 100.0 100.0
Early Users
Wave 1 Per cent
Wave 2 Per cent
Wave 3 Per cent
Very Satisfied 43.7 43.0 45.3 Satisfied 50.3 49.8 48.6 Neither satisfied nor dissatisfied 5.7 6.0 5.2 Dissatisfied 0.4 0.3 0.8 Very Dissatisfied 0.6 0.1 No opinion 0.2 Total 100.0 100.0 100.0
Late Users
Wave 1 Per cent
Wave 2 Per cent
Wave 3 Per cent
Very Satisfied 42.4 37.2 44.1 Satisfied 48.8 53.5 48.8 Neither satisfied nor dissatisfied 7.8 7.8 5.8 Dissatisfied 0.5 0.9 1.1 Very Dissatisfied 0.1 0.2 0.2 No opinion 0.3 0.4 Total 100.0 100.0 100.0
High Users
Wave 1 Per cent
Wave 2 Per cent
Wave 3 Per cent
Very Satisfied 40.2 36.9 35.0 Satisfied 51.4 53.4 55.7 Neither satisfied nor dissatisfied 7.3 8.6 8 Dissatisfied 0.4 1.0 0.9 Very Dissatisfied 0.1 0.1 0.1 No opinion 0.5 0.0 0.3 Total 100.0 100.0 100.0

48
Table A7. Number of Services Used by Sector and Wave
Early Users
Wave 1 Government Provided Services 15,265 NGO Provided Services 2,112 Services Provided by Other 1,282 Other/Unspecified 3,708 Total 22,367
Late Users
Wave 2 Wave 3 Total Service Use
Government Provided Services
5,863 4,792 10,655
NGO Provided Services 287 1,666 1,953 Services Provided by Other 3,045 3,040 6,085 Total 9,195 9,498 18,693
High Users
Wave 1 Wave 2 Wave 3 Total Service Use
Government Provided Services
53,068 38,743 17,638 109,449
NGO Provided Services 8,649 2,510 7,395 18,554 Services Provided by Other 1,345 7,706 12,105 21,156 Total 63,062 48,959 37,138 149,159

49
Table A8. Number of Services Used by Service Type and Wave
Early Users
Wave 1 Housing 393 Employment 3,632 Financial/Tax 3,020 Health and Aged Care 5,008 Social Security/Child Care 2,853 Education and Language 3,287 Other 4,174 Total 22,367
Late Users
Wave 2 Wave 3 Total Housing 315 189 504 Employment 997 808 1,805 Financial/Tax 1,896 574 2,470 Health and Aged Care 1,491 824 2,315 Social Security/Child Care 1,492 1,745 3,237 Education and Language 2,458 1,738 4,196 Other 546 572 1,118 Total 9,195 6,450 15,645
High Users
Wave 1 Wave 2 Wave 3 Total Housing 1,524 2,016 1,387 4,927 Employment 8,709 7,816 5,749 22,274 Financial/Tax 4,289 4,166 3,180 11,635 Health and Aged Care 7,796 6,001 4,497 18,294 Social Security/Child Care 12,937 9,237 8,360 30,534 Education and Language 17,975 17,395 10,039 45,409 Other 9,572 2,332 2,909 14,813 Total 62,802 48,963 36,121 147,886

50
APPENDIX B. CHARACTERISTICS OF HOUSING SERVICE USERS
Table B1. Users of Housing Services by Visa Category and Period of Housing Service Use
High Users Early Users All Users
Number Per cent Number Per cent Number Per cent
Preferential Family 335 15.0 2,283 34.1
Concessional Family 200 9.0 530 7.9
Business Skills & Employer Nomination
391 17.5 421 6.3
Independent 2 5.2 429 19.2 1,019 15.2
Humanitarian 45 94.8 878 39.3 2,450 36.6
Total 48 100.0 2,233 100.0 6,702 100.0
* Data do not add to totals due to entry error.
Table B2. Tenure, Users of Housing Services, All Waves
Wave 1 Per cent
Wave 2 Per cent
Wave 3 Per cent
Home Ownership 0.5 2.5 1.5 Home Purchase 3.9 6.3 16.6 Public Rental 4.7 9.0 13.1 Private Rental 63.8 4.8 61.0 Paying Board 13.2 9.0 5.2 Rent Free 11.6 5.6 1.3 Employer Provided 1.5 1.5 0.7 Other 0.8 1.3 0.5 Total 100.0 100.0 100.0
Table B3. Weekly Rent /Mortgage, Users of Housing Services, All Waves
Wave 1 Per cent
Wave 2 Per cent
Wave 3 Per cent
Nil 1.8 0 0 Less than $50 3.9 5.7 3.4 $50 - $99 17.4 15.9 19.8 $100 - $149 38.3 37.6 27.9 $150 - $199 27.3 28.3 28.7 $200 - $299 6.4 9.5 14.0 $300 - $499 2.9 2.1 4.5 $500 or more 0.8 0.6 1.7 Refused/ Not Stated 0 0 0 Don’t know 1.3 0.2 0 Total 100.0 100.0 100.0

51
Table B4. Labour Force Status, Users of Housing Services, All Waves
Wave 1 Per cent
Wave 2 Per cent
Wave 3 Per cent
A wage or salary earner 23.2 36.5 44.1 Conducting own business but not employing others
0.2 1 2.7
Conducting own business and employing others
0.3 0.6 0.9
Other employed 0.1 2.1 0 Unemployed looking for full time work
25.6 18.7 13.6
Unemployed looking for part time work
3.7 1.4 2.3
Student 22.4 13.7 8.4 Home duties 18.3 17.1 15.4 Retired 2.2 2.9 1.4 Aged pensioner 1.3 1.8 3.9 Other pensioner 0.2 3.0 4.2 Other 2.5 1.1 2.9 Refused/Not stated 0 Total 100.0 100.0 100.0 Table B5. Household Income, Users of Housing Services, All Waves
Wave 1 Per cent
Wave 2 Per cent
Wave 3 Per cent
Not stated/Refused 26.5 21.5 13.3 None, Nil 0.6 0.7 0.2 $1 to $8,000 a year 1.2 2.7 1.7 $8,001 to $16,000 a year 11.3 12.1 7.8 $16,001 to $25,000 a year 25.6 17.9 13.9 $25,001 to $35,000 a year 12.1 11.8 18.2 $35,001 to $50,000 a year 9.6 14.8 18.2 $50,001 or more a year 13.1 18.5 26.7 Total 100.0 100.0 100.0 Table B6. How Well English Spoken, Users of Housing Services, All Waves
Wave 1 Per cent
Wave 2 Per cent
Wave 3 Per cent
Very well 12.3 15.0 16.6 Well 29.8 37.0 42.7 Not well 39.8 40.2 35.6 Not at all 18.2 7.8 5.1 Total 100.0 100.0 100.0 Table B7. Satisfaction with Life in Australia, Users of Housing Services, All Waves
Wave 1 Per cent
Wave 2 Per cent
Wave 3 Per cent
Very Satisfied 41.9 38.3 37.2 Satisfied 47.7 54.2 53.7 Neither satisfied nor dissatisfied 9.3 6.7 8.6 Dissatisfied 0.6 0.8 0.5 Very Dissatisfied 0.1 No opinion 0.5 Total 100.0 100.0 100.0

52
Table B8. Services Used by Sector, Users of Housing Services, All Waves
Wave 1 Number
Wave 2 Number
Wave 3 Number
Total Number
Government Provided Services 23,006 14,660 9,797 47,463 NGO Provided Services 6,702 1,041 2,141 9,884 Other Services 2,042 3,419 3,939 9,400 Total Sector 31,750 19,120 15,877 66,747
Table B9. Type of Service Used, Users of Housing Services, All Waves
Wave 1 Wave 2 Wave 3 Total Total Per cent
Housing 3,026 2,930 2,072 8,028 12.8 Employment 3,934 2,526 1,931 8,391 13.4 Financial/Tax 2,781 1,610 1,002 5,393 8.6 Health and Aged Care 3,695 2,075 1,502 7,272 11.6 Social Security/Child Care 5,842 3,375 2,578 11,795 18.8 Education and Language 7,961 5,638 2,758 16,357 26.0 Other 4,440 965 185 5,590 9.0 Total 31,679 19,119 12,028 62,826 100.0
Table B10. Amount of Rent Assistance Received, Waves Two and Three
Wave Two Wave Three Number Per cent Number Per cent Not stated/Refused 218 24.7 17 8.6 Don’t know 182 20.7 Less than $50 per fortnight 85 9.6 23 11.7 $50 to $99 per fortnight 309 35.1 149 75.6 $100 to $149 per fortnight 55 6.2 $200 to $249 per fortnight 12 1.4 $250 to $299 per fortnight 6 0.7 $300 to $349 per fortnight 8 4.1 $600 or more per fortnight 14 1.6 Total 881 100.0 197 100.0
Table B 11. Source of Assistance in Finding a House, Users of Housing Services, All Waves
Wave 1 Number
Wave 2 Number
Wave 3 Number
Total Number
Total Per cent
Ethnic Club 164 4 7 175 1.3 Church 569 43 36 648 4.9 Vietnamese Welfare Association 175 17 30 222 1.7 Migrant Resource Centre 191 0 17 208 1.6 Dept. of Immigration and Ethnic Affairs
421 22 0 443 3.4
Dept. of Social Security 320 353 81 754 5.7 DEET/Centrelink 105 6 18 129 1.0 Embassy, Former Home Country 245 0 0 245 1.9 Other Govt. Agency 442 1,556 1,197 3,195 24.3 Employer 640 46 18 704 5.4 Other 0 882 662 1,544 11.8 Relatives in Australia 2,711 218 112 3,041 23.2 Friends in Australia 1,550 226 52 1,828 13.9 Total 7,533 3,373 2,230 13,136 100.0

53
AHURI Research Centres
Sydney Research Centre
UNSW-UWS Research Centre
RMIT Research Centre
Swinburne-Monash Research Centre
Queensland Research Centre
Western Australia Research Centre
Southern Research Centre
ANU Research Centre
Affiliates
Ecumenical Housing Inc
Northern Territory University
National Centre for Social and Economic Modelling
Australian Housing and Urban Research Institute
Level 7 20 Queen Street, Melbourne Victoria 3000
Phone +61 3 9613 5400 Fax +61 3 9629 8536
Email [email protected] Web www.ahuri.edu.au