the hub development proposal by dev
TRANSCRIPT

The HUB Development Proposal
“The HUB,” a mixed-use transit-oriented development, is the community of choice connecting you to your network. It is located adjacent to Layton City’s new transportation hub - where I-15, Layton Parkway, and Frontrunner converge (a.k.a. the center of the universe). The HUB’s proximity to Layton’s historic downtown and the future IHC community hospital, along with its quick access to the Wasatch Front, makes The HUB a very attractive development. These connections create the opportunity of a walkable master planned mixed-use development. The HUB creates an urban center for residents and neighbors through open space, recreation, and a vibrant mix of retail and commercial services.
TABLE OF CONTENTS
-------------------01 Summary of Salient Facts 1------------------------02 Property Description 2
-------------------------------03 Deal Economics 7------------------------------04 Feasibility Study 9
01 Summary of Salient Facts
‣ 20 Acres Zoned MU-TOD, Owned by IHC‣ Commercial: 119,080 sf‣ Retail: 88,780 sf‣ Residential: 400 units‣ Senior Housing: 80 units‣ Recreation Center: 18,000 sf‣ Development Budget: $62,800,000‣ Overall Leveraged IRR: 23%
THEHUB
STAY CONNECTEDTM
R
.festDEV
by DEV.fest

02 Property Description
LOCATION
The HUB is a 20-acre mixed-use, transit-oriented development in Layton, Utah. The site is located within Layton City’s Downtown Plan and is described as the “West Field Area.” The site is west of the Layton FrontRunner s ta t ion, south of Kay’s Creek, and bordered on the west by an existing neighborhood. The current owner is IHC Health Services Inc. c/o James F. Wood. Our development plan is focused on this MU-TOD 20 acre parcel with an option to develop an additional 7 acres zoned B-RP located to the southeast.
PROJECT OBJECTIVES
1. Create a sense of community2. Provide convenient access to
transportation3. Improve quality of life with health services
and active lifestyle amenities
PROJECT AMENITIES
‣ Recreation Center‣ Live/work/shop amenities‣ Open space‣ Utopia Fiber Optic Internet Connection‣ Community Hospital within walking distance‣ Close proximity to transportation corridors
• Kay’s Creek Trail and regional trail system
• Close proximity to the freeway• FrontRunner Access within walking
distance‣ Close to Layton’s up and coming
Downtown
1/4 MILE RADIUS5-MINUTE WALK
1/2 MILE RADIUS10-MINUTE WALK
FUTUREGROCERY
STORE
ELEMENTARYSCHOOL
FUTURECOMMUNITY
HOSPITAL
DEVELOPMENT SITE:ZONED: MU-TOD
FRONTRUNNERSTATION
!H
!H
!H
!H
!H
!H
!H
!H
S a l t L a k e C i t yS a l t L a k e C i t y
H o o p e rH o o p e r
O g d e nO g d e n
L a y t o nL a y t o n
R o yR o y
B o u n t i f u lB o u n t i f u l
K a y s v i l l eK a y s v i l l e
P l a i n C i t yP l a i n C i t y
C l i n t o nC l i n t o n
W e s t P o i n tW e s t P o i n t
S y r a c u s eS y r a c u s e
F a r m i n g t o nF a r m i n g t o n
W e s t H a v e nW e s t H a v e n
C l e a r f i e l dC l e a r f i e l d
F a r r W e s tF a r r W e s tN o r t h O g d e nN o r t h O g d e n
N o r t h S a l t L a k eN o r t h S a l t L a k e
C e n t e r v i l l eC e n t e r v i l l e
R i v e r d a l eR i v e r d a l e
M o r g a nM o r g a n
P l e a s a n t V i e wP l e a s a n t V i e w
S o u t h W e b e rS o u t h W e b e r
M a r r i o t t - S l a t e r v i l l eM a r r i o t t - S l a t e r v i l l e
W o o d s C r o s sW o o d s C r o s s
S o u t h O g d e nS o u t h O g d e n
H a r r i s v i l l eH a r r i s v i l l e
S u n s e tS u n s e t
W e s t B o u n t i f u lW e s t B o u n t i f u l
F r u i t H e i g h t sF r u i t H e i g h t s
U i n t a hU i n t a h
W a s h i n g t o n T e r r a c eW a s h i n g t o n T e r r a c e
H u n t s v i l l eH u n t s v i l l e
FrontRunner North0 5 102.5Miles
Existing LRT
Pleasant View
Woods Cross
Salt Lake Central
Ogden
Roy
Clearfield
Layton
Farmington
Weber County
Davis County
Davis County
Salt Lake C
ounty
Morgan County
H A F BH A F B
FrontRunner South
(under construction)
Airport LRT
(under construction)
2

The project has a healthy mix of residential, retail, office, and recreational uses. In addition to the internal project amenities, there are several neighborhood parks, local and regional trails, and public transit that add value to the development. Layton City plans to add a trail along Kay’s Creek and construct a tunnel under the existing rail line linking the trail system and neighborhood to the UTA FrontRunner station. On the south side of Layton Parkway, IHC is planning to build a community hospital that will provide medical services to the surrounding community. Not only does The HUB have great access to the transportation network of the Wasatch Front, but it will also deliver its residents and businesses access to the world via a fiber optic network. Layton City is one of 13 cities in Utah to provide its citizens with internet access to Utopia’s Fiber Optic Network. The HUB is where people stay connected to life both virtually and physically.
Given its numerous and varied amenities, The HUB provides its residents with a greater quality of life. Picture waking up and walking to the local fitness center or taking a peaceful walk along Kay’s Creek trail to several nearby parks. Not your cup of tea? Walk over to the local café for your favorite brew and surf the web via Utopia’s fiber optic network. Found out you need to go into work? No problem. Jump on the nearby commuter rail and arrive downtown in no time. Long day at work? Take your family over to the local restaurant and enjoy dessert in the park. Need to get your kids out of the house? Take them on a bike ride along Kay’s creek trail to the nearby library or over to the recreation center. The HUB keeps your life running smoothly.
KAYS CREEK TRAILNEW TUNNEL
FRONTRUNNERSTATION
LAYTON PARKWAY
MAIN
STREET
3

URBAN LIFESTYLE
The HUB wi l l p rov ide i ts residents with an urban lifestyle. The project contributes to Layton’s overall downtown plan of creating a “District,” which is a place of distinguishing character. The development will attract more intense use by connecting walkable community places, open spaces, and providing aesthetically pleasing architecture.
The “Amer ican Dream” is shifting. Arthur C. Nelson, PH.D, FAICP, University of Utah, called it “A D e c a d e o f C h a n g i n g H o u s i n g Demand.” The 40-year career, house in the suburbs, cheap gas, and all homes appreciate attitude has evolved. What is the “New American Dream?” Connections. Connections from home to friends, nature, recreation and technology. “Baby Boomers and Echo Boomers are looking for urban amenities.” The Ivory Institute, 2011. Convenience, connectivity, walk-ability, and efficiency are now associated with current housing demands.
PHASE I
P h a s e 1 c o n s i s t s o f 2 0 0 apartment units, 62,880 square feet of retail, 51,780 square feet of office, and a 18,000 square foot recreation center that will be leased, and managed by Layton City. Layton City will start constructing the asphalt trail between Kay’s Creek and our property line, as well as to the UTA FrontRunner Station.
PHASE II
P h a s e 2 c o n s i s t s o f 2 0 0 apartments units, 80 senior housing
garden style apartments, 25,900 square feet of retail, and 67,300 square feet of office space.
PHASE III
At this time the market will be re-evaluated. A hotel will be considered on the southeast corner of the 20-acre parcel. Phase III may also see the development of two
4
MIXED USE (RESIDENTIAL)
MIXED USE (OFFICE)
INSTITUTIONAL
HOSPITALITY
medical office buildings on the south side of Layton Parkway on the 7-acre parcel. This land is currently zoned for Business-Research Park (B-RP). The construction of these buildings will begin after IHC starts constructing the community hospital.
PROPOSED USES
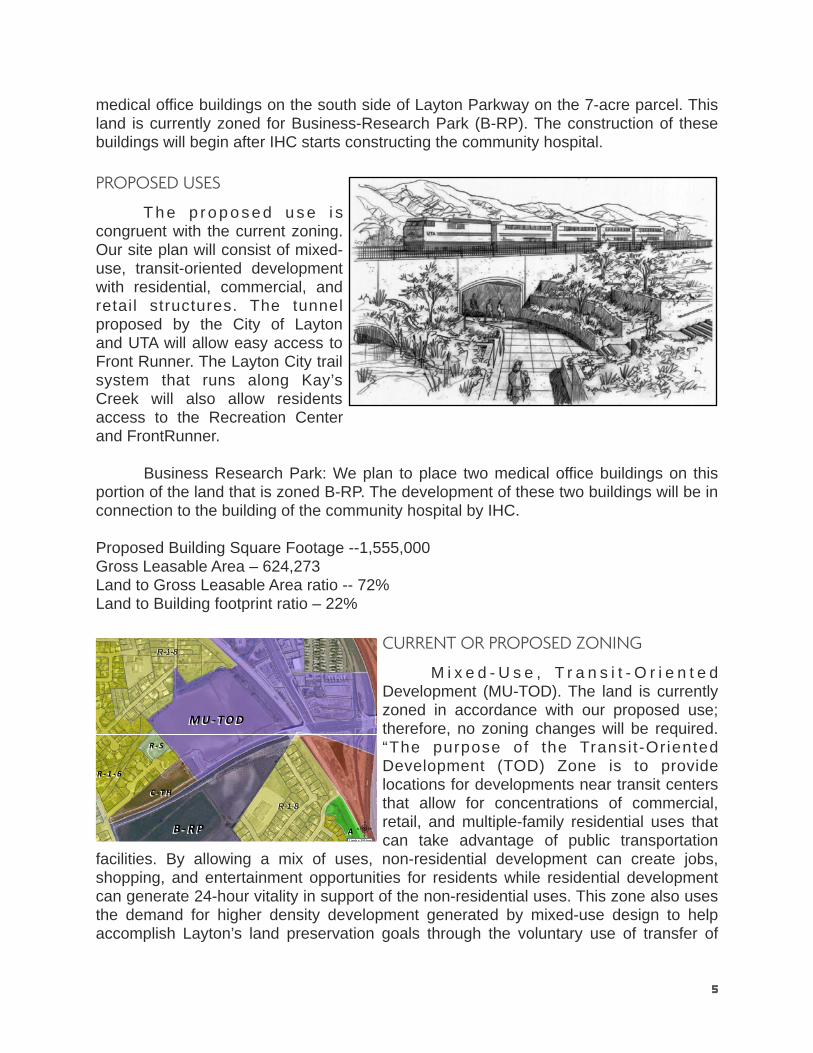
T h e p r o p o s e d u s e i s congruent with the current zoning. Our site plan will consist of mixed-use, transit-oriented development with residential, commercial, and retail structures. The tunnel proposed by the City of Layton and UTA will allow easy access to Front Runner. The Layton City trail system that runs along Kay’s Creek will also allow residents access to the Recreation Center and FrontRunner. Business Research Park: We plan to place two medical office buildings on this portion of the land that is zoned B-RP. The development of these two buildings will be in connection to the building of the community hospital by IHC.
Proposed Building Square Footage --1,555,000Gross Leasable Area – 624,273Land to Gross Leasable Area ratio -- 72%Land to Building footprint ratio – 22%
CURRENT OR PROPOSED ZONING
M i x e d - U s e , T r a n s i t - O r i e n t e d Development (MU-TOD). The land is currently zoned in accordance with our proposed use; therefore, no zoning changes will be required. “The purpose of the Transi t -Oriented Development (TOD) Zone is to provide locations for developments near transit centers that allow for concentrations of commercial, retail, and multiple-family residential uses that can take advantage of public transportation
facilities. By allowing a mix of uses, non-residential development can create jobs, shopping, and entertainment opportunities for residents while residential development can generate 24-hour vitality in support of the non-residential uses. This zone also uses the demand for higher density development generated by mixed-use design to help accomplish Layton’s land preservation goals through the voluntary use of transfer of
AA
R -‐ SR -‐ S
R -‐ 1 -‐ 6R -‐ 1 -‐ 6
R -‐ 1 -‐ 6R -‐ 1 -‐ 6
C -‐ THC -‐ TH
B -‐ R PB -‐ R P
MU -‐ TODMU -‐ TOD
:1 inch = 300 feet
R-1-8R-1-8
R-1-8R-1-8
5

development rights.” Layton City Municipal Code 19.26 Mixed-Use/Transit Oriented Development (TOD)Zone, 19.26.010-Purpose and intent (July 8,2009).
Business Research Park (B-RP). The proposed improvements to the land comply with current zoning type and will not need to be rezoned. “The B-RP (Business and Research Park) zoning district is intended to be an attractive environment for offices, research facilities, and environmentally appropriate assembly uses as well as appropriate amenities supporting employee activity. Uses receiving site plan approval for this zone should be compatible with surrounding uses and integrated so that all development creates an open campus like atmosphere. This is to be accomplished with a number of design components including attractive buildings, meandering walks and well thought out generous landscaping.” Layton City Municipal Code 19.04.020 Purpose of zoning districts
6

03 Deal Economics
The HUB will be a community success and a financial one as well. Based upon the realistic assumptions given in the pro forma, the Leveraged IRR for the project is 23% and unleveraged is 15%. Because of these attractive returns Dev.fest’s excitement for The HUB isn’t limited to the fee we will earn managing the project. We also want to participate in the cash flows of this project and will thus contribute our development fee as deferred equity. Additionally, IHC has agreed to contribute the cost of the land ($4,704,480) as an equity partner on the deal. However this leaves another $6,916,339 that is required in additional equity. According to Stan Castleton, it is easier to raise 100 million than 100 thousand dollars. Projects like The HUB illustrate this principle. An economist from AEW has shown that with today’s capital markets, institutional money can be crucial for large scale projects. Additionally, institutional money managers demand class A investments. We are confident that the appealing returns will attract the necessary joint venture partner(s).
CONSTRUCTION BUDGET
USES OF FUNDS Size (SF) PSF Project Costs Loan EquityPhase 1Land (acres) 12 522,720 9 4,704,480 4,704,480 Office 51,780 90 4,660,200 Retail 62,880 71 4,464,480 Multi-Family 182,000 71 12,922,000 Recreation Center 18,000 85 1,530,000 Developer FeeRoughly 5% 1,600,000 1,600,000
Phase 2Land (acres) 8 348,480 9 3,136,320 3,136,320 Office 67,300 80 5,384,000 Retail 25,900 90 2,331,000 Multi-Family 182,000 71 12,922,000 Senior Housing 93,645 71 6,648,795 Developer FeeRoughly 5% 1,800,000 1,800,000
Total Building Costs 54,262,475 Total Building Costs Incl. Land 62,103,275 Initial Equity 11,240,800 Additional Cash Equity Needed 6,916,339 Total Uses Of Funds 62,103,275 43,946,137 18,157,139
SOURCES OF FUNDSPhase 1 Phase 2 Total
Maximum Loan Amount 21,390,656 22,555,481 43,946,137 70%Land Equity 4,704,480 3,136,320 7,840,800 12%Deferred Equity 1,600,000 1,800,000 3,400,000 5%Additional Cash Equity 2,862,944 4,730,315 7,593,259 12%Total Sources 30,558,080 32,222,115 62,780,195 100%
7

COMBINED 10-YEAR CASH FLOWSCombined CASH FLOWDISCOUNTED CASH FLOW ANALYSIS Year 1 Year 2 Year 3 Year 4 Year 5 Year 6 Year 7 Year 8 Year 9 Year 10 Year 11
CostPOTENTIAL GROSS REVENUEGross Income 4,014,509 4,175,089 4,342,093 9,413,277 9,789,808 10,181,400 10,588,656 11,012,203 11,452,691 11,910,798 12,387,230 Vacancy (2,007,254) (626,263) (158,486) (2,613,576) (935,429) (371,621) (386,486) (401,945) (418,023) (434,744) (452,134)
EFFECTIVE GROSS REVENUE 2,007,254 3,548,826 4,183,606 6,799,701 8,854,379 9,809,779 10,202,171 10,610,257 11,034,668 11,476,054 11,935,097
TOTAL OPERATING EXPENSES (1,023,003) (1,048,578) (1,074,792) (2,612,952) (2,678,276) (2,745,233) (2,813,864) (2,884,210) (2,956,316) (3,030,224) (3,105,979)
NET OPERATING INCOME 984,251 2,500,248 3,108,814 4,186,749 6,176,103 7,064,546 7,388,307 7,726,047 8,078,352 8,445,831 8,829,117 selling cap
CASH FLOW BEFORE DEBT SERVICE 984,251 2,500,248 3,108,814 4,186,749 6,176,103 7,064,546 7,388,307 7,726,047 8,078,352 8,445,831Debt Service Payments (1,594,478) (1,594,478) (1,594,478) (4,673,490) (4,673,490) (4,673,490) (4,673,490) (4,673,490) (4,673,490) (4,673,490)Sales Price 119,458,705Selling Costs (2,389,174)Loan Repayment (33,998,633)Cash Flow Stream (9,167,424) (610,226) 905,770 (8,152,298) (486,742) 1,502,613 2,391,056 2,714,816 3,052,557 3,404,862 86,843,238Cash on Cash Return -6.7% 9.9% -88.9% -5.3% 16.4% 26.1% 29.6% 33.3% 37.1% 947.3%
LEVERAGED IRR 23.29%UNLEVERAGED IRR 15.06%
(30,558,080) 984,251 2,500,248 (29,113,301) 4,186,749 6,176,103 7,064,546 7,388,307 7,726,047 8,078,352 125,515,361
PROJECT USE TYPE ECONOMICSSENIOR HOUSING PROJECT ECONOMICSPhase 2 Units Leasable SF Total SF Lease Rate Inc/Unit/Mo Stabilized1 Bed - 1 Bath 25 915 22,875 1.20 1,098.00 329,400 2 Bed - 1 Bath 30 1,114 33,420 1.05 1,169.70 421,092 2 Bed - 2 Bath 25 1,224 30,600 0.99 1,211.76 363,528 3 Bed - 2 Bath 5 1,350 6,750 0.96 1,296.00 77,760
85 93,645 1,191,780
Gross income 1,191,780 Less: MF Vacancy & Turnover 2.7% ($31,582)Effective Gross Income 1,160,198
Operating Expenses: Cost Per YearAdministrative 170 Per Unit 68,000 Management 5% 682 Per Unit 272,988 Advertising 100 Per Unit 40,000 Turnover Cost 140 Per Unit 56,000 Repairs and Maintenance 300 Per Unit 120,000 Payroll 740 Per Unit 296,000 Utilities 440 Per Unit 176,000 Taxes 320 Per Unit 128,000 Insurance 120 Per Unit 48,000
Total Operating Expenses 14,176 (1,204,988)NET OPERATING INCOME (44,790)
Gross SF Leasable SF Lease Rate Stabilized
Phase 1
Building A: levels 1 and 2 19,280 15,424 18.88 291,205
Building B: Levels 1 20,000 16,000 18.88 302,080
Bottom of MF 20,000 16,000 19.88 318,080
Building C: Flower Shop 3,600 3,420 18.88 64,570
Phase 2
Building 2A: level 1 and 2 16,000 12,800 18.88 241,664
Building 2B: Level 1 9,900 7,920 19.88 157,450
88,780 71,564 1,375,048
Gross income 1,375,048
Less: Retail Vacancy @ 8% ($110,004)
Effective Gross Income 1,265,044
Operating Expenses:
1.20 psf 85,877
0.15 psf 10,735
0.20 psf 14,313
Administration Expense 0.50 psf 35,782
3.00 psf 214,692
3.0% of EGI 37,951
0.21 psf 15,028
Total Operating Expenses 5.79 psf (414,378)
NET OPERATING INCOME 850,666
Utilities
RETAIL PROJECT ECONOMICS
Taxes
Insurance
Common Area Maintenance
Management Fee
Relacement and Reserves
MULTI-FAMILY PROJECT ECONOMICS
Units Leasable SF Total SF Lease Rate Inc/Unit/Mo Stabilized
Phase 1
Studios 20 500 10,000 1.02 510.00 122,400
1 Bed - 1 Bath 60 800 48,000 1.05 840.00 604,800
2 Bed - 1 Bath 80 950 76,000 0.95 902.50 866,400
3 Bed - 2 Bath 40 1,200 48,000 0.84 1,008.00 483,840
Phase 2
Studios 20 500 10,000 1.02 510.00 122,400
1 Bed - 1 Bath 60 800 48,000 1.05 840.00 604,800
2 Bed - 1 Bath 80 950 76,000 0.95 902.50 866,400
3 Bed - 2 Bath 40 1,200 48,000 0.84 1,008.00 483,840
400 364,000 4,154,880
Gross income 4,154,880
Less: MF Vacancy & Turnover 3.7% ($151,653)
Effective Gross Income 4,003,227
Operating Expenses: Cost Per Year
Administrative 170 Per Unit 68,000
Management 3% 300 Per Unit 120,097
Advertising 100 Per Unit 40,000
Turnover Cost 140 Per Unit 56,000
Repairs and Maintenance 300 Per Unit 120,000
Payroll 740 Per Unit 296,000
Utilities 440 Per Unit 176,000
Taxes 320 Per Unit 128,000
Insurance 120 Per Unit 48,000
Total Operating Expenses 2,630 (1,052,097)
NET OPERATING INCOME 2,951,130
Gross SF Leasable SF Lease Rate Stabilized
Phase 1
Building B: Levels 2 and 3 32,500 26,000 22.83 593,580
Building A: Level 2 19,280 15,424 23.83 367,554
Phase 2
Building 2B: Levels 2, 3, and 4 29,700 23,760 22.83 542,441
Building 2C: Levels 1, 2, 3, & 4 37,600 30,080 22.83 686,726
119,080 95,264 2,190,301
Gross income 2,190,301
Less: Office Vacancy @8.00% ($175,224)
Effective Gross Income 2,015,077
Operating Expenses:
1.2 psf 114,316.80
0.23 psf 21,911
1.5 psf 142,896
0.77 psf 73,353
0.34 psf 32,390
3.0% of EGI 60,452
0.21 psf 20,005
Total Operating Expenses 4.88 psf (465,324)
NET OPERATING INCOME 1,549,753
OFFICE PROJECT ECONOMICS
Property Taxes
Insurance
Repairs and Maintenance
Management
Relacement and Reserves
Utilities
Janitorial
8
04 Feasibility Study
The Park Lane Village in Farmington is a reasonable comparable based upon the type of programing and proposed uses. The HUB’s rents are in line with other similar products in the surrounding area. Construction costs are based upon current industry standards for the type of construction.
Demand for Walkable, Mixed-Used NeighborhoodsDemand for Walkable, Mixed-Used NeighborhoodsDemand for Walkable, Mixed-Used Neighborhoods
Demographic Group
Would Support a "Daybreak" Community
Want to Live in a "Daybreak" Community
All 51% 47%
Age 18-34 55% 51%
35-54 48% 45%
55-69 52% 47%70+ 59% 56%
Household Type
Single Person HH* 50% 48%
HH Without Children 52% 46%
HH With Children 52% 46%source: Ivory Institute 2012, Compiled by Metropolitan Research Center, University of Utah, using PPIC and ASU surveys
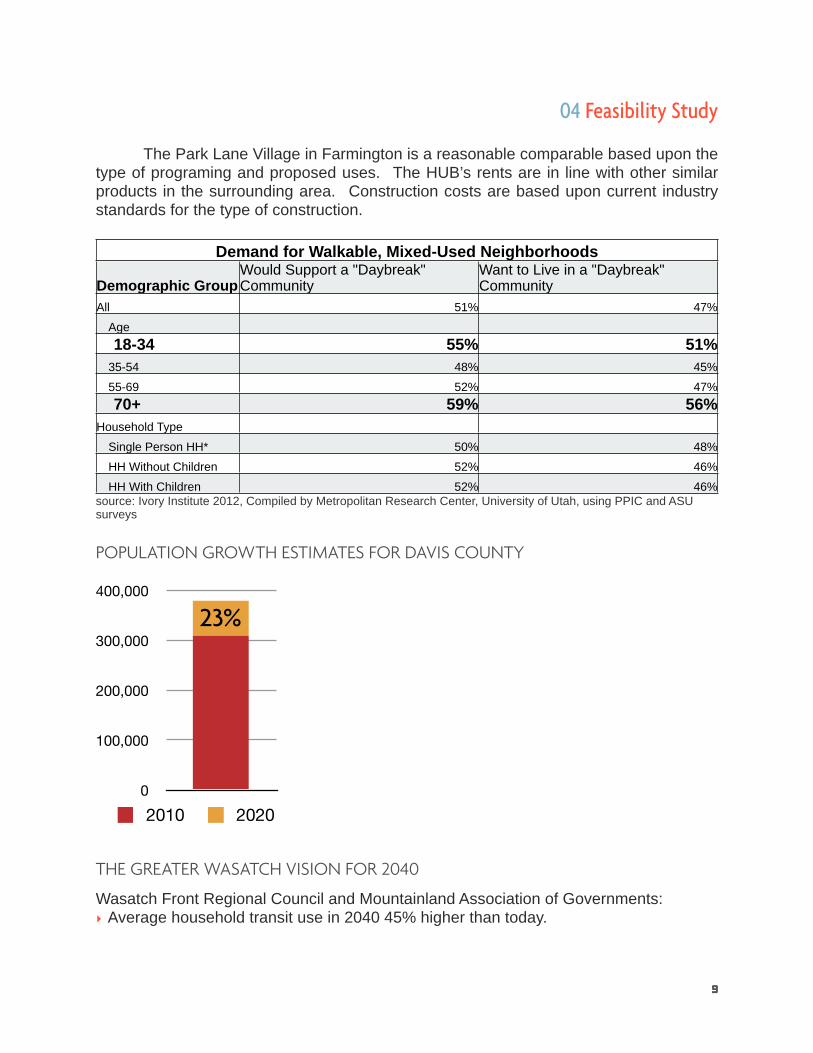
POPULATION GROWTH ESTIMATES FOR DAVIS COUNTY
THE GREATER WASATCH VISION FOR 2040
Wasatch Front Regional Council and Mountainland Association of Governments:‣ Average household transit use in 2040 45% higher than today.
0
100,000
200,000
300,000
400,000
2010 2020
9
23%

‣ Walkable community: new homes are twice as likely as today’s homes to have convenient access to places to work, shop, play and learn.
‣ More vertical development, less sprawl: by 2040 there will be 40% more vertical development.
Vision 2040‣Utah is among the fastest growing states in the nation. ‣More than 900,000 growth-related residential units will be constructed by 2040.‣Nearly 1.9 billion square feet of new and rebu i l t space w i l l be needed to accommodate the projected 2.9 million jobs we’ll have by 2040.‣The Wasatch Front has limited land available for development, and building roads to serve wide ly d ispersed populations will become increasingly impractical and expensive.
source: Arthur C. Nelson, Presidential Professor of City and Metropolitan Planning, University of Utah (2009)
CONCLUSION
Dev.Fest is excited to deliver an exciting mixed-use, transit-oriented development. The HUB is the development that best suits the proposed site. With its excellent amenities, the project will be a resounding success. Stay connected.
10