the iceland basin - hafrannsóknastofnun · the iceland basin -topography and oceanographic...
TRANSCRIPT

Hafrannsóknastofnunin. Fjölrit no. 109
The Iceland Basin
-Topography and Oceanographic Features-
Svend-Aage Malmberg
Marine Research Institute
Reykjavík 2004

The Iceland Basin
2

The Iceland Basin
3
CONTENT
ABSTRACT ............................................................................................................................................5
ÁGRIP .....................................................................................................................................................5
1. INTRODUCTION .............................................................................................................................7
2. BOTTOM TOPOGRAPHY..............................................................................................................7
2.1. THE ICELAND BASIN .....................................................................................................................7 2.2. THE REYKJANES RIDGE ................................................................................................................7 2.3. THE ICELAND - FAROE RIDGE .......................................................................................................7 2.4. ICELAND .......................................................................................................................................8 2.5. CONTINENTAL SLOPE, RISE AND DEEP SEA FLOOR .........................................................................8
3. WATER MASSES .............................................................................................................................8
4. CIRCULATION ................................................................................................................................9
5. DIRECT CURRENT MEASUREMENTS ......................................................................................9
6. CHARLIE-GIBBS FRACTURE ZONE........................................................................................10
7. CONCLUSIONS..............................................................................................................................10
8. ACKNOWLEDGEMENT ..............................................................................................................11
REFERENCES .....................................................................................................................................11
FIGURES ..............................................................................................................................................13

The Iceland Basin
4

The Iceland Basin
5
Abstract Svend-Aage Malmberg. 2004. The Iceland Basin: Topography and oceanographic features. Marine Research Institute. Report 109, 43 s.
This overview deals with the ocean region south of Iceland, named the Iceland Basin. The region is surrounded by the Reykjanes Ridge in the west, Iceland in the north, the Iceland-Faroe Ridge in the northeast and east, and several banks extending from the Faroes southwest wards to the Hatton Bank and Rockall. Only to the southwest the region is open out to the North Atlantic.
The overview was prepared in 1996 following a request from the Icelandic Post and Telephone Services because of faults in the submarine cable CANTAT-3 between North America and Europe.
The overview explains the general features of the bottom topography, especially around the western, northern and eastern boundaries of the Iceland Basin or along the lines of the submarine cable. Furthermore a description is given on the different water masses and their distribution in the area. They are the Atlantic water from the south in the uppermost 1000-1500 m, the Labrador and Irminger Sea water from the west at intermediate depths flowing across the Reykjanes Ridge into the Iceland Basin, and the "Overflow" bottom water from the north flowing through the Faroe-Shetland and the Faroe Bank Channels and across the Iceland-Faroe Ridge, and from there around the periphery of the Iceland Basin and at last over the Reykjanes Ridge into the Irminger Sea. Furthermore results of direct current measurements, mainly in the deep and bottom waters along the northern periphery of the Iceland Basin, are described. These measurements show in general velocities of 20-50 cm s-1 or up to one knot and with a westwards direction along the depth isobaths.
At last thoughts are given to the reason of the failures or faults in the submarine cable CANTAT-3 in the waters south of Iceland. The question arises, if these failures possibly were due to turbidity currents downhill the continental slopes and the submarine ridges or even due to trawl fisheries? But as the failures were located in deep waters and limited to regions of the different submarine ridges, it seems more likely that they were due to vibration or strumming of the cable, induced by currents along the depth contours that cause chafe faults and abrasion.
Ágrip Svend-Aage Malmberg. 2004. Suðurdjúp - Íslandsdjúp: Botnlögun, sjógerðir og straumar. Hafrannsóknastofnunin. Fjölrit 109, 43 pp.
Yfirlit þetta fjallar um hafsvæðið sunnan Íslands, nánar tiltekið svæði það sem afmarkast af Reykjaneshrygg að vestan, Íslandi að norðan, Íslands-Færeyjahrygg að austan og norðaustan, og svo fjölda grunna og banka sem teygja sig frá Færeyjum vestur að Hatton banka og Rockall. Aðeins að sunnan eða suðvestan er hafsvæðið opið út í Atlantshaf.
Tilurð verksins var beiðni þáverandi Póst- og símamálastjórnar 1996 um úttekt á botnlögun og botnstraumum á umræddu svæði, einkum meðfram austur-, norður- og vesturmörkum þess. Um þær slóðir liggur neðansjávar-strengur milli Evrópu og Norður-Ameríku - CANTAT 3 - en hann hafði bilað eða rofnað á nokkrum stöðum. Var því leitað leiða til að skýra þessar bilanir m.a. að hve miklu leyti mætti kenna straumum og botnlögun eða lands-lagi um skemmdirnar, og þá að leita úrbóta á vandanum.
Í þessu yfirliti er gerð grein fyrir helstu einkennum botnlögunar á svæðinu og þá einkum á slóðum umrædds neðansjávarstrengs á ytri mörkum Suðurdjúps í austri, norðri og vestri. Síðan er helstu sjógerðum og útbreiðslusvæðum þeirra lýst. Þær eru hlýi Atlantssjórinn að sunnan í efstu 1000-1500 metrunum, millilög vestan úr Labrador- og Grænlandshafi (Irminger Sea) og botnsjór norðan úr hafi sem streymir suður yfir neðansjávarhryggina, „Overflow” svokallað. Í Suðurdjúpi er djúpstraumur sem streymir vestan úr Labrador- og Grænlandshafi um skörð í Reykjaneshrygg yfir í Suðurdjúp, og botnstraumur sem flæðir um Færeyjaála og yfir Íslands-Færeyjahrygg í Suðurdjúp með rótum íslensku landgrunnshlíðanna og síðan suður með Reykjaneshrygg og þaðan yfir hrygginn vestur í Grænlandshaf. Því næst er lýst niðurstöðum beinna straummælinga á slóðinni, einkum þá djúpt með nyrðri mörkum hennar. Þær niðurstöður sýna yfirleitt straumhraða á bilinu 20-50 cm sek-1 eða allt að einum hnúti með straumstefnu vestur á bóginn og tekur mið af hryggjum og skörðum.
Að lokum er hugað að orsök bilana á strengnum CANTAT-3. Því má velta fyrir sér hvort orsakirnar séu t.d. eðjustraumar niður brattar hlíðar landgrunnshalla og neðansjávarhryggja eða jafnvel togveiðar. En þar sem bilanirnar voru djúpt á slóðum neðansjávarhryggja þá berast böndin þó fremur að titringi strengs og núningi þar sem strengurinn liggur þvert á brattar hlíðarnar og er líklegur til að vera fremur slakur og/eða jafnvel svífa laus ofar botni. Tillaga til úrbóta er að forðast slíka slóð af fremsta megni og jafnframt að huga vel að því hvernig strengurinn leggst á hafsbotninn. Eftir sem áður þarf einnig að huga að togslóðum fiskiskipa.

The Iceland Basin
6
The Iceland Basin
7
1 Introduction
This report is an overview of physical conditions including bathymetry and bottom topography, water masses and circulation in the oceanic area south of Iceland, an area named the Iceland Basin. The overview was originally prepared in 1996 following a request by the Icelandic Post and Telephone Services, because of failures in the submarine cable CANTAT-3 between North America and Europe (Fig. 1). Later on the CANTAT-3 submarine cable was relayed at some other location farther south off the Icelandic coast with a longer outlier to the Vestmannaeyjar Islands.
There may be some a broader interest for the outlined physical features of the Iceland Basin. Therefore the manuscript mentioned above is made accessible with some amend-ments.
2 Bottom Topography
2.1 The Iceland Basin
The ocean areas around Iceland are the Irminger Sea to the west, the Iceland Sea to the north, the Norwegian Sea to the east, and the Iceland Basin to the south (Fig. 2; Hansen and Østerhus 2000). The Irminger Sea and the Iceland Basin are the northern-most regions of the North Atlantic Ocean, and the Iceland and Norwegian Seas are the southern regions of the “intracontinental or arctic” mediterranean seas consisting of the Arctic and Nordic Seas.
The boundaries between these oceanic regions are several submarine ridges. These ridges are the Reykjanes Ridge and Green-land-Iceland Ridges to the west of Iceland, and the Jan Mayen and Iceland-Faroe Ridge to the east of Iceland.
The Iceland Basin with depths exceeding 2000 m is bordered by the Reykjanes Ridge in the northwest with depths less than 1000 m, by the Icelandic margin in the north, and the Iceland-Faroe Ridge in the northeast with depths less than 500 m (Fig. 3). To the south-east the Basin is bordered by several banks such as the Faroe Bank (100 m), the Bill Bailey Bank (50-100 m), the Lousy Bank (200 m), the Georg Bligh Bank (500 m) and the Hatton (500-1000 m) and
Rockall Banks, the latter reaching to the surface as the Rockall itself. The Iceland Basin can be considered as a separate oceanographic reg-ion of the North-east North Atlantic Ocean.
2.2 The Reykjanes Ridge
The Reykjanes Ridge is the part of the Mid-Atlantic Ridge extending from Iceland about 300-400 nm to the southwest into the North Atlantic, and even 600 nm in the extreme form as the South Reykjanes Ridge. The ridge separates depths of 2000-3000 m on each side. It is distinguished by the 1000 m and 2000 m depth contours (Figs. 2 and 3). The ridge system is extremely irregular and rough, being an active volcanic rift system and earthquake zone (Fig. 4; Ulrich 1963). At about 57°N and 52-53°N fracture zones cross the ridge (Bight and Charlie-Gibbs Fracture Zones) with sill depths of about 2000-2500 and about 3500 m respect-ively (see Figs. 2 and 40; Hansen and Østerhus 2000, Garner 1972). The ridge system is a natural boundary between differ-ent water masses of the North East Atlantic Drift and the Irminger Sea. It also plays an important role regarding deep and near-bottom currents (Figs. 19 and 20; Malmberg 1985, Anon. 1995).
2.3 The Iceland-Faroe Ridge
The Iceland-Faroe Ridge is a part of the Greenland-Scotland Ridge separateing the Nordic Seas and the North Atlantic (Figs. 2 and 3). It separates depths of more than 2000 m on both sides and it is a natural boundary between relatively warm Northeast Atlantic Water and cold Subarctic water masses. In the shallowest part of the Iceland-Faroe Ridge, outside the continental shelf areas off Iceland and the Faroes, depths less than 300 m are found (Rosengarten and Thorsbanki). The deepest areas are again found just off the shelves. There the treshold depths are 430 m off Iceland and 470 m off the Faroes (Fig. 26; Hansen and Meincke 1979). The morphological features on the southwest side of the ridge are more complex than on the northeastern side, presumably due to strong overflowing bottom currents, though by far not as complex as on the Reykjanes Ridge.

The Iceland Basin
8
2.4 Iceland
Iceland is located at the crossing of the two above mentioned ridges, the Mid-Atlantic Ridge and the Greenland-Scotland Ridge. Its southern shores are very smooth and sandy were run-off and sedimentation arrive into the sea with the many rivers mostly fed by glaciers. Off the coast is a continental shelf with its many valleys or deeps between banks formed by water and sediment transport as well as of diluvial ice masses (Figs. 3, 5; for location see Fig. 6; Malmberg and Magnússon 1982, Malmberg 1961, 1962). The shelf edge is found at about 200 m depth (Figs. 7 and 8; Malmberg 1961, Malmberg and Magnússon 1982), but its seawards extension varies from between 50 nm in the eastern and western parts and about 10 nm off the mid-south coast. The mean slope of the shelf out to 200 m is calculated to be 0°08,6' and 0°52,6' respect-ively.
2.5 Continental slope, rise and deep sea floor
At the shelf break at about 200 m depth off the south coast of Iceland a steep canyon embedded continental slope takes over down to 1000 m depth at the foot of the contin-ental terrace (Figs. 3, 7 and 8). From there depths of the continental rise and deep sea floor increase slowly farther off into the Iceland Basin to 2-3000 m depths. Note-worthy are the sediment ridges extending southwards from the mid of the Icelandic south coast, i.e. the Katla Ridges (Figs. 3, 9 and 10) as defined by the author (Malmberg 1974) The Katla Ridges are distinguished by the 1000-1800 m depth contours. They have an elevation above the surrounding bottom or trenches of about 500-800 m extending as far south as to 62°N. The steepness of the continental slope off South-Iceland is differ-ent from place to place and greatest off the southeast coast or up to 12° (Fig. 8; Malm-berg 1961).
3 Water masses
The main water masses in the Iceland Basin are the following: a) North Atlantic Water with different
regional hydrographic properties found in the uppermost 1000-1500 m in the Iceland Basin proper (Figs. 11-15;
Malmberg 1961, 1962, Malmberg and Magnússon 1982, Blindheim et al. 1996). Depending on origin and degree of mixing and entrainment with other water masses it has salinities above 35 and up to 35.4, and temperatures of 5-9°C. The highest values are found in the eastern part of the Basin, and the lowest in the western part, there the water mass is named Modified Atlantic Water (Fig. 16).
b) Labrador Sea Water is a deep intermed-iate water mass formed in the Labrador Sea and to some extend in the Irminger Sea, spreading from there across the Mid-Atlantic Ridge through the fracture zones into the Iceland Basin at about 1000-1500 m depth (Figs. 11, 13, 14, 15, 17, 18 and 20; Malmberg 1974, de Boer and v. Aken 1995, Anon. 1995, Blindheim et al. 1996). The characteristic values of the hydrographic parameters are variable or 3-4°C in temperature and 34.90-34.95 in salinity. This water mass occurs as an intermediate deep water in the Iceland Basin and even as bottom water below 1000 m along the continental rise south of Iceland, at least in the region of the Katla Ridges (Fig. 17).
c) Iceland-Scotland Overflow Water from the Nordic Seas flows across the Iceland-Scotland Ridge into the Iceland Basin. It includes water mainly of two different origins. First to mention is the Norweg-ian Sea Deep Water (t<0°C, salinity 34.9) flowing through the Faroe-Shetland and Faroe Bank Channels, the latter with a sill depth of 840 m; and secondly as variable intermediate water masses flow-ing above the Norwegian Sea Deep Water and across the Iceland-Faroe Ridge (temperature 0-3°C; salinity 34.7-34.9). When reaching the Iceland Basin these water masses, which flow west-wards along the roots and rise of the Icelandic continental terrace below 1500 m depth, reveal temperatures of 2-3°C and salinities just below 35 (Figs. 11-15, 17). The vertical distribution of the different
water masses in the Iceland Basin is shown in a N-S section along 20°W extending from Iceland to 60°N on Figure 18 (de Boer and v. Aken 1995).

The Iceland Basin
9
4 Circulation
Three different current systems are most pronounced in the Iceland Basin and adja-cent ocean areas (Figs. 19 and 20; Malmberg 1985, Anon. 1995). These are the north-wards flowing warm water of the North-East Atlantic Drift in the uppermost 1000-2000 m of the Iceland Basin; an intermediate or deep flow from the Labrador and Irminger Seas in the west across the Mid-Atlantic or Reykja-nes Ridge into the Iceland Basin at 1200-1500 m depth; and a near-bottom flow mainly consisting of cold water from the north crossing the submarine ridges between Greenland and Scotland, i.e. the socalled overflow. These overflows and their path-ways are very much depending on the sub-marine ridges, i.e. passes and fracture zones, as well as on other topographic features in the different areas. Thus the main flow of Norwegian Sea Deep Water into the Iceland Basin occurs between the Faroes and the Faroe Bank where the deepest part of the Iceland-Scotland Ridge is found (840 m). From there the overflow water flows as bottom current northwards along the Iceland-Faroe Ridge and further westwards, with an additional flow directly across the ridge at upper levels (Fig. 22; Joseph 1967), into the waters south of Iceland at 1000-2000 m depth. There the flow is mainly concentrated along the Icelandic continental rise and foot of the slope. This westward flow south of Iceland is influenced by the deepest part of the Katla Ridges. Farther uphill to about 1200 m depth, Labrador or Irminger Sea Water may be found at near-bottom, at least occasionally (Fig. 17; Malmberg 1974). Farther west the bottom current bends to the south again along the Reykjanes Ridge until it reaches the Charlie-Gibbs Fracture Zone at 52-53°N and the Bight Fracture Zone at 56°N, where it crosses the Mid-Atlantic Ridge into the Irminger Sea. From there again the bottom flow bends northwards along the Mid-Atlantic Ridge until it, in the northern Irminger Sea, again bends westwards and southwards along the East-Greenland con-tinental slope and rise. There it joins the bottom overflow from the north through the Denmark Strait (sill depth 620 m). Together, these overflows, the Denmark Strait Over-flow and the Faroe Bank Channel as well as
the Iceland-Faroe Ridge overflow contri-bute to the deep water of the Northwestern Atlantic.
5 Direct current measurements
Following are outlined some results of direct current measurements in the Iceland Basin. The main areas of relevance in this review are a) along the Iceland-Faroe Ridge, not least just southeast of Iceland; b) in the area south of Iceland especially around the Katla Ridges; and c) along the Reykjanes Ridge as far south as to Charlie-Gibbs Fracture Zone and further through the fracture zone itself.
During the times in the latter half of the 20th century some effort was made to measure ocean currents in the Iceland Basin directly. Special attention was paid to observations of the deep overflows across the submarine ridges, but some data are also available from the slope south of Iceland, mainly around the Katla Ridges.
In summer 1960 some direct current measurements were carried out on and along the Iceland-Faroe Ridge during the so-called "Overflow '60 Project" of the International Council for the Exploration of the Sea (ICES). The results are shown in Figs. 21 and 22 (Joseph 1967). The near-surface layer at 20 m depth southeast of Iceland revealed a NE-wards flow of North Atlantic Water of about 40 cm s-1. The deep overflow at the same location showed up with strong currents of 20-30 cm s-1 now with south-westerly direction. Relatively strong currents, both near-surface and near-bottom were also observed farther south on the ridge.
In summer 1973 direct current measure-ments were again carried out in the Iceland-Faroe Ridge region in the so-called "Over-flow '73 Project" of ICES. The results are shown in Figs. 23-26 (Koltermann et al. 1976, Ross and Meincke 1976, Hansen and Meincke 1979). Again the deep overflow across the Iceland-Faroe Ridge and along the ridge showed up with strong currents periodically up to 50 cm s-1, but 10-25 cm s-1
in general. The component to the NE or inflowing North Atlantic Water at 250 m depth southeast of Iceland was also revealed (Fig. 24).

The Iceland Basin
10
During the years 1989-1992 some investigations on behalf of the NATO Saclant Research Centre in Italy were carried out in the area east of Iceland. Some results from direct current measurements are shown in Figs. 27 and 28 (Perkins et al. 1996). The deep overflow again revealed strong and relatively stable currents of about 50 cm s-1 with a southwesterly direction, but less strong northerly flow of the North Atlantic Water in the upper layers (Fig. 28).
Summarized, direct current measure-ments in the Iceland-Faroe Ridge region reveal more or less constant strong bottom currents across and along the ridge into the Iceland Basin of 20-50 cm s-1.
During the years 1990-1991 seven current meter moorings were deployed in the Iceland Basin east of the Katla Ridges. The locations and results are shown in Figs. 29 and 30 (Saunders 1996). It is evident that the flow is intensified and confined to the bottom depth range of 1300-2100 m, with current vectors westwards along the depth contours of up to 20-30 cm s-1.
Some direct current measurements were carried out from six mooring stations in the Katla Ridges area in 1997 on the slope a little to the west of the easternmost Katla Ridge. The results are shown in Fig. 31 (Shore 1978). The flow was confined to the bottom features with maximum velocities of about 20 cm s-1 towards the west found near-bottom at 1400-1800 m depths.
Observations carried out in 1991 in the western valley or the Reynis Canyon west of the Katla Ridges at around 2000 m depth are shown in Figs. 32 and 33 (van Aken 1995). The near-bottom flow was also here found along the depth contours with a velocity up to 20 cm s-1 in a southwesterly direction.
Summarized, direct current measure-ments in the area south of Iceland show more or less constant near-bottom currents of up to 20-30 cm s-1 in westerly/south-westerly direction. The flow is confined to the upper rise and the foot of the continental terrace at depths of 1300-2000 m. At deeper levels further offshore the velocities de-crease and directions become more variable.
Along the eastern slopes of the Reykjanes Ridge or Mid-Atlantic Ridge no near-bottom current meter data seem to be available, only hydrographic data showing the different water masses including over-
flow water in the near-bottom layers (Fig. 15; Blindheim et al. 1996).
6. Charlie-Gibbs Fracture Zone
Finally several attempts have been made to measure the deep and near-bottom flow below 2000 m across the Reykjanes Ridge through the Charlie-Gibbs Fracture Zone (Figs. 34-41; Saunders 1994, Shore et al. 1976, Dickson et al. 1980, Garner 1972). No data seems to be available from the over-laying eastwards flow of the Labrador or Irminger Sea water (Fig. 20; Anon. 1995). In this very complicated area with two separated throughs, a northern and southern one of more than 3000 to 4000 m depths, the observed deep and near-bottom currents were more variable than those in the Iceland Basin and in the Iceland-Faroe Ridge area. The obtained velocity mean values of the currents are frequently only a few cm s-1 (Figs. 38, 41 and Table 1), but the variations are from 0 cm s-1 to 20 cm s-1 or more. In general, the deep flow of the Iceland-Scotland Overflow Water at 2500-3000 m depth is westwards from the Iceland Basin into the Irminger Sea. This is especially so in the northern through (Figs. 38, 39, 41) but also an eastwards flow is obtained on the southern slopes of the through and in the deep of the southern through (Figs. 39 and 41). There even the westwards and east-wards transports are in balance (Table 1. Last column; Dickson et al. 1980).
7 Conclusions
When the failure sites or faults in the subsurface CANTAT-3 communication cable (Fig. 1; Jónsson Icelandic Post and Telephone Services, personal communicat-ion) are compared with the bottom topography in the Iceland Basin it is evident that the failures were concentrated around areas of relatively rough bottom topography in the Iceland-Faroe Ridge area, the Katla Ridge area and the Charlie-Gibbs Fracture Zone area (Fig. 1).
Thus turbidity currents downhill the continental slope and submarine ridges and even trawl fisheries, seem not to be involved in the faults and neither current velocity alone. But as the failures were located in deep waters and limited to the regions of the different submarine ridges, it is considered

The Iceland Basin
11
that they may presumably be due to vibration of the cable induced by strong bottom currents along the depth contours, and then chafe faults and abrasion (Eales 1996).
8 Acknowledgement
Due thanks to prof. Steingrímur Jónsson, dr. Ólafur S. Ástþórsson and dr. Karl
Gunnarsson for their review of the paper and many valuable advices, as well as to secre-tary Sigurborg Jóhannsdóttir for preparing the manuscript including figures for publication.
Table 1. Selected hourly current means and maximum scalar speed, and daily means-vectors and directions,
common 247 day duration - from moorings in the southern trough of the Charlie-Gibbs Fracture Zone; 1977-1978. For location see Figs. 36 and 37. From Dickson et al. 1980.
Valin klukkustunda meðaltöl straums og hámark straums, og dagleg meðalgildi -vektorar og
stefnur- frá syðra Charlie-Gibbs skarði; 1977-1978. Mælistaðir eru sýndir á 37. og 38. mynd. (Dickson o.fl. 1980).
Depth Number of
obs. Mean speed scalar cm s-1
Max speed cm s-1
Mean speed vector cm s-1
Mean Direction (°)
AU 2500 6001 4.94 25.0 0.57 36 AB 3000 6001 3.40 13.5 0.82 291 BU 2977 6074 7.56 30.9 1.63 93 BB 3977 6075 6.06 27.5 3.36 263 CP 3527 6002 4.62 20.5 2.71 101
References Anon. 1995. Förderungsantrag 1996-1999. Sonder-
forschungsbereich 1561. "Dynamik Thermohaline Zirculationsschwankungen". Christian-Albrechts-Universität Kiel. 380 pp.
Blindheim, J., E. Buch, E. Fogelqvist, T. Tanhua, and S. Østerhus. 1996. The RV. Johan Hjort 1994 NORDIC WOCE cruise; on Hydrography and Tracers. ICES. CM 1996/O: 20, 28pp.
de Boer, J.C. and H.van Aken 1995. A study of Objective Methods for Water Mass Analysis, Applied to the Iceland Basin. Deutsche Hydr. Zeitschr. 47(1): 5-22.
Dickson, R.R., P.A. Gurbutt and K.J. Medler 1980. Long-term water movements in the Southern Trough of the Charlie-Gibbs Fracture Zone. Journal Marine Research 38: 571-583.
Eales, B.A. 1996. The occurrance of chafe damage to submarine cables in deep ocean situations (CANTAT-3). ALCATEL Submarine Network. Technical Directorate IPR and Technical Support, Greenwich, 12pp, add. 10 Figs. and 2 Tables.
Garner, D.M. 1972. Flow through the Charlie-Gibbs Fracture Zone, Mid-Atlantic Ridge. Canadian Journal of Earth Sciences 9: 115-121.
Hansen, B. and J. Meincke 1979. Eddies and meanders in the Iceland-Faroe Ridge area. Deep Sea Research 26A: 1067-1082.
Hansen B. and S. Østerhus 2000. North Atlantic-Nordic Seas Ecxhanges. Progress in Oceanography 45: 109-208.
Joseph, J. 1967. Current Measurements during the International Iceland-Faroe Ridge Expeditions, 30. May to 18. June 1960. Rapp.-Proc verb. Réunions 157: 157-183.
Koltermann, K.P., J. Meincke and T. Müller 1976. Overflow '73 - Data Report "Meteor" and "Meerkatze 2". Overflow ’73 Contrib. 11. Christian-Albrechts-Universität Kiel, 88 pp.
Malmberg, S.A. 1961. Schictung und Zirculation in den Südisländischen Gewässern. Diss. Erl. Doktorswürde der Hohen Philosophischen Fakultät der Christian-Albrechts-Universität zu Kiel, 68 pp.
Malmberg, S.A. 1962. Schictung und Zirculation in den Südisländischen Gewässern. Kieler Meeresforschungen 18: 3-28.
Malmberg S.A. 1974. A note on the Deep Water South of Iceland - "Overflow '73". ICES CM 1974/C: 32, 14 pp.
Malmberg, S.A. 1985. Sjórannsóknir í kjölfar Eiríks og Leifs við Grænland og í Labradorhafi í október og nóvember 1984. Ægir 78: 368-374.
Malmberg, S.A. and G. Magnússon 1982. Sea Surface Temperature and Salinity in South Icelandic Waters in the period 1868-1965. Rit Fiskideildar 6(3): 1-31.
Perkins, H., T.S. Hopkins, S.A. Malmberg, P.M. Poulain and A. Warn-Varnas 1996.

The Iceland Basin
12
Oceanographic Conditions east of Iceland. Journal of Geophysical Research C, Oceans 103: 21531-21542.
Ross, C.K. and J. Meincke 1976. Near-bottom Current Vectors observed during the ICES Overflow ’73. Experiment: August-September 1973. Data series/ BI-D-79-8. Bedford Inst. of Oceanogr. Dartmouth, 39 pp.
Saunders, P.M. 1994. The Flux of overflow water through the Charlie-Gibbs Fracture Zone. Journal of Geophysical Research C, Oceans 99: 12343-12355.
Saunders, P.M. 1996. The Flux of Dense Cold Overflow Water Southeast of Iceland. Journal of Physical Oceanography 26: 85-95.
Shore, A. 1978. Bottom Currents on East Katla Ridge, NW Iceland Basin. ICES CM 1978/C:60, 20 pp.
Shore, A., P. Lonsdale, C. Hollister and D. Spenser 1976. Charlie-Gibbs Fracture Zone; Bottom Water Transport and its Geological Effects 1980. Deep Sea Research 27: 325-345.
Ulrich, J. 1963. Der Formenschats des Meeresbodens. Geogr. Rundschau 15, 136-148.
van Aken, H. 1995. Mean Currents and Current Variability in the Iceland Basin. Netherlands Journal of Sea Research 33: 135-145.

The Iceland Basin
13
Figures
Figure 1. The location of the submarine cable CANTAT-3 and where it failed (Páll Jónsson, Póstur og
Sími. Icel. Post and Telephone Service. Personal communication). 1. mynd. Lega neðansjávar strengsins CANTAT-3 og bilunarstaðir hans (Páll Jónsson, Póstur og Sími,
munnlegar upplýsingar).
Figure 2. Bathymetry and nomenclature of the northern North Atlantic and Nordic Seas. Areas shallower
than 500 m are lightly shaded (Hansen and Østerhus 2000). 2. mynd. Dýpi og örnefni á norðanverðu Norður-Atlantshafi og í Norðurhafi. Dýpi minna en 500 m er
skyggt (Hansen og Østerhus 2000).

The Iceland Basin
14
Figure 3. Iceland and adjacent waters to the South - bathymetry and nomenclature (Malmberg and
Magnússon 1982). The frame is showing the study area in the referred paper. 3. mynd. Ísland og aðliggjandi hafsvæði í suðri - dýpi og örnefni (Malmberg og Magnússon 1982).
Ramminn sýnir athugunarsvæði í tilvitnaðri grein.
Figure 4. A section across the Reykjanes Ridge at 57.5°N (Ulrich 1963). 4. mynd. Dýptarsnið yfir Reykjaneshrygg á 57°5'N (Ulrich 1963).

The Iceland Basin
15
Figure 5. Depth profiles across two sub-marine valleys on the South Icelandic shelf, Hornafjardar (E-III)
and Breidamerkur (E-II) Deeps. For location see Fig. 6 (Malmberg 1961). 5. mynd. Dýptarsnið yfir tvo neðansjávardali á íslenska landgrunninu Sunnanlands, Hornafjarðar (E-III)
og Breiðamerkur (E-II) djúp. Sjá staði á 6. mynd (Malmberg 1961).
Figure 6. Location of sections used (Malmberg 1961, 1962). 6. mynd. Lega lóðréttra sniða til umræðu (Malmberg 1961, 1962).

The Iceland Basin
16
Figure 7. A section perpendicular to the South Icelandic shelf. For location see Fig. 6, E-I (Malmberg
1961). 7. mynd. Dýptarsnið þvert á suðurströnd Íslands. Lega er sýnd á 6. mynd, E-I (Malmberg 1961).
Figure 8. A section perpendicular to the South Icelandic shelf. For location see Fig. 6, E-IV (Malmberg
1961). 8. mynd. Dýptarsnið þvert á suðurströnd Íslands. Lega er sýnd á 6. mynd, E-IV (Malmberg 1961).

The Iceland Basin
17
Figure 9. Depth contours and location of hydrographic stations in the Katla Ridges area south of Iceland
(Malmberg 1974). Information on currents (Shore 1978, Saunders 1996; Figs. 29 and 31) and location of the sub-marine cable CANTAT-3 together with failure 2 (Fig.1) are also shown.
9. mynd. Dýpi og mælistaðir hita og seltu við Kötluhryggi út af suðurströnd Íslands (Malmberg 1974)
ásamt upplýsingum um botnstrauma (Shore 1978, Saunders 1996; 29. og 31. mynd) og legu neðansjávarstrengsins CANTAT-3 sem og bilunarstaður 2. Sjá 1. mynd.
Figure 10. A depth profile across the Katla Ridges. For location see Fig. 9 (Malmberg 1974). 10. mynd. Dýptarsnið yfir Kötluhryggi. Lega er sýnd á 9. mynd (Malmberg 1974).

The Iceland Basin
18
Figure 11. Temperature and salinity sections in South Icelandic waters; August 1958. For location see Fig. 6
(Malmberg 1961, 1962). 11. mynd. Lóðrétt hita- og seltusnið í Suðurdjúpi í ágúst 1958. Lega er sýnd á 6. mynd (Malmberg 1961,
1962).
The Iceland Basin
19
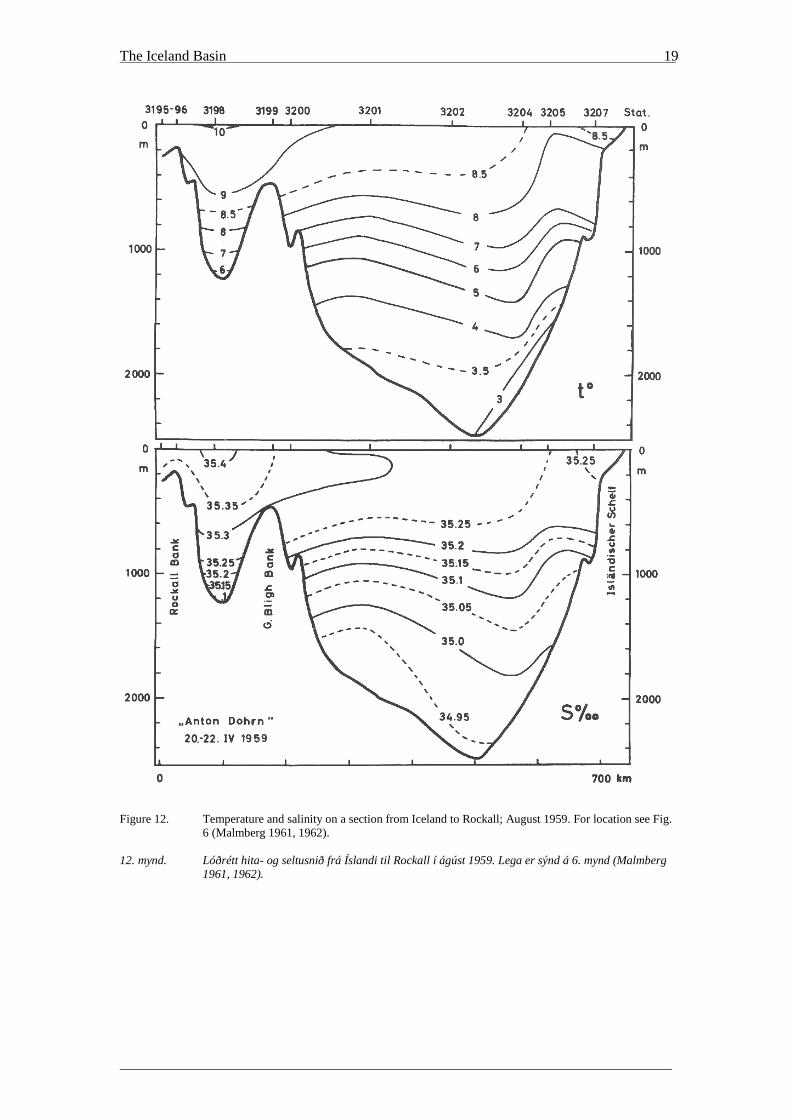
Figure 12. Temperature and salinity on a section from Iceland to Rockall; August 1959. For location see Fig. 6 (Malmberg 1961, 1962).
12. mynd. Lóðrétt hita- og seltusnið frá Íslandi til Rockall í ágúst 1959. Lega er sýnd á 6. mynd (Malmberg
1961, 1962).

The Iceland Basin
20
Figure 13. Salinity and temperature on a section across the Iceland-Faroe Ridge; July-August 1994 (Blindheim et al. 1996).
13. mynd. Lóðrétt seltu- og hitasnið yfir Íslands-Færeyjahrygg í júlí/ágúst 1994 (Blindheim og fél. 1996).

The Iceland Basin
21
Figure 14. Salinity and temperature sections in the Iceland Basin Proper; July-August 1994 (Blindheim et al.
1996). 14. mynd. Lóðrétt seltu- og hitasnið í Suðurdjúpi í júlí/ágúst 1994 (Blindheim og fél. 1996).

The Iceland Basin
22
Figure 15. Salinity and temperature sections in the western part of the Iceland Basin; July-August 1994
(Blindheim et al. 1996). 15. mynd. Lóðrétt seltu- og hitasnið í vesturhluta Suðurdjúps í júlí/ágúst 1994 (Blindheim og fél. 1996).

The Iceland Basin
23
Figure 16. A W-E salinity and temperature sections (0-200 m) along 63°N through the Iceland Basin from the western slope of the Reykjanes Ridge to southeast of Iceland in spring 1996 (Malmberg, unpublished).
16. mynd. Lóðrétt vestur/austur seltu- og hitasnið, 0-200 m, vorið 1996 í Suðurdjúpi eftir 63°N, nánar frá
vesturhlíðum Reykjaneshryggjar, yfir hrygginn til austurs í Suðurdjúp austur á móts við SA-strönd Íslands (Malmberg, óbirt).

The Iceland Basin
24
Figure 17. a) Temperature section across the Katla Ridges; August 1973. For location see Fig. 9 (Malmberg 1974). 17 mynd a). Lóðrétt V-A hitasnið yfir Kötluhryggi í ágúst 1973. Lega er sýnd á 9. mynd (Malmberg 1974).

The Iceland Basin
25
Figure 17. b) Salinity section across the Katla Ridges; August 1973. For location see Fig. 9 (Malmberg 1974). 17 mynd b). Lóðrétt V-A seltusnið yfir Kötluhryggi í ágúst 1973. Lega er sýnd á 9. mynd (Malmberg 1974).

The Iceland Basin
26
Figure 18. Positions of cores of water masses in a section in the Iceland Basin. SPMW/IW LSW ISOW LDW
: North Atlantic Water : Labrador Sea Water. : Iceland-Scotland Overflow Water. : Antarctic Water (de Boer and van Aken 1995).
18. mynd. Kjarnar sjógerða á N-S lóðréttu sniði á 20°V í Suðurdjúpi í apríl 1991. SPMW/IW LDW ISOW LDW
: Atlantískur hlýsjór : Labrador sjór : Kaldur Overflow botnsjór, sem streymir yfir Íslands-Færeyjahrygg og um Færeyjasund úr Norðurhafi. : Kaldur Suðurskautssjór. (de Boer og van Aken 1995).

The Iceland Basin
27
Figure 19. General ocean circulation, both in near-surface as in deep and bottom
layers in the seas around Iceland, Greenland and Labrador. ����������-surface circulation.
--> cold near-surface circulation. ···> deep and near-bottom circulation.
(Malmberg 1985). 19. mynd. Meginstaumar, bæði grunnt og djúpt, í hafinu við Ísland, Grænland og Labrador.
�������������ðssjór (Atlantssjór). --> kaldur yfirborðssjór (Pólsjór). ···> djúp og botnsjór (Labrador og Overflow sjór).
(Malmberg 1985).
Figure 20. General deep circulation in the northern North Atlantic, convection areas (K) and cold surface
currents off Greenland and Labrador (Anon 1995). 20. mynd. Megindjúpstraumar nyrst í Norður-Atlantshafi, (m.a. Labrador og Overflow sjór) og kaldir
yfirborðsstraumar (Pólsjór) við Grænland og Labrador. (Anon 1995).

The Iceland Basin
28
Figure 21. Residual currents 9.-12.6. and 17.-18.6. 1960 at different depths and locations on the Iceland Faroe Ridge. ICES Overflow Project, June 1960 (Joseph 1967).
21. mynd. Endanlegur meðalstraumur 9.-12.6 og 17.-18.6.1960 á mismunandi stöðum og dýpi á Íslands-
Færeyjahrygg. ICES Overflow verkefni í júní 1960 (Joseph 1967).

The Iceland Basin
29
Figure 22. Cores of main overflow branches across and along the Iceland-Faroe Ridge. ICES Overflow Project, June 1960 (Joseph 1967).
22. mynd. Meginferlar botnstraums yfir og meðfram Íslands-Færeyjahrygg. ICES Overflow verkefni í júní
1960 (Joseph 1967).
Figure 23. Location of stations, Iceland-Faroe Ridge. ICES Overflow Project August-September 1973 (Koltermann et al. 1976).
23. mynd. Mælistaðir straummælinga á Íslands-Færeyjahrygg. ICES Overflow verkefni í ágúst-september
1973 (Koltermann og fél. 1976).

The Iceland Basin
30
Figure 24. Progressive current vectors at stations 85 (to the left) and BS4 (three vectors to the right), Iceland Faroe Ridge. ICES Overflow Project August-September 1973. For locations see Fig. 23 (Koltermann et al. 1976).
24. mynd. Framskreiðir straumvektorar á stöðvum 85 (lengst t.v.) og BS4 (þrír ferlar t.h.) í ágúst-september
1973. Staðir sýndir á 23. mynd. ICES Overflow verkefni (Koltermann og fél. 1976).

The Iceland Basin
31
Figure 25. Chosen examples of near-bottom currents from the ICES Overflow August-September 1973
Project in the Iceland-Faroe Ridge area (Ross and Meincke 1976). 25. mynd. Valin dæmi um botnlæga strauma á Íslands-Færeyjahrygg. ICES Overflow verkefni í ágúst-
september 1973 (Ross og Meincke 1976).

The Iceland Basin
32
Figure 26. Bathymetry, and scheme of velocities (cm s-1) of near-bottom currents in the Iceland-Faroe Ridge area. ICES Overflow Project, August-September 1973 (Hansen and Meincke 1979).
26. mynd. Dýpi og botnlægir straumar (cm sek-1) á Íslands-Færeyjahrygg. ICES Overflow verkefni í ágúst-
september 1973 (Hansen og Meincke 1979).
Figure 27. Mean currents and variance ellipses some 50 m above the bottom east and southeast of Iceland,
SACLANT 1989-1992 (Perkins et al. 1996). 27. mynd. Meðalstraumur 50 m frá botni fyrir Suðaustur- og Austurlandi. SACLANT verkefni 1989-1992
(Perkins og fél. 1996).

The Iceland Basin
33
VELOCITY (cm s-1) VVV
Figure 28. Time-series of current vectors at site x at different depths southeast of Iceland. SACLANT 1989-1992. For location see Figure 27 (Perkins et al. 1996).
28. mynd. Tímaseríur straumvektora 1991-1992 á mismunandi dýpi á stöð x sunnan í rennunni fyrir
Suðausturlandi á Íslands-Færeyjahrygg. Mælistaður er sýndur á 27. mynd. SACLANT verkefni 1989-1992 (Perkins og fél. 1996).

The Iceland Basin
34
Figure 29. Current meter stations and mean near-bottom currents in 1990-1991 in South Icelandic waters.
Largest current vector is 20 cm/s. (Saunders 1996). 29. mynd. Mælistaðir straums og meðal botnlægir straumar í Suðurdjúpi 1990-1991. Mesti straumvektor er
20 cm/s. (Saunders 1996).
Figure 30. Time series of current vectors 10 m above the bottom in 1990-1991 on stations with increasing
depth southwards from Iceland shown in Fig. 29. Downward on the Figure represents 240° (Saunders 1996).
31. mynd. Tímaseríur straumvektora 10 m frá botni 1990-1991. Lóðrétt stefna niðurávið samsvarar 240°.
Mælistaðir eru sýndir á 29. mynd (Saunders 1996).

The Iceland Basin
35
Figure 31. Location of stations in summer 1977 in the Katla Ridges region south of Iceland and near-bottom
current velocity vectors (Shore 1978). 31. mynd. Mælistaðir hita og seltu sumarið 1977 á Kötluhryggjasvæðinu fyrir Suðurlandi og
straumvektorar botnlægra strauma (Shore 1978).

The Iceland Basin
36
Figure 32. Bathymetry, hydrographic stations and mooring stations (x) in the Iceland Basin 1990-1991 (van
Aken 1995). 32. mynd. Dýpi, hita-, seltu- og straummælingastaðir (X) í Suðurdjúpi 1990-1991 (van Aken 1995).
Figure 33. Mean current vectors from the lowest 200 m above the bottom (1990-1991) at the stations shown
in Fig. 33. Currents at 40 m from the bottom are marked with a cross (van Aken 1995). 33. mynd. Meðal straumvektorar frá neðstu 200 m frá botni, 1990-1991, á mælistöðum sýndum á 33. mynd.
Straumar 40 m frá botni eru markaðir með X (van Aken 1995).

The Iceland Basin
37
Figure 34. Bathymetry of the Charlie-Gibbs Fracture Zone. Contours are labelled in hundreds of meters and high ground is shaded. Mooring positions along 35°W (1988-1989) are indicated (Saunders 1994).
34. mynd. Dýpi á Charlie-Gibbs svæðinu í hundruðum metra ásamt nánari staðsetningu þess. Grynnstu
slóðir eru skyggðar. Straummælingastaðir á 35°V, 1988-1989, eru auðkenndir (Saunders 1994).
Figure 35. Bathymetry of the Charlie-Gibbs Fracture Zone (northern channel and partly southern channel).
High ground above 3000 m is shaded (Shore et al. 1976). 35. mynd. Dýpi á Charlie-Gibbs svæðinu - nyrðra skarðið og syðra skarðið að hluta. Dýpi minna en 3000 m
er skyggt. * eru hita- og seltumælingar og ���� ���ælingastaðir (Shore og fél. 1976).

The Iceland Basin
38
Figure 36. Bathymetry in the southern trough of the Charlie-Gibbs Fracture Zone, 1977-1978. Position of moorings A, B and C are shown by solid circles and the location of a detailed bathymetric transect along 30°59'W is also indicated (Dickson et al. 1980).
36. mynd. Dýpi og straummælingastaðir A, B og C á sniði í syðra skarði Charlie-Gibbs brota belti 1977-
1978 (Dickson og fél. 1980).
Figure 37. North-south bathymetric transect of the southern trough at 30°59'W with mooring positions and instrument depths superimposed (1977-1978). Locations of moorings are shown in Fig. 36 (Dickson et al. 1980).
37. mynd. Norður-suður dýptarsnið í syðra Charlie-Gibbs skarði ásamt straummælingaslóðunum A, B og C
(sbr. 36. mynd) og stöðu straummæla, 1977-1978 (Dickson og fél. 1980).

The Iceland Basin
39
Figure 38. Recorded mean east component, direct current measurements on a N-S section along 35°W
across the northern and southern valleys of the Charlie-Gibbs Fracture Zone 1988-1989. East is positive and West negative. The isohaline 34.94 is shown. For location see Fig. 34 (Saunders 1994).
38. mynd. Meðal austur þáttur straums á N-S sniði á 35° V yfir nyrðra og syðra skarð Charlie-Gibbs
brotabeltisins 1988-1989. Lega sniðsins er sýnd er á 34. mynd. Austur er pósitíft og vestur þá negatíft. Jafnseltulínan 34,94 er einnig sýnd (Saunders 1994).
Figure 39. Currents at 3000 m on 35°W; 1988-1989. The moorings are lettered and positioned according to latitude, (B North and H south) and the current vectors are rotated with north directed at the left margin. For location see Figs. 34 and 38 (Saunders 1994).
39. mynd. Straumvektorar (1988-1989) á 3000 dýpi á sniðinu 35°V (sjá 34. og 38. myndir).
Straummælingastaðirnir eru merktir bókstöfunum B-H og raðað eftir breidd staða. B er nyrst og H syðst. Straumvektorar sýna norður til vinstri (Saunders 1994).

The Iceland Basin
40
Figure 40. Bathymetry of the Charlie-Gibbs Fracture Zone, isobaths in km. Cross-hatching upwards to the left indicates areas shallower than 2 km, but upwards to the right areas deeper than 4 km. Current meter moorings (June 1970) were at sites A and B (Garner 1972).
40. mynd. Dýpi á Charlie-Gibbs svæðinu í km. Skástrik upp til vinstri sýna svæði grynnri en 2 km, en upp til
hægri svæði dýpri en 4 km. Straummælingastaðir - Júní 1970 - eru merktir A og B (Garner 1972).

The Iceland Basin
41
Figure 41. Current meter records, velocity and direction during seven days in June 1970, from the Charlie-Gibbs Fracture Zone, (a) northern channel, (b) southern channel. For location of moorings see Fig. 40. Full line upper meter 650 m above bottom, and broken line lower meter at 50 m above bottom (Garner 1972).
41. mynd. Niðurstöður straummælinga á stöðum A og B – í sjö daga í júní 1970 - (sjá 40. mynd), þ.e. hraði
og stefna í a) nyrðra Charlie-Gibbs skarði og b) syðra skarði. Heil lína sýnir mælingar 650 m frá botni en brotin lína mælingar 50 m frá botni (Garner 1972).
days of the year

_______________________________________________________________________________________________

_______________________________________________________________________________________________
Hafrannsóknastofnun. Fjölrit Marine Research Institute. Reports
Þessi listi er einnig á Netinu
(This list is also on the Internet)
http://www.hafro.is/Bokasafn/Timarit/fjolr.htm 1. Kjartan Thors, Þórdís Ólafsdóttir: Skýrsla um leit að
byggingarefnum í sjó við Austfirði sumarið 1975. Reykjavík 1975. 62 s. (Ófáanlegt - Out of print).
2. Kjartan Thors: Skýrsla um rannsóknir hafsbotnsins í sunnanverðum Faxaflóa sumarið 1975. Reykjavík 1977. 24 s.
3. Karl Gunnarsson, Konráð Þórisson: Áhrif skolpmengunar á fjöruþörunga í nágrenni Reykjavíkur. Reykjavík 1977. 19 s. (Ófáanlegt - Out of print).
4. Einar Jónsson: Meingunarrannsóknir í Skerjafirði. Áhrif frárennslis á botndýralíf. Reykjavík 1976. 26 s. (Ófáanlegt - Out of print).
5. Karl Gunnarsson, Konráð Þórisson: Stórþari á Breiðafirði. Reykjavík 1979. 53 s.
6. Karl Gunnarsson: Rannsóknir á hrossaþara (Laminaria digitata ) á Breiðafirði. 1. Hrossaþari við Fagurey. Reykjavík 1980. 17 s. (Ófáanlegt - Out of print ).
7. Einar Jónsson: Líffræðiathuganir á beitusmokk haustið 1979. Áfangaskýrsla. Reykjavík 1980. 22 s. (Ófáanlegt - Out of print).
8. Kjartan Thors: Botngerð á nokkrum hrygningarstöðvum síldarinnar. Reykjavík 1981. 25 s. (Ófáanlegt - Out of print).
9. Stefán S. Kristmannsson: Hitastig, selta og vatns- og seltubúskapur í Hvalfirði 1947-1978. Reykjavík 1983. 27 s.
10. Jón Ólafsson: Þungmálmar í kræklingi við Suðvestur-land. Reykjavík 1983. 50 s.
11. Nytjastofnar sjávar og umhverfisþættir 1987. Aflahorfur 1988. State of Marine Stocks and Environmental Conditions in Icelandic Waters 1987. Fishing Prospects 1988. Reykjavík 1987. 68 s. (Ófáanlegt - Out of print).
12. Haf- og fiskirannsóknir 1988-1992. Reykjavík 1988. 17 s. (Ófáanlegt - Out of print).
13. Ólafur K. Pálsson, Björn Æ. Steinarsson, Einar Jónsson, Gunnar Jónsson, Gunnar Stefánsson, Sigfús A. Schopka: Stofnmæling botnfiska á Íslandsmiðum. Reykjavík 1988. 76 s. (Ófáanlegt - Out of print).
14. Nytjastofnar sjávar og umhverfisþættir 1988. Aflahorfur 1989. State of Marine Stocks and Environmental Conditions in Icelandic Waters 1988. Fishing Prospects 1989. Reykjavík 1988. 126 s.
15. Ástand humar- og rækjustofna 1988. Aflahorfur 1989. Reykjavík 1988. 16 s.
16. Kjartan Thors, Jóhann Helgason: Jarðlög við Vestmannaeyjar. Áfangaskýrsla um jarðlagagreiningu og könnun neðansjávareldvarpa með endurvarpsmælingum. Reykjavík 1988. 41 s.
17. Stefán S. Kristmannsson: Sjávarhitamælingar við strendur Íslands 1987-1988. Reykjavík 1989. 102 s.
18. Stefán S. Kristmannsson, Svend-Aage Malmberg, Jóhannes Briem: Western Iceland Sea. Greenland Sea Project. CTD Data Report. Joint Danish-Icelandic Cruise R/V Bjarni Sæmundsson, September 1987. Reykjavík 1989. 181 s.
19. Nytjastofnar sjávar og umhverfisþættir 1989. Aflahorfur 1990. State of Marine Stocks and Environmental Conditions in Icelandic Waters 1989. Fishing Prospects 1990. Reykjavík 1989. 128 s. (Ófáanlegt - Out of print).
20. Sigfús A. Schopka, Björn Æ. Steinarsson, Einar Jónsson, Gunnar Jónsson, Gunnar Stefánsson, Ólafur K. Pálsson: Stofnmæling botnfiska á Íslandsmiðum 1989. Rannsóknaskýrsla. Reykjavík 1989. 54 s.
21. Nytjastofnar sjávar og umhverfisþættir 1990. Aflahorfur 1991. State of Marine Stocks and Environmental Conditions in Icelandic Waters 1990. Fishing prospects 1991. Reykjavík 1990. 145 s.
22. Gunnar Jónsson, Björn Æ. Steinarsson, Einar Jónsson, Gunnar Stefánsson, Ólafur K. Pálsson, Sigfús A. Schopka: Stofnmæling botnfiska á Íslandsmiðum 1990. Reykjavík 1990. 53 s. (Ófáanlegt - Out of print).
23. Stefán S. Kristmannsson, Svend-Aage Malmberg, Jóhannes Briem, Erik Buch: Western Iceland Sea - Greenland Sea Project - CTD Data Report. Joint Danish Icelandic Cruise R/V Bjarni Sæmundsson, September 1988. Reykjavík 1991. 84 s. (Ófáanlegt - Out of print).
24. Stefán S. Kristmannsson: Sjávarhitamælingar við strendur Íslands 1989-1990. Reykjavík 1991. 105 s. (Ófáanlegt - Out of print).
25. Nytjastofnar sjávar og umhverfisþættir 1991. Aflahorfur fiskveiðiárið 1991/92. State of Marine Stocks and Environmental Conditions in Icelandic Waters 1991. Prospects for the Quota Year 1991/92. Reykjavík 1991. 153 s. (Ófáanlegt - Out of print).
26. Páll Reynisson, Hjálmar Vilhjálmsson: Mælingar á stærð loðnustofnsins 1978-1991. Aðferðir og niðurstöður. Reykjavík 1991. 108 s.
27. Stefán S. Kristmannsson, Svend-Aage Malmberg, Jóhannes Briem, Erik Buch: Western Iceland Sea - Greenland Sea Project - CTD Data Report. Joint Danish Icelandic Cruise R/V Bjarni Sæmundsson, September 1989. Reykjavík 1991. Reykjavík 1991. 93 s.
28. Gunnar Stefánsson, Björn Æ. Steinarsson, Einar Jónsson, Gunnar Jónsson, Ólafur K. Pálsson, Sigfús A. Schopka: Stofnmæling botnfiska á Íslandsmiðum 1991. Rannsóknaskýrsla. Reykjavík 1991. 60 s.
29. Nytjastofnar sjávar og umhverfisþættir 1992. Aflahorfur fiskveiðiárið 1992/93. State of Marine Stocks and Environ-mental Conditions in Icelandic Waters 1992. Prospects for the Quota Year 1992/93. Reykjavík 1992. 147 s. (Ófáanlegt - Out of print).

_______________________________________________________________________________________________
30. Van Aken, Hendrik, Jóhannes Briem, Erik Buch, Stefán S. Kristmannsson, Svend-Aage Malmberg, Sven Ober: Western Iceland Sea. GSP Moored Current Meter Data Greenland - Jan Mayen and Denmark Strait September 1988 - September 1989. Reykjavík 1992. 177 s.
31. Björn Æ. Steinarsson, Einar Jónsson, Gunnar Jónsson, Gunnar Stefánsson, Ólafur K. Pálsson, Sigfús A. Schopka: Stofnmæling botnfiska á Íslandsmiðum 1992. Reykjavík 1993. 71 s. (Ófáanlegt - Out of print).
32. Guðrún Marteinsdóttir, Gunnar Jónsson, Ólafur V. Einarsson: Útbreiðsla grálúðu við Vestur- og Norðvestur-land 1992. Reykjavík 1993. 42 s. (Ófáanlegt - Out of print).
33. Ingvar Hallgrímsson: Rækjuleit á djúpslóð við Ísland. Reykjavík 1993. 63 s.
34. Nytjastofnar sjávar 1992/93. Aflahorfur fiskveiðiárið 1993/94. State of Marine Stocks in Icelandic Waters 1992/93. Prospects for the Quota Year 1993/94. Reykjavík 1993. 140 s.
35. Ólafur K. Pálsson, Björn Æ. Steinarsson, Einar Jónsson, Gunnar Jónsson, Gunnar Stefánsson, Sigfús A. Schopka: Stofnmæling botnfiska á Íslandsmiðum 1993. Reykjavík 1994. 89 s.
36. Jónbjörn Pálsson, Guðrún Marteinsdóttir, Gunnar Jónsson: Könnun á útbreiðslu grálúðu fyrir Austfjörðum 1993. Reykjavík 1994. 37 s.
37. Nytjastofnar sjávar 1993/94. Aflahorfur fiskveiðiárið 1994/95. State of Marine Stocks in Icelandic Waters 1993/94. Prospects for the Quota Year 1994/95. Reykjavík 1994. 150 s.
38. Stefán S. Kristmannsson, Svend-Aage Malmberg, Jóhannes Briem, Erik Buch: Western Iceland Sea - Greenland Sea Project - CTD Data Report. Joint Danish Icelandic Cruise R/V Bjarni Sæmundsson, September 1990. Reykjavík 1994. 99 s.
39. Stefán S. Kristmannsson, Svend-Aage Malmberg, Jóhannes Briem, Erik Buch: Western Iceland Sea - Greenland Sea Project - CTD Data Report. Joint Danish Icelandic Cruise R/V Bjarni Sæmundsson, September 1991. Reykjavík 1994. 94 s.
40. Þættir úr vistfræði sjávar 1994. Reykjavík 1994. 50 s.
41. John Mortensen, Jóhannes Briem, Erik Buch, Svend-Aage Malmberg: Western Iceland Sea - Greenland Sea Project - Moored Current Meter Data Greenland - Jan Mayen, Denmark Strait and Kolbeinsey Ridge September 1990 to September 1991. Reykjavík 1995. 73 s.
42. Einar Jónsson, Björn Æ. Steinarsson, Gunnar Jónsson, Gunnar Stefánsson, Ólafur K. Pálsson, Sigfús A. Schopka: Stofnmæling botnfiska á Íslandsmiðum 1994. - Rannsóknaskýrsla. Reykjavík 1995. 107 s.
43. Nytjastofnar sjávar 1994/95. Aflahorfur fiskveiðiárið 1995/96. State of Marine Stocks in Icelandic Waters 1994/95 - Prospects for the Quota Year 1995/96. Reykjavík 1995. 163 s.
44. Þættir úr vistfræði sjávar 1995. Environmental Conditions in Icelandic Waters 1995. Reykjavík 1995. 34 s.
45. Sigfús A. Schopka, Björn Æ. Steinarsson, Einar Jónsson, Gunnar Jónsson, Gunnar Stefánsson, Höskuldur Björnsson, Ólafur K. Pálsson: Stofnmæling botnfiska á Íslandsmiðum 1995. Rannsóknaskýrsla. Icelandic Groundfish Survey 1995. Survey Report. Reykjavík 1996. 46 s.
46. Nytjastofnar sjávar 1995/96. Aflahorfur fiskveiðiárið 1996/97. State of Marine Stocks in Icelandic Waters 1995/96. Prospects for the Quota Year 1996/97. Reykjavík 1996. 175 s.
47. Björn Æ. Steinarsson, Gunnar Jónsson, Hörður Andrésson, Jónbjörn Pálsson: Könnun á flatfiski í Faxaflóa með dragnót sumarið 1995 - Rannsóknaskýrsla. Flatfish Survey in Faxaflói with Danish Seine in Summer 1995 - Survey Report. Reykjavík 1996. 38 s.
48. Steingrímur Jónsson: Ecology of Eyjafjörður Project. Physical Parameters Measured in Eyjafjörður in the Period April 1992 - August 1993. Reykjavík 1996. 144 s.
49. Guðni Þorsteinsson: Tilraunir með þorskgildrur við Ísland. Rannsóknaskýrsla. Reykjavík 1996. 28 s.
50. Jón Ólafsson, Magnús Danielsen, Sólveig Ólafsdóttir, Þórarinn Arnarson: Næringarefni í sjó undan Ánanaustum í nóvember 1995. Unnið fyrir Gatnamálastjórann í Reykjavík. Reykjavík 1996. 50 s.
51. Þórunn Þórðardóttir, Agnes Eydal: Phytoplankton at the Ocean Quahog Harvesting Areas Off the Southwest Coast of Iceland 1994. Svifþörungar á kúfiskmiðum út af norðvesturströnd Íslands 1994. Reykjavík 1996. 28 s.
52. Gunnar Jónsson, Björn Æ. Steinarsson, Einar Jónsson, Gunnar Stefánsson, Höskuldur Björnsson, Ólafur K. Pálsson, Sigfús A. Schopka: Stofnmæling botnfiska á Íslandsmiðum 1996. Rannsóknaskýrsla. Icelandic Groundfish Survey 1996. Survey Report. Reykjavík 1997. 46 s.
53. Þættir úr vistfræði sjávar 1996. Environmental Conditions in Icelandic Waters 1996. Reykjavík 1997. 29 s.
54. Vilhjálmur Þorsteinsson, Ásta Guðmundsdóttir, Guðrún Marteinsdóttir, Guðni Þorsteinsson og Ólafur K. Pálsson: Stofnmæling hrygningarþorsks með þorskanetum 1996. Gill-net Survey to Establish Indices of Abundance for the Spawning Stock of Icelandic Cod in 1996. Reykjavík 1997. 22 s.
55. Hafrannsóknastofnunin: Rannsókna- og starfsáætlun árin 1997-2001. Reykjavík 1997. 59 s. (Ófáanlegt - Out of print).
56. Nytjastofnar sjávar 1996/97. Aflahorfur fiskveiðiárið 1997/98. State of Marine Stocks in Icelandic Waters 1996/97. Prospects for the Quota Year 1997/98. Reykjavík 1997. 167 s.
57. Fjölstofnarannsóknir 1992-1995. Reykjavík 1997. 410 s.
58. Gunnar Stefánsson, Ólafur K. Pálsson (editors): BORMICON. A Boreal Migration and Consumption Model. Reykjavík 1997. 223 s. (Ófáanlegt - Out of print).
59. Halldór Narfi Stefánsson, Hersir Sigurgeirsson, Höskuldur Björnsson: BORMICON. User’s Manual. Reykjavík 1997. 61 s. (Ófáanlegt - Out of print).
60. Halldór Narfi Stefánsson, Hersir Sigurgeirsson, Höskuldur Björnsson: BORMICON. Programmer's Manual. Reykjavík 1997. 215 s. (Ófáanlegt - Out of print).
61. Þorsteinn Sigurðsson, Einar Hjörleifsson, Höskuldur Björnsson, Ólafur Karvel Pálsson: Stofnmæling botnfiska á Íslandsmiðum haustið 1996. Reykjavík 1997. 34 s.
62. Guðrún Helgadóttir: Paleoclimate (0 to >14 ka) of W and NW Iceland: An Iceland/USA Contribution to P.A.L.E. Cruise Report B9-97, R/V Bjarni Sæmundsson RE 30, 17th-30th July 1997. Reykjavík 1997. 29 s.
63. Halldóra Skarphéðinsdóttir, Karl Gunnarsson: Lífríki sjávar í Breiðafirði: Yfirlit rannsókna. A review of literature on marine biology in Breiðafjörður. Reykjavík 1997. 57 s.
64. Valdimar Ingi Gunnarsson og Anette Jarl Jörgensen: Þorskrannsóknir við Ísland með tilliti til hafbeitar. Reykjavík 1998. 55 s.
65. Jakob Magnússon, Vilhelmína Vilhelmsdóttir, Klara B. Jakobsdóttir: Djúpslóð á Reykjaneshrygg: Könnunar-leiðangrar 1993 og 1997. Deep Water Area of the Reykjanes Ridge: Research Surveys in 1993 and 1997. Reykjavík 1998. 50 s.
66. Vilhjálmur Þorsteinsson, Ásta Guðmundsdóttir, Guðrún Marteinsdóttir: Stofnmæling hrygningarþorsks með þorskanetum 1997. Gill-net Survey of Spawning Cod in Icelandic Waters in 1997. Survey Report. Reykjavík 1998. 19 s.

_______________________________________________________________________________________________
67. Nytjastofnar sjávar 1997/98. Aflahorfur fiskveiðiárið 1998/99. State of Marine Stocks in Icelandic Waters 1997/98. Prospects for the Quota year 1998/99. Reykjavík 1998. 168 s.
68. Einar Jónsson, Hafsteinn Guðfinnsson: Ýsurannsóknir á grunnslóð fyrir Suðurlandi 1989-1995. Reykjavík 1998. 75 s.
69. Jónbjörn Pálsson, Björn Æ. Steinarsson, Einar Hjörleifsson, Gunnar Jónsson, Hörður Andrésson, Kristján Kristinsson: Könnum á flatfiski í Faxaflóa með dragnót sumrin 1996 og 1997 - Rannsóknaskýrsla. Flatfish Survey in Faxaflói with Danish Seine in Summers 1996 and 1997 - Survey Report. Reykjavík 1998. 38 s.
70. Kristinn Guðmundsson, Agnes Eydal: Svifþörungar sem geta valdið skelfiskeitrun. Niðurstöður tegundagreininga og umhverfisathugana. Phytoplankton, a Potential Risk for Shellfish Poisoning. Species Identification and Environmental Conditions. Reykjavík 1998. 33 s.
71. Ásta Guðmundsdóttir, Vilhjálmur Þorsteinsson, Guðrún Marteinsdóttir: Stofnmæling hrygningarþorsks með þorskanetum 1998. Gill-net survey of spawning cod in Icelandic waters in 1998. Reykjavík 1998. 19 s.
72. Nytjastofnar sjávar 1998/1999. Aflahorfur fiskveiðiárið 1999/2000. State of Marine Stocks in Icelandic Waters 1998/1999. Prospects for the Quota year 1999/2000. Reykjavík 1999. 172 s. (Ófáanlegt - Out of print.)
73. Þættir úr vistfræði sjávar 1997 og 1998. Environmental Conditions in Icelandic Waters 1997 and 1998. Reykjavík 1999. 48 s.
74. Matthías Oddgeirsson, Agnar Steinarsson og Björn Björnsson: Mat á arðsemi sandhverfueldis á Íslandi. Grindavík 2000. 21 s.
75. Nytjastofnar sjávar 1999/2000. Aflahorfur fiskveiðiárið 2000/2001. State of Marine Stocks in Icelandic Waters 1999/2000. Prospects for the Quota year 2000/2001. Reykjavík 2000. 176 s.
76. Jakob Magnússon, Jútta V. Magnússon, Klara B. Jakobsdóttir: Djúpfiskarannsóknir. Framlag Íslands til rannsóknaverkefnisins EC FAIR PROJECT CT 95-0655 1996-1999. Deep-Sea Fishes. Icelandic Contributions to the Deep Water Research Project. EC FAIR PROJECT CT 95-0655 1996-1999. Reykjavík 2000. 164 s. (Ófáanlegt - Out of print).
77. Þættir úr vistfræði sjávar 1999. Environmental Conditions in Icelandic Waters 1999. Reykjavík 2000. 31 s.
78. dst2 Development of Structurally Detailed Statistically Testable Models of Marine Populations. QLK5-CT1999-01609. Progress Report for 1 January to 31 December 2000. Reykjavik 2001. 341 s. (Ófáanlegt. - Out of print).
79. Tagging Methods for Stock Assessment and Research in Fisheries. Co-ordinator: Vilhjálmur Þorsteinsson. Reykjavik 2001. 179 s.
80. Nytjastofnar sjávar 2000/2001. Aflahorfur fiskveiðiárið 2001/2002. State of Marine Stocks in Icelandic Waters 2000/2001. Prospects for the Quota year 2001/2002. Reykjavík 2001. 186 s.
81. Jón Ólafsson, Sólveig R. Ólafsdóttir: Ástand sjávar á losunarsvæði skolps undan Ánanaustum í febrúar 2000. Reykjavík 2001. 49 s.
82. Hafsteinn G. Guðfinnsson, Karl Gunnarsson: Sjór og sjávarnytjar í Héraðsflóa. Reykjavík 2001. 20 s.
83. Þættir úr vistfræði sjávar 2000. Environmental Conditions in Icelandic Waters 2000. Reykjavík 2001. 37 s.
84. Guðrún G. Þórarinsdóttir, Hafsteinn G. Guðfinnsson, Karl Gunnarsson: Sjávarnytjar í Hvalfirði. Reykjavík 2001. 14 s.
85. Rannsóknir á straumum, umhverfisþáttum og lífríki sjávar í Reyðarfirði frá júlí til október 2000. Current measurements,
environmental factors and biology of Reyðarfjörður in the period late July to the beginning of October 2000. Hafsteinn Guðfinnsson (verkefnisstjóri). Reykjavík 2001. 135 s.
86. Jón Ólafsson, Magnús Danielsen, Sólveig R. Ólafsdóttir, Jóhannes Briem: Ferskvatnsáhrif í sjó við Norðausturland að vorlagi. Reykjavík 2002. 42 s.
87. dst2 Development of Structurally Detailed Statistically Testable Models of Marine Populations. QLK5-CT1999-01609. Progress Report for 1 January to 31 December 2001 Reykjavik 2002. 300 s.
88. Nytjastofnar sjávar 2001/2002. Aflahorfur fiskveiðiárið 2002/2003. State of Marine Stocks in Icelandic Waters 2001/2002. Prospects for the Quota year 2002/2003. Reykjavík 2002. 198 s.
89. Kristinn Guðmundsson, Ástþór Gíslason, Jón Ólafsson, Konráð Þórisson, Rannveig Björnsdóttir, Sigmar A. Steingrímsson, Sólveig R. Ólafsdóttir, Öivind Kaasa: Ecology of Eyjafjörður project. Chemical and biological parameters measured in Eyjafjörður in the period April 1992-August 1993. Reykjavík 2002. 129 s.
90. Ólafur K. Pálsson, Guðmundur Karlsson, Ari Arason, Gísli R Gíslason, Guðmundur Jóhannesson, Sigurjón Aðalsteinsson: Mælingar á brottkasti þorsks og ýsu árið 2001. Reykjavík 2002. 17 s.
91. Jenný Brynjarsdóttir: Statistical Analysis of Cod Catch Data from Icelandic Groundfish Surveys. M.Sc. Thesis. Reykjavík 2002. xvi, 81 s.
92. Umhverfisaðstæður, svifþörungar og kræklingur í Mjóafirði. Ritstjóri: Karl Gunnarsson. Reykjavík 2003. 81 s.
93. Guðrún Marteinsdóttir (o.fl.): METACOD: The role of sub-stock structure in the maintenance of cod metapopulations. METACOD: Stofngerð þorsks, hlutverk undirstofna í viðkomu þorskstofna við Ísland og Skotland. Reykjavík 2003. vii, 110 s.
94. Ólafur K. Pálsson, Guðmundur Karlsson, Ari Arason, Gísli R. Gíslason, Guðmundur Jóhannesson og Sigurjón Aðalsteinsson: Mælingar á brottkasti botnfiska 2002. Reykjavík 2003. 29 s.
95. Kristján Kristinsson: Lúðan (Hippoglossus hippoglossus) við Ísland og hugmyndir um aðgerðir til verndunar hennar. Reykjavík 2003. 33 s.
96. Þættir úr vistfræði sjávar 2001 og 2002. Environmental conditions in Icelandic water 2001 and 2002. Reykjavík 2003. 37 s.
97. Nytjastofnar sjávar 2002/2003. Aflahorfur fiskveiðiárið 2003/2004. State of Marine Stocks in Icelandic Waters 2002/2003. Prospects for the Quota year 2003/2004. Reykjavík 2003. 186 s.
98. dst2 Development of Structurally Detailed Statistically Testable Models of Marine Populations. QLK5-CT1999-01609. Progress Report for 1 January to 31 December 2002. Reykjavik 2003. 346 s.
99. Agnes Eydal: Áhrif næringarefna á tegundasamsetningu og fjölda svifþörunga í Hvalfirði. Reykjavík 2003. 44 s.
100. Valdimar Ingi Gunnarsson (o.fl.): Þorskeldiskvóti: Yfirlit yfir föngun og áframeldi þorsks á árinu 2002. Reykjavík 2004. 26 s.

_______________________________________________________________________________________________
101. Þættir úr vistfræði sjávar 2003. Environmental conditions in Icelandic waters 2003. Reykjavík 2004. 43 s.
102. Nytjastofnar sjávar 2003/2004. Aflahorfur fiskveiðiárið 2004/2005. State of Marine Stocks in Icelandic Waters 2003/2004. Prospects for the Quota Year 2004/2005. Reykjavík 2004. 175 s.
103. Ólafur K. Pálsson o.fl.: Mælingar á brottkasti 2003 og Meðafli í kolmunnaveiðum 2003. Reykjavík 2004. 37 s.
104. Ásta Guðmundsdóttir, Þorsteinn Sigurðsson: Veiðar og útbreiðsla íslensku sumargotssíldarinnar að haust- og vetrarlagi 1978-2003. Reykjavík 2004. 42 s.
105. Einar Jónsson, Hafsteinn Guðfinnsson: Ýsa á grunnslóð fyrir Suðurlandi 1994-1998. Reykjavík 2004. 44 s.
106. Kristinn Guðmundsson, Þórunn Þórðardóttir, Gunnar Pétursson: Computation of daily primary production in Icelandic waters; a comparison of two different approaches. Reykjavík 2004. 23 s.
107. Kristinn Guðmundsson og Kristín J. Valsdóttir: Frum-framleiðnimælingar á Hafrannsóknastofnuninni árin 1958-1999: Umfang, aðferðir og úrvinnsla. Reykjavík 2004. 56 s.
108. John Mortensen: Satellite altimetry and circulation in the Denmark Strait and adjacent seas. Reykjavík 2004. 84 s.
109. Svend-Aage Malmberg: The Iceland Basin. Topography and oceanographic features. Reykjavík 2004. 41 pp.

_______________________________________________________________________________________________