the iea mobility model
Post on 13-Sep-2014
2.135 views
DESCRIPTION
Updated February 2014TRANSCRIPT

© OECD/IEA 2012
The IEA Mobility Model
Division of Energy Technology Policy
International Energy Agency
As of February 2014
© OECD/IEA 2012
Project History
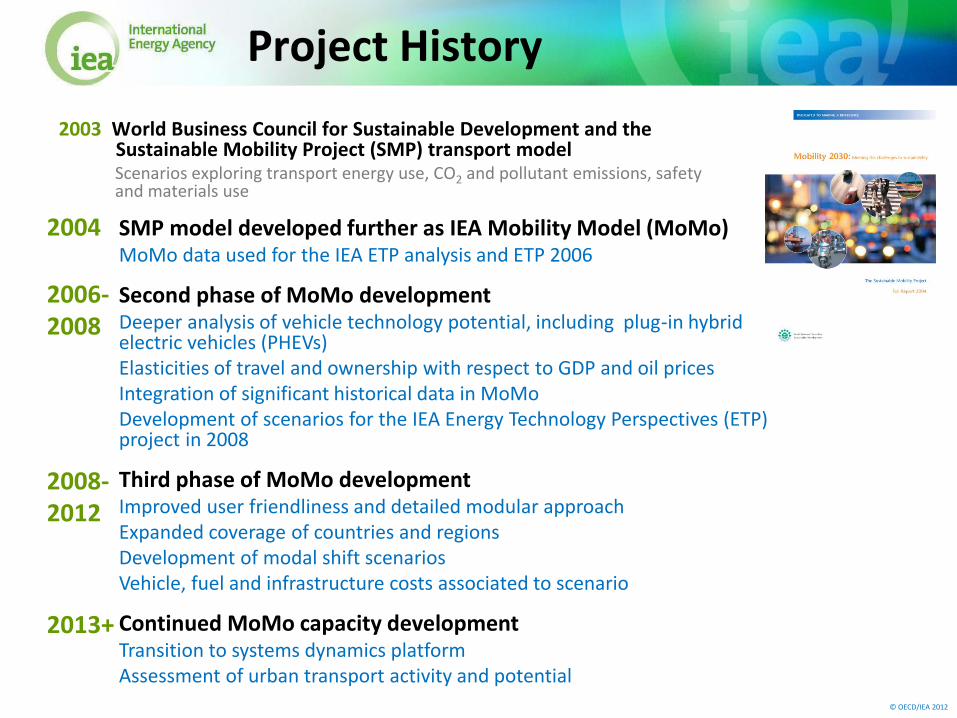
2003 World Business Council for Sustainable Development and the Sustainable Mobility Project (SMP) transport model Scenarios exploring transport energy use, CO2 and pollutant emissions, safety and materials use
SMP model developed further as IEA Mobility Model (MoMo) MoMo data used for the IEA ETP analysis and ETP 2006
Second phase of MoMo development Deeper analysis of vehicle technology potential, including plug-in hybrid electric vehicles (PHEVs) Elasticities of travel and ownership with respect to GDP and oil prices Integration of significant historical data in MoMo Development of scenarios for the IEA Energy Technology Perspectives (ETP) project in 2008
Third phase of MoMo development Improved user friendliness and detailed modular approach Expanded coverage of countries and regions Development of modal shift scenarios Vehicle, fuel and infrastructure costs associated to scenario
Continued MoMo capacity development Transition to systems dynamics platform Assessment of urban transport activity and potential
2004
2006- 2008
2008- 2012
2013+
© OECD/IEA 2012
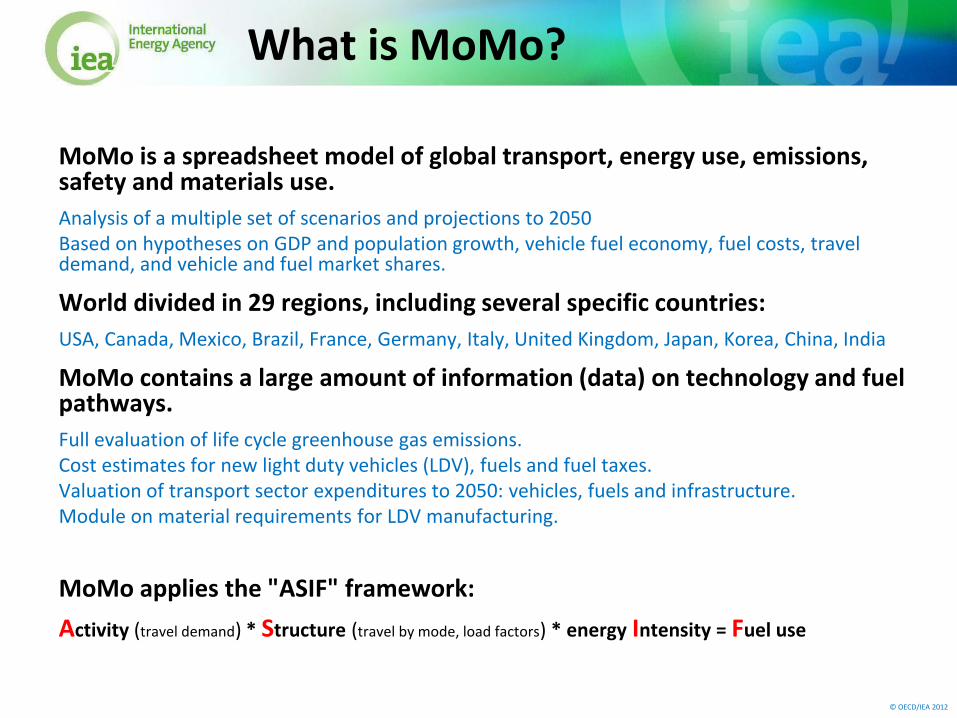
What is MoMo?
MoMo is a spreadsheet model of global transport, energy use, emissions, safety and materials use.
Analysis of a multiple set of scenarios and projections to 2050 Based on hypotheses on GDP and population growth, vehicle fuel economy, fuel costs, travel demand, and vehicle and fuel market shares.
World divided in 29 regions, including several specific countries:
USA, Canada, Mexico, Brazil, France, Germany, Italy, United Kingdom, Japan, Korea, China, India
MoMo contains a large amount of information (data) on technology and fuel pathways.
Full evaluation of life cycle greenhouse gas emissions. Cost estimates for new light duty vehicles (LDV), fuels and fuel taxes. Valuation of transport sector expenditures to 2050: vehicles, fuels and infrastructure. Module on material requirements for LDV manufacturing.
MoMo applies the "ASIF" framework:
Activity (travel demand) * Structure (travel by mode, load factors) * energy Intensity = Fuel use
© OECD/IEA 2012
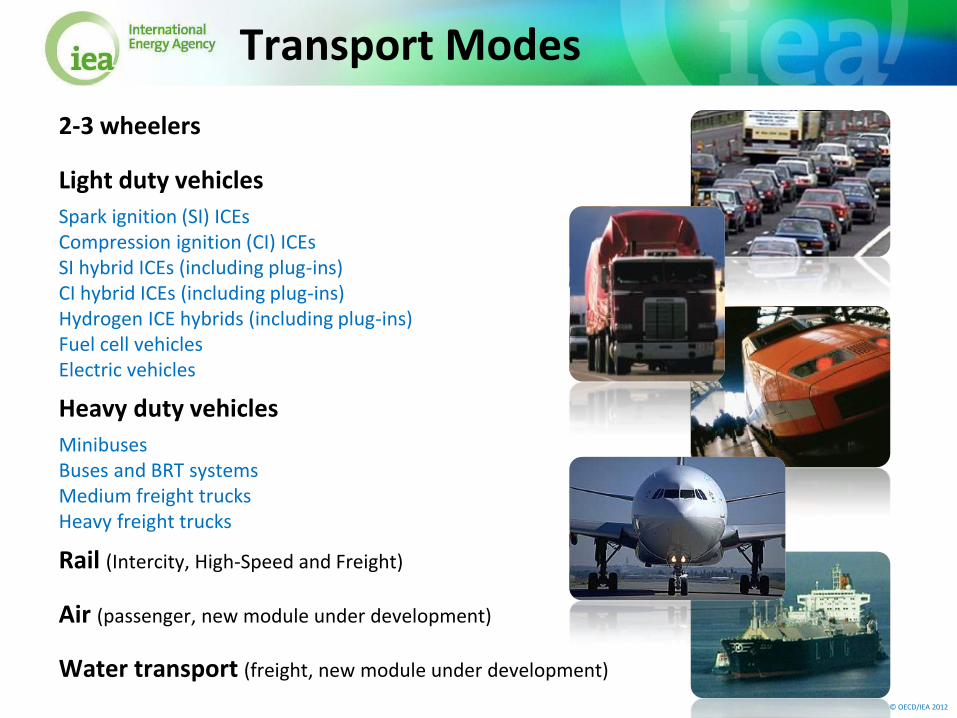
Transport Modes
2-3 wheelers
Light duty vehicles
Spark ignition (SI) ICEs Compression ignition (CI) ICEs SI hybrid ICEs (including plug-ins) CI hybrid ICEs (including plug-ins) Hydrogen ICE hybrids (including plug-ins) Fuel cell vehicles Electric vehicles
Heavy duty vehicles
Minibuses Buses and BRT systems Medium freight trucks Heavy freight trucks
Rail (Intercity, High-Speed and Freight)
Air (passenger, new module under development)
Water transport (freight, new module under development)

© OECD/IEA 2012
Fuel Pathways
Liquid petroleum fuels
Gasoline Diesel (high- and low-sulphur)
Biofuels
Ethanol (grain, sugar cane, and advanced technologies [lignocellulose]) Biodiesel (conventional [fatty acid methyl esters, FAME or biodiesel obtained from hydrogenation of vegetable oil in refineries] and advanced processes [BTL, fast pyrolysis, hydrothermal upgrade])
Synthetic fuels
Gas-to-liquids (GTL) and coal-to-liquids (CTL)
Gas
Compressed natural gas (CNG), liquefied petroleum gas (LPG) and biogas
Electricity
Treated separately for electric vehicles (EVs) and plug-in hybrid electric vehicles (PHEVs) and other modes, by generation mix and region
Hydrogen
From natural gas (with and without CO2 sequestration), electricity and point of use electrolysis (with and without CO2 sequestration), biomass gasification and advanced low-GHG hydrogen production
© OECD/IEA 2012
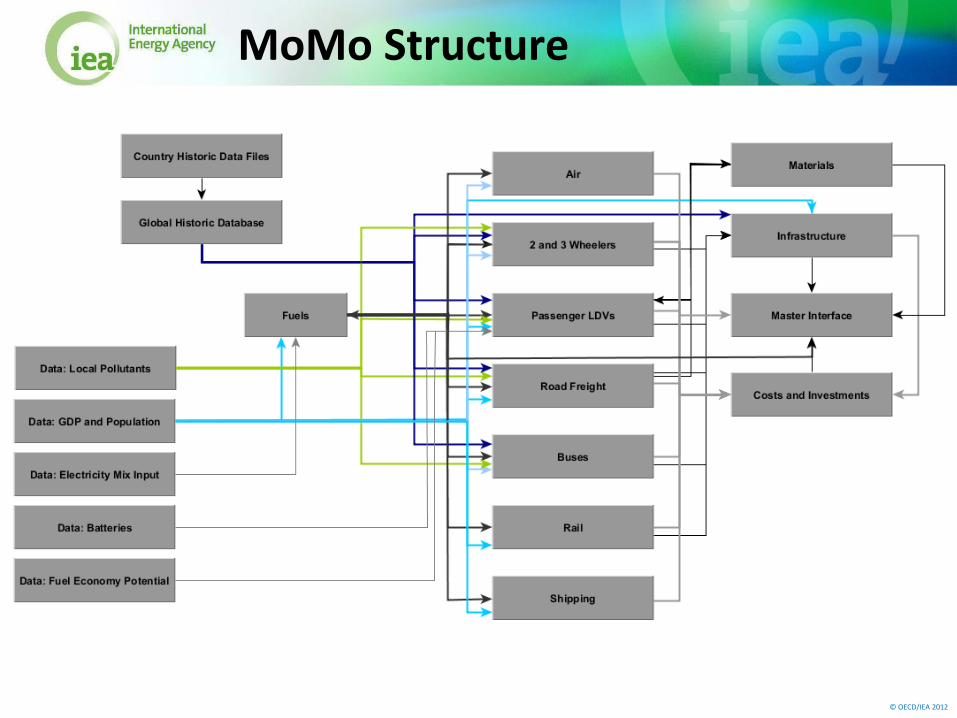
MoMo Structure

© OECD/IEA 2012
To date, 33 countries have been pulled out as individual historic data files.
68 individual countries are planned to be pulled out.
MoMo Regions
© OECD/IEA 2012
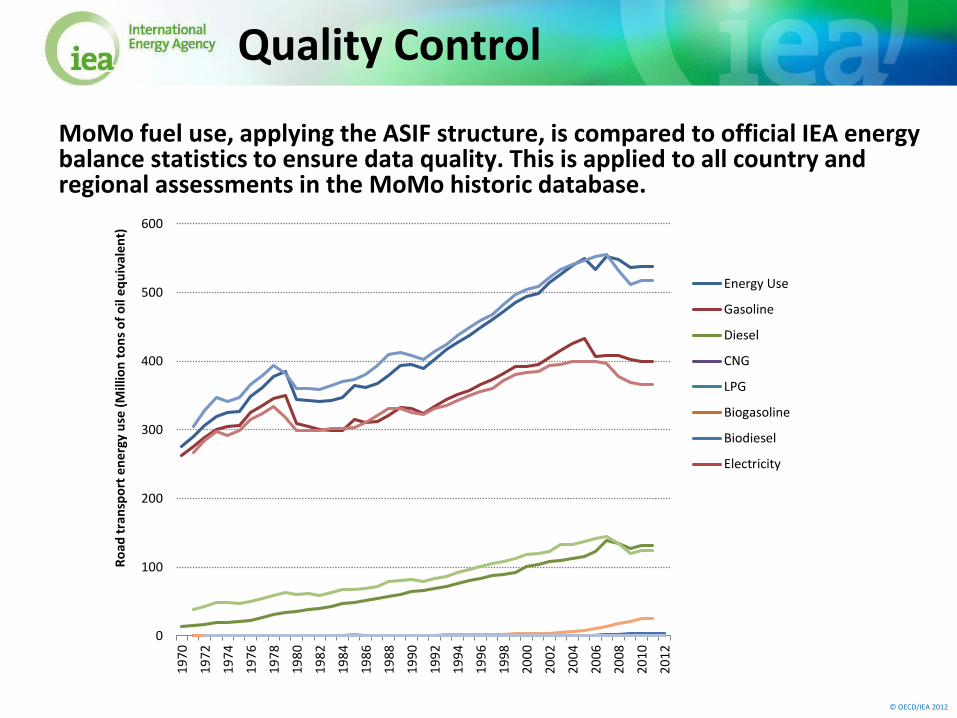
MoMo fuel use, applying the ASIF structure, is compared to official IEA energy balance statistics to ensure data quality. This is applied to all country and regional assessments in the MoMo historic database.
Quality Control
0
100
200
300
400
500
600
19
70
19
72
19
74
19
76
19
78
19
80
19
82
19
84
19
86
19
88
19
90
19
92
19
94
19
96
19
98
20
00
20
02
20
04
20
06
20
08
20
10
20
12
Ro
ad t
ran
spo
rt e
ne
rgy
use
(M
illio
n t
on
s o
f o
il e
qu
ival
en
t)
Energy Use
Gasoline
Diesel
CNG
LPG
Biogasoline
Biodiesel
Electricity
ESD official Stats

© OECD/IEA 2012
Analytical Capabilities
The MoMo model follows the ASIF structure and calculates energy and emissions by mode, with more detailed analysis on stock, sales and costs depending on mode and data availability.
For LDVs and freight trucks:
A stock and sales model has been developed. Activity, intensity and energy use are estimated. CO2 emissions are calculated (well-to-wheel and tank-to-wheel, using ETP modelling framework). Pollutant emissions (CO, VOCs, PM, lead and NOx) estimated. Vehicle and fuel costs.
For buses and 2/3 wheelers: MoMo tracks stock, stock efficiency, travel, energy use and emissions.
For rail and air: Total travel activity, energy intensities, energy use and emissions are tracked.
For shipping: To date, MoMo tracks sectorial energy use and emissions.

© OECD/IEA 2012
MoMo has a user interface that allows: What-if scenario building. Back casting. Use of elasticities for ownership and mileage. Mode shift scenario building for passenger travel.
MoMo also estimates material requirements and emissions:
Analysis of future vehicle sales (e.g. fuel cells) and how they impact materials requirements (e.g. precious metals) is possible. Full life-cycle analysis for GHG emissions from LDVs (including manufacturing) can be calculated.
Recent MoMo capacity developments include:
Urban and non-urban travel splits applying data from a global set of mobility surveys. Land transport infrastructure requirements in support of travel demand growth. Fuel cost, T&D, storage and distribution infrastructure assessment. Cost estimations from vehicle, fuel and infrastructure investments.
Analytical Capabilities

© OECD/IEA 2012
Who supports this work?
Now 13 partner institutions. Six have been financing the project development since the end of the SMP.
© OECD/IEA 2012
Contact
ETP Transport International Energy Agency 9, rue de la Fédération 75739 Paris Cedex 15 France [email protected]