the image quality of lenses for digital photography
TRANSCRIPT

8/9/2019 The Image Quality of Lenses for Digital Photography
http://slidepdf.com/reader/full/the-image-quality-of-lenses-for-digital-photography 1/8
The image quality of lenses for digital photography
Author: Dr. Karl Lenhardt, Bad Kreuznach
Digital photography at this time is in the
process of an enormous expansion. In
Germany, the number of digital cameras
already exceeds in terms of value the number
of all other types of (conventional) cameras
sold. The number of different kinds is almost
incomprehensible, too.
If one takes only the digital cameras with
image sensors (CCD's or CMOS's) with 2
million pixels or more, there are already over 80 different models.
As a result, anyone who is considering the
purchase of a digital camera is confronted by
an enormous flood of information which must
be sifted and classified.
The question is -- what criteria must be
applied to accomplish this? Intuitively -- if
somewhat imprecisely -- someone might say:
by the quality of the picture produced. It is
precisely this subject which the following
article is devoted to.
The transfer chain in digital photography
What constitutes "good image quality" in an optical system?
Final remarks
The transfer chain in digital photography
Image quality is affected by a whole series of links (components) in the apparatus used in the process of
taking a picture (i.e., components of the digital camera). It is customary to speak of the transfer chain
with its individual links (components), which can be classified as follows:
Digital photography
8/9/2019 The Image Quality of Lenses for Digital Photography
http://slidepdf.com/reader/full/the-image-quality-of-lenses-for-digital-photography 2/8
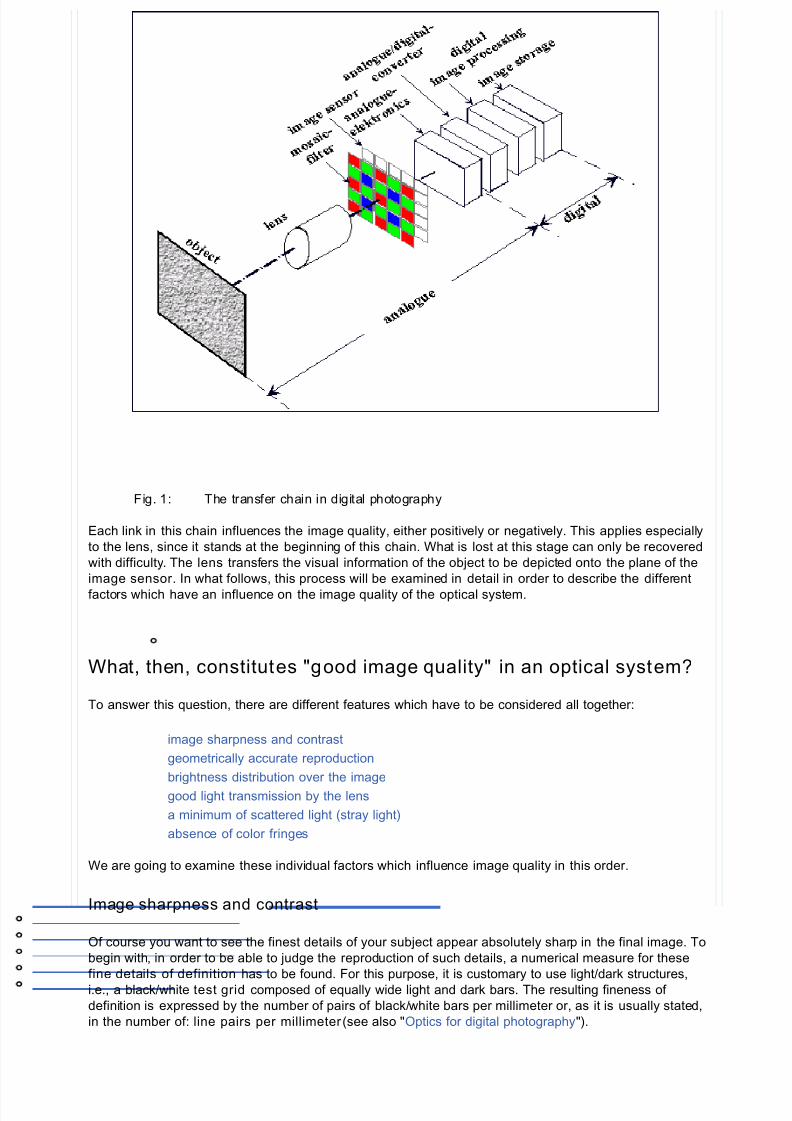
Fig. 1: The transfer chain in digital photography
Each link in this chain influences the image quality, either positively or negatively. This applies especially
to the lens, since it stands at the beginning of this chain. What is lost at this stage can only be recovered
with difficulty. The lens transfers the visual information of the object to be depicted onto the plane of the
image sensor . In what follows, this process will be examined in detail in order to describe the different
factors which have an influence on the image quality of the optical system.
What, then, constitutes "good image quality" in an optical system?
To answer this question, there are different features which have to be considered all together:
image sharpness and contrast
geometrically accurate reproduction
brightness distribution over the image
good light transmission by the lens
a minimum of scattered light (stray light)
absence of color fringes
We are going to examine these individual factors which influence image quality in this order.
Image sharpness and contrast
Of course you want to see the finest details of your subject appear absolutely sharp in the final image. To
begin with, in order to be able to judge the reproduction of such details, a numerical measure for these
fine details of definition has to be found. For this purpose, it is customary to use light/dark structures,
i.e., a black/white test grid composed of equally wide light and dark bars. The resulting fineness of
definition is expressed by the number of pairs of black/white bars per millimeter or, as it is usually stated,
in the number of: line pairs per millimeter (see also "Optics for digital photography").
8/9/2019 The Image Quality of Lenses for Digital Photography
http://slidepdf.com/reader/full/the-image-quality-of-lenses-for-digital-photography 3/8
8/9/2019 The Image Quality of Lenses for Digital Photography
http://slidepdf.com/reader/full/the-image-quality-of-lenses-for-digital-photography 4/8
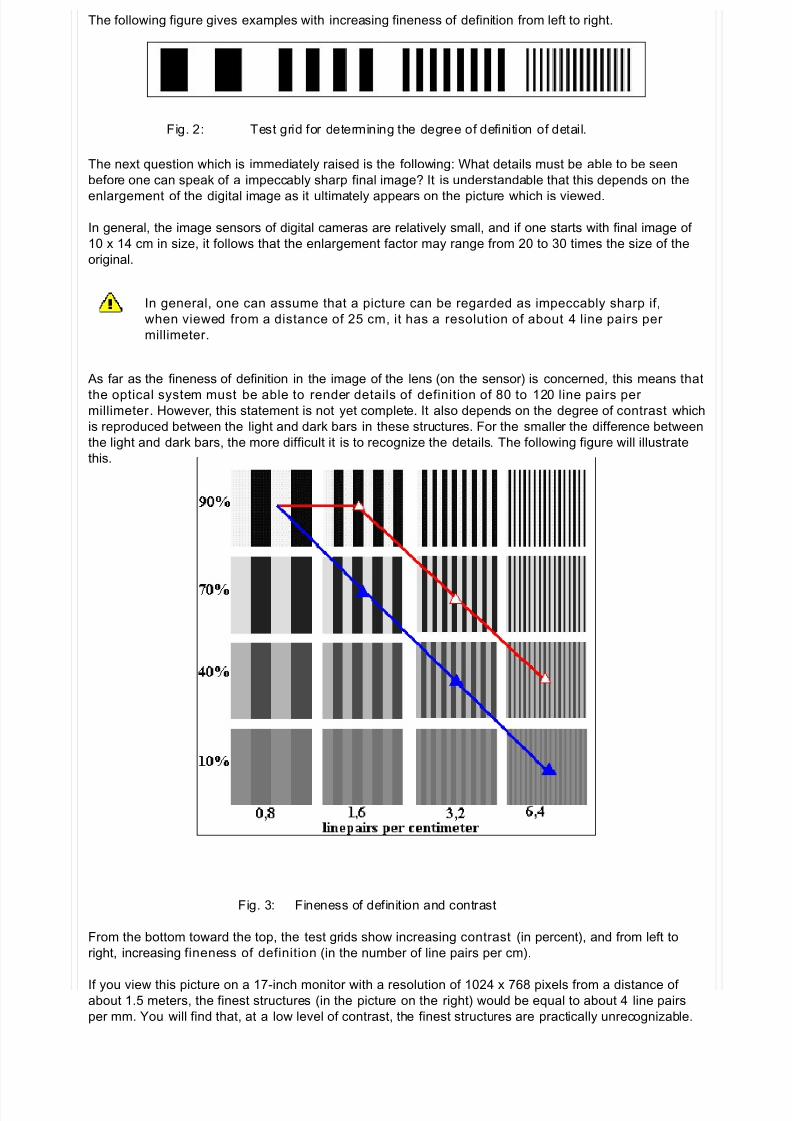
If one wants to describe the focusing capability of a lens, then one can draw a line from test figure to test
figure with the respective contrast which the lens can reproduce for that test figure. This curved line is
called the contrast transfer function (or MTF, Modulation Transfer Function).
In fig. 3, two such curves are drawn; here, the upper curved line stands for the qualitatively better lens,
since it reproduces comparable details of definition with higher contrast (higher modulation).
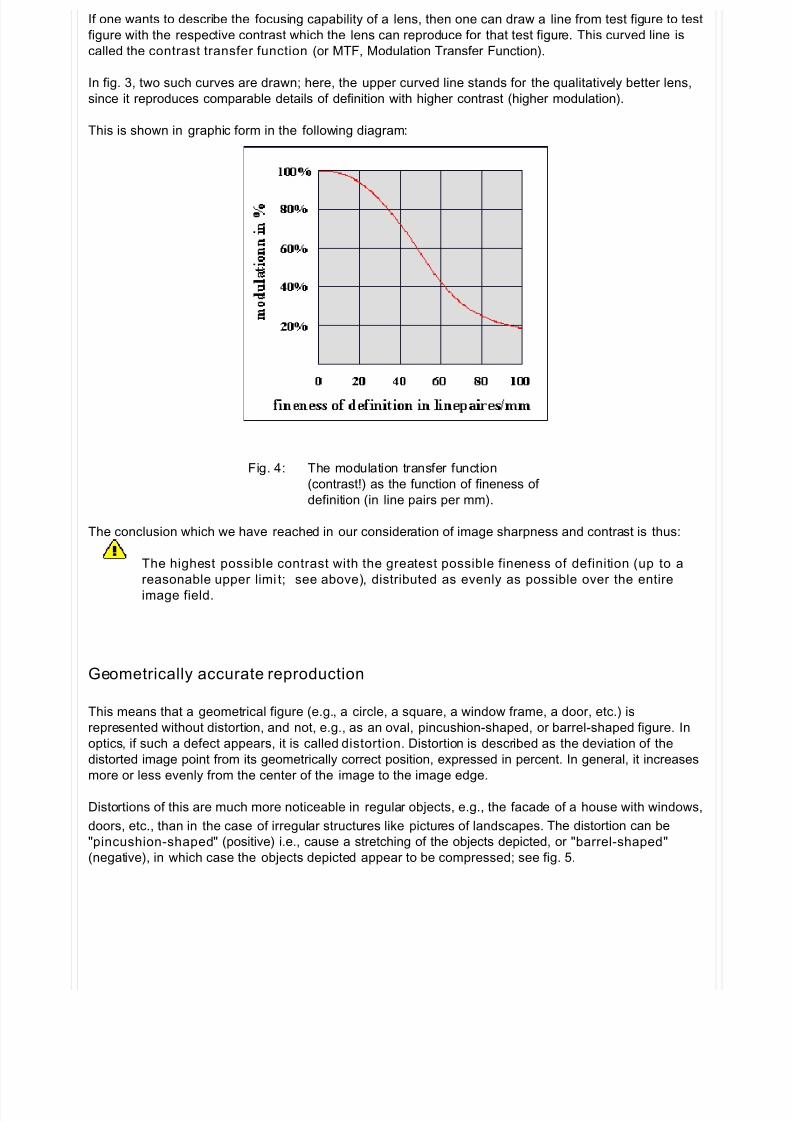
This is shown in graphic form in the following diagram:
Fig. 4: The modulation transfer function
(contrast!) as the function of fineness of
definition (in line pairs per mm).
The conclusion which we have reached in our consideration of image sharpness and contrast is thus:
The highest possible contrast with the greatest possible fineness of definition (up to a
reasonable upper limi t; see above), distributed as evenly as possible over the entire
image field.
Geometrically accurate reproduction
This means that a geometrical figure (e.g., a circle, a square, a window frame, a door, etc.) is
represented without distortion, and not, e.g., as an oval, pincushion-shaped, or barrel-shaped figure. In
optics, if such a defect appears, it is called distortion. Distortion is described as the deviation of the
distorted image point from its geometrically correct position, expressed in percent. In general, it increases
more or less evenly from the center of the image to the image edge.
Distortions of this are much more noticeable in regular objects, e.g., the facade of a house with windows,
doors, etc., than in the case of irregular structures like pictures of landscapes. The distortion can be
"pincushion-shaped" (positive) i.e., cause a stretching of the objects depicted, or "barrel-shaped"
(negative), in which case the objects depicted appear to be compressed; see fig. 5.
8/9/2019 The Image Quality of Lenses for Digital Photography
http://slidepdf.com/reader/full/the-image-quality-of-lenses-for-digital-photography 5/8
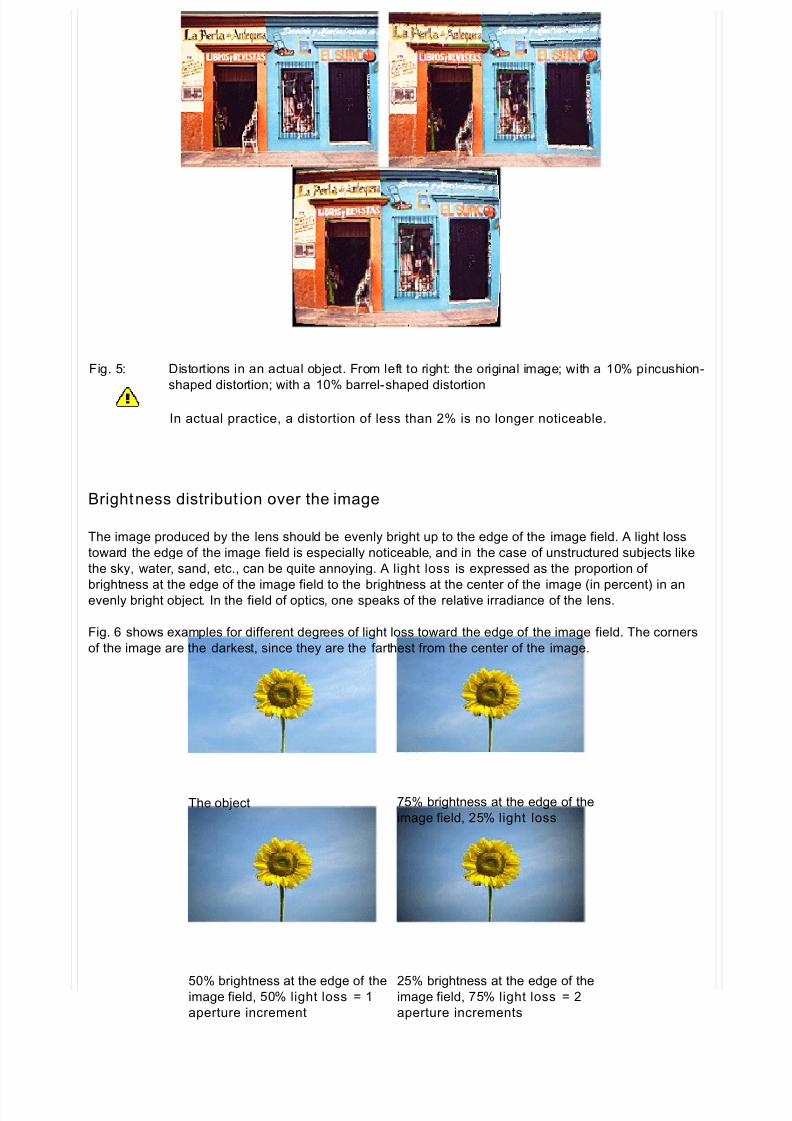
Fig. 5: Distortions in an actual object. From left to right: the original image; with a 10% pincushion-
shaped distortion; with a 10% barrel-shaped distortion
In actual practice, a distortion of less than 2% is no longer noticeable.
Brightness distribut ion over the image
The image produced by the lens should be evenly bright up to the edge of the image field. A light loss
toward the edge of the image field is especially noticeable, and in the case of unstructured subjects like
the sky, water, sand, etc., can be quite annoying. A light loss is expressed as the proportion of
brightness at the edge of the image field to the brightness at the center of the image (in percent) in anevenly bright object. In the field of optics, one speaks of the relative irradiance of the lens.
Fig. 6 shows examples for different degrees of light loss toward the edge of the image field. The corners
of the image are the darkest, since they are the farthest from the center of the image.
The object
75% brightness at the edge of the
image field, 25% light loss
50% brightness at the edge of theimage field, 50% light loss = 1
aperture increment
25% brightness at the edge of theimage field, 75% light loss = 2
aperture increments
8/9/2019 The Image Quality of Lenses for Digital Photography
http://slidepdf.com/reader/full/the-image-quality-of-lenses-for-digital-photography 6/8
Fig. 6: Examples of light loss at the image edge
Particularly in the case of wide-angle lenses, a certain amount of light loss is, for reasons having to do
with physics, unavoidable.
As the f igures show, a ligh t loss of 25% does not have a disturbing effect ..
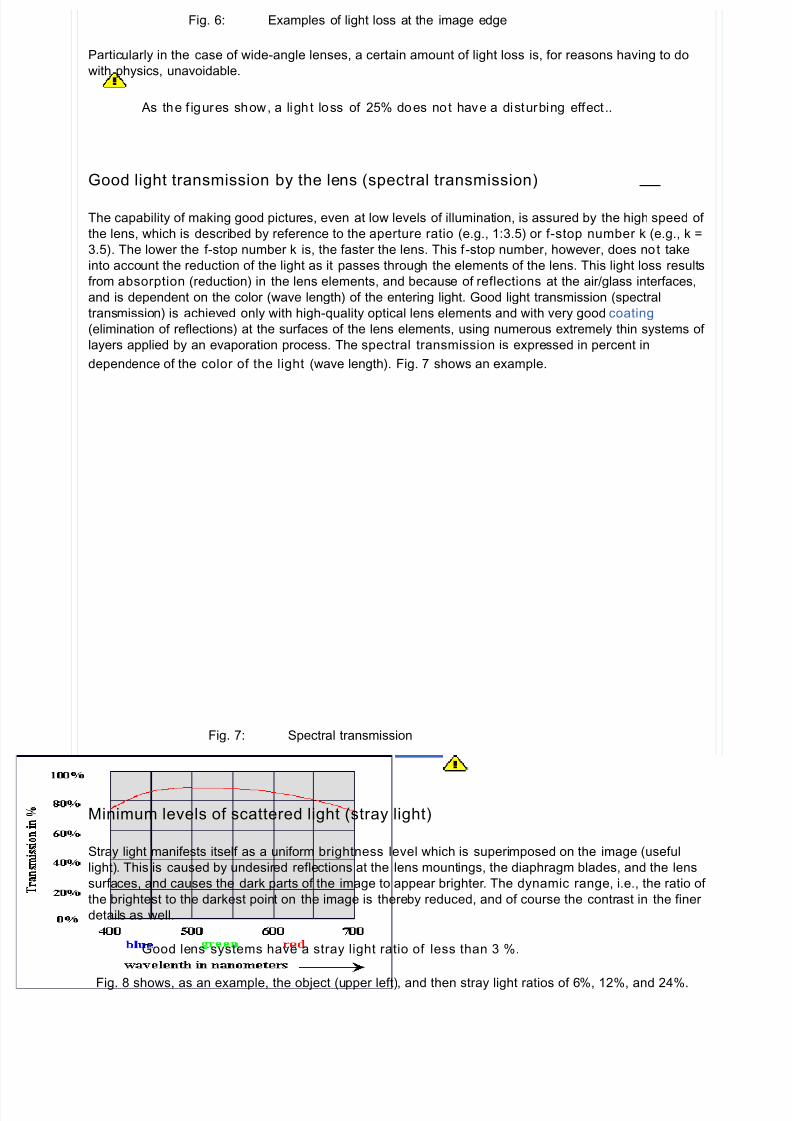
Good light transmission by the lens (spectral transmission)
The capability of making good pictures, even at low levels of illumination, is assured by the high speed of
the lens, which is described by reference to the aperture ratio (e.g., 1:3.5) or f-stop number k (e.g., k =
3.5). The lower the f-stop number k is, the faster the lens. This f -stop number, however, does not take
into account the reduction of the light as it passes through the elements of the lens. This light loss results
from absorption (reduction) in the lens elements, and because of reflections at the air/glass interfaces,
and is dependent on the color (wave length) of the entering light. Good light transmission (spectral
transmission) is achieved only with high-quality optical lens elements and with very good coating
(elimination of reflections) at the surfaces of the lens elements, using numerous extremely thin systems of
layers applied by an evaporation process. The spectral transmission is expressed in percent in
dependence of the color of the light (wave length). Fig. 7 shows an example.
Fig. 7: Spectral transmission
Minimum levels of scattered light (stray light)
Stray light manifests itself as a uniform brightness level which is superimposed on the image (useful
light). This is caused by undesired reflections at the lens mountings, the diaphragm blades, and the lens
surfaces, and causes the dark parts of the image to appear brighter. The dynamic range, i.e., the ratio of
the brightest to the darkest point on the image is thereby reduced, and of course the contrast in the finer
details as well.
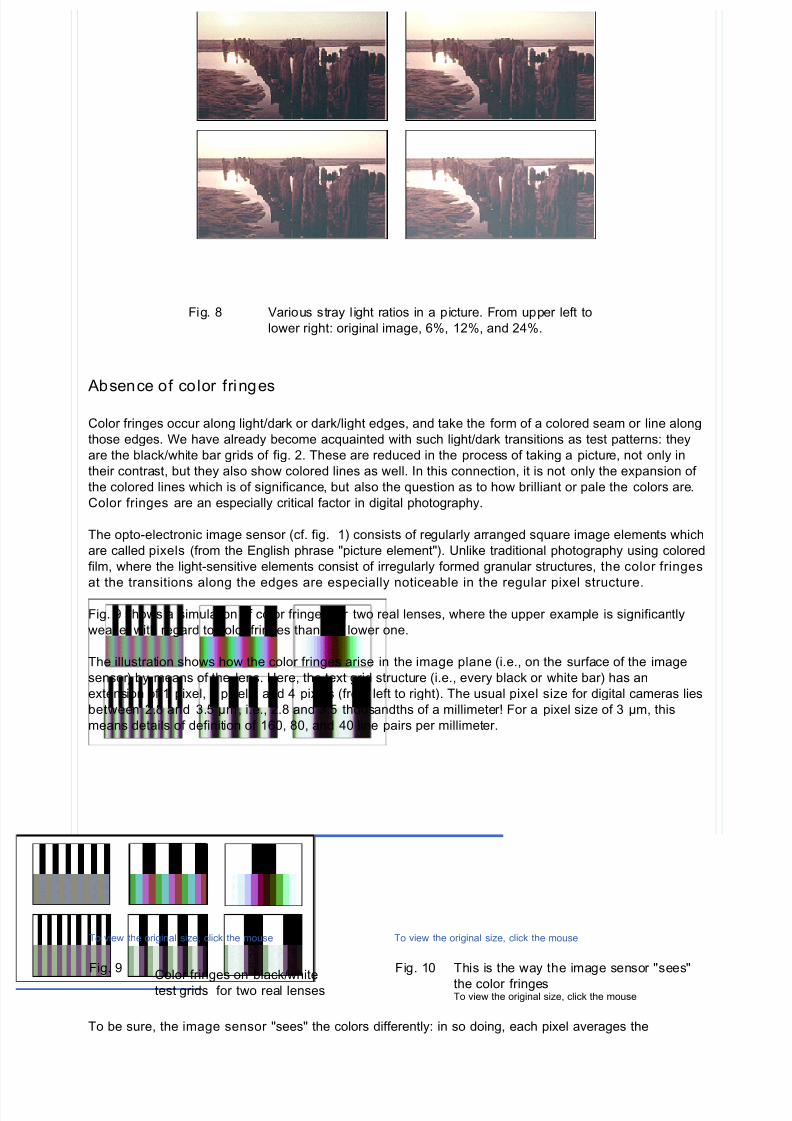
Good lens systems have a stray light ratio of less than 3 %.
Fig. 8 shows, as an example, the object (upper left), and then stray light ratios of 6%, 12%, and 24%.
8/9/2019 The Image Quality of Lenses for Digital Photography
http://slidepdf.com/reader/full/the-image-quality-of-lenses-for-digital-photography 7/8
Fig. 8 Various stray light ratios in a picture. From upper left to
lower right: original image, 6%, 12%, and 24%.
Absence of color fringes
Color fringes occur along light/dark or dark/light edges, and take the form of a colored seam or line along
those edges. We have already become acquainted with such light/dark transitions as test patterns: they
are the black/white bar grids of fig. 2. These are reduced in the process of taking a picture, not only in
their contrast, but they also show colored lines as well. In this connection, it is not only the expansion of
the colored lines which is of significance, but also the question as to how brilliant or pale the colors are.
Color fringes are an especially critical factor in digital photography.
The opto-electronic image sensor (cf. fig. 1) consists of regularly arranged square image elements which
are called pixels (from the English phrase "picture element"). Unlike traditional photography using colored
film, where the light-sensitive elements consist of irregularly formed granular structures, the color fringes
at the transitions along the edges are especially noticeable in the regular pixel structure.
Fig. 9 shows a simulation of color fringes for two real lenses, where the upper example is significantly
weaker with regard to color fringes than the lower one.
The illustration shows how the color fringes arise in the image plane (i.e., on the surface of the image
sensor) by means of the lens. Here, the text grid structure (i.e., every black or white bar) has an
extension of 1 pixel, 2 pixels, and 4 pixels (from left to right). The usual pixel size for digital cameras lies
between 2.8 and 3.5 µm , i.e., 2.8 and 3.5 thousandths of a millimeter! For a pixel size of 3 µm, this
means details of definition of 160, 80, and 40 line pairs per millimeter.
To view the original size, click the mouse To view the original size, click the mouse
Fig. 9Color fringes on black/white
test grids for two real lenses
Fig. 10 This is the way the image sensor "sees"
the color fringesTo view the original size, click the mouse
To be sure, the image sensor "sees" the colors differently: in so doing, each pixel averages the

8/9/2019 The Image Quality of Lenses for Digital Photography
http://slidepdf.com/reader/full/the-image-quality-of-lenses-for-digital-photography 8/8
brightness and color across its light-sensitive surface. As a result, each pixel has a uniform color and a
uniform brightness, as fig. 10 shows.
Color fringes can arise, not only in the optical system, but also in other links of the transfer chain (cf.
fig.1), e.g., through the mosaic filter of the image sensor and in connection with digital image processing
(digital color interpolation).
Good color correction is achieved in the optical system when the the co lor fringes have
an expansion of less than 2 pixels with relatively little color saturation.
Final remarks
We have shown that there are many factors which determine the "good image quality" of a lens. A
balanced evaluation of the totality of these parameters is thus required in order to be able to properly
assess the imaging quality of a lens. A further point, which could not be discussed in this introduction,
also has to do with the regular pixel structure of the image sensor, one which is responsible, among other
things, for the occurrence of color fringe structures: It is the so-called cross-talk effect or (in English)
aliasing. To those who would like to know more about this, we recommend our article " Optical systems
for digital photography" on this web site.
FON : +49 ( 0 ) 671 601-0 ....... FAX : +49 ( 0 ) 671 601-108 ....... E-mail : [email protected]