the image repository: a user guide · the repository. 2.3 type of migration data migration can be...
TRANSCRIPT

Queensland Centre for Population Research
The IMAGE Repository:
A User Guide
Martin Bell, Aude Bernard, Philipp Ueffing
and Elin Charles-Edwards
October 2014
Working Paper No 2014/01
School of Geography, Planning and
Environmental Management
www.gpem.uq.edu.au/qcpr
2
Contents
1 Introduction .................................................................................................................................... 3
2 Impediments to cross-national comparisons of migration ............................................................. 4
2.1 Dimensions of migration ......................................................................................................... 4
2.2 Comparability of migration data ............................................................................................. 8
2.3 Type of migration data ............................................................................................................ 8
2.4 Observation interval ............................................................................................................... 9
2.5 Spatial framework ................................................................................................................. 10
3 Assembling the IMAGE Repository ............................................................................................... 13
3.1 Selection of migration data ................................................................................................... 13
3.2 Sources of data ..................................................................................................................... 14
4 IMAGE Catalogue: a guide to the Repository ............................................................................... 15
4.1 Content ................................................................................................................................. 15
4.2 Structure ............................................................................................................................... 19
5 IMAGE Repository: files and content ............................................................................................ 19
5.1 Data files availability ............................................................................................................. 19
5.2 Files naming conventions ...................................................................................................... 22
5.3 Summary of data holdings .................................................................................................... 22
6 Access to the IMAGE Repository ................................................................................................... 24
References ............................................................................................................................................ 27

3
1 Introduction
The IMAGE project (Internal Migration Around the GlobE) is an international program of
research which aims to facilitate comparisons of internal migration between countries by
implementing a set of robust indicators that measure different dimensions of population
mobility. Comparative analysis calls for careful consideration of differences in the nature of
data collected in countries around the world (Bell et al. 2002). These differences are
complicated by the limited availability of migration data, as national migration statistics are
rarely available in a readily accessible format (Bell et al. 2014). Moreover, even where data
are made available, formats vary widely from one country to another. Analysts also confront
a number of challenges in deriving rigorous measures of migration.
To address the above challenges, the IMAGE project has been developed around a number
of discrete modules, including a global survey of internal migration data, the assembly of a
comprehensive repository, and the development of specialised software and analytical tools,
as shown in Figure 1. The first step to the IMAGE project was a global inventory of migration
data collection practice in the 193 UN member states (Bell et al. 2014). Building on this
inventory, a repository of internal migration data has been assembled, currently covering
135 countries. In tandem with the IMAGE Repository, a suite of analytical software, the
IMAGE Studio, has been developed to facilitate the spatial analysis and modelling of internal
migration by allowing the computation of a range of migration measures (Daras 2014;
Stillwell et al. 2014).
Figure 1 The IMAGE Project Framework
The IMAGE Inventory Review of internal migration
data collection practice in the 193 UN member states
The IMAGE Repository Global collection of
population and internal migration data and GIS
boundaries
The IMAGE Studio Analytical software to
compute internal migration measures and address key
methodological issues

4
This document is a user guide to the IMAGE Repository and is organised as follows. Section
2 summarises the main impediments to comparing migration between nations. Section 3
summarises current data collection practice in countries around the world. Section 4
discusses the strategy employed to assemble the IMAGE Repository, with regard to the
characteristics of the migration data selected and the data sources used. Section 5
introduces the IMAGE Repository Catalogue, an independent spreadsheet which describes
in detail the content and structure of the Repository itself, including the availability of
populations at risk and administrative area boundaries and contiguities. Section 6 lists the
different files available for each country and explains the naming conventions used to
identify individual files. Finally, Section 7 explains how to request data from the IMAGE
Repository. The distribution of data is governed by conditions particular to the organisation
from which the data were sourced, and not all data held in the Repository can be made
available to third parties. Where direct access cannot be provided, the Repository can
provide a guide that will enable users to identify the data on internal migration which are
available for countries around the world and where it might be acquired.
2 Impediments to cross-national comparisons of migration
Three main issues stand in the way of effective cross-national comparisons of internal
migration: the multifaceted nature of migration itself; the choice of migration indicators;
and the widespread variation in the type of migration data that are collected. In any
comparative analysis, a crucial first decision concerns the particular aspect of migration to
be explored. Four discrete dimensions of migration can be recognised: intensity, impact,
distance and connectivity (Bell et al. 2002), each of which call for somewhat different forms
of data and methods of analysis. The IMAGE Repository has been assembled to facilitate
comparisons on all these aspects of migration, so an understanding of the four dimensions
of migration, the associated data and the migration indicators is essential to appreciate the
way in which the Repository has been designed.
2.1 Dimensions of migration
Four broad dimensions of internal migration can be recognised, each of which provides
insights into a different aspect of migration at a particular spatial scale. These are:
(1) migration intensity, which indicates the overall level or incidence of migration
within a country;
(2) migration impact, which captures the extent of population redistribution through
migration;
(3) migration distance, which indicates the distance decay associated with population
movement; and
(4) migration connectivity, which reveals the way migration serves to link cities and
regions.

5
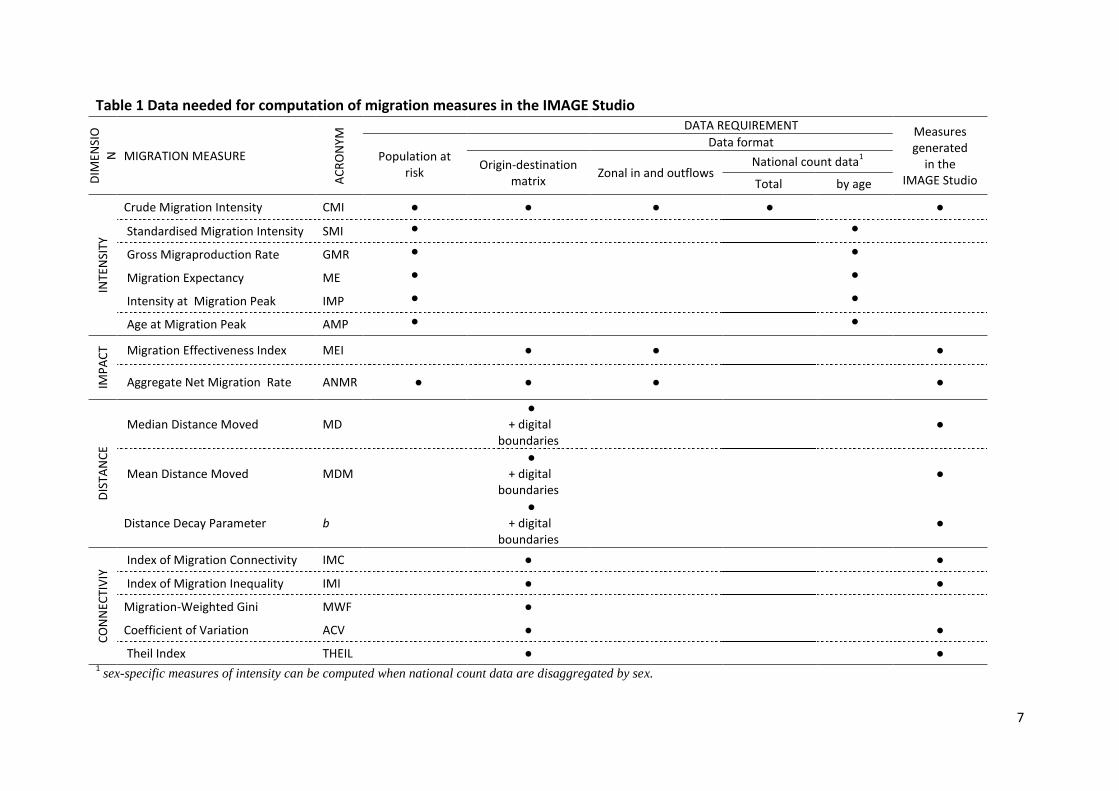
Each of these dimensions can be captured using a number of statistical indicators and each
of these indicators requires somewhat different forms of data. Table 1 lists in summary form
the suite of 15 migration measures proposed by Bell et al. (2002) and sets out the data
required for their computation. Table 1 also indicates which of these measures are
generated in the IMAGE Studio.
For the purposes of discussion, it is useful to identify three broad forms in which migration
data are commonly available:
(1) Origin-destination matrices
Also described as flow matrices, these contain region-to-region migration flows in which,
by convention, rows represent origins and columns represent destinations. The diagonal
element of flow matrices commonly indicates the number of people who changed
residence but remained in the same region at the start and end of the observation,
interval but it may also contain non-movers, or a subset of people who moved between
smaller zones within the region. To avoid ambiguity, the diagonal in OD matrices in the
IMAGE Repository has been set to zero. Where additional data on movement within
region, or on non-movers are available, these data are held as simple vectors in separate
spreadsheets in the OD Matrix workbook. See section 2.5 for more information.
(2) Marginal totals
In some cases, full origin-destination matrices are not available, but data may be
provided on the aggregate number of arrivals and departures for each region. These
effectively represent the marginal (row and column) totals of a full origin-destination
flow matrix and are also referred to as zonal inflows and outflows. While these
aggregates do not provide information on flows between specific origin-destination
pairs, they can be used to generate aggregate system-wide measures of migration
impact, and are also commonly available disaggregated by age and sex. It is important to
know whether or not the marginal totals include or exclude flows taking place within
regions.
(3) National migration counts
Count data comprise a single figure which indicates the total number of movers or
moves between regions within a country, irrespective of origin and destination. They
may also include information on changes of address that occurred within regions. They
do not provide any information on the origin or destination of flows, but may be
disaggregated by age and sex.
Allied to these three forms of migration data are two other types of information that are
required to compute some of the 15 indicators associated with the four dimensions of
migration listed above. These are:

6
(1) digital boundaries matching the regions against which migration is recorded, which are
used to compute migration distances, calibrate spatial interaction models and drive the
spatial aggregation facility in the IMAGE Studio, and
(2) populations at risk, which are used to compute migration rates and probabilities.
Table 1 shows how these data combine to generate the various migration metrics. With
respect to intensity measures, for example, the Crude Migration Intensity, which is obtained
by dividing the number of migrants by the population at risk, can be computed with
migration data of any format, because it simply requires the aggregate number of migrants.
This may be directly available in the form of a national migration count, but it can also be
derived by summation from an origin-destination matrix or from marginal totals. Other
intensity measures require migration data disaggregated by age, which may be available in
flow matrices but are more commonly held only in the form of nationwide migration counts
or marginal totals. Migration impact measures relate to individual regions so their
computation requires data on inter-regional flows, which can be obtained either from
origin-destination matrices or marginal totals. Distance measures are generated as Euclidian
distances between the region centroids by the IMAGE Studio, but it is also possible to input
a matrix of distance values assembled independently. Connectivity measures, on the other
hand, require complete origin-destination flow matrices, and cannot be computed from
marginal totals or from count data.
Table 1 shows that all measures of impact, distance and connectivity can be generated in
the IMAGE Studio, with the exception of the Migration-Weighted Gini which is excluded
because of the high computational load leading to long processing times. As for measures
of intensity, the IMAGE Studio generates only the Crude Migration Intensity. Other
measures of intensity require migration data disaggregated by age and are not computed in
the IMAGE Studio.
The IMAGE Studio incorporates a spatial aggregation routine which was designed to assist in
generating estimates of migration intensity that are comparable between countries, and to
explore the scale and pattern effects of the Modifiable Areal Unit Problem (MAUP) (Stillwell
et al. 2014). Provided the requisite types and forms of information are available, the Studio
can be employed to generate migration metrics for any size of migration matrix based on a
set of Basic Spatial Units (BSUs).
7
Table 1 Data needed for computation of migration measures in the IMAGE Studio
1 sex-specific measures of intensity can be computed when national count data are disaggregated by sex.
DIM
ENSI
O
N
MIGRATION MEASURE
AC
RO
NYM
DATA REQUIREMENT Measures generated
in the IMAGE Studio
Population at risk
Data format
Origin-destination matrix
Zonal in and outflows National count data
1
Total by age
INTE
NSI
TY
Crude Migration Intensity CMI ● ● ● ● ●
Standardised Migration Intensity SMI ● ●
Gross Migraproduction Rate GMR ● ●
Migration Expectancy ME ● ●
Intensity at Migration Peak IMP ● ●
Age at Migration Peak AMP ● ●
IMP
AC
T Migration Effectiveness Index MEI ● ● ●
Aggregate Net Migration Rate ANMR ● ● ●
●
DIS
TAN
CE
Median Distance Moved MD ●
+ digital boundaries
●
Mean Distance Moved MDM ●
+ digital boundaries
●
Distance Decay Parameter b ●
+ digital boundaries
●
CO
NN
ECTI
VIY
Index of Migration Connectivity IMC ● ●
Index of Migration Inequality IMI ● ●
Migration-Weighted Gini MWF ●
Coefficient of Variation ACV ● ●
Theil Index THEIL ● ●
8
2.2 Comparability of migration data
Comparability between countries is complicated by the fact that, irrespective of data
format, migration can be measured in various ways using different instruments ranging from
population registers and administrative records, to censuses and surveys. As a result,
significant variation exists between countries with regard to the type of migration data
collected, the time interval over which migration is measured, and the spatial frameworks
used. An understanding of these issues is essential to appreciate the design and content of
the Repository.
2.3 Type of migration data
Migration can be measured as an event or transition, or by reference to duration of
residence. Event data are usually associated with population registers and are the most
common form of internal migration data available in many European countries. Transition
data measure migration by comparing place of residence at two points in time and are the
type of data most commonly derived from censuses and surveys (Bell et al. 2014). Because
of the way they are measured, events and transitions count different things; population
registers count migrations while censuses count migrants. The difference is important
because transition data fail to capture return and onwards moves that occur within the
observation interval, and therefore undercount the number of migration events. There are
also differences in the treatment of migration among those who are born or die in the
interval, as well as in the inclusion or exclusion of immigrants (Bell and Rees 2006), and
these may vary further between individual countries. The impact of these differences on
overall migration intensities is small over relatively short intervals (Long and Boertlein 1990)
but increases as the observation interval lengthens, and care is also needed to eliminate or
control for variations in population coverage (Boden et al. 1991).
Censuses around the world also commonly collect data on duration of residence in the
current dwelling or locality. By filtering duration data for fixed durations of residence, it is
possible to derive a surrogate estimate of the number of moves that have occurred within a
given interval, comparable to the migration count data commonly derived from events or
transitions. Duration of residence data are also commonly collected in association with
information on previous place of residence, to generate origin-destination matrices that
effectively capture each respondent’s last move. In this instance, duration of residence can
be used as a filter to generate a migration flow matrix, which is broadly comparable to the
conventional migration transition. However, lack of precision in the measurement of
duration and ambiguity in the locality to which it applies necessitate caution in the use of
these data to make cross-national comparisons (Bell et al. 2014).
Table 2 summarises the principal differences between events, transitions, duration and last
move data. It shows that duration and last move data essentially represent a hybrid in terms
of population and migration coverage. They fail to capture multiple migration events that
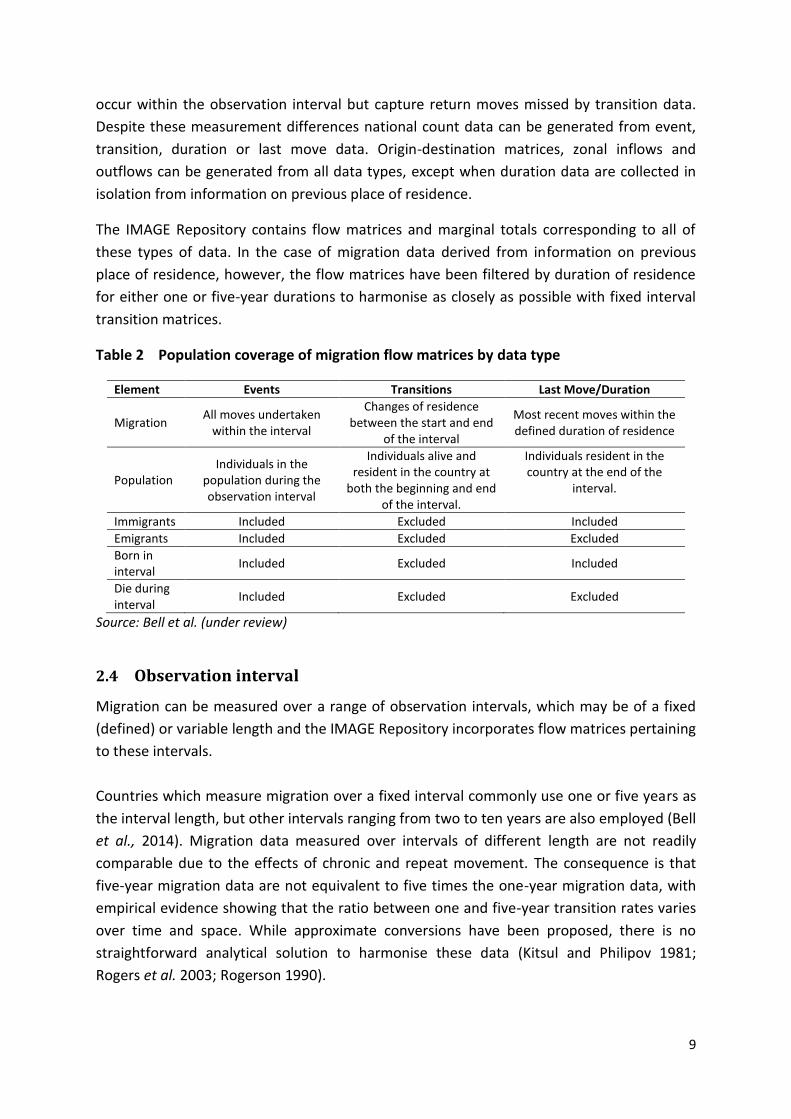
9
occur within the observation interval but capture return moves missed by transition data.
Despite these measurement differences national count data can be generated from event,
transition, duration or last move data. Origin-destination matrices, zonal inflows and
outflows can be generated from all data types, except when duration data are collected in
isolation from information on previous place of residence.
The IMAGE Repository contains flow matrices and marginal totals corresponding to all of
these types of data. In the case of migration data derived from information on previous
place of residence, however, the flow matrices have been filtered by duration of residence
for either one or five-year durations to harmonise as closely as possible with fixed interval
transition matrices.
Table 2 Population coverage of migration flow matrices by data type
Element Events Transitions Last Move/Duration
Migration All moves undertaken
within the interval
Changes of residence between the start and end
of the interval
Most recent moves within the defined duration of residence
Population Individuals in the
population during the observation interval
Individuals alive and resident in the country at
both the beginning and end of the interval.
Individuals resident in the country at the end of the
interval.
Immigrants Included Excluded Included
Emigrants Included Excluded Excluded
Born in interval
Included Excluded Included
Die during interval
Included Excluded Excluded
Source: Bell et al. (under review)
2.4 Observation interval
Migration can be measured over a range of observation intervals, which may be of a fixed
(defined) or variable length and the IMAGE Repository incorporates flow matrices pertaining
to these intervals.
Countries which measure migration over a fixed interval commonly use one or five years as
the interval length, but other intervals ranging from two to ten years are also employed (Bell
et al., 2014). Migration data measured over intervals of different length are not readily
comparable due to the effects of chronic and repeat movement. The consequence is that
five-year migration data are not equivalent to five times the one-year migration data, with
empirical evidence showing that the ratio between one and five-year transition rates varies
over time and space. While approximate conversions have been proposed, there is no
straightforward analytical solution to harmonise these data (Kitsul and Philipov 1981;
Rogers et al. 2003; Rogerson 1990).
10
Data on migration events, derived from population registers and administrative collections
commonly refer to a single-year interval.
Some countries measure migration by comparing place of residence with place of birth,
which delivers a measure of lifetime migration, and this in fact is the most common
measure of internal migration collected by censuses worldwide (Bell et al. 2014). Lifetime
migration data provide useful insights into the cumulative impact of migration over a
population’s collective lifetime. However, because individuals have been exposed to
migration for varying periods, differences in age structure prejudice comparability between
countries. Moreover, lifetime migration data offer limited insights into contemporary
migration processes.
A third approach to the collection of migration data is based on asking each person’s
previous place of residence (PPR), irrespective of when the migration look place. As noted
above, these data can be filtered by duration of residence, if collected, to generate a
surrogate estimate that approximates a fixed interval transition. Where PPR data are held
in the IMAGE Repository, they have been filtered in this way to approximate either one or
five-year transitions.
2.5 Spatial framework
Countries also vary widely in regard to the number of spatial units into which they are
divided and which are used to record migration. Some countries record all changes of
address, including those that take place within the same region, but for most it is the change
of address that crosses regional boundaries that is recorded in the migration flow matrix
described earlier. The level at spatial scale at which data are collected, as apparent on the
Census form or other record, does not necessarily correspond to the level at which the data
are subsequently coded or made available. At the same time, migration flow matrices for
the same country, source and time interval may be made available at multiple levels of
aggregation. The IMAGE Repository contains origin-destination migration matrices for
countries across the globe at a range of spatial scales. In some countries, boundaries of
administrative areas have changed over time and therefore migration matrices collected at
the same scale for different time periods may have different numbers of origins and
destinations.
3. Inventory of internal migration data
Previous sections have highlighted the diversity of ways in which migration is measured. The
first step in assembling a global repository was therefore to undertake a comprehensive
inventory of internal migration data collection practice in countries around the world. This
section summarises the findings of the IMAGE Inventory conducted in 2013 for the 193 UN

11
member states (Bell et al. 2014). Details for individual countries can be found on-line at
http://qcifvm5.genome.at.uq.edu.au/population/.
The IMAGE Inventory shows that most countries rely on population censuses to measure
internal migration (158 countries). As shown in Table 3, nationally representative surveys
are also widely used (110 countries), while population registers and administrative data
feature in 50 countries and are the dominant collection practice in Europe. Most countries
(109) draw migration statistics from multiple sources.
Table 3 Countries collecting internal migration data since 1995 by region and source
Region Census Register Survey Multiple sources
Total countries collecting data
Total countries
Africa 43 0 38 31 50 54 Asia 37 15 24 27 41 47 Europe 31 32 32 34 41 43 Latin America 32 0 12 12 32 33 Northern America 2 2 2 2 2 2 Oceania 13 1 2 3 13 14
Total 158 50 110 109 179 193
Source: IMAGE Inventory; see Bell et al. (2014)
Among countries using census-based statistics, lifetime migration based on region of birth is
the most common migration measure worldwide (122 countries), but many countries also
measure migration by reference to last place of residence. A total of 52 countries measure
migration over a five-year interval, whereas 29 countries use a one-year interval. A total of
71 countries collect data on duration of residence at their census, often in association with
place of last residence.
Table 4 Countries collecting internal migration data in the 2000 UN Census round by region Type of Data
Total countries collecting
data
Region Observation Period
Duration of residence
One year
Five year Other fixed
interval Lifetime Last move
Africa 9 8 8 29 13 17 32 Asia 2 13 8 27 18 24 35 Europe 13 4 12 25 10 12 31 Latin America 2 17 2 29 12 13 29 Northern America 1 2 0 2 0 0 2 Oceania 2 8 2 10 2 5 13
Total 29 52 32 122 55 71 142
Source: IMAGE Inventory; see Bell et al. (2014)
12
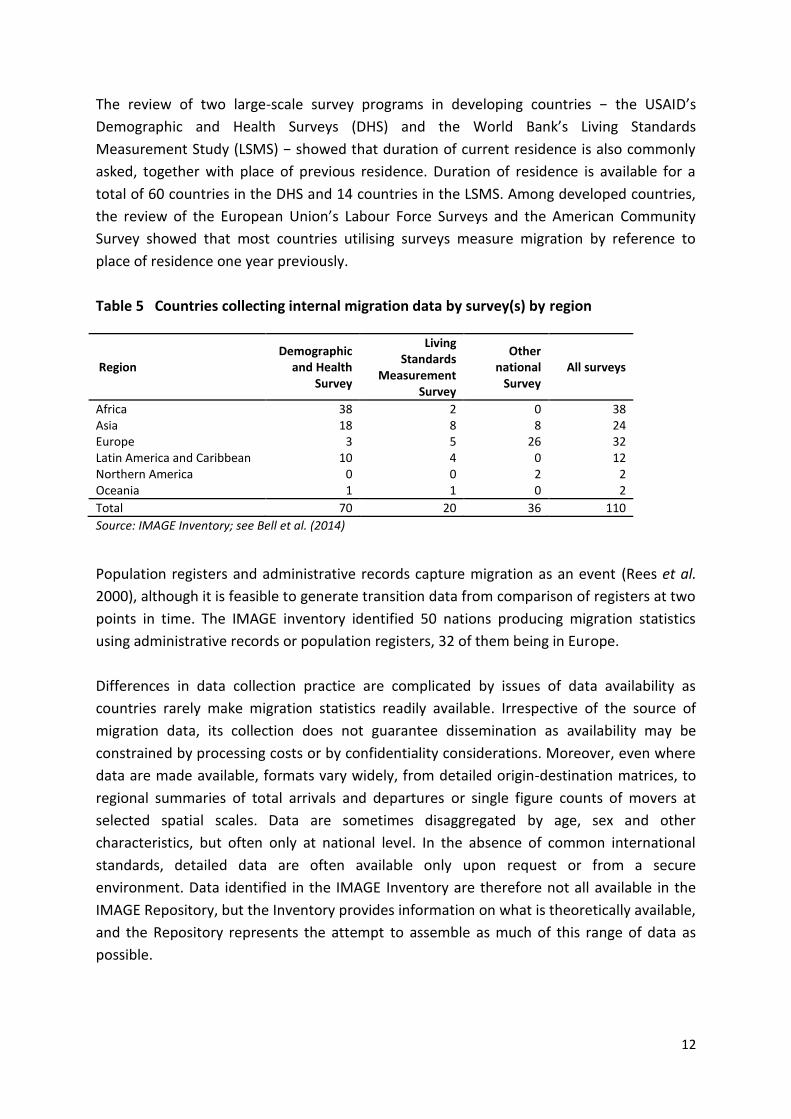
The review of two large-scale survey programs in developing countries − the USAID’s
Demographic and Health Surveys (DHS) and the World Bank’s Living Standards
Measurement Study (LSMS) − showed that duration of current residence is also commonly
asked, together with place of previous residence. Duration of residence is available for a
total of 60 countries in the DHS and 14 countries in the LSMS. Among developed countries,
the review of the European Union’s Labour Force Surveys and the American Community
Survey showed that most countries utilising surveys measure migration by reference to
place of residence one year previously.
Table 5 Countries collecting internal migration data by survey(s) by region
Region Demographic
and Health Survey
Living Standards
Measurement Survey
Other national
Survey All surveys
Africa 38 2 0 38 Asia 18 8 8 24 Europe 3 5 26 32 Latin America and Caribbean 10 4 0 12 Northern America 0 0 2 2 Oceania 1 1 0 2
Total 70 20 36 110
Source: IMAGE Inventory; see Bell et al. (2014)
Population registers and administrative records capture migration as an event (Rees et al.
2000), although it is feasible to generate transition data from comparison of registers at two
points in time. The IMAGE inventory identified 50 nations producing migration statistics
using administrative records or population registers, 32 of them being in Europe.
Differences in data collection practice are complicated by issues of data availability as
countries rarely make migration statistics readily available. Irrespective of the source of
migration data, its collection does not guarantee dissemination as availability may be
constrained by processing costs or by confidentiality considerations. Moreover, even where
data are made available, formats vary widely, from detailed origin-destination matrices, to
regional summaries of total arrivals and departures or single figure counts of movers at
selected spatial scales. Data are sometimes disaggregated by age, sex and other
characteristics, but often only at national level. In the absence of common international
standards, detailed data are often available only upon request or from a secure
environment. Data identified in the IMAGE Inventory are therefore not all available in the
IMAGE Repository, but the Inventory provides information on what is theoretically available,
and the Repository represents the attempt to assemble as much of this range of data as
possible.

13
3 Assembling the IMAGE Repository
3.1 Selection of migration data
To meet the aims of the project in implementing the full suite of migration measures for the
largest possible number of countries, all migration data which we have been able to acquire
for each country have been included in the IMAGE Repository. As a result, a variety of data
types (event, transition and duration) measured over intervals of different lengths (one-year,
five-year, last move and lifetime) are included. For instance, one-year and five-year
transition data are held for Australia whereas one-year event and five-year transition data
are held for Switzerland, and five-year transition and lifetime transition data are held for
Costa Rica. As explained above, migration transitions and events are often measured over
one-year and five-year intervals, so to maximise comparability, data on place of previous
residence (last move) have been filtered by fixed durations of residence of one and five
years to generate surrogate estimates of migration broadly comparable to the conventional
migration transition.
With regard to spatial frameworks, migration flow (origin-destination) matrices have been
collected at the finest available spatial scale. For many countries, flow matrices are made
available at multiple spatial scales corresponding to particular levels of administrative or
statistical geography, and these are catalogued separately in the Repository. In the case of
Canada, for example, the Repository includes a flow matrix for migration between 11
provinces and another for migration between 288 counties.
Some countries do not release full origin-destination matrices but only collect or make
available the marginal totals, corresponding to the aggregate inflows to and outflows from
each zone or region. These data can be used to compute some (though not all) of the
measures listed in Table 1 and may also be available at a finer spatial resolution than flow
matrices. Marginal totals are therefore included in the Repository in cases where complete
flow matrices are unavailable.
Distance measures can be computed only if origin-destination matrices can be coupled with
corresponding digital boundaries. Digital boundaries are also required for mapping and for
the computation of the contiguity matrices used in the spatial aggregation facility in the
IMAGE Studio (Daras 2014; Stillwell et al. 2014) ). Digital boundary files at various levels of
spatial aggregation are therefore included in the Repository.
The type of data collected in each country determines the format in which the data can be
held. Table 6 lists the data included in the IMAGE Repository by type and format. Cells
indicated with n.a. point to a combination of data format and data type that is conceptually
not feasible. For instance, origin-destination matrix and zonal inflows and outflows are not
held for duration data because of the lack of information on previous place of residence.
However, migration flows are available for last move data, because they combine place of
14
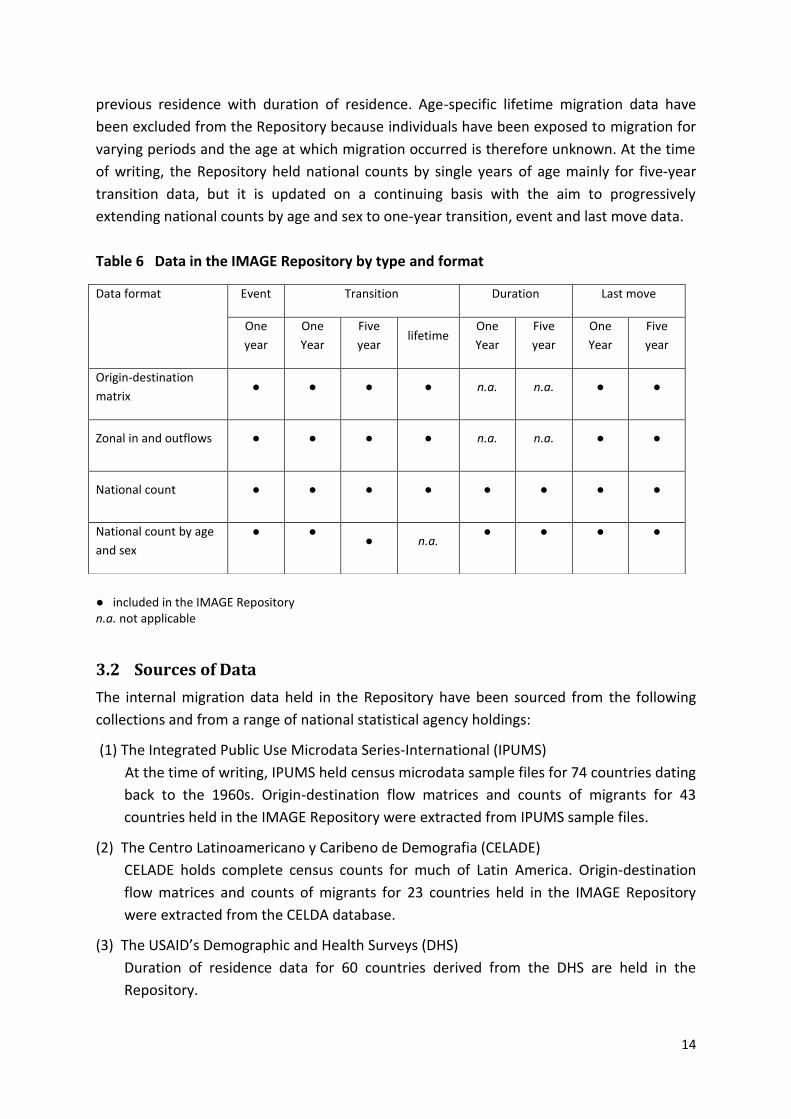
previous residence with duration of residence. Age-specific lifetime migration data have
been excluded from the Repository because individuals have been exposed to migration for
varying periods and the age at which migration occurred is therefore unknown. At the time
of writing, the Repository held national counts by single years of age mainly for five-year
transition data, but it is updated on a continuing basis with the aim to progressively
extending national counts by age and sex to one-year transition, event and last move data.
Table 6 Data in the IMAGE Repository by type and format
● included in the IMAGE Repository n.a. not applicable
3.2 Sources of Data
The internal migration data held in the Repository have been sourced from the following
collections and from a range of national statistical agency holdings:
(1) The Integrated Public Use Microdata Series-International (IPUMS)
At the time of writing, IPUMS held census microdata sample files for 74 countries dating
back to the 1960s. Origin-destination flow matrices and counts of migrants for 43
countries held in the IMAGE Repository were extracted from IPUMS sample files.
(2) The Centro Latinoamericano y Caribeno de Demografia (CELADE)
CELADE holds complete census counts for much of Latin America. Origin-destination
flow matrices and counts of migrants for 23 countries held in the IMAGE Repository
were extracted from the CELDA database.
(3) The USAID’s Demographic and Health Surveys (DHS)
Duration of residence data for 60 countries derived from the DHS are held in the
Repository.
Data format Event Transition Duration Last move
One
year
One
Year
Five
year lifetime
One
Year
Five
year
One
Year
Five
year
Origin-destination
matrix ● ● ● ● n.a. n.a. ● ●
Zonal in and outflows ● ● ● ● n.a. n.a. ● ●
National count ● ● ● ● ● ● ● ●
National count by age
and sex
● ● ● n.a.
● ● ● ●
15
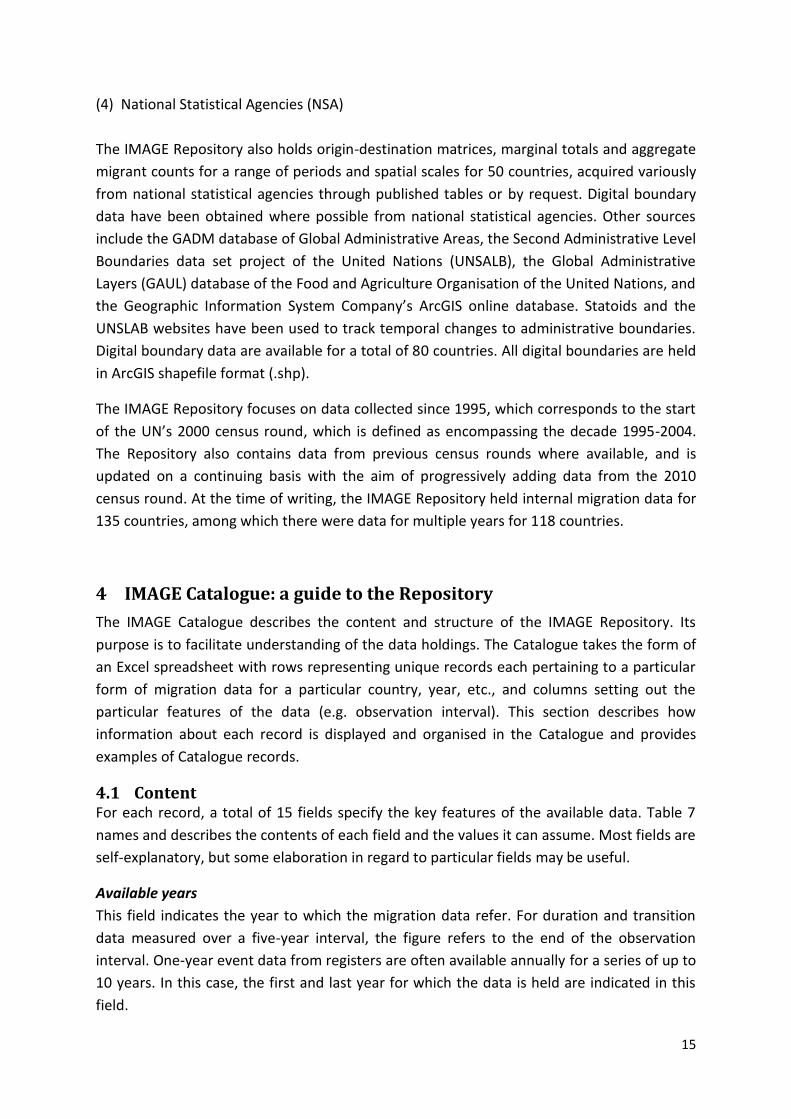
(4) National Statistical Agencies (NSA)
The IMAGE Repository also holds origin-destination matrices, marginal totals and aggregate
migrant counts for a range of periods and spatial scales for 50 countries, acquired variously
from national statistical agencies through published tables or by request. Digital boundary
data have been obtained where possible from national statistical agencies. Other sources
include the GADM database of Global Administrative Areas, the Second Administrative Level
Boundaries data set project of the United Nations (UNSALB), the Global Administrative
Layers (GAUL) database of the Food and Agriculture Organisation of the United Nations, and
the Geographic Information System Company’s ArcGIS online database. Statoids and the
UNSLAB websites have been used to track temporal changes to administrative boundaries.
Digital boundary data are available for a total of 80 countries. All digital boundaries are held
in ArcGIS shapefile format (.shp).
The IMAGE Repository focuses on data collected since 1995, which corresponds to the start
of the UN’s 2000 census round, which is defined as encompassing the decade 1995-2004.
The Repository also contains data from previous census rounds where available, and is
updated on a continuing basis with the aim of progressively adding data from the 2010
census round. At the time of writing, the IMAGE Repository held internal migration data for
135 countries, among which there were data for multiple years for 118 countries.
4 IMAGE Catalogue: a guide to the Repository
The IMAGE Catalogue describes the content and structure of the IMAGE Repository. Its
purpose is to facilitate understanding of the data holdings. The Catalogue takes the form of
an Excel spreadsheet with rows representing unique records each pertaining to a particular
form of migration data for a particular country, year, etc., and columns setting out the
particular features of the data (e.g. observation interval). This section describes how
information about each record is displayed and organised in the Catalogue and provides
examples of Catalogue records.
4.1 Content For each record, a total of 15 fields specify the key features of the available data. Table 7
names and describes the contents of each field and the values it can assume. Most fields are
self-explanatory, but some elaboration in regard to particular fields may be useful.
Available years
This field indicates the year to which the migration data refer. For duration and transition
data measured over a five-year interval, the figure refers to the end of the observation
interval. One-year event data from registers are often available annually for a series of up to
10 years. In this case, the first and last year for which the data is held are indicated in this
field.

16
It is important to recognise that available years vary by collection instrument. In the case of
censuses, data are referenced to a particular date, reflecting the timing of the census. In
Table 7 this is represented by a single year in the “Year” field. For registers, data are
assembled for 12 month periods usually corresponding to the calendar year. Where time
series data are available, the “Year” field indicates the first and last year for which data are
held separated by a dash (“-“). For surveys, available years reflect the duration of the field
work which may extend over multiple calendar years. In such instances, the start and finish
year of the field work is indicated with these separated by a forward slash.
Collection Instrument
The data held in the Repository are drawn from three main sources: population censuses,
population registers and national sample surveys. Estimates of migration are also generated
in some countries (Lomax et al. 2013; Raymer 2010), and these data are also incorporated in
the Repository where available. In the case of surveys, it is important to clarify the type of
survey and the survey universe. These are specified in Fields 12 and 13.
Table 7 Fields in the IMAGE Catalogue
Field Description Values
1 Country Country for which the data is held
- Country name
2 Region World region in which the country is located
- Africa - Asia - Europe - Latin America and the Caribbean - North America - Oceania
3 Available years Year(s) the migration data refer to
- Year -
4 Collection Instrument Instrument used to collect internal migration
- Census - Survey - Register - Estimate
5 Zones System of geographic zones against which migration is recorded
- Number of zones (n) - All changes of address (ACA) - Imprecise place of residence (IPR)
6 Data type Way migration is measured
- Event (E) - Transition (T) - Last move (LM) - Duration (D)
7 Interval
Interval over which migration is measured
- One year (1) - Five year (5) - Lifetime (na) - Other (specify)
8 Data format Nature of the migration data held in the file
- OD matrix (OD) - Zonal inflows and outflows(ZIO) - National counts (NC) - National counts by age and sex (NC_AS)
9 Population at risk Population at risk of moving
- National population at risk (PAR) - Zonal population at risk (ZPAR) - National population at risk by age and sex

17
(PAR_AS)
10 Survey universe Population covered by the survey
- Specifies the survey universe (e.g. people of working age)
- Not applicable to data from sources other than surveys (na)
11 Survey acronym Survey from which the sample was obtained
- DHS (This is the only survey from which survey data were held in the Repository at the time of writing)
- Not applicable to data from sources other than surveys (na)
12 Migration data source
Organisation from which the data were sourced
- IPUMS - CELADE - USaid - NSA
13 Digital boundaries Digital boundary file harmonised with OD matrix
- Harmonised digital boundaries are held (Y) - Harmonised digital boundaries are not held (N)
14 Contiguity file Digital files identifying adjacent regions
- File indicating contiguity between each pair of zones is held (Y)
- File indicating contiguity between each pair of zones is not held (N)
15 Digital boundaries source
Organisation from which the data were sourced
- NSA - GADM - UNSALB - GAUL - ESRI - EUROSTAT
Zones
Most migration data in the Repository take the form of flow matrices which represent the
movements between a specified set of origins and destinations. Most such matrices are
square so that the number of origins matches the number of destinations. The zones field
specifies the number of zones in the matrix, and is therefore equivalent to the number of
rows and columns. In cases when the file only contains marginal totals, the same applies.
For a total of 10 countries, the number of origins and destinations does not match because
changes to administrative boundaries could not be reconciled. In that case, the zone field
specifies the number of both origins and destinations. A country will have multiple entries if
migration data are available in the Repository at different levels of geography. Where the
file refers to all moves in the country, this is indicated by the acronym ACA indicating that it
represents All Changes of Address. The term Imprecise Place of Residence (IPR) indicates
that the zonal framework is unclear or ambiguous. This occurs primarily in the case of
duration of residence data derived from the DHS.
Data type
The data field indicates the type of data that are held in the Repository. Four types of data
are recognised:
- event data, which are usually derived from population registers or administrative
collections;
18
- transition data, which are obtained by comparing place of residence at two points in
time, and are commonly drawn from censuses and surveys;
- last move data, which are obtained by combining place of previous residence with
duration of residence, and are drawn from censuses and surveys; and
- duration of residence data, which are obtained when information on duration of
residence data are held in the Repository without reference to previous place of
residence. Data in this form are most commonly drawn from censuses and surveys.
Interval
This field specifies the interval over which migration is measured. Event data are generally
made available for single-year intervals whereas transition data can refer to any length of
interval. For fixed interval data, the most common intervals are one and five years. For the
few countries employing other fixed intervals, the length of the interval is specified in the
catalogue. For comparability, last move and duration data have been computed only for one
and five year intervals. Lifetime migration based on region of birth is the most common
migration measure in the Repository. However, there is no fixed interval for lifetime data, so
the interval variable takes the value n.a. in the catalogue.
Data format
This field indicates whether migrants (transition/duration/last move data) and migrations
(event data) are held in the form of origin-destination flow matrices, marginal totals
capturing total arrivals and departures, or national counts of all moves. This field also
specifies whether national counts of migrants/migrations are disaggregated by age and
single year of age. Sex has not been a prime focus of the IMAGE project and count data by
sex are available only for a few countries.
Population at Risk
This field denotes the national and zonal populations at risk of moving during the interval
over which migration is measured. For transition data, the preferred population at risk (PAR)
is the population at the origin at the start of the observation interval (see Rees et al., 2000).
However, in some countries (e.g. the UK) this is not readily available from published
statistics and the population at the end of interval is commonly substituted. For last move
and duration data, the PAR is the number of people living in the designated zone for longer
than the observation interval (one or five years) plus the number of migrants. For event data,
PAR is the mid-year population estimate (Rees et al., 2000) unless the migration interval is
from mid-year to mid-year, in which case the start of period population is used. The field
indicates whether PAR data are held. In addition to the national PAR, zonal populations at
risk are held in files containing origin-destination matrices and marginal totals.

19
Digital Boundaries
This field indicates whether a file containing digital boundaries matching the zones against
which migration is recorded are held in the Repository. The digital boundary data were
constructed by matching spatial units in the shapefile to that of the origin-destination
matrix. Unlike the PAR data, which are always held in the same file as the associated
migration data, digital boundary files are held separately. All digital boundaries are held as
ESRI shapefile (.shp).
Contiguity File
This field indicates whether a contiguity file comprising pairwise data that identify
contiguous zones is available. Where such a file has been created, the data were
constructed using the IMAGE Studio, which automatically identifies adjacent zones sharing a
boundary based on Queen contiguities (i.e. sharing at least one boundary data point). For
neighbouring zones not sharing a boundary, such as islands, geographic proximity and
transport routes were used to identify and manually add the missing connections between
zones to the contiguity file. This file is used in the IMAGE Studio to aggregate administrative
units, and ultimately to compute migration measures at different spatial scales.
4.2 Structure
The catalogue is held in the form of an Excel spreadsheet. The first row of the catalogue
contains the column headings of the 15 fields, and subsequent rows contain unique records.
As noted earlier, all available migration data have been included in the Repository in order
to maximise coverage. Thus, there are often multiple datasets for an individual country
pertaining to particular years, spatial scales, data types, etc. For ease of access and
reference, the Repository has been organised such that there is a single entry per year, per
instrument, per level of geography, per migration data type and per measurement interval.
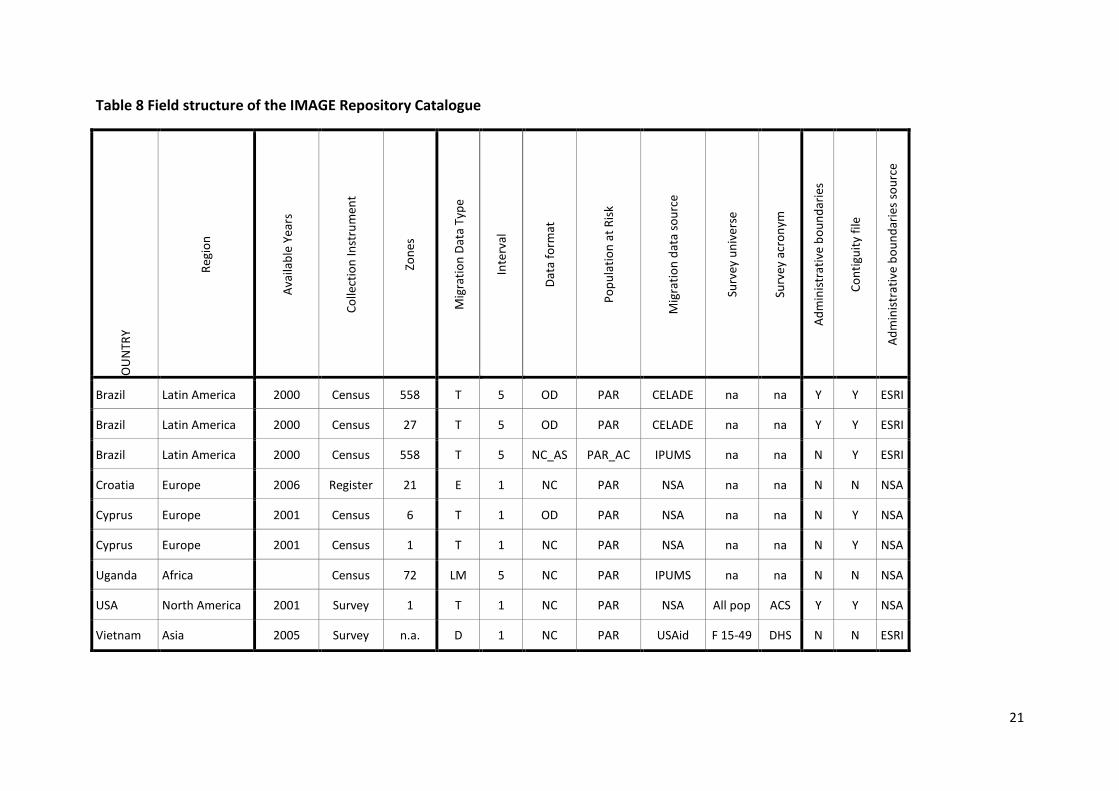
Table 8 provides examples of catalogue records and shows instances where multiple records
are held for an individual country.
5 IMAGE Repository: files and content
This section describes the data files available for each record in the catalogue. The number
and type of data files vary depending on the features of the data assembled for each entry.
This section first lists the different data files that are held in the Repository, and then
describes the naming conventions established for those files.
5.1 Data files availability For each record in the catalogue, up to three files are available:
(1) Migration data file

20
(2) Digital boundary file
(3) Contiguity file
The migration data file contains either an origin-destination matrix, zonal inflows and
outflows, or national counts of movers. For ease of use, population at risk data are always
included in the migration data file. Migration data files are held as Excel spreadsheets and
are structured as follows:
(1) Origin-Destination (OD) matrix files:
Sheet 1: Origin-destination matrix, with diagonal elements set to zero
Sheet 2: National and zonal populations at risk
Sheet 3: Single columns containing the elements of the diagonal, where available. The
columns contain one or more of the following and are clearly labelled as such:
(a) all moves which occurred within each region,
(b) moves which occurred between zones within the region, and/or,
(c) non-movers.
Sheet 4: Notes (e.g. data sources, population coverage and population at risk)
(2) Zonal inflows and outflows:
Sheet 1: Zonal migration flows and population at risk
(3) National count:
Sheet 1: Counts of migrants and population at risk
Sheet 2: Counts of migrants and population at risk by age and sex (when available).
For some records held in origin-destination matrix format, a digital boundary file and a
contiguity file are also available. The former are in ArcGIS shapefile and the latter are in CSV
format.
21
Table 8 Field structure of the IMAGE Repository Catalogue
OU
NTR
Y
Reg
ion
Ava
ilab
le Y
ears
Co
llect
ion
Inst
rum
ent
Zon
es
Mig
rati
on
Dat
a Ty
pe
Inte
rval
Dat
a fo
rmat
Po
pu
lati
on
at
Ris
k
Mig
rati
on
dat
a so
urc
e
Surv
ey u
niv
erse
Surv
ey a
cro
nym
Ad
min
istr
ativ
e b
ou
nd
arie
s
Co
nti
guit
y fi
le
Ad
min
istr
ativ
e b
ou
nd
arie
s so
urc
e
Brazil Latin America 2000 Census 558 T 5 OD PAR CELADE na na Y Y ESRI
Brazil Latin America 2000 Census 27 T 5 OD PAR CELADE na na Y Y ESRI
Brazil Latin America 2000 Census 558 T 5 NC_AS PAR_AC IPUMS na na N Y ESRI
Croatia Europe 2006 Register 21 E 1 NC PAR NSA na na N N NSA
Cyprus Europe 2001 Census 6 T 1 OD PAR NSA na na N Y NSA
Cyprus Europe 2001 Census 1 T 1 NC PAR NSA na na N Y NSA
Uganda Africa
Census 72 LM 5 NC PAR IPUMS na na N N NSA
USA North America 2001 Survey 1 T 1 NC PAR NSA All pop ACS Y Y NSA
Vietnam Asia 2005 Survey n.a. D 1 NC PAR USAid F 15-49 DHS N N ESRI

22
5.2 Files naming conventions
To identify each file easily, the naming conventions adopted in the Excel spreadsheet for the
migration data files (Table 9), ArcGIS digital boundaries files and CSV contiguity files follow
the structure of the catalogue as shown in Table 7. Migration data files are named according
to the catalogue fields in the order described in Table 7, with the exception of world region,
and survey universe and acronym, which are not included. The examples in Table 9 show
that migration at the 2001 Argentinian census was measured between 24 zones over a five-
year interval and data are available in origin-destination matrix format obtained from
CELADE, whereas migration data in Brazil were obtained from IPUMS from the 2000 Census
and were measured as a five-year transition between 558 zones available as a national
count of movers.
Table 9 Migration data file naming conventions
Examples: Argentina_2001_C_24_T_5_OD_CELADE.xls Brazil_2000_C_588_T_5_NC_IPUMS.xls
The names of digital boundaries and contiguity files in the Catalogue indicate the year,
number of zones and source of the data. For Brazil, for example, the files for digital
boundaries for 588 zones in 2000 and their contiguities, obtained from the NSA are
Brazil_2000_588_NSA.shp and Brazil_2000_588_NSA.csv respectively.
5.3 Summary of data holdings
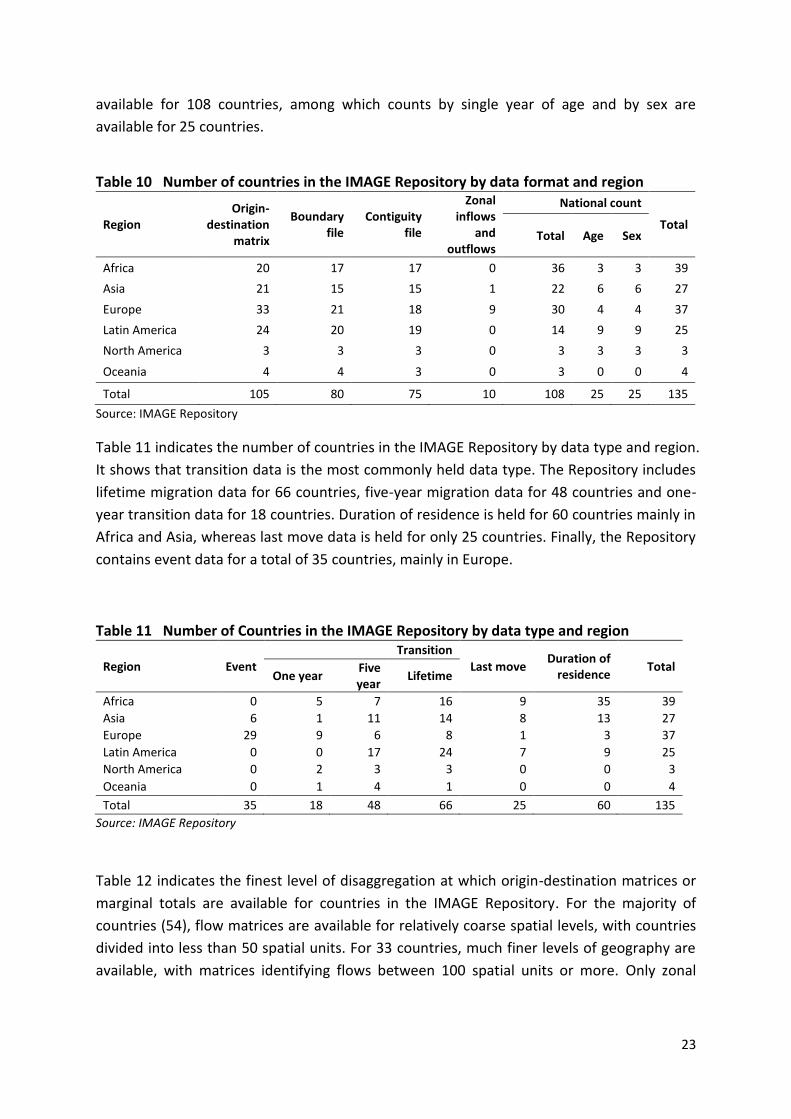
At the time of writing, the IMAGE Repository contained migration data for 135 countries
encompassing all the major world regions. Table 10 displays the number of countries in the
IMAGE Repository by data format and region. It shows that origin-destination matrices are
available for 105 countries. Of these, a boundary file is available for 80 countries, and of
these, a contiguity file is available for 75 countries. For the 105 countries with origin-
destination matrices, zonal inflows and outflows can be generated from the matrices.
However, additional zonal inflow and outflows are held for 10 of these countries. These
additional zonal inflows and outflows provide migration data either at a different
geographic scale, or for a different data type or for a different time period than those the
data held in the form of origin-destination matrices. National counts of move(r)s are
Country Year Census (C) Survey (S) Register (R)
Zones
Event (E) Transition (T) Last move (LM) Duration (D)
One year (1) Five year (5) Lifetime (na)
OD matrix (OD) Zonal in and flows(ZIO) National counts (NC) National counts by age and sex (NC_AS)
CELADE IPUMS USAid NSA
Argentina 2001 C 24 T 5 OD CELADE
Brazil 2000 C 558 T 5 NC IPUMS
23
available for 108 countries, among which counts by single year of age and by sex are
available for 25 countries.
Table 10 Number of countries in the IMAGE Repository by data format and region
Region Origin-
destination matrix
Boundary file
Contiguity file
Zonal inflows
and outflows
National count
Total Total Age Sex
Africa 20 17 17 0 36 3 3 39
Asia 21 15 15 1 22 6 6 27
Europe 33 21 18 9 30 4 4 37
Latin America 24 20 19 0 14 9 9 25
North America 3 3 3 0 3 3 3 3
Oceania 4 4 3 0 3 0 0 4
Total 105 80 75 10 108 25 25 135
Source: IMAGE Repository
Table 11 indicates the number of countries in the IMAGE Repository by data type and region.
It shows that transition data is the most commonly held data type. The Repository includes
lifetime migration data for 66 countries, five-year migration data for 48 countries and one-
year transition data for 18 countries. Duration of residence is held for 60 countries mainly in
Africa and Asia, whereas last move data is held for only 25 countries. Finally, the Repository
contains event data for a total of 35 countries, mainly in Europe.
Table 11 Number of Countries in the IMAGE Repository by data type and region
Region Event
Transition
Last move Duration of
residence Total
One year Five year
Lifetime
Africa 0 5 7 16 9 35 39
Asia 6 1 11 14 8 13 27
Europe 29 9 6 8 1 3 37
Latin America 0 0 17 24 7 9 25
North America 0 2 3 3 0 0 3
Oceania 0 1 4 1 0 0 4
Total 35 18 48 66 25 60 135
Source: IMAGE Repository
Table 12 indicates the finest level of disaggregation at which origin-destination matrices or
marginal totals are available for countries in the IMAGE Repository. For the majority of
countries (54), flow matrices are available for relatively coarse spatial levels, with countries
divided into less than 50 spatial units. For 33 countries, much finer levels of geography are
available, with matrices identifying flows between 100 spatial units or more. Only zonal

24
inflows and outflows are available for a relatively small number of countries across the five
categories.
Table 12 Number of countries in the IMAGE Repository by data format and lowest level of geography
Number of zones Origin-destination matrix Zonal inflows and outflows
<50 54 3
50 to 99 18 1
100 to 199 11 2
200 to 399 10 3
>400 12 1
Total 105 10
6 Access to the IMAGE Repository To request access to data from the IMAGE Repository, please return the completed form
below to [email protected]. The distribution of data from the IMAGE Repository is
governed by conditions of use particular to each national statistical agency and organisation
from which data collections were sourced. Thus, not all data can be passed on to third
parties. If you have access to data, which you would like to add to the IMAGE Repository, we
welcome your contribution. Please contact us at [email protected].
Table 13 Image Repository data request form
IMAGE REPOSITORY
DATA REQUEST FORM
PERSONAL INFORMATION
Title:
First name: Last name:
Email address
Country of residence:
Department and Research Institution/Affiliation:
Research filed: Demography Geography Economics

25
Statistics Other, academic Other, non-academic
Status: Faculty Student Academic researcher Statistics Other, academic Other, non-academic
RESEARCH PROJECT
Anticipated output:
Journal paper Conference paper Book Book chapter Thesis, doctoral Thesis , other Policy report Teaching material Other
Please describe in at least 100 words your research project or education use for the data.
DATA REQUEST
To request data for multiple countries, please duplicate the rows below for each country of interest.
Country:
Year(s):
Instrument Register Census Survey Estimate
Regions (number):
Data type Event Transition Last move Duration
Interval Lifetime 5 years 1 years Other interval (specify)
Data format OD matrix Digital boundaries Total national count National count by sex National count by
age

26
Zonal count Inflows and outflows
CONDITIONS OF USE
Please check all of the following boxes to indicate that you agree to abide by the conditions of use
Data must not be redistributed without authorisation. Data are intended only for scholarly research and educational purposes. Commercial use and redistribution of the data is strictly prohibited. Scholarly publications must cite the IMAGE project appropriately. User agrees to receive occasional email messages about the IMAGE Project.
27
References
Bell, M., Blake, M., Boyle, P., Duke-Williams, O., Rees, P., Stillwell, J., & Hugo, G. (2002). Cross-national comparison of internal migration: issues and measures. Journal of the Royal Statistical Society: Series A (Statistics in Society), 165(3), 435-464.
Bell, M., Charles-Edwards, E., Kupiszewska, D., Kupiszewski, M., Stillwell, J., & Zhu, Y. (2014). Internal Migration Data Around the World: Assessing Contemporary Practice. Population, Space and Place. doi: 10.1002/psp.1848.
Bell, M., Charles-Edwards, E., Kupiszewska, D., Kupiszewski, M., Stillwell, J., & Zhu, Y. (under review). Internal migration and development: comparing migration intensities around the world. Population, Space and Place
Bell, M., & Rees, P. (2006). Comparing migration in Britain and Australia: harmonisation through use of age-time plans. Environment and Planning A, 38(50), 959-988.
Boden, P., Stillwell, J., & Rees, P. (1991). Internal migration projection in England: the OPCS/DOE model examined. London: Belhaven.
Daras, K. (2014). IMAGE Studio 1.1 User Manual Working Paper: University of Leeds.
Kitsul, P., & Philipov, D. (1981). The One-Year-Five-Year Migration Problem Advances in Multiregional Demography, Research Report 81-6. Laxenburg, Austria: International Institute for Applied Systems Analysis.
Lomax, N., Norman, P., Rees, P., & Stillwell, J. (2013). Subnational migration in the United Kingdom: producing a consistent time series using a combination of available data and estimates. Journal of Population Research, 30(3), 265-288.
Long, L., & Boertlein, C. G. (1990). Comparing migration measures having different intervals Current Population Reports, Series P-23 (pp. 1-11). Washington DC: US Bureau of Census.
Raymer, J. (2010). A general framework for estimating population movements. In T. Salzman, B. Edmonston & J. Raymer (Eds.), Demographic Aspects of Migration (pp. 73-96). Heidelberg, Germany: VS Verlag für Sozialwissenschaften
Rees, P., Bell, M., Duke-Williams, O., & Blake, M. (2000). Problems and solutions in the measurement of migration intensities: Australia and Britain compared. Population Studies, 54(2), 207-222.
Rogers, A., Raymer, J., & Newbold, K. B. (2003). Reconciling and translating migration data collected over time intervals of differing widths. The Annals of Regional Science, 37(4), 581-601.
Rogerson, P. A. (1990). Migration analysis using data with time intervals of differing widths. Papers of the Regional Science Association, 68, 97-106.
Stillwell, J., Daras, K., Bell, M., & Lomax, N. (2014). The IMAGE studio: a tool for internal migration analysis and modelling. Applied Spatial Analysis and Policy, 7(1), 5-23.

28