the impact of a business plan competition on selected
TRANSCRIPT

The Impact of a Business Plan Competition on Selected
Economic Outcomes for Horticultural Farmers in Rwanda∗
Mohamed Abouaziza
Department of Economics, University of Sussex, Brighton, United Kingdom
Abstract
Business plan competitions have the potential to play a crucial role in boost-
ing entrepreneurship through, for example, the alleviation of credit constraints.
However, the existing literature does not address the impact of these competi-
tions for farmers. In this paper, we address this aspect by studying the impact of
winning a business plan competition on selected outcomes of interest exploiting
data drawn from a sample of horticulture farmers in Rwanda. Using a regression
discontinuity framework, the empirical findings reveal that the competition has a
positive impact on certain household business outcomes and inputs. Specifically,
winning the competition raises the likelihood of securing formal funding and in-
creases the income of seasonal horticultural crops.
JEL Codes: L26, L53, M13, O13, Q12, Q13, Q14
Corresponding Author: Mohamed Abouaziza ([email protected])
∗The author is grateful for comments received at the Royal Economic Society conference 2021 and
the economics internal seminar at the University of Sussex. The author is also grateful to the Re-
search and Impact Assessment Division (RIA) at the International Fund for Agricultural Development
(IFAD) for permission to use the PRICE impact evaluation data in this paper. Special thanks are also
due to the National Agricultural Export Development Board (NAEB) staff and the Single Project Im-
plementation Unit (SPIU) who were responsible for the PRICE project in Rwanda. Benjamin D. K.
Wood, RIA team, and Andreas Kutka are also thanked for their support throughout this work. We
are also indebted to Anna Vitali and Emma Riley for their comments on an earlier draft of this paper.
Impact assessment registry no. RIDIE-STUDY-ID-5d64ecc3e241c on Registry for International Devel-
opment Impact Evaluations (RIDIE). The views expressed here are those of the authors alone and do
not necessarily represent those of IFAD or any other organizations.1

1 Introduction
Small and medium-sized enterprises (SMEs) play a vital role in the economic devel-
opment process (Neumark, Wall & Zhang, 2011; Martin, Nataraj & Harrison, 2017).
Yet, they still face many constraints in developing countries1 with credit constraints
one of the main impediments confronting SMEs in the agriculture sector in particular
(Just, Wolf, Wu & Zilberman, 2002; Guirkinger & Boucher, 2008). Policy-makers ex-
ploit various tools to mitigate these constraints, one of which is running business plan
competitions where potential entrepreneurs develop business plans and typically obtain
feedback from an outside committee.2 The overarching goals of these competitions in-
clude encouraging entrepreneurs to participate in these competitions, supporting the
entrepreneurs to develop business plans, and mitigating credit constraints through ei-
ther assistance in securing funding or offering direct funding as a reward for winning
these competitions (Howell, 2019).
The effectiveness of business plan competitions on business outcomes, as well as their
corresponding awards, have been contentious with research findings mixed on this issue.
The recent empirical evidence is summarized in Table A1, which is briefly reviewed
here. Using a large-scale RCT in Nigeria, McKenzie & Sansone (2019) conclude that
business plan scores are not correlated with business survival, sales, and profits. In con-
trast, McKenzie (2017) and Howell (2019) report that business plan scores and being a
business plan competition winner are strong predictors of business plan success.3 How-
ever, the extant literature does not examine the impacts of these competitions for po-1These include regulations (Djankov, La Porta, Lopez-de Silanes & Shleifer, 2002), infrastructure
(Datta, 2012; Falentina & Resosudarmo, 2019), macroeconomic uncertainty (Svensson, 1998), credit
access (Banerjee & Duflo, 2014; Udry & Anagol, 2006), and capital intensity (Bigsten & Gebreeyesus,
2007).2Business plan competitions are typically based on scoring with respect to a set of specific selection
criteria, and are associated with awards including access to microcredit through loans, grants, training,
monitoring up to business implementation, or a combination of all or some of these.3The role of machine learning techniques in predicting business plan success, as an alternative tool
to a judge’s scoring, is also controversial (Coad & Srhoj, 2019; McKenzie & Sansone, 2019).
2

tential entrepreneurs in agricultural settings where credit constraints may be a more
pertinent issue than in other sectors (Boucher, Guirkinger & Trivelli, 2009). There-
fore, this gap in the literature is addressed by assessing the impact of a national busi-
ness plan competition on selected outcomes using data on 3,000 horticulture farmers in
Rwanda over the period 2013-16.4
The design of the business plan competition used in this context differed from other
competitions along several dimensions. It included supporting farmers to develop their
business plans and then subsequently monitoring farmers until the implementation of
their business plans. First, the immediate award was an endorsement letter if an appli-
cant scored above a specific threshold. Second, the award was a matching grant once
a loan was secured from a Micro- Finance Institution (MFI) on condition of the repay-
ment of 50 percent of the loan in a timely manner. The competition was implemented
by the government of Rwanda (GoR) with the support of the Umurenge Savings and
Credit Cooperatives (hereafter defined as SACCOs).5 The SACCOs were the informa-
tion diffusion points among farmers for this competition. Winners of this competition
received an endorsement letter from the GoR indicating their business plans were fea-
sible. Out of the 3,000 applicants, around 400 business plans were endorsed, and 177
farmers received the grant.
The setting of this competition allows us to assess the impact of winning the competi-
tion and receiving an endorsement letter (the endorsement effect) on household busi-
ness outcomes and inputs. In order to do so, cross-sectional household survey data col-
lected in 2018 comprising 1,578 horticulture farmers are used. We exploit the fact that
the business plans of the participating farmers were scored externally based on pre-
determined selection criteria with participants assigned to the endorsement treatment4These farmers grow a wide array of crops including tamarillo, passion fruit, pineapple, tomatoes,
avocado, garlic, onions, beans, carrots, hot pepper, cabbage, eggplant, and flowers.5Umurenge refers to the third level administrative subdivisions (or sectors) in Rwanda. According
to the Rwanda Cooperative Agency (RCA), the Government of Rwanda developed a national strategy
in 2008 to establish a SACCO in each of its 416 sectors. The main reason was to encourage Rwandans,
especially in rural areas, to access finance through formal institutions.
3

solely on the basis of a threshold score. This facilitates use of a regression discontinuity
design (RDD) framework to elicit the causal effect of endorsement. The main assump-
tion is that farmers who scored just below and above the passing score have similar
baseline characteristics, which provides us with a setting that is as close with that of
randomized experiments.
Our main results reveal that winning the competition with an endorsement letter in-
creases the likelihood of securing formal loans as well as enhancing farmer income as-
sociated with horticultural seasonal crops. Yet, the competition proved more effective
when endorsing farmers with existing rather than new business lines. The results sug-
gest that business plan competitions can be an effective tool to mitigate credit con-
straints among farmers even without immediate monetary awards. Approximately 70
percent of those applicants who did not win in the competition implemented their busi-
ness plans. Thus, in a context of limited funding for developmental projects, the busi-
ness plan competition was found to boost entrepreneurship among both successful and
unsuccessful participants.
This paper contributes to two independent strands of the existing literature within the
agricultural sector centred around business plan competition and credit constraints.
The evidence on the effectiveness of business plan competitions is thin and does not
assess competitions in agricultural settings. For example, based on a sample of 1,310
applicants, Klinger & Schundeln (2011) find that business training with a prize ranging
from between USD 6,000 and USD 15,000 increases the likelihood of starting a business
or expanding an existing business in three Central American countries. Fafchamps &
Quinn (2017), using a sample of 750 applicants, report that winning USD 1,000 cash
prizes in a business plan competition increases the probability of self-employment. Us-
ing a national business plan competition in Nigeria with a sample of 3,139 applicants,
McKenzie (2017) concludes that winning with a prize of USD 50,000, coupled with
training and monitoring, leads to higher firm entry and survival with increased em-
ployment and profits. Based on an RCT using a sample of 400 applicants in Ghana,
Fafchamps & Woodruff (2017), however, find business training without funding has no4

significant impact on business growth. Unlike studies that focus on different types of
potential entrepreneurs, this paper adds to the existing literature through studying a
national competition within an agricultural setting, where entrepreneurship constraints
are generally more severe (Boucher et al., 2009).
The paper also adds to the more developed literature on credit constraints among farm-
ers. Most of this literature focuses on the effects of alleviating credit constraints through
providing assets or grants. This is the case with Bandiera, Burgess, Das, Gulesci, Rasul
& Sulaiman (2017) which explore the transfers of livestock assets to women in Bangladesh,
Blattman, Fiala & Martinez (2014) study grants to young adults in Uganda, and de Mel,
McKenzie & Woodruff (2008) analyze the effects of capital gifts in the form of machin-
ery or cash to micro-entrepreneurs in Sri Lanka. The current paper provides evidence
that business plan competitions among farmers can be an effective tool to mitigate
credit constraints, which does not require the need for providing assets or grants. Sup-
porting farmers to develop business plans and negotiating with financial institutions on
their behalf can also alleviate credit constraints. We show that these types of competi-
tions are cost effective and provide a signal to financial institutions that some farmers
can be credit-worthy without immediate monetary awards for winners.
The remainder of this paper is organized as follows. Section 2 presents some back-
ground on the horticulture sector in Rwanda and contains a description of the business
plan competition. Detailed information about the sample, the data collected and de-
scriptive statistics are discussed in Section 3. The empirical identification strategy is
outlined in Section 4, after which the results are discussed in Section 5, and a set of ro-
bustness checks provided in Section 6. The conclusion and policy implications of the
findings are reviewed in the final section.
5

2 Background
In this section, we present an overview of the horticulture sector in Rwanda as well as
outline the context of the business plan competition implemented among horticulture
farmers in Rwanda.
2.1 Horticulture Sector in Rwanda
Rwanda has been one of the fastest-growing economies in East Africa. Although poverty
is still prevalent with more than 50 percent of the population living on less than USD
1.90 a day (and 38 percent if the local poverty line is used), annual GDP growth has
been estimated at 7.4 percent on average over the ten-year period between 2008 and
2018 (World Bank, 2020). Agriculture accounts for about a 30 percent share of GDP
over the same period. The contribution of agriculture to employment is somewhat larger
(55 percent of male and 27 percent of female employment). According to the Agricul-
tural Household Survey (AHS) 2017 in Rwanda, 80 percent of households in Rwanda
participate in some form of agriculture-related activity.
Horticulture farmers mainly grow vegetables, fruits and flowers with almost all crop-
producing households in Rwanda engaged in horticulture crop production. The cul-
tivation of these crops assists rural households in terms of income diversification. In
addition, the activity not only provides a source of increasing income through crop
sales but is also an important channel for the enhanced nutrition of household mem-
bers through home consumption. For instance, according to the Agricultural Household
Survey (AHS) 2017 in Rwanda, about 50 percent of crop-producing households cul-
tivate bush beans, out of which 30 percent are sold with around 40 percent used for
home consumption, and the remainder allocated to other usages such as seeds or farm
rent. On the other hand, at least 80 percent of most fruits and vegetables produced
are sold. Nevertheless, according to the 2013 Rwanda Horticulture Organizations Sur-
vey, around 75 percent of farmer horticultural produce is sold within a local market in
Rwanda (Clay & Turatsinze, 2014).6

The horticulture sector has the potential to increase foreign trade. The Government
of Rwanda has been trying to diversify exports through many channels, one of which
identified is the horticulture sector. The government policy is designed not only to in-
crease the production of the horticulture crops to meet local demand but also to de-
velop the value chain of these crops and increase horticulture exports. According to
FAOSTAT as of 2019, Rwanda is a net exporter of certain horticulture crops (e.g.,
pineapples, avocados, and green beans). However, as the production of certain hor-
ticulture crops is restricted by seasonality (e.g., tomatoes, onions and potatoes), the
country remains a net importer of such horticultural crops (Van Dijk, Dijkxhoorn &
Van Merrienboer, 2015).
2.2 The PRICE Project
The business plan competition was mainly designed and financed by the International
Fund for Agricultural Development (IFAD), as part of the Rural Income through Ex-
ports (PRICE) project in Rwanda. Its primary aim was to achieve sustainable increased
returns to farmers through export-driven value chains for different categories of farm-
ers, including horticulture farmers. The main objective of the business plan competi-
tion was to identify potential entrepreneurs among horticulture farmers, assist them to
develop and implement business plans, and mitigate credit constraints through helping
credit-constrained farmers to secure funding to implement or expand their horticulture
business activities.
The business plan competition was implemented in several stages (see Figure A1).
These comprised an application stage, an evaluation stage, and a funding and busi-
ness implementation stage. The National Agricultural Export Development Board
(NAEB) in Rwanda first launched the application submission over the period from
October-November 2013 and during June-July 2014. Farmers were informed about the
competition through SACCOs and had a month to submit their business plans using a
standardized 5-page application form. Figure A2 exhibits some selected questions from
7

this application form. A committee consisting of professionals from NAEB, the Sin-
gle Project Implementation Unit (SPIU), and the Bank of Rwanda Development Fund
(BDF) participated in the evaluation process to ensure careful screening was under-
taken at the evaluation stage. They were also responsible for evaluating and scoring
each business plan. The screening was conducted in two stages: a pre-selection phase
to exclude those who did not satisfy the basic application criteria (e.g., type of crops),
and a second phase comprising a detailed evaluation where applicants were graded out
of 100 points on the basis of a set of specific selection criteria.6 All farmers were in-
formed by the outcome of both stages by NAEB representatives.
The primary and immediate award for winning the competition was an endorsement
letter delivered to those who won the competition through scoring above a specific
threshold. An example of the endorsement letter is displayed in Figure A3. The aim of
the letter was to help farmers to secure funding from formal financial institutions. The
ultimate goal was to encourage farmers, especially those subject to credit constraints,
to engage with formal financial institutions to demonstrate their credit-worthiness. In
order to motivate winners who received the endorsement letter to apply for funding,
there was a matching grant as an additional inducement for some farmers. The en-
dorsement was also followed by a monitoring period until funds were secured and the
business plans implemented for those endorsed. This follow-up process included capac-
ity building and business planning in the field, preparing loan applications, negotiating
with financial institutions on loans, and the provision of non-financial business sup-
port.7
6The selection criteria included market and export potential/differentiation opportunity/value-
adding capacity (20 points), guaranteed markets (15 points), potential for export growth for Rwanda (15
points), experience and interest of the applicant, business idea’s potential impact (25 points), investment
cost and financing (15 points), sustainability (5 points), and the remaining 5 points were for other factors
(e.g., crop type and whether it is a primary production business plan or involves post-harvest/marketing
activities).7For these purposes, the PRICE management unit at NAEB partnered with BUSI-
NESS/PARTNERS, a company that provides financial and business services, and other value-added
services for formal small and medium enterprises (SMEs) in many African countries including Rwanda.
8

The rules governing business plan endorsement and securing matching grants are differ-
ent. For a business plan to be endorsed, the evaluation committee used different pass
marks (or thresholds) for different groups of crops. These threshold marks ranged be-
tween 50 percent to 80 percent.8 They were determined in advance to prompt process-
ing, post-harvest packaging, transportation, and marketing. The pass score for all crops
involving these activities was at the minimum of 50 percent. The receipt of a match-
ing grant was conditional on securing endorsement for a business plan, securing a loan
using the endorsement letter, and repaying 50 percent of the loan as planned to the rel-
evant financial institution. However, to avail of this matching grant process, a farmer
needed to receive approval from the Bank of Rwanda Development Fund (BDF) after
having obtained a loan approval letter from any financial institution (e.g., SACCOs).
The matching grant was approved to a small number of endorsed farmers over the pe-
riod between 2014 and 2016.
The selection team received 300 submissions during the first application period (October-
November 2013) and 2,700 during the second application round (June-July 2014). Out
of the 3,000 applicants, only 382 business plans were endorsed and 177 farmers received
matching grants. Around 70 percent of the rejected applicants implemented their pro-
posed business concept through the use of personal savings, loans (mainly from their
SACCOs), and partnerships with other farmers. As such, the competition setting fea-
tures three group of farmers: endorsed farmers (winners) who implemented their busi-
ness plans, rejected farmers who pursued their business plans regardless, and rejected
farmers who did not take their business plans any further (see Figure A1 again).
8The evaluation committee assigned 50 percent as a pass mark for essential oils, flowers, and all crops
that involved processing, post-harvest, packaging, transport, and marketing. A pass score of 75 percent
was set for onions, passion fruit, apple banana, and pineapple. Other business plans for vegetables and
fruits needed to score 80 percent in order to receive an endorsement letter.9

3 Data Description
We use cross-sectional household survey data collected in 2018 as part of IFAD’s eval-
uation efforts under the auspices of the PRICE project (see Mabiso, Abouaziza, Wood
& Balint (2018) for more details). Figure A4 presents the timeline of the business plan
competition and the data collection. As shown in Figure A5, the household sample is
representative of the entire country. All interviewed households include a horticulture
farmer who applied to the competition. The total sample comprises 1,578 households,
which covers 358 farmers with selected business plans (endorsed farmers) and 1,220
farmers with rejected business plans (rejected farmers). Table A2 presents an overview
of the number of farmers by competition outcome and crop type.9
The sample was randomly selected to guarantee representativeness of all participants
in the competition. Comparing the average investment cost of the sampled farmers
(USD 11,059) with that of all applicants (USD 11,008) supports this argument. The
same applies when comparing the percentages of plans that are an extension of existing
businesses. About 70 percent of the business plans of the two groups involved business
expansions.
In addition to the household sample, secondary data on all applicants linked to these
households are also obtained. These data were extracted from the business plan appli-
cations of the farmers. The data comprise information on project investment costs in
Rwandan francs (RWF), crop category, location, whether it is a new or existing project,
whether an applicant was endorsed or rejected, and the scores assigned to each busi-
ness plan by the evaluation committee. As subsequently outlined below in the empiri-
cal strategy, these scores coupled with the business plan outcome (i.e., endorsement or
rejection) provide the basis for the empirical approach used in this study.9For all crop categories, rejected farmers whose scores are within 2 standard deviations of the
threshold were interviewed. This criterion was reduced to 0.5 standard deviations for two of the seven
crop categories as they had too few endorsed farmers and too many rejected farmers.
10

3.1 Data Collected
The household data were collected using a detailed questionnaire administered between
March and May 2018. The questionnaire gathered information on agriculture produc-
tion by plot and crop. Questions cover the past three agricultural seasons in the agri-
cultural year spanning March 2017-February 2018 (Season B: March-June 2017, Sea-
son C: July-August 2017, and Season A: September 2017-February 2018).10 The ques-
tionnaire also solicited information on perennial crops over the period from September
2017 to August 2018, horticultural activities, demographic characteristics, food-related
questions, shocks, and external financial support. Given the focus of this paper, two
sections relevant to the analysis are now detailed, namely agricultural production and
business plan competition activities. The outcome indicators at the household level
are also constructed from the responses to the questionnaire. The indicators include
crop/horticulture income, number of hired labour, and business survival.
The agricultural production section consists of four modules: agricultural production
during season A, agricultural production during season B, agricultural production dur-
ing season C, and perennial agricultural production. The respondent was asked to di-
vide household land into different plots, each of which is related to a cultivated crop
within a specific season. The respondent was also asked to list all perennial crops the
household cultivated/harvested. Each module includes questions about cultivated plots
(area, soil colour, texture, erosion, and crops), production inputs for each crop (soil
preparation, irrigation, fertilizers, pesticides/herbicides, labour and seeds),11 and pro-10The agricultural year in Rwanda starts with Season A and ends with Season C. However, because
of the timing of the data collection, the IFAD team decided to focus on the three most recent seasons.
The justification was to avoid the difficulty farmers might encounter in recalling information about
season A (September 2016-February 2017).11Questions about production inputs include the volume of inputs used (in kilograms or litres),
the volume of inputs purchased (in kilograms or litres), the amount paid in Rwandan francs (RWF)
for purchased inputs, and the type of inputs used. In the case of intercropping, production inputs are
divided between crops based on the approximate percentage of each crop in a plot as reported by the
respondent.
11

duction outputs for each crop (crop harvest, sales, home- consumption, either in the
form of payments or to others for free or loss).
Based on these modules, harvest, sales, and the income from each crop were calculated
in USD. The harvest and sales are converted to monetary values- first to RWF and
then to USD. The price of harvest and sales for each crop (per kg) is imputed based
on the monetary value of the sales reported by respondents.12 The imputed prices are
then multiplied by the amount of harvest (kg) and sales (kg) to obtain the correspond-
ing monetary values for each crop expressed in RWF. An exchange rate of 1 USD= 835
RWF, which is the average exchange rate over the agricultural year used for the house-
hold data collection period (March 2017-February 2018), is then used to convert the
income into USD.
The income from each crop was also calculated as a net income measure (revenue mi-
nus input costs). The monetary value of sales represents the relevant revenue. Input
costs include fertilizers, seeds, pesticides/herbicides, and labour. It is calculated in an
analogous way to the harvest and sales. The prices/wages of inputs (per kg/day) are
used for each crop within a specific sector based on the prices/wages of purchased/hired
inputs reported by the respondents. The total monetary values of harvest, sales, and
crop income are then aggregated by horticulture/non-horticulture activity, by horti-
culture seasonal/perennial crops, and as a total for the whole agricultural year (March
2017-February 2018).
The business plan competition module covers questions about SACCO membership and
the business plan competition. The latter includes crop(s) used as part of the business
plan, years of experience growing these crops, the outcome decisions at the endorse-
ment stage, selection into implementation, funding channels, and the outcome at the
matching grant stage. These questions are then compared to the secondary data to cal-
culate business crop survival. In the current context, whether a farmer still cultivates12We first divide the monetary value of sales (RWF) by the amount of sales (kg) to obtain a crop
price, and then we calculate the median price of each crop within each sector (the third administrative
level in Rwanda).
12

the same crop(s) that featured in their business plan is taken to provide an indication
of business crop survival. If so, this means that their business is still active and has not
exited the state of operation.13
3.2 Descriptive statistics
The nature of the business plan competition among horticultural farmers in Rwanda
permits the separate identification of three different groups: G1: endorsed farmers
(”winners”) who implemented their business plan; G2: rejected farmers who imple-
mented their business plan; and G3: rejected farmers who did not implement their
business plan. The mean values for selected household characteristics and business out-
comes/inputs across these three groups are reported in Tables 1 and 2, respectively.
There appears to be some significant differences across the three groups in terms of
their characteristics (see Table 1). In comparing G1 and G2, we find that endorsed
households (winners) are more educated and more likely to run an enterprise, live closer
to the capital (Kigali), have more ambitious business plans in terms of investment cost,
and possess better housing characteristics at baseline. Nevertheless, rejected households
who pursued their business ideas have more household members involved in agricultural
activities, cultivate more land, and are more experienced in cultivating the crop(s) used
in their business plans. The latter possibly justifies why those farmers pursued their
business idea despite the rejection outcome at the endorsement stage. No statistical dif-
ferences were detected with regard to the gender and religion of the household head,
household size, years of SACCO membership, and the number of advice/training events
(about agriculture, marketing, or credit) received between March 2017 and February
2018. In regard to the average differences between G2 and G3, the data reveal that
farmers who implemented their business concepts are statistically different to those13One should be cautious when interpreting business crop survival given the changing nature of
horticulture farming. It reflects the survival of business crop proposed rather than the survival of the
business/farm activity itself. Farmers switch from one crop to another based on many factors such as
changing climatic and market conditions.
13

who did not with respect to a set of characteristics other than the household head’s
education, the number of employed members, owning an enterprise, the number of
dwelling rooms within the residential property, and the intention to leave a SACCO.
Insert Table 1 about here
Examining differences in the outcome variables across the three groups reveals system-
atic differences (see Table 2). Comparing the means of outcomes between G1 and G2
statistical differences with respect to the outcomes relating to formal funding and busi-
ness crop survival are detected. The likelihood of obtaining funding for endorsed farm-
ers was higher (0.45) compared to that for those rejected (0.17). On the other hand,
those who were rejected and implemented their business plan (G2) exhibit a higher
likelihood of business crop survival. It appears that G2 farmers are more experienced
in cultivating crop(s) that featured in their business plans and this played some role in
not only encouraging them to pursue their business concept but also in increasing the
likelihood of their business crop survival. In regard to the differences between G2 and
G3, as anticipated, rejected farmers who implemented their business ideas are on aver-
age better off in terms of all outcomes compared to those who did not.
Insert Table 2 about here
An examination of the characteristics of these farmers reveals they are generally well-
off. On average, they utilize around 10 hectares for cultivation purposes per year, most
of which is rented. They were also able to secure an annual net income from selling
crops of at least USD 1,000 in 2018, most of which was from horticultural crops. An-
other observation is that these farmers invest more in seasonal than in perennial horti-
culture crops. Hence, they obtain higher income from their seasonal horticulture activ-
ity.
14

4 Empirical Strategy
The key research question of this study is whether winning the business competition
exerts any impact on household business outcomes/inputs. The treatment reflects whether
a farmer won the competition and obtained an endorsement letter (the endorsement ef-
fect). The unit of analysis is a household that has an endorsed farmer (the treatment
group) or a rejected farmer (the control group). However, the impact of obtaining a
matching grant is not analysed for two reasons: 1) the number of farmers who received
the grant is not considerable- 177 applicants, out of which only 130 farmers were inter-
viewed during the data collection period; 2) of the 130 farmers, the evaluation scores of
39 are missing.
The identification of the causal effect of endorsement is empirically challenging. Com-
paring outcomes of endorsed farmers with those of rejected farmers would not capture
the endorsement effect precisely due to the role of self-selection into business implemen-
tation after the endorsement stage. The self-selection is likely to overstate the impact
of winning the competition (McKenzie, 2017).14 All selected farmers implemented their
business plan as designed by the PRICE project, whereas self-selection is more relevant
among the rejected farmers. In order to mitigate any potential issues stemming from
self-selection into implementation, the empirical strategy focuses on G1 and G2 and
excludes the rejected farmers who did not implement their business ideas. Comparing
outcomes between G1 and G2 within an RDD framework reveals the causal impact of
endorsement conditional on implementation. By conducting the analysis conditional
upon business implementation, we set a higher bar to detect the endorsement effect. As
such, the final household sample used in the analysis contains 358 observations repre-
senting the treatment group with 851 observations confined to the control group.
Even with estimating the endorsement effect conditional on business implementation,14Comparing the outcomes of endorsed farmers with rejected farmers would capture both the
endorsement effect (i.e., winning the competition and getting an endorsement letter) and the self-
selection into implementing a business idea. This would overstate the treatment effect (Duflo & Saez,
2003). Tables A3 and A4 corroborate this argument.15

there remains a further self-selection concern due to the fact that those in G1 and G2
might have had different motivational attributes. G1 implemented their project af-
ter winning, whereas G2 pursued their business plan after being rejected. Therefore,
a sharp RDD framework is used to estimate the impact of endorsement on household
business outcomes/inputs. The use of the RDD in this context is similar to its use in
the seminal literature on this technique (e.g., see Thistlethwaite & Campbell (1960)).
The identification here relies on using the evaluation score to determine the threshold
used to award farmers an endorsement treatment (i.e., through winning the competi-
tion).
4.1 Regression Discontinuity Assumptions
We argue the business plan competition satisfies the key assumptions for the use of an
RDD approach to provide an unbiased causal estimate of the endorsement effect. The
key assumptions of the RDD include the exogeneity of the forcing variable, endorse-
ment treatment compliance, the absence of clustering around the threshold, and the
discontinuity in the outcomes of interest. The validity of these features in the business
plan context under review here is now explored.
First, we look into the exogeneity of the forcing variable by exploring whether the eval-
uation committee followed a strict rule for endorsement and whether farmers or others
were able to manipulate the scores in order to be endorsed. The evaluation committee
determined the thresholds for each crop category before embarking on receiving any
business plans, implying that the thresholds were not affected by the type of farmers
and the nature of business plans presented. In addition, Figure 1 shows there is no ev-
idence that scoring just above the threshold was more likely, indicating that examiners
were not overly-generous at the threshold and that farmers were not able to manipu-
late their score in any way to fall just above the threshold.15 Nevertheless, the more15We standardize scores of all crop categories, such that the threshold equals zero. The standardiza-
tion of different thresholds around zero leads to a slight jump in the frequency just above the thresh-
old.
16

compelling argument about the lack of manipulation by farmers relates to the fact that
participants were not aware of the pass marks assigned to each category of horticulture
crops ex-ante.
Insert Figure 1 about here
The exogeneity of the forcing variable around the threshold is statistically investigated
by the ‘manipulation test’ developed by Cattaneo (2018) and Cattaneo, Jansson & Ma
(2019). The null for the manipulation test is that there is no evidence of discontinu-
ity in the density of scores at the threshold. The absence of the continuity is poten-
tially interpretable as statistical evidence of self-selection into the treatment. The ro-
bust ‘manipulation test’ statistic is found to be 0.67, with a p-value of 0.50. Therefore,
there is no statistical evidence suggesting a systematic manipulation in the assignment
variable for the current application.
Second, the endorsement rules were followed perfectly. All farmers who scored above
the threshold received an endorsement letter. Therefore, the empirical analysis under-
taken here does not present any compliance issues. Nonetheless, we find that the en-
dorsement outcome of a few farmers from the secondary data does not match with the
outcome based on the questionnaire data collected in 2018. These farmers were con-
fused between the first award (endorsement) and the second award (matching grant)
of the competition. Consequently, they answered ”no” to the endorsement treatment
question because they failed to secure a matching grant. Figure 2 indicates that this
creates differences between the actual treatment status of certain farmers and their per-
ceptions of the endorsement treatment. Yet, this discrepancy is minimal, involving 82
farmers. Our results are also robust to the exclusion of these farmers.
Insert Figure 2 about here
Third, we investigate the smoothness of the covariates across the threshold. We first
explore the differences in observable baseline characteristics between G1 and G2 just
17

above and below the threshold (the discontinuity sample). Table 3 evidences that there
are no statistical differences between the treatment (G1) and control (G2) groups in
the neighbourhood of the threshold.16 Figure 3 then presents the RD plots for selected
control variables and reveals no evidence of a discontinuity in any of the variables at
the threshold used for the endorsement. This provides re-assurance that the key covari-
ates are orthogonal to the treatment. In summary, the discontinuity in outcomes, the
exogeneity of the forcing variable, treatment compliance, and the smoothness of the co-
variates across the threshold appear satisfied in the current application confirming the
internal validity of the RDD procedure in this case.
Insert Table 3 and Figure 3 about here
Finally, the discontinuity in the main outcomes of interest is investigated using regres-
sion discontinuity (RD) plots. Figures 4 and 5 show comparisons between the business
outcomes and inputs of endorsed farmers (G1) and rejected farmers (G2). They both
reveal evidence of a jump in most business outcomes and inputs. Yet, the discontinuity
is more evident in magnitude for income from horticultural seasonal crops, the like-
lihood of securing formal loans, horticultural inputs cost, horticultural hired labour.
Farmers ended up investing more in horticulture seasonal crops given the rapid return
these crops yield, which then assist farmers in repaying their loans rapidly.17 The in-
crease in horticultural income was realized by securing formal funding to purchase hor-
ticultural inputs and hire more labour.
Insert Figures 4 and 5 about here
We also examine the heterogeneity between existing business versus de novo businesses
given that the former represents about 70 percent of business plans submitted to the16We use three bandwidths as follows: h ∈ {1, 2, 3}, but we only present results based on h = 3 as
other bandwidths yield similar results.17Another observation is that some outcomes and inputs are declining with the score above the
threshold. This may be attributed to the fact that farmers who had higher scores, while more edu-
cated, are less experienced in cultivating horticulture crops.18

competition. Figure 6 shows the corresponding figures for selected business outcomes
and inputs. We find that there are positive jumps when looking at indicators for exist-
ing businesses. The reverse is observed for certain new business indicators. This could
suggest that the competition was more effective for farmers with current business activ-
ity rather than new activities.
Insert Figure 6 about here
4.2 Methodology
There are two RDD approaches generally used to causally estimate the endorsement
effect one of which is a parametric approach, while the other is a non-parametric ap-
proach (see Lee & Lemieux (2010)). The parametric approach treats the RD as a dis-
continuity at the threshold and it is known as a global approach as it exploits all avail-
able data in the sample. The non-parametric approach characterizes the RD as a lo-
cal randomization around a specific threshold. Therefore, it uses only observations
known as the discontinuity sample within a small neighborhood (bandwidth) around
this threshold. The challenge of the parametric approach is to determine the functional
form of the forcing variable (scores), whereas the choice of bandwidth for the non-
parametric approach is an empirical issue. The difference between these approaches
involves a standard trade-off between precision and bias.
Our preferred specification is the global parametric approach as it affords more sample
power. However, we also present results from the local non-parametric approach in the
robustness checks section of this paper. To estimate the endorsement effect using the
global parametric approach, we use the following Equation (1):
Yi = α + τTi + θ1xi + θ2x2i + θ3(Ti · xi) + θ4(Ti · x2
i ) + Z ′γ + εi (1)
where Yi is the relevant outcome of interest for household i and α is a constant term.
Ti is the endorsement treatment dummy that equals 1 if a farmer is endorsed, and τ is19

the average causal endorsement effect on Y, the estimate of which provides the primary
focus of this analysis. xi is the business plan score of household i centered around zero
(i.e., the actual score minus the threshold value).18 The inclusion of the forcing variable
in the regression potentially absorbs any selection bias attributable to selection on ob-
servables. We use the quadratic form of xi as recommended in the literature (see Gel-
man & Imbens (2019)). We also interact the endorsement treatment dummy with the
forcing variable in order to allow its effects to differ both sides of the threshold. The
control variables included in the specification cover an array of household characteris-
tics (see Table 1).
18The centring of scores around zero is undertaken for interpretational reasons. If we are exactly at
the threshold, then the realization of all variables involving xi go to zero. The only remaining thing,
under such circumstances, would be α reflecting the average outcome for the rejected farmers and τ
representing the difference in outcomes between the endorsed farmers and the rejected farmers after
controlling for the covariates.20

5 Empirical Results
The business plan competition was designed to increase horticultural crop income by
mitigating credit constraints among horticulture farmers in order to create new horti-
cultural businesses and expand existing businesses. Therefore, we first investigate its
effectiveness in achieving this objective by considering the endorsement impact on cer-
tain household business outcomes (e.g., horticultural income and sales). We then turn
to the mechanisms through considering the endorsement impacts on household business
inputs (e.g., capital and labour). Finally, we examine the endorsement impact by the
type of business (existing versus new) since 70 percent of farmers developed business
plans for expanding existing businesses with the remainder developing de novo plans.
Household Business Outcomes
Table 4 reports the impact of endorsement on selected household business outcomes
using the global parametric RDD, as specified in equation 1. The first two columns re-
port the impact on overall business outcomes (business crop survival and crop income),
while the remaining columns display the effect on horticultural outcomes (income and
sales). The results are consonant with the visual findings of the RD plots discussed ear-
lier. The results reveal positive impacts of the endorsement on all outcomes, with the
exception of business crop survival. However, the estimated effects are found to be sta-
tistically significant only when it comes to seasonal horticultural income and sales. In
this case, winning the competition increases the annual horticulture income and sales
of seasonal crops by USD 247 and USD 328 respectively. This represents at least a
35 percent increase relative to the control group mean. The qualitative interviews re-
vealed that farmers ended up investing more in seasonal horticulture crops because of
the rapid yield of these crops and the need to repay loans as rapidly as possible.
Insert Table 4 about here
Three observations are worth mentioning. First, the increase in seasonal horticultural
income and sales is the main driver of the increase in overall horticultural sales and in-21

come. In particular, winning the competition is found to increase overall horticultural
sales by USD 450, with 70 percent (USD 328) of which attributed to the increase in
seasonal horticultural sales. The same applies to horticultural income. Second, there
appears to be no substitution effect between seasonal and perennial horticulture crops.
The endorsement effect on the latter is also found to be positive, but it is not statisti-
cally significant. Third, winning the competition does not appear to matter in terms of
business crop survival. One reason is that the control group (G2) appears to have more
experience compared to the treatment group (G1) in growing horticulture crops.
Household Business Inputs
Table 5 illustrates the endorsement effect on certain household business inputs. The
results reveal that winning the competition also yields positive point estimates for all
inputs other than irrigation, but it only provides a statistically significant effect for
formal funding (loans). The receipt of an endorsement letter increases the likelihood
of receiving funding by approximately 28 percentage points. This is more than twice
the control group mean. Thus, the endorsement letter appears to have a considerable
economic impact in mitigating credit constraints among horticulture farmers. The en-
dorsement has a positive numerical impact on the horticultural inputs and hired labour,
but without any statistical significance.
The lack of statistical significance of the endorsement effect on horticultural inputs
and hired labour is possibly attributable to three reasons, most of which are gleaned
from qualitative interviews undertaken with the horticulture farmers. First, the notion
that the empirical analysis is conditional on the implementation of a business plan re-
flects the fact that both endorsed and rejected farmers invested in horticultural inputs
and hired labour. This does not give rise to any statistical difference between the two
groups. Second, the time lag between the project implementation and the data collec-
tion might not have captured the whole array of horticultural inputs purchased. The
final explanation could be that there exists a difference between business plans based
on new businesses and those based on expanding existing businesses. For instance, ex-
22

isting businesses could have more resources than new businesses to buy more inputs
and hire more workers.
Insert Table 5 about here
In order to evaluate the above argument, we split the sample into farmers with business
plans based on existing activity and those passed on new business proposals. Table 6
and 7 respectively show the endorsement impact on household business outcomes and
inputs by these two business plan types. Panel A focuses on the endorsement impact
on existing businesses, while the effects on new businesses are reported in Panel B. The
results are consistent with the above claim regarding the heterogeneity across existing
and new businesses. In terms of business outcomes, the endorsement effect reported
earlier seems to be mediated through existing business plans rather than new ones.
Winning the competition assisted farmers with plans to expand existing businesses
and thus increase their seasonal horticultural income and sales. On the other hand,
the results reveal that winning the competition reduces business crop survival for those
farmers who developed new business ideas for their plans. As discussed earlier, business
crop survival reflects the survival of the crop activity proposed not the survival of the
business/farm activity itself. Most of these farmers still grow other horticultural crops
than the one proposed in their business plans.
The heterogeneity is also evident with respect to business inputs. Winning the compe-
tition helped existing businesses overcome credit constraints by obtaining formal loans
to purchase horticultural inputs and hire more labour. Winning the competition raises
the likelihood of securing formal loans by 29 percentage points for farmers with expan-
sion plans related to existing business activity. In line with the above-reported results,
the endorsement impact on existing business activity is statistically significant for sea-
sonal horticultural crops. In particular, winning the competition raises seasonal horti-
cultural input purchases and hired labour by USD 60 and 15 days, respectively. This
is in comport with the McKenzie (2017) study based on a business plan competition in
Nigeria.23

Insert Table 6 about here
On the other hand, the corresponding estimates for new business ideas reveal a posi-
tive endorsement impact on formal loans, but the impact is smaller in magnitude com-
pared to that for existing business activities (an increase of 19 percentage points for
new businesses versus 29 percentage points for existing businesses). The results also
reveal negative effects on seasonal horticultural inputs and hired labour. This is con-
sistent with the observed negative impact on business crop survival for new business
activities. It seems that the years of experience in growing horticultural crops that fea-
tured in farmers’ business plans are highly relevant in explaining these differences (5.3
years for farmers with new businesses compared to 6.2 years for farmers with plans to
expand existing businesses).
Insert Table 7 about here
To demonstrate the cost-effectiveness of this business plan competition, we review the
budget for screening all business plans. This is estimated to be less than 10,000 in to-
tal. The average grant awarded to 177 farmers (out of 400 winners) was USD 5,000.
This is compared to an average award of USD 1,000 in Fafchamps & Quinn (2017),
USD 9,000 in Klinger & Schundeln (2011), and 50,000 in McKenzie (2017) to all win-
ners. This reflects the promising nature of such competitions that do not need to award
all winners with immediate cash prizes. A competition that requires only screening and
supporting farmers negotiate with financial institutions, as well as grants for selected
farmers, should be of interest to international donors and policy makers who seek to
mitigate credit constraints among farmers.
24

6 Robustness Checks
Several checks to assess the robustness of the above estimates are now conducted. The
first check re-estimates the previous global parametric specification using weighted re-
gressions in conjunction with a triangular kernel density for the forcing variable rather
than assigning the same weight to all observations as in the main analysis. The mo-
tivation is to assess if our results are driven by farmers at the extremes of the forcing
variable distribution. The triangular weighting adopted is justified in this case for two
reasons. First, farmers with the highest and the lowest ratings on business plans might
have different characteristics to those around the threshold. As such, the triangular
kernel gives higher weights to observations closer to the threshold and down-weights
observations further away from it, thereby capturing the importance of observations
around the threshold in the estimated regressions (Calonico, Cattaneo, Farrell & Titiu-
nik, 2019). Second, the sample does not have farmers with extreme evaluation scores
(i.e., zero and 100). Therefore, we do not lose any observations as a result of assign-
ing a zero weight to those massed at the extreme values of the forcing variable. Table 8
presents the treatment estimates based on the weights of the forcing variable produced
with the triangular kernel. The estimates are congruent with the earlier results. This
suggests that the previous estimates are robust to kernel choice and the estimates are
not overly-influenced by farmers in the extremes of the distribution with the lowest and
the highest evaluation scores.
Insert Table 8 about here
The second check uses fake passing scores that are 5 points higher and 5 points lower
than the one used in the main analysis. The aim is to assess whether the observed
differential effects are potentially induced by a different threshold than that predeter-
mined by the evaluation committee threshold. The corresponding estimates are re-
ported in Tables 9 and 10 and reveal no statistical significance of the endorsement on
almost all household business outcomes and inputs. The above suggests that no mean-
25

ingful effects are detected when using artificial pass scores above and below the prede-
termined threshold.
Insert Table 9 and Table 10 about here
The fourth check uses the same sample of farmers but excludes those with a matching
grant. The objective is to investigate whether the estimated effects on the key outcome
variables of winning the competition are attributable to securing the grant. This re-
duces the sample size by 110 farmers. Table 11 provides the corresponding estimates.
The effect of endorsement on the annual income from seasonal horticulture crops is sta-
tistically significant and similar in magnitude to that detected in the main analysis. By
winning the competition, the annual seasonal horticultural income rose by USD 266
relative to the control group (compared to USD 247 in the main analysis).
Insert Table 11 about here
Nevertheless, the endorsement effect on formal funding is not invariant to this exer-
cise and is not statistically well determined. This could be due to the fact that both
endorsed and rejected farmers succeeded in obtaining loans even though they did not
receive the matching grant. About 16.5 percent of endorsed farmers (32 farmers) and
17 percent of rejected farmers (147 farmers) implemented their projects through loans
without obtaining the grant.19 This corroborates our conclusion that the competition
has been effective in overcoming credit constraints among horticulture farmers with-
out the need to award all of them grants. This is not to say it has not been effective
to award grants to a few farmers. According to the qualitative interviews, having the
grant as a second award was a strong incentive to encourage farmers to develop their
business plans in the first place.
The fifth check uses the same sample but excludes farmers who were confused between
endorsement treatment and the receipt of a grant. This creates differences between the19It is worth mentioning that the matching grant recipients are proportional to the percentages of
existing and de novo business activities that applied to the competition.26

actual treatment status of certain farmers and their perceptions of the endorsement
treatment. As previously stated, this difference involves 82 farmers. The corresponding
estimates of the endorsement effect are reported in Table 12. The results are compat-
ible in both magnitude and statistical significance with the estimates obtained for the
main analysis.
Insert Table 12 about here
The final check uses the local non-parametric approach as an alternative to the global
parametric RDD approach adopted earlier. For the local non-parametric estimation, we
use the covariate-adjusted RD estimator developed by Calonico, Cattaneo & Titiunik
(2014) and Calonico et al. (2019). In this case, the endorsement effect (τ) is estimated
through running the weighted least squares regression with only units within a specific
bandwidth (h) of the threshold. This involves estimating two separate regressions using
observations on both sides of the threshold. For the bandwidth selection, we employ a
mean square error (MSE) optimal bandwidth as discussed in Imbens & Kalyanaraman
(2012), and implement it following Calonico (2014) and Calonico, Cattaneo, Farrell &
Titiunik (2017). Thus, we estimate the following local linear regressions:
Rh(x, Z ′) =
(α+, θ+, γ+) = argmin
α,θ,γ
∑Ni=1(Yi − α+ − θ+f(xi)− Z ′γ+)2 ·K(xi
h) if x ≥ 0
(α−, θ−, γ−) = argminα,θ,γ
∑Ni=1(Yi − α− − θ−f(xi)− Z ′γ−)2 ·K(xi
h) if x < 0
(2)
where αj, θj, γj, where j ∈ [−,+],20 are an intercept, a parameter vector of the polyno-
mial order of the forcing variable, and a parameter vector of the explanatory variables
included, respectively.21 f(xi) refers to the polynomial order function of the forcing
variable (a quadratic form in this context). K reflects the kernel function used to de-20The positive and negative signs refer to both sides of the threshold, where the former includes
observations above and the latter includes observations below the threshold.21We include the same control variables used in the global parametric approach.
27

termine the weights for each observation in the regressions.22 The difference between
α+ and α−, in the limit (xi → 0) and after controlling for Z ′, represents the local aver-
age treatment effect (LATE) of the endorsement.
Tables 13 and 14 show the endorsement impact on business outcomes and inputs us-
ing the local non-parametric approach. The results are broadly comparable with those
obtained using the global parametric approach. Winning the competition increases the
likelihood of securing formal loans by 28 percentage points, which is the same point es-
timate using the global parametric approach. Yet, the impact on the rest of indicators
is not statistically significant. This could be due to the heterogeneity between the ex-
isting and new businesses discussed previously. We therefore split the sample again by
business type. Tables 15 and 16 report the corresponding estimates for existing busi-
ness activity. We find consistent, but larger, estimates with the global parametric ap-
proach. This again confirms our previous results that the endorsement was more effec-
tive for farmers with plans based on existing rather than de novo business activity.
Insert Tables 13 through 16 about here
22We give all observations the same weight to ensure the comparability of results with the paramet-
ric approach estimation.28

7 Conclusions
This paper provides empirical evidence that business plan competitions can be an ef-
fective tool in mitigating credit constraints among farmers. Results from a business
plan competition, involving horticultural farmers in Rwanda, suggested some positive
effects on household farming activity across a number of dimensions. Winning the com-
petition with an endorsement letter increases the likelihood of both receiving formal
funding and enhancing income from seasonal horticulture crops. Specifically, the receipt
of funding enabled those farmers engaged in existing lines of business activity to secure
higher levels of inputs that enhanced seasonal productivity and seasonal income.
The results are consistent with previous studies such as Fafchamps & Quinn (2017) in
three African countries (Ethiopia, Tanzania, and Zambia), Klinger & Schundeln (2011)
in three Central American countries (El Salvador, Guatemala, and Nicaragua), and
McKenzie (2017) in Nigeria. The evidence provided here complements the existing, if
somewhat thin, literature by studying the impact of success in a business plan compe-
tition among farmers and demonstrating it can be an effective tool in mitigating credit
constraints even in the absence of any direct monetary prizes. However, a key finding
here is that the business plan competition proved more effective when endorsing plans
for farmers related to their current business activity rather than new activities.
The empirical results have some implications for future research on business plan com-
petitions and for policymakers seeking to boost entrepreneurship and formal financial
transactions among smallholder farmers. First, the findings emphasize the importance
of having central points (SACCOs in our context) to diffuse information about business
plan competitions. Farmers were supported by these SACCOs to develop their busi-
ness ideas and to secure funding for their business afterwards. Second, business plan
competitions can be an effective tool to mitigate credit constraints among farmers, even
without grant/funding as an immediate winning award. This is particularly important
with limited funding available for such developmental projects. Third, business plan
judges may need to act conservatively when endorsing business plans and opt for safer
29

proposals around existing business expertise rather than backing higher risk de novo
business proposals. Alternatively, this may reflect the design of the business plan and
the nature of support provided to those farmers with new business line concepts that
are endorsed. The support required may differ and need further enhancement to ensure
greater efficacy of the endorsement process for those with new business ideas. Fourth,
differentiating between those who did not win the competition but pursued their busi-
ness ideas and those who did not pursue these ideas, is crucial to avoid drawing mis-
leading conclusions about the effectiveness of these competitions.
30

References
Bandiera, O., Burgess, R., Das, N., Gulesci, S., Rasul, I., & Sulaiman, M. (2017). La-
bor Markets and Poverty in Village Economies. The Quarterly Journal of Economics,
132 (2), 811–870.
Banerjee, A. V. & Duflo, E. (2014). Do Firms Want to Borrow More? Testing Credit
Constraints Using a Directed Lending Program. The Review of Economic Studies,
81 (2), 572–607.
Bigsten, A. & Gebreeyesus, M. (2007). The small, the young, and the productive: De-
terminants of manufacturing firm growth in ethiopia. Economic Development and
Cultural Change, 55 (4), 813–840.
Blattman, C., Fiala, N., & Martinez, S. (2014). Generating skilled self-employment in
developing countries: Experimental evidence from uganda. The Quarterly Journal of
Economics, 129 (2), 697–752.
Boucher, S., Guirkinger, C., & Trivelli, C. (2009). Direct elicitation of credit con-
straints: Conceptual and practical issues with an application to peruvian agriculture.
Economic Development and Cultural Change, 57 (4), 609–640.
Calonico, S. (2014). Robust data-driven inference in the regression-discontinuity design.
Stata Journal, 14 (4), 909–946(38).
Calonico, S., Cattaneo, M. D., Farrell, M. H., & Titiunik, R. (2017). Rdrobust: Soft-
ware for regression-discontinuity designs. The Stata Journal, 17 (2), 372–404.
Calonico, S., Cattaneo, M. D., Farrell, M. H., & Titiunik, R. (2019). Regression dis-
continuity designs using covariates. The Review of Economics and Statistics, 101 (3),
442–451.
Calonico, S., Cattaneo, M. D., & Titiunik, R. (2014). Robust nonparametric confidence
intervals for regression-discontinuity designs. Econometrica, 82 (6), 2295–2326.
31

Cattaneo, M. D. (2018). Manipulation testing based on density discontinuity. Stata
Journal, 18 (1), 234–261(28).
Cattaneo, M. D., Jansson, M., & Ma, X. (2019). Simple local polynomial density esti-
mators. Journal of the American Statistical Association, 0 (0), 1–7.
Clay, D. & Turatsinze, J. (2014). Baseline report on the rwanda horticulture organisa-
tions survey (rhos).
Coad, A. & Srhoj, S. (2019). Catching gazelles with a lasso: Big data techniques for
the prediction of high-growth firms. Small Business Economics.
Datta, S. (2012). The impact of improved highways on indian firms. Journal of Devel-
opment Economics, 99 (1), 46 – 57.
de Mel, S., McKenzie, D., & Woodruff, C. (2008). Returns to Capital in Microenter-
prises: Evidence from a Field Experiment. The Quarterly Journal of Economics,
123 (4), 1329–1372.
Djankov, S., La Porta, R., Lopez-de Silanes, F., & Shleifer, A. (2002). The Regulation
of Entry. The Quarterly Journal of Economics, 117 (1), 1–37.
Duflo, E. & Saez, E. (2003). The Role of Information and Social Interactions in Re-
tirement Plan Decisions: Evidence from a Randomized Experiment. The Quarterly
Journal of Economics, 118 (3), 815–842.
Fafchamps, M. & Quinn, S. (2017). Aspire. The Journal of Development Studies,
53 (10), 1615–1633.
Fafchamps, M. & Woodruff, C. (2017). Identifying Gazelles: Expert Panels vs. Sur-
veys as a Means to Identify Firms with Rapid Growth Potential. The World Bank
Economic Review, 31 (3), 670–686.
Falentina, A. T. & Resosudarmo, B. P. (2019). The impact of blackouts on the perfor-
mance of micro and small enterprises: Evidence from indonesia. World Development,
124, 104635.32

Gelman, A. & Imbens, G. (2019). Why high-order polynomials should not be used in
regression discontinuity designs. Journal of Business & Economic Statistics, 37 (3),
447–456.
Guirkinger, C. & Boucher, S. R. (2008). Credit constraints and productivity in peru-
vian agriculture. Agricultural Economics, 39 (3), 295–308.
Howell, S. T. (2019). Reducing information frictions in venture capital: The role of new
venture competitions. Journal of Financial Economics.
Imbens, G. & Kalyanaraman, K. (2012). Optimal Bandwidth Choice for the Regression
Discontinuity Estimator. The Review of Economic Studies, 79 (3), 933–959.
Just, D. R., Wolf, S. A., Wu, S., & Zilberman, D. (2002). Consumption of economic
information in agriculture. American Journal of Agricultural Economics, 84 (1), 39–
52.
Klinger, B. & Schundeln, M. (2011). Can entrepreneurial activity be taught? quasi-
experimental evidence from central america. World Development, 39 (9), 1592 – 1610.
Lee, D. S. & Lemieux, T. (2010). Regression discontinuity designs in economics. Jour-
nal of Economic Literature, 48 (2), 281–355.
Mabiso, A., Abouaziza, M., Wood, B. D. K., & Balint, T. (2018). Project for rural
income through exports (price), rwanda impact assessment report. ifad, rome, italy.
Martin, L. A., Nataraj, S., & Harrison, A. E. (2017). In with the big, out with the
small: Removing small-scale reservations in india. American Economic Review,
107 (2), 354–86.
McKenzie, D. (2017). Identifying and spurring high-growth entrepreneurship: Exper-
imental evidence from a business plan competition. American Economic Review,
107 (8), 2278–2307.
33

McKenzie, D. & Sansone, D. (2019). Predicting entrepreneurial success is hard: Ev-
idence from a business plan competition in nigeria. Journal of Development Eco-
nomics, 141, 102369.
Neumark, D., Wall, B., & Zhang, J. (2011). Do small businesses create more jobs? new
evidence for the united states from the national establishment time series. The Re-
view of Economics and Statistics, 93 (1), 16–29.
Svensson, J. (1998). Investment, property rights and political instability: Theory and
evidence. European Economic Review, 42 (7), 1317 – 1341.
Thistlethwaite, D. & Campbell, D. (1960). Regression-discontinuity analysis: An al-
ternative to the ex post facto experiment. Journal of Educational Psychology, 51,
309–317.
Udry, C. & Anagol, S. (2006). The return to capital in ghana. The American Economic
Review, 96 (2), 388–393.
Van Dijk, N., Dijkxhoorn, Y., & Van Merrienboer, S. (2015). Smart tomato supply
chain analysis for rwanda: identifying opportunities for minimizing food losses.
World Bank (2020). Poverty and equity. data retrieved from World Development Indi-
cators, https://databank.worldbank.org/source/poverty-and-equity.
34

Tables
Table 1: Descriptive statistics of household characteristics by treatment status
(1) (2) (3) (4) (5) (6) (7)
Variables G1 G2 G3 G1-G2 G2-G3
t-test prob t-test prob
Panel A: Socio-economic characteristics
Gender of household head (=1 if male) 0.89 0.90 0.83 -0.01 0.55 0.07 0.00
Religion of household head (=1 if Christian) 0.97 0.98 0.96 -0.01 0.47 0.02 0.03
Education of household head (years) 10.94 9.63 9.65 1.32 0.00 0.01 0.96
Household size (number of members) 4.96 5.17 4.63 -0.21 0.13 0.55 0.00
Number of parcels (number)1 2.44 2.86 1.89 -0.42 0.00 0.97 0.00
Household land (hectares) 10.59 14.11 6.13 -3.51 0.00 8.06 0.00
Agriculture household members (number)2 1.74 2.22 1.85 -0.48 0.00 0.38 0.00
Wage-employed household members (number)3 1.29 1.27 1.29 0.02 0.65 -0.02 0.71
Owning an enterprise (=1 if yes)4 0.23 0.18 0.20 0.05 0.05 -0.02 0.49
Distance from Kigali (km) 54.02 60.47 49.88 -6.44 0.00 10.38 0.00
Panel B: Housing5
Wood walls (=1 if yes) 0.35 0.20 0.29 0.15 0.00 -0.08 0.00
Concrete roof (=1 if yes) 0.81 0.76 0.87 0.05 0.06 -0.10 0.00
Cement floor (=1 if yes) 0.78 0.72 0.80 0.07 0.02 -0.07 0.01
Toilet with roof (=1 if yes) 0.77 0.87 0.81 -0.10 0.00 0.07 0.00
Number of rooms (number) 3.98 4.07 4.07 -0.08 0.31 -0.04 0.65
Electricity Access (=1 if yes) 0.72 0.55 0.67 0.18 0.00 -0.13 0.00
Panel C: SACCO membership and business plan details
SACCO membership (=1 if yes) 0.99 0.99 0.96 0.00 0.50 0.03 0.00
SACCO membership (years) 8.44 8.07 7.15 0.37 0.24 0.92 0.00
Intention to leave a SACCO (=1 if yes) 0.03 0.01 0.01 0.02 0.07 0.00 0.87
”Business” horticultural crop experience (years) 6.06 7.19 2.89 -1.13 0.00 4.29 0.00
Continued on next page35

Existing project (=1 if yes) 0.70 0.68 0.59 0.02 0.55 0.08 0.01
Business investment cost (USD) 13,729 9,796 11,470 3,933 0.00 -1,665 0.00
Panel D: Extensions received over Mar 2017-Feb 2018
Number of advices received (number) 1.65 1.71 1.06 -0.06 0.70 0.66 0.00
Agricultural inputs advice (=1 if yes) 0.34 0.39 0.21 -0.06 0.07 0.18 0.00
Harvest techniques advice (=1 if yes) 0.24 0.23 0.15 0.00 0.87 0.08 0.00
Post-harvest techniques advice (=1 if yes) 0.20 0.19 0.13 0.01 0.64 0.06 0.01
Marketing advice (=1 if yes) 0.11 0.10 0.10 0.02 0.33 0.00 1.00
Credit access advice (=1 if yes) 0.13 0.12 0.08 0.01 0.50 0.04 0.05
Observations 358 851 363
Notes: This table shows descriptive statistics of selected household characteristics. G1: Endorsed
farmers who implemented their business; G2: Rejected farmers who implemented their business; and
G3: Rejected farmers who did not implement their business. Columns (1) through (3) present the
mean values among G1, G2, and G3, respectively. Columns (4) and (5) include the t-test statistics and
the corresponding p-values of the mean differences between G1 and G2. Similarly, Columns (6) and (7)
show the same for the mean differences between G1 and G2.
1 Number of parcels cultivated over Mar 2017-Feb 2018.
2 Number of household members who participated in agriculture activities over Mar 2017-Feb 2018.
3 Number of household members who were wage-employed over Mar 2017-Feb 2018.
4 It reflects whether a household owning an enterprise over Mar 2017-Feb 2018.
5 Questions about housing were asked to households in 2018 to recall their housing characteristics 5
years ago- before the business plan competition was taken place.
36

Table 2: Descriptive statistics of household business indicators by treatment status
(1) (2) (3) (4) (5) (6) (7)
Variables G1 G2 G3 G1-G2 G2-G3
t-test prob t-test prob
Panel A: Funding, Business Survival, and Crop Income
Formal funding (=1) 0.45 0.17 0.00 0.28 0.00 0.17 0.00
Business crop survival 0.48 0.67 0.00 -0.19 0.00 0.67 0.00
Crops income (USD) 1672 1753 892 -80.78 0.58 868.33 0.00
Panel B: Horticultural
Horticulture harvest (USD) 1603 1424 467 179.52 0.26 962.49 0.00
Horticulture sales (USD) 1500 1365 423 134.73 0.45 948.03 0.00
Horticulture income (USD) 1379 1317 570 61.76 0.65 753.12 0.00
Hired labour (number of days) 57 51 22 5.57 0.31 30.08 0.00
Panel C: Seasonal Horticultural
Horticulture harvest (USD) 1035 908 249 127.05 0.41 662.48 0.00
Horticulture sales (USD) 944 795 240 148.99 0.25 558.60 0.00
Horticulture income (USD) 837 729 342 107.94 0.24 390.50 0.00
Hired labour (number of days) 39 31 14 7.82 0.05 17.00 0.00
Panel D: Perennial Horticultural
Horticulture harvest (USD) 590 610 218 -19.85 0.85 394.34 0.00
Horticulture sales (USD) 470 476 183 -6.50 0.93 295.95 0.00
Horticulture income (USD) 643 670 345 -26.73 0.76 328.29 0.00
Hired labour (number of days) 17 19 6 -1.99 0.51 12.54 0.00
Observations 358 851 363
Notes: This table shows descriptive statistics of selected household outcomes. Columns (1) through
(3) present the mean values among G1, G2, and G3, respectively. Columns (4) and (5) include the t-
test statistics and the corresponding p-value of the mean differences between G1 and G2. Similarly,
Columns (4) and (5) show the same for the mean differences between G1 and G3.
37

Table 3: Descriptive statistics of discontinuity sample characteristics
(1) (2) (3) (4)
Variables G1 G2 G1-G2
t-test prob
Panel A: Socio-economic characteristics
Gender of household head (=1 if male) 0.94 0.90 0.04 0.40
Religion of household head (=1 if Christian) 0.99 0.95 0.04 0.13
Schooling of household head (years) 10.99 10.03 0.96 0.20
Household size (number of members) 5.13 4.81 0.32 0.38
Number of parcels (number of parcels)1 2.81 2.95 -0.14 0.64
Household land (hectares) 12.23 12.06 0.17 0.95
Agriculture household members (number)2 1.99 2.06 -0.07 0.60
Wage-employed household members (number)3 1.29 1.24 0.05 0.70
Owning an enterprise (=1 if yes)4 0.22 0.29 -0.07 0.33
Distance from Kigali (km) 58.43 68.43 -10.01 0.06
Panel B: Housing5
Wood walls (=1 if yes) 0.31 0.31 0.01 0.93
Concrete roof (=1 if yes) 0.80 0.77 0.02 0.72
Cement floor (=1 if yes) 0.80 0.76 0.04 0.55
Toilet with roof (=1 if yes) 0.75 0.89 -0.14 0.03
Number of rooms (number) 3.79 4.03 -0.24 0.24
Electricity (=1 if yes) 0.67 0.58 0.09 0.27
Panel C: SACCO membership and business plan details
SACCO membership (=1 if yes) 0.98 0.97 0.01 0.64
SACCO membership (years) 7.96 7.03 0.93 0.26
Intention to leave a SACCO (=1 if yes) 0.05 0.02 0.03 0.27
”Business” horticultural crop experience (years) 5.13 6.02 -0.88 0.26
Continued on next page
38

Existing project (=1 if yes) 0.79 0.81 -0.02 0.81
Business investment cost (USD) 12,265 9,892 2,374 0.12
Panel D: Extensions received over Mar 2017-Feb 2018
Number of advices received (number) 2.02 1.66 0.36 0.36
Agricultural inputs advice (=1 if yes) 0.41 0.42 -0.01 0.95
Harvest techniques advice (=1 if yes) 0.33 0.24 0.09 0.22
Post-harvest techniques advice (=1 if yes) 0.28 0.18 0.11 0.13
Marketing advice (=1 if yes) 0.14 0.08 0.06 0.25
Credit access advice (=1 if yes) 0.15 0.13 0.02 0.69
Observations 99 62
Notes: This table displays descriptive statistics od selected household characteristics. The statistics
are based on a discontinuity sample (just above and below the threshold with bandwidth=3). Columns
(1) and (2) present the mean values among G1 and G2, respectively. Columns (4) and (5) include the
t-test statistics and the corresponding p-value of the mean differences between G1 and G2.
1 Number of parcels cultivated over Mar 2017-Feb 2018.
2 Number of household members who participated in agriculture activities over Mar 2017-Feb 2018.
3 Number of household members who were wage-employed over Mar 2017-Feb 2018.
4 It reflects whether a household owns an enterprise over Mar 2017-Feb 2018.
5 Questions about housing were asked to households in 2018 to recall their housing characteristics 5
years ago.
39

Table 4: Endorsement impact on selected business outcomes
(1) (2) (3) (4) (5) (6) (7) (8)
General Horticultural Seasonal Hortic. Perennial Hortic.
Variables Business
crop
survival
(=1)
Crop
income
(USD)
Income
(USD)
Sales
(USD)
Income
(USD)
Sales
(USD)
Income
(USD)
Sales
(USD)
Endorsement (=1) -0.0564 202.6 295.2 450.1* 246.9* 328.3* 56.09 96.88
(0.0465) (212.2) (193.7) (258.2) (128.4) (185.6) (138.5) (119.7)
Observations 1,184 1,184 1,184 1,184 1,184 1,184 1,184 1,184
R-squared 0.065 0.110 0.089 0.094 0.073 0.081 0.040 0.045
Control mean 0.66 1,742 1,308 1,353 724 790 666 471
prob (=1) USD USD USD USD USD USD USD
Notes: This table presents results of the impact of endorsement on selected household business out-
comes using equation 1. Robust standard errors in parentheses. ∗ ∗ ∗p < 0.01, ∗ ∗ p < 0.05, ∗p < 0.1.
40

Table 5: Endorsement impact on selected business inputs
(1) (2) (3) (4) (5) (6) (7) (8)
Capital Horticultural Seasonal Hortic. Perennial Hortic. Irrigation
Variables Formal
funding
(=1)
Inputs
cost
(USD)
Hired
labour
(days)
Inputs
cost
(USD)
Hired
labour
(days)
Inputs
cost
(USD)
Hired
labour
(days)
Irrigated
land
(=1)
Endorsement (=1) 0.280*** 56.81 12.55 29.76 6.228 27.05 6.444 -0.00607
(0.0411) (34.82) (8.538) (24.69) (6.152) (25.10) (4.758) -0.0126
Observations 1,184 1,184 1,184 1,184 1,184 1,184 1,184 1,184
R-squared 0.125 0.064 0.092 0.046 0.075 0.042 0.045 0.038
Control mean 0.17 144 51 108 31 36 18 0.06
prob (=1) USD days USD days USD days prob (=1)
Notes: This table presents results of the impact of endorsement on selected household business inputs
using equation 1. Robust standard errors in parentheses. ∗ ∗ ∗p < 0.01, ∗ ∗ p < 0.05, ∗p < 0.1.
41

Table 6: Endorsement impact on selected business outcomes by business type
(1) (2) (3) (4) (5) (6) (7) (8)
General Horticultural Seasonal Hortic. Perennial Hortic.
Variables Business
crop
survival
(=1)
Crop
income
(USD)
Income
(USD)
Sales
(USD)
Income
(USD)
Sales
(USD)
Income
(USD)
Sales
(USD)
Panel A: Existing businesses
Endorsement (=1) 0.000485 240.3 301.6 442.8 270.4* 424.1* 36.27 72.11
(0.0556) (272.4) (237.0) (313.6) (161.1) (227.4) (172.5) (140.1)
Observations 787 787 787 787 787 787 787 787
R-squared 0.072 0.134 0.103 0.101 0.077 0.084 0.056 0.057
Panel B: New businesses
Endorsement (=1) -0.191** -15.90 159.2 194.2 40.89 -135.8 131.7 153.1
(0.0953) (388.5) (389.0) (522.9) (244.1) (354.0) (259.2) (260.1)
Observations 357 357 357 357 357 357 357 357
R-squared 0.141 0.107 0.102 0.100 0.108 0.111 0.049 0.056
Control mean 0.66 1,742 1,308 1,353 724 790 666 471
prob (=1) USD USD USD USD USD USD USD
Notes: This table presents results of the impact of endorsement on selected household business out-
comes by business type using equation 1. Robust standard errors in parentheses. ∗ ∗ ∗p < 0.01, ∗ ∗ p <
0.05, ∗p < 0.1.
42

Table 7: Endorsement impact on selected business inputs by business type
(1) (2) (3) (4) (5) (6) (7) (8)
Capital Horticultural Seasonal Hortic. Perennial Hortic. Irrigation
Variables Formal
funding
(=1)
Inputs
cost
(USD)
Hired
labour
(days)
Inputs
cost
(USD)
Hired
labour
(days)
Inputs
cost
(USD)
Hired
labour
(days)
Irrigated
land
(=1)
Panel A: Existing businesses
Endorsement (=1) 0.292*** 61.55* 22.73** 59.05* 14.89** 2.496 7.351 -0.00611
(0.0519) (33.17) (10.01) (31.86) (7.509) (9.453) (5.387) (0.0165)
Observations 787 787 787 787 787 787 787 787
R-squared 0.136 0.089 0.115 0.064 0.083 0.058 0.066 0.040
Panel B: New businesses
Endorsement (=1) 0.190** 3.022 -17.62 -89.97** -22.22** 92.99 6.031 -0.0188
(0.0759) (92.48) (15.93) (41.84) (10.48) (82.20) (9.928) (0.0240)
Observations 357 357 357 357 357 357 357 357
R-squared 0.156 0.067 0.081 0.051 0.118 0.122 0.056 0.064
Control mean 0.17 144 51 108 31 36 18 0.06
prob (=1) USD days USD days USD days prob (=1)
Notes: This table presents results of the impact of endorsement on selected household business inputs
by business type using equation 1. Robust standard errors in parentheses. ∗ ∗ ∗p < 0.01, ∗ ∗ p <
0.05, ∗p < 0.1.
43

Table 8: Endorsement impact on the household using the triangular kernel density
(1) (2) (3) (4) (5) (6) (7) (8)
General Horticultural Seasonal Hortic. Perennial Hortic.
Variables Business
crop
survival
(=1)
Crop
income
(USD)
Income
(USD)
Sales
(USD)
Income
(USD)
Sales
(USD)
Income
(USD)
Sales
(USD)
Endorsement (=1) -0.0450 187.6 271.9 407.9 259.7* 328.0* 18.16 67.43
(0.0479) (219.3) (202.5) (273.8) (135.2) (194.8) (142.8) (122.4)
Observations 1,184 1,184 1,184 1,184 1,184 1,184 1,184 1,184
R-squared 0.062 0.111 0.093 0.097 0.077 0.086 0.042 0.044
Control mean 0.66 1,742 1,308 1,353 724 790 666 471
prob (=1) USD USD USD USD USD USD USD
Capital Horticultural Seasonal Hortic. Perennial Hortic. Irrigation
Variables Formal
funding
(=1)
Inputs
cost
(USD)
Hired
labour
(days)
Inputs
cost
(USD)
Hired
labour
(days)
Inputs
cost
(USD)
Hired
labour
(days)
Irrigated
land
(=1)
Endorsement (=1) 0.269*** 50.62 12.08 27.61 4.747 23.02 7.343 -0.00679
(0.0421) (34.18) (8.929) (26.39) (6.544) (22.03) (4.923) (0.0136)
Observations 1,184 1,184 1,184 1,184 1,184 1,184 1,184 1,184
R-squared 0.135 0.066 0.092 0.049 0.074 0.046 0.047 0.041
Control mean 0.17 144 51 108 31 36 18 0.06
prob (=1) USD days USD days USD days prob (=1)
Notes: This table presents results of the impact of endorsement on selected household business out-
comes and inputs using equation 1. Robust standard errors in parentheses. ∗ ∗ ∗p < 0.01, ∗ ∗ p <
0.05, ∗p < 0.1.
44

Table 9: Endorsement impact on the household using a lower fake threshold
(1) (2) (3) (4) (5) (6) (7) (8)
General Horticultural Seasonal Hortic. Perennial Hortic.
Variables Business
crop
survival
(=1)
Crop
income
(USD)
Income
(USD)
Sales
(USD)
Income
(USD)
Sales
(USD)
Income
(USD)
Sales
(USD)
Endorsement (=1) -0.0233 627.3 342.8 737.3 352.7 363.7 -50.71 41.57
(0.0981) (403.2) (376.4) (466.8) (267.2) (391.5) (258.8) (207.9)
Observations 1,184 1,184 1,184 1,184 1,184 1,184 1,184 1,184
R-squared 0.068 0.110 0.087 0.093 0.071 0.079 0.038 0.044
Control mean 0.66 1,742 1,308 1,353 724 790 666 471
prob (=1) USD USD USD USD USD USD USD
Capital Horticultural Seasonal Hortic. Perennial Hortic. Irrigation
Variables Formal
funding
(=1)
Inputs
cost
(USD)
Hired
labour
(days)
Inputs
cost
(USD)
Hired
labour
(days)
Inputs
cost
(USD)
Hired
labour
(days)
Irrigated
land
(=1)
Endorsement (=1) 0.0165 74.95 12.40 70.54 17.41 4.411 -4.357 0.0245
(0.0832) (58.85) (15.80) (56.55) (11.60) (19.81) (9.491) (0.0311)
Observations 1,184 1,184 1,184 1,184 1,184 1,184 1,184 1,184
R-squared 0.093 0.058 0.090 0.046 0.077 0.023 0.043 0.037
Control mean 0.17 144 51 108 31 36 18 0.06
prob (=1) USD days USD days USD days prob (=1)
Notes: This table presents results of the impact of endorsement on selected household business out-
comes and inputs using equation 1. Robust standard errors in parentheses. ∗ ∗ ∗p < 0.01, ∗ ∗ p <
0.05, ∗p < 0.1.
45

Table 10: Endorsement impact on the household using a higher fake threshold
(1) (2) (3) (4) (5) (6) (7) (8)
General Horticultural Seasonal Hortic. Perennial Hortic.
Variables Business
crop
survival
(=1)
Crop
income
(USD)
Income
(USD)
Sales
(USD)
Income
(USD)
Sales
(USD)
Income
(USD)
Sales
(USD)
Endorsement (=1) 0.0377 -538.5 -227.5 512.0 259.1 793.0 -415.2 -184.4
(0.140) (549.2) (592.6) (848.2) (433.2) (699.3) (367.7) (343.7)
Observations 1,184 1,184 1,184 1,184 1,184 1,184 1,184 1,184
R-squared 0.065 0.107 0.087 0.092 0.069 0.079 0.039 0.044
Control mean 0.66 1,742 1,308 1,353 724 790 666 471
prob (=1) USD USD USD USD USD USD USD
Capital Horticultural Seasonal Hortic. Perennial Hortic. Irrigation
Variables Formal
funding
(=1)
Inputs
cost
(USD)
Hired
labour
(days)
Inputs
cost
(USD)
Hired
labour
(days)
Inputs
cost
(USD)
Hired
labour
(days)
Irrigated
land
(=1)
Endorsement (=1) -0.0418 -12.34 -34.64 11.35 -20.02 -23.69 -18.10* -0.0190
(0.128) (104.4) (24.28) (103.1) (18.34) (23.16) (9.459) (0.0374)
Observations 1,184 1,184 1,184 1,184 1,184 1,184 1,184 1,184
R-squared 0.092 0.057 0.092 0.045 0.076 0.023 0.045 0.035
Control mean 0.17 144 51 108 31 36 18 0.06
prob (=1) USD days USD days USD days prob (=1)
Notes: This table presents results of the impact of endorsement on selected household business out-
comes and inputs using equation 1. Robust standard errors in parentheses. ∗ ∗ ∗p < 0.01, ∗ ∗ p <
0.05, ∗p < 0.1.
46

Table 11: Endorsement impact on the household without matching grants
(1) (2) (3) (4) (5) (6) (7) (8)
General Horticultural Seasonal Hortic. Perennial Hortic.
Variables Business
crop
survival
(=1)
Crop
income
(USD)
Income
(USD)
Sales
(USD)
Income
(USD)
Sales
(USD)
Income
(USD)
Sales
(USD)
Endorsement (=1) -0.0954* 299.9 370.7* 474.6 266.7* 284.1 132.9 137.4
(0.0523) (238.5) (220.0) (301.0) (147.1) (208.9) (160.6) (137.6)
Observations 1,074 1,074 1,074 1,074 1,074 1,074 1,074 1,074
R-squared 0.079 0.121 0.096 0.097 0.077 0.080 0.040 0.050
Control mean 0.66 1,742 1,308 1,353 724 790 666 471
prob (=1) USD USD USD USD USD USD USD
Capital Horticultural Seasonal Hortic. Perennial Hortic. Irrigation
Variables Formal
funding
(=1)
Inputs
cost
(USD)
Hired
labour
(days)
Inputs
cost
(USD)
Hired
labour
(days)
Inputs
cost
(USD)
Hired
labour
(days)
Irrigated
land
(=1)
Endorsement (=1) 0.00276 32.14 5.351 -3.816 -0.565 35.96 5.546 -0.00865
(0.0382) (42.01) (9.051) (22.52) (6.162) (36.42) (5.308) (0.0144)
Observations 1,074 1,074 1,074 1,074 1,074 1,074 1,074 1,074
R-squared 0.043 0.070 0.095 0.046 0.070 0.058 0.057 0.039
Control mean 0.17 144 51 108 31 36 18 0.06
prob (=1) USD days USD days USD days prob (=1)
Notes: This table presents results of the impact of endorsement on selected household business out-
comes and inputs using equation 1. Robust standard errors in parentheses. ∗ ∗ ∗p < 0.01, ∗ ∗ p <
0.05, ∗p < 0.1.
47

Table 12: Endorsement impact on the household with perfect treatment compliance
(1) (2) (3) (4) (5) (6) (7) (8)
General Horticultural Seasonal Hortic. Perennial Hortic.
Variables Business
crop
survival
(=1)
Crop
income
(USD)
Income
(USD)
Sales
(USD)
Income
(USD)
Sales
(USD)
Income
(USD)
Sales
(USD)
Endorsement (=1) 0.0636 531.2 362.2 498.1 430.9* 522.5* -83.44 -10.17
(0.0799) (329.0) (321.6) (447.6) (222.0) (309.9) (232.2) (195.0)
Observations 1,102 1,102 1,102 1,102 1,102 1,102 1,102 1,102
R-squared 0.071 0.115 0.093 0.098 0.081 0.090 0.036 0.041
Control mean 0.66 1,742 1,308 1,353 724 790 666 471
prob (=1) USD USD USD USD USD USD USD
Capital Horticultural Seasonal Hortic. Perennial Hortic. Irrigation
Variables Formal
funding
(=1)
Inputs
cost
(USD)
Hired
labour
(days)
Inputs
cost
(USD)
Hired
labour
(days)
Inputs
cost
(USD)
Hired
labour
(days)
Irrigated
land
(=1)
Endorsement (=1) 0.120* 22.37 12.00 21.44 -2.033 0.921 13.30* 0.00893
(0.0704) (47.63) (15.03) (46.29) (11.45) (10.98) (7.738) (0.0240)
Observations 1,102 1,102 1,102 1,102 1,102 1,102 1,102 1,102
R-squared 0.096 0.066 0.093 0.048 0.083 0.044 0.042 0.040
Control mean 0.17 144 51 108 31 36 18 0.06
prob (=1) USD days USD days USD days prob (=1)
Notes: This table presents results of the impact of endorsement on selected household business out-
comes and inputs using equation 1. Robust standard errors in parentheses. ∗ ∗ ∗p < 0.01, ∗ ∗ p <
0.05, ∗p < 0.1.
48

Table 13: Endorsement impact on business outcomes using local non-parametric RDD
(1) (2) (3) (4) (5) (6) (7) (8)
General Horticultural Seasonal Hortic. Perennial Hortic.
Variables Business
crop
survival
(=1)
Crop
income
(USD)
Income
(USD)
Sales
(USD)
Income
(USD)
Sales
(USD)
Income
(USD)
Sales
(USD)
Endorsement (=1) 0.160 256.5 198.1 -183.0 453.0 674.8 3.318 -71.15
(0.114) (513.5) (441.0) (618.5) (317.5) (458.6) (344.0) (277.6)
Observations 1,184 1,184 1,184 1,184 1,184 1,184 1,184 1,184
Effective observations (L) 218 218 251 275 166 166 251 275
Bandwidth size (L) 10.9 10.1 11.8 12.2 8.7 8.4 12.0 12.1
Effective observations (R) 223 223 237 240 199 199 237 240
Bandwidth size (R) 10.9 10.1 11.8 12.2 8.7 8.4 12.0 12.1
Control mean 0.66 1,742 1,308 1,353 724 790 666 471
prob (=1) USD USD USD USD USD USD USD
Notes: This table presents results of the impact of endorsement on selected household business outcomes using equation 1. Robust standard errors in parenthe-
ses. ∗ ∗ ∗p < 0.01, ∗ ∗ p < 0.05, ∗p < 0.1.
49

Table 14: Endorsement impact on business inputs using local non-parametric RDD
Capital Horticultural Seasonal Hortic. Perennial Hortic. Irrigation
Variables Formal
funding
(=1)
Inputs
cost
(USD)
Hired
labour
(days)
Inputs
cost
(USD)
Hired
labour
(days)
Inputs
cost
(USD)
Hired
labour
(days)
Irrigated
land
(=1)
Endorsement (=1) 0.279*** 16.82 11.12 12.13 -1.992 -10.29 5.551 0.0221
(0.107) (73.42) (24.07) (72.95) (17.58) (14.96) (10.40) (0.0346)
Observations 1,184 1,184 1,184 1,184 1,184 1,184 1,184 1,184
Effective observations (L) 166 166 138 166 194 138 113 194
Bandwidth size (L) 8.9 8.2 7.1 8.2 9.7 7.1 6.0 9.6
Effective observations (R) 199 199 178 199 211 178 162 211
Bandwidth size (R) 8.9 8.2 7.1 8.2 9.7 7.1 6.0 9.6
Control mean 0.17 144 51 108 31 36 18 0.06
prob (=1) USD days USD days USD days prob (=1)
Notes: This table presents results of the impact of endorsement on the household business inputs using equation 1. Robust standard errors in parentheses.
∗ ∗ ∗p < 0.01, ∗ ∗ p < 0.05, ∗p < 0.1.
50
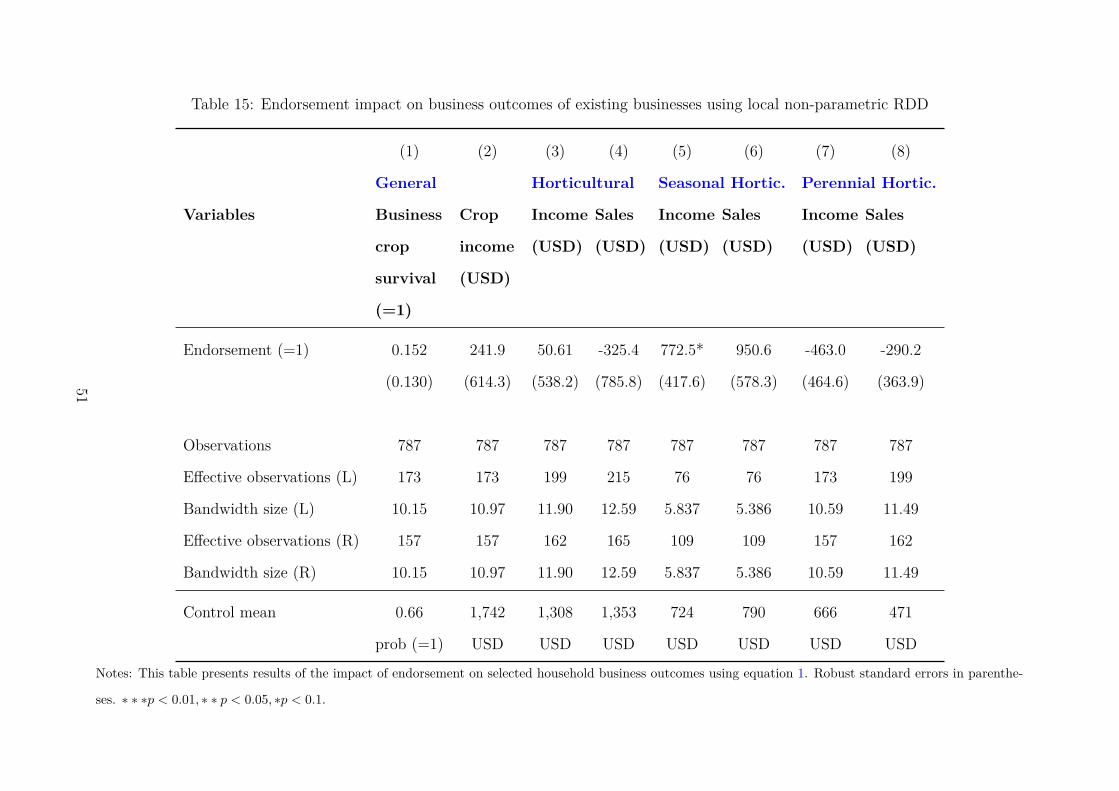
Table 15: Endorsement impact on business outcomes of existing businesses using local non-parametric RDD
(1) (2) (3) (4) (5) (6) (7) (8)
General Horticultural Seasonal Hortic. Perennial Hortic.
Variables Business
crop
survival
(=1)
Crop
income
(USD)
Income
(USD)
Sales
(USD)
Income
(USD)
Sales
(USD)
Income
(USD)
Sales
(USD)
Endorsement (=1) 0.152 241.9 50.61 -325.4 772.5* 950.6 -463.0 -290.2
(0.130) (614.3) (538.2) (785.8) (417.6) (578.3) (464.6) (363.9)
Observations 787 787 787 787 787 787 787 787
Effective observations (L) 173 173 199 215 76 76 173 199
Bandwidth size (L) 10.15 10.97 11.90 12.59 5.837 5.386 10.59 11.49
Effective observations (R) 157 157 162 165 109 109 157 162
Bandwidth size (R) 10.15 10.97 11.90 12.59 5.837 5.386 10.59 11.49
Control mean 0.66 1,742 1,308 1,353 724 790 666 471
prob (=1) USD USD USD USD USD USD USD
Notes: This table presents results of the impact of endorsement on selected household business outcomes using equation 1. Robust standard errors in parenthe-
ses. ∗ ∗ ∗p < 0.01, ∗ ∗ p < 0.05, ∗p < 0.1.
51

Table 16: Endorsement impact on business inputs of existing businesses using local non-parametric RDD
Capital Horticultural Seasonal Hortic. Perennial Hortic. Irrigation
Variables Formal
funding
(=1)
Inputs
cost
(USD)
Hired
labour
(days)
Inputs
cost
(USD)
Hired
labour
(days)
Inputs
cost
(USD)
Hired
labour
(days)
Irrigated
land
(=1)
Endorsement (=1) 0.387*** 144.5* 18.34 138.8** 30.29* -27.90 23.03* 0.0598
(0.132) (78.97) (24.92) (64.63) (18.00) (16.99) (12.32) (0.0428)
Observations 787 787 787 787 787 787 787 787
Effective observations (L) 88 109 88 131 153 88 131 109
Bandwidth size (L) 6.301 7.837 6.917 8.650 9.812 6.646 8.036 7.018
Effective observations (R) 119 132 120 146 152 120 146 130
Bandwidth size (R) 6.301 7.837 6.917 8.650 9.812 6.646 8.036 7.018
Control mean 0.17 144 51 108 31 36 18 0.06
prob (=1) USD days USD days USD days prob (=1)
Notes: This table presents results of the impact of endorsement on the household business inputs using equation 1. Robust standard errors in parentheses.
∗ ∗ ∗p < 0.01, ∗ ∗ p < 0.05, ∗p < 0.1.
52

Figures
Figure 1: Distribution of evaluation scores
Notes: This figure displays the distribution of farmer scores in the household sample. These scores
are standardized around one threshold (zero) for all crop categories. The bars reflect the frequency
of farmers within each bandwidth around the zero threshold. They are overlaid with kernel density
estimates (triangular kernel).
53

Figure 2: Distribution of evaluation scores by treatment status
Notes: This figure shows the distribution of farmer scores in the household sample, divided into two
groups: farmers who received an endorsement letter (T) on the right side and farmers who were not
endorsed (C) on the left side. These scores are standardized around one threshold (zero) for all crop
categories. The bars reflect the density of farmers within each bandwidth around the zero threshold.
They are overlaid with kernel density estimates (triangular kernel).
54

Figure 3: Regression discontinuity plots of selected household characteristics
Notes: This figure depicts the regression discontinuity plots for selected household characteristics. Within each sub-figure, the dots reflect the sample average
within each bin of scores, assigned with a 95 percent confidence interval. We use ten evenly-distributed bins for this purpose. The lines indicate the polynomial
fit of order 2. The line and dots on the right side is related to the endorsed farmer outcomes, and the ones on the left side belong to the rejected farmers who
implemented their business.

Figure 4: Regression discontinuity plots of household business outcomes
Notes: This figure depicts the regression discontinuity plots for the household business outcomes used
in the analysis. Within each sub-figure, the dots reflect the sample average within each bin of scores,
assigned with a 95 percent confidence interval. We use ten evenly-distributed bins for this purpose.
The lines indicate the polynomial fit of order 2. The line and dots on the right side is related to the
endorsed farmer outcomes, and the ones on the left side belong to the rejected farmers who imple-
mented their business.
56

Figure 5: Regression discontinuity plots of household business inputs
Notes: This figure depicts the regression discontinuity plots for some household business inputs used in
the analysis. Within each sub-figure, the dots reflect the sample average within each bin of scores, as-
signed with a 95 percent confidence interval. We use ten evenly-distributed bins for this purpose. The
lines indicate the polynomial fit of order 2. The line and dots on the right side is related to the en-
dorsed farmer outcomes, and the ones on the left side belong to the rejected farmers who implemented
their business.
57

Figure 6: Regression discontinuity plots of selected indicators by type of business
Notes: This figure depicts the regression discontinuity plots for selected outcomes/inputs by type of
business. Sub-figures on the left column are for existing businesses, whereas the new businesses’ sub-
figures are on the right. Within each sub-figure, the dots reflect the sample average within each bin
of scores, assigned with a 95 percent confidence interval. We use ten evenly-distributed bins for this
purpose. The lines indicate the polynomial fit of order 2. The line and dots on the right side is related
to the endorsed farmer outcomes, and the ones on the left side belong to the rejected farmers who
implemented their business. 58

Appendix
Table A1: Previous studies on business plan competitions
Context Award Data Sample Approach Outcomes Results
Nigeria USD 50,000+ Training/Monitoring
5 years later 3,139 RCT
Business survivalSalesEmploymentProfits
Positive impact of winningMcKenzie (2017)
El SalvadorGuatemalaNicaragua
USD 6,000-15,000+ Training
1 year later 1,310 RDDStart a businessExpand a business
Positive impact of trainingKlinger & Schundeln (2011)
EthiopiaTanzaniaZambia
USD 1,000 6-months later 750 RCT
Start a businessSalesProfitsWealth
Positive impact of winningFafchamps & Quinn (2017)
USA USD 73,000 for64% of winners
4,328 RDDFundingSurvivalEmployment
Positive impact of winning &Smaller impact of cash prizesHowell (2019)
Nigeria USD 50,000+ Training/Monitoring
3 years later 2,506 RCT
Business survivalSalesEmploymentProfits
No impact of scoresMcKenzie & Sansone (2019)
Ghana Training 2 years later 400 RCT Firm performanceNo impact of scores& trainingFafchamps & Woodruff (2017)
59

Table A2: Sample distribution within crop categories
Crop Category Total number
of farmers
Passing score
(out of 100)
Percentage of endorsed
farmers (treatment group)
1. All horticultural crops (post-harvest value-adding) 11050
60.9
2. Essential oils & flowers (primary production) 58 70.7
3. Onion (primary production) 199
75
19.6
4. Passion fruit (Primary Production) 133 19.5
5. Apple banana (Primary Production) 159 10.1
6. Pineapple (Primary Production) 134 12.7
7. Other Vegetables & Fruits (Primary Production) 785 80 19.4
Total 1578
Notes: This table presents a summary of the number of households included in the sample, the passing scores, and the percentage of endorsed farmers within
each crop category. The sample was designed to cover all the endorsed farmers and some rejected farmers whose scores are near to the passing scores. Within
all crop categories, rejected farmers whose scores are within at least 2 standard deviations from the threshold were interviewed. This criterion was modified to
0.5 standard deviation for the last two crop categories as very few endorsed farmers and too many rejected farmers applied for the competition.1 The sample was designed according to these crop categories as the passing scores to win the competition were different across them. It was 50 percent for
categories 1-2, 75 percent for categories 3-6, and 80 percent for category 7. These different passing marks were determined in advance to prompt processing,
post-harvest, packaging, transport, marketing, essential oil and flowers. That is why the passing score for all crops involving these activities was at the mini-
mum.
60

Table A3: Endorsement impact on selected business outcomes
(1) (2) (3) (4) (5) (6) (7) (8)
General Horticultural Seasonal Hortic. Perennial Hortic.
Variables Business
crop
survival
(=1)
Crop
income
(USD)
Income
(USD)
Sales
(USD)
Income
(USD)
Sales
(USD)
Income
(USD)
Sales
(USD)
Endorsement (=1) 0.0907** 316.5* 398.8** 568.6** 269.6** 363.4** 133.7 158.7
(0.0420) (190.2) (175.3) (233.5) (117.3) (166.5) (125.4) (110.6)
Observations 1,536 1,536 1,536 1,536 1,536 1,536 1,536 1,536
R-squared 0.103 0.115 0.093 0.097 0.077 0.083 0.038 0.042
Control mean 0.66 1,742 1,308 1,353 724 790 666 471
prob (=1) USD USD USD USD USD USD USD
Notes: This table presents results of the impact of endorsement on selected household business out-
comes using equation 1, regardless of business implementation. Unlike, the main analysis that focuses
on G1 as a treatment group and G2 as a control group, these estimates use G2 and G3 as a control
group. Robust standard errors in parentheses. ∗ ∗ ∗p < 0.01, ∗ ∗ p < 0.05, ∗p < 0.1.
61

Table A4: Endorsement impact on selected business inputs
(1) (2) (3) (4) (5) (6) (7) (8)
Capital Horticultural Seasonal Hortic. Perennial Hortic. Irrigation
Variables Formal
funding
(=1)
Inputs
cost
(USD)
Hired
labour
(days)
Inputs
cost
(USD)
Hired
labour
(days)
Inputs
cost
(USD)
Hired
labour
(days)
Irrigated
land
(=1)
Endorsement (=1) 0.302*** 73.07** 19.65*** 38.59* 10.17* 34.48 9.198** -0.000343
(0.0376) (33.54) (7.552) (22.10) (5.438) (25.72) (4.293) (0.0114)
Observations 1,536 1,536 1,536 1,536 1,536 1,536 1,536 1,536
R-squared 0.161 0.069 0.109 0.050 0.088 0.042 0.048 0.031
Control mean 0.17 144 51 108 31 36 18 0.06
prob (=1) USD days USD days USD days prob (=1)
Notes: This table presents results of the impact of endorsement on selected household business inputs
using equation 1, regardless of business implementation. Unlike, the main analysis that focuses on G1
as a treatment group and G2 as a control group, these estimates use G2 and G3 as a control group.
Robust standard errors in parentheses. ∗ ∗ ∗p < 0.01, ∗ ∗ p < 0.05, ∗p < 0.1.
62

Figure A1: Stages of the business plan competition
Application∼3000 farmers
Endorsement∼400 farmers
Funding- Formal loan/ grant
- Personal savings
Implementation
No Endorsement∼2,600 farmers
Funding- Formal loan
- Personal savings
Implementation
No funding
No implementation
G1 G2 G3Notes: This figure depicts the stages of the business plan competition as follows: 1) the development
and submission of business plans (Application), 2) the evaluation and endorsement (Endorsement),
3) funding applications (Funding), and 4) the implementation with monitoring for farmers who were
endorsed and implementation without monitoring for farmers who were rejected (Implementation).
63

Figure A2: Some questions asked in the business plan application form
Notes: This figure shows some questions asked in the in the standardized business plan application
form that horticulture farmers used to apply for the competition. The original application was 5-page
long contained questions about the applicants (location, experience, age, etc.), and their business idea
(investment cost, horticulture crop, existing/new project, etc.), and farmer’s motivation. Questions
were asked in English and official language of Rwanda (Kinyarwanda).
64

Figure A3: Endorsement Letter example
Notes: This figure displays an example of the endorsement letter that was delivered to the compe-
tition’s winners. It is written in the official language of Rwanda (Kinyarwanda). It indicates that a
farmer win the competition (referring to a score out of 100) and encourages farmers to start prepar-
ing funding applications to submit to financial institutions. It also confirms that a business plan is
endorsed by the National Agricultural Export Development Board (NAEB) and the Bank of Rwanda
Development Fund (BDF).
65

Figure A4: Timeline of the business plan competition and data collection
2013-14
• First application round(Oct-Nov 2013)- 300 farmers
• Second application round(Jun-Jul 2014)- 2,700 farmers
Application
2014
• Endorsement for those whoscore above a specific threshold
Evaluation
2015-16
• Loan
• Loan and matching grant
• Personal savings
• Partnerships with other farmers
• No funding/ Noimplementation
Funding and Implementation
2018
• Cross-sectional data
• A sample of ∼ 1,600 farmers
• Agricultural seasons in 2017
Household data collection
Notes: This figure portrays the stages of the business plan competition and household data collection. The navy circles show the timing of the business plan
competition stages (application, endorsement, funding, and implementation). The maroon circle shows the timing of the household data collection.
66

Figure A5: Geographic distribution of household data
Note: This figure shows the geographical distribution of the household sample. The numbers in each circle reflect how many households in each area were in-
terviewed. The yellow, blue and red circles respectively refer to a group of fewer than 10 farmers, a group between 10-99 farmers, and a group of more than
100 farmers.
67

Figure A6: The association of control variables with selected household outcomes
This graph depicts the estimates related to the control variables used in the analysis for two household outcomes. It provides both point estimates as well as
95% confidence intervals of all control variables.
68