the impact of artificial intelligence on employment in
TRANSCRIPT
The Impact of Artificial Intelligence on
Employment in High-Tech Companies in the
Jordanian Market
أثر الذكاء الاصطناعي على التوظيف في الشركات عالية التقانة في السوق الأردني
Prepared by:
Nour Khalil Abu-Khaled
Supervised by:
Dr. Abdel-Aziz Ahmad Sharabati
Thesis Submitted in Partial Fulfillment of the Requirements
for Master's Degree in MBA.
Business Administration Department
Business Faculty
Middle East University
January 2020

II
Authorization

III
Examination Committee’s Decision

IV
Acknowledgment
First of all, I am grateful to The Almighty God for helping me to complete
this thesis.
I wish to express my sincere thanks to DR. Abdel-Aziz Sharabati, for his
constant encouragement and support.
I take this opportunity to record my sincere thanks to all faculty members
of the Department of Business for their help and encouragement. I also thank
my family for their unceasing encouragement and support.
I also place on record, my sense of gratitude to everyone who, directly or
indirectly, has lent his or her helping hand in this venture.
Nour Khalil Abu-Khaled

V
Dedication
Nobody has been more important to me for the dedication of this thesis
than my family. I would like to thank my mother and the soul of my father; whose
love and guidance are with me in whatever I pursue. They are the ultimate role
models. Most importantly, I wish to thank my loving son, Zaid.
I really cannot express my gratitude and thanks to my lovely family and
friends; so, I extend my deepest appreciation to them.
Nour Khalil Abu-Khaled

VI
Table of Contents
Authorization ......................................................................................................................................... II
Examination Committee’s Decision .....................................................................................................III
Acknowledgment .................................................................................................................................. IV
Dedication .............................................................................................................................................. V
Table of Contents .................................................................................................................................. VI
List of Models .................................................................................................................................... VIII
List of Tables ........................................................................................................................................ IX
List of Figures ........................................................................................................................................ X
List of Appendices ................................................................................................................................ XI
English Abstract .................................................................................................................................. XII
Arabic Abstract .................................................................................................................................. XIII
Chapter One: Introduction .................................................................................................................. 1
1.1 Background: ................................................................................................................................. 1
1.2 Study Purpose and Objectives: .................................................................................................... 4
1.3 Study Significance and Importance: ............................................................................................ 5
1.4 Problem Statement: ...................................................................................................................... 5
1.5 Problem Questions: ...................................................................................................................... 7
1.6 Study Hypotheses: ....................................................................................................................... 7
1.7 Study Model: ................................................................................................................................ 8
1.8 Operational Definitions of Terms: ............................................................................................... 8
1.9 Study Limitations and Delimitations: ........................................................................................ 10
Chapter Two: Theoretical and Conceptual Framework and Literature Review ......................... 11
2.1 Introduction: ............................................................................................................................... 11
2.2 Definitions and Components of Variables: ................................................................................ 11
2.3 Relationships between Independent and Dependent Variables: ................................................ 15
2.4 Previous Models: ....................................................................................................................... 16
2.5 Previous Studies: ........................................................................................................................ 22
2.6 What Differentiates this Current Study from Previous Studies?: .............................................. 30
Chapter Three: Study Methodology (Methods and Procedures) ................................................... 32
3.1 Introduction: ............................................................................................................................... 32
3.2 Study Design: ............................................................................................................................. 32
3.3 Study Population, Sample and Unit of Analysis: ....................................................................... 32
3.4 Data Collection Methods: .......................................................................................................... 33

VII
3.5 Data Collection and Analysis: ............................................................................................... 34
3.5.1 Validity Test: ................................................................................................................ 34
3.5.2 Reliability test: .............................................................................................................. 40
3.5.3 Demographic Analysis: ................................................................................................. 40
Chapter Four: Data Analysis ............................................................................................................. 43
4.1 Introduction: ............................................................................................................................... 43
4.2 Descriptive Analysis of Study Variables: .................................................................................. 43
4.2.1 Level of artificial intelligence in High-Tech companies:................................................... 43
4.2.2 Level of the Employment in High-Tech Companies: ........................................................ 46
4.2.3 Relationship between Independent and Dependent Variables: .......................................... 50
4.3 The Research Hypotheses: ......................................................................................................... 51
Chapter Five: Results’ Discussion, Conclusion, and Recommendations ....................................... 55
5.1 Results’ Discussion: ................................................................................................................... 55
5.2 Conclusion: ................................................................................................................................ 56
5.3 Recommendations: ..................................................................................................................... 57
5.3.1 Recommendations for High-Tech Companies in Jordan: .................................................. 57
5.3.2 Recommendations for Academics and Future Research: ................................................... 58
References ............................................................................................................................................ 59
Appendices ........................................................................................................................................... 70

VIII
List of Models
Model (1-1): Study Model ...................................................................................................................... 8
Model (2-1): Ruël, et. al. (2004) Model ................................................................................................ 17
Model (2-2): Ghazzawi, et. al. (2014) Mode ........................................................................................ 17
Model (2-3): Strohmeier & Piazza (2015) Model ................................................................................. 18
Model (2-4): Kiruthika & Khaddaj (2017) Model ................................................................................ 18
Model (2-5): Skilton & Hovsepian (2017) Model ................................................................................ 19
Model (2-6): Garg, et al. (2018) Model ................................................................................................ 19
Model (2-7): Masum, et. al. (2018) Model ........................................................................................... 20
Model (2-8): Oksanen (2018) Model .................................................................................................... 21
Model (2-9): Dijkkamp (2019) Model .................................................................................................. 22

IX
List of Tables
Table (3-1): Principal Component Analysis Automation ..................................................................... 35
Table (3-2): Principal Component Analysis Efficiency ........................................................................ 36
Table (3-3): Principal Component Analysis Ease of use ...................................................................... 37
Table (3-4): Principal Component Analysis Recruitment ..................................................................... 37
Table (3-5): Principal Component Analysis Selection .......................................................................... 38
Table (3-6): Principal Component Analysis Appointment ................................................................... 38
Table (3-7): Principal Component Analysis Artificial Intelligence ...................................................... 39
Table (3-8): Principal Component Analysis Employment .................................................................... 39
Table (3-9): Cronbach's Alpha for the Study Fields ............................................................................. 40
Table (3-10): Respondents Gender ....................................................................................................... 41
Table (3-11): Respondents Age ........................................................................................................... 41
Table (3-12): Respondents Experience ................................................................................................ 41
Table (3-13): Respondents Education ................................................................................................... 42
Table (3-14): Respondents Position ...................................................................................................... 42
Table (4-1): Arithmetic Mean, Std. Deviation, T value, Item Importance and Importance level of The
Artificial Intelligence in High-Tech Companies ................................................................................... 43
Table (4-2): Arithmetic Mean, Std. Deviation, t value, Item Importance and Importance level of The
AI Automation level in High-Tech Companies .................................................................................... 44 Table (4-3): Arithmetic Mean, Std. Deviation, t value, Item Importance and Importance level of The
AI Efficiency level in High-Tech Companies ....................................................................................... 45 Table (4-4): Arithmetic Mean, Std. Deviation, t value, Item Importance and Importance level of The
AI Ease of Use level in High-Tech Companies .................................................................................... 46
Table (4-5): Arithmetic Mean, Std. Deviation, t value, Item Importance and Importance level of The
Employment in High-Tech Companies ................................................................................................. 47
Table (4-6): Arithmetic Mean, Std. Deviation, t value, Item Importance and Importance level of The
Recruitment level in High-Tech Companies ......................................................................................... 47
Table (4-7): Arithmetic Mean, Std. Deviation, t value, Item Importance and Importance level of The
Selection level in High-Tech Companies .............................................................................................. 48
Table (4-8): Arithmetic Mean, Std. Deviation, t value, Item Importance and Importance level of The
Appointment level in High-Tech Companies ....................................................................................... 49
Table (4-9): That the Relationship between Variables ......................................................................... 50
Table (4-10): Durbin-Watson value and Variance Inflation Factor ...................................................... 53
Table (4-11): Multiple Regressions of the Artificial Intelligence Dimensions on Employment. ......... 53
Table (4-12): Multiple Regressions of the Artificial Intelligence Dimensions on Employment. ......... 54
Table (5-1): Summary of Multiple Regressions Artificial Intelligence Dimensions on Employment
(Selection, Recruitment, and Appointment) (ANOVA) ....................................................................... 55

X
List of Figures
Figure (4-1): Normality Test ................................................................................................................. 51
Figure (4-2): Linearity Test .................................................................................................................. 52
Figure (4-3): Equal variance ................................................................................................................. 52

XI
List of Appendices
Appendix (1): Panel of Referees Committee: ..................................................................................... 70
Appendix (2): Questionnaire of Respondents: ................................................................................. 71
Appendix (3): Questionnaire of Respondents (Arabic version): ..................................................... 74

XII
The Impact of Artificial Intelligence on Employment in High-Tech
Companies in the Jordanian Market
Prepared by: Nour Khalil Abu-Khaled
Supervised by: Dr. Abdel-Aziz Ahmad Sharabati
Abstract
Purpose: Artificial intelligence is used in many fields. Employment is one of
the most important fields that take advantage of these technologies. On the other hand,
it threatens to replace jobs. The purpose of the study is to examine the impact of artificial
intelligence on employment in High-Tech companies in the Jordanian market.
Methodology: To actualize this study, data were collected from 138 managers,
supervisors and employees who work at Jordanian High-Tech companies by
questionnaire. After confirming the normality, validity, and reliability of the tool,
descriptive analysis was carried out, and the correlation between variables checked.
Finally, the impact was tested by multiple regressions by using SPSS.
Findings: The result shows that Jordanian High-Tech companies implement
both artificial intelligence and employment dimensions. It also shows that there is a
correlation between artificial intelligence dimensions and employment dimensions.
Finally, results indicate that there is a significant impact of the total artificial
intelligence on total employment in High-Tech companies in the Jordanian market.
Automation has rated the highest impact on employment, followed by efficiency, while
ease of use does not show a significant impact on total employment dimensions.
Limitations/Recommendations: The current study was conducted in High-
Tech companies in Jordan. Therefore, it recommends future researches to collect more
data over a longer period of time to check the current model validity and the measuring
instrument. It also recommends carrying out similar studies on other sectors in Jordan
and the same sector outside Jordan to test its results generalizability.
Originality/Value: This study may be considered as one of the few studies that
discuss the use of new technologies in business from an employee’s perspective.
Keywords: Artificial Intelligence, Employment, Automation, Efficiency,
Ease of Use, Recruitment, Selection, Appointment.

XIII
في السوق الأردني التقانةأثر الذكاء الاصطناعي على التوظيف في الشركات عالية
إعداد: نور خليل أبو خالد
كتور عبد العزيز أحمد الشرباتيإشراف: الد
الملخص
يستخدم الذكاء الاصطناعي في العديد من المجالات، يعد التوظيف أحد أهم المجالات التي تستفيد الغرض:
التقنيات. من ناحية أخرى، فإنه يهدد باستبدال الوظائف. والغرض من هذه الدراسة هو دراسة تأثير الذكاء من هذه
الاصطناعي على التوظيف في شركات التكنولوجيا العالية التقانة في السوق الأردني.
في الشركات مديرًا ومشرفًا وموظفاً يعملون 138لإنجاز هذه الدراسة، تم جمع البيانات من المنهجية:
م إجراء التحليل ، توثباتهاالأردنية عن طريق الاستبيان. بعد التأكد من التوزيع الطبيعي للأداة وصدقها التقانةعالية
برنامج باستخدام وأخيرا تم اختبار الاثر بواسطة الانحدار المتعدد ،الارتباط بين المتغيرات والتحقق منالوصفي
SPSS.
الأردنية تطبق أبعاد الذكاء الاصطناعي والتوظيف. كما التقانةتوضح النتائج أن الشركات عالية النتائج:
ر في تشير النتائج إلى وجود تأثير كبي أخيرًا،يوضح أن هناك علاقة بين أبعاد الذكاء الاصطناعي وأبعاد التوظيف.
يراً الأردنية. لقد صنفت الأتمتة الأكبر تأث لتقانةاالذكاء الاصطناعي الكلي على إجمالي العمالة في الشركات عالية
على التوظيف، تليها الكفاءة. في حين أن سهولة الاستخدام لا تظهر تأثيرًا كبيرًا على إجمالي أبعاد التوظيف.
في الأردن. لذلك توصي التقانةتم إجراء هذه الدراسة الحالية على الشركات عالية المحددات / التوصيات:
ثبات وراسة الأبحاث المستقبلية بجمع المزيد من البيانات على مدار فترة زمنية أطول للتحقق من صدق هذه الد
. كما توصي بإجراء دراسات مماثلة حول قطاعات أخرى في الأردن ونفس وأداة القياسالدراسة الحالي نموذج
النتائج. إمكانية تعميم للتأكد منالقطاع خارج الأردن
تناقش تأثير استخدام يمكن اعتبار هذه الدراسة واحدة من الدراسات القليلة التي ة:الأصالة / القيم
الجديدة في الأعمال من منظور الموظف. التكنولوجيا
الكلمات المفتاحية: الذكاء الاصطناعي، التوظيف، الأتمتة، الكفاءة، سهولة الاستخدام، التوظيف،
الاختيار، التعيين.

1
Chapter One: Introduction
1.1 Background:
New technologies create winners and losers in the labor market.
Companies seek to reduce cost, increase efficiency and quality by applying
artificial intelligence.
Today, artificial intelligence drives changes in many sectors,
including employment, which takes advantage of these technologies. On the
other hand, it threatens to replace jobs.
Jordan's High-Tech companies have recently begun to apply artificial
intelligence increasingly in their businesses. Many employees working in
these companies have concerns that AI might influence their jobs by
replacing them with automated machines, thus, affecting the overall terms
of their employment. Moreover, there is unanimity that AI will have a
disruptive impact on work, with some jobs being lost, others being created
or the nature of these jobs being changed.
Weizenbaum (1972) said that artificial intelligence machines would
replace or enhance human capabilities in many areas within the human
domain. Albus (1983) said that the problem is not in finding plenty of work
for both humans and robots but in finding mechanisms by which the wealth
created by robot technology can be distributed as income to the people who
need it. Rifkin (1995) said that we are entering a new era in world history-
one in which fewer and fewer workers would be needed to produce the goods
and services for the global population. Therefore, it is moving us to the edge
of a near worker less world. Autor, et. al. (2003) stated that worker
displacement is a possible outcome of automation as machines take over
tasks previously performed by humans. Noe, et. al. (2006) said that the
impact of intelligence technology could change the manager's work
2
contents, artificial intelligence could undertake and help managers speed up
their daily boring and repetitive work. Ford (2013) stated that an increasing
share of work would become more automated as machines are taking on
intellectual tasks that once were referred to non-routine tasks that required
the human brain. Frey & Osborne (2013) warned that the pace of automation
is accelerating; the range of jobs affected is increasing, and this is
threatening displacement across large shares of jobs in the future. Autor
(2015) said that the number of jobs lost to more efficient machines is only
part of the problem. What worries many job experts more is that automation
might prevent the economy from creating enough new jobs. Davenport &
Kirby (2015) said that it could be appealing for managers to possess the least
number of workers possible, maintaining a large number of robots with high
productivity levels to reduce salaries, but this could significantly increase
unemployment rates, outweighing the benefits of automation to the
economy. Autor & Salomons (2017) stated that rapid advances in machine
capabilities might curtail aggregate labor demand as technology increasingly
encroaches on human job tasks.
Manyika (2017) concluded that jobs that are more technical and
routine, have a greater chance of being replaced by technology. He also
found that about half the activities people are paid to do globally could
theoretically be automated using currently demonstrated technologies.
McKinsey & Company (2017) suggested that between almost zero and one-
third of work activities could be displaced by 2030. Wisskirchen, et. al.
(2017) stated that artificial intelligence would influence the global labor
market in the next decade, and he discussed how it would lead to mass
unemployment. Ernst, et. al. (2018) said that the current wave of
technological change based on advancements in artificial intelligence has
created widespread fear of job losses and further rises in inequality. He

3
(2018) stated that artificial intelligence could ease the onboarding process
for both employers and employees since AI learns and adapts, it would sense
the preference characteristics and attributes and recommend it back. Grace,
et. al. (2018) discussed that experts expect that artificial intelligence would
outperform humans in the next 10 years, not only in some fewer demanding
tasks but also in services. Nuefeind, et. al. (2018) said that artificial
intelligence is coming to put most of us out of business, except for a growing
number of ‘gig economy’ workers. Upadhyay & Khandelwal (2018) argued
that AI is changing the recruitment industry and is replacing repetitive tasks
that were usually performed by human recruiters. Wang & Lin (2018) said
that AI can effectively reduce the subjective factors of people, complete the
whole process of recruitment openly, transparently and objectively, but the
interviewing process must be lacking interaction and face-to-face various
senses.
Barboza (2019) said that one of the most talked-about and highly
debated drifts in modern organizations regarding HR technology has been
artificial intelligence and they believe that artificial intelligence would be a
game-changer for higher productivity and efficiency in HR professionals.
Cappelli, et. al. (2019) said that artificial intelligence applications harm
employees’ behavior and firms must ensure their involvement because that
is necessary for their success. Fedorov, et. al. (2019) said that artificial
intelligence technologies strongly affect the company's business strategy
and the HR practices and are being perceived by many as a real threat to
human employees' jobs. Nunn (2019) stated that AI is becoming the key
driver behind job-candidate matching and automating communications with
candidates. These are arguably the two biggest areas where AI is at its most
effective, eliminating human bias and increasing efficiency in candidate
assessment and communication. Parveen & Palaniammal (2019) stated that

4
artificial intelligence would perform all work in human resource
management functions like recruitment, selection, and performance
management automatically. Prasanna & Kusuma (2019) said that the
integration of HR practices with AI applications has a stronger impact on
enhancing organizational performance, even though it does not possess
human’s emotional and cognitive abilities.
Based on the above mentioned, this study aims to investigate the
impact of artificial intelligence dimensions (automation, efficiency, and ease
of use) on employment in High-Tech companies (recruitment, selection, and
appointment) in the Jordanian market.
1.2 Study Purpose and Objectives:
The purpose of the study is to examine the impact of artificial
intelligence on employment in High-Tech companies (recruitment,
selection, and appointment) in the Jordanian market. The main objectives of
this study are:
1. Provide sound recommendations to High-Tech companies in
Jordan to reduce the negative impact of artificial intelligence on future
employment by developing suitable strategies to take advantage of these
technologies to help employees expand their capabilities, and to create new
markets that establish new business horizons instead of stealing their jobs.
2. Find out how to utilize artificial intelligence technologies in a
way that is suitable for employees in High-Tech companies to improve their
skills and service quality as well as keep their jobs.
3. Develop policies that promote efficient labor markets for the
benefit of workers, employers and societies as a whole.

5
1.3 Study Significance and Importance:
The current study might be considered the first study on this topic to
be, conducted in Jordan and/or the Arab world. It might provide advice to
High-Tech companies to benefit from these technologies in developing their
employees’ skills instead of dispensing with them.
The results might be appropriate to other industries that have
similarities within the same business sphere. It could also be a base for other
studies in the future. There are a few studies that discuss the impact of using
new technologies in business from an employee’s perspective. Therefore,
the value of this study arises from the following scientific and practical
considerations:
1. Drive attention to artificial intelligence and its impact on
employment in High-Tech companies in the Jordanian market.
2. This study contributes to build further studies on this topic that
can be used in other businesses.
3. Give recommendations to High-Tech companies or other
industries on how to apply artificial intelligence technologies in a way that
helps the employees instead of replacing them.
4. The researcher is working in a company that has started to
consider dismissing employees due to using new technologies. The results
of this study can be used to give some recommendations to the business
owner on the impact of artificial intelligence technologies on employment
to help them develop suitable strategies to their businesses that benefit the
workers and employers.
1.4 Problem Statement:
The problem of the study arises from the reality of work, and after
conducting some interviews with the employees, they complained that their
6
companies seek to reduce costs and apply artificial intelligence, thus making
employees feel that this threatens their jobs, especially those with weak
skills. The study discusses the impact of artificial intelligence on
employment. Previous studies differ between supporters and opponents.
Frey & Osborne (2013) said that the number of jobs at risk of replacement
by future computerization has attracted the attention of the media
everywhere. Rotman (2013) said that rapid technological change has been
destroying jobs faster than it is creating them. He also said that the robot
workforce could drive productivity and growth on its own, eliminating jobs
in the process. Bowles (2014) found that for the European labor market, the
average of EU jobs at risk of computerization is 54%. Autor (2015) stated
that automation is starting to move in and eliminate office jobs too. Not that
long ago, new industries hired more people than those they put out of
business. Susskind & Susskind (2015) stated that with increased
mechanization, there are increased organic systems losses. Arntz, et. al.
(2016) argued that due to artificial intelligence advances, technological
unemployment because of workers seeking new jobs after being laid off is
likely to increase over the years. Deloitte (2016) suggested that up to 15
million jobs in the UK could be lost through the utilization of advanced
robotics and automation technologies. Tandon, et. al. (2017) argued that a
human recruiter is necessary for middle management, senior management
hires, and companies should only consider human recruiters when hiring
managers. Frontier (2018) discussed that the recent industrial automation
has been tied to falling employment and earnings in manufacturing for labor
with low and medium levels of formal education.
Therefore, this study aims to investigate the impact of artificial
intelligence on employment in High-Tech companies in the Jordanian
market.

7
1.5 Problem Questions:
Based on the arguments above, this study aims to answer the
following research question:
1. Do artificial intelligence dimensions (automation, efficiency,
and ease of use) have an impact on employment in High-Tech companies in
the Jordanian market?
Based on artificial intelligence dimensions above, we divided the
main question into the following sub-questions:
1.1. Does artificial intelligence automation have an impact on
employment in High-Tech companies in the Jordanian market?
1.2. Does artificial intelligence efficiency have an impact on
employment in High-Tech companies in the Jordanian market?
1.3. Does artificial intelligence ease of use have an impact on
employment in High-Tech companies in the Jordanian market?
1.6 Study Hypotheses:
The previous questions answered by testing the following hypothesis:
Main Hypothesis:
H01: Artificial intelligence dimensions (automation, efficiency, and
ease of use) do not impact employment in High-Tech companies in the
Jordanian market, at (α≤0.05).
Sub Hypotheses:
Based on artificial intelligence dimensions, the main hypothesis was
divided into the following sub-hypotheses:
H01.1: Artificial intelligence automation does not impact
employment in High-Tech companies in the Jordanian market, at (α≤0.05).

8
H01.2: Artificial intelligence efficiency does not impact employment
in High-Tech companies in the Jordanian market, at (α≤0.05).
H01.3: Artificial intelligence ease of use does not impact employment
in High-Tech companies in the Jordanian market, at (α≤0.05).
1.7 Study Model:
Based on the problem statement above and its questions the following
model has been formed to study the impact of artificial intelligence on
employment, as shown in Model (1-1).
Model (1-1): Study Model
Independent Variable Dependent Variable
Employment:
(Recruitment, Selection,
Appointment)
Artificial Intelligence:
1. Automation.
2. Efficiency.
3. Ease of use.
Sources: This model is developed based on the following studies: For the independent variable:
(Strohmeier & Piazza, 2015; Kiruthika & Khaddaj, 2017; Garg, et al., 2018). For the dependent
variable: (Ruël, et. al., 2004; Oksanen, 2018; Dijkkamp, 2019; Masum, et. al., 2018).
1.8 Operational Definitions of Terms:
Artificial intelligence (AI): is the computer system that can perform
normal tasks that require human intelligence. It is the stimulation of human
intelligence processes by machines, including learning, reasoning, and self-
correction. AI automates processes that can be controlled by machines
instead of humans and can efficiently interpret external data, learn from such
data, and use what was learned from the data to achieve specific goals and
tasks through flexible adaptation. The user can easily use AI to minimize
effort and maximize chances for the achievement of goals.
01.3H
01H
01.1H
01.2H

9
Automation: It is the use of machines and technology to make
processes run on their own without human effort. It involves the use of
control systems for operating equipment and applications with minimal
human intervention. Automation is a system used to build automatic
alarms/process notifications when a problem of any kind arises; a human
being is notified and can intervene to solve the problem.
Efficiency: It is the extent to which useful work is performed by a
machine and the condition of producing the results you desire without
wasting material, energy, effort, money, and time. Efficiency is developing
modern production facilities using new information technologies that can
produce and distribute a company’s products in a timely and cost-effective
manner.
Ease of Use: It is the degree to which an application can be easily
understood and controlled by users. Users can operate the system without
putting much effort. Ease of use means the flexibility of using technology
and it gives a motivation to use the technology more frequently.
Employment: It is the process of recruiting, selecting and appointing
the right employees who will fit well into job requirements in the
organization.
Recruitment: It is the overall activity carried out by the organization
to identify, attract and shortlisting suitable candidates and stimulate them to
apply for the job. It is a nonstop process whereby the firm tries to develop a
pool of qualified applicants for future human resources needs. Recruitment
is the search for potential employees to meet job requirements.
Selection: It is the process of interviewing and evaluating candidates
for a vacant position in the organization and carefully choosing an individual
for employment based on certain standards and qualifications and filtering

10
out unsuitable applicants for future dismissal. It includes preliminary
interviewing, receiving applications, screening applications, interviewing,
reference checking, and final selection.
Appointment: It is the approval of an applicant or employee for
suitable jobs to perform the duties and responsibilities of an established
position under the company's objectives. It includes the arrangement to
conduct a meeting with the person and the act of placing the person in a job
or position.
1.9 Study Limitations and Delimitations:
Human Limitation: This research applied to managers, supervisors,
and employees of High-Tech companies in Jordan.
Place Limitation: The research was applied in Amman, Jordan.
Time Limitation: This research was applied during the first semester
and the second semester of the academic year 2019/2020.
Study Delimitation: The purpose of this research is to investigate the
impact of artificial intelligence on employment in High-Tech companies in
the Jordanian market. Generalizing its results on other sectors may not apply,
so this research is limited to High-Tech companies in Jordan.
Extending the analyses to other industries and countries represent
future research opportunities, which can be done by further testing with
larger samples within the same industry, and including other industries will
help reduce the issue of generalizing conclusions on other industries.
Moreover, further empirical researches involving data collection over
various countries especially Arab countries are needed.

11
Chapter Two: Theoretical and Conceptual Framework
and Literature Review
2.1 Introduction:
This chapter contains variables definitions and, the relationship
between different variables. Moreover, it includes previous studies and
previous models and what differentiates this study from other studies.
2.2 Definitions and Components of Variables:
Definitions and Components of the Independent Variable
(Artificial Intelligence):
Artificial Intelligence: Rifkin (1995) said that artificial intelligence
means the art of creating machines that perform functions that require
intelligence when performed by people. Arntz, et. al. (2016) defined
artificial intelligence as the type of human capabilities machines can do.
Russell & Norvig (2016) said that artificial intelligence (AI) can be defined
as computer programs that are capable of performing intelligent functions.
Wisskirchen, et. al. (2017) said that artificial intelligence describes the work
processes of machines that would require intelligence if performed by
humans. Wisskirchen, et. al. (2017) also said that when computers can
understand the right software/programming and are able to optimize their
behavior based on their former behavior and their experience is called
artificial intelligence. Jackson (2019) agreed that artificial intelligence is a
technology that is already impacting how users interact with and are affected
by the internet. Prasanna & Kusuma (2019) stated that artificial intelligence
is a tool that uses human intelligence in various fields and improves
performance, and it is an emerging technology, which is used in all
industries to improve productivity and performance.

12
In summary, artificial intelligence is a computer system that can
perform normal tasks requiring human intelligence. It is the stimulation of
human intelligence processes by machines, including learning, reasoning,
and self-correction.
Automation: Rifkin (1995) said that automation is the use of control
systems for operating equipment such as machinery, processes in factories,
and other applications and vehicles with minimal human intervention.
Tzafestas (2009) stated that automation means the operations and activities
that can be monitored and controlled by machines instead of humans.
Groover (2014) defined automation as the technology by which a process or
procedure is performed with minimal human assistance. Altemeyer (2019)
argued that automation is the use of technology to execute recurring tasks or
processes in a business where manual effort can be replaced. Wang & Siau
(2019) defined automation as the use of digital technology to perform
processes to accomplish a workflow or function.
In summary, automation is the use of machines and technology to
make processes run on their own without human effort. It involves the use
of control systems for operating equipment and applications with minimal
human intervention.
Efficiency: Samset (1998) defined efficiency as a measure of
realization of the project’s purpose, or the project’s long-term consequences.
Sufian, et. al. (2013) said that efficiency is the extent to which a firm has
been able to transform its inputs into outputs following the progressive
objective of the firm. Olsson (2017) stated that efficiency is related to
producing direct outputs, and to added value for owners and users. Palmer
& Torgerson (2018) defined efficiency as the relationship between resource
inputs (costs, labor, capital, or equipment) and intermediate outputs
(numbers treated, waiting time, etc.). Ashtiani, et. al. (2019) said that

13
efficiency is the ratio of the work done or energy developed by a machine,
engine, etc., to the energy supplied to it, usually expressed as a percentage.
Sattar, et. al. (2019) defined efficiency as the level of performance that
describes using the least amount of input to achieve the highest amount of
output.
In summary, efficiency is the extent to which useful work is
performed by a machine and the condition of producing the results you
desire without wasting material, energy, effort, money, and time.
Ease of Use: Lee & Park (2008) defined it as the extent to which a
user can use the specific system without putting much effort. Jen & Hung
(2010) said that it is the degree to which artificial intelligence is easily
understood and can be operated by anyone. Lim, et. al. (2011) stated that
ease of use is the minimum effort that a user can put in using technology.
Jung & Yim (2016) defined it as a motivation to use technology more
frequently. Gursoy, et. al. (2019) defined ease of use as the degree to which
an application can be easily understood and controlled by users.
In summary, ease of use is the degree to which an application can be
easily understood and controlled by users.
Definitions and Components of the Dependent Variable
(Employment):
Employment: Dakin, et. al. (1989) defined employment as the
relationship between two parties, usually based on a contract where work is
paid for. Kaba (2017) said that employment means finding new jobs that are
available at that moment. Heathfield (2018) defined employment as an
agreement between an employer and an employee according to which the
employee will provide certain services on the job that are paid. Goldberg &
Wilkinson (2019) agreed that employment is the process of reviewing

14
applications, selecting the right candidates to interview, testing candidates,
and choosing between candidates to make the hiring decision. Wilkinson
(2019) said that employment is the process of attracting, training and
developing talents who will fit well into the organization.
In summary, employment is the process of recruiting, selecting, and
appointing the right employees who will fit well into job requirements in the
organization.
Recruitment: Devi & Banu (2014) defined recruitment as the process
of searching for candidates for employment and stimulating them to apply
for jobs in the organization. Devi & Banu (2014) also defined it as a
continuous process whereby the firm attempts to develop a pool of qualified
applicants for the future human resources needs even though specific
vacancies do not exist. Brando, et. al. (2019) said that it is the process of
attracting a pool of candidates to a particular position, followed by the
selection phase. Hmoud & Laszlo (2019) said that recruitment is the process
of identifying the job vacancy, analyzing the job requirements, reviewing
applications, screening, shortlisting and selecting the right candidate.
Matolo, et. al. (2019) stated that recruitment is the search for the prospective
employee to suit the job requirements as represented by job specification.
In summary, recruitment is the overall activity carried out by the
organization to identify, attract and shortlisting suitable candidates and
stimulate them to apply for the job.
Selection: Gusdorf (2008) defined selection as the process of
shortlisting the right candidates with the necessary qualifications and skills
to fill the vacancies in an organization. Muchinsky (2011) said that selection
is the methodical process used to hire (or, less commonly, promote)
individuals. Holm & Haahr (2019) defined selection as choosing the right
candidates who will fit well into the organization, the vacant job, and their

15
future co-workers. Matolo, et. al. (2019) defined selection as the
management decision making and extensive planning to employ the most
suitable manpower. Villegas, et. al. (2019) said that selection is a process of
picking the right candidate with prerequisite qualifications and capabilities
to fill the jobs in the organization.
In summary, the selection is the process of interviewing and
evaluating candidates for a vacant position in the organization and carefully
choosing an individual for employment based on certain standards and
qualifications and filtering out unsuitable applicants for future dismissal.
Appointment: Public Service Ministry of Guyana (2004) defined
appointment as the procedure for formulating the employment of persons in
specific posts. Mehrabad & Brojeny (2007) said that it is the selection of
suitable jobs for applicants and correct job rotation concerning
organizational requirements and job classification. Bauer (2010) defined
appointment as the process of helping new hires adjust to social and
performance aspects of their new jobs quickly and smoothly. Decenzo &
Robbins (2010) defined appointment as the process by which an individual
is empowered in the appropriate job. Luder, et. al. (2018) said that
appointment is the power of the executive to select persons to fill a position
or employment in the organization.
In summary, the appointment is the approval of an applicant or
employee for suitable jobs to perform the duties and responsibilities of an
established position under the company's objectives.
2.3 Relationships between Independent and Dependent
Variables:
Previous studies showed the correlation between variables, but few
studies are related to this. The researcher combined independent variables
16
from several studies that indicate an impact on dependent variables. Albus
(1983) said that the problem is not in finding jobs for both humans and
robots, but in finding mechanisms by which the wealth created by robot
technology can be distributed as income to the people. Autor, et. al. (2003)
stated that there is a relationship between automation and tasks performed
by humans. Frey & Osborne (2013) warned that the pace of automation is
accelerating and the range of jobs affected is increasing, thus threatening
displacement across large shares of jobs in the near future. Deloitte (2016)
suggested that employment in the UK could be lost through the utilization
of advanced automation technologies. Autor & Salomons (2017) stated that
rapid advances in machine capabilities might affect employment on so many
levels. McKinsey & Company (2017) suggested that almost every job could
be replaced by machines by 2030. Frontier (2018) discussed that industrial
automation has been tied to falling employment in manufacturing for labor
with low and medium levels of formal education.
2.4 Previous Models:
After reviewing related literature, it has been found that not only the
definition but also the classification of each dimension was not clear nor
unified. Moreover, the measurement methods and models were not unified
as well. Very limited literature discussed and studied the artificial
intelligence concept, dimensions, and components. The following section
will briefly discuss some of the literature and models that studied the
artificial intelligence dimensions and the relationship with one or more of
employment dimensions.
Ruël, et. al. (2004) Model:
This model illustrates the goals of e-HRM, which are mainly to
improve HR's administrative efficiency to achieve cost reduction using AI
technology to achieve organizational objectives. The results showed that e-

17
HRM helped to improve employee competencies, but led to cost reduction
and a reduction of the administrative burden.
Model (2-1): Ruël, et. al. (2004) Model
Ghazzawi, et. al. (2014) Model:
The study presents a strong influence of perceived ease of use of
electronic human resource management on the employee's attitudes of using
E-HRM. The study revealed that perceived ease of use is more important
than perceived usefulness; it is the main predictor of the attitude towards
implementing electronic human resource management.
Model (2-2): Ghazzawi, et. al. (2014) Mode

18
Strohmeier & Piazza (2015) Model:
The model summarizes the automation and information of staffing,
performance management, development, and compensation constitute major
task requirement categories.
Model (2-3): Strohmeier & Piazza (2015) Model
Kiruthika & Khaddaj (2017) Model:
This model shows how virtual reality and artificial intelligence creates
a new dimension to the business and affects crucial decisions for the future
continuation of the business, and which areas they impact.
Model (2-4): Kiruthika & Khaddaj (2017) Model
Skilton & Hovsepian (2017) Model:
This model shows the relationship between the adaptations of human
work towards AI society. The results showed that the impact of artificial

19
intelligence and the fusion of intelligent systems into industries, individuals
and societies would have a profound impact on the role of the human at work
and human experience.
Model (2-5): Skilton & Hovsepian (2017) Model
Garg, et al. (2018) Model:
The framework shows how artificial intelligence can be used by
organizations for candidate screening, employee engagement, employee re-
engagement and career development without much use of resources and thus
decreasing overall environmental impact. The study analyzed the emergence
of artificial intelligence in the green HRM process and the potential benefits
of artificial intelligence through secondary data.
Model (2-6): Garg, et al. (2018) Model

20
Masum, et. al. (2018) Model:
The model shows the framework of intelligent human resource
information systems (i-HRIS) applying an intelligent decision support
system (IDSS) to improve structured and unstructured HR decision-making
processes. Moreover, the proposed HR IDSS stores and processes
information with a set of artificial intelligent (AI) tools such as knowledge-
based reasoning, and machine learning. These AI tools are used to discover
useful information or knowledge from past data and experience to support
the decision-making process.
Model (2-7): Masum, et. al. (2018) Model
21
Oksanen (2018) Model:
This model illustrates the new technology-based recruitment
methods, focusing on how they are utilized by recruitment professionals and
how the opportunities and risks that these new technological solutions
provide in recruitment processes are experienced.
Model (2-8): Oksanen (2018) Model

22
Dijkkamp (2019) Model:
The model shows the changing role of the HR professional in the
recruitment and selection process with the introduction of AI, and presents
the tasks and responsibilities, competencies and the way the HR professional
creates value in every stage.
Model (2-9): Dijkkamp (2019) Model
2.5 Previous Studies:
Rifkin (1995) study titled “The end of work: the decline of the
global labor force and the dawn of the post-market era” aimed to discuss
the impact of machines on the global labor force, describing how new
technologies are stealing jobs in every industry. Data was collected from
previous studies and specialty journals. Results showed that information
and communication technologies would be able to replace more and more
of the global workforce, and wonder how an increasingly underemployed
and unemployed global workforce, displaced by the technologies, is going
23
to be able to afford all of the products and services being turned out by the
highly automated machines.
Frey & Osborne (2013) study titled “The future of employment:
how susceptible are jobs to computerization?” aimed to investigate the
impact of future computerization on labor market outcomes, with the
primary objective of analyzing the number of jobs at risk. The new novel
methodology was used to estimate the probability of computerization for
702 detailed occupations. Results showed that a substantial share of
employment in service occupations is susceptible to computerization. It also
provided evidence that wages and educational attainment exhibit a strong
negative relationship with the probability of computerization.
Ford (2013) study titled “Could artificial intelligence create an
unemployment crisis?” aimed to discuss how machines automation is
taking on intellectual tasks that once were referred to non-routine tasks that
required the human brain. Data was collected from previous studies and
specialty journals. Results showed that machine intelligence could
accomplish every task better and more cheaply than human workers, and by
that, it would create an employment crisis that would endanger human
workers.
Rotman (2013) study titled “How technology is destroying jobs”
aimed to investigate the impact of impressive advanced computer
technology-from improved industrial robotics to automated services- on
employment for the last decade. The data was collected from several
different studies and in particular Brynjolfsson’s book: Race against the
Machine. Results showed that automation and digital technologies are partly
responsible for today’s lack of jobs, and it is clear that it has caused workers
to worry about their jobs.

24
Autor (2015) study titled “Why Are There Still So Many Jobs? The
History and Future of Workplace Automation” aimed to discuss the
consequences that automation has on the majority of jobs over the years and
how machines would indeed replace workers. Data were collected from
several studies to conclude the positive and negative usage of automation.
The results showed a strong complementarity between automation and labor
that increases productivity and augment demand for labor.
Davenport & Kirby (2015) study titled “Beyond automation” aimed
to investigate the impact of technology and artificial intelligence would have
on where we work and how we work. Data was collected from previous
studies and journals. Results showed that the implementation of artificial
intelligence and technological advances in the work environment is neither
a blessing nor a curse. Technological advances promote efficiency and cost-
savings in the long run, but there is a human value that cannot be replaced
by automation.
Arntz, et. al. (2016) study titled “The risk of automation for jobs in
OECD countries” aimed to discuss two purposes. Firstly, assess job
automation for 21 countries taking into account the heterogeneity of
employees’ tasks and the second purpose is to critically assess studies that
create figures on the “risk of computerization” and to discuss the possibility
of adjusting processes of companies and workers to automation. The
analysis was based on data collected from the international assessment of
adult competencies program. The main conclusion from the study was that
automation is improbable to destroy huge numbers of jobs but some of them.
H´emous & Olsen (2016) study titled “The Rise of the Machines:
Automation, Horizontal Innovation, and Income Inequality” aimed to
develop a structure for the realization of the relationship between
technological change and the income distribution by focusing on two kinds

25
of innovations, the establishment of new products, and the automation of
existing tasks. Data was collected from statistical analysis of variance
growth model with low-skill and high-skill workers. The results showed that
the rushing process of technological development now allows employees to
be replaced by machines. However, there is a negative correlation between
the probability of automation of a profession and its average annual wages,
proposing a possible rise in short-term inequality.
Autor & Salomons (2017) study titled “Does Productivity Growth
Threaten Employment?” aimed to apply a comprehensive approach to
measure technological progress, studying the employment consequences of
rising labor productivity to investigate both the direct and indirect
employment effects of productivity growth. The analysis was tested by using
country and industry-level data for 19 countries over 35+ years. The results
showed that productivity growth has been employment increasing rather
than employment decreasing.
Manyika (2017) study titled “What is the future of work” aimed to
debate what impact automation technology like artificial intelligence (AI)
and robotics would have on jobs, skills, and wages. The analysis was based
on data collected from international companies. Results showed that
between almost zero and 30 percent of the hours worked globally could be
automated by 2030, depending on the speed of adoption.
McKinsey & Company (2017) study titled “Jobs lost, jobs gained:
workforce transitions in a time of automation” aimed to report on
automation and its impact on work activities. The study assessed the jobs
that could be established under various scenarios through 2030 and
compared them to jobs that could be displaced by automation. The analysis
covered 46 countries that make up almost 90 percent of global GDP. The

26
results showed a rich variety of potential changes in occupations in
upcoming years, with significant effects on workforce skills and wages.
Wisskirchen, et al. (2017) study titled “Artificial intelligence and
robotics and their impact on the workplace” aimed to investigate the
impact of future trends relating to the impact of artificial intelligence on the
labor market and discusses legal, business and economic issues, such as
changes in the future labor market and the impact on working time. Data
was collected from a collection of complex articles, sources and analysis
studies to discuss all the threats and opportunities that artificial intelligence
has on the future labor market. The results showed that artificial intelligence
is threatening labor in different industries, and on the other hand, it showed
that artificial intelligence is opening new opportunities to create new jobs.
Ernst, et. al. (2018) study titled “The economics of artificial
intelligence: Implications for the future of work” aimed to discusses the
rationale fears of losing jobs opportunities, highlighting the specific nature
of artificial intelligence and comparing previous waves of automation with
the current advancements made possible by the wide-spread adoption of it.
Data collected from previous studies and articles. Results found that, based
on the automation of a few sectors, automation could generate even more
significant (negative) employment effects when artificial intelligence affects
a far larger set of job opportunities in industries and occupations.
Frontier Economics (2018) study titled “The Impact of Artificial
Intelligence on Work: An evidence synthesis on implications for
individuals, communities, and societies” aimed to discuss the potential
impact of Artificial Intelligence on work in the near and medium-term, and
how automation would affect societies in the future. Data was collected from
previous studies also from interviews with managers of different levels.
Results showed that digital technology and automation have already affected

27
work over and above the role of trade liberalization. They also showed that
there have been individual losses from displacement related to automation.
Grace, et, al. (2018) study titled “When will AI exceed human
performance? Evidence from AI experts” aimed to investigate how
technology might replace millions of jobs over the coming decade. It also
discusses possible unemployment, new challenges we might face when
artificial intelligence takes over, such as rebuilding infrastructure and
adapting laws and regulations. Data was collected by a survey distributed on
352 researchers. Results showed that high-level machine intelligence can
accomplish every task better and more cheaply than human workers can.
He (2018) study titled “Can artificial intelligence make work more
human?” aimed to investigate where AI can be implemented in the
traditional recruitment process and possibly make the process more
effective, as well as what are the implications of having AI within
recruitment. This study used a qualitative study with semi-structured
interviews conducted with eight international companies from all over the
world. The results showed that the area of AI in recruitment is relatively new
and there are not many companies that utilize AI in all parts of their
recruitment process. The most suitable parts to implement AI in traditional
recruitment include recruitment activities such as pre-selection and
communication with candidates and sending out recruitment results for
applicants.
Nuefeind, et. al. (2018) study titled “Work in the digital age:
challenges of the fourth industrial revolution” aimed to provide a wide-
ranging, comprehensive analysis of the challenges and opportunities for
labor in a period of rapid technological change. Data was collected from a
collection of articles. Results showed that employment losses have to be
accepted as a minimal cost, due to the automation impact on employment

28
growth. It also showed that massive employment losses have led to
widespread moves away from long-term jobs towards self-employment,
linked more closely to new digital technologies, robotics, and artificial
intelligence.
Perez, et al. (2018) study titled “Artificial intelligence and robotics”
aimed to search in the ethical issues in artificial intelligence and the fears
about the impact of the technology on the society. Data were collected from
several studies and resources to conclude the positive and negative usage of
artificial intelligence and its impact on various jobs. Results showed that
robots replace already 8% of jobs, and in 2020, this percentage will increase
to 26%. It also showed that robots will become increasingly autonomous and
be able to interact, execute and make more complex decisions.
Wang & Lin, (2018) study titled “Research on the Influence of
Artificial Intelligence on Human Resource Management Teaching and
Work” aimed to discuss the impact of artificial intelligence on employment
arrangement and how to appoint people to suitable positions and give them
scientific tasks. This study used a literature analysis of companies and
selected 76 companies as a case study. The results showed that human beings
are irreplaceable, and there is a significant relationship between AI and
employment arrangement in both positive a negative way.
Barboza (2019) study titled “Artificial Intelligence and HR: The
New Wave of Technology” aimed to discuss the state of artificial
intelligence and its impact on HR. Data was collected from secondary data
with the base of relevant studies in the field of artificial intelligence on HR.
In this regard, various libraries were visited and some on-line journals,
books and research papers on the internet were also reviewed. Results
showed that with a more productive and efficient workplace begins when

29
HR leaders implement numerous layers of AI to deliver more value to their
organizations.
Cappelli, et. al. (2019) study titled “Artificial intelligence in human
resources management: challenges and a path forward” aimed to discuss
the gap between the promise and reality of artificial intelligence in human
resource management and suggest how progress might be made, and also to
identify the challenges in using data science techniques for HR tasks. Data
was collected based on interviews with CEO’s of different technological
companies. The results showed that there is a risk to HR leaders that if they
do not engage the possibilities of AI, some other functions in the business
will take control of it for them.
Fedorov, et. al. (2019) study titled “Digitalization of human
resource management practices and its impact on employees’ well-
being” aimed to assess the impact of the processes of the labor activity
digitalization on employees, which have not yet received sufficient attention
in HRM research and practice. The research methodology included the
analysis of data obtained using sociological surveys and content analysis.
The results of the study identified the problems resulting from expanding the
practice of applying digital technologies in HRM system, proving the
negative impact of digitalization processes on employee well-being (along
with positive effects), and, therefore, the need to develop management
solutions aimed at preserving well-being in the workplace.
Nunn (2019) study titled “The Emerging Impact of AI on HR”
aimed to investigate the impact of artificial intelligence on HR and the
employment process. Data were collected from several studies to conclude
the positive and negative usage of artificial intelligence. Results showed that
human resource management is the key to the success of any organization
but recent technology will help human resources to operate with the help of

30
machines, which will reduce their work and help them to concentrate more
on other aspects of the organization.
Prasanna & Kusuma (2019) study titled “To Study Impact of
Artificial Intelligence on Human Resource Management” aimed to
discuss how well the organization needs to train and re-transform its
workforce in understanding, collaborating, and working with AI and robots
to improve its human resource management process. A survey
(questionnaire) was conducted at 243 firms in high-tech companies in India.
The statistical test applied and the results showed that there is a significant
impact of artificial intelligence on HRM.
Parveen & Palaniammal (2019) study titled “A Study on Artificial
Intelligence in Human Resource Management Today and Tomorrow”
aimed to discuss the impact of artificial intelligence on human resource
management and how it would perform the work of HRM functions in
organizations. Data was collected from surveying 112 managers at High-
Tech companies. The results showed that in 2025 all the work will change
into automation and there will be only 25% of human workers. Though AI
evolved to a great degree, the HR department still needs human contribution
to do the necessary work for staffing.
2.6 What Differentiates this Current Study from Previous
Studies?
1. This study might be considered the first study to investigate the
impact of artificial intelligence on employment in High-Tec companies in
the Jordanian market, especially in the service sector.
2. The samples of the previous studies and research included
specific categories, either beneficiaries or employees, while the current
study comprises the samples of employees working in the High-Tech

31
companies who are concerned about the possibility that the advancement in
technology may one day replace human labor and automate their work.
3. Most previous studies considered public shareholder
organizations listed in the stock markets, while the current study covered
both public and private shareholder organizations.
4. The findings of this study could be helpful to be applied
immediately in the Jordanian environment.

32
Chapter Three: Study Methodology (Methods and
Procedures)
3.1 Introduction:
This chapter describes the methodology of the current study used, the
study population and sample, study tools and data collections, the validity
of questionnaire and reliability analysis that have been stated and applied.
Finally, a discussion of statistical treatment used in the analysis of the
collected data was addressed.
3.2 Study Design:
This study is deemed a descriptive and cause-effect study. It aims to
study the impact of artificial intelligence dimensions (efficiency,
automation, and ease of use) on employment dimensions (recruitment,
selection, and appointment) in the Jordanian market. It starts with a literature
review to develop a model for the study. Then a panel of judges was used
and expert interviews were conducted to develop a questionnaire, which
used to gather the data. The gathered data was checked and coded on SPSS.
Then normality, validity, and reliability were tested and the correlation
among variables was checked. Finally, multiple regressions were used to test
the hypotheses.
3.3 Study Population, Sample and Unit of Analysis:
The study population consists of managers, supervisors, and
employees in High-Tech companies in the Jordanian market.
The sample of the study was chosen by a survey method which
negates the need for the study sampling. A list of 900 High-Tech companies
was taken from the Amman Chamber of Commerce, including 130
companies related to artificial intelligence. All these companies were

33
contacted, and (51) companies responded and agreed to participate in this
study.
Unit of Analysis: The survey unit of analysis composed of 138
managers, supervisors and employees in High-Tech companies in the
Jordanian market, who were available at the time of distributing the
questionnaires to participate in the study.
3.4 Data Collection Methods:
For fulfilling the purposes of the study, data was collected from two
sources: secondary and primary data as follows:
Primary and Secondary Sources:
Secondary Sources:
Secondary data was collected from different sources such as journals,
working papers, research, thesis, articles, and the worldwide web.
Primary Sources:
To actualize this study primary data was collected from managers,
supervisors, and employees in High-Tech companies in Jordan by a
questionnaire, which was built and developed for this purpose.
Study Tool:
The questionnaire was used as the main tool to actualize this study,
which examines the impact of artificial intelligence on employment in High-
Tech companies in the Jordanian market. This questionnaire was addressed
to managers, supervisors, and employees from different companies, and it
consisted of three sections. These are:
1. Section one: demographic variables, containing (gender, age,
education, position, and experience).

34
2. Section two: artificial intelligence, containing three
dimensions: AI automation, which contains (5) statements. AI efficiency,
which contains (5) statements. AI ease of use, which contains (5) statements.
3. Section three: employment, containing three dimensions:
Recruitment, which contains (5) statements. Selection, it contains (5)
statements. Appointment, which contains (5) statements.
All items measured by a five-point Likert-type scale to rate the
respondent's actual perceptions regarding each item as follows: 1 (strongly
unimplemented) to 5 (strongly implemented).
3.5. Data Collection and Analysis:
The researcher distributed (200) questionnaires to participants, (152)
questionnaires were returned from the sample, and the researcher excluded
(14) questionnaires due to unfinished information, so the questionnaires that
valid for analysis were (138). The response rate was (69%) from the original
sample, so Table (3-10) shows the demographic characteristics of the study
sample
3.5.1. Validity Test:
The tool’s validity was confirmed by using three methods: content,
face, and construct. The content validity was established by collecting the
data from multiple kinds of literature resources such as articles, thesis,
papers, journals, research, and the World Wide Web. Furthermore, face
validity was accurately performed by academic reviewers from Middle East
University and other universities. The questionnaire was submitted to (13)
board of judges, to verify the sincerity of its statements, and to take their
opinions, and re-wording of some paragraphs. The required modifications
were made to carefully strike a weight degree between the content of
resolution in statements.

35
Construct Validity (Factor Analysis):
The construct validity was confirmed using Principal Component
Factor Analysis with Kaiser Meyer Olkin (KMO). The data explanatory and
conformity were examined using Principal Factor Analysis. Factor loading
more than 0.50 is good and accepted if it exceeds 0.40 (Hair, et. al. 2014).
However, Kaiser Meyer Olkin (KMO) is used to measure sampling
adequacy, harmony and inter-correlations, KMO values between 0.8 and 1
indicate that a high sampling is adequate, and accepted if it is exceeding 0.6.
Another indicator is Bartlett's of Sphericity that was used for the
determination of the suitability of data and correlation, whereby if the
significant value of data is less than 0.05 at a 95% confidence level, it
indicates useful factor analysis. Variance percentage shows the explanation
power of factors (Cerny & Kaiser, 1977).
Automation:
Table (3-1): Principal Component Analysis Automation
No. Item F1 KMO Chi2 BTS Var% Sig.
1 The company uses AI to
perform processes without
human intervention.
0.577
0.702 93.602 10 43.088 0.000
2 The company uses AI to reduce
administrative workload. 0.699
3 The company uses AI to
replace manual tasks. 0.674
4 The company uses AI to
substitute repetitive tasks. 0.646
5 The company uses AI to avoid
errors automatically. 0.678
Table (3-1) shows that the loading factor of automation items scored
between 0.577 and 0.699. Therefore, construct validity is assumed. KMO
has rated 70.2%, which indicates good adequacy, and the Chi2 is 93.602,
which indicates the fitness of the model. Moreover, the variance percentage

36
is 43.088, so it can explain 43.08% of the variation. Finally, the significance
of Bartlett's Sphericity is less than 0.05, which indicates the factor analysis
is useful.
Efficiency:
Table (3-2) shows that the loading factor of efficiency items scored
between 0.623 and 0.794. Therefore, construct validity is assumed. KMO
has rated 77.2%, which indicates good adequacy, and the Chi2 is 149.762,
which indicates the fitness of the model. Moreover, the variance percentage
is 50.572, so it can explain 50.57% of the variation. Finally, the significance
of Bartlett's Sphericity is less than 0.05, which indicates the factor analysis
is useful.
Table (3-2): Principal Component Analysis Efficiency
No. Item F1 KMO Chi2 BTS Var% Sig.
1 The company uses AI to
convert resources efficiently
(fewer inputs).
0.623
0.772 149.762 10 50.572 0.000
2 The company uses AI to
transform inputs into outputs
with high quality.
0.794
3 The company uses AI in a
cost-effective manner. 0.697
4 The company uses AI to
improve productivity. 0.690
5 The company uses AI to speed
working processes. 0.741
Ease of use:
Table (3-3) shows that the loading factor of ease of use items scored
between 0.631 and 0.838. Therefore, construct validity is assumed. KMO
has rated 77.6%, which indicates good adequacy, and the Chi2 is 171.848,
which indicates the fitness of the model. Moreover, the variance percentage
is 52.364, so it can explain 52.36% of the variation. Finally, the significance
of Bartlett's Sphericity is less than 0.05, which indicates the factor analysis
is useful.

37
Table (3-3): Principal Component Analysis Ease of use
No. Item F1 KMO Chi2 BTS Var% Sig.
1 The employee understands AI
functions easily. 0.744
0.776 171.848 10 52.364 0.000
2 The employee uses AI systems
without much effort. 0.838
3 The employee uses AI to
complete tasks with minimal
supervision.
0.707
4 The employee uses AI to
perform tasks easily.
0.682
5 The employee uses AI to
simplify complex tasks. 0.631
Recruitment:
Table (3-4) shows that the loading factor of recruitment items scored
between 0.501 and 0.716. Therefore, construct validity is assumed. KMO
has rated 66.2%, which indicates good adequacy, and the Chi2 is 113.898,
which indicates the fitness of the model. Moreover, the variance percentage
is 44.221, so it can explain 44.22% of the variation. Finally, the significance
of Bartlett's Sphericity is less than 0.05, which indicates the factor analysis
is useful.
Table (3-4): Principal Component Analysis Recruitment
No. Item F1 KMO Chi2 BTS Var% Sig.
1 The company uses AI to
attract potential candidates. 0.693
0.662 113.898 10 44.221 0.000
2 The company uses AI to
improve the recruiter’s
response time.
0.698
3 The company uses AI to
discover new talents quickly. 0.716
4 The company uses AI to filter
resumes. (search keywords in
resumes)
0.692
5 The company uses AI to
predict employee success. 0.501

38
Selection:
Table (3-5) shows that the loading factor of selection items scored
between 0.694 and 0.821. Therefore, construct validity is assumed. KMO
has rated 78.6%, which indicates good adequacy, and the Chi2 is 192.349,
which indicates the fitness of the model. Moreover, the variance percentage
is 55.015, so it can explain 55.01% of the variation. Finally, the significance
of Bartlett's Sphericity is less than 0.05, which indicates the factor analysis
is useful.
Table (3-5): Principal Component Analysis Selection
No. Item F1 KMO Chi2 BTS Var% Sig.
1 The company uses AI to
evaluate candidates for open
vacancies.
0.821
0.786 192.349 10 55.015 0.000
2 The company uses AI to test
employees for a specific job. 0.731
3 The company uses AI to
reduce human bias. 0.751
4 The company uses AI to
match the right individual with
the right job.
0.705
5 The company uses AI to
schedule interviews. 0.694
Appointment:
Table (3-6): Principal Component Analysis Appointment
No. Item F1 KMO Chi2 BTS Var% Sig.
1 The company uses AI to
approve applicants for suitable
jobs.
.609
0.739 93.177 10 43.667 0.000
2 The company uses AI to
improve candidate
engagement.
.721
3 The company uses AI to
choose candidates based on
interpersonal skills.
.561
4 The company uses AI to
reduce hiring time. .636
5 The company uses AI to
schedule interviews. .756

39
Table (3-6) shows that the loading factor of appointment items scored
between 0.561 and 0.756. Therefore, construct validity is assumed. KMO
has rated 73.9%, which indicates good adequacy, and the Chi2 is 93.177,
which indicates the fitness of the model. Moreover, the variance percentage
is 43.667, so it can explain 43.66% of the variation. Finally, the significance
of Bartlett's Sphericity is less than 0.05, which indicates the factor analysis
is useful.
Artificial Intelligence:
Table (3-7) shows that the loading factor of artificial intelligence
items scored between 0.699 and 0.861. Therefore, construct validity is
assumed. KMO has rated 60.3%, which indicates good adequacy, and the
Chi2 is 73.635, which indicates the fitness of the model. Moreover, the
variance percentage is 61.108, so it can explain 61.10% of the variation.
Finally, the significance of Bartlett's Sphericity is less than 0.05, which
indicates the factor analysis is useful.
Table (3-7): Principal Component Analysis Artificial Intelligence
No. Item F1 KMO Chi2 BTS Var% Sig.
1 AI Ease of Use 0.699
0.603 73.635 10 61.108 0.000 2 AI Efficiency 0.861
3 AI Automation 0.777
Employment:
Table (3-8) shows that the loading factor of employment items scored
between 0.774 and 0.894.
Table (3-8): Principal Component Analysis Employment
No. Item F1 KMO Chi2 BTS Var% Sig.
1 Recruitment 0.774
0.637 120.052 10 68.649 0.000 2 Selection 0.813
3 Appointment 0.894
Therefore, construct validity is assumed. KMO has rated 63.7%,
which indicates good adequacy, and the Chi2 is 120.052, which indicates the

40
fitness of the model. Moreover, the variance percentage is 68.649, so it can
explain 68.64% of the variation. Finally, the significance of Bartlett's
Sphericity is less than 0.05, which indicates the factor analysis is useful.
3.5.2. Reliability test:
To calculate the stability of an instrument study, the researcher used
the equation of internal consistency using Cronbach's alpha test shown in
Table (3-9). The test results were the values of Cronbach alpha for all
variables of the study and identification of generally higher than (60%)
which is acceptable in the research and studies (Hair et. al., 2010). Table (3-
9) shows that the reliability coefficient for Artificial Intelligence dimensions
ranges between 0.666 and 0.764, and for Employment dimensions is
between 0.675 and 0.794.
Table (3-9): Cronbach's Alpha for the Study Fields
Variables Cronbach Alpha AI Automation 0.666
AI Efficiency 0.751
Ease of Use 0.764
Artificial Intelligence 0.828
Recruitment 0.680
Selection 0.794
Appointment 0.675
Employment 0.849
3.5.3 Demographic Analysis:
The demographic analysis presented in the below sections based on
the characteristics of the valid respondent i.e. frequency and percentage of
participants such as gender, age, experience, education, and position.
Gender: Table (3-10) shows that the majority of respondents are
males, where 94 (61.1%) were males, and only 44 (31.9%) are females. This
is justified since the female’s proportion is low within the scope of tested
divisions and this percentage is much higher within other divisions.

41
Table (3-10): Respondents Gender
Frequency Percent
Gender
Male 94 61.1
Female 44 31.9
Total 138 100.0
Age: Table (3-11) shows that the majority of respondents ages are
between (25-35 years) 79 (57.2%) out of the total sample. Those aged
between (35-45 years) are 40 (29%), respondents younger than 25 years are
11 (8%), and finally, those older than 45 years are 8 (5.8%).
Table (3-11): Respondents Age
Frequency Percent
Age
less than 25 years 11 8.0
25- less than 35 years 79 57.2
35- less than 45 years 40 29.0
more than 45 years 8 5.8
Total 138 100.0
Experience: Table (3-12) shows that the majority of respondents
have an experience between (11-15 years) 44 (31.9%), then respondents
experience between (5-10 years) are 39 (28.3%), followed by those with
experience less than 5 years 34 (24.6%). Finally, respondents who have
more than 15 years’ experience are 21 (15.2%).
Table (3-12): Respondents Experience
Frequency Percent
Experience
Less than 5 years 34 24.6
5-10 years 39 28.3
11-15 years 44 31.9
above 15 years 21 15.2
Total 138 100.0
Education: Table (3-13) shows that the majority of respondents hold
a bachelor's degree, where the majority of 108 (78.3%) have a bachelor's
degree, 28 (20.3%) have a master's degree, and finally 2 (1.4%) have
diploma degree.

42
Table (3-13): Respondents Education
Frequency Percent
Education
Diploma 2 1.4
Bachelor 108 78.3
Master 28 20.3
Total 138 100.0
Position: Table (3-14) shows that the majority of respondents are
employees 66 (47.8%), out of the total respondents after that; 49 (35.5%)
are managers; finally, the third category is supervisors 23 (16.7%).
Table (3-14): Respondents Position
Frequency Percent
Position
Manager 49 35.5
Supervisor 23 16.7
Employee 66 47.8
Total 138 100.0

43
Chapter Four: Data Analysis
4.1 Introduction:
According to the purpose of the research and the research framework
presented in the previous chapter, this chapter describes the results of the
statistical analysis for the data collected according to the research questions
and research hypotheses. Data analysis includes Pearson Bivariate
Correlation matrix, a descriptive of the Means and Standard Deviations for
the questions of the study and Multiple Regression were used.
4.2 Descriptive Analysis of Study Variables:
The research included a Likert scale as follows:
Strongly
Implemented Implemented Neutral
Not
Implemented
Strongly Not
Implemented
5 4 3 2 1
Relative importance, assigned due to:
Class Interval = Maximum Class – Minimum Class = 5 - 1 = 4 = 1.33
Number of Level 3 3
The low degree ranges from (1.00- 2.33), the medium degree from
(2.34 – 3.67), and the high degree from 3.67 – 5.00.
4.2.1 Level of artificial intelligence in High-Tech companies:
The researcher used arithmetic mean, standard deviation, t value, item
importance, and importance level to show the level of artificial intelligence
in High-Tech companies in the Jordanian market, as shown in Table (4-1).
Table (4-1): Arithmetic Mean, Std. Deviation, T value, Item Importance and
Importance level of The Artificial Intelligence in High-Tech Companies
No. Dimensions M. S.D. t Sig. Rank Impl. 1 AI Automation 3.46 0.66 8.169 0.000 2 Medium
2 AI Efficiency 3.43 0.78 6.490 0.000 3 Medium
3 AI Ease of use 3.47 0.72 7.718 0.000 1 Medium
Total 3.45 0.56 9.478 0.000 Medium
(T-tabulated value = 1.960)

44
As shown in Table (4-1) the means values of (artificial intelligence in
High-Tech companies), ranged from (3.43-3.47), where the total mean was
of (3.45), with a standard deviation between (0.66-0.78), which is of a
medium implementation level.
This indicates that respondents agree on the medium implementation
of artificial intelligence dimensions that is supported by high t-value
compared to T-tabulated. The average mean is (3.45) with a standard
deviation of (0.56), which indicates that the respondents are medium aware
and concerned about artificial intelligence, where the t-value is 9.478>T-
tabulated = 1.960.
(AI Automation Level)
The researcher used arithmetic mean, standard deviation, item
importance, and importance level to show the AI automation level in High-
Tech companies, as shown in Table (4-2).
Table (4-2): Arithmetic Mean, Std. Deviation, t value, Item Importance and
Importance level of The AI Automation level in High-Tech Companies
No. Statements M. S.D. t Sig. Rank Impl.
1
The company uses AI to
perform processes without
human intervention.
3.49 1.03 5.636 0.000 3 Medium
2 The company uses AI to reduce
administrative workload. 3.28 0.90 3.585 0.000 5 Medium
3 The company uses AI to replace
manual tasks. 3.55 1.06 6.099 0.000 2 Medium
4 The company uses AI to
substitute repetitive tasks. 3.41 0.96 4.946 0.000 4 Medium
5 The company uses AI to avoid
errors automatically. 3.56 1.05 6.222 0.000 1 Medium
Total 3.46 0.66 8.169 0.000 Medium
(T-tabulated value = 1.960)

45
Table (4-2) shows that the means of automation statements ranged
from (3.56-3.28), with a standard deviation between (0.90-1.06). This
indicates that respondents agree on the medium implementation of
automation statements. This is supported by a high t-value compared to T-
tabulated value for items from 1 to 5. The average mean is (3.46) with a
standard deviation of (0.66), indicating that the respondents are medium
aware and concerned about automation, where the t-value is 8.169>T-
tabulated = 1.960.
(AI Efficiency Level)
The researcher used arithmetic mean, standard deviation, item
importance, and importance level to show the AI efficiency level in High-
Tech Companies, as shown in Table (4-3).
Table (4-3): Arithmetic Mean, Std. Deviation, t value, Item Importance and
Importance level of The AI Efficiency level in High-Tech Companies
No. Statements M. S.D. t Sig. Rank Impl.
1
The company uses AI to
convert resources
efficiently (fewer inputs).
3.40 1.10 4.240 0.000 3 Medium
2
The company uses AI to
transform inputs into
outputs with high quality.
3.54 1.03 6.179 0.000 1 Medium
3 The company uses AI in a
cost-effective manner. 3.43 1.12 4.560 0.000 2 Medium
4 The company uses AI to
improve productivity. 3.38 1.16 3.815 0.000 5 Medium
5 The company uses AI to
speed working processes. 3.39 1.06 4.323 0.000 4 Medium
Total 3.43 0.78 6.490 0.000 Medium
(T-tabulated value = 1.960)
Table (4-3) shows that the means of efficiency statements ranged from
(3.38-3.54), with a standard deviation between (1.03-1.16). This indicates
that respondents agree on the medium implementation of efficiency
statements. This is supported by a high t-value compared to T-tabulated

46
value for items from 1 to 5. The average mean is (3.43) with a standard
deviation of (0.78), indicates that the respondents are medium aware and
concerned about efficiency, where the t-value is 6.490>T-tabulated = 1.960.
(AI Ease of use Level)
The researcher used arithmetic mean, standard deviation, item
importance, and importance level to show the AI ease of use level in High-
Tech companies, as shown in Table (4-4).
Table (4-4): Arithmetic Mean, Std. Deviation, t value, Item Importance and
Importance level of The AI Ease of Use level in High-Tech Companies
No. Statements M. S.D. t Sig. Rank Impl.
1 The employee understands
AI functions easily. 3.53 1.08 5.743 0.000 3 Medium
2 The employee uses AI
systems without much effort. 3.35 0.88 4.661 0.000 4 Medium
3
The employee uses AI to
complete tasks with minimal
supervision.
3.57 1.04 6.475 0.000 2 Medium
4 The employee uses AI to
perform tasks easily. 3.33 1.00 3.921 0.000 5 Medium
5 The employee uses AI to
simplify complex tasks. 3.59 1.02 6.738 0.000 1 Medium
Total 3.47 0.72 7.718 0.000 Medium
(T-tabulated value = 1.960)
Table (4-4) shows that the means of ease of use statements ranged from
(3.33-3.59), with a standard deviation between (0.88-1.08). This indicates
that respondents agree on the medium implementation of ease of use
statements. This is supported by a high t-value compared to T-tabulated
value for items from 1 to 5. The average mean is (3.47) with a standard
deviation of (0.72), indicates that the respondents are medium aware and
concerned about the ease of use, where the t-value is 7.718>T-tabulated =
1.960.

47
4.2.2 Level of the Employment in High-Tech Companies:
The researcher used arithmetic mean, standard deviation, item
importance and importance level to show the level of employment in High-
Tech companies in the Jordanian market, as shown in Table (4-5).
Table (4-5): Arithmetic Mean, Std. Deviation, t value, Item Importance and
Importance level of The Employment in High-Tech Companies
No. Dimensions M. S.D. t Sig. Rank Impl. 1 Recruitment 3.40 0.70 6.778 0.000 2 Medium
2 Selection 3.43 0.73 6.921 0.000 1 Medium
3 Appointment 3.40 0.66 7.147 0.000 2 Medium
Total 3.41 0.58 8.406 0.000 Medium
(T-tabulated value = 1.960)
As shown in Table (4-5) that the means values of (employment in
High-Tech companies), ranged from (3.40-3.43), where the total mean was
of (3.41), which is of a medium implementation level.
This indicates that respondents agree on the medium implementation
of employment dimensions that is supported by high t-value compared to T-
tabulated. The average mean is (3.41) with a standard deviation of (0.58),
which indicates that the respondents are medium aware and concerned about
employment, where the t-value is 8.406>T-tabulated = 1.960.
(Recruitment Level)
Table (4-6): Arithmetic Mean, Std. Deviation, t value, Item Importance and
Importance level of The Recruitment level in High-Tech Companies
No. Statements M. S.D. t Sig. Rank Impl.
1 The company uses AI to
attract potential candidates. 3.63 1.05 7.028 0.000 1 Medium
2
The company uses AI to
improve the recruiter’s
response time.
3.38 1.05 4.225 0.000 3 Medium
3 The company uses AI to
discover new talents quickly. 3.35 1.06 3.863 0.000 4 Medium
4 The company uses AI to filter
resumes. 3.41 1.08 4.421 0.000 2 Medium
5 The company uses AI to
predict employee success. 3.25 1.03 2.885 0.005 5 Medium
Total 3.40 0.70 6.778 0.000 Medium
(T-tabulated value = 1.960)

48
The researcher used arithmetic mean, standard deviation, item
importance and importance level to show the recruitment level in High-Tech
companies, as shown in Table (4-6).
Table (4-6) shows that the means of recruitment statements ranged
from (3.25-3.63), with a standard deviation between (1.03-1.08). This
indicates that respondents agree on the medium implementation of
recruitment statements. This is supported by a high t-value compared to T-
tabulated value for items from 1 to 5. The average mean is (3.40) with a
standard deviation of (0.70), indicates that the respondents are medium
aware and concerned about recruitment, where the t-value is 6.778>T-
tabulated = 1.960.
(Selection Level)
The researcher used arithmetic mean, standard deviation, item
importance and importance level to show the selection level in High-Tech
companies, as shown in Table (4-7).
Table (4-7): Arithmetic Mean, Std. Deviation, t value, Item Importance and
Importance level of The Selection level in High-Tech Companies
No. Statements M. S.D. t Sig. Rank Impl.
1
The company uses AI to
evaluate candidates for open
vacancies.
3.49 0.99 5.757 0.000 2 Medium
2 The company uses AI to test
employees for a specific job. 3.36 0.97 4.371 0.000 4 Medium
3 The company uses AI to
reduce human bias. 3.54 0.99 6.362 0.000 1 Medium
4
The company uses AI to
match the right individual
with the right job.
3.33 0.98 4.010 0.000 5 Medium
5 The company uses AI to
schedule interviews. 3.44 1.02 5.100 0.000 3 Medium
Total 3.43 0.73 6.921 0.000 Medium
(T-tabulated value = 1.960)
Table (4-7) shows that the means of selection statements ranged from
(3.33-3.54), with a standard deviation between (0.97-1.02). This indicates

49
that respondents agree on the medium implementation of selection
statements. This is supported by a high t-value compared to T-tabulated
value for items from 1 to 5. The average mean is (3.43) with a standard
deviation of (0.73), indicates that the respondents are medium aware and
concern about selection, where the t-value is 6.921>T-tabulated = 1.960.
(Appointment)
The researcher used arithmetic mean, standard deviation, item
importance and importance level to show the appointment level in High-
Tech companies, as shown in Table (4-8).
Table (4-8): Arithmetic Mean, Std. Deviation, t value, Item Importance and
Importance level of The Appointment level in High-Tech Companies
No. Statements M. S.D. t Sig. Rank Impl.
1
The company uses AI to
approve applicants for
suitable jobs.
3.44 0.98 5.289 0.000 3 Medium
2
The company uses AI to
improve candidate
engagement.
3.50 1.03 5.719 0.000 1 Medium
3
The company uses AI to
choose candidates based on
interpersonal skills.
3.25 0.97 3.081 0.002 5 Medium
4 The company uses AI to
reduce hiring time. 3.35 0.96 4.272 0.000 4 Medium
5 The company uses AI to make
ethical employment decisions. 3.47 1.08 5.114 0.000 2 Medium
Total 3.41 0.58 8.406 0.000 Medium
(T-tabulated value = 1.960)
Table (4-8) shows that the means of appointment statements ranged
from (3.25-3.50), with a standard deviation between (0.96-1.08). This
indicates that respondents agree on the medium implementation of
appointment statements. This is supported by a high t-value compared to T-
tabulated value for items from 1 to 5. The average mean is (3.41) with a
standard deviation of (0.58), indicates that the respondents are medium

50
aware and concerned about the appointment, where the t-value is 8.406>T-
tabulated = 1.960.
4.2.3 Relationship between Independent and Dependent
Variables:
Bivariate Pearson Correlation Test was used to show the relationship
between variables of the study which presented independent variable
artificial intelligence (automation, efficiency, and ease of use) and
dependent variable employment (recruitment, selection, and appointment),
Table (4-9) shows that the relationship among variables was strong and
positive were (R) values ranged between (0.270-0.877) which is significant
at level of (0.01).
Table (4-9): That the Relationship between Variables
No. 1 2 3 4 5 6 7 8
1 AI Ease of Use
2 AI Efficiency .433**
3 AI Automation .270** .533**
4 Artificial intelligence .733** .854** .751**
5 Recruitment .334** .466** .526** .563**
6 Selection .282** .438** .441** .494** .387**
7 Appointment .283** .450** .431** .497** .565** .628**
8 Employment .363** .546** .564** .627** .784** .820** .877**
**significant at the level of (0.01)
Table (4-9) shows that the relationships among artificial intelligence
dimensions are medium, where r ranges from (0.270-0.533). Moreover, the
relationships among employment dimensions are medium to strong, where
r ranges between (0.387-0.628). Finally, the relationship between
independent and dependent variables is strong and positive, where r equals
(0.627).

51
4.3 The Research Hypotheses:
After approving validity, reliability and the correlation between
independent and dependent variables, the following tests should be carried
out to confirm the validity of regression analysis. (Sekaran, 2003):
Normality Test: Figure (4-1) shows that if a data set is well modeled
by a normal distribution and to compute how likely it is for a random
variable underlying the data set to be normally distributed.
Figure (4-1): Normality Test
Linearity Test: Figure (4-2) assumes that the relationship between the
independent and dependent variables is linear. When the relationship is
linear it is expected that the points above and below the line are randomly
scattered, and the statistic is small.

52
Figure (4-2): Linearity Test
Equal variance (homoscedasticity): Figure (4-3) shows that the errors
are scattered around the mean, therefore there is no relation between errors
and predicted values.
Figure (4-3): Equal variance

53
Multi-Collinearity: Variance Inflation Factor (VIF) value is less than
10, and tolerance is more than 10%, where one predictor variable in a
multiple regression model can be linearly predicted from the others with a
substantial degree of accuracy.
Table (4-10): Durbin-Watson Value and Variance Inflation Factor
Dimensions Collinearity Statistics
Tolerance VIF
AI Ease of Use 0.810 1.235
AI Efficiency 0.626 1.599
AI Automation 0.714 1.400
Main Hypothesis:
H01: Artificial Intelligence Dimensions (Automation, Efficiency,
and Ease of Use) Do Not Impact Employment in High-Tech Companies
in the Jordanian Market, at (Α≤0.05).
Table (4-11) shows the multiple regression of the three dimensions of
artificial intelligence and its impact on employment in High-Tech
companies in the Jordanian market, the artificial intelligence can explain
(41.8%) of the variation of employment, where (R2=0.418, F=32.051, Sig=
0.000). Therefore, the null hypothesis is rejected and the alternative
hypothesis is accepted, which stipulated artificial intelligence dimensions
(automation, efficiency, and ease of use) do not impact employment in High-
Tech companies in the Jordanian market, at (α≤0.05).
Table (4-11): Multiple Regressions of the Artificial Intelligence Dimensions on
Employment.
Model r R2 Adjusted R2 f Sig.
1 0.646a 0.418 0.405 32.051 0.000*
a. Predictors: (Constant), AI automation, AI efficiency, and AI ease of use, b. Dependent Variable:
Employment
Multiple Regression analysis was used to ensure the impact of
artificial intelligence dimensions (automation, efficiency, and ease of use)
on employment in High-Tech companies in the Jordanian market, at
((α≤0.05).

54
Table (4-12): Multiple Regressions of the Artificial Intelligence Dimensions on
Employment.
Model
Unstandardized
Coefficients
Standardized
Coefficients t Sig.
B Std. Error β
Constant 1.164 0.245
Automation 0.329 0.069 0.374 4.798 0.000*
Efficiency 0.213 0.062 0.287 3.447 0.001*
Ease of use 0.110 0.059 0.137 1.871 0.063
** Significant at the level of (0.05), T-tabulated=1.960
It is clear from Table (4-12) that the variables (automation and
efficiency) have an impact on employment in High-Tech companies in the
Jordanian market, reaching calculated t-values of (4.798, 3.447),
respectively. Values significant at the level of significance (α ≥0.05), have
not shown any impact of (ease of use) on employment. This amounted to (t)
(1.871) and it is not significant at the level of significance (α ≥0.05).
In summary, the result of multiple regressions analysis shows that
artificial intelligence dimensions together impact employment, where
(R2=0.418, F=32.051, Sig. =0.000). Automation has the highest impact rated
37.4%, then efficiency rated at 28.7%, while the ease of use does not
significantly impact employment. It seems respondents believe that ease of
use does not significantly impact employment dimensions.

55
Chapter Five: Results’ Discussion, Conclusion, and
Recommendations
5.1 Results’ Discussion:
The results of this study show the implementation of artificial
intelligence dimensions in High-Tech companies in the Jordanian market.
The Ease of use has the highest implementation rate among the dimensions,
then automation, followed by efficiency, which all have a medium
implementation rate. The findings show that the implementation of
employment dimensions, selection has the highest implementation rate
among the dimensions, followed by recruitment and appointment.
Table (5-1) summarizes the impact matrix among the artificial
intelligence dimensions on employment (selection, recruitment, and
appointment) via ANOVA analysis, the results as follow:
Table (5-1): Summary of Multiple Regressions Artificial Intelligence Dimensions
on Employment (Selection, Recruitment, and Appointment) (ANOVA)
Artificial Intelligence Dimensions Employment
Automation +
Efficiency +
Ease of Use
1. The significant impact of the total artificial intelligence on the
total employment, which was supported by previous studies Frey and
Osborne, (2013), and McKinsey & Company, (2017).
2. The significant impact of the total artificial intelligence on total
employment, which was supported by the previous study (Wisskirchen, et.
al. 2017). The artificial intelligence would impact the global labor market in
the next years, and lead to mass unemployment.
3. The significant impact of artificial intelligence dimensions on
the total employment except for ease of use (although it has a medium

56
implementation rate).
4. The significant impact of artificial intelligence dimensions on
the total employment which was supported by a previous study (Fedorov, et.
al. 2019). The artificial intelligence technologies affect the company's
business strategy and the HR practices and are being perceived by many as
a real threat to human employees' jobs.
5. Automation has a significant impact on employment
dimensions, which was supported by a previous study (Autor, 2015).
6. The significant impact of AI automation which supported by a
previous study (Frontier, 2018). The industrial automation tied with
employment and would affect labor with low and medium levels of formal
education.
7. Efficiency has a significant impact on employment dimensions,
which was supported by a previous study (Ashtiani Abdi, et. al. (2019).
5.2 Conclusion:
This study is devoted to answering the study main question: do
artificial intelligence dimensions (automation, efficiency, and ease of use)
have an impact on employment in High-Tech companies in the Jordanian
market? Data collected via a questionnaire, which was tested for its validity
and reliability. Then correlation and multiple regressions were used to test
the hypotheses.
The results of this study show that the implementation of artificial
intelligence dimensions is medium in High-Tech companies in the Jordanian
market. The ease of use has rated medium implementation, followed by
automation, then efficiency. Moreover, the findings show that
implementation of employment dimensions, where selection rated medium
implementation, followed by recruitment, then appointment, respectively.
Moreover, results show that the relationship between artificial

57
intelligence dimensions is medium, the relationship among employment
dimensions is medium to strong, and the relationship between independent
and dependent variables is strong and positive.
Finally, results indicate that there is a significant impact of the total
artificial intelligence on total employment in High-Tech companies in the
Jordanian market. Moreover, automation has rated the highest impact on
employment, then efficiency, while ease of use does not show a significant
impact on total employment dimensions.
Based on the conclusion above, AI has a significant impact on
employment dimensions and could improve and add value to High-Tech
companies. Therefore, it is a potential threat to the current state of job
opportunities.
It can be said that this unemployment problem occurs under a two-
dimensional structure. The first is related to which AI extent efficiency has
a significant impact on employment processes so it may cause
misconceptions by taking decisions of candidates depending on the
responses of candidates by ignoring stress, psychological situation, pressure,
and similar factors. Another dimension of unemployment is the fact that
artificial intelligence practices, which are defined as automatic and robotic
applications, cause individuals to stay out of production activities.
Employers will be able to lay people off by choosing machines that they do
not pay for working hours.
5.3 Recommendations:
5.3.1 Recommendations for High-Tech Companies in Jordan:
The study recommends that High-Tech companies in Jordan
have to use AI to reduce administrative workload.

58
The study recommends that High-Tech companies in Jordan
have to use AI to simplify tasks.
The study recommends that High-Tech companies in Jordan
have to use AI to predict employee’s success.
The study recommends that High-Tech companies in Jordan
have to use AI to choose a candidate based on their skills.
5.3.2 Recommendations for Academics and Future Research:
This study is carried out on High-Tech companies in Jordan.
To be able to generalize the current study results, it is recommended to
conduct such a study on the same industry in other countries, especially,
Arab countries because they have a similar social and cultural lifestyle.
This study is carried out on High-Tech companies in Jordan;
therefore, it is advised to apply the same variables on other manufacturing
industries.
This study is carried out within a limited period; therefore, it is
advised to repeat this study after a suitable time to check sector development.
Extending the analyses to other industries and countries represent
future research opportunities, which can be done by further testing with
larger samples within the same industry, and including other industries will
help mitigate the issue of generalizing conclusions on others.

59
References:
Albus, J. (1983) From Washington: the robot revolution: an interview with
James Albus. Communications of the ACM, 26 (3), 179-180.
Altemeyer, B. (2019). Making the business case for AI in HR: two case
studies. Strategic HR Review, 18 (2), 66-70.
Arntz, M., Gregory, T., & Zierahn, U. (2016). The risk of automation for
jobs in OECD countries: a comparative analysis, Paris: OECD
Publishing.
Ashtiani Abdi, A., Nour mohammadian, F., Mohammadi, Y., & Saeb, M. R.
(2019). Control over power conversion efficiency of bhj solar cells:
learn more from less, with artificial intelligence. Progress in Color,
Colorants and Coatings, 12 (1), 1-14.
Autor D.H. & Salomons, A. (2017). Does productivity growth threaten
employment? Frankfort: ECB.
Autor D.H. (2015) Why are there still so many jobs? The history and future
of workplace automation, Journal of Economic Perspectives, 29 (3),
1-3, 3-30.
Autor, D.H., Levy, F., & Murnane, R.J. (2003) the skill content of recent
technological change: an empirical exploration. The Quarterly
Journal of Economics, 118 (4), 1279–1333.
Barboza, C. (2019). Artificial Intelligence and Hr: The new wave of
Technology. Journal of Advances in Social Science and
Humanities, 5 (4), 715-720.
Bauer, T. N. (2010). Onboarding new employees: Maximizing
success. SHRM Foundation’s Effective Practice Guideline
Series, 7.

60
Bowles, J. (2014). The computerization of European jobs. Brussels: Bruegel.
Brando, C., Silva, R., & dos Santos, J. V. (2019). Online recruitment in
Portugal: Theories and candidate profiles. Journal of Business
Research, 94, 273-279.
Cappelli, P., Tambe, P., & Yakubovich, V. (2019). Artificial intelligence in
human resources management: challenges and a path
forward. Available at SSRN 32, 63878.
CIPD Chartered Institute of Personnel and Development, (2015).
Productivity: Getting the best out of people. London: CIPD.
Dakin, Stephen, Armstrong, J.S. (1989). Predicting job performance: a
comparison of expert opinion and research findings. International
Journal of Forecasting, 5 (2): 187–94.
Davenport, T. H., & Kirby, J. (2015). Beyond automation. Harvard
Business Review, 93 (6), 58-65.
DeCenzo, D. A., & Robbins, S. P. (2010). Personnel/human resources
management. New Delhi: Prentice Hall of India Private Ltd.
Deloitte, (2016). The state of the state 2016–17: Brexit and the business of
government. London: Deloitte.
Devi, R., & Banu, V. (2014) Introduction to recruitment. SSRG
International Journal of Economics and Management Studies,
1(2).
Dijkkamp, J. (2019). The recruiter of the future, a qualitative study in AI
supported recruitment process (Master's thesis, University of
Twente).

61
Ernst, E. Merola, R. & Samaan, D. (2018) the economics of artificial
intelligence: Implications for the future of work. International Labor
Organization, 10 (13), 140.
Fedorov, A., Koropets, O., & Gatti, M. (2019, May). Digitalization of
human resource management practices and its impact on employees’
well-being. International Scientific Conference “Contemporary
Issues in Business, Management and Economics Engineering".
Ford, M. (2013). Could artificial intelligence create an unemployment
crisis? Communications of the ACM, 56 (7), 37-39.
Frey, C.B. & Osborne, M.A. (2013). The future of employment: how
susceptible are jobs to computerization? Elsevier, 114 (C), 254-280.
Frontier economics, (2018). The Impact of Artificial Intelligence on Work:
An evidence synthesis on implications for individuals, communities,
and societies. London, Frontier Economics network.
Garg, V., Srivastav, S., & Gupta, A. (2018, October). Application of
Artificial Intelligence for Sustaining Green Human Resource
Management. International Conference on Automation and
Computational Engineering (ICACE) (pp. 113-116). IEEE.
Ghazzawi, K., Al-Khoury, P., & Saman, J. (2014). The effect of
implementing technology in HRM on the level of employee
motivation.
Goldberg, J., & Wilkinson, G. (2019). 2019: the year that was in labor law:
employment law. Without Prejudice, 19 (10), 48-49.
Grace, K., Salvatier, J., Dafoe, A., Zhang, B., & Evans, O. (2018) When will
AI exceed human performance? Evidence from AI experts. Journal
of Artificial Intelligence Research, 3, 1-26.

62
Groover, M.P. (2014). Fundamentals of modern manufacturing:
materials, processes, and systems. New Jersey: John Wiley & Sons.
Gursoy, D., Chi, O. H., Lu, L., & Nunkoo, R. (2019). Consumers acceptance
of artificially intelligent (AI) device use in service delivery.
International Journal of Information Management, 49, 157-169.
Gusdorf, M. L. (2008). Recruitment and selection: Hiring the right
person. USA: Society for Human Resource Management.
H´emous, D. & Olsen, M. (2016). <<The rise of the machines: automation,
horizontal innovation and income inequality>>, Brown University.
(On-Line), available:
https://www.brown.edu/academics/economics/sites/brown.edu.acade
mics.economics/files/uploads/rise_machines_paper_feb16.pdf?fbcli
d=IwAR0BP6RCYwztlADiqA4n894m0ExiwTORz_tBXRF1e9XNb
vSrNjkQbs0tLrc.
Hair, J. F, Black, W. C, Babin, B. J, Anderson, R. E., & Tatham, R. L,
(2010), Multivariate Data Analysis, 7th edition., New York.
He, E. (2018). Can artificial intelligence make work more human? Strategic
HR Review, 17 (5), 263-264.
Heathfield, S.M. (2018). <<What Is Employment? Take a Closer Look at
What It Means to Be Employed>>, The Balance Career. (On-Line),
available: https://www.thebalancecareers.com/what-is-employment-
1918114.
Hmoud, B., & Laszlo, V. (2019). Will Artificial Intelligence Take Over
Human resources Recruitment and Selection? Network Intelligence
Studies, 7 (13), 21-30.
Holm, A. B., & Haahr, L. (2019). 11 e-Recruitment and selection. e-HRM:
Digital Approaches, Directions & Applications.

63
IBA Global Employment Institute, (2017). Artificial intelligence and
robotics and their impact on the workplace. London: International
Bar Association Global Employment Institute (IBA GEI).
Jackson, P. C. (2019). Introduction to artificial intelligence. Courier Dover
Publications.
Jantan, H., Hamdan, A. R., & Othman, Z. A. (2010). Intelligent techniques
for decision support system in human resource
management. Decision Support Systems, 261-276.
Jen, Y.W., & Hung, C.M. (2010). An Empirical Study of Adopting Mobile
Healthcare Service: The Family’s Perspective on the Healthcare
Needs of Their Elderly Members. TELEMEDICINE and e-
HEALTH JOURNAL, 16 (1), 41-48.
Jung, W., and Yim, H. (2016). Effects of Mental Model and Intrinsic
Motivation on Behavioral Intention of Smartphone Application
Users. ETRI Journal, 38 (3), 589-598.
Kaba, A. (2017). Library employment: Satisfaction, opportunities,
challenges, and future actions as perceived by academic librarians.
Library Management, 38 (8/9), 511-527.
Kiruthika, J., & Khaddaj, S. (2017, October). Impact and Challenges of
Using of Virtual Reality & Artificial Intelligence in Businesses.
International Symposium on Distributed Computing and
Applications to Business, Engineering and Science (DCABES) (pp.
165-168). IEEE.
Koufteros, X. A., Vonderembse, M. A., & Doll, W. J. (1997, November).
Competitive capabilities: measurement and relationships. In
Proceedings Decision Science Institute, 3: 1067-1068.
64
Lee, M.T., & Park, C. (2008). Mobile technology usage and B2B market
performance under mandatory adaption. Industrial marketing
management, 37 (7), 833-840.
Lim, S. Xue, L. Yen, C.C. Chang, L., Chan, C.H., Tai, C.B., Duh, B.H. &
Choolani, M. (2011). A study on Singaporean women’s acceptance of
using mobile phones to seek health information. International
Journal of Medical Informatics, 80 (20), 189-202.
Luder, H. R., Kunze, N., Heaton, P. C., & Frede, S. M. (2018). An
appointment-based model to systematically assess and administer
vaccinations. Journal of the American Pharmacists Association, 58
(3), 290-295.
Mano-Negrin, R. & Tzafrir, S. (2004) Job search modes and turnover.
Career Development International, 9 (5), 442 – 458.
Manyika, J. (2017, December). What is the future of work? McKinsey
Global Institute, Retrieved from
https://www.mckinsey.com/featured-insights/future-of-
organizations-and-work/what-is-the-future-of-work
Masum, A. K. M., Beh, L. S., Azad, M. A. K., & Hoque, K. (2018).
Intelligent human resource information system (i-HRIS): a holistic
decision support framework for HR excellence. Int. Arab J. Inf.
Technol., 15 (1), 121-130.
Matolo, R. S., Iravo, M., & Waititu, G. A. (2019). Study on Relationship
between Recruitment and Selection and Employee Performance in
Technical Training Institutes in Kenya. International Journal of
Scientific Research and Management, 7 (03).

65
McKinsey & Company, (2017). Jobs lost, jobs gained workforce transitions
in a time of automation. San Francisco, California: McKinsey Global
Institute.
Mehrabad, M. S., & Brojeny, M. F. (2007). The development of an expert
system for effective selection and appointment of the jobs applicants
in human resource management. Computers & Industrial
Engineering, 53 (2), 306-312.
Muchinsky, P. M., & O’Leary, B. J. (2011). Psychology and Work:
Understanding People in the Workplace. Applied Psychology in
Everyday Life, 109.
Nespor, J. (2014). Knowledge in motion: Space, time and curriculum in
undergraduate physics and management. Routledge.
Noe, R. A. (2006). Human resource management: Gaining a competitive
advantage with OLC card. McGraw-Hill.
Nuefeind, M., O’Reilly, J., & Ranft, F. (2018). Work in digital age:
challenges of the fourth industrial revolution. London: Policy
Network.
Nunn, J. (2019). The Emerging Impact of AI on HR. Accessed from
https://www.forbes.com/sites/forbestechcouncil/2019/02/06/the-
emerging-impact-of-ai-on-hr/#6d23a2ca5496 accessed on 20.03.19
Oksanen, R. (2018). New technology-based recruitment methods (Master's
thesis).
Olsson, N.O., & Zidane, Y.J. (2017) Defining project efficiency,
effectiveness and efficacy. International Journal of Managing
Projects in Business, 4 (2), 308–328.

66
Palmer, S., & Torgerson, D. J. (2018). Definitions of efficiency. Bmj, 318
(7191), 1136.
Parveen, N. A., & Palaniammal, V. S. (2019). A STUDY ON ARTIFICIAL
INTELLIGENCE IN HUMAN RESOURCE MANAGEMET
TODAY AND TOMORROW. International Journal of Research
and Analytical Reviews (IJRAR), 6 (1), 513-516.
Perez. J.A., Deligianni, F., Ravi, D., & Yang, G. (2018). Artificial
intelligence and robotics, London: UK-RAS Network.
Prasanna Matsa, Kusuma Gullamajji (2019) To Study Impact of Artificial
Intelligence on Human Resource Management. International
Research Journal of Engineering and Technology (IRJET),
Volume: 06 Issue: 08.
Public Service Ministry of Guyana, (2004). Public service rules.
Georgetown: INFORMATION Systems Division.
Rifkin, J. (1995). The end of work: the decline of the global labor force
and the dawn of the post-market era, New York: G. P. Putnam's
Sons.
Rotman, D. (2013). <<How technology is destroying jobs>>, MIT
Technology Review. (On-Line), available:
https://www.technologyreview.com/s/515926/how-technology-is-
destroying-jobs/.
Ruël, H., Bondarouk, T., & Looise, J. K. (2004). E-HRM: Innovation or
irritation. An explorative empirical study in five large companies on
web-based HRM. Management revue, 364-380.
Russell, S. J., & Norvig, P. (2016). Artificial intelligence: a modern
approach. Malaysia; Pearson Education Limited.

67
Samset, K. (1998). Project management in a high-uncertainty situation:
understanding risk and project management in international
development projects, (Unpublished doctoral dissertation),
Norwegian University of Science and Technology, Trondheim.
Sattar, A. A., Elhakeem, M., Rezaie-Balf, M., Gharabaghi, B., & Bonakdari,
H. (2019). Artificial intelligence models for prediction of the aeration
efficiency of the stepped weir. Flow Measurement and
Instrumentation, 65, 78-89.
Sekaran, U. (2003). Research methods for business: A skill building
approach, student edition. John Wiley & Sons, Singapore.
Singh, S., Remya, T., Shijo, T. M., Nair, D., & Nair, P. (2014). Lean six
sigma application in reducing nonproductive time in operation
theaters. The Journal of National Accreditation Board for Hospitals
& Healthcare Providers, 1 (1), 1.
Skilton, M., & Hovsepian, F. (2017). The 4th Industrial Revolution:
Responding to the Impact of Artificial Intelligence on Business.
Springer.
Strohmeier, S., & Piazza, F. (2015). Artificial intelligence techniques in
human resource management—a conceptual exploration. Intelligent
Techniques in Engineering Management (pp. 149-172). Springer,
Cham.
Sufian, F., Kamarudin F., & Noor M. H.N. (2013) Assessing the revenue
efficiency of domestic and foreign Islamic banks: empirical evidence
from Malaysia, Journal Pengurusan, 37 (1), 77 – 90.
Susskind, R., & Susskind, D. (2015). The Future of the Professions: How
Technology will transform the Work of Human Experts. Oxford:
Oxford University Press.

68
Tandon, L., Joshi, P., & Rastogi, R. (2017) Understanding the Scope of
Artificial Intelligence in Human Resource Management Processes - A
Theoretical Perspective International Journal of Business and
Administration.
Tzafestas, S.G. (2009). Human and nature minding automation: an
overview of concepts, methods, tools and applications. Athens:
Springer.
Upadhyay, A. K., & Khandelwal, K. (2018). Applying artificial intelligence:
implications for recruitment. Strategic HR Review, 17 (5), 255-258.
Villegas, S., Lloyd, R. A., Tritt, A., & Vengrouskie, E. F. (2019). Human
Resources as Ethical Gatekeepers: Hiring Ethics and Employee
Selection. Journal of Leadership, Accountability and Ethics, 16 (2).
Wang, T., & Lin, J. (2018). Research on the Influence of Artificial
Intelligence on Human Resource Management Teaching and
Work. DES tech Transactions on Social Science, Education and
Human Science, (ichae).
Wang, W., & Siau, K. (2019). Artificial Intelligence, Machine Learning,
Automation, Robotics, Future of Work and Future of Humanity: A
Review and Research Agenda. Journal of Database Management
(JDM), 30 (1), 61-79.
Weizenbaum, J. (1972). The impact of the computer on society. Norwood,
NJ, USA: Ablex Publishing.
Westfall, R. D. (2019). An employment-oriented definition of the
information systems field: An educator's view. Journal of
Information Systems Education, 23 (1), 6.

69
Yadav, P. and Sachin, M. (2015) the concept of productivity. International
Journal of Engineering and Technical Research (IJETR) ISSN, 3
(5), 1-2.
Zhang, D. Z. (2011) towards theory building in agile manufacturing
strategies Case studies of an agility taxonomy. International Journal
of Production Economics, 131 (1), 303-312.

70
Appendices Appendix (1): Panel of Referees Committee:
No. Name Qualification Organization
1 Prof. Hussein Al-Yaseen Full Professor Amman Al-Ahliyya University
2 Prof. Samer Barakat Full Professor Applied Science Private University
3 Prof. Ahmad Ali Saleh Associate Professor Middle East University
4 Prof. Nidal Al-Salhi Associate Professor Petra University
5 Prof. Saleh Abu-Soud Associate Professor Princess Sumaya university
6 Dr. Mohammed Al-Shahatit Assistant Professor Princess Sumaya university
7 Dr. Ibrahim Yousef Assistant Professor Petra University
8 Dr. Fayez Al-Badri Assistant Professor Middle East University
9 Dr. Tamer Qubartai Assistant Professor Petra University
10 Dr. Sameer Al-Jabali Associate Professor Middle East University
11 Dr. Abdullah Al-Bataineh Associate Professor Middle East University
12 Dr. Abdullah Aref Assistant Professor Princess Sumaya university
13 Dr. Fadi Masalha Assistant Professor Applied Science Private University

71
Appendix (2): Questionnaire of Respondents:
Dear Participant:
The purpose of this master thesis is to study “The Impact of Artificial
Intelligence on Employment in High-Tech Companies in the Jordanian
Market.”
This research contains 30 questions, which may take 10 minutes to
answer it; therefore, we will be thankful to you for devoting your valuable
time to answer it .
Your answers will be top confidential and will be used for research
purposes only.
Again, we appreciate your participation in this research. Please, if you
have any questions or comments, please contact me at
Thank you for your fruitful cooperation.
Researcher: Nour Khalil Abu-Khaled
Supervisor: Dr. Abdel-Aziz Ahmad Sharabati

72
Study Questionnaire
Part one: Demographic information
Company Name:
Gender: □ Male □ Female
Age (years): □ less than 25 □ 25-35 □ 35-45 □ above 45
Education: □ High School □ Diploma □ Bachelor □ Master
Position: □ Employee □ Supervisor □ Manager
Experience: □ Less than 5 □ 5-10 □ 11-15 □ Above 15
Part two: The following 30 questions tap into your perception about the actual
implementation of Artificial Intelligence variable and Employment dimensions. Please
answer the following questions based on your knowledge and experience about the
statement taking into consideration that:
[1 = strongly not implemented, 2 = not implemented, 3 = neutral, 4 =
implemented, 5 = strongly implemented].
Artificial Intelligence (AI): is the computer system and applications that are able
to perform normal tasks requiring human intelligence. Companies use AI to automate
their employment processes.
AI Automation
1 The company uses AI to perform processes without human
intervention.
1 2 3 4 5
2 The company uses AI to reduce administrative workload. 1 2 3 4 5
3 The company uses AI to replace manual tasks. 1 2 3 4 5
4 The company uses AI to substitute repetitive tasks. 1 2 3 4 5
5 The company uses AI to avoid errors automatically. 1 2 3 4 5
AI Efficiency
1 The company uses AI to convert resources efficiently (fewer inputs). 1 2 3 4 5
2 The company uses AI to transform inputs into outputs with high
quality.
1 2 3 4 5
3 The company uses AI in a cost-effective manner. 1 2 3 4 5
4 The company uses AI to improve productivity. 1 2 3 4 5
5 The company uses AI to speed working processes. 1 2 3 4 5
AI Ease of Use
1 The employee understands AI functions easily. 1 2 3 4 5
2 The employee uses AI systems without much effort. 1 2 3 4 5
3 The employee uses AI to complete tasks with minimal supervision. 1 2 3 4 5
4 The employee uses AI to perform tasks easily. 1 2 3 4 5
5 The employee uses AI to simplify complex tasks. 1 2 3 4 5
Employment: is the process of recruiting, selecting and appointing the right
employees who will fit well with job requirements in the organization.

73
Recruitment
1 The company uses AI to attract potential candidates. 1 2 3 4 5
2 The company uses AI to improve the recruiter’s response time. 1 2 3 4 5
3 The company uses AI to discover new talents quickly. 1 2 3 4 5
4 The company uses AI to filter resumes. (search keywords in resumes) 1 2 3 4 5
5 The company uses AI to predict employee success. 1 2 3 4 5
Selection
1 The company uses AI to evaluate candidates for open vacancies. 1 2 3 4 5
2 The company uses AI to test employees for a specific job. 1 2 3 4 5
3 The company uses AI to reduce human bias. 1 2 3 4 5
4 The company uses AI to match the right individual with the right job. 1 2 3 4 5
5 The company uses AI to schedule interviews. 1 2 3 4 5
Appointment
1 The company uses AI to approve applicants for suitable jobs. 1 2 3 4 5
2 The company uses AI to improve candidate engagement. 1 2 3 4 5
3 The company uses AI to choose candidates based on interpersonal
skills.
1 2 3 4 5
4 The company uses AI to reduce hiring time. 1 2 3 4 5
5 The company uses AI to make ethical employment decisions. 1 2 3 4 5

74
Appendix (3): Questionnaire of Respondents (Arabic version):
عزيزي المشارك:
تهدف رسالة الماجستير هذه إلى دراسة "تأثير الذكاء الاصطناعي على التوظيف في شركات
التكنولوجيا عالية التقانة في السوق الأردني".
دقائق للإجابة عليه؛ لذلك، سنكون 10سؤالًا، والذي قد يستغرق 30على يحتوي هذا الاستبيان
ممتنين على تخصيص وقتك الثمين للرد عليه.
علماً أن إجاباتك ستكون سرية للغاية وسيتم استخدامها لأغراض البحث فقط.
،مرة أخرى، نقدر مشاركتك في هذا البحث. من فضلك، إذا كان لديك أي أسئلة أو تعليقات
([email protected]يرجى التواصل معي على )
.شكراً جزيلًا لتعاونكم
الباحثة: نور خليل أبو خالد.
المشرف الأكاديمي: الدكتور عبد العزيز الشرباتي.

75
الاستبيان
المعلومات الديموغرافية الجزء الأول:
اسم الشركة:
أنثى□ ذكر □ الجنس:
45فوق □ 45-35□ 35-25□ 25أقل من □ العمر )بالسنوات(:
ماجستير□ بكالوريوس □ دبلوم □ ثانوية □ التعليم:
مدير□ مشرف □ موظف □ الوظيفة:
فأكثر 15□ 15-11□ 10-5□ 5أقل من □ الخبرة:
توضح الأسئلة التالية العلاقة بين التطبيق الحالي للذكاء الاصطناعي عملية التوظيف. يرجى الجزء الثاني:
الإجابة على الأسئلة التالية بناءً على معرفتك وخبرتك، اخذاً بعين الاعتبار أن:
= مطبق بقوة[. 5= مطبق ، 4= محايد ، 3= غير مطبق ، 2ق بقوة ، ب= غير مط 1]
(: هو أنظمة الكمبيوتر والتطبيقات القادرة على أداء المهام العادية التي تتطلب الذكاء AI)الذكاء الاصطناعي
البشري. تستخدم الشركات الذكاء الاصطناعى لأتمتة عملية التوظيف الخاصة بهم.
(AI Automation)أتمتة الذكاء الاصطناعي
5 4 3 2 1 تدخل بشري. ( لإجراء العمليات دونAIتستخدم الشركة الذكاء الاصطناعي ) 1
5 4 3 2 1 ( لتخفيف عبء العمل الإداري.AIتستخدم الشركة الذكاء الاصطناعي ) 2
5 4 3 2 1 ( لاستبدال المهام اليدوية.AIتستخدم الشركة الذكاء الاصطناعي ) 3
5 4 3 2 1 ( لاستبدال المهام المتكررة.AIتستخدم الشركة الذكاء الاصطناعي ) 4
5 4 3 2 1 ( لتجنب الأخطاء تلقائياً.AIالشركة الذكاء الاصطناعي )تستخدم 5
(AI Efficiency) كفاءة الذكاء الاصطناعي
5 4 3 2 1 ( لتحويل الموارد بكفاءة )عدد أقل من المدخلات(.AIتستخدم الشركة الذكاء الاصطناعي ) 1
5 4 3 2 1 مخرجات بجودة عالية.( لتحويل المدخلات إلى AIتستخدم الشركة الذكاء الاصطناعي ) 2
5 4 3 2 1 ( بطريقة فعالة من حيث التكلفة.AIتستخدم الشركة الذكاء الاصطناعي ) 3
5 4 3 2 1 ( لتحسين الإنتاجية.AIتستخدم الشركة الذكاء الاصطناعي ) 4
5 4 3 2 1 ( لتسريع عمليات العمل.AIتستخدم الشركة الذكاء الاصطناعي ) 5
(AI Ease of Use) الذكاء الاصطناعي الاستخدامسهولة
5 4 3 2 1 ( بسهولة.AIيفهم الموظف مهام الذكاء الاصطناعي ) 1
5 4 3 2 1 ( دون بذل الكثير من الجهد.AIيستخدم الموظف أنظمة الذكاء الاصطناعي ) 2
5 4 3 2 1 ( لإكمال المهام بأدنى حد من الإشراف.AIيستخدم الموظف الذكاء الاصطناعي ) 3
5 4 3 2 1 ( لأداء المهام بسهولة.AIيستخدم الموظف الذكاء الاصطناعي ) 4
5 4 3 2 1 ( لتبسيط المهام المعقدة.AIيستخدم الموظف الذكاء الاصطناعي ) 5
هي عملية استقطاب واختيار وتعيين الموظفين المناسبين الذين يتناسبون بشكل جيد مع متطلبات التوظيف:
الوظيفة في الشركة.
(Recruitment) الاستقطاب
5 4 3 2 1 ( لجذب المرشحين المحتملين.AIتستخدم الشركة الذكاء الاصطناعي ) 1
5 4 3 2 1 استجابة المستقطب.( لتحسين وقت AIتستخدم الشركة الذكاء الاصطناعي ) 2
5 4 3 2 1 ( لاكتشاف المواهب الجديدة بسرعة.AIتستخدم الشركة الذكاء الاصطناعي ) 3
( لتصفية السير الذاتية. )البحث عن الكلمات الرئيسية AIتستخدم الشركة الذكاء الاصطناعي ) 4
في السير الذاتية(
1 2 3 4 5
5 4 3 2 1 ( للتنبؤ بنجاح الموظف.AIالاصطناعي )تستخدم الشركة الذكاء 5
76
(Selection) الاختيار
5 4 3 2 1 ( لتقييم المرشحين للوظائف الشاغرة.AIتستخدم الشركة الذكاء الاصطناعي ) 1
5 4 3 2 1 ( لاختبار الموظفين لوظيفة محددة.AIتستخدم الشركة الذكاء الاصطناعي ) 2
5 4 3 2 1 ( للحد من التحيز البشري.AIالاصطناعي )تستخدم الشركة الذكاء 3
5 4 3 2 1 ( لوضع الشخص المناسب في الوظيفة المناسبة.AIتستخدم الشركة الذكاء الاصطناعي ) 4
5 4 3 2 1 ( لجدولة المقابلات.AIتستخدم الشركة الذكاء الاصطناعي ) 5
(Appointment) التعيين
5 4 3 2 1 ( للموافقة على المتقدمين للوظائف المناسبة.AIالاصطناعي )تستخدم الشركة الذكاء 1
5 4 3 2 1 ( لتحسين مشاركة المرشح للوظيفة.AIتستخدم الشركة الذكاء الاصطناعي ) 2
( لاختيار المرشحين بناءً على مهارات التعامل مع AIتستخدم الشركة الذكاء الاصطناعي ) 3
الآخرين.
1 2 3 4 5
5 4 3 2 1 لتقليل وقت التوظيف. (AIتستخدم الشركة الذكاء الاصطناعي ) 4
5 4 3 2 1 ( لاتخاذ قرارات التوظيف الأخلاقية.AIتستخدم الشركة الذكاء الاصطناعي ) 5

77
Data Analysis: Frequencies Frequency Table
Gender
Frequency Percent Valid Percent Cumulative
Percent
Valid
Male 94 68.1 68.1 68.1
Female 44 31.9 31.9 100.0
Total 138 100.0 100.0
Age
Frequency Percent Valid Percent Cumulative
Percent
Valid
less than 25 years 11 8.0 8.0 8.0
25- less than 35 years 79 57.2 57.2 65.2
35- less than 45 years 40 29.0 29.0 94.2
more than 45 years 8 5.8 5.8 100.0
Total 138 100.0 100.0
Education
Frequency Percent Valid Percent Cumulative
Percent
Valid
diploma 2 1.4 1.4 1.4
Bachelore 108 78.3 78.3 79.7
Master 28 20.3 20.3 100.0
Total 138 100.0 100.0
Position
Frequency Percent Valid Percent Cumulative
Percent
Valid
Manager 49 35.5 35.5 35.5
Supervisor 23 16.7 16.7 52.2
employee 66 47.8 47.8 100.0
Total 138 100.0 100.0

78
Experience
Frequency Percent Valid Percent Cumulative
Percent
Valid
Less than 5 years 34 24.6 24.6 24.6
5-10 years 39 28.3 28.3 52.9
11-15 years 44 31.9 31.9 84.8
above 15 years 21 15.2 15.2 100.0
Total 138 100.0 100.0
Factor Analysis /VARIABLES q1 q2 q3 q4 q5
KMO and Bartlett's Test
Kaiser-Meyer-Olkin Measure of Sampling Adequacy. .702
Bartlett's Test of Sphericity
Approx. Chi-Square 93.602
df 10
Sig. .000
Total Variance Explained
Component Initial Eigenvalues Extraction Sums of Squared Loadings
Total % of Variance Cumulative % Total % of Variance Cumulative %
1 2.154 43.088 43.088 2.154 43.088 43.088
2 .948 18.951 62.039
3 .764 15.278 77.317
4 .610 12.199 89.515
5 .524 10.485 100.000
Extraction Method: Principal Component Analysis.
Component Matrixa
Component
1
The company uses AI to perform processes without human
intervention. .577
The company uses AI to reduce administrative workload. .699
The company uses AI to replace manual tasks. .674
The company uses AI to substitute repetitive tasks. .646
The company uses AI to avoid errors automatically. .678
Extraction Method: Principal Component Analysis.
a. 1 component extracted.

79
Factor Analysis /VARIABLES a1 a2 a3 a4 a5
KMO and Bartlett's Test
Kaiser-Meyer-Olkin Measure of Sampling Adequacy. .772
Bartlett's Test of Sphericity
Approx. Chi-Square 149.762
df 10
Sig. .000
Total Variance Explained
Component Initial Eigenvalues Extraction Sums of Squared Loadings
Total % of Variance Cumulative % Total % of Variance Cumulative %
1 2.529 50.572 50.572 2.529 50.572 50.572
2 .795 15.894 66.465
3 .722 14.446 80.912
4 .515 10.307 91.219
5 .439 8.781 100.000
Extraction Method: Principal Component Analysis.
Component Matrixa
Component
1
The company uses AI to convert resources efficiently (fewer inputs). .623
The company uses AI to transform inputs into outputs with high
quality. .794
The company uses AI in a cost-effective manner. .697
The company uses AI to improve productivity. .690
The company uses AI to speed working processes. .741
Extraction Method: Principal Component Analysis.
a. 1 component extracted.
Factor Analysis /VARIABLES b1 b2 b3 b4 b5
KMO and Bartlett's Test
Kaiser-Meyer-Olkin Measure of Sampling Adequacy. .776
Bartlett's Test of Sphericity
Approx. Chi-Square 171.848
df 10
Sig. .000

80
Total Variance Explained
Component Initial Eigenvalues Extraction Sums of Squared Loadings
Total % of Variance Cumulative % Total % of Variance Cumulative %
1 2.618 52.364 52.364 2.618 52.364 52.364
2 .833 16.664 69.028
3 .675 13.505 82.533
4 .475 9.507 92.040
5 .398 7.960 100.000
Extraction Method: Principal Component Analysis.
Component Matrixa
Component
1
The employee understands AI functions easily. .744
The employee uses AI systems without much effort. .838
The employee uses AI to complete tasks with minimal supervision. .707
The employee uses AI to perform tasks easily. .682
The employee uses AI to simplify complex tasks. .631
Extraction Method: Principal Component Analysis.
a. 1 component extracted.
Factor Analysis /VARIABLES c1 c2 c3 c4 c5
KMO and Bartlett's Test
Kaiser-Meyer-Olkin Measure of Sampling Adequacy. .662
Bartlett's Test of Sphericity
Approx. Chi-Square 113.898
df 10
Sig. .000
Total Variance Explained
Component Initial Eigenvalues Extraction Sums of Squared Loadings
Total % of Variance Cumulative % Total % of Variance Cumulative %
1 2.211 44.221 44.221 2.211 44.221 44.221
2 1.037 20.745 64.965 1.037 20.745 64.965
3 .722 14.447 79.413
4 .593 11.853 91.266
5 .437 8.734 100.000
Extraction Method: Principal Component Analysis.

81
Component Matrixa
Component
1 2
The company uses AI to attract potential candidates. .693 -.335-
The company uses AI to improve the recruiter’s
response time. .698 .429
The company uses AI to discover new talents quickly. .716 -.347-
The company uses AI to filter resumes. (search
keywords in resumes) .692 -.274-
The company uses AI to predict employee success. .501 .739
Extraction Method: Principal Component Analysis.
a. 2 components extracted.
Factor Analysis /VARIABLES d1 d2 d3 d4 d5
KMO and Bartlett's Test
Kaiser-Meyer-Olkin Measure of Sampling Adequacy. .786
Bartlett's Test of Sphericity
Approx. Chi-Square 192.349
df 10
Sig. .000
Total Variance Explained
Component Initial Eigenvalues Extraction Sums of Squared Loadings
Total % of Variance Cumulative % Total % of Variance Cumulative %
1 2.751 55.015 55.015 2.751 55.015 55.015
2 .749 14.978 69.993
3 .586 11.727 81.720
4 .561 11.214 92.934
5 .353 7.066 100.000
Extraction Method: Principal Component Analysis.
Component Matrixa
Component
1
The company uses AI to evaluate candidates for open vacancies. .821
The company uses AI to test employees for a specific job. .731
The company uses AI to reduce human bias. .751
The company uses AI to match the right individual with the right job. .705
The company uses AI to schedule interviews. .694
Extraction Method: Principal Component Analysis.
a. 1 component extracted.

82
Factor Analysis /VARIABLES e1 e2 e3 e4 e5
KMO and Bartlett's Test
Kaiser-Meyer-Olkin Measure of Sampling Adequacy. .739
Bartlett's Test of Sphericity
Approx. Chi-Square 93.177
df 10
Sig. .000
Total Variance Explained
Component Initial Eigenvalues Extraction Sums of Squared Loadings
Total % of Variance Cumulative % Total % of Variance Cumulative %
1 2.183 43.667 43.667 2.183 43.667 43.667
2 .871 17.429 61.095
3 .788 15.759 76.855
4 .613 12.260 89.115
5 .544 10.885 100.000
Extraction Method: Principal Component Analysis.
Component Matrixa
Component
1
The company uses AI to approve applicants for suitable jobs. .609
The company uses AI to improve candidate engagement. .721
The company uses AI to choose candidates based on interpersonal
skills. .561
The company uses AI to reduce hiring time. .636
The company uses AI to make ethical employment decisions. .756
Extraction Method: Principal Component Analysis.
a. 1 component extracted.
Factor Analysis /VARIABLES EoU Eff Auto
KMO and Bartlett's Test
Kaiser-Meyer-Olkin Measure of Sampling Adequacy. .603
Bartlett's Test of Sphericity
Approx. Chi-Square 73.635
df 3
Sig. .000

83
Total Variance Explained
Component Initial Eigenvalues Extraction Sums of Squared Loadings
Total % of Variance Cumulative % Total % of Variance Cumulative %
1 1.833 61.108 61.108 1.833 61.108 61.108
2 .738 24.607 85.715
3 .429 14.285 100.000
Extraction Method: Principal Component Analysis.
Component Matrixa
Component
1
AI Ease of Use .699
AI Efficiency .861
AI Automation .777
Extraction Method: Principal Component Analysis.
a. 1 component extracted.
Factor Analysis /VARIABLES Rec Sel App
KMO and Bartlett's Test
Kaiser-Meyer-Olkin Measure of Sampling Adequacy. .637
Bartlett's Test of Sphericity
Approx. Chi-Square 120.052
df 3
Sig. .000
Total Variance Explained
Component Initial Eigenvalues Extraction Sums of Squared Loadings
Total % of Variance Cumulative % Total % of Variance Cumulative %
1 2.059 68.649 68.649 2.059 68.649 68.649
2 .617 20.550 89.199
3 .324 10.801 100.000
Extraction Method: Principal Component Analysis.
Component Matrixa
Component
1
Recruitment .774
Selection .813
Appointment .894
Extraction Method: Principal Component Analysis.
a. 1 component extracted.
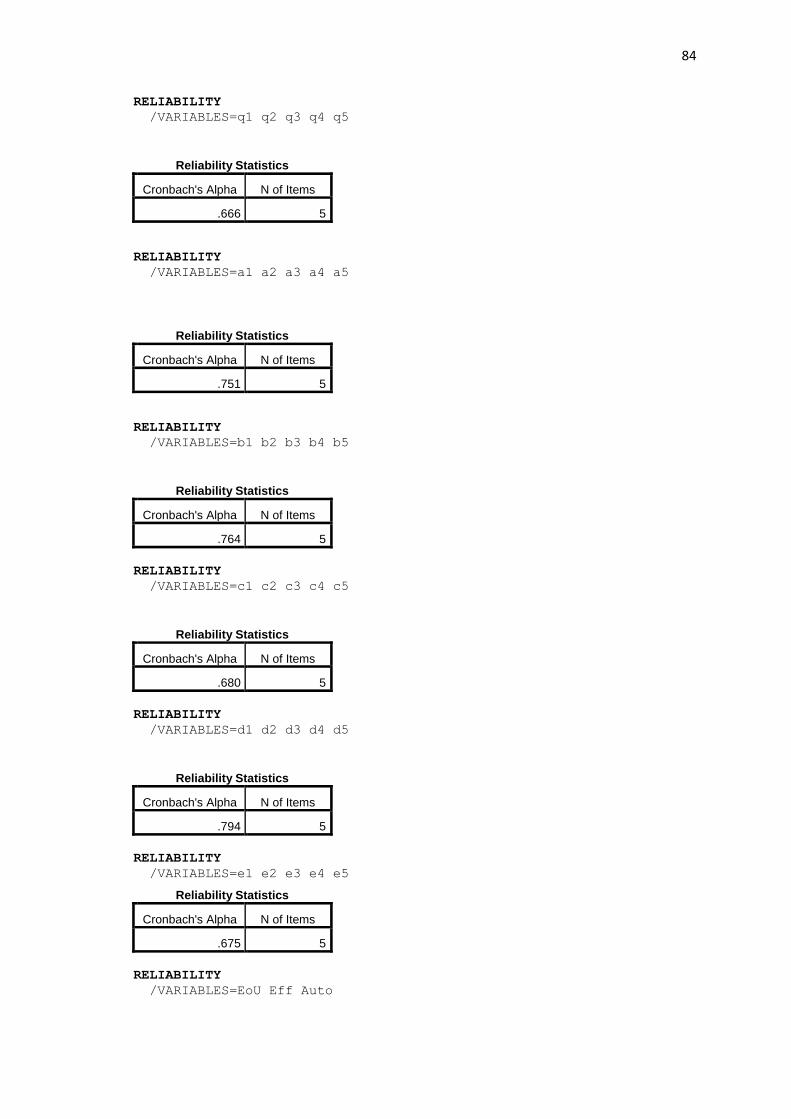
84
RELIABILITY
/VARIABLES=q1 q2 q3 q4 q5
Reliability Statistics
Cronbach's Alpha N of Items
.666 5
RELIABILITY
/VARIABLES=a1 a2 a3 a4 a5
Reliability Statistics
Cronbach's Alpha N of Items
.751 5
RELIABILITY
/VARIABLES=b1 b2 b3 b4 b5
Reliability Statistics
Cronbach's Alpha N of Items
.764 5
RELIABILITY
/VARIABLES=c1 c2 c3 c4 c5
Reliability Statistics
Cronbach's Alpha N of Items
.680 5
RELIABILITY
/VARIABLES=d1 d2 d3 d4 d5
Reliability Statistics
Cronbach's Alpha N of Items
.794 5
RELIABILITY
/VARIABLES=e1 e2 e3 e4 e5
Reliability Statistics
Cronbach's Alpha N of Items
.675 5
RELIABILITY
/VARIABLES=EoU Eff Auto

85
Reliability Statistics
Cronbach's Alpha N of Items
.679 3
RELIABILITY
/VARIABLES=Rec Sel App
Reliability Statistics
Cronbach's Alpha N of Items
.766 3
T-TEST
/TESTVAL=3
/VARIABLES=q1 q2 q3 q4 q5 a1 a2 a3 a4 a5 b1 b2 b3 b4 b5 c1 c2 c3 c4
c5 d1 d2 d3 d4 d5 e1 e2 e3 e4 e5 EoU Eff Auto AI Rec Sel App Empl
T-Test
One-Sample Statistics
N Mean Std. Deviation Std. Error Mean
The company uses AI to perform
processes without human
intervention.
138 3.4928 1.02698 .08742
The company uses AI to reduce
administrative workload. 138 3.2754 .90229 .07681
The company uses AI to replace
manual tasks. 138 3.5507 1.06073 .09030
The company uses AI to substitute
repetitive tasks. 138 3.4058 .96386 .08205
The company uses AI to avoid
errors automatically. 138 3.5580 1.05345 .08968
The company uses AI to convert
resources efficiently (fewer inputs). 138 3.3986 1.10434 .09401
The company uses AI to transform
inputs into outputs with high quality. 138 3.5435 1.03317 .08795
The company uses AI in a cost-
effective manner. 138 3.4348 1.12020 .09536
The company uses AI to improve
productivity. 138 3.3768 1.16018 .09876
The company uses AI to speed
working processes. 138 3.3913 1.06322 .09051

86
The employee understands AI
functions easily. 138 3.5290 1.08198 .09210
The employee uses AI systems
without much effort. 138 3.3478 .87672 .07463
The employee uses AI to complete
tasks with minimal supervision. 138 3.5725 1.03858 .08841
The employee uses AI to perform
tasks easily. 138 3.3333 .99878 .08502
The employee uses AI to simplify
complex tasks. 138 3.5870 1.02329 .08711
The company uses AI to attract
potential candidates. 138 3.6304 1.05385 .08971
The company uses AI to improve
the recruiter’s response time. 138 3.3768 1.04778 .08919
The company uses AI to discover
new talents quickly. 138 3.3478 1.05783 .09005
The company uses AI to filter
resumes. (search keywords in
resumes)
138 3.4058 1.07824 .09179
The company uses AI to predict
employee success. 138 3.2536 1.03276 .08791
The company uses AI to evaluate
candidates for open vacancies. 138 3.4855 .99073 .08434
The company uses AI to test
employees for a specific job. 138 3.3623 .97368 .08289
The company uses AI to reduce
human bias. 138 3.5362 .99017 .08429
The company uses AI to match the
right individual with the right job. 138 3.3333 .97661 .08313
The company uses AI to schedule
interviews. 138 3.4420 1.01821 .08668
The company uses AI to approve
applicants for suitable jobs. 138 3.4420 .98172 .08357
The company uses AI to improve
candidate engagement. 138 3.5000 1.02701 .08742
The company uses AI to choose
candidates based on interpersonal
skills.
138 3.2536 .96706 .08232
The company uses AI to reduce
hiring time. 138 3.3478 .95636 .08141
The company uses AI to make
ethical employment decisions. 138 3.4710 1.08198 .09210
AI Ease of Use 138 3.4739 .72134 .06140

87
AI Efficiency 138 3.4290 .77650 .06610
AI Automation 138 3.4565 .65646 .05588
Artificial Intelligence (AI) 138 3.4531 .56161 .04781
Recruitment 138 3.4029 .69827 .05944
Selection 138 3.4319 .73306 .06240
Appointment 138 3.4029 .66222 .05637
Employment 138 3.4126 .57657 .04908
One-Sample Test
Test Value = 3
t df Sig. (2-tailed) Mean
Difference
95% Confidence Interval of
the Difference
Lower Upper
The company uses AI to
perform processes
without human
intervention.
5.636 137 .000 .49275 .3199 .6656
The company uses AI to
reduce administrative
workload.
3.585 137 .000 .27536 .1235 .4272
The company uses AI to
replace manual tasks. 6.099 137 .000 .55072 .3722 .7293
The company uses AI to
substitute repetitive
tasks.
4.946 137 .000 .40580 .2436 .5680
The company uses AI to
avoid errors
automatically.
6.222 137 .000 .55797 .3806 .7353
The company uses AI to
convert resources
efficiently (fewer inputs).
4.240 137 .000 .39855 .2127 .5844
The company uses AI to
transform inputs into
outputs with high quality.
6.179 137 .000 .54348 .3696 .7174
The company uses AI in
a cost-effective manner. 4.560 137 .000 .43478 .2462 .6233
The company uses AI to
improve productivity. 3.815 137 .000 .37681 .1815 .5721
The company uses AI to
speed working
processes.
4.323 137 .000 .39130 .2123 .5703

88
The employee
understands AI functions
easily.
5.743 137 .000 .52899 .3469 .7111
The employee uses AI
systems without much
effort.
4.661 137 .000 .34783 .2002 .4954
The employee uses AI to
complete tasks with
minimal supervision.
6.475 137 .000 .57246 .3976 .7473
The employee uses AI to
perform tasks easily. 3.921 137 .000 .33333 .1652 .5015
The employee uses AI to
simplify complex tasks. 6.738 137 .000 .58696 .4147 .7592
The company uses AI to
attract potential
candidates.
7.028 137 .000 .63043 .4530 .8078
The company uses AI to
improve recruiter’s
response time.
4.225 137 .000 .37681 .2004 .5532
The company uses AI to
discover new talents
quickly.
3.863 137 .000 .34783 .1698 .5259
The company uses AI to
filter resumes. (search
keywords in resumes)
4.421 137 .000 .40580 .2243 .5873
The company uses AI to
predict employee
success.
2.885 137 .005 .25362 .0798 .4275
The company uses AI to
evaluate candidates for
open vacancies.
5.757 137 .000 .48551 .3187 .6523
The company uses AI to
test employees for a
specific job.
4.371 137 .000 .36232 .1984 .5262
The company uses AI to
reduce human bias. 6.362 137 .000 .53623 .3696 .7029
The company uses AI to
match the right individual
with the right job.
4.010 137 .000 .33333 .1689 .4977
The company uses AI to
schedule interviews. 5.100 137 .000 .44203 .2706 .6134

89
The company uses AI to
approve applicants for
suitable jobs.
5.289 137 .000 .44203 .2768 .6073
The company uses AI to
improve candidate
engagement.
5.719 137 .000 .50000 .3271 .6729
The company uses AI to
choose candidates
based on interpersonal
skills.
3.081 137 .002 .25362 .0908 .4164
The company uses AI to
reduce hiring time. 4.272 137 .000 .34783 .1868 .5088
The company uses AI to
make ethical
employment decisions.
5.114 137 .000 .47101 .2889 .6531
AI Ease of Use 7.718 137 .000 .47391 .3525 .5953
AI Efficiency 6.490 137 .000 .42899 .2983 .5597
AI Automation 8.169 137 .000 .45652 .3460 .5670
Artificial Intelligence (AI) 9.478 137 .000 .45314 .3586 .5477
Recruitment 6.778 137 .000 .40290 .2854 .5204
Selection 6.921 137 .000 .43188 .3085 .5553
Appointment 7.147 137 .000 .40290 .2914 .5144
Employment 8.406 137 .000 .41256 .3155 .5096
CORRELATIONS
/VARIABLES=EoU Eff Auto AI Rec Sel App Empl
Correlations
AI Ease
of Use
AI
Efficien
cy
AI
Automati
on
Artificial
Intelligen
ce (AI)
Recruit
ment
Select
ion
Appoint
ment
Employ
ment
AI Ease of Use
Pearson
Correlation 1 .433** .270** .733** .334** .282** .283** .363**
Sig. (2-
tailed)
.000 .001 .000 .000 .001 .001 .000
N 138 138 138 138 138 138 138 138
AI Efficiency
Pearson
Correlation .433** 1 .533** .854** .466** .438** .450** .546**
Sig. (2-
tailed) .000
.000 .000 .000 .000 .000 .000
N 138 138 138 138 138 138 138 138
AI Automation Pearson
Correlation .270** .533** 1 .751** .526** .441** .431** .564**
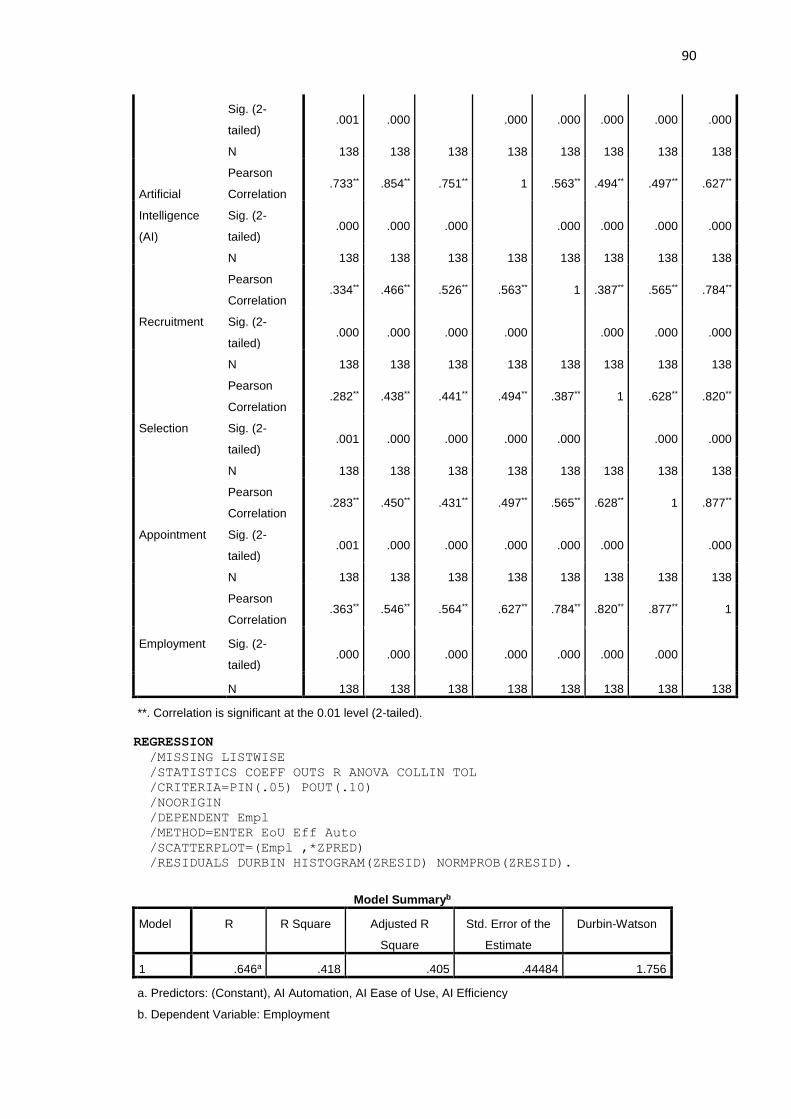
90
Sig. (2-
tailed) .001 .000
.000 .000 .000 .000 .000
N 138 138 138 138 138 138 138 138
Artificial
Intelligence
(AI)
Pearson
Correlation .733** .854** .751** 1 .563** .494** .497** .627**
Sig. (2-
tailed) .000 .000 .000
.000 .000 .000 .000
N 138 138 138 138 138 138 138 138
Recruitment
Pearson
Correlation .334** .466** .526** .563** 1 .387** .565** .784**
Sig. (2-
tailed) .000 .000 .000 .000
.000 .000 .000
N 138 138 138 138 138 138 138 138
Selection
Pearson
Correlation .282** .438** .441** .494** .387** 1 .628** .820**
Sig. (2-
tailed) .001 .000 .000 .000 .000
.000 .000
N 138 138 138 138 138 138 138 138
Appointment
Pearson
Correlation .283** .450** .431** .497** .565** .628** 1 .877**
Sig. (2-
tailed) .001 .000 .000 .000 .000 .000
.000
N 138 138 138 138 138 138 138 138
Employment
Pearson
Correlation .363** .546** .564** .627** .784** .820** .877** 1
Sig. (2-
tailed) .000 .000 .000 .000 .000 .000 .000
N 138 138 138 138 138 138 138 138
**. Correlation is significant at the 0.01 level (2-tailed).
REGRESSION
/MISSING LISTWISE
/STATISTICS COEFF OUTS R ANOVA COLLIN TOL
/CRITERIA=PIN(.05) POUT(.10)
/NOORIGIN
/DEPENDENT Empl
/METHOD=ENTER EoU Eff Auto
/SCATTERPLOT=(Empl ,*ZPRED)
/RESIDUALS DURBIN HISTOGRAM(ZRESID) NORMPROB(ZRESID).
Model Summaryb
Model R R Square Adjusted R
Square
Std. Error of the
Estimate
Durbin-Watson
1 .646a .418 .405 .44484 1.756
a. Predictors: (Constant), AI Automation, AI Ease of Use, AI Efficiency
b. Dependent Variable: Employment

91
ANOVAa
Model Sum of Squares df Mean Square F Sig.
1
Regression 19.027 3 6.342 32.051 .000b
Residual 26.516 134 .198
Total 45.543 137
a. Dependent Variable: Employment
b. Predictors: (Constant), AI Automation, AI Ease of Use, AI Efficiency
Coefficientsa
Model Unstandardized
Coefficients
Standardized
Coefficients
t Sig. Collinearity Statistics
B Std. Error Beta Tolerance VIF
1
(Constant) 1.164 .245 4.748 .000
AI Ease of
Use .110 .059 .137 1.871 .063 .810 1.235
AI Efficiency .213 .062 .287 3.447 .001 .626 1.599
AI Automation .329 .069 .374 4.798 .000 .714 1.400
a. Dependent Variable: Employment

92
Charts

93