the impact of bank and non-bank financial institutions - econstor
TRANSCRIPT

econstorMake Your Publications Visible.
A Service of
zbwLeibniz-InformationszentrumWirtschaftLeibniz Information Centrefor Economics
Cheng, Xiaoqiang; Degryse, Hans
Working Paper
The Impact of Bank and Non-Bank FinancialInstitutions on Local Economic Growth in China
LICOS Discussion Paper, No. 171
Provided in Cooperation with:LICOS Centre for Institutions and Economic Performance, KU Leuven
Suggested Citation: Cheng, Xiaoqiang; Degryse, Hans (2006) : The Impact of Bank and Non-Bank Financial Institutions on Local Economic Growth in China, LICOS Discussion Paper, No.171, Katholieke Universiteit Leuven, LICOS Centre for Transition Economics, Leuven
This Version is available at:http://hdl.handle.net/10419/74868
Standard-Nutzungsbedingungen:
Die Dokumente auf EconStor dürfen zu eigenen wissenschaftlichenZwecken und zum Privatgebrauch gespeichert und kopiert werden.
Sie dürfen die Dokumente nicht für öffentliche oder kommerzielleZwecke vervielfältigen, öffentlich ausstellen, öffentlich zugänglichmachen, vertreiben oder anderweitig nutzen.
Sofern die Verfasser die Dokumente unter Open-Content-Lizenzen(insbesondere CC-Lizenzen) zur Verfügung gestellt haben sollten,gelten abweichend von diesen Nutzungsbedingungen die in der dortgenannten Lizenz gewährten Nutzungsrechte.
Terms of use:
Documents in EconStor may be saved and copied for yourpersonal and scholarly purposes.
You are not to copy documents for public or commercialpurposes, to exhibit the documents publicly, to make thempublicly available on the internet, or to distribute or otherwiseuse the documents in public.
If the documents have been made available under an OpenContent Licence (especially Creative Commons Licences), youmay exercise further usage rights as specified in the indicatedlicence.
www.econstor.eu

LICOS Centre for Transition Economics
LICOS Discussion Papers
Discussion Paper 171/2006
“The Impact of Bank and Non-Bank Financial Institutions on Local Economic Growth in China”
Xiaoqiang Cheng Hans Degryse
Katholieke Universiteit Leuven
LICOS Centre for Transition Economics Huis De Dorlodot Deberiotstraat 34 B-3000 Leuven
BELGIUM TEL:+32-(0)16 32 65 98 FAX:+32-(0)16 32 65 99
http://www.econ.kuleuven.be/licos

The Impact of Bank and Non-Bank Financial Institutions on
Local Economic Growth in China*
by
Xiaoqiang Cheng Katholieke Universiteit Leuven
Department of Economics
Naamsestraat 69 BE-3000 Leuven
Belgium E-mail: [email protected]
and
Hans Degryse
CentER - Tilburg University, TILEC, and CESIfo
P.O. Box 90153 NL-5000 LE Tilburg
The Netherlands E-mail: [email protected]
First draft: September 30, 2005 This draft: April 10, 2006
_______________________ * The authors thank Steven Ongena, Lijan Sun, Ellen Vanassche, Patrick Van Cayseele, Vincenzo Verardi, as well as seminar participants of the LICOS-Monetary Economics workshop in Leuven, Joint KULeuven-Peking University Workshop in Beijing, the Fudan University financial economics workshop in Shanghai, and the “Debt, money and finance in integrated global markets” conference in Rome for useful comments. Financial assistance from FWO-Flanders, NWO-The Netherlands, and the Research Council of the University of Leuven is gratefully acknowledged. Hans Degryse holds the AFM-TILEC Chair on Financial Market Regulation.
1

The Impact of Bank and Non-Bank Financial Institutions on
Local Economic Growth in China
Abstract This paper shows that banking development spurs growth, even in a country with a
high growth rate such as China. Employing data of 27 Chinese provinces over the
period 1995-2003, we study whether the financial development of two different types
of institutions – banks and non-bank financial institutions – have a (significantly
different) impact on local economic growth. Our findings show that banks outperform
non-bank financial institutions. Only banking development exerts a statistically and
economically significant positive impact on local economic growth. This effect
becomes more pronounced when the financial sector is less concentrated.
Key Words: growth, financial development, Chinese provinces, banks JEL-codes: E44, G21
2

I. Introduction
Financial development plays an important role in promoting the growth of many
countries. An under-researched question, however, is whether finance continues to be
an important driver of growth in countries exhibiting high growth rates. In this paper
we address this “finance-high-growth rate” question by studying the recent economic
growth of Chinese provinces. China, being one of the most important developing
countries in the world, exhibited an average real growth rate of about 9 percent per
year during the last two decades. We do find that finance also matters for fast growing
economies.
In addressing the finance-high-growth rate nexus, we deal with the impact of different
financial institutions – bank and non-bank financial institutions. Banks typically are
state-owned, large, operate nationwide, and have many branches. Non-bank financial
institutions, in contrast, operate locally within the province and are much smaller1.
Banks are generally technologically more advanced, better developed and dominate
the financial system. Banks, however, are known for their reluctance to grant loans to
small private companies (Allen et al., 2005 and Boyreau-Debray, 2002), while most
non-bank institution loans are extended to the non-state-owned sector (Xie, 1998).
Bank and non-bank financial institutions show clear differences calling for a separate
treatment. Employing a generalized “difference-in-differences” method, we compare
the impact of the development of bank and non-bank financial institutions on Chinese
provinces’ growth rates over the period 1995-2003. Our results indicate that only bank
loans exert a statistically and economically significant positive impact on local
economic growth. The distinct performances of bank and non-bank financial
institutions can mainly be attributed to the differences in their geographical scope,
size and organization, and efficiency. However, we also find that the presence of
non-bank financial institutions stimulates competition in the local banking market.
Specifically, the positive impact of banks’ development on growth becomes more
pronounced when the local financial sector is less concentrated.
1 Banks in our study include the five biggest commercial banks in China: the four biggest state-owned commercial banks and one national commercial bank, Bank of Communications. Non-bank financial institutions mainly include rural credit cooperatives, and local trust and investment companies. For the detailed differences between those institutions, we refer to the third section.
3

The relationship between finance and growth has been debated for a long time. Recent
cross-country studies provide evidence that greater financial development leads to
higher growth (e.g. King and Levine (1993a), Levine and Zervos (1998), Berger,
Hasan, and Klapper (2004); more details are in our literature review section).
However, the evidence from cross-country regressions may be plagued by omitted
variable problems, and therefore must be viewed with some skepticism (Jayaratne and
Strahan (1996)). For example, cross-country differences in political institutions,
accounting standards, and legal systems may drive both economic growth and
financial development, but are not easily controlled for.
Within-country studies suffer less from this problem and their inferences therefore
should be more convincing. For instance, Jayaratne and Strahan (1996) document that
after the relaxation of bank branch restrictions in the United States, the growth in
income and output increased significantly (see our literature review section for other
studies). However, whether those inferences also apply to developing economies that
are in a different phase of the growth path than the developed ones, is not clear.
Direct evidence from developing economies on the finance-high-growth-rate nexus is
scarce. 2 As China is one of the most important developing countries, China’s
experience may be relevant also for other countries having the potential of exhibiting
similar growth as China. The Chinese finance-growth nexus only recently received
attention, but no consensus on the role of finance has been reached yet. One strand of
papers argues that financial development matters for economic growth by observing
that local growth is significantly correlated with financial development (e.g. Li and
Liu (2001) and Zhou and Wang (2002)). Another strand of papers holds the opinion
that China is a counterexample to the current findings of the finance and growth
literature. For instance, Allen et al. (2005) conclude that there exist other financing
channels for the private sector than those of financial institutions.
Our paper provides new evidence and insights on the finance-high-growth rate nexus
in China. Identifying the effects of financial development on economic growth is a
challenging task in that financial development may react to the expectation of
2 An exception is Haber (1991, 1997) who documents that financial liberalization promotes growth in both Brazil and Mexico.
4
enhanced future economic growth; hence economies with good growth prospects
develop institutions to provide funds necessary to support those good prospects
(Robinson (1952)). The Chinese case allows us to make progress in controlling for
this reverse causality. First, the Chinese economy with its different types of financial
institutions allows us to take a generalized “difference-in-differences” method, which
helps us identify the causation. The rationale for this approach stems from the
following reasoning. Theory argues that financial institutions efficiently allocate
capital to where it can generate better returns and therefore promote growth. If this
theory applies, banks with better efficiency relative to non-bank financial institutions
may be better at selecting fast growing firms. Empirically we should observe a
stronger correlation between bank development and future economic growth.
However, if finance simply follows growth, the huge demand for funds from the
non-state-owned enterprises due to their growing needs will make the development of
non-bank financial institutions show a stronger correlation with future growth.
Second, we choose the period over 1995-2003, immediately after the Chinese
government tried to “soft land” the economy. The economic growth rates had shown a
decreasing trend during our sample period. When economic growth leads finance, the
situation should be less severe during the downswing of the business cycle. Typically,
we find that the fastest growing provinces in our sample are not those that exhibit the
greatest increase in financial development.
Our findings highlight that banking development via bank loans exerts a significantly
positive impact on local growth, both statistically and economically. As a comparison,
non-bank financial institutions, while granting most of their loans to the
non-state-owned sector, seem to be less important for local growth. This suggests that
the efficiency of financial institutions still plays an important role in the allocation of
funds, and in turn spurs growth. We find little evidence that fast growing provinces
also had experienced a fast developing financial sector during our sample period. In
conclusion, our results are less likely driven by reserve causality.
How to reconcile these results with Allen et al. (2005), who argue that growth in
China mainly stems from the private sector? First, Chinese banks may enjoy a better
pool of borrowers as they have a larger geographical scope, face fewer restrictions in
5
attracting deposits and therefore can establish stronger bank-firm relationships, and
finance both large and small firms. Non-bank financial institutions may have a
restricted choice due to their smaller nature. We notice that the state-owned sector still
contributes around 40% of GDP growth in recent years (Sun, 2003). Banks therefore
can easily allocate the capital to the most profitable state-owned enterprises. Second,
bank loans and especially short-term loans to the non-state-owned sector, had grown
considerably during our sample period. This suggests that banks increased their
relative exposure towards the financing of private firms, even though most financed
private firms were large ones. This noticeable change is also documented by two
recent surveys (see Appendix), which indicate that Chinese banks are more likely to
discriminate borrowers with respect to their sizes rather than ownership. Third,
another plausible explanation is that bank loans may be transmitted to the private
sector through state-owned enterprises. Lu and Yao (2004) argue that given the weak
legal enforcement, Chinese banks may prefer to grant loans to state-owned enterprises
that reinvest bank loans in the private sector.
The rest of our paper is organized as follows. Section II briefly reviews the finance
and growth literature. Section III introduces the Chinese financial system, focusing on
the two types of financial institutions. Section IV presents the effects of financial
development on economic growth in China. The last section concludes.
II Financial Development and Economic Growth: Theory and
Evidence
Theory has studied the relationship between finance and growth. In general there are
two schools of thought with contrasting views. One school holds the idea that
financial development follows rather than spurs economic growth. Robinson (1952)
argues that finance does not cause growth, but reacts to the demand from the real
sector. Hence economies with good growth prospects develop institutions to provide
the necessary funds to support those good prospects. Some empirical evidence
supports this idea. For instance, Shan and Morris (2002) study data from 19 OECD
countries and China, and document that there is no clear evidence that finance
6

Granger causes growth.
The other school argues that financial development plays a key role for growth. First,
financial intermediation economizes the costs associated with mobilizing savings
(Boyd and Smith (1992) and Sirri and Tufano (1995)), and therefore increases capital
accumulation. Second, financial intermediation evaluates firms, managers and market
conditions, and reallocates capital to its best use (Boyd and Prescott (1986),
Greenwood and Jovanovic (1990), or Allen (1990)). Moreover, financial
intermediaries monitor firms and exert control to overcome agency problems
(Townsend (1979), Gale and Hellwig (1985), and Boyd and Smith (1994)). Financial
intermediation meanwhile diversifies investment risks, which enhances the output and
in turn economic growth (Gurley and Shaw (1955), Greenwood and Jovanovic (1990)
and Acemoglu and Zilibotti (1997)). In their view, differences in the quantity and
quality of services provided by financial institutions partly explain why countries
grow at different rates (Goldsmith (1969), Mckinnon, (1973), and Shaw (1973)). The
recent literature also well integrates financial development in innovation-based
growth models. For instance, King and Levine (1993a) suggest that financial
intermediaries can evaluate, finance and monitor potential entrepreneurs in their
innovative activities. They also show that the relationship between finance and growth
is likely to be dynamic and endogenous. Aghion, Howitt and Mayer-Foulkers (2003)
show why the existence of technological transfers is not sufficient to put all countries
on parallel long-run growth rate paths. They find that it is not just financial constraints
that make some countries poor but rather that financial constraints inhibit a
technological transfer and thus lead to an ever-increasing technology gap.
Recent empirical evidence employing cross-country datasets document that finance is
positively correlated with growth. King and Levine (1993a) use data on 77 countries
over the period 1960-1989, to document that the level of financial development
determines long-run economic growth, capital accumulation, and productivity growth.
Levine and Zervos (1998) refine this and find that initial stock market liquidity and
banking development are both positively correlated with future rates of economic and
productivity growth in a sample of 42 countries over the period 1976-1993.
The initial cross-country studies, however, are likely to suffer from simultaneity bias.
7

More recent studies therefore focus on finding proper instruments to extract the
exogenous part of financial development when trying to settle the issue of causality.
La Porta et al (1998) link the legal origin of a country to its financial development.
Their empirical results suggest that a variety of legal origins (British, French, German
or Scandinavian laws) differing in protecting the rights of both shareholders and
creditors and in the efficiency of legal enforcement, reasonably lead to different levels
of financial development. Based upon the above legal origin-finance instruments and
using cross-country datasets, a substantial body of empirical work further shows that
financial development promotes economic growth in aggregate, industry and firm
level analysis (see e.g. Levine, Loayza, and Beck, (2000) or Demirgüç-Kunt and
Maksimovic (1998)). Next to instruments such as legal origin, economists also rely on
improved econometric techniques to instrument endogenous variables. Authors
employ the dynamic system GMM panel estimator proposed by Arellano and Bover
(1995), to extract the impact of financial development on economic growth by
controlling for potential endogeneity.
One way to control for cross-country differences such as legal origin is to focus on
one country only. Jayaratne and Strahan (1996) tackle the endogeneity problem by
keeping effects other than financial development constant. They use financial
deregulation in the early 1970s in 35 U.S.-states as an exogenous shock to local
financial development. They find that in the 30 years after the deregulation, the
economy grew faster in the deregulated states than in the other states. They also test
the hypothesis of deregulation happening only due to expectation about the future
needs of financing. They reject this hypothesis by observing that the loans after
deregulation did not explode. Therefore, they attribute the relatively faster economic
growth in the deregulated states to the improvements in loan quality. Guiso, Sapienza
and Zingales (2004) study the effects of differences in local financial development on
economic activity in Italy. They find that local financial development enhances the
probability that an individual starts a business, increases industrial competition, and in
turn spurs firm growth.
Only few studies consider developing countries. Haber (1991, 1997) carefully
examines the role of financial liberalization for economic growth in Brazil and
Mexico. He documents that financial liberalization allows more firms to have better
8

access to external finance. He argues that political institutions play an important role
in determining the degree of financial liberalization, and concludes that Brazil did
better in financial liberalization due to its better political institutions.
The finance and growth issue in China has only received attention recently but no
consensus has been reached yet. One strand of papers holds the view that finance
promotes growth in China. Employing a province-level dataset for the period
1985-1998, Liu and Li (2001) find that growth of provincial aggregate output is
positively related to the growth of the loans of the largest banking institutions and self
raised funds. They attribute the positive correlation to the improvement in the
efficiency of capital reallocation during the liberalization in both financial and real
sectors. Zhou and Wang (2002) study the impact of local financial development on
economic growth, using a provincial dataset over the period 1978-2000, and find that
local financial development is highly correlated with economic growth. Moreover, the
provinces with relatively low initial level of financial development show slower
growth rates afterwards. Particularly, they attribute the significant correlation between
finance and growth to the openness of local financial markets, which improves the
competition as well as the efficiency of financial institutions. However, those papers
do not formally deal with the endogeneity of finance and growth and hence to some
extent their conclusion of the causality is less convincing.
The other strand of papers holds the opinion that China is a counterexample of the
law-finance-growth nexus. More specifically, they question whether financial
development plays an important role for China’s growth, as they observe the
coexistence of weak Chinese legal and financial systems and fast economic growth.
Allen et al. (2005) examine closely the relationship between law, finance and growth
in China. Their analysis reveals that the relatively poor legal system and the
underdeveloped financial sector contribute little to the growth of the private sector,
which is known as the most important component of China’s fast growth. Hence,
Allen et al. (2005) argue that there exist other financing channels for the private sector
than those of financial institutions.
9

III. The Chinese financial system
3.1 The Chinese financial structure
In this section, we offer a description of the Chinese financial structure.3 We explicitly
focus on the differently developed financial institutions in China – banks and
non-bank financial institutions, rather than stock markets. The reasoning is that the
Chinese financial system is dominated by financial institutions, especially banks.4
[Insert Figure 1 here]
Figure 1 presents the structure of the Chinese financial system at the end of 1994. It
shows that financial institutions in China can be separated in two categories: banks
and non-bank financial institutions. The banking sector (labeled as “banks”) entails
three policy banks – focusing on policy-oriented loans – and fifteen commercial banks,
of which the four state-owned commercial banks dominate the whole banking sector.
Among the eleven national and regional banks, Bank of Communications5 is the
largest with China’s finance ministry the largest shareholder. Sometimes researchers
refer to the four state-owned banks and the Bank of Communications as “the five
biggest state-owned banks”. The non-bank financial sector consists of urban and rural
credit cooperatives, trust and investment companies, financial companies and other
institutions.
We make a distinction between banks and non-bank financial institutions. Banks are
hierarchically organized while non-bank institutions are generally following a
“decentralized form”. This hierarchical structure mainly stems from their size. For
example, Industrial and Commercial Bank of China, the largest state-owned bank has
37,039 branches all over the country. As a comparison, there are only 50,745 rural
credit cooperatives in the whole country. Also, a rural credit cooperative typically has 3 Table a1 in Appendix introduces the functions of the main Chinese financial institutions. 4 For example, at the end of 1994, the ratio of the stock market capitalization to total assets of financial institutions was approximately 6.7%. Although the importance of stock markets has increased somewhat since the early 1990s, the scale and the importance of the financing channels of the stock markets are not comparable to those of financial institutions (Allen et al., 2005). In this paper, we assume that stock markets have no significantly different impacts on different provinces. Hence employing a fixed effects panel model and incorporating time dummy variable in our analysis may well control for the impact of stock markets. 5 The Bank of Communications has been publicly listed in Hong Kong Stock Exchange since June 2005.
10
only one branch-office, does not belong to any “headquarter”, is independent from
other rural credit cooperatives, and is active in one province only.
[Insert Figure 2 here]
As Figure 2 illustrates, the total assets of the four state-owned banks, which were
approximately 7,122 billion RMB6 at the end of 1994, cover around 78 percent of the
total assets of the entire financial sector. The other banks are relatively smaller. As the
fifth biggest bank in China, Bank of Communications occupied more than half of the
total assets of all national and regional banks at the end of 1994. The total assets of
non-bank financial institutions together took 16 percent of the assets of all financial
institutions. The market share of rural credit cooperatives was 7 percent, which was
comparable to that of trust and investment companies. At the end of 2002,
state-owned banks still dominated but their market share declined towards 68 percent.
National and regional banks gained market share towards 15 percent. Market share of
rural credit cooperatives increased whereas trust and investment companies’ market
share decreased.
We argue that the two types of financial institutions – banks and non-bank financial
institutions – differ in several dimensions, and their financial development should
therefore be treated separately. First, they have a diverging geographical scope. Banks
are bigger players than non-bank financial institutions. Most banks in China are
national or regional players, and some of them are even international players. A
non-bank financial institution, in contrast, is typically present in one province only.
Second, banks may be technological more advanced. Banks often pay higher salaries
and offer better career opportunities to young graduates. Therefore, banks may attract
higher quality personnel. Banks also benefit more easily from technological spillovers,
as they recruit experts having overseas working experience. Third, large banks’
branches benefit from expert credit systems developed centrally. Although a
hierarchical structure also has clear disadvantages and may imply a focus on hard
information as argued by Stein (2002), banks in emerging countries may still benefit
from such organizational structure as it helps in reducing asymmetric information
6 RMB=Renminbi (in 2000, 1 US $ = 8.3 RMB)
11

problems. Stand-alone non-bank financial institutions are more likely to suffer from
asymmetric information in the Chinese financial system. The reasoning is that there is
no third-party credit rating agency.
Recent balance sheet data as well as reported data on non-performing loans (NPLs)
show that banks perform better than non-bank financial institutions. Tables 1 and 2
offer more information.
[Insert Tables 1 and 2 here]
Table 1 shows the operating costs of different types of Chinese financial institutions.
The ratio of operating costs to assets is lower for banks than for non-bank financial
institutions. Table 2 provides data on the non-performing loans (NPLs) in the Chinese
financial sector. Although the average NPL ratio is high relative to other countries,
banks have a lower NPL ratio than non-bank financial institutions. The numbers
presented in Table 1 and 2 suggest that banks are more efficient than non-bank
financial institutions.
3.2 Bank-firm relationships in China
Understanding the formation of bank-firm relationships in China may help us to gain
insights into the role of finance for growth. As stock markets are not well developed
in developing economies and emerging markets, firms heavily rely on debt, in
particular short-term debt, for financing their investments. Hence the short-term loan
portfolios of Chinese financial institutions may shed light on how different types of
firms are financed. Figure 3 and Table 3 show how short-term credit has been
allocated between two different types of firms, state-owned and non-state owned
enterprises in China, during our sample period.
[Insert Figure 3 and Table 3 here]
Figure 3 shows the evolution of the short-term loan portfolios of financial institutions
in China. Although both state-owned enterprises and non-state-owned enterprises
received more short-term credit over the period 1994-2002, the short-term loans
12

extended to the non-state-owned sector grew faster. Meanwhile the proportion of
loans to the state-owned sector decreased from 82.5% in 1994 towards 64.4% in 2002.
Data from BankScope show that the reporting banks’ growth rate of short-term loans
was larger than the one of the reporting non-bank financial institutions (average
annual growth rate of 6.6% versus 2.3% respectively over the period 1996-2002).
This evidence taken together suggests that the growing short-term loans stem more
from banks than from non-bank financial institutions.
Furthermore, two surveys provide evidence on how firms may choose between
different financial institutions (see Appendix: survey a1 and a2). They show that firms
apply first for credit at banks before turning to non-bank financial institutions or other
sources of finance. Hence, banks in China may enjoy a better pool of borrowers. The
two surveys indicate also that at the end of 2002, banks in China are more likely to
discriminate according to borrowers’ size rather than ownership. This may stem from
the fact that the Chinese banks are used to extent loans on the basis of collateral.
IV. The growth effects of financial development in China
4.1 Theoretical background, empirical model and financial development indicators
4.1.1 Theoretical background
Following King and Levine (1993b), we illustrate briefly how financial development
affects technological innovation and hence possibly influences the long-run growth
rate. Their endogenous growth model focuses on the connections between finance,
entrepreneurship and economic growth. Financial institutions in this model play an
important role in both the monitoring and financing of potential entrepreneurs, in their
initiation of innovative activities, and launching of new products.
[Insert Figure 4 here]
13

Figure 4 displays the channels through which financial intermediation contributes to
economic growth. Initially, in the entrepreneurial selection procedure, the financial
intermediary monitors the whole set of candidates in the market and picks up potential
entrepreneurs with the ability to manage innovations in the intermediate goods
production technology. Second, the financial intermediary finances the innovative
activities. If entrepreneurs are successful, they will enjoy monopoly profits by
producing the unique intermediate product at a lower cost than their rivals but
charging the same price. However, to produce intermediate goods the successful
entrepreneurs need external financing. The financial intermediary evaluates and
finances those entrepreneurs while it can pay back the consumers (savers) the interest
according to its evaluation of the profitability of those entrepreneurs. Requiring the
input of intermediate goods and labor, the production of final goods is also affected by
the innovative success − the productivity increases with the technological progress. Of
course, the aggregate final goods’ production influences the consumers, who also
provide the labor in this model, by affecting their optimal choice of intertemporal
substitution in consumption. Again, as most neo-classical models predict, the
intertemporal substitution elasticity and time preferences of labor together with real
return rates (interest rates in this model), are positively correlated with the aggregate
growth. Moreover, the equilibrium conditions of the model show that the growth rate
is not only affected by productivity, which is partly decided by the probability that a
candidate is a potential entrepreneur, but also negatively impacted by the cost of
monitoring.
The model identifies the following potential relationships between finance and growth.
First, finance supports innovations and hence increases the productivity which is
positively correlated with growth. Second, efficiency improvements in the financial
sector, such as a decrease in the cost of monitoring, will increase the real rate of return
and thus lead to a higher future growth rate. Third, the model also suggests a reverse
channel of causation where distortions in the innovative sector lower the demand for
financial services and retard financial development.
4.1.2 Empirical framework
To estimate the impact of financial development on economic growth, consider a
14
Cobb-Douglas production function at the individual level,
,xky α= (1)
where y equals real per capita GDP, k equals real per capita physical capital stock, x
equals other determinants of per capita growth, and α is a production function
parameter. Taking the logarithm of (1) yields,
.lnlnln xky +=α (2)
As most neo-classical R&D models predict, for example King and Levine (1993), the
growth of x comes from technological innovation. First-difference of (2) yields,
PRODGKGYP += )(α ,
where GYP is the growth rate of real per capita GDP, GK is the growth rate of real per
capita capital stock and PROD is the growth rate of everything else. If we assume that
the hours worked per worker are relatively stable in our sample range, PROD should
provide a reasonable conglomerate indicator of technology growth. If there is any key
relationship between technological growth and financial development, for instance,
efficiency, the contemporaneous impact of finance on growth hence can be estimated
by,
1 2t o t tGPY a a GK a FI tε= + + + (3)
where FIt is the financial development indicator at time t. For an empirical application
of equation (3) to China’s local province growth, we base our estimation on panel data
from different provinces over the period 1995-2003. The advantage of using panel
data is that we can estimate the corresponding relationship even in a relatively short
period. The fixed effects model derived from equation (3), also controlling for time
effects can be written as
, 1 , 2 , 3 ,1 1
I T
i t i t i t i t i i t t i ti t
GPY a GK a FI a CON U V ,δ φ ε= =
= + + + + +∑ ∑
where FIi,t is the financial development indicator of either banks or non-bank financial
institutions in province i at time t. Ui is a set of province dummy variables, Vt is the
set of time dummy variables, and iδ and tφ are the vectors of coefficients. CON
refers to the conditioning informational set. CON includes FDI and Investment
measured by the ratio of Foreign Direct Investment to GDP, and the ratio of total
investment to GDP, respectively.
15

In order to reveal the relationship between financial development and future economic
growth, we introduce the lagged financial development indicators in our panel
regression,
, 1 , 2 , 1 3 ,1 1
I T
i t i t i t i t i i t t i ti t
GPY a GK a FI a CON U V ,δ φ ε−= =
= + + + + +∑ ∑ 7 (4)
Here equation (4) can be estimated by OLS in general, assuming that the lagged FI is
exogenous and there is no heteroskedasticity and serial autocorrelation in the error
term. However, problems arise when those assumptions are violated. For example,
heteroskedasticity or serial autocorrelation in the error term is often observed in panel
analysis. This problem can be solved by introducing robust standard errors or by first
differencing the data. In our analysis, heteroskedasticity is detected. We report the
results of regression (4) employing robust standard errors.
Within country panel analysis alleviates the potential endogeneity problem that most
cross-country studies may face. It is easier to control for omitted variables that may
drive both economic growth and financial development. Reverse causality is another
concern. The significant correlation between finance and growth may not necessarily
indicate that finance spurs growth, but possibly the reverse. As we argued before,
examining two types of financial institutions may also mitigate this problem. In
several robustness tests, we also try to further deal with potential endogeneity
problems.
4.1.3. Bank and non-bank financial development indicators
We construct three financial development indicators at province level for banks and
non-bank financial institutions, respectively.
Indicators of financial development of banks
Bank Deposit equals the ratio of the savings in the banking system to local GDP. Bank
7 Here we control for the contemporaneous effects of conditioning variables, such as FDI and Investment, following the traditional finance and growth literature (see e.g. King and Levine (1993a)). As a robustness test, we also model the finance and growth relationship by controlling for the lagged value of conditioning variables, as conventional growth theory suggests. Our results remain robust.
16

Deposit is a measure of “financial depth” of the local banking sector. A second
indicator is Bank Credit, which equals the credit extended by banks to local
enterprises over local GDP. This indicator measures the financial resources provided
by banks to provincial entities. Finally, we construct a measure Bank Concentration,
which represents the Herfindahl-Hirschman Index (HHI), employing bank market
shares in the deposit market and taking the province as the relevant market. We
include this measure to proxy for the competitiveness of the banking sector. Before
1980, there were only 3 banks in China and each of them enjoyed a different segment
of the deposit market. After 1984, the number of banks in the market increased and
banks began to compete for deposits under the permission of the central government.
Indicators of financial development of non-bank financial institutions
In a similar fashion as for the bank indicators, we construct Non-bank Deposit,
Non-bank Credit and Non-bank Concentration for non-bank financial institutions.
Descriptive statistics on all the development indicators are discussed in Section IV.
A final variable we employ is Financial Concentration, computed as the HHI of the
deposit market share of all financial institutions in our sample. It provides us with a
global view of the concentration of the entire financial sector
4.2 Data and empirical results
4.2.1 Data Description
Our dataset contains annual growth rates of real per capita GDP, real per capita capital
stock, FDI and Investment in 27 provinces of China over the period 1995-20038.
Lagged financial development indicators are also included in our dataset from 1994 to
2002.
The financial development indicators in our study are calculated employing the
statistics data reported by Almanac of China’s Finance and Banking. The Almanac
documents the provincial data of annual savings and loans of 5 banks only: 4
8 Data reasons prevent us to include three provinces (Hubei, Tibet and Hainan).
17

state-owned banks and the Bank of Communications, the biggest bank of the national
commercial banks. At the end of 1994, those 5 banks represent approximately 96
percent of the total assets of the banking sector.
From 1994 onwards, Almanac of China’s Finance and Banking reports the provincial
data of savings and loans of rural credit cooperatives and of some selected trust and
investment companies, financial companies, and other non-bank financial
institutions.9 Only the non-bank financial institutions that are considered to be large
enough have their data included in the Almanac, whereas smaller institutions remain
uncovered. This may introduce a reporting bias in that provinces with many small
institutions may have an underestimated size of the non-banking sector. However such
reporting bias should be taken care of by our province dummies in as far the reporting
bias remains constant over our sample period within a province.
We construct the financial development indicators of non-bank institutions from the
annual provincial data of rural credit cooperatives and other reporting non-bank
financial institutions. The computation of the non-bank concentration based on the
aggregate data of Almanac of China’s Finance and Banking also induces some
problems. While rural credit cooperatives, like other non-bank financial institutions,
are isolated from each other, Almanac of China’s Finance and Banking reports the
province level aggregate for all rural credit cooperatives jointly in every province.
However in reality rural credit cooperatives are not “integrated” into one entity.
Therefore, the degree of competition among non-bank financial institutions is
estimated by measurement error, which is inevitable given our data limitations.
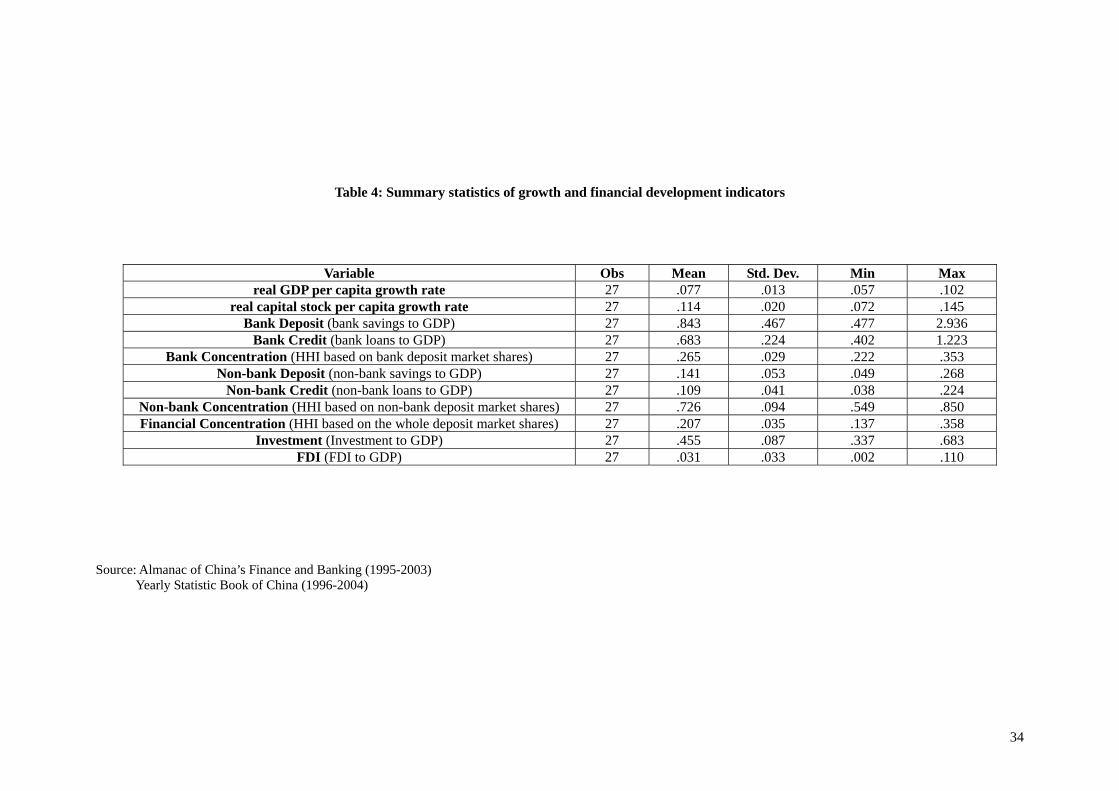
[Insert Table 4 here]
Table 4 provides summary statistics of our data. We present time averages for the 27
provinces. Table 4 highlights that there is substantial variation between provinces. The
highest average annual real per capita GDP growth rate equals 10.2 percent (Zhejiang
province), while the lowest equals 5.7 percent (Yunnan province). The financial
development indicators for China are relatively high compared to those for other
9 The data of urban credit cooperatives are also reported but not for every year. We therefore decided to exclude urban credit cooperatives from our sample.
18

countries (see also Allen et al. (2005)). For example, the average ratios of Bank
Deposit and Bank Credit across provinces are 0.843 and 0.683, while the average
ratios of non-bank savings and loans to GDP across provinces are 0.141 and 0.109
only. Similarly, Beijing on average has the highest values of both Bank Deposit and
Bank Credit, while Shandong province on average has the lowest levels of Bank
Deposit and Bank Credit. Non-bank financial institutions exhibit the lowest
development in Qinghai province, while Shanxi on average has the greatest Non-bank
Deposit and Guangdong enjoys the greatest Non-bank Credit. Both Bank Deposit and
Bank Credit outweigh those of non-bank financial institutions.
4.2.2 Empirical results
[Insert Table 5 here]
Table 5 presents the results of different versions of equation (4). The left panel (5a,b
and c) displays the results including the bank financial development indicators in the
regression. We first discuss the results on our financial development indicators. We
turn to the control variables after having introduced the results in Table 6. Bank
Deposit and Bank Credit are significantly positively correlated with future economic
growth. The middle panel (5d,e and f) presents the results where non-bank financial
development indicators enter the regression. Only Non-bank Deposit is positively
correlated with growth. While most of the Non-bank Credit is granted to the
non-state-owned sector, those loans exhibit little correlation with future growth. The
right panel (5g and h) shows the results for the regressions where both bank and
non-bank indicators enter the specification. Including both Bank Credit and Non-bank
Credit into one regression (5h) shows the robustness of the results. Both Bank Deposit
and Non-bank Deposit are significantly positively correlated with future growth
(column 5g), which is in line with most finance and growth literature. However, Bank
Concentration and Non-bank Concentration do not affect growth directly, suggesting
that competition in banking markets does not affect growth.
Bank and non-bank financial development indicators exhibit a significant different
impact on growth. In particular, the coefficient of Bank Credit is statistically
significant and higher even though bank loans are more focused on the state-owned
19

sector. As a comparison, although non-bank loans are mostly extended to the
non-state-owned sector, Non-bank Credit is largely irrelevant in explaining growth.
This remarkable difference between bank and non-bank financial institutions suggests
that the loans of the financial sector do not simply follow growth. On the contrary, it
reveals that financial development plays an important role in promoting local Chinese
economic growth, as banks compared to non-bank financial institutions have a wider
geographical scope, are technologically more advanced, and may have been more
affected by deregulatory financial reforms.10
Does banking competition promote the impact of financial development? We deal
with this question by running two additional regressions, and present the results in
Table 6. The first regression in column 6a includes the interaction between Financial
Concentration and Bank Credit (Financial Concentration x Bank Credit) as additional
regressor. In the second regression presented in column 6b, we introduce the
interaction between Bank Concentration and Bank Credit (Bank Concentration x
Bank Credit). The reasoning is that banks dominate the financial sector and the impact
of Financial Concentration may mainly stem from Bank Concentration.
[Insert Table 6 here]
Column 6a shows that the interaction term Financial Concentration x Bank Credit is
strongly negative, suggesting that more concentrated financial markets exhibit a lower
growth rate for a given level of Bank Credit. In contrast, the coefficient on Bank
Concentration x Bank Credit in column 6b is not significantly different from zero.
Our results therefore suggest that although non-bank financial institutions seem to
contribute little to local growth, their presence stimulates the competitiveness of the
financial sector. That is the impact of Bank Credit in the provinces where the financial
markets are less concentrated is much more pronounced.
We now turn to the control variables. The results in Tables 5 and 6 reveal that neither
FDI nor Investment are having a significant impact on growth. This result may stem
from the inclusion of province fixed effects. Therefore, FDI and Investment may not
10 The series of financial reforms and deregulations are reported in Table a2 in Appendix.
20
exhibit sufficient time-series variation to become significant. Table 6 reveals that also
the per capita capital stock growth is not statistically significant. An explanation for
this is that people may move easier across provinces within a country than to move
across countries. Hence an empirical application using local data of a country may
suffer from the problem that the provincial population is quite unstable over time.
Therefore, the insignificance of the coefficient of per capita capital stock growth may
be due to the fluctuation of local population. We therefore test whether the growth of
aggregate capital stock is correlated with aggregate economic growth.
[Insert Table 7 here]
Table 7 presents the results of regressing provincial aggregate GDP growth on the
growth of the aggregate capital stock and financial development indicators. The
aggregate capital stock growth is significant and positive. More importantly, Bank
Credit keeps it positive sign. However, Bank Deposit now is only marginally
significant in the first regression, and Non-bank Deposit becomes insignificant.
4.3 Robustness tests: endogeneity
Are our results driven by reserve causality? That is, does the expectation of future
growth prospects imply greater financial development? If this were true, high
economic growth provinces should also exhibit high growth rates of financial
development. We investigate this issue in several ways. First, we select the 13 fastest
growing provinces in terms of economic growth. We do find, however, that only 6 of
them are in the top 13 of fastest growing Bank Deposit or Bank Credit provinces.
Therefore, high growth provinces are not more likely to be provinces that have a high
growth rate of financial development.
Second, directly controlling for endogeneity is also possible when employing the
dynamic system GMM estimator proposed by Arellano and Bover (1995). The
dynamic panel model requires the lagged dependent variable to enter to right-hand
side of the regression. For example, regression (4) can be extended to a dynamic panel
regression as follows,
21

, 0 , 1 1 , 2 , 1 3 ,1 1
I T
i t i t i t i t i t i i t t i ti t
GPY a GPY a GK a FI a CON U V ,δ φ ε− −= =
= + + + + +∑ ∑ +
1))
−
(5)
First differences of (5) read,
, , 1 0 , 1 , 2 1 , ,
2 , 1 , 2 3 , , 1
, , 1
( ) (( ) (
( )
i t i t i t i t i t i t
i t i t i t i t
i t i t
GPY GPY a GPY GPY a GK GKa FI FI a CON CONε ε
− − −
− − −
−
− = − + −
+ − + −
+ −
(6)
A system estimator jointly estimates the regression in levels (5) and the regression in
differences (6). In order to correct for endogeneity, Arellano and Bover (1995) suggest
employing lagged first differences of the explanatory variables as instruments for the
equation in levels (5) and the lagged values of the explanatory variables in levels as
instruments for the equation in differences (6). The crucial assumptions therefore are
that the lagged differences of variables are good instruments for explaining
subsequent levels and the lagged levels of variables are good instruments for
explaining subsequent first differences. Rejection of the Sargan test of
over-identifying restrictions at 5% level however questions the validity of those
instruments. It is also necessary to test whether the error term of regression (6),
, ,i t i t 1ε ε −− , is second-order serially autocorrelated. Accepting the null hypothesis of
no second-order serial autocorrelation supports the assumption of the moment
condition of (6).
[Insert Table 8 here]
Table 8 reports the impact of financial development on economic growth when using
the dynamic system GMM estimator. Bank loans significantly spur future economic
growth, both economically and statistically. For example, if Shandong, the province
now receiving the least bank credit enjoyed as much bank credit as Beijing, where the
most bank credit is extended, ceteris paribus, Shandong’s growth rate would increase
approximately 8 percent per year, which is huge. Column 8h displays the results when
we include Bank Credit and Non-bank Credit in one regression. Again, only the
impact of Bank Credit appears to be positive and significant. Bank Deposit does not
show any significant impact. The impact of Non-bank Deposit appears to be different
in column 8d and column 8g, questioning the robustness of the effect of non-bank
22

loan size on growth. The coefficients of Bank Concentration and Non-bank
Concentration are not significant. The fact that the null hypotheses of both the Sargan
test and the second-order serial autocorrelation tests cannot be rejected at the 5
percent level approves the validity of the results of dynamic panel regressions11. In
general, the results reported by Table 8 confirm those of Table 5.
We also employ the dynamic system GMM estimator when including the interaction
item between concentration and financial development (results are reported in Table
9). Our previous findings remain virtually unaffected.
V. Conclusion
Is the finance-growth nexus at work in an economy exhibiting a high growth rate? In
this paper we provide empirical evidence on the impact of financial development on
the growth of Chinese provinces over the recent period 1995-2003. Exploiting within
variation on 27 provinces, we are able to more adequately control for institutional,
legal and cultural factors that may commonly affect the Chinese financial system. We
find that the finance-growth nexus also applies to the recent economic growth of
Chinese provinces.
But which financial institutions’ development contributes to the Chinese
finance-growth nexus? We look at the impact of two types – “banks” and “non-bank
financial institutions”. The reasoning to distinguish those two types is that banks,
relative to non-bank financial institutions, have a wider geographical scope, are larger,
and are often more hierarchically organized. Bank branches are also well integrated
and may benefit from centrally developed technology and expert credit systems.
We find that provinces with a more financially developed banking sector enjoy a
statistically and economically significantly higher local economic growth 12 . In
11 The null of the Sargan test of the regression reported in column 6f cannot be rejected at 5% but can still be rejected at 10%. 12 As the two surveys in Appendix document, the Chinese banks seem to be less prone to grant loans when firms are in the starting-up stage but become the most important loan providers once the firms survive and become larger. Hence the Chinese banks may discriminate the two different channels modeled by King and Levine (1993b), as illustrated in Figure 4. Specifically, banks are more likely to drop the channel of financing potential entrepreneurs
23

contrast, even though non-bank financial institutions focus more on the
non-state-owned sector, we still find that provinces with a more developed non-bank
financial sector show no different growth rate than provinces with a little developed
non-bank financial sector. We also find that the impact on growth of banking
development is more pronounced in provinces with a less concentrated financial
sector, showing that competition pronounces the finance-growth nexus. In particular
competition from non-bank financial institutions seems important.
In general, our findings challenge the view that China is a counterexample to the
current findings in the finance-growth literature. Our focus on a recent time period
and the difference between banks and non-bank financial institutions shows that the
finance-growth nexus also applies to the growth rate of Chinese provinces.
but adopt the channel of evaluating and financing intermediate goods monopoly.
24

References Acemoglu, D. and F. Zilibotti, 1997, Was Prometheus Unbound by Chance? Risk,
Diversification, and Growth, Journal of Political Economy, 105: 709-775. Aghion, P., Howitt, P., and Mayer-Foulkers, D., 2003, The Effect of Financial
Development on Convergence: Theory and Evidence, Quarterly Journal of Economics, 120: 173-222.
Allen, F., 1990, The Market for Information and the Origin of Financial Intermediaries, Journal of Financial Intermediation, 1: 3-30.
Allen, F., Qian, J., and Qian, M., 2005, Law, Finance and Economic Growth in China, Journal of Financial Economics, 77: 57-116.
Arellano, M., and Bover, O., 1995, Another Look at the Instrumental-Variable Estimation of Error-Components Models, Journal of Econometrics, 68: 29-52.
Bekaert, G., and Harvey, C. R., Chronology of Economic, Political and Financial Events in Emerging Markets: China. http://www.duke.edu/~charvey/Country_risk/couindex.htm.
Berger, A. N., I. Hasan, and L. F. Klapper, 2004, Further Evidence on the Link between Finance and Growth: An International Analysis of Community Banking and Economic Performance, Journal of Financial Services Research 25, 169-202.
Boyd, J. H. and E. C. Prescott 1986, Financial Intermediary-Coalitions, Journal of Economic Theory, 38: 211-232.
Boyd, J. H., and B. D. Smith, 1992, Intermediation and the Equilibrium Allocation of Investment Capital: Implications for Economic Development, Journal of Monetary Economics, 30: 409-432.
Boyd, J. H. and B. D. Smith, 1994, How Good Are Standard Debt Contracts? Stochastic Versus Nonstochastic Monitoring in a Costly State Verification Environment, Journal of Business, 67: 539-562.
Boyreau-Debray, G., 2003, Financial Intermediation and Growth: Chinese Style, World Bank Policy Research Working Paper, 3027.
Demirgüç-Kunt, A., and Maksimovic, V., 1998, Law, Finance and Firm Growth, Journal of Finance, 53: 2107-2137.
Gale, D. and M. Hellwig, 1985, Incentive-Compatible Debt Contracts: The One-Period Problem, Review of Economic Studies, 52: 647-663.
Goldsmith, R. W., 1969, Financial Structure and Development, New Haven, CT: Yale University Press.
Greenwood, J., and B. Jovanovic, 1990, Financial Development, Growth, and the Distributionof Income, Journal of Political Economy, 98: 1076-1107.
Guiso, L., P. Sapienza and L. Zingales (2004), Does local financial development matter?, Quarterly Journal of Economics, 119(3), 929-969.
Gurley, J. G. and E. S. Shaw, 1955, Financial Aspects of Economic Development, American Economic Review, 45: 515-538.
Haber, S. H. 1991, Industrial Concentration and the Capital Markets: A Comparative Study of Brazil, Mexico, and the United States, 1830-1930, Journal of Economic History, 51: 559-580.
Haber, S. H. 1997, Financial Markets and Industrial Development: A Comparative Study of Governmental Regulation, Financial Innovation and Industrial Structure in Brazil and Mexico, 1840-1940, In: How Latin America Fell Behind?, Ed: S. Haber, Stanford, CA: Stanford University Press: 146-178.
Jayaratne, J., and Strahan, P.E., 1996, The Finance-Growth Nexus: Evidence from Bank Branch Deregulation, Quarterly Journal of Economics, 111: 639-670.
25
26
King, R.G., and Levine, R., 1993a, Finance and Growth: Schumpeter Might Be Right, Quarterly Journal of Economics, 108: 717-738.
La Porta, R., Lopez-de-Silanes, F., and Shleifer, A., and Vishny, R. W., 1998, Law and Finance, Journal of Political Economy, 106: 1113-1150.
Levine, R., Loayza, N., and Beck, T., 2000, Financial Intermediation and Growth: Causality and Causes, Journal of Monetary Economics, 46: 31-77.
Levine, R., and Zervos, S., 1998, Stock Markets, Banks, and Economic Growth, American Economic Review, 88: 537-558.
Li, K., and Liu, T., 2001, Impact of Liberalization of Financial Resources in China's Economic Growth: Evidences from Provinces, Journal of Asian Economics, 12: 245-262.
Lu, F., and Y. Yao, 2004, Jinrong Yayi Xia de Fazhi, Jinrong Fazhan he Jingji Zengzhang (Law, Financial Development and Economic Growth under Financial Repression), 2004(1)
McKinnon, R.I., 1973, Money and Capital in Economic Development, Washington, DC: Brookings Institution.
Robinson, J. 1952, The Generalization of the General Theory, In: the Rate of Interest and Other Essays, London: MacMillan.
Shan, JZ, and A. Morris 2002, Does Financial Development ‘lead’ Economic. Growth?, International Review of Applied Economics, 16(2), pp.153-168.
Shaw, E.S., 1973, Financial Deepening in Economic Development, New York, NY. Oxford University Press.
Sirri, E. R. and P. Tufano 1995, The Economics of Pooling, In: The Global Financial System: A Functional Approach, Eds: D. B. Crane, et al., Boston, MA: Harvard Business School Press: 81-128.
Stein, J.C., 2002, Information Production and Capital Allocation: Decentralized vs. Hierarchical Firms, Journal of Finance, 57: 1891-1921.
Sun, L., 2003, Zhongguo Jingrong Tixi de Cuiruo Xing (The Fragility in China’s Financial Systems), Finance and Trade Economics, 268: 5-12.
Townsend, R. M., 1979, Optimal Contracts and Competitive Markets with Costly StateVerification, Journal of Economic Theory, 21: 265-293.
Xie, P., 1998, Zhongguo Fei Yinhang Jinrong Jigou Yanjiu ( A Study of the Chinese Non-bank Financial Institutions), Economics and Finance, 1998 (3), (4), and (5).
Xie, P., 2001, Zhongguo Nongcun Xinyongshe Tizhi Gaige de Zhenglun (The system reform of China’s rural credit cooperatives), Financial Research, 2001(1).
Zhang, Q., 2003, Zhongguo Nongcun Jinrong Xianzhang yu Zhengce Fengxi (Analysis of the Chinese Rural Financial System), Report for Asian Development Bank, 2003.
Zhou, L., and Z, Wang, Zhongguo Jinrong Fazhan Diqu Chaju Fengxi,1978-1999 (The divergence of the Chinese Local Financial Development, Empirical Evidence 1978-1999). Financial Research, 2002 (10).
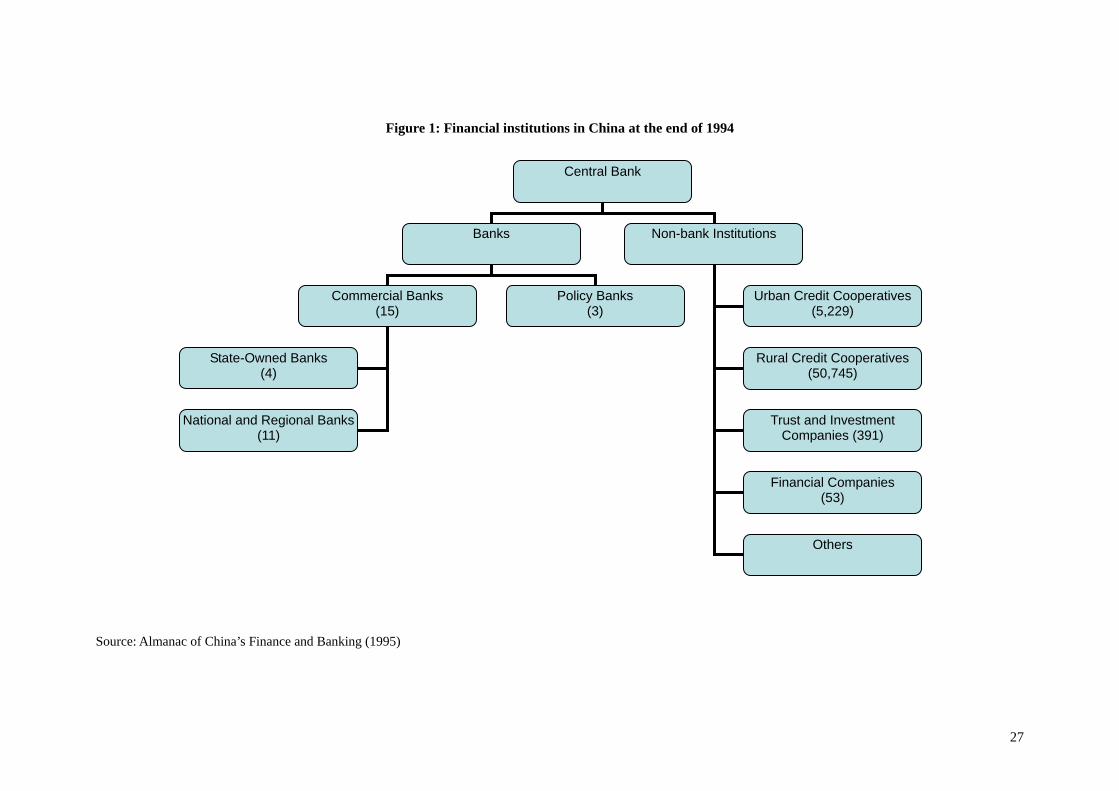
Figure 1: Financial institutions in China at the end of 1994
Central Bank
Non-bank Institutions Banks
Urban Credit Cooperatives (5,229)
Rural Credit Cooperatives (50,745)
Trust and Investment Companies (391)
Financial Companies (53)
Others
Commercial Banks (15)
Policy Banks (3)
State-Owned Banks (4)
National and Regional Banks(11)
Source: Almanac of China’s Finance and Banking (1995)
27

Figure 2: Total assets of financial institutions at the end of 1994 and 2002
78%
6%0%
7%3% 6%
0%
68%
15%
1%
11%
1% 2% 2%0%
10%
20%
30%
40%
50%
60%
70%
80%
90%
state-ow nedbanks
national andregional
commercialbanks
foreign banks rural creditcooperatives
urban creditcooperatives
trust investmentcompanies
f inancialcompanies
1994 2002
Source: Almanac of China’s Finance and Banking (1995, 2003)
28

Figure 3: Short-term loan portfolio of the Chinese financial institutions: 1994-2002
0
1000
2000
3000
4000
5000
6000
7000
8000
1994 1995 1996 1997 1998 1999 2000 2001 2002
Bil RMB
non-state-ownedenterprises
state-ownedenterprises
Source: China Credit Yearbook (Volume I)
29
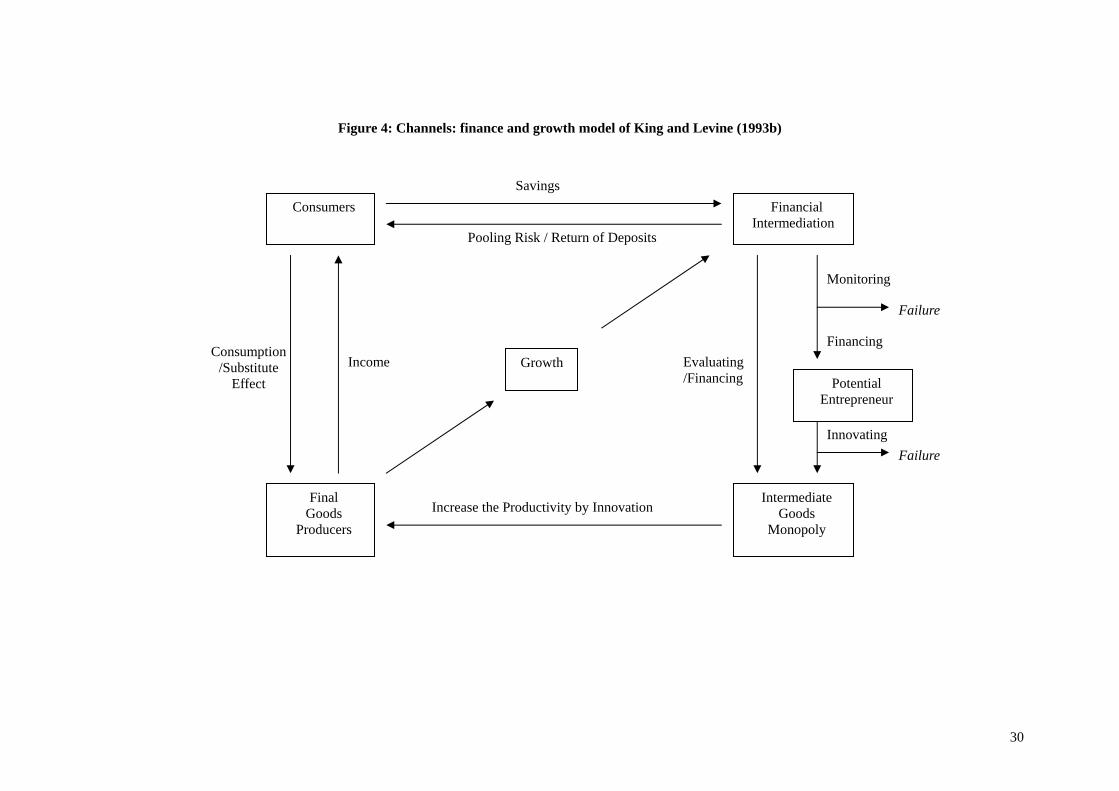
Figure 4: Channels: finance and growth model of King and Levine (1993b)
Financial Intermediation
Potential Entrepreneur
Intermediate Goods
Monopoly
Monitoring
Failure
Financing
Innovating Failure
Evaluating /Financing
Final Goods
Producers
Consumers
Increase the Productivity by Innovation
Consumption /Substitute
Effect
Growth
Savings
Pooling Risk / Return of Deposits
Income
30

Table 1: Operating costs of different Chinese financial institutions
Institutions Operating Costs Ratio Sample Period Average Ratio Industrial and commercial Bank of China* 0.010 1996-2003
Bank of China* 0.007 1996-2003
Operating costs ratio= operating costs/total assets * Source: Bankscope ** Source: Xie, P., 2001, Zhongguo nongcun xinyongshe tizhi gaige de zhenglun (The system reform of China’s rural credit cooperatives), Financial Research, 2001(1).
Banks Bank of Communications* 0.015 1996-2003
0.011
Rural Credit Cooperatives** 0.019 1998-1999 Heilongjiang International Trust & Investment Corp.* 0.030 1997-1998
Jiangsu International Trust & Investment Corp.* 0.007 1996-1997 Shanghai AJ Trust & Investment Co, Ltd* 0.014 1996-2002
Shanghai Associated Finance Co.* 0.008 1996-1997 Shanghai International Trust & Investment Corp.* 0.022 2000-2002 Shenzhen International Trust & Investment Corp.* 0.015 1996-1999
0.016
Non-bank Financial
Institutions
0.128 1996-1999 Zhejiang International Trust & Investment Corp.*
0.030
31

Table 2: Financial risk comparison between banks and non-bank institutions
Institutions Financial Risk
Nonperforming Loan Ratio* Name 2000 2001 2002 2003 ICBC 0.334 0.298 0.257 0.213 BOC 0.272 0.275 0.225 0.181 CCB 0.203 0.192 0.152 0.119
Banks
ABC 0.468 0.421 0.381 0.321
Rural Credit Cooperatives
Average nonperforming loan ratio was around 0.5 by the end of 2003. In some underdeveloped provinces the ratio even reached 0.9.**
Non-bank Financial institutions
Nonperforming Loan ratio is unreported but expected to be high. The bankruptcy of Guangdong International Trust and Investment Company (GITIC) in 1998 is an example. The Chinese government often decides to close the financially bankrupt Trust and Investment Companies.
Trust and Investment
Companies The total number of Trust and Investment companies shrank from 339 (by 1990) to 244 (by 1996). ***
* Source: Sun, L., 2003,The Fragility in China’s Financial Systems, Finance and Trade Economics (Chinese), 268: 5-12 **Source:Zhang, Q., 2003, Zhongguo Nongcun Jinrong Xianzhang Yu Zhengce Fengxi (Analysis of the Chinese Rural Finanical System), Report for Asian Development
Bank, 2003 *** Source: Xie, P., 1998, Zhongguo Fei Yinhang Jinrong Jigou Yanjiu ( A Study of the Chinese Non-bank Financial Institutions), Economcs and Finance, 1998 (3), (4),
and (5).
32

Table 3: Composition of Short-term loan portfolio of the Chinese financial institutions: 1994-2002
1994 1995 1996 1997 1998 1999 2000 2001 2002 Average
Proportion
0.824
0.808
0.807
0.718
0.720
0.690
0.603
0.669
0.644
State-owned enterprises
Growth rate
0.176
0.169
0.185
0.088
0.010
-0.192
0.178
0.058
0.084
Proportion
0.176
0.192
0.193
0.282
0.280
0.310
0.397
0.331
0.356
Non-state-owned
enterprises
Growth rate
0.263
0.174
0.503
0.079
0.142
0.188
-0.091 0.156 0.177
Source: China Credit Yearbook (Volume I)
33
34
Table 4: Summary statistics of growth and financial development indicators
Variable Obs Mean Std. Dev. Min Max
real GDP per capita growth rate 27 .077 .013 .057 .102 real capital stock per capita growth rate 27 .114 .020 .072 .145
Bank Deposit (bank savings to GDP) 27 .843 .467 .477 2.936 Bank Credit (bank loans to GDP) 27 .683 .224 .402 1.223
Bank Concentration (HHI based on bank deposit market shares) 27 .265 .029 .222 .353 Non-bank Deposit (non-bank savings to GDP) 27 .141 .053 .049 .268
Non-bank Credit (non-bank loans to GDP) 27 .109 .041 .038 .224 Non-bank Concentration (HHI based on non-bank deposit market shares) 27 .726 .094 .549 .850 Financial Concentration (HHI based on the whole deposit market shares) 27 .207 .035 .137 .358
Investment (Investment to GDP) 27 .455 .683 .087 .337 .110 .002 .033 27 .031 FDI (FDI to GDP)
Source: Almanac of China’s Finance and Banking (1995-2003) Yearly Statistic Book of China (1996-2004)

Table 5: Finance and real per capita GDP growth in Chinese provinces: 1995-2003 Fixed effects regressions, within estimator
Dependent variable: Real Per Capita GDP Growth
regressors 5a 5b 5c 5d 5e 5f 5g 5h
Per Capita Capital Stock
Growth
-.036 (.641)
-.000 (.999)
-.034 (.662)
-.041 (.572)
-.037 (.627)
-.036 (.633)
-.041 (.571)
-.0060 (.936)
Bank Deposit
.080*** (.000)
.072*** (.006)
Bank Credit
.095*** (.000)
.096*** (.000)
Bank
Concentration
.015
(.769)
Non-bank Deposit
.032** (.016)
.023* (.093)
Non-bank Credit
.008
(.398)
.009
(.186)
Non-bank Concentration
-.014 (.400)
Investment .050* (.081)
.054* (.062)
.041 (.267)
.029 (.341)
.035 (.314)
.039 (.259)
.041 (.135)
.048* (.084)
FDI .001 (.863)
.002 (.859)
.003 (.740)
.002 (.795)
.002 (.781)
.003 (.687)
.000 (.902)
.001 (.913)
Obs 242 242 242 242 242 242 242 242
R-squared .385 .398 .351 .366 .353 .354 .390 .401 * indicates significance at 10% level ** indicates significance at 5% level *** indicates significance at 1% level p-value is reported between brackets
35

Table 6: Finance and real per capita GDP growth in Chinese provinces (1995-2003): the impact of concentration
Fixed effects regressions, within estimator Dependent variable: Real Per Capita GDP Growth
regressors 6a 6b
Per Capita
Capital Stock Growth
.018 (.800)
.019 (.821)
Bank Credit
. 195*** (.000)
. 180** (.012)
Bank Credit x Financial
Concentration
-. 080** (.047)
Bank Credit x Bank Concentration
-. 074 (.223)
Investment . 049 (.102)
.050 (.117)
FDI .001 (.916)
.002 (.845)
Obs 242 242
R-squared .407 .402 * indicates significance at 10% level ** indicates significance at 5% level *** indicates significance at 1% level p-value is reported between brackets
36

Table 7: Finance and aggregate real GDP growth in Chinese province ( 1995-2003): aggregate capital stock growth
Fixed effects regressions, within estimator
Dependent variable: Aggregate Real GDP Growth
regressors 7a 7b 7c 7d 7e 7f 7g 7h Aggregate
Capital Stock Growth
.421*** (.000)
.478*** (.000)
.484***(.000)
.453*** (.000)
.479*** (.000)
.479***(.000)
.406*** (.000)
.472*** (.000)
Bank Deposit
.042* (.089)
.042 (.122)
Bank Credit
.057** (.028)
.057** (.028)
Bank
Concentration
-.008 (.850)
Non-bank Deposit
.0100 (.361)
.006 (.652)
Non-bank Credit
.001
(.849)
.002
(.711)
Non-bank Concentration
-.002 (.865)
Investment -.043 (.185)
-.043 (.200)
-.057* (.050)
-.056* (.053)
-.056* (.058)
-.056** (.049)
-.049 (.186)
-.043 (.211)
FDI .001 (.910)
.001 (.954)
.001 (.868)
.001 (.875)
.001 (.876)
.001 (.860)
.001 (.913)
.000 (.965)
Obs 242 242 242 242 242 242 242 242
R-squared .462 .473 .449 .451 .449 .449 .460 .474 * indicates significance at 10% level ** indicates significance at 5% level *** indicates significance at 1% level p-value is reported between brackets
37

Table 8: Finance and real per capita GDP growth in Chinese provinces: 1995-2003
Dynamic panel regressions, system GMM estimator Dependent variable: Real Per Capita GDP Growth
Regressors
8a 8b 8c 8d 8e 8f 8g 8h
Per Capita Capital Stock
Growth
-.064 (.307)
-.090 (.147)
-.059 (.371)
-.089 (.147)
-.090 (.154)
-.076 (.214)
-.077 (.190)
-.078 (.185)
Bank Deposit
.016 (.639)
.009 (.769)
Bank Credit
.072** (.022)
.074** (.010)
Bank
Concentration
-.044 (.501)
Non-bank Deposit
.028 (.183)
.036* (.067)
Non-bank Credit
.004
(.688)
.010
(.286)
Non-bank Concentration
-.017 (.241)
Investment .017
(.657) .065* (.092)
.007 (.846)
.010 (.771)
.027 (.485)
.032 (.374)
.005 (.891)
.042 (.240)
FDI .006
(.443) .003
(.739) .008
(.300) .005
(.538) .007
(.370) .008
(.310) .005
(.466) .006
(.431)
Obs 215 215 215 215 215 215 215 215 Sargan Test .297 .321 .226 .200 .390 .051* .282 .419 AR(2) Test .290 .372 .241 .355 .218 .332 .299 .354
* indicates significance at 10% level ** indicates significance at 5% level *** indicates significance at 1% level p-value is reported between brackets
38

Table 9: Finance and real per capita GDP growth in Chinese provinces (1995-2003):
the impact of concentration Dynamic panel regressions, system GMM estimator
Dependent variable: Real Per Capita GDP Growth
regressors 9a 9b
Per Capita
Capital Stock Growth
-.021 (.727)
-.048 (.437)
Bank Credit
. 260*** (.001)
. 211*** (.010)
Bank Credit x Financial
Concentration
-.138** (.010)
Bank Credit x Bank Concentration
-.107* (.095)
Investment . 035 (.314)
. 050 (.153)
FDI .004
(.533) . 005 (.461)
Obs 215 215
. 460 . 458 Sargan Test
. 335 AR(2) Test .416 * indicates significance at 10% level ** indicates significance at 5% level *** indicates significance at 1% level p-value is reported between brackets
39

Appendix
Table a1: The introduction to the main Chinese financial institutions
* They are classified as non-bank financial institutions, according to Almanac of China’s Finance and Banking.
Some Chinese researchers are willing to exclude credit cooperatives from non-bank financial institutions because
those cooperatives are functionally closer to commercial banks. In our study, we follow the classification of
Almanac of China’s Finance and Banking.
Name Functions
People’s Bank of China
The People’s Bank of China (PBOC) is China’s central bank, which
formulates and implements monetary policy.
China Banking Regulatory
Commission
China Banking Regulatory Commission (CBRC) was officially launched on
April 28, 2003, to take over the supervisory role of the PBOC. It regulates
and supervises banks, asset management companies, trust and investment
companies as well as other deposit-taking financial institutions.
Stated-owned commercial banks
The four Stated-owned banks were established in the mid-1980s and
transformed into commercial banks in 1994. The “big four” include: the
Bank of China (BOC), the China Construction Bank (CCB), the
Agricultural Bank of China (ABC), and the Industrial and Commercial
Bank of China (ICBC).
The three policy banks were established in 1994 to take over the
government-directed spending functions of the four state-owned
commercial banks. The three policy banks are: the Agricultural
Development Bank of China (ADBC), China Development Bank (CDB),
and the Export-Import Bank of China (Chexim)
Policy banks
National and regional commercial banks were mostly established by key
state entities. China Minsheng Banking Corp. is the first publicly traded
private bank. Bank of Communications is the biggest bank among all those
banks. Although those banks are much smaller than the four state-owned
banks, they have a much lower ratio of non-performing loans (NPLs).
National and regional commercial
banks
There are two types of credit cooperatives: rural credit cooperatives (RCCs)
and urban credit cooperatives (UCCs). Both of them are local financial
institutions and aimed to extend loans for local economic activities. They
are functionally close to commercial banks.
Credit cooperatives*
Trust and investment companies (TICs) are engaged in various forms of
merchant and investment banking activities. They take deposits from
inter-bank markets. Except for few national TICs, most of them were
established by government agencies and provincial authorities and are
localized.
Trust and investment companies*
Financial companies*
Financial companies belong to state entities. They are only allowed to take
deposits from and grant loans to entities.
40

Table a2: Financial reforms in China
Date Events 198302
The State Council approved a regulation on establishment of delegations of foreign banks and financial institutions in Beijing and special economic zones
198504 The State Council approved a regulation on establishment of branches of foreign banks and of joint venture banks in special economic zones
198601 PBOC allowed Industrial and Commercial Bank of China (ICBC) and Agricultural Bank of China (ABC) to provide personal checks for the individual-owned companies in 7 provinces/cities.
198604 PBOC introduced a regulation on controlling the establishment of trust and investment companies (TICs); The regulation strictly forbids private-owned TICs.
198607 PBOC introduced a regulation requiring a re-evaluation process for existing urban credit cooperatives (UCCs) in order to control the fast growth of UCCs. UCCs were not allowed to enter the county level market.
199102 PBOC introduced credit rating system in ABC and requested ABC to grant loans according to a company’s creditworthiness.
199207 PBOC decided to intervene in the management of non-bank financial institutions by assigning officials to those institutions.
199400 The Chinese government converted four "specialized" banks into "commercial" banks by transferring their responsibilities for making noncommercial loans to three newly established "policy" banks. The first China's central and commercial banking laws was passed to allowed new, non-state-owned banks to set up business.
199400 PBOC liberalized the interest rates for the four stated-owned commercial banks within bounds (upper bounder 20%, lower bounder 10% respect to the fixed interest rate set by PBOC).
199507 A new commercial bank law went into effect. 199511 China launched its first national inter-bank market linking 30 short-term credit
offices across China into a single computer network. 199608 PBOC overtook ABC in supervision RCCs. 199600 China Minsheng Banking Corp., the nation’s first publicly traded private bank,
was established. 199800 PBOC abolished the “credit plan” requirement for commercial banks. Credit risk
control becomes one of the most important topics. 199808 TICs and other financial companies were regulated. The number of those
financial institutions shrank. 199810 RCCs and UCCs were re-audited and regulated. Some RCCs and UCCs were
closed.
41

Table a2 (continued): Financial reforms in China
Date Events
199907 (Controls on credit operations) Some controls on Renminbi (RMB) loans to foreign-funded enterprises (FFEs) under foreign exchange liens or guarantees were eased.
199900 Four asset management companies established to offload $169 billion in nonperforming loans from the four state-owned banks.
200007 A personal credit rating system was launched in Shanghai to assess consumer credit risk and set ratings standards. This helps in developing China’s consumer credit industry, and increases bank loans to individuals.
200100 During the third quarter, the government crackdown illegal bank loans to stock market speculators and its practice of selling of shares to finance pension obligations.
200100 China becomes a member of the World Trade Organization; commits to opening up its financial services industry on equal terms to foreign banks by 2006.
200100 HSBC Holdings becomes the first foreign bank to buy a stake in a mainland Chinese bank.
200201 The regulations governing foreign banks and financial institutions were issued by the PBOC and were to take effect on 1 February, replacing the five sets of regulations in force since 1996.
200401 The Chinese government has dipped into its US$400bn foreign exchange reserves in order to recapitalize two of the 'Big Four' state-owned banks, in a move to accelerate reform in the country's ailing financial sector.
200405 Liu Mingkang, head of the China Banking Regulatory Commission, said that China's banks should sue the firms and people whose bad debts are destabilizing the banking system.
200406
China's banking regulator has ordered tighter scrutiny of bank lending as part of a government campaign against reckless investment.
Source: Bekaert, G., and Harvey, C. R., Chronology of Economic, Political and Financial Events in Emerging Markets: China. http://www.duke.edu/~charvey/Country_risk/couindex.htm Almanac of China’s Finance and Banking (1986-2004)
42

Surveys: The bank loans to the non-state-owned sector
Survey a1 A survey carried out by People’s Bank of China in October, 2002, shows that 47.7% of the total bank loans had been extended to the non-state-owned sector during the first 9 months in 2002. This survey covers 184 cities from 30 provinces of China, 10,804 non-state-owned enterprises and 2,633 banks (branches) and non-bank financial institutions.
Satisfaction ratios reported by banks (2002.1-2002.9)
Institutions Loans required (Billion RMB) Satisfaction ratio State-owned banks 1,138.9 84.1% National and regional banks 596.24 80.9% City commercial banks* 149.68 84.5% Foreign banks 122.66 75.4% Non-bank financial institutions 208.95 85.5% *transformed from urban credit cooperatives The satisfaction ratio varies among different types of applicants. For example, the satisfaction ratio of large non-state-owned enterprises is 85% while that of small and medium non-state-owned enterprises is only 69.5%. Moreover, ownership also matters for the satisfaction ratio. For instance, Hong Kong, Macao and Taiwan funded enterprises have a satisfaction ratio of 88.6%, which is the highest among all kinds of enterprises. Private enterprises, on the contrary, have the lowest satisfaction ratio of 73.8%.
Ranked financing channels by enterprises
Bank Loans
Self-raised Funds
Client-raised funds
Private-lending Bonds FDI Stock markets loans
35.7% 24.7% 17.4% 10.7% 8.2% 2.8% 0.6% Source: Almanac of China’s Finance and Banking (2003) Survey a2 Another survey carried out by People’s Bank of China in 2002 shows that after the deregulation of interest rate discrimination, bank loans become the most important sources for SMEs in Weizhou city, whose economic growth is typically driven by the private sector. This survey covers 190 SMEs and 13 banks and credit cooperatives in Wenzhou. The survey
43

shows that 61% of the debts of the SMEs were bank loans at 2002. 78% of the SMEs in the survey answered they would first go for bank loans (or credit cooperative loans) when needing external financing. The satisfaction ratio still varies between small and medium sized enterprises. For example, the satisfaction ratio of loans reported by medium sized enterprises is 72.7% while that reported by small sized enterprises is only 60.5%. Source: Almanac of China’s Finance and Banking (2003)
44