the impact of campaigns on discrepancies, errors, and ...ates (1970) found empirical support for the...
TRANSCRIPT

The Impact of Campaigns onDiscrepancies, Errors, and Biases
in Voting Behavior
Patrick Fournier
TH E R E A R E VA R I O U S WAY S B Y which political campaigns can be rele-vant. One can look at the impact of political campaigns on vote intentions,on opinions about leaders and issues, on perceptions of candidates’ issue po-sitions, and on the determinants of decisions (Bartels 1988, 1992; Franklin1991; Johnston et al. 1992, 1996b; Johnston, Hagen, and Jamieson 2004;Gelman and King 1993; Norris et al. 1999; Nevitte et al. 2000; Blais et al.2002). However, one terrain for campaign inBuence remains to be explored:what happens to interpersonal diversity in behavior during a campaign?
Previous research has identiAed two forms of heterogeneity in po-litical behavior: diversity in the process of decision making and diversity inthe outcome of decision making. First, there is evidence that people of dif-ferent information or sophistication levels do not reason the same wayabout politics: they rely on different considerations, or they give differentweight to similar considerations (Stimson 1975; Sniderman, Brody, andTetlock 1991; Johnston et al. 1996b; Fournier 2000). Second, low politicalinformation ultimately leads to individual and aggregate choices that devi-ate from informed decisions: less knowledgeable citizens have opinionsthat differ from those they would have had they been fully informed (Bar-tels 1996; Delli Carpini and Keeter 1996; Althaus 1998; Luskin, Fishkin,and Jowell 2002; Sturgis 2003).
The dynamics of these two types of interpersonal heterogeneityduring political campaigns have not been investigated. We do not know
45

whether the differences between very and less informed citizens are mini-mized or compounded by the progress of a campaign or whether theyremain intact, unaffected by the unfolding of campaigns. Yet, such an in-vestigation is crucial, as it informs us about the impact of the democraticprocess on the quality of voters’ decisions. We need to ascertain whethercampaigns help people make more enlightened choices. Never mind learn-ing and persuasion, this is arguably the most socially important effect thata campaign can have.
This study tackles an important but neglected issue by analyzingthe impact of campaigns on both diversity in decision making and diver-sity in decision outcome. Three separate campaigns are examined: the1988, 1993, and 1997 Canadian federal elections. The goal is to determinewhether campaigns increase, decrease, or do not inBuence the differencesbetween information groups in the determinants of vote choice on onehand and the individual and aggregate deviations in vote choice attribut-able to low information on the other hand.
Heterogeneity and Political Campaigns
There are two types of interpersonal heterogeneity in models of individualpolitical behavior: heterogeneity in the process of decision making, andheterogeneity in the outcome of decision. Heterogeneity in decision mak-ing refers to relationships between independent and dependent variablesthat are not uniform across the entire population, that differ in strengthacross segments of the population. For instance, in a model of voting be-havior, partisan identiAcation, ideology, issues, and leader evaluations maynot have the same impact on the vote of all citizens. Ideology may be moreclosely linked to the decision of some individuals (perhaps the more in-formed), while leader evaluations are stronger determinants of the choiceof other citizens (possibly the less informed). Such results are generally un-derstood as a sign of differing decisional or reasoning rules: people withdiffering levels of expertise think differently about politics, relying on dif-ferent considerations or giving different weight to similar considerations(Rivers 1988; Sniderman, Brody, and Tetlock 1991).1 Sniderman, Brody,and Tetlock (1991) found interpersonal diversity between individuals ofdifferent education levels among a myriad of political decisions. An ex-panding number of studies have uncovered evidence of this type of hetero-geneity between citizens of different levels of political information (Zaller
46 Capturing Campaign Effects

1992; Lupia 1994; Delli Carpini and Keeter 1996; Johnston et al. 1996b;Krause 1997; Fournier 2000).2
There is also evidence of heterogeneity in decision outcome. Stud-ies demonstrate that the information deAciencies of the electorate seriouslyaffect individual choices and collective preferences (Bartels 1996; DelliCarpini and Keeter 1996; Althaus 1998; Luskin, Fishkin, and Jowell 2002;Sturgis 2003). First, at the individual level, lack of information leads toopinions that differ from informed opinions. For instance, uninformed vot-ers do not mimic the choices of informed voters with similar sociodemo-graphic proAles: they do not vote the way they would have had they beenfully informed (Bartels 1996). So all the means reportedly available to cit-izens to overcome informational disparities (polls, cues, and shortcuts) donot perform perfectly (Kuklinski and Hurley 1994; Kuklinski and Quirk2000). These results severely undermine the low information rationalityclaims (McKelvey and Ordeshook 1986; Popkin 1991; Sniderman, Brody,and Tetlock 1991; Lupia 1994). Furthermore, at the aggregate level, theseindividual “errors” are not random; they do not cancel each other out; theyare systematic. This means that actual collective preferences do not corre-spond to hypothetical preferences of the same population if it were fullyinformed. For example, American presidential incumbents receive about 5percentage points more, on average, than they would under full informa-tion, while Democrat presidential candidates do about 2 percentage pointsbetter (Bartels 1996).3 Thus, the aggregationist claims are not vindicated(Miller 1986; Lahda 1992; Page and Shapiro 1992).
The evidence concerning heterogeneity in decision outcome iscongruous. Statistical simulations that apply the behavior of the most in-formed to all individuals (Bartels 1996; Althaus 1998) and quasi-experi-ments that deliberately increase subjects’ level of information (Luskin,Fishkin, and Jowell 2002) both yield informed political preferences thatdiffer from real preferences in comparable ways. Moreover, one study thatuses both techniques on the same data uncovered similar “biases” in publicopinion attributable to information deAciency (Sturgis 2003).
Beyond their common focus on interpersonal diversity, there is, I be-lieve, a strong link between the two types of heterogeneity. People of iden-tical proAles except for their levels of political information do not have thesame opinions because they rely on different considerations that do not alllead as effectively to the same judgment. Heterogeneity in the process of de-cision making is a necessary (but not sufAcient) condition for heterogeneity
Impact of Campaigns 47

in the outcome of decision. Thus, similar citizens who reason differentlyabout politics will not necessarily reach different decisions; they may stillget to the same choice. However, divergent decisions cannot occur with-out the presence of heterogeneity in process. The causal sequence followsthe following form: reliance on considerations of varying efAciency en-courages the emergence of individual deviations from informed behavior,which, in turn, are generally not nulliAed by the aggregation of opinionsand translate into collective preferences that differ from hypothetical fullyinformed preferences.4
Two questions emerge at this point: (1) What happens to the level ofheterogeneity in process during electoral campaigns? and (2) What happensto the level of heterogeneity in outcome during campaigns? I now pondereach of these questions, potential answers, and plausible explanations.
Heterogeneity in Decision Making
Postelection data reveal that citizens with differing levels of informationdo not end up with the same structures of vote determinants ( Johnston etal. 1996b). Preelection data also indicate a signiAcant quantity of hetero-geneity (Rivers 1988). However, these studies use different methods todocument the existence of heterogeneity, so their results are not compar-able.5 Thus, we know that different decision rules exist before and after theelection, but whether any movement occurs in the level of heterogeneityin process during the campaign remains to be determined. Three scenariosare possible: divergence, convergence, and stability.
First, in the divergence scenario, differences in decision rules maybe magniAed by political campaigns. Disparities in exposure or sensitivityto campaign messages may prompt groups of contrasting levels of informa-tion to move away from one another. The literature on agenda setting,framing, and priming, by establishing a relationship between political in-formation and the susceptibility to mass media inBuence, contains evi-dence that suggests that increasing heterogeneity is a viable scenario. Sur-vey and experimental studies indicate that politically sophisticated citizensare more prone to modify their priorities and considerations according tothe attention allocated to the issues by the media (MacKuen 1984; Hill1985; Krosnick and Brannon 1993; Nelson, Oxley, and Clawson 1997;Miller and Krosnick 2000).6 If the dominant coverage points to issues andconsiderations that diverge from the structure of vote determinants used
48 Capturing Campaign Effects

by the less informed, then the gaps between informed and uninformed in-dividuals should accentuate.
The literature on the dissemination of information also lends cre-dence to the divergence scenario. Most notably, Tichenor and his associ-ates (1970) found empirical support for the knowledge gap hypothesis: “Asthe infusion of mass media information into a social system increases, seg-ments of the population with higher socioeconomic status tend to acquirethis information at a faster rate than the lower status segments, so that thegap in knowledge between these segments tends to increase rather thandecrease” (159–60). The knowledge gap hypothesis has also been vali-dated, to a limited extent, in the political realm (Moore 1987; Holbrook2002). However, unequal levels of motivation to acquire the informationappear to be a necessary condition for broadening gaps (Tichenor et al.1973; Ettema, Brown, and Luepker 1983; Kwak 1999). The question istherefore whether the electoral process generates equal levels of motiva-tion. Studies indicate that citizens experience varying levels of interest inand attention to political activities and that campaigns have little aggregateimpact on these attitudes (Lazarsfeld, Berelson, and Gaudet 1944; Berel-son, Lazarsfeld, and McPhee 1954). Thus, widening political knowledgegaps are possible. Would they translate into increasingly divergent struc-tures of vote determinants? There are indications that the learning, discus-sion, and thought induced by a deliberative poll increase the attitude con-straint advantage of the more informed over the less informed (Sturgis,Roberts, and Allum 2003). Thus, widening knowledge gaps during a cam-paign could translate into widening differences in decision rules.
In the second scenario—convergence—political campaigns reducethe level of heterogeneity. There are three plausible paths to convergence.(1) Everybody learns what the election is about, what the driving issues are,and on what considerations their voting decision should be based. This pathis consistent with the idea that mass communications, most notably televi-sion, have a “mainstreaming” effect on public opinion: uniform coveragecultivates common outlooks (Morgan and Signorielli 1990; Gerbner et al.1994). In this case, simpliAed and consensual media coverage of campaignscould serve to minimize the differences between groups, leading them tomove toward one another, converging on a more uniAed decisional process.(2) The less informed learn with the unfolding of the campaign what oth-ers already know (about issue positions, leader evaluations, and so forth),and they zero in on the consensual decision process. This path could be
Impact of Campaigns 49

labeled a sophistication-dependent Gelman and King conception (1993)where only a portion of the public, the less knowledgeable, experiences theactivation of enlightened preferences. (3) Campaign events and coveragepush the most informed, since they are more attentive to new information(Zaller 1992; Price and Zaller 1993) and more sensitive to media effects(Nelson, Oxley, and Clawson 1997; Miller and Krosnick 2000), toward astructure of vote ingredients already adopted by the less knowledgeable.
Finally, in the stability scenario, the level of heterogeneity in pro-cess might be unaffected by political campaigns. If campaigns do not carrymuch information to anyone, or similar amounts of information to every-one, and if they do not modify the public’s electoral agenda, two quite im-probable assertions in light of the research cited previously, then the levelof heterogeneity may remain the same.
Heterogeneity in Decision Outcome
People of different information levels do not think similarly about politicsand do not reach the same voting decision. These individual “errors” trans-late into “biased” collective preferences (Bartels 1996; Luskin, Fishkin, andJowell 2002). But what is the role of campaigns in this process? Classicaldemocratic theory expects campaigns to be a forum for debate about poli-cies, ideas, and leadership, a debate that exposes the electorate to themajor alternatives competing for government, that allows voters to learnabout them, compare them, and deliberate on their respective value. Infact, previous evidence of learning is vast and somewhat diverse. Duringcampaigns, citizens gain knowledge about parties, candidates, and inter-venors, notably their stance on the major issues of the day; about the na-ture of referendum proposals; and about the electoral viability of competi-tors (Bartels 1988; Johnston et al. 1992, 1996b). Furthermore, campaignsactivate citizens’ political predispositions, indicating that knowledge ac-quired is related to long-standing preferences and rendered relevant (Bar-tels 1988; Finkel 1993; Finkel and Schrott 1995; Gelman and King 1993;Johnston et al. 1992, 1996b).
Extending Bartels’s work on the deviations from informed votechoice to a dynamic perspective provides another way to determinewhether respondents exhibit behavior consistent with a conception ofcampaigns as a context of deliberation. Two questions are central. First,does the level of individual deviations from informed decisions move dur-
50 Capturing Campaign Effects

ing the progress of campaigns? Second, do campaigns affect the “biases” inaggregate preferences? If campaigns were conducive to substantial learningand reBection about political parties, candidates, and issues, then we wouldexpect early vote intentions to be marked by much more individual “errors”than Election Day choices. If the uninformed people’s capacity to emulatethe decision of the more informed improves with the progress of a cam-paign, individual deviations from informed decisions should decline. Apartfrom reducing individual deviations, learning may also translate, at the ag-gregate level, into less signiAcant deviations from full information collec-tive preferences.
The Study
To compare the levels of interpersonal diversity in decision making and indecision outcome present at each stage of the campaign, I need to measurethese phenomena. By my count, there are three methods one can employto expose heterogeneity. First, Douglas Rivers (1988) recommends the useof an econometric speciAcation that uses complete preference orders tocorrect for the presence of interpersonal heterogeneity in the estimation ofthe inBuence of ideology and partisanship on vote choice. This methodaccounts for the presence of heterogeneity, but it does not easily provideassessments of the magnitude of heterogeneity in decision making, nordoes it enable estimation of individual and aggregate deviations from in-formed decisions.
The second method, the most frequently used, involves splittingthe population into separate subgroups according to information and esti-mating a separate explanatory model for each group.7 Since it produces adifferent set of coefAcients for each subgroup, this method allows us to di-rectly exhibit differences in parameter strength and to examine any move-ment in the level of heterogeneity in process during the campaign. How-ever, since the effects of information are not integrated into a single model,this method cannot estimate the total impact and signiAcance of hetero-geneity nor individual and aggregate deviations from informed opinions.
The third method is proposed by Bartels (1996): an interactive formwhere the information scale and its reverse interact with every explanatoryvariable, thereby producing high and low information sets of coefAcientsin the same model. This technique allows us to measure the differences in model At between a heterogeneity-sensitive setup and a traditional
Impact of Campaigns 51

homogeneous design and the individual and aggregate consequences oflow information. Unfortunately, due to the less than straightforward speci-Acation (each respondent’s behavior is a weighted function of the high andlow information sets of coefAcients), analysis of movement in the magni-tude of heterogeneity in process is quite difAcult. Moreover, this methodrestricts the effects of information to be linear, an assumption that is theo-retically and empirically problematic (Zaller 1992). Bartels acknowledgesthis point but argues that experimentation with alternative monotonic andnonmonotonic speciAcations did not improve the At of the model in thecase of presidential voting in the United States (1996, 207–8). I believethat a more Bexible setup that permits the coexistence of linear and non-linear effects eliminates the necessity to test alternative speciAcations byallowing information effects to take various forms in the same model.
I propose a fourth method where three information dummy vari-ables (low, medium, high) interact with all independent variables. This spe-ciAcation is illustrated by the following equations:
Homogeneous model:
Y � a � b1(If) � b1(Xa) � b2(Xs) � b3(I1) � b4(I3) � e (1)
Heterogeneity in decision making:
Y � a � b1(I1 • Xa) � b2(I2 • Xa) � b3(I3 • Xa) � b4(Xs)
� b5(I1) � b6(I3) � e (2)
Heterogeneity in decision outcome:
Y � a � b1(I1 • Xs) � b2(I2 • Xs) � b3(I3 • Xs) � b4(I1)
� b5(I3) � e, (3)
where Y is either vote intention or reported vote; where I1, I2, and I3 arethree dummy variables (low, medium, and high information); where Xa is aset of attitudinal independent variables (such as party identiAcation, leaderevaluations, and issues positions); and where Xs is a set of sociodemo-graphic independent variables.8 Because of the binary nature of the de-pendent variables, the functional form is logistic.
52 Capturing Campaign Effects

This method combines the advantages of the previous two tech-niques. First, it estimates a distinct parameter structure for each informationgroup, hence replicating the straightforwardness of the sample-splittingtechnique in identifying differences in decision rules.9 Second, by integrat-ing all effects into a single model, this method allows us to measure the sig-niAcance of the contribution of the heterogeneous speciAcation over thehomogeneous design and to calculate variants of Bartels’s individual andaggregate deviations from full information. Furthermore, it permits nonlin-ear effects to coexist with linear ones. The decision to divide the distribu-tion into three tiers simpliAes the presentation and interpretation of results,and it allows multiple types of nonlinear effects to manifest themselves.
These equations will be used here to assess the level of heterogene-ity in three different ways: two of them dealing with heterogeneity inprocess and one relating to heterogeneity in outcome. First, I examine theheterogeneity captured by the total gaps between the parameters of eachattitude (b1–b3 of equation (2)). If homogeneity prevails, if every citizenrelies on the same considerations similarly, then the gaps between param-eters should be small, even nonexistent. In contrast, if there are importantinterpersonal differences in decision making, then large parameter gapsshould be encountered. Since logistic coefAcients use a noninterpretablescale, I rely on Arst differences—the gain in the probability of voting for Xproduced by a variable as it moves from one end of its scale to the oppo-site end. Each Arst difference was calculated as the difference between twopredicted values: one where the manipulated variable is set at its lowestlevel and all other variables remain unchanged and another where the ma-nipulated variable is set at its highest level and all other variables are un-changed. To assure that all forms of interpersonal differences in parameterstrength are captured by the measure, I estimate the gaps between all grouppairings. For instance, to measure the variation in the impact of party iden-tiAcation on vote choice, I tally the gaps in party identiAcation (PID) Arstdifferences between the low and medium information groups, between thelow and high, and between the medium and high. The absolute values ofthe gaps were then summed for all independent variables in each model.Finally, in order to compare the gaps across different campaign periodsamples, I adjust for variation in the mean of the dependent variable by di-viding each model’s total gaps by the period’s average vote share.10
Second, I look at the improvement in model At provided by the in-teractive model (equation (2)) over the basic homogeneous model (equation(1)). There should be a relationship between the level of heterogeneity in a
Impact of Campaigns 53

model and the power of the homogeneous explanatory model (where theimpact of each independent variable is constrained to be uniform). Ceterisparibus, high heterogeneity should lead to low model At. An average pa-rameter that does not accurately reBect the behavior of two differentgroups should lead to inefAcient predictions for both groups. Of course, aheterogeneity-sensitive speciAcation would correct for the interpersonalvariation and generate more accurate predictions. So, the greater the dif-ferences in decision rules, the larger the model improvement of the inter-active setup should be over the homogeneous speciAcation. A log-likeli-hood ratio test is employed to ascertain the signiAcance of the contributionof the information interactive terms. To compare across different campaignperiod samples, the standardized difference in log-likelihood is also re-ported (where each log-likelihood is divided by the number of cases andthe mean of the dependent variable).
The third analysis concerns diversity in decision outcome. It deter-mines whether individuals’ actual voting preferences coincide with the pref-erences they would have possessed had they been fully informed. Follow-ing Bartels’s lead (1996), high information behavior is applied to the entirepopulation on the grounds of similar sociodemographic variables only. Twostatistics are produced for each model: an individual and an aggregate devi-ation from informed opinions. Individual and aggregate deviations are op-erationalized as the difference between each respondent’s predicted valuefrom the complete sociodemographic model (equation (3)) and the corre-sponding predicted value computed from the high information set of coefA-cients (b3 of equation (3)). Instead of calculating deviations from a hypo-thetical condition where all the electorate is perfectly informed (Bartels1996), I estimate deviations from a hypothetical situation where everybodybehaves as the top third of the information distribution, a less dramatic butmore plausible scenario. An average deviation (the mean of all absolute de-viations) exposes the average individual difference in behavior attributableto low information, while an aggregate deviation (the mean of all signed de-viations) reveals the departure of the entire electorate’s actual preferencefrom the hypothetical high information preference. Since information is avaluable resource that “assists citizens in discerning their individual andgroup interests, in connecting their interests to broader notions of the pub-lic good, and in effectively expressing these views through political partic-ipation,” then informed opinions constitute more enlightened opinions(Delli Carpini and Keeter 1996, 1; Bartels 1996; Fishkin 1991, 1997; Luskin,
54 Capturing Campaign Effects

Fishkin, and Jowell 2002). Consequently, individual and aggregate devia-tions from informed opinions can be considered individual errors and aggre-gate biases attributable to low information.
There are problems with comparing people based only on theirsociodemographic characteristics. Two individuals with similar socio-demographic proAles could still have different priorities and different in-terests. However, using attitudes would be even more problematic. AsBartels notes, attitudes “may themselves be affected by levels of politicalinformation, rendering problematic any imputation of vote choices frommore informed people to less informed people with the same measuredattitudes. By contrast, since demographic and social characteristics . . .are essentially Axed, they provide a Armer base for imputing the hypo-thetical ‘fully informed’ voter choices of less informed people from theobserved choices of more informed people with similar characteristics”(1996, 208).
The analyses rely on the Canadian Election Studies of the 1988,1993, and 1997 federal elections. Each of these is a two-wave panel study:one campaign rolling cross-section telephone interview and one postelec-tion telephone reinterview. Since the analysis requires the production ofseveral voting models, identical in structure, each spanning a distinct por-tion of the campaign; the campaign rolling cross-section surveys are essen-tially treated as a series of three cross-sectional surveys covering differentperiods of the campaign. Because each day’s sample is a separate replicate,this is totally justiAed. Each campaign was simply divided into three equalportions.11 I can therefore compare the levels of heterogeneity present atfour points in time: in each third of the campaigns and in the postelectiondata.
The models contain a wide range of independent variables: partisanidentiAcation and leader evaluations, along with an election-speciAc set ofpolitical values and issue positions.12 Based on the variables used by the co-investigators of the Canadian Election Studies (Johnston et al. 1992, 1996a;Nevitte et al. 2000), these lists were limited to items measured during thecampaign in order to avoid postelectoral rationalization. Besides PID andleader ratings, the 1988 set includes the free trade agreement, feelings to-ward the French, ties with the United States, the power of unions, the levelof taxation and services, the Meech Lake constitutional agreement, govern-ment honesty, immigration, and abortion. The 1993 models contain feel-ings toward racial minorities, feelings toward the French, moral traditional-
Impact of Campaigns 55

ism, the power of unions, continentalism, macroeconomic policy, and thewelfare state. The 1997 set incorporates regional alienation, feelings to-ward Quebec, feelings toward racial minorities, political cynicism, moraltraditionalism, tax cuts, deAcit reduction, government job creation, youngoffenders, and immigration. The array of independent variables will allowvarious forms of interpersonal variation in parameter strength to shinethrough. The list of sociodemographic characteristics is constant acrossmodels: region, gender, age, ethnic background, marital status, religion,education, income, union membership, employment status, and public sec-tor employment.
The central concept, political information, is operationalized by adifferent indicator in each data set. I sought measures of general factualknowledge about politics (Luskin 1987; Fiske, Lau, and Smith 1990; Zaller1990; Delli Carpini and Keeter 1993). The 1988 election models rely on aseven-item index of knowledge of party placements and local candidates.13
For 1993, a six-item index of awareness of the major parties’ main electionstands is employed.14 For 1997, I use a seven-item index of informationabout four general facts and three party campaign promises.15 From eachindex, a dummy variable was created for each third of the resulting distri-butions (low, medium, and high information). These three dummy vari-ables interact with all attitudes in equation (2) and all sociodemographicvariables in equation (3).
Finally it should be noted that the analyses of 1993 and 1997 arelimited to the non-Quebec sample.16
The Results
Heterogeneity in Decision Making
First tackled is movement of heterogeneity in process during campaigns.Table 1 reports the results of both equation (1) (homogeneous model) andequation (2) (heterogeneity in decision-making model) at each time pointfor one of the models: support for the incumbent Liberal Party in our mostrecent data set (1997). First differences based on the logistic regressionsare presented. Each Arst difference indicates the actual effect of the inde-pendent variable on that information subgroup’s vote choice. There is noneed to take into account the other parameters (as is the case when inter-active terms are coupled with main effects). When the three Arst differ-
56 Capturing Campaign Effects

ences of an attitude are identical, then that variable has the same impactamong all levels of information.
Table 1 contains plenty of examples that the presumption of homo-geneity often leads to inaccurate explanatory models that, by estimatingthe behavior of the “average” citizen, systematically misconceive the be-havior of informed and uninformed citizens. Most subgroups’ parametersare weaker, stronger, or contrary to the parameters of the conventional ho-mogeneous estimation. And many differences between information sub-groups are statistically signiAcant.17 In some cases, the relationships simplyvary linearly in strength across the groups. For instance, in the Arst portionof the campaign, the impact of party identiAcation increases as informationclimbs: the effect is strongest among the more informed and weakestamong the less informed.18 But some variables suffer from even greater in-consistency, and the averaging effect of homogeneous parameters cancompletely mask the subgroups’ true relationships. If two correlations ofsimilar strength work in opposite directions, one positive and one negative,then the homogeneous parameter estimate can overestimate the relation-ship of some voters, underestimate the relationship of other voters, and ef-fectively apply to very few individuals. Even worse, the average parametercan lead to the conclusion that there is no relationship at all. For instance,in the Arst third of the campaign (period 1), regional alienation, feelingstoward Quebec, and feelings toward racial minorities all have contrary ef-fects among some groups that are obscured by the homogeneous design.Attitudes toward minorities are strongly and positively related to thechoice of the less informed (.29) but slightly negatively correlated to thedecision of the medium and high information subgroups (.03, .06). Thisvariable’s homogeneous parameter cancels out these reverse patterns anddelivers a barely positive and not statistically signiAcant effect (.02).
Is there any change in the level of heterogeneity in decision makingover the campaign? There are large parameter differences at each timepoint. So the information subgroups clearly possess different structures ofvote determinants both at the beginning and the end of the campaign, in-dicating that the campaign did not create heterogeneity out of thin air.There is support for convergence (for example, regional alienation), diver-gence (for example, tax cuts), and stability (for example, immigration). Thedifferences in reliance on regional alienation were substantially reducedduring the course of the campaign. In contrast, the tax cut issue displays
Impact of Campaigns 57

TA
BLE
1.H
omog
eneo
usan
dH
eter
ogen
eous
Mod
els,
1997
Libe
ralS
uppo
rt(fi
rst
diffe
renc
esof
logi
stic
coef
ficie
nts)
Hom
ogen
eous
Mod
els
Het
erog
eneo
usM
odel
s
Peri
od1
Peri
od2
Peri
od3
Vot
eIn
fo.
Peri
od1
Peri
od2
Peri
od3
Vot
e
Part
yid
enti
ficat
ion
.52*
**.4
0***
.48*
**.3
4***
Low
.33*
**.4
7***
.49*
**.3
7***
Med
.51*
**.3
0***
.50*
**.2
4***
Hig
h.6
0***
.27*
**.2
4***
.29*
**Le
ader
eval
uati
on.6
1***
.56*
**.4
2***
.38*
**Lo
w.3
7***
.45*
**.3
5***
.42*
**M
ed.6
5***
.72*
**.2
4**
.36*
**H
igh
.58*
**.4
9***
.64*
**.5
2***
Reg
iona
lalie
nati
on�
.02
�.0
6�
.06
�.0
3Lo
w.1
1�
.10
�.1
3�
.06
Med
�.1
0*�
.18*
**�
.07
�.0
2H
igh
.08
.00
.03
�.0
4Fe
elin
gfo
rQ
uebe
c�
.07
�.0
3.0
4.0
4Lo
w.0
1�
.14*
.14
�.0
3M
ed�
.05
�.0
9�
.07
.10*
*H
igh
�.1
4*.1
3.0
5.0
2Fe
elin
gfo
rm
inor
itie
s.0
2.0
4�
.02
.05
Low
.29*
**.2
1**
�.1
4*.1
1M
ed�
.03
�.0
9.0
8�
.01
Hig
h�
.06
.02
.02
.07
Cyn
icis
m�
.12
�.2
9***
�.1
2*�
.18*
**Lo
w�
.15
�.3
0***
�.1
5�
.16*
*M
ed�
.13
�.2
4**
.06
�.1
5**
Hig
h�
.13
�.1
1�
.25*
*�
.09

Mor
altr
adit
iona
lism
.02
.04
.02
�.0
3Lo
w.0
9�
.02
.05
�.0
4M
ed�
.02
�.0
3.0
1�
.04
Hig
h�
.03
.14*
�.0
6�
.02
Tax
cuts
�.1
4***
�.0
6�
.07
�.0
4Lo
w�
.18*
*�
.04
.02
.11*
Med
�.0
5�
.06
�.2
1***
�.1
0*H
igh
�.2
8**
�.0
3�
.04
�.0
6D
efici
tre
duct
ion
.00
.06
.06
.09*
**Lo
w�
.01
�.0
1�
.16*
*�
.04
Med
�.0
7.1
3.0
4.1
3**
Hig
h.1
2.0
6.3
6***
.20*
**G
over
nmen
tjo
bcr
eati
on.0
7�
.02
�.0
4�
.02
Low
.04
�.0
5�
.05
�.2
0***
Med
�.0
4.0
9�
.05
.11
Hig
h.2
6�
.06
�.0
6�
.03
Tou
ghw
ith
youn
gof
fend
ers
.05*
.06*
*�
.01
.05*
*Lo
w.0
0�
.01
�.0
2.0
2M
ed.0
6.0
6�
.03
.10*
**H
igh
.12
.10*
.08
.00
Mor
eim
mig
rati
on.0
4.0
0.0
2.0
0Lo
w�
.01
.05
.16*
�.0
5M
ed.0
9.0
1�
.03
.00
Hig
h.0
0�
.02
.03
.07
Num
ber
ofca
ses
728
855
889
1,99
172
885
588
91,
991
Log-
likel
ihoo
d56
0.6
639.
773
1.4
1,78
4.7
524.
559
8.9
661.
61,
742.
6T
otal
para
met
erga
ps4.
74.
15.
43.
2
Not
e:C
onst
ant
and
soci
odem
ogra
phic
cont
rols
not
repo
rted
.**
*p�
.01
**p
�.0
5*p
�.1

greater interpersonal differences in parameter strength after the electionthan earlier in the campaign. Finally, immigration was marked by similaramounts of heterogeneity both in period 1 and after the election. All in all,however, the main story seems to be one of modest convergence. An eye-ball estimate suggests that about half of the variables experience conver-gence and close to half of the others encounter stability. Rare are the occur-rences where parameter diversity is actually accentuated by the progress ofthe campaign.
To examine this evidence more systematically for all decision mod-els, the analysis only concentrates on summary results of the three empiri-cal tests introduced earlier. Table 2 reports the total gaps in Arst differencesfor all models.19 If information is irrelevant for decisional processes, if vot-ing structures are homogeneous, the gaps in parameter strength should ex-hibit very small values. Inversely, the presence of heterogeneity should bemarked by gaps of signiAcant size. Although this is a crude summary mea-sure, it corroborates the subjective interpretation of table 1. The total of allparameter gaps for 1997 Liberal support and the more appropriate measurethat controls for size of the vote share also manifest a decrease in the levelof heterogeneity. The postelection measure is lower than at any point in thecampaign. The other decisions tend to exhibit a similar pattern: hetero-geneity exists early and late but declines as the campaign unfolds. As the av-erage adjusted gaps illustrate (at the bottom of the table), there are differ-ences between the less, the moderately, and the more informed in thestrength of decision determinants throughout the campaign, and movementin the level of heterogeneity is generally toward convergence. Thus, thecampaign diminished, though it did not eradicate, the gaps in decision rulesbetween information groups.
Sometimes, the decrease is not linear. For instance, Liberal supportin 1993 shows no decrease in adjusted gaps during the Arst three periods.A real drop in heterogeneity only occurs in the postelection data. In somecases, there are large jumps in heterogeneity during certain periods of thecampaign. Notably, Liberal support in 1997 displays a leap in parametergaps during the third period. But, ultimately, in all cases except for 1993Conservative support, the magnitude of diversity in decision rules is lowerafter the election than at any other point. I will return to this issue of non-incremental convergence in the next section.
Next, I examine movement during the campaigns in the relevance ofheterogeneity in decision making by analyzing the model At improvement
60 Capturing Campaign Effects

TABLE 2. Dynamics of Total and Adjusted Gaps in Parameter Strength during Campaigns
Campaign Vote IntentionsPostelection
First Third Second Third Last Third Reported Vote
1988 Conservative supportTotal gaps 3.5 2.9 3.9 2.1Adjusted gaps 8.9 8.8 10.5 5.0
1988 Liberal supportTotal gaps 5.2 2.8 3.4 2.1Adjusted gaps 27.8 9.4 11.8 8.5
1988 NDP supportTotal gaps 3.6 3.2 2.5 1.2Adjusted gaps 19.5 17.8 15.3 7.3
1993 Conservative supportTotal gaps 4.1 3.3 3.2 2.6Adjusted gaps 15.5 16.3 17.8 20.6
1993 Liberal supportTotal gaps 2.8 3.2 3.8 2.1Adjusted gaps 7.9 8.2 9.8 5.2
1993 NDP supportTotal gaps 3.3 7.1 2.5 1.9Adjusted gaps 41.6 88.3 38.8 27.2
1993 Reform supportTotal gaps 4.0 4.1 2.8 2.4Adjusted gaps 31.2 23.0 11.2 10.4
1997 Conservative supportTotal gaps 6.7 4.9 5.3 3.3Adjusted gaps 43.0 29.8 32.8 24.5
1997 Liberal supportTotal gaps 4.7 4.1 5.4 3.2Adjusted gaps 12.8 12.7 16.0 10.4
1997 NDP supportTotal gaps 5.1 4.6 4.1 2.7Adjusted gaps 46.4 44.7 38.0 26.0
1997 Reform supportTotal gaps 4.9 5.0 4.0 3.7Adjusted gaps 33.2 27.9 20.3 16.0
Average total gaps 4.3 4.1 3.7 2.5Average adjusted gaps 26.2 26.1 20.2 14.7

provided by the interactive model (equation (2)) over the basic model whereall independent variables have a homogeneous impact for all citizens (equa-tion (1)). Table 3 reports the difference in log-likelihood of each decision’stwo models (the homogeneous and the heterogeneous) for each period ofthe campaigns. The statistical signiAcance of the differences was obtainedfrom log-likelihood ratio tests. The table also presents the adjusted measurethat permits comparison of each model across the four periods. The adjustedstatistic is the difference between log-likelihoods that were divided by theaverage vote share and the number of cases of the period.
These results conArm the conclusions of the preceding test: conver-gence in voting decision rules. As campaigns proceed, the usefulness of po-litical information’s interactions to explain individual political behavior de-clines in all models. SigniAcant differences in model At are present withineach period, but the standardized differences tend to get smaller over time(see the average adjusted differences at the bottom of the table).
The decline is not always steady and uniform. Again, there is stabil-ity or even slight increases in heterogeneity for certain models during theArst three periods of the campaign. For example, 1997 Liberal and NewDemocratic Party (NDP) support shows a peak in model At improvementduring the third period of the campaign. But, again, the smallest level of het-erogeneity is found after the election among all models’ adjusted difference.
Heterogeneity in Decision Outcome
Campaigns produce decline in the level of heterogeneity in the decision-making process, as indicated by the movement in parameter gaps andmodel At improvement. Does the level of heterogeneity in decision out-come move as well during campaigns? Does the relative homogenizationof decision rules translate into smaller discrepancies from informed opin-ions? Does campaign learning and deliberation contribute to reduce the in-dividual error and collective biases in voting preferences? Table 4 reportsthe individual and aggregate deviations from high information behavior forall models at each point of the campaigns. Here, in keeping with the logicof knowledge gap analyses and allowing campaign dynamics to havemeaningful inBuences, actual behavior is compared to informed behaviorof the same period (rather than the alternative: postelection informed be-havior). Our focus is to ascertain whether the less informed are able tocatch up to the more knowledgeable and improve their ability to express
62 Capturing Campaign Effects
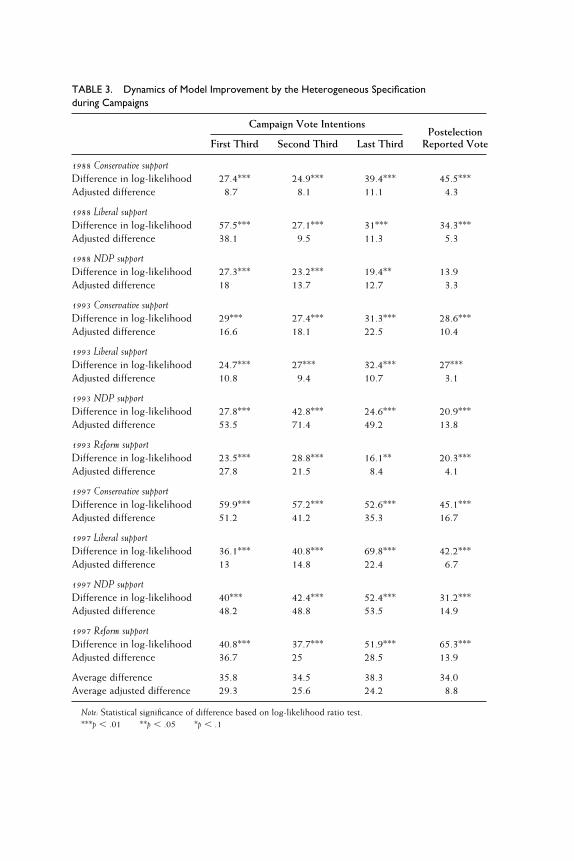
TABLE 3. Dynamics of Model Improvement by the Heterogeneous Specificationduring Campaigns
Campaign Vote IntentionsPostelection
First Third Second Third Last Third Reported Vote
1988 Conservative supportDifference in log-likelihood 27.4*** 24.9*** 39.4*** 45.5***Adjusted difference 8.7 8.1 11.1 4.3
1988 Liberal supportDifference in log-likelihood 57.5*** 27.1*** 31*** 34.3***Adjusted difference 38.1 9.5 11.3 5.3
1988 NDP supportDifference in log-likelihood 27.3*** 23.2*** 19.4** 13.9Adjusted difference 18 13.7 12.7 3.3
1993 Conservative supportDifference in log-likelihood 29*** 27.4*** 31.3*** 28.6***Adjusted difference 16.6 18.1 22.5 10.4
1993 Liberal supportDifference in log-likelihood 24.7*** 27*** 32.4*** 27***Adjusted difference 10.8 9.4 10.7 3.1
1993 NDP supportDifference in log-likelihood 27.8*** 42.8*** 24.6*** 20.9***Adjusted difference 53.5 71.4 49.2 13.8
1993 Reform supportDifference in log-likelihood 23.5*** 28.8*** 16.1** 20.3***Adjusted difference 27.8 21.5 8.4 4.1
1997 Conservative supportDifference in log-likelihood 59.9*** 57.2*** 52.6*** 45.1***Adjusted difference 51.2 41.2 35.3 16.7
1997 Liberal supportDifference in log-likelihood 36.1*** 40.8*** 69.8*** 42.2***Adjusted difference 13 14.8 22.4 6.7
1997 NDP supportDifference in log-likelihood 40*** 42.4*** 52.4*** 31.2***Adjusted difference 48.2 48.8 53.5 14.9
1997 Reform supportDifference in log-likelihood 40.8*** 37.7*** 51.9*** 65.3***Adjusted difference 36.7 25 28.5 13.9
Average difference 35.8 34.5 38.3 34.0Average adjusted difference 29.3 25.6 24.2 8.8
Note: Statistical significance of difference based on log-likelihood ratio test.***p � .01 **p � .05 *p � .1

their underlying interests. Evidence based on comparison with the post-election informed opinions would not directly speak to such concerns. Anyobserved weakening of deviations from postelection informed behaviorcould have been due to the most informed driving improvement in thequality of decisions and the less informed falling even further behind. Nev-ertheless, both reference points yield very similar dynamics of individualand aggregate deviations.
Individual deviations, the summary indicator of individual differ-ences between actual and informed behavior, have a propensity to decreasein all campaigns. Uninformed people tend to match the position of similarinformed people more effectively as time goes on. For instance, at the be-ginning of the 1988 campaign, being more informed changed each respon-dent’s probability of voting for the incumbent Conservative Party by an av-erage of over 16 percentage points.20 After the campaign, that value hadbeen cut in half. The trend of average individual deviations at the bottomof the table points to an overall decline of individual deviations as the elec-tion draws nearer. These data do not actually say people are getting to theright position with regards to their predispositions and beliefs. But, if weassume that informed preferences are more accurate, then the declining in-dividual deviations from high information are indicating that voters aremaking, on average, more enlightened choices as campaigns proceed.
In some cases, again, the evidence does not exhibit a steady reduc-tion in heterogeneity. The individual deviations experience sudden in-creases among the models of 1993 Liberal, 1997 NDP, and 1997 Reformsupport during the second or third campaign period. However, amongeach model, the postelection individual deviation is always lower than atany other moment.
The aggregate deviations, also in table 4, speak of the collective bi-ases of actual preferences with respect to hypothetical high informationpreferences. For instance, the Conservative score of 4.5 for the Arst thirdof the 1988 campaign signiAes that the actual level of support for this party(50.8 percent) was 4.5 percentage points higher than it would have beenin a hypothetical outcome where all voters behave like similar individualswith high levels of information (46.3 percent). If we assume that informedbehavior is more consistent with people’s latent interests, then hypotheti-cal high information preference could be labeled the more enlightenedcollective preference.
The results show that, in any election, some political parties are
64 Capturing Campaign Effects

TABLE 4. Dynamics of Individual and Aggregate Deviations from Informed Preferencesduring Campaigns
Campaign Vote IntentionsPostelection
First Third Second Third Last Third Reported Vote
1988 Conservative supportIndividual deviation 16.5 13.7 10.8 7.7Aggregate deviation 4.5 7.3 �5.2 3.7
1988 Liberal supportIndividual deviation 14.2 14.6 12.7 7.2Aggregate deviation 0.7 �3.1 7.0 �0.4
1988 NDP supportIndividual deviation 11.3 11.2 8.4 6.1Aggregate deviation �5.2 �4.2 �1.9 �3.3
1993 Conservative supportIndividual deviation 17.5 12.7 9.3 7.3Aggregate deviation �3.4 �5.1 1.2 �4.5
1993 Liberal supportIndividual deviation 18.7 13.3 17.1 10.0Aggregate deviation 5.7 0.8 �2.7 3.5
1993 NDP supportIndividual deviation 12.3 8.7 8.9 5.6Aggregate deviation �2.8 4.4 1.2 0.0
1993 Reform supportIndividual deviation 13.7 13.3 11.7 7.6Aggregate deviation 0.5 �0.1 0.3 1.1
1997 Conservative supportIndividual deviation 13.3 12.4 9.2 4.8Aggregate deviation 4.4 0.6 3.8 �0.3
1997 Liberal supportIndividual deviation 16.5 16.5 11.9 10.5Aggregate deviation �1.8 6.1 4.4 5.7
1997 NDP supportIndividual deviation 9.4 9.5 11.7 5.5Aggregate deviation �1.5 �0.5 �4.7 �2.0
1997 Reform supportIndividual deviation 9.2 10.8 11.2 7.9Aggregate deviation �1.1 �6.1 �3.5 �3.4
Average individual deviation 13.9 12.4 11.2 7.3Average absolute aggregate deviation 2.9 3.5 3.3 2.5

advantaged by the public’s lack of information, while others are disadvan-taged. These parties vary from one election to another. And, most impor-tant, the collective biases are relatively consistent over the course of thecampaigns.
In 1988, the aggregate deviations of the incumbent party, the Con-servatives, are positive in most periods. That party’s actual support isgreater than the support of a more informed electorate. The positive biasis slightly smaller in the postelection data (3.7 percentage points), but itis essentially the same size as when the campaign started. The incumbent’sgains from low information were at the expense of the NDP. The left-of-center party that Anished third in the race was systematically getting lesssupport than the enlightened preferences. On Election Day, it obtained 3.3percentage points fewer than what an informed citizenry would have con-ferred. The Liberal model exhibits inconsistent aggregate deviations dur-ing the campaign. But it concluded with a practically nil aggregate de-viation: authentic election preferences for the Liberals coincide with thehypothetical high information preferences.
In 1993, the party that beneAted from low knowledge Ave years ear-lier—the Conservatives—now had an unpopular incumbent whose for-tunes dwindled dramatically during the campaign; it lost over half its voteshare and the election (Johnston et al. 1992). Throughout these events, theuninformed were supporting the party less than they would have had theybeen informed. Despite the great volatility in vote intentions during thecampaign, low knowledge consistently led people to punish the Conserv-atives more than the knowledgeable in three periods out of four. Theyended up with 4.5 percentage points below what they would have receivedunder high information. It was the Liberals, who had established them-selves as the government in waiting, that beneAted. Ultimately, they gar-nered 3.5 percentage points more than the informed hypothetical scenario.Such a positive deviation was already evident in the Arst third of the cam-paign. The NDP and Reform aggregate deviations in the reported vote arebasically nonexistent. Some movement toward convergence may havetaken place with the NDP, but not with the Reform Party.
Had the population been more informed in 1997, the Liberal Partywould have won fewer votes than it did in reality (5.7 percentage pointsless). The incumbent governing party reaped the rewards of low informa-tion to the detriment of the two small off-center parties (left-wing NDPand right-wing Reform). Both of these parties would have fared better
66 Capturing Campaign Effects

under high information. They would have captured an extra 2 and 3.4 per-centage points, respectively. There is no clear indication that the aggregatedeviations signiAcantly decreased during this campaign. Throughout thecampaign periods, actual support for these parties does not correspond totheir hypothetical support under high information.
Incumbency seems to help take advantage of the public’s lack of in-formation, but only if the government is in good standing. In fact, the pos-itive aggregate biases of uninformed electorates appear to coincide with abandwagon conception rather than a blind incumbency advantage.21 Neg-ative biases tend to hurt the small parties.
These aggregate deviations reveal quite large departures of the ac-tual election outcomes from the hypothetical high information outcomes.But they do not signal that “illegitimate” election results have occurred.None of the hypothetical scenarios would have meant a reversal of the out-come. With a more informed electorate, the same government would havebeen elected in each election. Even the rankings of parties would have re-mained the same in each case. However, their potential signiAcance for thebalance of power and for close races should not be underestimated.
More to the point, the evidence does not substantiate the claim thatcampaigns allow aggregation to perform more effectively in canceling in-dividual errors and generating the fully informed preferences. Each model’sresults along with the summary average absolute aggregate deviations donot display a clear decline pattern. In contrast with the evolution of indi-vidual deviations, the collective biases in electoral preferences do notdwindle importantly during campaigns.
Discussion
Although the trend toward the reduction of heterogeneity in decisionmaking during campaigns is clear, many party models exhibit a suddensurge in interpersonal diversity at one point or another. These bumps ap-pear simultaneously in parameter gaps and model improvement statistics(tables 2 and 3). While this simultaneity provides validation that the indi-cators tend to measure the same basic phenomenon, it also suggests thatthese bumps are meaningful and deserve an explanation.
Most notably, we see the jumps in heterogeneity among 1988 Con-servative and Liberal support during the last third of the campaign; amongthe Conservatives, Liberals, and NDP during the second and third periods
Impact of Campaigns 67

of 1993; and among Conservative and Liberal support in the last portionof the 1997 campaign. Such instances demonstrate that campaigns oftendo not bring about a steady and uniform decline in heterogeneity. Howcan we account for the nonincremental nature of the decrease of interper-sonal diversity in these cases?
One thing is certain: these temporary surges in heterogeneity donot happen during Bat periods of the campaigns. They generally coincidewith instances of great volatility in vote intentions (see campaign dynam-ics in Johnston et al. 1992, 1996a; Nevitte et al. 2000). However, it is notjust a question of increased variance in the dependent variable, since thesurges also appear in the measures that control for the size of the voteshare. Moreover, some jumps in heterogeneity take place while a party islosing support. One could argue that levels of heterogeneity temporarilyescalate when there is an intense period of conversion and reevaluation ofvoting intentions among numerous parties, when uncertainty, doubt, andpossibly anxiety seize citizens. During such times of heightened attentionand sensitivity, the correlates of vote choice could become scrambled byvarious stimuli. I cannot verify the validity of this speculation with thepresent evidence.
Another puzzle concerns the postelection data. In all tables, hetero-geneity measures fall sharply when the reported vote is the dependent vari-able. Why are the post results so different from those of the end of the cam-paign? Could it be post hoc rationalization (Rahn, Krosnick, and Breuning1994); that is, people adjust their answers to the postelection wave ques-tions about the vote correlates to match how they marked their ballot? Be-cause all independent variables were captured in the campaign wave, thisaccount is not viable. Could it be panel attrition (Bartels 2000); that is,those who choose to take part in the second interview are different (theyhave a more similar set of decision correlates) from those who don’t? Actu-ally, nonpanel participants in the campaign models are rare, and analyseslimited to panel participants show the same heterogeneity dynamics. Couldit be panel conditioning (Bartels 2000); that is, panel participants were in-Buenced by the fact that they responded to an election survey to adopt amore homogeneous structure of vote correlates? Could it be that postelec-tion reported vote is fraught with misreporting (due to fading memory, thewish to support a winner, or the intervention of events since the vote tookplace) and that this misreporting is somehow correlated to initial hetero-geneity? Or could a true reduction of interpersonal diversity in decision
68 Capturing Campaign Effects

making really have occurred between the last third of the campaign andElection Day? Although unlikely, the last three accounts are possible. Thereis no way of determining with the data used here.
Thus, the exact source of the late plunge in interpersonal diversityin behavior remains ambiguous. Nevertheless, the conclusions of this studyhold regardless of whether the postelection data are reliable, since the de-cline in heterogeneity is apparent within the campaign data.
Conclusions
The analysis reveals that all three campaigns signiAcantly reduced the levelof heterogeneity among the electorate but that considerable amounts ofinterpersonal diversity still subsist after the campaigns. As campaigns pro-ceed, the discrepancies in decision rules between information groups di-minish; the usefulness of a heterogeneity-sensitive speciAcation in explain-ing individual voting behavior declines; and the ability of uninformedvoters to make decisions analogous to those of informed citizens with sim-ilar sociodemographic proAles increases. On most counts, the evidencesupports the notion that campaigns matter and that they do so by curtail-ing, but not eradicating, differences between voters with contrasting levelsof political information. Only the evidence about aggregate deviationsdoes not follow the same story; the collective biases in preferences are es-sentially unaffected by the unfolding of campaigns.
The signiAcant reduction in individual deviations from informedopinions highlights the critical importance of the democratic process. In-dividuals would not have made the same choices had they not experiencedthese campaigns; they would have made more “erroneous” choices. There-fore, campaigns promote the expression of more enlightened preferences.
How do political campaigns generate these declining trends of het-erogeneity? Obviously, patterns of learning and priming about contendersand issues could allow citizens to cut through the complex and conBictingrhetoric, to Agure out what the election and the competing options areabout, to connect each option to their own preferences and predisposi-tions, to decide in similar ways, and to gradually improve the quality oftheir decisions.
Alternatively, campaigns may simply be about overcoming voter ap-athy and inattentiveness and activating predispositions. Early on, peoplemay simply answer survey questionnaires indifferently and carelessly,
Impact of Campaigns 69

thereby introducing errors in responses (attitudes and intentions), errorsthat affect the relationships between independent and dependent variables,and the precision of explanatory models. As the deadline for decision ap-proaches and as parties and candidates increase their activity, citizens maybecome more seriously involved in the campaign, and their responses andbehavior may accordingly appear more thoughtful and more similar.
Although the evidence I gathered cannot totally disconArm eitherof these explanations, it seems to conform with a “campaigns matter be-cause they activate certain predispositions and not others and they providesome kinds of information and not others” approach rather than a “cam-paigns matter only in activating predispositions” approach. Examination ofall the models’ parameters (not reported here) suggests that all voters tendto move toward a particular structure of vote choice determinants (someless efAciently than others) rather than one or two information groupscatching up to other groups that had already Agured things out. The de-cline in heterogeneity therefore seems to follow the particular and uniquedynamics of campaign events and coverage rather than simply falling inline with an unavoidable underlying pattern or an inexorable simpliAcationof things, as the choice becomes imminent, that operates regardless of thelength of the campaign. Furthermore, the convergence is more consistentwith the expectations drawn from mass media “mainstreaming” than thoseextrapolated from the widening knowledge gap literature or the agenda-setting/framing/priming research.
APPENDIX: Variables in the ModelsThe 1988, 1993, and 1997 Canadian Election Studies questionnaires anddata can be obtained from the Canadian Election Study (www.ces-eec.umontreal.ca) and from the Inter-university Consortium for Political andSocial Research (www.icpsr.umich.edu).
1988Political information (h2b, h2c, h2d, h4b, h4c, h4d, xm2, xm3, xm4); cam-paign vote intentions (b1, b2, b3); reported vote (xb1, xb2); leader evalu-ations (d1a, d1b, d1c, d2a, d2b, d2c); party identiAcation (i1, i2); free tradeagreement (l2); Meech Lake constitutional agreement (14a); governmenthonesty (j1); feelings toward French (h1a); ties with United States (h2a);power of unions (h3); level of taxation and services (h4a); immigration (l3);abortion (16a); region (province); gender (rsex); age (n1); ethnicity (n15);
70 Capturing Campaign Effects

marital status (n2); religion (n11); education (n3); income (n19); unionmembership (n9); retired (n5); public sector employment (n5).
1993Political information (pese17a, pese18a, pese19a, pese20a, cpsg3a1,cpsg31b); campaign vote intentions (cpsa3, cpsa4); reported vote (pesa4);leader evaluations (d2a, d2b, d2c, d2d); party identiAcation (cpsm1, cpsm2);feelings toward racial minorities (cpsk3a); feelings toward French (antf_f1a);moral traditionalism (cpsg6a, cpsg6b, cpsg6c, cpsg7a, cpsg7b, cpsg7e);power of unions (cpsk1a); continentalism (cpsf2a, cpsl1, cpsl3); macro-economic policy (cps16a, cps19a, cps19b); welfare state (cps15a, cps15b,cps17b, cps17d, cps17e); region (cpsprov); gender (cpsrgen); age (cpsage);ethnicity (cpso13, refn13); marital status (cpso2); religion (cpso9); educa-tion (cpso3, refn2); income (cpso18, cpso18a); union membership (refn,cpsjob6); retired (cpsjob1); public sector employment (cpsjob1, cpsjob5).
1997Political information (cps16, cpsf13, cpsf14, cpsf15, cpsl11, cpsl12,cpsl13); campaign vote intentions (cpsa4); reported vote (pesa4); leaderevaluations (cpsd1a, cpsd1b, cpsd1c, cpsd1d, cpsdr1, cpsdr2, cpsdr3,cpdsr4); party identiAcation (cpsk1, cpsk2); regional alienation (cpsj12);feelings toward Quebec (cpse3a, cpsj3); feelings toward racial minorities(cpsf1, cpsj9, cpsj10); political cynicism (cpsb10d, cpsb10e, cpsb10a);moral traditionalism (cpsf2, cpsf3); tax cuts (cpsa2d); deAcit reduction(cpsa2b, cpsf5, cpsf8); government job creation (cpsf6, cpsf4, cpsa2c);young offenders (cpsj21); immigration (cpsj18); region (province); gender(cpsrgen); age (cpsage); ethnicity (cpsm13); marital status (cpsm2); reli-gion (cpsm10); education (cpsm3); income (cpsm16a); union membership(cpsm9); retired (cpsm4); public sector employment (cpsm4, cpsm7).
NOTESThis study beneAted from the Anancial support of the Fonds Québécois de laRecherche sur la Société et la Culture (FQRSC) and the Social Sciences and Hu-manities Research Council of Canada (SSHRC). I thank Michael Alvarez, AndréBlais, Henry Brady, Larry Bartels, Richard Jenkins, Richard Johnston, Simon Mc-Dougall, Paul Sniderman, and Stuart Soroka for their valuable comments and sug-gestions. The author is solely responsible for errors of analysis or interpretation.
1. While heterogeneity in decision making is generally interpreted as diversity
Impact of Campaigns 71

in decisional processes, it could also result from interpersonal differences in thelevels of measurement error, in the susceptibility to survey effects (wording, order-ing, and so forth), in the propensity to rationalize, and in the capacity to recall ac-curate information. However, it is beyond the scope of this essay to examine suchalternative explanations. I will therefore accept, for the purpose of this study, thecommon interpretation and treat process heterogeneity in voting models as an in-dication of divergent decision rules.
2. Some dissenting opinions exist. For instance, Wendy Rahn and her col-leagues argue that “the rich and often redundant Bow of political information in apresidential election year, combined with the relative simplicity of a choice be-tween two presidential candidates, leads to relatively similar assessment and deci-sional processes for most individuals” (Rahn et al. 1990, 137). Their model of can-didate appraisal showed only a few signs of heterogeneity: partisanship had aslightly greater impact on the decision of the less sophisticated, while ideologyhad a slightly greater impact for the more sophisticated. Goren (2004) also foundthat information does not systematically enhance the impact of domain-speciAcbeliefs and values on policy preferences.
3. Although the margins of victory would have been different, no winnerwould have lost under full information in the six presidential elections (1972–92)examined by Bartels.
4. This conjecture about the relationship between heterogeneity in processand heterogeneity in outcome will receive some credence if the analyses con-ducted herein show that the campaign dynamics of both types of heterogeneityfollow the same pattern.
5. In the other major study of heterogeneity (Sniderman, Brody, and Tetlock1991), the temporal location of the heterogeneity detected in voting models is notstipulated.
6. Some research shows that the effects of agenda setting and priming aregreater among the least informed or the least educated (Iyengar et al. 1984; Iyen-gar and Kinder 1987; Krosnick and Kinder 1990). However, these results may bedue to the fact that exposure and attention to media content were not controlled(Krosnick and Brannon 1993; Miller and Krosnick 2000).
7. Notable examples of this practice include Sniderman, Brody, and Tetlock1991 and Johnston et al. 1996b.
8. Two of the three dummy variables are included to capture the direct effectof information on vote choice.
9. In fact, the estimates of this interactive design are almost equivalent tothose produced by three separate estimations where the sample is split accordingto the three dummies. Slight differences are due to the single constant and the di-rect effects of information in the interactive design.
10. Otherwise, change in the variance of the dependent variable between peri-ods could artiAcially modify the level of heterogeneity.
11. For the 1988 models: October 4–19; October 20–November 4; November5–20. For the 1993 models: September 10–24; September 25–October 9; October10–24. For the 1997 models: April 27–May 8; May 9–20; May 21–June 1.
12. All variables and original data sources are found in the appendix.
72 Capturing Campaign Effects

13. That is, the parties’ relative positions regarding ties with the UnitedStates, the parties’ relative positions concerning the level of taxation and ser-vices, the local Conservative candidate, the local Liberal candidate, and the localNDP candidate.
14. That is, the party that promised to spend more on public works (Liberal),the party that promised to eliminate the deAcit in three years (Reform), the partythat promised to eliminate the deAcit in Ave years (Conservative), the party thatopposes NAFTA (NDP), the party that opposes the goods and services tax (GST)(Liberal/Reform), and the party that supports the GST (Conservative).
15. That is, the current president of the United States (Clinton), the currentprovincial premier, the Arst woman prime minister of Canada (Campbell), the cur-rent federal minister of Anance (Martin), the party that promised to lower incometax by 10 percent (Conservative), the party that promised to cut unemployment inhalf by 2001 (NDP), and the party that is against distinct society status for Que-bec (Reform).
16. That province would require separate analyses ( Johnston et al. 1996a,1996b; Nevitte et al. 2000; Blais et al. 2002). However, the number of Quebeccases cannot support the interactive speciAcation on three campaign period sub-samples.
17. The differences in parameter strength that are statistically signiAcant arenot reported here. These can be revealed by variants of equation (2), where onegroup’s interactions are replaced by the regular variables.
18. Note that, in the latter portions of the campaign, the weight of party iden-tiAcation tends to be greater among the less knowledgeable.
19. Again this is the sum of the absolute values of the gaps in Arst differencesbetween the low/medium, low/high, and medium/high information groups.
20. Since the most informed cannot move (they are the reference point for thesimulations), this number is an underestimation of the true effect among the lessinformed.
21. On the notion of bandwagon, see Gallup and Rae 1940; Simon 1954; Bar-tels 1988; McAllister and Studlar 1991; Nadeau, Cloutier, and Guay 1993; Goideland Shields 1994.
REFERENCESAlthaus, Scott L. 1998. “Information Effects in Collective Preferences.” American Po-
litical Science Review 92:545–58.Bartels, Larry. 1988. Presidential Primaries and the Dynamics of Vote Choice. Princeton:
Princeton University Press.———. 1992. “The Impact of Electioneering in the United States.” In Electioneering:
A Comparative Study of Continuity and Change, ed. D. Butler and A. Ranney. Oxford:Clarendon Press.
———. 1996. “Uninformed Votes: Information Effects in Presidential Elections.”American Journal of Political Science 40:194–230.
———. 2000. “Panel Effects in the American National Election Studies.” PoliticalAnalysis 8:1–20.
Berelson, Bernard R., Paul F. Lazarsfeld, and William N. McPhee. 1954. Voting: A
Impact of Campaigns 73

Study of Opinion Formation in a Presidential Campaign. Chicago: University of ChicagoPress.
Blais, André, Elisabeth Gidengil, Richard Nadeau, and Neil Nevitte. 2002. Anatomyof a Liberal Victory: Making Sense of the Vote in the 2000 Canadian Election. Peterborough:Broadview Press.
Delli Carpini, Michael X., and Scott Keeter. 1993. “Measuring Political Knowl-edge: Putting First Things First.” American Journal of Political Science 37:1179–206.
———. 1996. What Americans Know about Politics and Why It Matters. New Haven:Yale University Press.
Ettema, James S., James W. Brown, and Russell V. Luepker. 1983. “Knowledge GapEffects in a Health Information Campaign.” Public Opinion Quarterly 47:516–27.
Finkel, Steven E. 1993. “Reexamining the ‘Minimal Effects’ Model in Recent Pres-idential Campaigns.” Journal of Politics 55:1–21.
Finkel, Steven E., and Peter R. Schrott. 1995. “Campaign Effects on Voter Choicein the German Election of 1990.” British Journal of Political Science 25:349–77.
Fishkin, James S. 1991. Democracy and Deliberation: New Directions for Democratic Reform.New Haven: Yale University Press.
———. 1997. The Voice of the People: Public Opinion and Democracy. New Haven: YaleUniversity Press.
Fiske, Susan, Richard Lau, and Richard Smith. 1990. “On the Varieties and Utili-ties of Political Expertise.” Social Cognition 8:31–48.
Fournier, Patrick. 2000. “Heterogeneity in Political Decision-Making: The Nature,Sources, Extent, Dynamics, and Consequences of Interpersonal Differences inCoefAcient Strength.” PhD diss., University of British Columbia.
Franklin, Charles. 1991. “Eschewing Obfuscation? Campaigns and the Perceptionsof U.S. Senate Incumbents.” American Political Science Review 85:1193–214.
Gallup, George, and Saul Forbes Rae. 1940. “Is There a Bandwagon Vote?” PublicOpinion Quarterly 4:244–49.
Gelman, Andrew, and Gary King. 1993. “Why Are American Presidential ElectionCampaign Polls So Variable When Votes Are So Predictable?” British Journal ofPolitical Science 23:409–51.
Gerbner, George, Larry Gross, Michael Morgan, and Nancy Signorielli. 1994.“Growing Up with Television: The Cultivation Perspective.” In Media Effects: Ad-vances in Theory and Research, ed. J. Bryant and D. Zillmann, 17–41. Hillsdale, NJ:Lawrence Erlbaum Associates.
Goidel, Robert, and Todd Shields. 1994. “The Vanishing Marginals, the Band-wagon, and the Mass Media.” Journal of Politics 56:802–10.
Goren, Paul. 2004. “Political Sophistication and Policy Reasoning: A Reconsidera-tion.” American Journal of Political Science 48:462–78.
Hill, David. 1985. “Viewer Characteristics and Agenda Setting by TelevisionNews.” Public Opinion Quarterly 49:340–50.
Holbrook, Thomas M. 2002. “Presidential Campaigns and the Knowledge Gap.”Political Communication 19:437–54.
Iyengar, Shanto, and Donald Kinder. 1987. News That Matters. Chicago: Universityof Chicago Press.
Iyengar, Shanto, Donald Kinder, Mark D. Peters, and Jon A. Krosnick. 1984. “The
74 Capturing Campaign Effects

Evening News and Presidential Evaluations.” Journal of Personality and Social Psy-chology 46:778–87.
Johnston, Richard, André Blais, Henry E. Brady, Elisabeth Gidengil, and NeilNevitte. 1996a. “The 1993 Canadian Election: Realignment, Dealignment, orSomething Else?” Paper presented at the annual meeting of the American Polit-ical Science Association, San Francisco.
Johnston, Richard, André Blais, Elisabeth Gidengil, and Neil Nevitte. 1996b. TheChallenge of Direct Democracy: The 1992 Canadian Referendum. Montreal: McGill-Queen’s University Press.
Johnston, Richard, Henry Brady, André Blais, and Jean Crête. 1992. Letting the PeopleDecide: Dynamics of a Canadian Election. Kingston: McGill-Queen’s University Press.
Johnston, Richard, Michael G. Hagen, and Kathleen Hall Jamieson. 2004. The 2000Presidential Election and the Foundations of Party Politics. Cambridge: Cambridge Uni-versity Press.
Krause, George A. 1997. “Voters, Information Heterogeneity, and the Dynamics ofAggregate Economic Expectations.” American Journal of Political Science 41:1170–200.
Krosnick, Jon A., and Laura A. Brannon. 1993. “The Impact of the Gulf War on theIngredients of Presidential Evaluations: Multidimensional Effects of Political In-volvement.” American Political Science Review 87:963–75.
Krosnick, Jon A., and Donald R. Kinder. 1990. “Altering the Foundations of Pop-ular Support for the President through Priming.” American Political Science Review84:497–512.
Kuklinski, James H., and Norman L. Hurley. 1994. “On Hearing and InterpretingPolitical Messages: A Cautionary Tale of Citizen Cue-Taking.” Journal of Politics56:729–51.
Kuklinski, James H., and Paul J. Quirk. 2000. “Reconsidering the Rational Public:Cognition, Heuristics, and Mass Opinion.” In Elements of Reason: Cognition, Choice,and the Bounds of Rationality, ed. A. Lupia, M. D. McCubbins, and S. L. Popkin.New York: Cambridge University Press.
Kwak, Nojin. 1999. “Revisiting the Knowledge Gap Hypothesis: Education, Mo-tivation, and Media Use.” Communication Research 26:385–413.
Lahda, Krishna K. 1992. “The Condorcet Jury Theorem, Free Speech, and Corre-lated Votes.” American Journal of Political Science 36:617–34.
Lazarsfeld, Paul F., Bernard R. Berelson, and Hazel Gaudet. 1944. The People’s Choice.New York: Duell, Sloane, and Pierce.
Lupia, Arthur. 1994. “Shortcuts versus Encyclopedias: Information and Voting Be-havior in California Insurance Reform Elections.” American Political Science Review88:63–76.
Luskin, Robert C. 1987. “Measuring Political Sophistication.” American Journal of Po-litical Science 31:856–99.
Luskin, Robert, James Fishkin, and Roger Jowell. 2002. “Considered Opinions.”British Journal of Political Science 32:455–87.
MacKuen, Michael. 1984. “Exposure to Information, Belief Integration, and Indi-vidual Responsiveness to Agenda Change.” American Political Science Review 78:399–419.
Impact of Campaigns 75

McAllister, Ian, and Donley Studlar. 1991. “Bandwagon, Underdog, or Projection?Opinion Polls and Electoral Choice in Britain, 1979–1987.” Journal of Politics 53:720–41.
McKelvey, Richard D., and Peter C. Ordeshook. 1986. “Information, ElectoralEquilibria, and the Democratic Ideal.” Journal of Politics 48:909–37.
Miller, Johanne M., and Jon A. Krosnick. 2000. “News Media Impact on the Ingre-dients of Presidential Evaluations: Politically Knowledgeable Citizens AreGuided by a Trusted Source.” American Journal of Political Science 44:295–309.
Miller, Nicholas R. 1986. “Information, Electorates and Democracy: Some Exten-sions and Interpretations of the Condorcet Jury Theorem.” In Information Poolingand Group Decision Making, ed. B. Grofman and G. Owen. Greenwich: JAI Press.
Moore, David W. 1987. “Political Campaigns and the Knowledge-Gap Hypothe-sis.” Public Opinion Quarterly 51:186–200.
Morgan, Michael, and Nancy Signorielli. 1990. “Cultivation Analysis: Conceptu-alization and Methodology.” In Cultivation Analysis: New Directions in Media EffectsResearch, ed. N. Signorielli and M. Morgan, 13–34. Newbury Park: Sage.
Nadeau, Richard, Édouard Cloutier, and Jean H. Guay. 1993. “New Evidence aboutthe Existence of a Bandwagon Effect in the Opinion Formation Process.” Interna-tional Political Science Review 14:203–13.
Nelson, Thomas E., Zoe M. Oxley, and Rosalee A. Clawson. 1997. “Toward a Psy-chology of Framing Effects.” Political Behavior 19:221–46.
Nevitte, Neil, André Blais, Elisabeth Gidengil, and Richard Nadeau. 2000. UnsteadyState: The 1997 Canadian Federal Election. Toronto: Oxford University Press.
Norris, Pippa, John Curtice, David Sanders, Margaret Scammel, and Holli A.Semetko. 1999. On Message: Communicating the Campaign. London: Sage.
Page, Benjamin I., and Robert Y. Shapiro. 1992. The Rational Public. Chicago: Uni-versity of Chicago Press.
Popkin, Samuel. 1991. The Reasoning Voter. Chicago: University of Chicago Press.Price, Vincent, and John Zaller. 1993. “Who Gets the News: Measuring Individual
Differences in Likelihood of News Reception.” Public Opinion Quarterly 57:133–64.
Rahn, Wendy M., John H. Aldrich, Eugene Borgida, and John L. Sullivan. 1990. “ASocial-Cognitive Model of Candidate Appraisal.” In Information and DemocraticProcesses, ed. J. Ferejohn and J. Kuklinski, 136–59. Urbana: University of IllinoisPress.
Rahn, Wendy, Jon Krosnick, and Marijke Breuning. 1994. “Rationalization and De-rivation Processes in Survey Studies of Political Candidate Evaluations.” AmericanJournal of Political Science 38:582–600.
Rivers, Douglas. 1988. “Heterogeneity in Models of Electoral Choice.” AmericanJournal of Political Science 32:737–57.
Simon, Herbert. 1954. “Bandwagon and Underdog Effects and the Possibility ofElection Predictions.” Public Opinion Quarterly 18:245–53.
Sniderman, Paul M., Richard A. Brody, and Philip E. Tetlock. 1991. Reasoning andChoice: Explorations in Political Psychology. Cambridge: Cambridge University Press.
Stimson, James A. 1975. “Belief Systems, Constraint and the 1972 Election.” Amer-ican Journal of Political Science 19:393–417.
76 Capturing Campaign Effects

Sturgis, Patrick. 2003. “Knowledge and Collective Preferences: A Comparison ofTwo Approaches to Estimating the Opinions of a Better Informed Public.” Soci-ological Methods and Research 31:453–85.
Sturgis, Patrick, Caroline Roberts, and Nick Allum. 2003. “A Different Take on theDeliberative Poll: Information, Deliberation and Attitude Constraint.” Paperpresented at the annual meeting of the American Association of Public OpinionResearch, Nashville, Tennessee.
Tichenor, P. J., G. A. Donohue, and C. N. Olien. 1970. “Mass Media and Differen-tial Growth in Knowledge.” Public Opinion Quarterly 34:158–70.
Tichenor, P. J., J. M. Rodenkirchem, C. N. Olien, and G. A. Donohue. 1973.“Community Issues, ConBict and Public Affairs Knowledge.” In New Models forCommunication Research, ed. P. Clarke. Beverly Hills: Sage.
Zaller, John R. 1990. “Political Awareness, Elite Opinion Leadership, and the MassSurvey Response.” Political Cognition 8:125–53.
———. 1992. The Nature and Origins of Mass Opinion. Cambridge: Cambridge Uni-versity Press.
Impact of Campaigns 77