the impact of chinese competition on mexican maquiladoras ... · zthe authors would like to thank...
TRANSCRIPT

The Impact of Chinese Competition on Mexican Maquiladoras:
Evidence from Plant-level Panel Data
Luis Bernardo Torres Ruiz∗ Hale Utar†‡
First version: August 4, 2009
This Version: August 30, 2009
Abstract
In this paper we analyze the impact of intensified competition from China on Mexican
export assembly plants (maquiladoras) using plant-level panel data covering the period
from 1990 to 2006. By using the WTO accession of China as a quasi-natural experiment,
our difference in difference approach reveals a significant effect of Chinese competition on
within plant productivity improvement of maquiladoras. We also find a positive and sig-
nificant impact of the heightened competition on productivity through entry. Although
competition from China also has negative and significant impact on plants’ growth, we
do not find a major effect on plant exits.
JEL Classification: F14; L25; L60
∗University of Colorado, Boulder and Banco de Mexico†University of Colorado at Boulder‡The authors would like to thank Gerardo Durand Alcantara, Director of International Trade Statistics,
Administrative Registry and Prices for access to the confidential data as well as for helpful information on the
data-set. We also thank Wolfgang Keller for his valuable suggestions and comments.
1
1 Introduction
China’s size, rapid economic growth and trade performance is being felt everywhere. Es-
pecially so in Mexico which has been a main competitor of China in the United States
markets for manufactured products. This competition saw a major shift in favor of China
with China’s 2001 accession to the World Trade Organization (WTO). By 2003 China had
surpassed Mexico as the second most important import supplier to the Unites States, behind
Canada.
China’s accelerated trade growth due to lower trade costs in the wake of WTO accession
provides us with a natural experiment to analyze the impact of international competition
in general. Similarity in export baskets between Chinese and Mexican manufacturers to the
US market makes the competition between Mexico and China even more intense, and the
analysis more revealing.
We explore here what China’s export growth means for exporters in Mexico, particularly for
the Mexican maquiladoras. Maquiladoras are export assembly plants historically specialized
in labor- intensive products such as apparel, footwear, electronics and toys. Long before
The North American Free Trade Agreement (NAFTA), favorable duty regulations with the
United States have been in place for maquiladoras since 1965. Since then, close proximity to
the US market and relatively cheap labor made Mexico one of the most favorable offshoring
destination for US companies for a long time. In 2006 the Maquiladora industry in Mexico
generated more than 24 billion dollars in foreign exchange, and accounted for 44 percent of
total Mexican manufacturing exports.
The impact of China’s trade is an important policy question and has recently also received
academic attention. Hanson and Robertson (2008) estimate the impact of increase in man-
ufacturing export from China on the demand for export from 10 other developing countries
2

covering the period between 1995-2005. Based on gravity equation estimates they conclude
that the impact is small. Bloom et al. (2009) use a panel of establishments from Euro-
pean countries to test the impact of Chinese imports on the use of Information Technology
equipment and innovation, finding a positive association between the two.
In this paper, we investigate the impact of the competition from China on Mexican export
assembly plants (maquiladoras); on plants’ growth, entry, exit and productivity using plant-
level panel data that covers the universe of Mexican maquiladoras. The data we use covers the
years 1990-2006, a time period long enough that it allows properly identifying the effects, if
any, of Chinese competition. Our sample starts in 1990 where China’s share in manufacturing
trade in the World was 1.74 % and covers until 2006 where China’s share became 8.37 %
(World Bank).
In contrast to previous studies on the Chinese competition we are better able to isolate
the competition effect from the dual, even triple, effects of Chinese trade: China as an
export market, China as a partner and China as a competitor. We focus entirely on export
assembly plants in Mexico that are tied to the US manufacturing sector where we expect
direct competition between Mexican and Chinese plants, also because they have similar export
baskets in the US market.
This paper provides a first analysis of any aspect of Mexican Maquiladoras using plant-
level panel data. In addition, we examine the link between international competition and
productivity using the WTO accession of China as a quasi-natural experiment which allows
us to identify the impact of intensified competition on the productivity of Mexican plants.
We find partial evidence supporting the frequently stated view by Mexican policy makers
that Chinese competition is forcing maquiladoras to exit low-tech, labor intensive industries
and evolve toward higher value added, technology intensive sectors.
3

We find strong evidence for within plant productivity improvement of maquiladoras due to
heightened competition from China. We also find that although the number of entrants
decreases with intensified Chinese competition, plants enter with a higher level of productiv-
ity as competition intensifies. But we do not find that intensified competition from China
improves the productivity of maquiladoras by causing exit of low-productivity plants.
Plant’s employment growth is also found to be negatively affected by Chinese competition.
More specifically, a one standard deviation increase in China’s share of the import penetration
rate is found to be associated with a decrease in annual plant employment growth of 6.2
percentage points.
Our results lend support to a commonly held view among Maquiladora managers: ”By moving
up the technological ladder, companies say they can afford to pay the relatively high salaries
common along the Mexican border and not relocate to lower-wage countries.” (Lindquist
(2004))
Both China and Mexico liberalized their economies since 1980s and hope to gain through
increasing openness. Although trade growth was impressive in both countries in the last
decades, China’s trade growth was also fueled by productivity-based economic growth; whereas
Mexico experienced relatively un-impressive economic growth performance. Despite official
Mexican concerns regarding China’s accession to WTO, our work highlights that long ex-
pected productivity growth in Mexico due to export and FDI may have just begun, ironically,
triggered by competition from China.
In the next section we describe the environment of maquiladora industry and the data used.
In section 3, we sketch some theoretical models. In section 4 our empirical model is outlined,
and results are interpreted in section 5 followed by conclusions.
4
2 Data Overview
2.1 Mexican Maquiladoras
Maquiladora plants are offshoring plants. A typical maquiladora plant imports inputs mostly
from the United States, processes them, and then ships them back to the country of origin.
The maquiladora program started in the mid-60s; it permits tariff-free transaction of the
inputs and the machinery between ’a maquiladora plant’ and the foreign companies.1 Upon
the return of the goods, the shipper pays duties only on the value added by manufacture in
Mexico (Gruben (2001)).2
In general, there are three ways in which a maquiladora can operate: subcontracting, shel-
ter operation and direct ownership. The subcontracting operation offers the least amount
of control to the foreign firms, given that the subcontractor fulfills all of the manufacturing
operations according to an arrangement established with the foreign firm. Shelter operations
offer more control, especially in the production process, but not in the administrative oper-
ation of the maquiladora plant, i.e. legal, accounting, customs, etc. Direct ownership offers
the foreign firm the most control and supervision over manufacturing operations.
Since its introduction, the maquiladora industry moved from consisting of only low-skilled
labor intensive plants, like apparel manufacturing, to more advanced manufacturing pro-
cesses, like electronics, electrical appliances and automotive. The government allowed the
establishment of maquiladoras in the interior regions of Mexico. NAFTA also contributed to
maquiladoras being allowed to sell their output domestically. However, this option is rarely
exercised.
1In order to benefit from the maquiladora program, a plant has to be registered as a maquiladora plant.
The bureaucratic steps necessary for registration were simplified significantly with the 1983 reform.2Export Processing Zones (EPZ) are similar to the maquila program of Mexico, and can be found around
the world.
5

The implementation of NAFTA required Mexico to change certain provisions for the maquiladora
industry, such as the elimination of certain tariff benefits. Most importantly, on January of
2001, duty-free imports from non-NAFTA countries were eliminated because these countries
intended to subsequently re export to another NAFTA country. These changes were based
on the rules of origin that were established under the treaty, where goods traded between
NAFTA countries are allowed duty free treatment only when the goods satisfy a minimum
percentage of North American content. Due to complaints from leaders of the maquiladora
industry, the Mexican government revised its regulations of the maquiladora sectors and cre-
ated a sectoral promotion program to protect the duty-free status of maquiladora imports and
therefore, allowing the maquiladora program to continue non-NAFTA content imports. Even
after 2001 there is no incentive for a foreign company not to register as being a maquiladora
if it is part of a foreign chain of production re-exporting its goods to the US. This is due
to the tax provision (APA) that allows maquiladoras not to pay income taxes in the same
way as the domestic manufacturing industry (Truett and Truett (2007), Canas and Coronado
(2002)).
2.2 Plant-level Data
The maquiladora industry data is from INEGI (Instituto Nacional Estadstica y Geografa).
INEGI has conducted an annual survey of the universe of plants registered under the maquiladora
program until 2007.3 The observation unit for the industry is a maquiladora establishment,
or plant. The data contains firm id’s as well as plant id’s so that it is possible to identify
3In 2007 a regulatory change was enacted that merges the maquiladora program with an export oriented
program for domestic companies known as the Program for Temporary Imports to Promote Exports (PITEX).
The new program is called Maquiladora Manufacturing Industry and Export Services (IMMEX). As a result,
INEGI stopped reporting maquiladora data after March 2007 and the data has been merged in to the IMMEX
data.
6

multi-plant and single-plant firms. The data set used for the present study is an annual panel
data set which covers the period between 1990-2006 for eleven manufacturing maquiladora
industries. The survey covers the universe of export assembly plants (maquiladoras) in Mex-
ico. The majority of the plants are owned by US companies. We do not have ownership data
at the plant-level due to confidentiality issues, but we do have aggregate capital investment
data in maquiladora industry which can be used as an ownership proxy. In 1994, the US
share of capital equipment investment was 92.4 %. The next biggest investor was Japan, with
a share of 2.5 %. In 2006 the US’s share was 88.1 % followed by Canada and Switzerland
both having 1.4 % shares (Source: Banco de Mexico). In terms of sales, maquiladoras’ export
to the US was 99.7 % of the total maquiladora export in 1993. In 2006 94 % of the total
maquiladora sales was to the US followed by Canada with a share of 1.7 % (Source: INEGI).
INEGI dropped establishments which did not answer the questionnaire or did not report one
of the output measures from the data set.4 Thus, the final data set consist of 27,548 plant
year observations that consist of 3,769 plants and 1,455 firms (1655 plants on average per
year). For each plant we have information on hours worked and the number of employees by
job category, wages paid by job category as well as plant expenditures/inputs, export sales,
and value-added. We do not have information on the owned capital, but plants report rental
expenditures on different capital items. All the nominal values are expressed in 2002 Mexican
peso. See Table 1 for the descriptive statistics. We use separate industry deflators (industry
classification for deflators approximately corresponds to 3-digit SICs) for each maquiladora
sector to deflate revenues and material expenditures. We use energy deflators to deflate fuel
and electricity; a machinery rental deflator to deflate the rental expenditures in machinery
and equipment and a building rental deflator to deflate the building rental expenditures. The
4Every plant operating under the maquiladora program was legally required to answer the questionnaire.
Our data set reveals that plants which did not answer the questionnaire (although legally required) are
mostly located in the interior regions of Mexico where maquiladora concentration is very little. Further
characterization of non-responsive and removed plants is being pursued in correspondence with INEGI.
7

deflators are provided by Banco de Mexico.
In the data-set we have 11 sectors, which we match with the corresponding US industries
in order to construct our aggregate variables. Table 11 presents these 11 industries and
corresponding NAICS codes. The details of the aggregate data construction is given in the
appendix.
3 Theoretical Motivation
China and Mexico are the two main offshoring destinations for the US manufacturing sector.
We expect that China’s recent trade performance accompanied by its accession to WTO has
direct and strong effect on Mexican export assembly plants.
3.1 Heckscher-Ohlin Theory
Both China and Mexico have a comparative advantage in labor-intensive products compared
to the US. However, China has a comparative advantage in unskilled labor in comparison to
Mexico. In 1999, approximately 13 % of the Latin American population has post-secondary
education, compared to 3 % in China (Devlin, Estevadeordal and Rodriguez-Clare (2006)).
Factor content theory suggests that as trade liberalizes in China, industries that dispro-
portionately employ unskilled workers will shrink in Mexico and the opposite will occur in
China. This can happen through the intensive margin, that export assembly plants operating
in Mexico shrink. It can also happen through the extensive margin that plant exits occur
as a result of the competition and or that heightened competition discourages entry of new
plants.
8

3.2 Product market competition
Product market competition will lead Mexican plants to loose market share in the US
market. Typical industrial organization theories with differentiated products (Dixit and
Stiglitz (1977), Salop (1977)) predict a negative relationship between competition and in-
novation/upgrading since competition will decrease the rents of innovating/upgrading for
innovators upon innovation.5 This is the Schumpeterian effect that the incentive to innovate
decreases as competition increases. However, the innovation/upgrading decision is also af-
fected by the difference between the pre-innovation and post-innovation rents (Aghion et al.
(2005)). If the pre-innovation rent disproportionately decreases due to intensified competi-
tion, then firms upgrade or innovate to be able to survive or ’escape’ from the competition as
much as possible. It is shown in Aghion et al. (2005) that such an escape competition effect
is stronger when the market structure is such that technological differences between firms
are small. Export assembly industry both in China and Mexico are mostly based on labor-
intensive technologies with no large technological gaps between plants, so one may expect to
see stronger escape competition effect on plants’ incentive to upgrade their technologies.
Another possible channel that can strengthen the escape competition effect is through a
parent-subsidiary relationship. Consider two competing offshoring destinations. In response
to lower trade costs in one of the offshoring destinations, a parent with a subsidiary in another
location would make a ’credible’ threat of relocating the subsidiary and therefore increases the
incentive for the manager of the subsidiary to put more efforts and decrease X-inefficiencies.
Principal-agent problems are especially relevant to our context as we focus on the perfor-
mances of subsidiaries. Papers analyze the competition and within firm productivity from a
principal-agent problem perspective include Hart (1983), Scharfstein (1988), and Hermalin
5Arrow (1962) on the other hand shows that the incentive to do cost-reducing innovation is higher for a
perfectly competitive firm than a monopolist in the homogeneous product markets under certain assumptions.
9

(1992) among others.6
One of the paper most relevant to our analysis is Horn et al. (1995). They study the
design of an optimal incentive contract for managers and they find that by increasing the
product market competition, international competition increases incentives for managers to
decrease X-inefficiencies and thereby increases within firm productivity. The specific channel
through which their conclusion is derived is the following: Intensified competition increases
the demand elasticities that firms face and therefore increases firms’ incentive to produce
more. As all firms want to expand, this increases demand for labor and increases real wages
of production workers. The two effects, higher output and higher production wages, cause
managers to supply more effort and use less input from production workers, and thus decrease
X-inefficiencies in a world of incomplete contracts with unobservable efforts. We now turn to
the empirical model.
4 Empirical Model
Since we are interested in quantifying the impact of competition between China and Mexi-
can Maquiladoras for the US market, we construct our measure of Chinese competition for
Maquiladoras as the Chinese share of the import penetration for the matched US industry,
following Bernard, Jensen and Schott (2006). That is, our measure of competition is the
total Chinese imports coming to the matched US industry relative to consumption of the US
industry products:7
6In Hart (1983) and Scharfstein (1988), competition affects the informational structure and changes the
possibilities that principal can make inferences about the manager’s action. In Hermalin (1992) competition
changes the manager’s incentive through the income effect.7An alternative would be the ratio of total imports coming from China to the relevant US industry to total
imports in the US industry as used in Bloom et al. (2009). We use both of them. The magnitudes of our
results are not the same because of different choices of normalization, but they are qualitatively the same.
10

IMPCHjt =MCH
jt
Mjt +Qjt −Xjt(1)
where MCHjt denotes the value of imports of industry j products coming from China to the
US at period t. M , Q and X denote total US imports, US production and US exports
respectively.
We also use import penetration rate without Chinese imports, defined below, as an aggregate
control variable.
IMPjt =Mjt −MCH
jt
Mjt +Qjt −Xjt(2)
4.1 Employment Growth
We start with a basic regression to test the impact of Chinese competition on employment
growth in Mexican Maquiladoras. Consider the following specification:
ΔlnEijst = �0 + �1Xijst + �2Zjt + �3IMPCHjt + �4IMPCHjt ∗ xijst+∑ts
�Y Sts Y eart ∗ States +
∑j
�Ij Industryj + ui + �ijst(3)
where ΔlnEijst = lnEijst+1 − lnEijst and Eijst refers to total employment. Subscripts i,j,s,
and t index plant, industry, state and year respectively. We allow for unobserved heterogene-
ity ui which may be correlated with regressors and estimate equation 3 using OLS. We add
interactive state-by-year fixed effects to control for aggregate shocks that may affect employ-
ment growth across all sectors but may vary across different states for example due to local
labor market conditions. Additionally, we control for industry specific fixed factors that may
affect plants’ growth. Vector X includes time varying plant-level controls that are found to
11

be important in determining firms’ growth: these are size dummies, plant tfp, a multi-plant
dummy, and age of a plant.8 Vector Z includes time varying industry-wide controls; these are
industry aggregate variables for the matched US industries that may affect the demand for
a particular maquiladora sector: import-penetration rate of the corresponding US industry
calculated without the imports from China, the matched US industry hourly wages relative
to the corresponding measure in the Maquiladora sector, and the production index of the
matched US industries to control for the sector specific business cycles.9
We then interact our Chinese competition measure with several variables of interests xijst
(productivity, skill-intensity, capital-intensity); to see if trade between the US and China has
a disproportionate effect on any particular type of export-assembly plants in Mexico.
There would be an endogeneity problem if unobserved factors that affect employment growth
of maquiladoras also affect the Chinese share of import penetration in the US industry. Our
industry level variables including the Chinese share are variables for the US industries not for
Maquiladora industries and it is safe enough to assume that the US variables are exogenous
from the perspective of Mexican maquiladoras. However, we still did a robustness check by
instrumenting the Chinese share of import penetration rate, IMPCH, as well as import
penetration rate with no Chinese imports, IMP , whenever applicable. We instrumented the
Chinese share of import penetration rate with the real exchange rate between China and
the US interacted with the 1999 Chinese share of import penetration of the corresponding
US NAICS for each Maquiladora sector. Clearly the real exchange rate between China and
the US must be exogenous from the perspective of Mexican plants. By interacting it with
the cross-sectional shares before China’s accession to the WTO, we get the cross-industry
variation in the degree of Chinese comparative advantage. Another instrument we use is the
8We constructed 5 category of sizes in the ranges 1-50, 51-100, 101-500, 501-1000 and 1000+ dummies as
measured by number of employee. We exclude the smallest size category from the regressions.9Details of these data are given in the appendix.
12

worldwide Chinese imports (exports from China) interacted with the 1999 Chinese import
shares over all imports of the corresponding US NAICS for each Maquiladora sector. In order
to instrument the import penetration rate calculated without Chinese imports, IMP , we use
the industry specific exchange rate for the US industry where the weights for each trading
partner’s currency are lagged share of imports of that particular trading partner. We also
use lagged values of import-penetration rates constructed without Mexican imports as well as
Chinese imports. Bloom et al. (2009) use a similar strategy in instrumenting their Chinese
competition proxy. In contrast to Bloom et al. (2009), our Chinese competition proxy is
not constructed by the imports measure of the same industry reducing endogeneity concerns
even further.
4.2 Employment at the Extensive Margin
What happened to the attractiveness of Mexico as an offshoring destination as China started
to become a favorable offshoring destination? In order to analyze the impact of Chinese
competition on plant entry we aggregate the plant-level data to industry-level and estimate
the following equation:
ln(ENTRYjt + 1) = 0 + 1Zjt + 2IMPCHjt +∑t
�Yt Y eart +∑j
�Ij Industryj + �jt (4)
ENTRYjt is the total number of entrants in industry j at period t. We include industry
dummies to control for industry-specific factors that affect entry, such as different levels
of sunk entry costs associated with starting up, say, apparel versus auto parts assembly
plants. We also include year dummies to control for aggregate shocks such as exchange rate
fluctuations that may affect the entry decision. If intensified Chinese competition discour-
age entry of new export-assembly plants in Mexico, we expect 2 to be negative. We do
13
not use the count data nature of our dependent variable in equation 4, since we use the
transformation ln(1+y). We also estimate the entry equation without using the logarithmic
transformation with Poisson and negative binomial regressions. Our dependent variable ex-
hibits over-dispersion so we opted for the negative binomial model. In this specification our
dependent variable conditional on our regressors assumed to be distributed with Negative
Binomial distribution. It is a Poisson-like distribution but unlike Poisson, equi-dispersion
(that is, mean equals variance V ar(yi∣xi) = exp(x′i�) ) is not imposed. Variance is assumed
to be V ar(yi∣xi) = exp(x′i�) + � ∗ (exp(x
′i)2 where � is an over-dispersion parameter, y is
ENTRY , and x is our vector of regressors.
Another potential effect of intensified Chinese competition is to cause already existing plants
to cease production and exit. We look at the impact of Chinese competition on maquiladora
exit using a probit analysis,
�ijst = �0 + �1Xijst + �2Zjt + �3IMPCHjt +∑j
�Ij Industryj +∑s
�Ss States +∑t
�Yt Y eart + �ijst
(5)
where �ijst is an indicator for exit decision that takes 1 if plant i ceases its operation next
period.
4.3 Productivity
There are mixed empirical evidence whether competition would lead to upgrade of tech-
niques (defensive innovation) or not. We constructed a difference in difference approach to
investigate the impact of Chinese competition on the productivity of Mexican maquiladoras.
Our identification strategy is based on the fact that some of the maquiladora sectors which
have only very little Chinese presence should not be affected by Chinese accession to WTO as
14

much as sectors with heavy presence of Chinese imports. We constructed three groups, one,
MoreCHT where we expect high degree of Chinese Threat, consisting of sectors with more
than 6 percent average Chinese share of import-penetration rate at the US market. These
are apparel, footwear and leather, electrical machinery and toys and sporting goods. Our
second group, NoCHT where we expect minimum Chinese presence and threat, consists of
sectors with less than 0.4 percent average Chinese share of import-penetration in the US mar-
ket. These are Chemicals, Transportation (Auto Parts) and Food products. Our third group
which is an excluded group in our regressions consists of furniture and wood products, metal
products, computer and electronic accessories, and miscellaneous manufacturing. These are
the sectors with medium presence of Chinese presence. 10 Although we base our classifica-
tion on the import-penetration rate, sectors with tiny presence of Chinese imports are also
reflecting the sectors in which Mexico has a comparative advantage due to transportation
costs (food, transportation), relative skill-intensity (chemicals, transportation), and also due
to the level of protection of the industries (chemicals, transportation).
We then construct our difference in difference estimator as follows:
lnTFPijst = �0 + �1I(WTO) + �2I(MoreCHT ) + �3I(MoreCHT ) ∗ I(WTO) + �4I(NoCHT )+
�5I(NoCHT ) ∗ I(WTO) + �6Xijst +∑j
�Ij Industryj +∑s
�Ss States +∑t
�Yt Y eart + �ijst
(6)
I(WTO) is a dummy variable that takes 1 after Chinese accession to WTO, i.e.
10We use different thresholds to check the robustness of our results and find that our qualitative results are
not sensitive to different thresholds.
15
I(WTO) = 1 if YEAR ⩾ 2001
= 0 otherwise
.
I(MoreCHT) and I(NoCHT) are indicator variables that take 1 if the plant i at period t
belongs to the respective groups as defined above. Xijst is a vector of plant-level controls :
logarithm of age, multi-plant dummy, entrant dummy (takes 1 if the plant enter that period),
and exit dummy (takes 1 if the plant does not participate next period). We also have industry,
state and year fixed effects.
In this specification we separate the variation in productivity due to WTO accession of China
from other sources by exploiting not only the variation of productivity before and after WTO
accession of China, but also across plants that are exposed to Chinese competition with
differing degrees.
If there is an overall shift in the productivity after 2001 in all Maquiladoras then the coef-
ficient �1 should be positive. Our difference in difference estimates of the effect of Chinese
competition are represented by �3 and �5. The former indicates the productivity differential
for sectors with heavy presence of Chinese imports in the corresponding US market compared
to the sectors with moderate Chinese imports presence in the US market. The latter indicates
the productivity differential between the sectors which are not under the dominance of China
compared to the sectors which are moderately affected by Chinese competition.
If Chinese competition makes plants more productive say through upgrading of production
techniques, management and organizational skills, the coefficient �3 should be positive and
the coefficient �5 should be negative.
Our regression model identifies the impact of Chinese competition on within productivity as
16

our dependent variable is un-weighted productivity. But productivity will also be affected by
reallocation at the extensive margin, that is, through entry and exit of plants. So we include
entry and exit dummies to capture these effects.
Competition can also effect productivity through interacting with entry and exit of plants. As
competition intensifies, low productivity firms may not be able to compete and exit and this
increases aggregate productivity. Another likely consequence is that aggregate productivity
increases through entry. This happens if entrant plants are more productive than an average
plant. Assume a pool of potential entrants with different productivity levels. If competition
decreases average profitability in the industry then the cut-off point of productivity at which
potential entrant find entry profitable will be higher, as the expected value of entry becomes
lower. We test these hypotheses by including interaction between entry and exit dummies
with our WTO dummy.
In our specification in 6, we do not consider intensified competition from China as a gradual
change. One way to investigate year by year change is to interact our group dummies with
year dummies.
lnTFPijst = �0 + �1I(MoreCHT )i +∑t
�2tY eart ∗ I(MoreCHT )i + �3Xijst+
∑j
�Ij Industryj +∑s
�Ss States +∑t
�Yt Y eart + �ijst
(7)
In this specification, �2t, will give the productivity differential between the plants that are
exposed to high level of Chinese competition with others at each year t.
As a further check we also estimate the following equation:
17

lnTFPijst = �0 + �1IMPCHjt + �2Zjt + �3Xijst +∑j
�Ij Industryj +∑s
�Ss States+
∑t
�Yt Y eart + �ijst
(8)
We now turn to the results.
5 Results
5.1 Employment Growth
In Table 2 we present the estimation of our employment growth equation. After we control
for plant-level variables we find a statistically significant effect of Chinese share of import
penetration on Mexican maquiladoras (column 2). In column 3, we additionally control for
import penetration rate calculated without Chinese imports, IMP . That both coefficients
are negative and significant indicates that import competition in the US market in general
is associated with lower employment growth. Although the coefficient of Chinese share is
bigger and significant at the 5 % level as opposed to the coefficient of import penetration
rate, IMP , which is significant at the 10 %, the Wald test cannot reject that both of the
coefficients are equal.
The coefficient in front of the Chinese share of import penetration in column 4 indicates that
a one standard deviation increase in Chinese share of import penetration rate is associated
with a decrease in annual plant employment growth of 6.2 percentage points.
In columns 5 and 6 of Table 2 we present instrumental variable regression results when we
instrument our Chinese imports variable, IMPCH, as well as our other import penetration
variable, IMP , with the instruments described in the previous section. The results confirm
18

that Chinese imports in the US market are associated with lower employment growth in
Maquiladora industries.
Our plant-level coefficients in all of our regressions are significant except the multi-plant
dummy and they all have the expected signs. Employment growth increases with productivity,
decreases with age, and decreases with size.1112
In Table 3 in columns 1, 2 and 3 we present our results when we interact our Chinese
competition proxy with plant TFP, skill intensity as measured by the ratio of non-production
workers to production workers and capital intensity as measured by the rental expenditures
of machinery, equipment and building to value added respectively. None of the interaction
terms are significant, so there is no indication that intensified Chinese competition as proxied
with Chinese share of import penetration rate in the US causes disproportionate decrease
in employment growth, especially in the group of low-productivity plants, low-skill intensive
plants or low capital-intensive plants. This could be expected as the the substitutability
between the Chinese export bundle and the Maquiladora export bundle is quite high and
there is no apparent ranking between them. That is, we do not expect Chinese exports to the
US to exhibit higher substitutability with the lower end of the distribution of maquiladora
products in comparison to the upper end for a given industry. Although for example, as
Bloom et al. (2009) finds it is more plausible to think that imports from China to Europe
compete more with the European firms’ products located at the low end of the distribution.
11Coefficients of size dummies and multi-plant dummy (additional plant-level controls) are not reported but
are available upon request. Size dummies are all negative and significant at the 1 % level. The multi-plant
dummy is positive and insignificant.12It is usual to find that younger and smaller firms and plants grow faster conditional on survival (Dunne
et al. (1989)). Jovanovic (1982) provides a theoretical foundation through learning.
19

5.2 Employment at the Extensive Margin
5.2.1 Entry of New Plants
We now turn our attention to the question of whether entry of new plants into the Maquiladora
program is affected by intensified Chinese competition. In Table 5 we present the estimates
of equation 4. In column 1, we regress ln(1 + ENTRYjt) on the Chinese competition proxy
and industry fixed effects. We find a negative and significant effect of the Chinese share of
import penetration on entry. However, in column 1 we do not control for aggregate factors
such as exchange rate fluctuations or policy changes such as implementation of NAFTA that
may affect the entry decision in the same way across sectors. In column 2, we additionally
control for year fixed effects and our coefficient of interest increased its magnitude.
Can this effect be generalized to imports from everywhere else? Or is it especially true for
Chinese competition? We add the import penetration rate in column 3. Interestingly, we find
no significant effect of import penetration in the US market on entry of offshoring plants in
Mexico. Another potential factor that may affect entry decisions is relative cost of production
in the US versus in Mexico. We include industry hourly wages of unskilled workers in the
Mexican maquiladora sectors relative to the corresponding US industries in column 4. We
find the coefficient of the relative wage negative and significant at the 5 % level. As one may
expect, cost factors play an important role for entry of an offshoring plant. One may think
that our import-penetration rate for the US industry as described in equation 2 does not
abstract the competition effect from other factors that are associated with imports. We use
an alternative measure of the ’general level of competitiveness’ of the US market in the last
column: It is the industry-specific exchange rate constructed using import partner’s shares
in total imports in the particular US industry, lnMER. An increase in this measure refers
to the appreciation of the US dollar. We find a negative and significant effect indicating that
20
decrease in the level competitiveness of the US industry is associated with lower rate of entry
to the Mexican maquiladoras. But our Chinese share of import penetration rate keeps its
sign and significance in column 5.
One criticism to our OLS regressions presented in Table 4 is that entry is a count data and
simple transformation of it using logarithm is not appropriate as one may suspect that the
error structure may not exhibit normal distribution. We use the count data nature of our
variable and estimated the same regressions (without transforming the dependent variable)
using Poisson and negative binomial regressions. We present only the negative binomial
regression results in Table 5 because our entry variable exhibits over-dispersion. Looking at
Table 5, we find results quite similar to the OLS results. We now turn to the impact of
Chinese competition on plant exits.
5.2.2 Exit
In Table 5 we present the results from our probit regression for plant exits. In column 1,
we regress the exit indicator on plant-level variables that may affect exit decisions and our
Chinese competition proxy, China’s share of the penetration rate in the US market. Let us
first discuss the coefficients of the plant-level variables.
As one may expect we find a significant and negative relationship between exit and size as well
as between exit and productivity. We also find evidence of the presence of non-linearities in
the relationship between productivity and exit. The impact of productivity on exit diminishes
with productivity (negative and significant coefficient of productivity square). Entrants are
less likely to exit and as the plants age, the probability of exit increases. These findings
indicate that offshoring plant dynamics may be different than the plants that are usually
studied using manufacturing survey data. It is typical to find a higher exit rate among
younger firms/plants, since they enter without full information about their capabilities or
21

opportunities; so as they age, their likelihood of exit decreases.13 14 Offshoring plants on the
other hand are mostly owned by large multi-nationals. When an offshoring plant starts an
operation it starts with a business tie with a company with safe demand (already accumulated
demand) but as time goes by, the offshoring plants’ probability to loose the business tie might
increase, perhaps due to bankruptcy or other reasons. Our findings indicate a need for a closer
look at offshoring plants dynamics.15 The demand accumulation process is expected to play
a minimum role in an offshoring industry like Mexican Maquiladoras, however it is probably
an important factor in causing different behavior of plants with different age in the usual
manufacturing data.
Turning our attention back to the impact of Chinese competition, we find a positive coefficient
of the Chinese penetration rate, however, is not significant. In column 2 we also add the
import penetration rate in the US market, IMP . The coefficient is positive and significant
at the 10 % level. As the general import-penetration increases in the US market, maquiladora
plants’ likelihood of exit increases in Mexico. This is probably because, as US firms face lower
demand for their products, they consider shutting down their offshoring plants in Mexico.16
The coefficient of relative wage is positive but insignificant. In column 3 we also present our
results when we instrument our Chinese proxy (the Wald test does not reject the exogeneity
of Chinese import penetration (p¿0.6738)) with instruments as explained in the previous
section. Our results are robust.
As a further robustness check, we also look at the impact of Chinese competition on plant
13See for example Dunne et al. (1989) for a study of plant dynamics using the US manufacturing plants.14In the dynamic stochastic industry evolution models, it is usual to assume that potential entrants do not
know their own productivity but holds an expectation over it when they make their entry decision, see for
example Utar (2007).15In a work-in progress, we are looking further into the dynamics of offshoring industry.16Bergin et al. (2009) documents excess volatility of maquiladoras in comparison to the US counterpart
which may imply that the US firms respond to shocks more strongly in their offshoring plants.
22

exit using the dummy group approach as described in section 4.3. The results of this exercise
are presented in Table 10. We find that the probability of exit increases after 2001. The
coefficients on the interaction terms have the expected signs: The coefficient of the interaction
between the WTO dummy and plants that belong to the most affected sectors is positive; and
the coefficient of the interaction between WTO dummy and plants that belong to the non-
affected sectors is negative (in comparison to our excluded group). But they are insignificant,
confirming our finding with the Chinese share of import-penetration rate. This shows that
competition from China is not a significant factor in causing plant exits among Mexican
maquiladoras.
5.3 Within Firm Productivity
Our difference in difference estimation results for plant TFP are presented in Table 7. Our
TFP measure is calculated separately for each industry allowing differing technologies as
described in the Appendix. We include industry fixed effects to control for the variation
of productivity levels between industries. We also include time fixed effects to control for
common shocks. In column (1) of Table 7 we present the regression result where we only
include the top group MoreCHT .
We find that the coefficient of the WTO dummy is positive and significant, indicating a general
shift in the productivity of export assembly plants in Mexico in 2000s. Indeed, although not
reported, we quantified in general 8.6 % increase in the productivity of maquiladora plants
after controlling industry and state fixed effects after 2001. It is difficult to attribute this
gain to intensified Chinese competition only, as there may be other changes in the aggregate
environment that cause a productivity shift in maquiladora plants. One potential explanation
is implementation of the rules of origin in 2001 due to NAFTA.17 However, our difference
17Although this rule took place in 2001, subsequent complaints from the maquiladora industries led the
23

in difference approach will be able to extract the role of Chinese competition from other
changes.
The coefficient of the interaction between the WTO dummy and the group of sectors that
are under the most direct threat of Chinese competition, MoreCHT , is found to be positive
and significant. It indicates that the productivity increase after China’s accession to WTO
is higher for the plants that are belong to the sectors with stronger Chinese comparative
advantage. More specifically, after WTO accession of China, productivity of plants in group
MoreCHT becomes 5.7 % higher than the productivity of rest of the plants after controlling
for aggregate shocks.
The coefficient in front of the entrant dummy is positive and significant at the 10 % level,
this is not usual in the firm dynamics literature. We expect that entrants are generally more
productive than exiting plants so the turnover rate increases aggregate productivity. However,
net entry is generally thought to be a negative contributor to the aggregate productivity as
new entrants are on average found to be less productive than the average.18 However, all
empirical findings until now has been based on manufacturing firms and we do not know any
study that investigates plant dynamics in an offshoring industry. 19 If demand accumulation
process does not play a significant role among offshoring plants, as we discussed in the
previous section, then we do not expect younger plants to charge a lower price than the
older plants, everything else is being constant. Accordingly, our productivity estimates will
not underestimate the productivity of entrants due to omitted price problem. So in one
sense, we confirm the findings of Foster et al. (2008) that entrants are not necessarily less
Mexican government put an exemption on maquiladora plants. One may also argue, the rules of origin would
lead decrease in productivity rather than increase as it would decrease the diversity of imports.18Foster et al. (2008) and Foster et al. (2009) find on the other hand that entrants are not necessarily less
productive than the incumbent plants after controlling for demand side factors.19In an accompanying paper where we analyze productivity dynamics of offshoring industry, we find that
non-negative contribution of entry is robust to different productivity estimates.
24
productive than the incumbents after controlling for demand disadvantages of entrants.
The exit dummy is negative indicating that, on average, exiting plants are less productive,
but this coefficient is not found to be statistically significant. This is in line with our previous
findings that aggregate demand factors are playing a role in plant exits as well as there are
non-linearities in the relationship between productivity and exit.
In column (2) of Table 7 we repeat the same analysis for the group of plants that belong to
the least affected sectors, NoCHT . We find that the interaction between the WTO dummy
and NoCHT is negative and significant. More specifically, plants that belong to the sectors
where Chinese comparative advantage is not strong (Chemicals, Transportation and Food),
are on average 6.1 % less productive in comparison to the rest of the plants after China’s
accession to WTO.
In column (3), we included both groups, MoreCHT , and NoCHT , so that the interaction
terms will indicate the productivity differential between that group and the excluded group,
which is the group with medium exposure to Chinese imports. The coefficient of the WTO
dummy is positive and significant, indicating that productivity increases 8 % on average after
China’s accession. The coefficient of MoreCHT ∗WTO is positive and significant, and the
coefficient ofNoCHT ∗WTO is negative and significant. Our difference in difference estimates
confirm that heightened Chinese competition leads to within firm productivity increase in
Mexican maquiladoras.
Does the competition have effect on productivity through entry and exit? Column (4) of Table
7 shows that the coefficient of the entrant dummy looses its significance after inclusion of
the interaction between entry and WTO dummies. Instead, the coefficient of the interaction
effect becomes positive and significant, indicating that after 2001 entrants started to become
more productive. It is interesting that the most of the positive effect of entry is indeed after
the competition with China is intensified. We find support for a hypothesis that intensified
25

competition with China increases the cut-off level of productivity at which a potential entrant
will be indifferent between starting up a plant or not. Only plants with a high level of
productive opportunities enter. We also look at the skill intensity (non-production workers
over production workers)of the entrants and find that the mean skill-intensity of entrants
before 2001 is 0.339 and the mean intensity of entrants after 2001 is 0.609 which supports
our finding with productivity levels. This is not due lower size of entrants after 2001 since
the mean size of entrants slightly increases in comparison to pre-2001 level too. This is also
in line with Heckscher-Ohlin theory which suggests growth in skill-intensive jobs in Mexico
as a result of competition from low skill intensive China.20
Looking at exit, after inclusion of interaction, the exit dummy becomes significant (and neg-
ative) at the 10 % level. The coefficient of the interaction between exit and WTO is positive
but insignificant. This could be due to US firms shutting down its sufficiently productive
plants in Mexico and moving them to China as trade costs with China decrease.21
From Column (5) through column(8) we repeat the analysis with the inclusion of plant-fixed
effects. In these regressions the time-invariant variables were removed due to the inclusion
of deterministic fixed effects. The basic picture does not change. That, there is significant
within productivity improvement after 2001 and this effect is stronger for the plants with more
exposure to Chinese imports. Moderately productive plants cease production as probably
some of the multi-national firms move labor intensive production stages from Mexico to
cheaper places, such as China.
What is the over-time impact of Chinese accession to WTO on the productivity of Mexican
20Indeed, among continuing plants, skill-intensity is on average 0.28 before 2001 in comparison to 0.38 after
2001.21Again we should be careful not to over-interpret our results, since the interaction term is found to be
insignificant. However, interaction between exit and the WTO dummy becomes significant once we include
our plant-level fixed effects.
26
maquiladoras? The results presented in Table 8 tell us that the effect of competition on
productivity increases over time as China performs better and better each year. The pro-
ductivity differential of the most effected group of plants and the rest of the maquiladoras is
7.3 % on average in 2002, and this becomes 9.1 % on average in 2005 (column 1). To be able
to extend the years until 2006, exit dummy is excluded in column 2. The results are similar.
The estimates are also robust to the inclusion of plant fixed effects (column (3) and (4)).
In Table 9 we present our results when using the continuous proxy for Chinese competition,
Chinese import penetration in the US market, IMPCH. In column (1), the coefficient
of IMPCH implies that one standard deviation increase in Chinese import penetration
in the US market increases the productivity of maquiladoras by 10.2 percentage points.
When we control for import-penetration rate (imports from everywhere else), one standard
deviation increase in Chinese import-penetration increases productivity by 12.6 percentage
points (column (2)). When we add interaction of our entry and exit dummies with the
Chinese competition proxy (columns 3 and 4) we confirm our previous findings in Table 7.
As competition becomes tougher, the contribution of entry to the aggregate productivity
increases as a more selective group of potential entrants choose to enter (Schumpeterian
effect). We also confirm our findings about exit, that intensified exit due to competition does
not necessarily affect low productivity plants. Indeed, it seems that Chinese competition
is associated with exiting plants that are on average more productive than the survivals as
the interaction between exit dummy and IMPCH is positive and significant. Again this
maybe because of firm-level adjustment to lower trade costs in China. As China becomes a
cheaper destination to offshore to, some firms may want to move their plants from Mexico to
China. Since this is a fixed cost activity, we may expect that only more productive firms will
choose to relocate their plants across different destinations (shutting down a maquiladora
and opening up a plant in China), while less productive ones may choose to respond at the
intensive margin.
27

6 Conclusion
We analyze the impact of Chinese competition on Mexican export assembly plants, (Maquilado-
ras) using plant-level data set that covers the period from 1990 to 2006. We find that em-
ployment growth and entry are negatively affected by Chinese competition. We quantified
a positive, and both economically and statistically significant productivity improvement in
Mexican maquiladoras in 2000s. We also quantified significant and positive effect of in-
tensified Chinese competition on within productivity of Mexican maquiladoras. The results
provide evidence in support of models that imply a positive relationship between international
competition and within firm productivity.
We also highlight that offshoring plants dynamics exhibit different patterns in contrast to
the plant dynamics mostly studied in manufacturing survey data. We find that entrants
are not necessarily less productive than incumbent plants. We also find probability of exit
increases with plants’ age. More specifically, the lack of demand accumulation concerns
among offshoring plants could be one factor that drive differences.
The results also indicate that plant exit decisions are given at the firm-level. Relocation
of plants from one location to another may imply that firms choose to relocate are more
productive than ones choose to respond to intensified competition from China at the intensive
margin due to sunk costs associated with relocation.
Overall we identify an interesting link between competition between two popular offshoring
destinations for the US firms (Mexico and China) and within plant productivity improvement
that may relieve some of the worries that Mexican policy makers express over growing trade
from China.
28

References
[1] Aghion, Philippe, Nick Bloom, Richard Blundell, Rachel Griffith and Peter Howitt
(2005), ”Competition and Innovation: An Inverted-U Relationship”, The Quarterly
Journal of Economics
[2] Arrow, Kenneth (1962), ”Economic Welfare and Allocation of Resources for Invention”,
appeared in The Rate and the Direction of the Inventive Activity, Princeton University
Press, p. 609-626.
[3] Bergin, Paul, Robert Feenstra, and Gordon Hanson, ”Outsourcing and Volatility”, forth-
coming in American Economic Review.
[4] Bernard, Andrew B, Bradford Jensen, and Peter K. Schott (2006), ”Survival of the Best
Fit: Exposure to Low-Wage Countries and the (uneven) Growth of U.S. Manufacturing
Plants”, Journal of International Economics, 68, p. 219-237.
[5] Bloom, Nicholas, Mirko Draca, John Van Reenen (2009), ”Trade induced technical
change? The impact of Chinese imports on innovation and information technology”,
Working Paper, Stanford University.
[6] Canas, Jesus, and Roberto Coronado (2002), ”Maquiladora Industry: Past, Present and
Future”, El Paso Business Frontier, Federal Reserve Bank of Dallas, El Paso Branch.
[7] Caves, W. Douglas, R. Laurits Christensen, and W. Erwin Diewert (1982) ”The Eco-
nomic Theory of Index Numbers and Measurement of Input, Output and Productivity”,
Econometrica, Vol 50, No:6, pp-1393-1414.
[8] Devlin, Robert, Antoni Estevadeordal and Andres Rodrıguez-Clare (2006), The Emer-
gence of China: Opportunities and Challenges for Latin America and the Caribbean,
Washington D.C.: Inter-American Development Bank.
29
[9] Dixit, Avinash, and Joseph Stiglitz (1977) ”Monopolistic Competition and Optimum
Product Diversity”, American Economic Review, Vol 67, pp-297-308.
[10] Dunne, Timothy, Mark J. Roberts, and Larry Samuelson (1989), ”The Growth and
Failure of US Manufacturing Plants”, The Quarterly Journal of Economics, Vol. 104,
No: 4, pp. 671-698.
[11] Foster, Lucia, John Haltiwanger, and Chad Syverson (2008) ”Reallocation, Firm
Turnover and Efficiency: Selection on Productivity or Profitability?, American Eco-
nomic Review
[12] Foster, Lucia, John Haltiwanger, and Chad Syverson (2009) ”The Slow Growth of New
Plants: Learning about Demand?”, working paper.
[13] Goldberg, Linda (2004), ”Industry-Specific Exchange Rate for the United States”,
FRBNY Economic Policy Review
[14] Good, D., Ishaq Nadiri and R. Sickles (1997), ”Index Number and Factor Demand Ap-
proaches to the Estimation of Productivity”, H. Pesaran and P. Schmidt, eds. Handbook
of Applied Econometrics Vol. II-Microeconometrics, Malden, MA: Blackwell Publishers,
14-80.
[15] Gruben, William C. (2001), ”Was NAFTA Behind Mexico’s High Maquiladora Growth”,
Economic and Financial Review, Third Quarter, Dallas FED.
[16] Hanson, Gordon and Raymond Robertson (2008), ”China and the Manufacturing Ex-
ports of Other Developing Countries”, NBER Working papers No 14497.
[17] Hart, Oliver (1983), ”The Market Mechanism as an Incentive Scheme”, The Bell Journal
of Economics, Vol. 14, No. 2, pp. 366-382
30

[18] Hermalin, E. Benjamin (1992), ”The Effects of Competition on Executive Behavior” The
RAND Journal of Economics, Vol. 23, No. 3, pp. 350-365
[19] Horn, Henrik, Harald Lang, and Stefan Lundgrena (1995) ”Managerial effort incentives,
X-inefficiency and international trade”, European Economic Review Volume 39, Issue 1,
January 1995, Pages 117-138
[20] Jovanovic, Boyan (1982),”Selection and the Evolution of Industry”, Econometrica, Vol.
50, No. 3, pp. 649-670
[21] Lindquist, Diane (2004), ”The Maquiladora Roars Back”, The San Diego Union Tribune,
June 29, 2004.
[22] Lopez-Cordova, J. Ernesto, Alejandro Micco and Danielken Molina (2008), ”How Sensi-
tive are Latin American Exports to Chinese Competition in the U.S. Market?”, World
Bank Policy Research Working Paper Series, No 4497.
[23] Salop, Steven (1977), ”The Noisy Monopolist: Imperfect Information, Price Dispersion
and Price Discrimination”, The Review of Economic Studies, Vol. 44, No. 3, pp. 393-406
[24] Scharfstein, David (1988) ”Product-market competition and managerial slack” Rand
Journal of Economics 19, pp. 147155.
[25] Truett, Lila, and Dale Truett (2007), ”NAFTA and The Maquiladoras: Boon or Bane?”
Contemporary Economic Policy, Vol. 25, No. 3, pp. 374-386
[26] Utar, Hale (2007), ”Import Competition and Employment Dynamics”, mimeo, Univer-
sity of Colorado.
31

7 Appendix
7.1 Tables and Figures
Table 1: Descriptive Statistics of the Plant Level Data Set
Mean Standard Deviation Median Observation
Labor (total hours) 769179.1 1744475 219399 27548
Production Workers 288 658.3 82 27548
Non-Production Workers 75 186.4 16.6 27548
Materials 187436 724008.8 16754.2 27548
Capital 1763.2 3965.8 363.5 27548
Value Added 50703.3 123993.4 12581 27548
Gross Output 242820.8 818301.6 31962.5 27548
Note: Values are expressed in thousand 2002 Mexican peso.
32

Table 2: The Impact of Chinese Competition on Employment I
(1) (2) (3) (4) (5) (6)
Specification OLS OLS OLS OLS IV IV
Dependent Variable ΔlnE ΔlnE ΔlnE ΔlnE ΔlnE ΔlnE
IMPCHjt−1 -0.488 -0.725 -1.052 -1.059 -1.190 -1.239
(0.357) (0.308)∗ (0.329)∗∗ (0.429)∗∗ (0.454)∗∗∗ (0.330)∗∗∗
IMPjt−1 -0.757 -0.789 -0.939
(0.328)∗ (0.352)∗ (0.217)∗∗∗
lnTFPijst−1 0.131 0.123 0.124 0.121 0.132
(0.035)∗∗∗ (0.033)∗∗∗ (0.033)∗∗∗ (0.027)∗∗∗ (0.027)∗∗∗
LogAgeijst−1 -0.813 -0.808 -0.809 -0.813 -0.811
(0.029)∗∗∗ (0.028)∗∗∗ (0.028)∗∗∗ (0.017)∗∗∗ (0.017)∗∗∗
Additional Plant-Level Controls No Yes Yes Yes Yes Yes
Additional Industry-Level Controls No No No Yes No No
State-Year Fixed Effects ✓ ✓ ✓ ✓ ✓ ✓
Plant Fixed Effects ✓ ✓ ✓ ✓ ✓ ✓
Number of Plants 3540 3122 3122 3122 2643 2578
Number of Observations 23743 18525 18525 18525 18046 17277
R2 0.1232 0.3086 0.3094 0.3094 0.3085 0.3142
SℎeaPartialR2 0.3088 0.6954-0.8060
Sargan Test 0.029 (�(1)) 4.610(�(3))
Note: Dependent variable is the change in the employment between t and t+1. Robust standard errors are reported in parentheses. For the OLS estimates
standard errors are clustered for each industry in each year. ∗, ∗∗ and ∗∗∗ indicate significance at the 10 %, 5% and 1% levels respectively. Additional
plant-level controls include size dummies, and multi-plant dummy which is an indicator variable if the plant is a part of multi-plant company. Additional
industry-level controls include Mexican industry hourly wages relative to the US industry, and production index of the US industry. For IV regressions
instruments we use are explained in the text. Constant is included but not reported.
33

Table 3: The Impact of Chinese Competition on Employment II
Dependent Variable ΔlnE ΔlnE ΔlnE
IMPCHjt−1 -0.951 -1.034 -1.202
(0.344)∗∗ (0.412)∗ (0.453)∗∗
IMPjt−1 -0.738 -0.880 -0.837
(0.354)∗ (0.366)∗ (0.352)∗
lnTFPijt−1 0.172 0.089 0.103
(0.042)∗∗∗ (0.038)∗ (0.039)∗∗
Skill Intensity log(NP/P)ijt−1 0.007
(0.015)
Capital Intensity log(K/Y)ijt−1 0.006
(0.005)
IMPCHjt−1 ∗ lnTFPijt−1 -0.797
(0.520)
IMPCHjt−1 ∗ Skill Intensity log(NP/P)ijt−1 -0.006
(0.180)
IMPCHjt−1 ∗ Capital Intensity log(K/Y)ijt−1 -0.033
(0.070)
Plant-Level Controls Yes Yes Yes
Industry-Level Controls Yes Yes Yes
State-Year Fixed Effects ✓ ✓ ✓
Plant Fixed Effects ✓ ✓ ✓
Number of Plants 3122 3101 3090
Number of Observations 18525 18439 18393
R2 0.3095 0.3087 0.3067
Note: Dependent variable is the change in the employment between t and t+1. Robust standard errors are reported
in parentheses. They are clustered for each industry in each year. ∗, ∗∗ and ∗∗∗ indicate significance at the 10 %,
5% and 1% levels respectively. Plant-level controls include multi-plant dummy and size dummies and logarithm
of age. Industry-level controls include Mexican industry hourly wages relative to the US industry, and production
index of the US industry. Constant is included but not reported.
34

Tab
le4:
Th
eIm
pac
tof
Ch
ines
eC
omp
etit
ion
onE
ntr
yto
Mex
ican
Off
shori
ng
Ind
ust
ry
(1)
(2)
(3)
(4)
(5)
Sp
ecifi
cati
onO
LS
OL
SO
LS
OL
SO
LS
Var
iab
les
ln(ENTRY
+1)
ln(ENTRY
+1)
ln(ENTRY
+1)
ln(ENTRY
+1)
ln(ENTRY
+1)
IMP
CH
-2.3
18
-3.9
72
-4.0
42
-3.7
38
-3.2
66
(0.6
59)∗
∗∗(0.9
94)∗
∗∗(1.0
87)∗
∗∗(0.9
63)∗
∗∗(0.9
89)∗
∗
IMP
-0.1
70
(0.8
56)
Rel
ativ
eW
age
(M
xW
agejt
USW
agejt)
-1.8
94
-1.7
69
(0.6
33)∗
∗(0.6
96)∗
Ind
ust
ryS
pec
ific
Exch
ange
Rat
e(lnMER
jt)
-2.9
39
(1.0
71)∗
∗
Ind
ust
ryF
ixed
Eff
ects
✓✓
✓✓
✓
Yea
rF
ixed
Eff
ects
No
✓✓
✓✓
N176
176
176
176
176
R2
0.8
15
0.8
45
0.8
46
0.8
51
0.8
58
Dep
endent
vari
able
isth
elo
gari
thm
of
one
plu
sth
eto
tal
num
ber
of
entr
ants
at
peri
od
tand
indust
ryj.
Robust
standard
err
ors
are
rep
ort
ed
inpare
nth
ese
s.∗,∗∗
and
∗∗∗
indic
ate
signifi
cance
at
the
10
%,
5%
and
1%
levels
resp
ecti
vely
.C
onst
ant
isin
clu
ded
but
not
rep
ort
ed.
35

Tab
le5:
Th
eim
pac
tof
Ch
ines
eC
omp
etit
ion
onE
ntr
yto
Mex
ican
Off
shori
ng
Ind
ust
ry
(1)
(2)
(3)
(4)
(5)
Sp
ecifi
cati
onN
egati
veB
inom
ial
Neg
ati
veB
inom
ial
Neg
ati
ve
Bin
om
ial
Neg
ati
veB
inom
ial
Neg
ati
veB
inom
ial
Var
iab
les
ENTRY
ENTRY
ENTRY
ENTRY
ENTRY
IMP
CH
-3.0
88
-6.7
40
-7.0
87
-6.6
32
-5.5
43
(0.7
66)∗
∗∗(1.1
41)∗
∗∗(1.1
57)∗
∗∗(1.1
40)∗
∗∗(1.1
65)∗
∗∗
IMP
-1.1
63
(0.7
33)
Rel
ativ
eW
age
(M
XW
agejt
USW
agejt
)-1
.932
-2.0
70
(0.8
81)∗
(0.9
02)∗
Ind
ust
ryS
pec
ific
Exch
ange
Rat
e(lnMER
jt)
-3.2
19
(0.9
80)∗
∗
ln(�
)(o
ver-
dis
per
sion
par
amet
er)
-2.3
26
-3.0
41
-3.1
24
-3.0
53
-3.2
16
(0.1
83)∗
∗∗(0.2
67)∗
∗∗(0.2
95)∗
∗∗(0.2
65)∗
∗∗(0.2
84)∗
∗∗
Ind
ust
ryF
ixed
Eff
ects
✓✓
✓✓
Yea
rF
ixed
Eff
ects
No
✓✓
✓
N176
176
176
176
176
Log
pse
ud
olik
elih
ood
-507.8
22
-484.3
01
-483.2
46
-482.2
93
-477.2
75
Dep
endent
vari
able
isth
eto
tal
num
ber
of
entr
ants
at
peri
od
tand
indust
ryj.
Robust
standard
err
ors
are
rep
ort
ed
inpare
nth
ese
s.∗,
∗∗
and
∗∗∗
indic
ate
signifi
cance
at
the
10
%,
5%
and
1%
levels
resp
ecti
vely
.C
onst
ant
isin
clu
ded
but
not
rep
ort
ed.
36
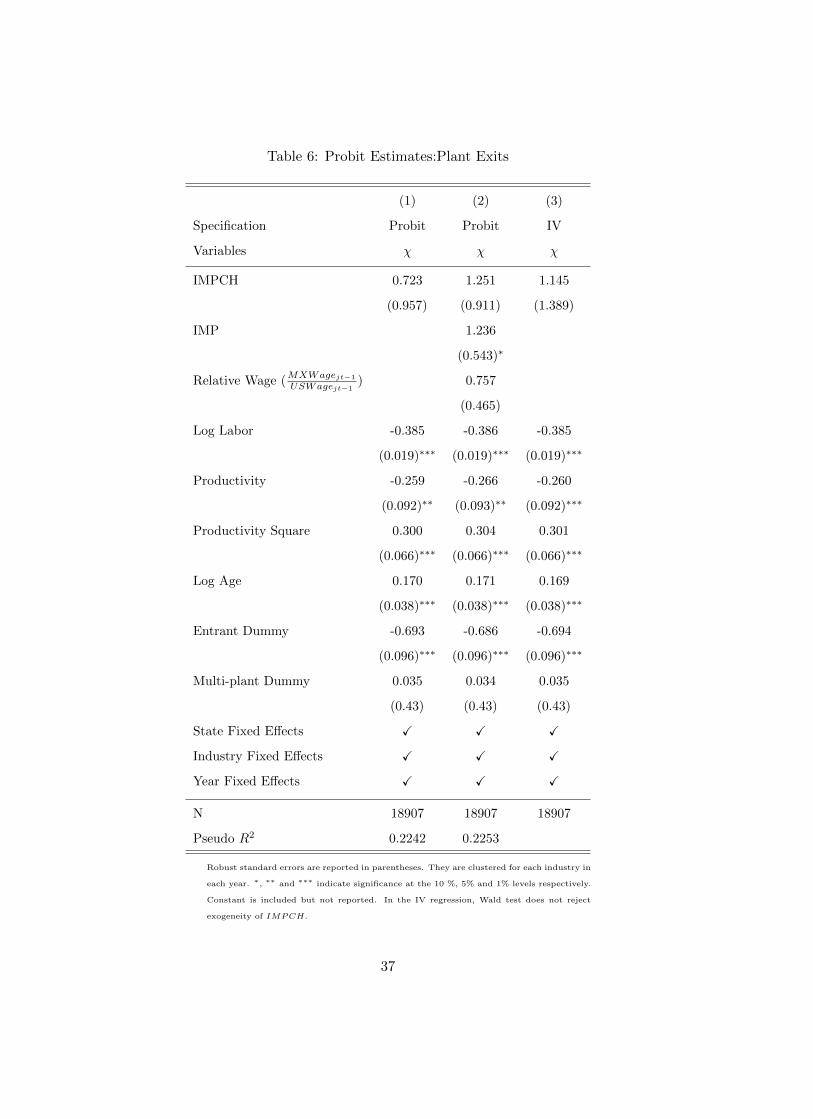
Table 6: Probit Estimates:Plant Exits
(1) (2) (3)
Specification Probit Probit IV
Variables � � �
IMPCH 0.723 1.251 1.145
(0.957) (0.911) (1.389)
IMP 1.236
(0.543)∗
Relative Wage (MXWagejt−1
USWagejt−1) 0.757
(0.465)
Log Labor -0.385 -0.386 -0.385
(0.019)∗∗∗ (0.019)∗∗∗ (0.019)∗∗∗
Productivity -0.259 -0.266 -0.260
(0.092)∗∗ (0.093)∗∗ (0.092)∗∗∗
Productivity Square 0.300 0.304 0.301
(0.066)∗∗∗ (0.066)∗∗∗ (0.066)∗∗∗
Log Age 0.170 0.171 0.169
(0.038)∗∗∗ (0.038)∗∗∗ (0.038)∗∗∗
Entrant Dummy -0.693 -0.686 -0.694
(0.096)∗∗∗ (0.096)∗∗∗ (0.096)∗∗∗
Multi-plant Dummy 0.035 0.034 0.035
(0.43) (0.43) (0.43)
State Fixed Effects ✓ ✓ ✓
Industry Fixed Effects ✓ ✓ ✓
Year Fixed Effects ✓ ✓ ✓
N 18907 18907 18907
Pseudo R2 0.2242 0.2253
Robust standard errors are reported in parentheses. They are clustered for each industry in
each year. ∗, ∗∗ and ∗∗∗ indicate significance at the 10 %, 5% and 1% levels respectively.
Constant is included but not reported. In the IV regression, Wald test does not reject
exogeneity of IMPCH.
37

Tab
le7:
Th
eIm
pac
tof
Ch
ines
eC
omp
etit
ion
onP
rod
uct
ivit
yI
(1)
(2)
(3)
(4)
(5)
(6)
(7)
(8)
Dep
end
ent
Var
iab
leln
TF
Pln
TF
Pln
TF
Pln
TF
Pln
TF
Pln
TF
Pln
TF
Pln
TF
P
WT
O0.
069
0.093
0.0
81
0.0
74
0.1
26
0.1
41
0.1
36
0.1
43
(0.0
13)∗
∗∗(0.0
13)∗
∗∗(0.0
13)∗
∗∗(0.0
13)∗
∗∗(0.0
34)∗
∗∗(0.0
34)∗
∗∗(0.0
34)∗
∗∗(0.0
34)∗
∗∗
Mor
eCH
T-0
.170
-0.1
58
-0.1
59
(0.0
77)∗
(0.0
20)∗
∗∗(0.0
20)∗
∗∗
Mor
eCH
T*W
TO
0.05
70.0
46
0.0
44
0.0
43
0.0
35
0.0
34
(0.0
13)∗
∗∗(0.0
14)∗
∗∗(0.0
14)∗
∗∗(0.0
12)∗
∗∗(0.0
12)∗
∗(0.0
12)∗
∗
NoC
HT
0.1
75
0.0
25
0.0
25
(0.0
78)∗
(0.0
77)
(0.0
77)
NoC
HT
*WT
O-0
.061
-0.0
48
-0.0
48
-0.0
41
-0.0
32
-0.0
31
(0.0
15)∗
∗∗(0.0
15)∗
∗(0.0
15)∗
∗(0.0
14)∗
∗(0.0
14)∗
(0.0
14)∗
Log
Age
-0.0
03-0
.002
-0.0
02
-0.0
01
-0.0
23
-0.0
23
-0.0
24
-0.0
26
(0.0
06)
(0.0
06)
(0.0
06)
(0.0
06)
(0.0
13)
(0.0
13)
(0.0
13)
(0.0
13)∗
Mu
lti-
Pla
nt
Du
mm
y0.
030
0.0
30
0.0
30
0.0
30
0.0
19
0.0
18
0.0
19
0.0
19
(0.0
09)∗
∗∗(0.0
09)∗
∗∗(0.0
09)∗
∗∗(0.0
09)∗
∗∗(0.0
12)
(0.0
12)
(0.0
10)
(0.0
12)
Entr
ant
Du
mm
y0.
023
0.023
0.0
23
0.0
10
0.0
09
0.0
09
0.0
13
-0.0
01
(0.0
10)∗
(0.0
10)∗
(0.0
10)∗
(0.0
10)
(0.0
10)
(0.0
10)
(0.0
10)
(0.0
11)
Entr
ant*
WT
O0.0
46
0.0
30
(0.0
18)∗
∗(0.0
17)
Exit
Du
mm
y-0
.016
-0.0
16
-0.0
17
-0.0
33
0.0
10
0.0
11
0.0
10
-0.0
18
(0.0
11)
(0.0
11)
(0.0
11)
(0.0
16)∗
(0.0
09)
(0.0
09)
(0.0
09)
(0.0
11)
Exit
*WT
O0.0
28
0.0
44
(0.0
22)
(0.0
17)∗
Yea
rF
ixed
Eff
ects
✓✓
✓✓
✓✓
✓✓
Sta
teF
ixed
Eff
ects
✓✓
✓✓
No
No
No
No
Ind
ust
ryF
ixed
Eff
ects
✓✓
✓✓
No
No
No
No
Pla
nt
Fix
edE
ffec
tsN
oN
oN
oN
o✓
✓✓
✓
Nu
mb
erof
Pla
nts
3116
3116
3116
3116
3116
3116
3116
3116
Nu
mb
erof
Ob
serv
atio
ns
1890
718
907
18907
18907
18907
18907
18907
18907
R2
0.19
90.
199
0.2
02
0.2
02
0.0
42
0.0
41
0.0
43
0.0
44
Note
:D
ep
endent
vari
able
isth
elo
gari
thm
of
pro
ducti
vit
y.
Robust
standard
err
ors
are
rep
ort
ed
inpare
nth
ese
s.T
hey
are
clu
stere
dfo
rpla
nts
.∗,
∗∗
and
∗∗∗
indic
ate
signifi
cance
at
the
10
%,
5%
and
1%
levels
resp
ecti
vely
.C
onst
ant
isin
clu
ded
but
not
rep
ort
ed.
38

Table 8: The Impact of Chinese Competition on Productivity II
(1) (2) (3) (4)Dependent Variable lnTFP lnTFP lnTFP lnTFP
MoreCHT -0.177 -0.177(0.080)∗ (0.045)∗∗
MoreCHT*1992 0.007 0.006 0.002 0.002(0.017) (0.017) (0.014) (0.014)
MoreCHT*1993 -0.012 -0.013 -0.016 -0.016(0.020) (0.020) (0.017) (0.017)
MoreCHT*1994 0.016 0.016 0.011 0.011(0.023) (0.023) (0.018) (0.018)
MoreCHT*1995 0.005 0.005 0.019 0.019(0.023) (0.023) (0.020) (0.020)
MoreCHT*1996 -0.002 -0.002 0.020 0.020(0.023) (0.024) (0.021) (0.021)
MoreCHT*1997 0.022 0.021 0.021 0.021(0.024) (0.024) (0.022) (0.022)
MoreCHT*1998 0.017 0.016 0.006 0.006(0.024) (0.024) (0.021) (0.021)
MoreCHT*1999 0.025 0.024 0.028 0.029(0.025) (0.025) (0.021) (0.021)
MoreCHT*2000 0.001 0.000 0.002 0.002(0.024) (0.024) (0.020) (0.021)
MoreCHT*2001 0.035 0.033 0.028 0.029(0.026) (0.026) (0.023) (0.023)
MoreCHT*2002 0.073 0.071 0.065 0.067(0.028)∗ (0.028)∗ (0.025)∗∗ (0.025)∗∗
MoreCHT*2003 0.065 0.063 0.063 0.065(0.028)∗ (0.028)∗ (0.025)∗ (0.025)∗∗
MoreCHT*2004 0.080 0.078 0.069 0.070(0.026)∗∗ (0.026)∗∗ (0.025)∗∗ (0.025)∗∗
MoreCHT*2005 0.091 0.088 0.081 0.080(0.029)∗∗ (0.029)∗∗ (0.026)∗∗ (0.026)∗∗
MoreCHT*2006 0.091 0.091(0.025)∗∗∗ (0.025)∗∗∗
Log Age -0.002 0.001 -0.023 -0.024(0.006) (0.006) (0.013) (0.012)
Multi-Plant Dummy 0.030 0.028 0.020 0.021(0.009)∗∗∗ (0.008)∗∗∗ (0.012) (0.011)
Entrant Dummy 0.023 0.027 0.009 0.008(0.010)∗ (0.009)∗∗ (0.010) (0.010)
Exit Dummy -0.017 0.010(0.011) (0.009)
Year Fixed Effects ✓ ✓ ✓ ✓State Fixed Effects ✓ ✓ No NoIndustry Fixed Effects ✓ ✓ No NoPlant Fixed Effects No No ✓ ✓Number of Plants 3116 3116 3116 3116Number of Observations 18907 18907 18907 18907R2 0.201 0.208 0.041 0.043
Note: Dependent variable is the logarithm of productivity. Robust standard errors are reported in
parentheses. They are clustered for plants. ∗, ∗∗ and ∗∗∗ indicate significance at the 10 %, 5% and
1% levels respectively. Constant is included but not reported. In columns (2) and (4) we exclude
exit dummy in order to include Year 2006 dummy, since exit is not defined in 2006 as we do not
observe 2007.39

Table 9: The Impact of Chinese Competition on Productivity III
(1) (2) (3) (4)
Dependent Variable lnTFP lnTFP lnTFP lnTFP
IMPCH 0.489 0.606 0.542 0.455
(0.136)∗∗∗ (0.125)∗∗∗ (0.126)∗∗∗ (0.125)∗∗∗
IMP 0.308 0.300 0.190
(0.068)∗∗∗ (0.068)∗∗∗ (0.093)∗
Log Age -0.003 -0.002 -0.002 -0.023
(0.004) (0.004) (0.004) (0.009)∗
Multi-Plant Dummy 0.030 0.030 0.029 0.019
(0.005)∗∗∗ (0.005)∗∗∗ (0.005)∗∗∗ (0.007)∗∗
Entrant Dummy 0.023 0.024 0.013 -0.005
(0.010)∗ (0.010)∗ (0.013) (0.011)
Entrant*IMPCH 0.197 0.265
(0.122) (0.115)∗
Exit Dummy -0.015 -0.017 -0.047 -0.029
(0.013) (0.013) (0.017)∗∗ (0.011)∗
Exit*IMPCH 0.393 0.498
(0.163)∗ (0.127)∗∗∗
Year Fixed Effects ✓ ✓ ✓ ✓
State Fixed Effects ✓ ✓ ✓ No
Industry Fixed Effects ✓ ✓ ✓ No
Plant Fixed Effects No No No ✓
Number of Plants 3116 3116 3116 3116
Number of Observations 18907 18907 18907 18907
R2 0.200 0.201 0.202 0.043
Note: Dependent variable is the logarithm of productivity. Robust standard errors are reported in
parentheses. They are clustered for each industry in each year. ∗, ∗∗ and ∗∗∗ indicate significance
at the 10 %, 5% and 1% levels respectively. Constant is included but not reported.
40

Table 10: Probit Estimates:Plant Exits– Robustness Check with
Dummy Variable Approach
(1) (2) (3)
Specification Probit Probit Probit
Variables � � �
WTO 0.405 0.458 0.423
(0.126)∗∗ (0.125)∗∗∗ (0.127)∗∗∗
WTO*MoreCHT 0.132 0.115
(0.074) (0.077)
WTO*NoCHT -0.128 -0.090
(0.099) (0.103)
MoreCHT 0.287 0.168
(0.169) (0.137)
NoCHT -0.252 -0.026
(0.146) (0.153)
Lagged Size -0.385 -0.385 -0.385
(0.016)∗∗∗ (0.016)∗∗∗ (0.016)∗∗∗
Lagged Productivity -0.262 -0.261 -0.264
(0.082)∗∗ (0.081)∗∗ (0.082)∗∗
Lagged Productivity Square 0.302 0.302 0.303
(0.058)∗∗∗ (0.057)∗∗∗ (0.058)∗∗∗
Lagged Log Age 0.170 0.171 0.170
(0.036)∗∗∗ (0.035)∗∗∗ (0.036)∗∗∗
Entrant Dummy -0.692 -0.692 -0.692
(0.089)∗∗∗ (0.088)∗∗∗ (0.089)∗∗∗
Multi-plant Dummy 0.036 0.035 0.036
(0.044) (0.044) (0.44)
State Fixed Effects ✓ ✓ ✓
Industry Fixed Effects ✓ ✓ ✓
Year Fixed Effects ✓ ✓ ✓
N 18907 18907 18907
Pseudo R2 0.2245 0.2243 0.2246
Robust standard errors are reported in parentheses. They are clustered for plants. ∗, ∗∗
and ∗∗∗ indicate significance at the 10 %, 5% and 1% levels respectively. Constant is
included but not reported.
41

7.2 Calculation of Plant TFPs
We use KLEM approach and calculate multi-factor productivity using gross-output measures.
Good, Nadiri and Sickles (1997) discusses the extension of the total factor productivity index
that incorporates both the chaining approach and the hypothetical firm approach of Caves,
Christensen and Diewert (1982) that is suitable for panel data-setting. We construct a hypo-
thetical firm whose subcomponent expenditure shares are the arithmetic mean expenditure
shares and whose subcomponent quantities are the geometric means of the subcomponent
quantities for each cross section. We then chain the hypothetical firms together over time.
lnTFPjt = (qjt − qt) +
t∑s=2
(qs − qs−1)− [∑
i=k,l,e,m
0.5 ∗ (�ijt + �i
t)(xijt − xijt)+
t∑s=2
∑i=k,l,e,m
0.5 ∗ (�is + �i
s−1)(xis − xis−1)]
(9)
where qit is the logarithm of deflated sales of plant j, and xijt is the logarithm of the input
i used by plant j at period t where type of input is indicated with superscript i = k, l, e,m.
l denotes labor measured by the total number of hours worked, k denotes capital measured
by the deflated rental expenditures on buildings, machinery and equipment, e denotes energy
measured by deflated expenditures on fuel and electricity and m denotes materials measured
by deflated expenditures on domestic and imported materials. The bar indicates an average
over the relevant variable (e.g. qt indicates the natural logarithm of the geometric average
for output across all plants at period t). Scale elasticity �’s are calculated using costs shares.
7.3 Sources and construction of the Data
7.3.1 Matching NAICS with Maquiladoras
The 11 maquiladora industries where matched with their closest 3-digit NAICS matches (See
Table 11). To do so, maquila export trade data in 2-digit Harmonized System(HS) as reported
42
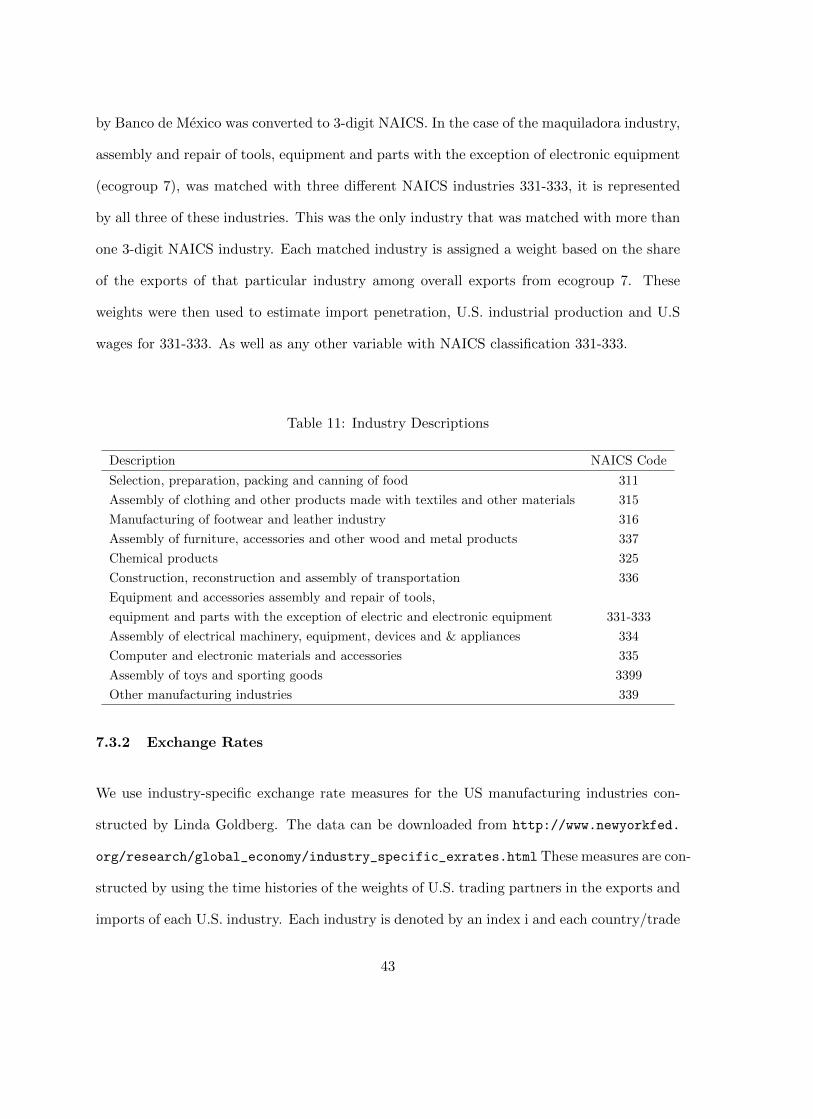
by Banco de Mexico was converted to 3-digit NAICS. In the case of the maquiladora industry,
assembly and repair of tools, equipment and parts with the exception of electronic equipment
(ecogroup 7), was matched with three different NAICS industries 331-333, it is represented
by all three of these industries. This was the only industry that was matched with more than
one 3-digit NAICS industry. Each matched industry is assigned a weight based on the share
of the exports of that particular industry among overall exports from ecogroup 7. These
weights were then used to estimate import penetration, U.S. industrial production and U.S
wages for 331-333. As well as any other variable with NAICS classification 331-333.
Table 11: Industry Descriptions
Description NAICS Code
Selection, preparation, packing and canning of food 311
Assembly of clothing and other products made with textiles and other materials 315
Manufacturing of footwear and leather industry 316
Assembly of furniture, accessories and other wood and metal products 337
Chemical products 325
Construction, reconstruction and assembly of transportation 336
Equipment and accessories assembly and repair of tools,
equipment and parts with the exception of electric and electronic equipment 331-333
Assembly of electrical machinery, equipment, devices and & appliances 334
Computer and electronic materials and accessories 335
Assembly of toys and sporting goods 3399
Other manufacturing industries 339
7.3.2 Exchange Rates
We use industry-specific exchange rate measures for the US manufacturing industries con-
structed by Linda Goldberg. The data can be downloaded from http://www.newyorkfed.
org/research/global_economy/industry_specific_exrates.html These measures are con-
structed by using the time histories of the weights of U.S. trading partners in the exports and
imports of each U.S. industry. Each industry is denoted by an index i and each country/trade
43

partner of that industry by an index c. The industry-specific real exchange rate indexes de-
part from the aggregate indexes in that the weights of each partner currency (country c) are
the shares of that partner c in the U.S. exports or imports of that specific industry i.
7.3.3 Import Penetration Rates and other Aggregate Variables
To calculate import penetration in the U.S., data from the Center for International Data at
U.C. Davis on exports and imports by industry and country was used. The information is
provided in 6-digit NAICS classification. The data was then aggregated to 3- digit NAICS.
Output information is provided by the Bureau of Economic Analysis(BEA) in 3-digit NAICS
format.
3-digit NAICS U.S. hourly wages data is taken from the Bureau of Labor Statistics(BLS). To
estimated maquiladora hourly wages, total worker wages were divided by total hours worked
by workers. Since they are in Mexican pesos they were then divided by the nominal exchange
rate and aggregated to industry-level. The source for the nominal exchange rate between the
US dollar and Mexican peso is Banco de Mexico. Relative wages is then constructed by divid-
ing Mexican hourly wage by the their U.S. industry counterpart. Both US and maquiladora
wages do not include benefits to workers. The source for U.S. industrial production is the
Federal Reserve Board of Governors. The information is presented annually with 3-digit
NAICS classification.
44