the impact of csr on financial performance
TRANSCRIPT

1
The Impact of CSR on Financial Performance
- An event study of abnormal stock returns of Swedish companies as a reaction to the release of the Folksam Index of Corporate Social Responsibility
Anna Linnea Helena Bråtenius ____________________________________ Emelie Josefin Melin ____________________________________
MSc Accounting, Strategy & Control Copenhagen Business School 2015
Master Thesis
Supervisor: Edward Vali Hand-in date: 01062015
Nr of pages: 118 Nr of characters: 239 355

2
Keywords: Event study, financial performance, corporate social responsibility, abnormal returns, rating announcements Abstract: The interest for and engagement in corporate social responsibility (CSR) has increased among both investors and companies, despite the uncertainty related to how CSR engagement creates financial value. As a result, the relationship between CSR and financial performance has been subject to several studies, which have shown conflicting results. Little evidence support that CSR and financial performance are directly related. This study aims to investigate whether CSR engagement has a direct impact on financial performance in the form of stock returns. This is examined by using a specific case, namely the release of Folksam’s Index of Corporate Social Responsibility report, and is conducted through an event study. The time frame covered is the years of 2006 to 2009, 2011 and 2013, in which the report has been released. The publisher of the report, Folksam, is one of Sweden’s largest investment- and insurance companies, and the report assesses the CSR engagement within environmental and human rights, for all companies on OMX Stockholm stock exchange, which therefore form the total population examined. To identify the reactions of investors on the report release, three samples are chosen from the total population. These are the 31 top-ranked companies, the 31 bottom-ranked companies, as well as those companies identified as “zero-performers”, defined as those who received no points at all in the ranking, implying no CSR engagement. The event study methodology used follows a classical approach, by using the market model for estimation of normal and abnormal returns. The estimation window covers the 126 days prior to the event window, and the event window covers the day before the event to the third day after the event day, i.e. day -1 to 3. Thereafter, cumulative abnormal returns, as well as abnormal returns, are calculated to assess the potential impact of the report on stock returns. Overall, the results show that a top ranking does not have an effect on stock returns, whereas a bottom ranking has a negative impact. The negative impact has been consistent over all years, and has increased over time. This indicates that even though top-performers within the area of CSR are not rewarded, companies are still punished for poor CSR performance. Moreover, the results show that the number of companies not engaging in CSR at all has decreased. In addition, four sub-hypotheses are tested to further uncover potential variables that affect the reaction among investors. These aim to examine 1) whether the report has had a larger impact in later years, 2) whether investors’ priorities were different pre-, during-, or post the financial crisis, as well as whether whether investors react differently to top- or bottom rankings when only considering 3) operationally risky and 4) large sized companies, respectively. These results confirm the main hypothesis results, and further support that the interest in CSR has increased over time.

3
Table of Contents 1. Introduction ...................................................................................................................................... 6 1.1 Purpose and Research Question ....................................................................................... 8 1.2 Disposition ................................................................................................................................. 9 1.3 Delimitations .......................................................................................................................... 10
2. CSR and Financial Markets ...................................................................................................... 11 2.1 Corporate Social Responsibility ..................................................................................... 11 2.2 CSR Motives ............................................................................................................................ 12 2.2.1 Benefits ............................................................................................................................ 14 2.2.2 Costs .................................................................................................................................. 17
2.3 The Efficient Stock Market and Valuation ................................................................. 18 2.3.1 The Efficient Market ................................................................................................... 18 2.3.2 Signalling Theory ......................................................................................................... 19 2.3.3 Valuation and the Investors’ Stock Price ........................................................... 20 2.3.4 Incorporating CSR into a Valuation ..................................................................... 21 2.3.5 Characteristics of the Swedish Equity Market ................................................ 23 2.3.6 Sweden’s Cyclical Development during the Period ...................................... 25
2.4 CSR and Financial Performance ..................................................................................... 27 2.4.1 Previous Empirical Papers ...................................................................................... 27 2.4.2 Previous Theoretical Research .............................................................................. 28
2.5 Literature Review ................................................................................................................ 29 2.5.1 Financial Performance as Dependent Variable .............................................. 29 2.5.1.1 Studies Indicating a Negative Relationship ............................................. 31 2.5.1.2 Studies Indicating a Positive Relationship ............................................... 32 2.5.1.3 Studies Indicating No or Insignificant Relationship ............................ 35
2.5.2 CSR as Dependent Variable ..................................................................................... 37 2.5.3 Critique of Various CSR Measures ........................................................................ 38
2.6 Clarification ............................................................................................................................ 39 3. Hypothesis Formation ............................................................................................................... 41 3.1 The Study’s Hypotheses .................................................................................................... 41 3.2 Delimitations .......................................................................................................................... 44
4. Method ............................................................................................................................................. 45 4.1 The Folksam CSR Ranking Report ................................................................................ 45 4.1.1 The Environmental Analysis .................................................................................. 47 4.1.2 The Analysis of Human Rights ............................................................................... 48 4.1.3 The Rating System ...................................................................................................... 48 4.1.4 The Industry Classification ..................................................................................... 48

4
4.1.5 Other CSR Indexes ....................................................................................................... 49 4.1.6 Assessment of Folksam’s CSR Ranking Report ............................................... 52
4.2 Theoretical Methodology ................................................................................................. 54 4.3 Data Collection and Source Criticism .......................................................................... 55 4.3.1 Data Collection .............................................................................................................. 55 4.3.2 Data Criticism ................................................................................................................ 57 4.3.3 Data Adjustment .......................................................................................................... 58 4.3.4 Analysis of Missing/Excluded Data ..................................................................... 58
4.4 Event Study and its Criticism .......................................................................................... 59 4.4.1 Event Definition ........................................................................................................... 60 4.4.2 Sample Criteria ............................................................................................................. 61 4.4.3 Normal Returns ............................................................................................................ 65 4.4.4 Estimation Procedure ................................................................................................ 68 4.4.5 Abnormal Returns ....................................................................................................... 68 4.4.6 Accumulation of Abnormal Returns .................................................................... 69 4.4.7 Interpretation and Conclusion .............................................................................. 69
4.5 Testing Procedure ............................................................................................................... 70 4.6 Testing Schedule .................................................................................................................. 77 4.6.1 Statistical Tests for the Main Hypothesis .......................................................... 77 4.6.2 Statistical Tests for the Sub-‐hypotheses: .......................................................... 77 4.6.3 Robustness Tests ......................................................................................................... 78
4.7 Validity, Reliability and Replication ............................................................................. 79 4.7.1 Internal validity ............................................................................................................ 79 4.7.2 External Validity .......................................................................................................... 80 4.7.3 The Validity of Concepts ........................................................................................... 80 4.7.4 Reliability ........................................................................................................................ 81 4.7.4.1 Stability ................................................................................................................... 81 4.7.4.2 Inter-‐observer consistency ............................................................................. 81
4.7.5 Replication ...................................................................................................................... 82 5. Results and Discussion .............................................................................................................. 83 5.1. Main Hypothesis .................................................................................................................. 83 5.1.1 Main Hypothesis Results .......................................................................................... 84 5.1.2 Discussion of Main Hypothesis .............................................................................. 86
5.2 Sub-‐hypotheses ..................................................................................................................... 87 5.2.1 Sub-‐hypothesis 1: 2006 versus 2013 ................................................................. 88 5.2.2 Sub-‐hypothesis 2: Economic Cycles .................................................................... 91 5.2.3 Sub-‐hypothesis 3: Operational risk ..................................................................... 92

5
5.2.4 Sub-‐hypothesis 4: Company Size as Defined by Market Capitalisation94 5.3 Robustness Tests .................................................................................................................. 96 5.3.1 Considerable Events ................................................................................................... 96 5.3.2 Environmental and Human points ....................................................................... 98 5.3.3 Correlation Test of Size Measures ........................................................................ 99
6. Analysis ......................................................................................................................................... 101 6.1 Analysis of Main Hypothesis ........................................................................................ 101 6.2 Analysis of Sub-‐hypotheses .......................................................................................... 108
7. Conclusion ................................................................................................................................... 114 7.1 Limitations ........................................................................................................................... 117 7.2 Suggestions for Future Research ............................................................................... 119
8. References ................................................................................................................................... 120 9. Appendix ...................................................................................................................................... 131 Appendix 9.1 Industry Classification Systems ............................................................. 131 Appendix 9.2 Data Adjustments ......................................................................................... 133 Appendix 9.3 Outliers for the Main Hypothesis .......................................................... 134 Appendix 9.4 Size versus Ranking .................................................................................... 138

6
1. Introduction Although a challenge to measure the impact, companies’ investments in corporate
social responsibility (CSR) activities have grown significantly as a business strategy
for value creation (McWilliams et al., 2006). The difficulty of measurement is
partially explained by the vague and varying definition of the concept of CSR, and
despite expansive research on the subject, there are strong proponents as well as
opponents to companies’ CSR engagement (ibid). Some schools claim that CSR
engagement is a misuse of resources and that company resources should be used for
value-adding activities for shareholders only, while others argue that companies have
obligations to a wider group of stakeholders and therefore should take on social
responsibility.
The interest in CSR is growing among companies, but the motives behind are varying.
However, the engagement can to a large extent be explained by an increasing pressure
from stakeholders (McWilliams et al., 2006). The pressure is not only expressed by
customers, but also by employees, suppliers, community groups, nongovernmental
organizations as well as governments (ibid). The interest in CSR has been seen to be
growing particularly in multi-national, multi-divisional companies who are exposed to
differing business norms and standards, regulatory frameworks, and stakeholder
demand for CSR across the nations they are operating in (ibid). A recent development
within the field is a new EU regulation on mandatory CSR reporting among large
companies, which was introduced in 2014 and puts further pressure on companies to
engage in socially responsible activities (European Commission, 2015). According to
this regulation, all EU companies with more than 500 employees are required to
report “information on policies, risks and outcomes as regards environmental
matters, social and employee aspects, respect for human rights, anti corruption and
bribery issues, and diversity in their board of directors” (ibid).
Excluding the pressure from stakeholders as a motivator, other underlying motives
behind CSR engagement include beneficial factors to the companies, such as
competitive advantages in the form of increased market shares and employee
motivation. The research however shows that CSR activities not only provide
company benefits. Rather, they also entail increased costs, both one-time costs and

7
continuous costs in addition to a risk of CSR involvement failure, which may lead to
mistrust among stakeholders and in turn company damage (Weber, 2008; McWilliams
et al., 2001; McWilliams et al., 2006).
The general trend of increased CSR engagement can also be found in Swedish
companies, which often have a long history of active CSR engagement (sweden.se,
2015). In fact, Sweden is regarded as a pioneer within the field and was in 2013 in the
top of RobecoSAM’s Country Sustainability Ranking. The government has even
appointed a CSR ambassador to take responsibility for issues related to sustainable
trade and business (ibid). In addition, investors’ interest in social- and environmental
issues is growing and this affects their investment decisions to a larger extent as they
recognize the importance of CSR (Dow Jones Sustainability Index, 2015). This seems
to be the case for Swedish investors too, as Folksam has experienced that more
customers now ask for social and environmental consideration in regard to investment
decisions (Folksam, 2013).
There is extensive literature on the relationship between CSR and financial
performance. However, the previous research has shown a lack of consistent evidence
of CSR activities’ impact on financial performance. Positive, negative and neutral
relations have been presented, and there are no clear incentives for companies to start
working with CSR based on these ambiguous studies. Among these studies, most of
them have performed regressions on rather specifically defined variables, which could
be considered as a deficiency in the CSR research area where the concepts and
measurement systems are vague and hence diverging from each other. To circumvent
the issue of measuring CSR, this study will use an event study methodology, where an
event within the field of CSR is defined and used as a specific case to measure if CSR
engagement impacts stock prices. Moreover, no such study has been performed on the
Swedish market, and since every market has its own characteristics, it is deemed
interesting to examine Swedish listed companies’ CSR initiatives and their potential
impact on financial performance.
Although many studies have been made on the relationship between CSR and
financial performance, none has investigated whether CSR ratings impact the stock
price of Swedish listed companies. It is therefore interesting to investigate this further,

8
and this study aims to determine whether the Swedish stock market reacts to a CSR
ranking publication made by Folksam. Folksam is one of the largest investment- and
insurance companies in Sweden and all listed companies traded on the Stockholm
Stock Exchange are included in its ranking. Hence, a case approach by using the CSR
ranking report that Folksam publishes on an annual/semi-annual basis will be used to
investigate the more general relationship between CSR and financial performance.
1.1 Purpose and Research Question This thesis aims to investigate the potential impact of CSR on financial performance.
Building on previous theoretical research, as well as examining previous studies, a
full picture of the subject is provided, which is used to analyse the results from the
event study. Previous research shows ambiguous results of the relation between CSR
and financial performance, and there is little evidence supporting that CSR and
financial performance are directly related. Still, companies seem to put large amounts
of money and effort into socially responsible activities, implying that there are
financial benefits to gain. The purpose of this study is therefore, by filling the gap in
existing research, to give both companies and investors a better insight into CSR
efforts and show if and how these efforts may add value to a business. Hence, the
results will be valuable for both these parties, as well as for other stakeholders who
benefit from companies’ CSR work. Interesting questions to investigate are; do CSR
efforts add financial value to a company and hence, do shareholders benefit from
companies’ CSR work? If not, why do the companies still engage in costly CSR
activities?
Based on the defined purpose, the following question arises:
Is it true that CSR engagement has no direct impact on the stock price of a company?
To answer the general question above, previous studies have taken on several
different approaches and used different cases. For example, Klassen et al. (1996) use
the case of announcements of winning an environmental award, while Guidry &
Patten (2010) use first-time announcements of releases of sustainability reports as a
case. In this thesis, the specific business case used is the CSR ranking report
published by Folksam to examine the releases’ impact on Swedish publically traded

9
companies’ stock returns. This will be done by empirically investigating and
analyzing the effects of CSR ratings on the stock price of companies listed on the
Stockholm Stock Exchange (NASDAQ OMX Stockholm). This implies that the listed
companies in the Swedish market will function as the population to investigate, which
limits the applicability of the study’s results. However, for the Swedish market, the
results will be more valid and applicable, as the specific characteristics of the Swedish
financial market can be used to better understand the results.
To examine this, three samples based on ranking score are chosen to discover whether
there are differences in how investors react to top-, bottom- and no CSR performance,
respectively. To strengthen the validity of the thesis, sub-hypotheses and robustness
tests will be performed to test for potentially important influential factors that could
impact the results of the main hypothesis. The sub-hypotheses, as specified and
justified in later chapters, will investigate whether there are any differences in how
investors consider CSR engagement 1) over the time-span used in this study, 2) if
there are any differences in reaction pre-, during-, and post the financial crisis, as well
as whether investors react differently to top- and bottom rankings for 3) companies
identified as operationally risky and 4) large sized companies.
1.2 Disposition To answer the research question, the thesis will guide the reader through a chapter on
relevant concepts and motives of CSR. Thereafter a separate section regarding the
financial markets as well as the characteristics of the Swedish stock market is
presented, followed by a presentation on how CSR and financial performance
potentially are linked. Finally, a section on existing previous research within the area
is reviewed. Based on the theoretical and literature review, the hypotheses of the
study are developed. Subsequently, a chapter describing the method and methodology
is outlined followed by a chapter reviewing the study’s results. Finally, an analysis
will follow based on the results where the theories from the second chapter are
applied on the findings.

10
1.3 Delimitations The study is limited to investigating the effect on the stock price following a specific
release on CSR engagement, namely the publication of the Folksam Index of
Corporate Social Responsibility (Folksam CSR Ranking Report). Released on an
annual/semi annual basis since 2006, the report evaluates and analyses the public
reports of Swedish listed companies based on their CSR policies and activities. It
evaluates the companies’ CSR engagement by reviewing to what extent their work
with human rights and environmental issues comply with the UN Global Compact
criteria and OECD’s guidelines for multinational companies. Consequently,
Folksam’s CSR Report rates all components of CSR and reports on the overarching
CSR efforts for each listed company. This makes this report release a highly suitable
event for this study.
To analyse the impact of Folksam’s CSR ranking publication on the stock value of
firms, an event study will be conducted where the event is defined as the release of
the CSR ranking report. The companies selected for this study are divided into three
segments, namely the top 31 companies with the highest total ranking, the 31
companies with the lowest ranking, and finally the companies without ranking each
year. The ranking is based on the scores that each company receives for both human
rights and environment, respectively. For the investigation of the sub-hypotheses, the
same approach will be used, however limited to 2006 and 2013 for the first sub-
hypothesis. The second sub-hypothesis covers all years grouped as pre-, during- and
post-crisis. The third and fourth sub-hypotheses are limited to 2013 and examine
companies that are highly exposed to operational risk and large sized companies,
respectively.
11
2. CSR and Financial Markets This chapter presents previous research within the CSR and financial areas as well as
theories within finance and valuation that are relevant for the study. The subjects
covered are CSR, CSR motives, CSR benefits and costs, the financial market,
valuation and the Swedish market in particular, as well as the causality between CSR
and financial performance. Lastly, a literature review is made on the existing
research on the relationship between CSR and financial performance.
2.1 Corporate Social Responsibility There are several proposed definitions of corporate social responsibility available, but
often they are unclear or vague. For example, Marrewijk (2003) defines CSR as
“...company activities, voluntary by definition, demonstrating the inclusion of social
and environmental concerns in business operations and in interactions with
stakeholders”, which is similar to the definition made by McWilliams, Siegel &
Wright (2006) explaining CSR as “...actions that appear to further some social good,
beyond the interests of the firm and that what is required by law”. Pava & Krausz
(1996) on the other hand write that as there is so much uncertainty surrounding the
definitions of CSR, it is tempting to suggest that there is no such thing as CSR and
that there is no difference between socially responsible and non-socially-responsible
firms. Anyhow, there is a growing interest in the area of CSR, and especially for the
strategic role of CSR for companies (McWilliams et al., 2006). As companies are
growing and becoming multinational, the external pressure from stakeholders will
most likely continue to increase. Opinions on whether companies should engage in
CSR have however varied in the past. For example, Friedman (1970) argues that CSR
is a result of possible agency problems within the firm, a misuse of resources that
instead could be spent on value-creating activities, while Freeman (1984) rather
argues that the firm has to satisfy a number of stakeholders, as they can influence the
firm’s performance and outcomes, and hence supports companies’ CSR activities.
Peloza & Shang (2011) use three different categories for distinguishing CSR
activities, namely philanthropy, business practices, and product-related. They argue
that generalisation of CSR activities is not easy as there is a wide variety of CSR
activities included in different measures.

12
Not only do the definitions of CSR differ, the understanding of “being good” also
varies between companies who take on different approaches to CSR (Johnson, 2003).
Johnson (2003) considers social responsibility of firms as a continuum ranging from
‘illegal/irresponsible’ companies acting on an illegal level to ‘social advocacy’ where
companies consider CSR to be a central part of their mission. The levels in between
are ‘compliant’, ‘fragmented’, and ‘strategic’. Based on the continuum proposed,
Johnson (2003) examines whether it pays to be good. The author concludes that it
does not pay to be bad as illegal activities have a negative impact, but that good
behaviour on the other hand only pays off to a limited extent (ibid). Despite this last
point, companies continue to engage in CSR activities that might go beyond what is
their responsibility as a company and may not be justified by monetary gains, and the
motives behind this choice and potential drawbacks are presented in the next section.
2.2 CSR Motives When it comes to the motives of CSR, there is a wide uncertainty about why
companies actually engage in these types of activities, which is a result of the problem
of asymmetric information (McWilliams et al., 2006). As CSR engagement is
supposed to reflect a focus on other aspects than the bottom line, rather the triple
bottom line1, managers may be reluctant to reveal the strategic motives for their CSR
activities. The lack of this information makes it difficult to understand the true
motives for engaging in CSR (ibid). However, there are plenty of theories underlying
companies’ motivations for engaging or not engaging in CSR activities, which are
presented below.
Sprinkle & Maines (2010) suggest an explanation to be that it is simply just the ‘right
thing to do” and that it is a part of being a good global citizen. Another suggestion is
that companies use CSR for so-called “window dressing” 2 in order to get an
appearance that stakeholders support and appreciate. In that way, firms engage in
CSR activities mainly because they feel that it is a requirement to avoid negative
publicity (Sprinkle & Maines, 2010). In fact, the power of stakeholders, such as
employees and customers, may play an important part in companies’ choice of
1 A Triple Bottom Line strategy considers ot only economic performance, but also social and environmental 2 Window dressing is a strategy for improving appearance or creating a falsely favorable impression
13
engaging in CSR activities (Dechant & Altman, 1994). Stakeholders are often
concerned with environmental performance and expect companies to take
responsibility, which makes them take action against companies perceived as
environmentally irresponsible. In addition, employees’ willingness to work for a firm
is dependent on how well the firm’s environmental performance fits their values
profile, which further strengthens companies’ willingness to engage in CSR (ibid).
When examining CSR engagement, McWilliams et al. (2006) suggest applying a
resource-based view (RBV). The theory of RBV assumes that a firm’s resources and
capabilities can lead to a competitive advantage given that they are valuable, rare,
inimitable and non-substitutional. Consequently, through an RBV-lens, CSR could be
seen as a possible source of competitive advantage (ibid). Assuming that two firms
produce identical products, McWilliams and Siegel (2001) suggest that a cost/benefit
analysis can help assess the optimal level of CSR activities, i.e. the demand for CSR
versus the cost of satisfying the demand. Moreover, the theory of the firm perspective
implies that CSR can be seen as a strategic investment, and if it cannot be an integral
element of the core business, it can at least enhance the firm’s reputation
(McWilliams et al., 2006).
The value of CSR can be found in several strategic areas. In most industries, CSR
characteristics can be incorporated into products, and is hence a strategic choice to
consider when differentiating vertically. Most customers know that a hybrid version
of a car is “better” than the original version, and some might be willing to pay a price
premium, given that this “CSR-characteristic” is valuable to them (McWilliams et al.,
2006). Moreover, the differentiation itself can add reputational value to the firm by
meeting stakeholder demands (ibid). Bhattacharya & Sen (2004) do however point
out that customers not necessarily are rational, and can express a certain demand for a
company engaging in CSR, without changing their purchasing behaviour. They
suggest that companies instead should focus on possible internal outcomes of CSR,
such as consumers’ awareness, attitudes, attributions, etc., which eventually can lead
to external outcomes (ibid).

14
2.2.1 Benefits
As McWilliams et al. (2006) suggest, CSR may be seen as a strategic investment.
According to Burke & Logsdon (1996), corporate social responsibility is considered
to be strategic when “...it yields substantial business-related benefits to the firm, in
particular by supporting core business activities and thus contributing to the firm’s
effectiveness in accomplishing its mission”. They identify five different dimensions of
corporate strategy necessary for firm success, namely centrality, specificity,
proactivity, voluntarism, and visibility, which are used for assessment of how CSR
activities can add value to a firm. The authors argue that the different dimensions may
lead to various benefits to the company, such as philanthropic contributions,
employee benefits, and environmental management, which in turn may create value as
they lead to customer loyalty, productivity gains, and new products and markets
(ibid). Greening and Turban (2000) support the theories related to increased employee
motivation, and claim that social performance is attractive to job applicants. In fact,
they argue that job applicants have higher self-images when working for firms that are
socially responsible compared to their less CSR focused counterparties (ibid).
Weber (2008) proposes five areas of beneficial impacts of CSR activities, which are
all presented below.
1. Company image & reputation: Both image and reputation can influence the
competitiveness of a company and hence have a beneficial effect. Research has
shown that CSR can have a positive impact on both, especially on reputation on a
more long-term basis (Weber, 2008).
2. Employee motivation, retention and recruitment: These positive effects could be a
result of enhanced reputation. However, CSR could also increase motivation for
those employees who are motivated by a better working environment, by
participating in voluntary activities, etc. Regardless, employee motivation and
retention could result in increases in productivity and cost savings. The company
might also be more attractive to future employees (Weber, 2008).
3. Cost savings: Epstein & Roy (2001) argue that implementing a sustainable
strategy can improve materials efficiency, time savings, energy consumption, etc.,
15
which could lead to cost savings. Moreover, this could generate a positive
customer reaction, who in turn might benefit from these cost savings or the
improvements of the products. Finally, the authors argue that financial analysts or
investors can see these improvements as a positive thing regarding the company’s
manufacturing performance (ibid).
4. Revenue increases from higher sales and market share: These benefits could be
achieved indirectly through an improved brand image or directly through a CSR-
specific product or service, such as a hybrid car (Weber, 2008).
5. CSR-related risk reduction or management: CSR can reduce the risk of negative
publicity or NGO-related pressure. Furthermore, there might be some direct
financial effects from for example avoiding fines, etc. (Weber, 2008).
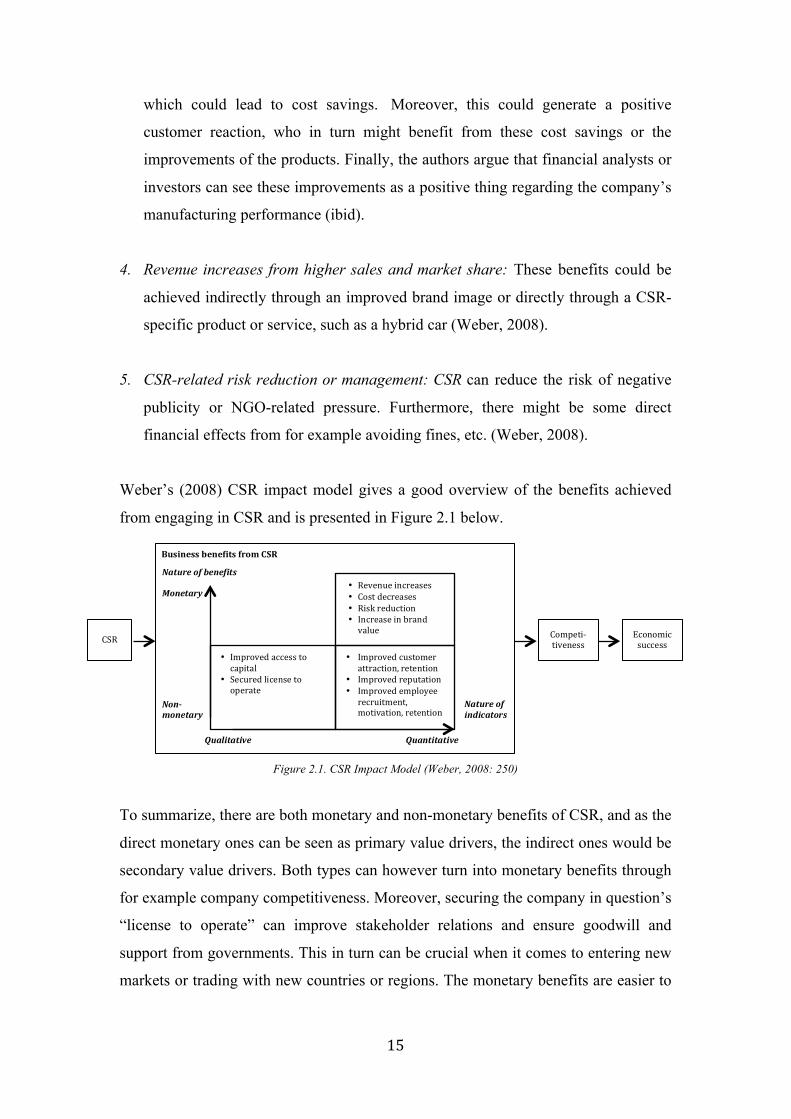
Weber’s (2008) CSR impact model gives a good overview of the benefits achieved
from engaging in CSR and is presented in Figure 2.1 below.
Figure 2.1. CSR Impact Model (Weber, 2008: 250)
To summarize, there are both monetary and non-monetary benefits of CSR, and as the
direct monetary ones can be seen as primary value drivers, the indirect ones would be
secondary value drivers. Both types can however turn into monetary benefits through
for example company competitiveness. Moreover, securing the company in question’s
“license to operate” can improve stakeholder relations and ensure goodwill and
support from governments. This in turn can be crucial when it comes to entering new
markets or trading with new countries or regions. The monetary benefits are easier to
Business benefits from CSR
• Revenue increases • Cost decreases • Risk reduction • Increase in brand value
• Improved customer attraction, retention
• Improved reputation • Improved employee recruitment, motivation, retention
• Improved access to capital
• Secured license to operate
Nature of indicators
Qualitative
Non-‐monetary
Monetary
Quantitative
Nature of benefits
CSR Economic success
Competi-‐tiveness

16
assess the added value of, and using the discounted cash flow method, as for any other
investment, this would imply the following model (Weber, 2008):
Formula 2.1 Monetary CSR Value Added (Weber 2008: 253)
Monetary CSR Value Added = 𝐵 !"#! − 𝐶 !"#
! ∗ !(!!!)!
!!!
!!!
where;
N= period; 𝐵!"# = 𝐶𝑆𝑅 𝑏𝑒𝑛𝑒𝑓𝑖𝑡𝑠; 𝐶!"# = 𝐶𝑆𝑅 𝑐𝑜𝑠𝑡𝑠; 𝑖 = 𝑑𝑖𝑠𝑐𝑜𝑢𝑛𝑡 𝑟𝑎𝑡𝑒
Barnett (2007) argues that the mentioned benefits, and the potential value added by
engaging in CSR, is dependent on the crowd of stakeholders, and he claims that CSR
investments overall require a high stakeholder relationship orientation. He introduces
the concept of SIC, i.e. stakeholder influence capacity, which is defined as “the ability
of a firm to identify, act on, and profit from opportunities to improve stakeholder
relationships through CSR”. Moreover, he suggests that the path-dependent nature of
stakeholders is the basic reason for why different reactions from stakeholders, as well
as different effects on financial performance, can occur depending on both the firm in
question, its history, and the timing (ibid). Further, he argues that firms with a poor
SIC that engage in CSR may find that their stakeholders are sceptical towards, or even
overlook, the firms’ CSR efforts. Finally, he draws the conclusion that CSR
contributions have upper bounds/limits due to this, and that the SIC of a firm is what
determines if more CSR efforts will generate positive or negative reactions from
stakeholders and hence financial results (ibid).
A final, and separate, CSR benefit related to valuation and risk of a company is
presented by El Ghoul, Guedhami, Kwok & Mishra (2011). The authors claim that
companies with a high CSR engagement should have lower cost of equity in
comparison to companies with a track record showing low CSR engagement.
Companies not engaging in CSR, or engaging to a limited extent only, have a reduced
investor base and higher perceived risk. Two explanations for this are information
asymmetry and investor preferences saying that disclosures of CSR related actions
would spread a positive image of the company, which in turn would attract more
investors. The results of the study imply that more investors are likely to invest in
companies that do engage in CSR than do not (ibid). As a result, CSR engagement
17
leads to lower cost of capital, which in turn reduces the financing costs and makes the
companies more valuable (ibid). The valuation of a company is further described in
section 2.3.3 below.
2.2.2 Costs
There are different types of costs related to CSR engagement. Weber (2008) suggests
that one-time CSR costs should be seen as separate from continuous costs. One-time
costs can for example include installation costs, one-time donations or other similar
investment costs (Weber, 2008). Continuous costs could be fees such as for licenses
or patents, recurring personnel or materials costs, and CSR-promotion activities such
as marketing and campaigns (ibid).
Another potential cost to consider comes from the risk of active CSR engagement
leading to higher exposure and more scrutinization from e.g. press and
nongovernmental organizations (NGOs) (Weber, 2008). According to Yoon, Gürhan-
Canli & Schwarz (2006), CSR may hurt the company image when motives behind the
CSR engagement are perceived to be insincere, i.e. that the consumers suspect that the
companies engage in CSR only in order to improve their images. Consequently, a
single mistake leading to bad publicity will affect a company’s reputation more
negatively than for a company who does not engage in CSR at all, causing costs that
are CSR risk-related (Yoon et al., 2006, Bhattacharya & Sen, 2004; Weber, 2008). In
fact, Bhattacharya, Korschun & Sen (2011) point to the risk of CSR activities, even
though well meaning, harming the competitiveness of the company. They further
suggest that a few basic principles can reduce this risk significantly. Firstly, they
highlight the market motives, and state that by being genuine and open with those,
together with pursuing genuine CSR objectives, will minimize the risk. Moreover,
trying to satisfy the specific needs of the customers will increase the likelihood of
them approving the CSR engagement, and accordingly minimize the risk. Finally,
constantly trying to align the company goals and stakeholder goals will also increase
the likelihood of the CSR activities actually creating value, and for all parties
involved (ibid).
A final remark to highlight is that CSR costs are hard to measure and that

18
conventional accounting systems do not distinguish between costs related to CSR and
not related to CSR. There is also an inherent risk of cost distortion due to the
overhead being assigned based on for example number of units (Weber, 2008).
2.3 The Efficient Stock Market and Valuation 2.3.1 The Efficient Market
A company’s stock price reflects a company’s value creation driven by its ability to
grow and gain return on invested capital, which are economic fundamentals that drive
long-term cash flows (Koller, Goedhart & Wessels, 2010). Consequently, different
discounted cash flow (DCF) models in which the future cash flows are forecasted are
popular for evaluating companies and determining their stock prices (ibid). According
to Koller et al. (2010), the DCF model is the most accurate method for valuing a
company, but other methods can be used for testing of the plausibility of DCF
forecasts. An example of such a valuation method is a multiple analysis in which the
company is compared to peer companies in the industry. The stock price can also be
directly found by discontinuation of the dividends that the stock is expected to pay in
the future (Koller et al, 2010). The different valuation models, as stated above, should
all yield the same results (Petersen & Plenborg, 2012).
The stock market is characterized by competitiveness and market efficiency (Brealey
et al., 2014). Fama (1970) defines an efficient market as a market in which “...
security prices at any point in time ‘fully reflect’ all available information”. In an
efficient market, prices follow a random walk, meaning that price changes in different
periods are independent of one another (Brealey et al., 2014). Consequently, there is
no pattern in share price changes, and past prices cannot be used for prediction of
future prices, as this would lead to effortless profits. Instead, the rule of market
efficiency implies that prices are adjusted immediately when investors try to utilize
information in past prices, until the superior profits disappear. All information in past
prices is therefore reflected in the stock price of today and consequently investors
cannot achieve excess returns on a long-term basis (Brealey et al., 2014). Further, the
efficient market theory suggests that all other information that is available to investors
also is reflected in today’s stock price. Following this reasoning, securities are

19
assumed to be fairly priced and their returns will be unpredictable, thus no consistent
superior returns should be achieved in the market. Collecting more information will
therefore not make any difference, as all information that is available already will be
incorporated in the stock price (ibid).
There are three levels of market efficiency, which differ in degree of information
reflected in security prices. These are called weak market efficiency, semi-strong
market efficiency, and strong-market efficiency (Brealey et al., 2014). In the weak
form of market efficiency, current security prices reflect all information about past
prices. In an efficient weak market, prices follow a random walk, which makes it
impossible to generate superior returns by using information on past returns. In the
semi-strong form of market efficiency, prices reflect both past prices and all other
public information. When public information is released, prices immediately adjust,
which makes it impossible to gain superior returns consistently. In the strong-market
efficiency form, prices reflect all available information through careful analysis of the
company and the economy, which makes it impossible to consistently beat the market
(ibid). Fama (1970) argues that there is no significant evidence against the weak and
semi-strong hypotheses, which indicates that prices seem to adjust to all publicly
available information. For the strong-market hypothesis on the other hand, there is
some evidence pointing against the efficiency of the theory. It is argued that there is a
possibility that some investors or groups have monopolistic access to information,
which could lead to abnormal profits. This could for example be the case for
corporation officers that have monopolistic access to information about their firms
(Fama, 1970).
2.3.2 Signalling Theory
As presented in the previous section, the stock price reflects the underlying value of
the stock and any new information about a company should immediately be
incorporated in its stock price, which implicates that there is no possibility to make
lasting profits (Brealey et al., 2014). The signalling theory on the other hand, suggests
that the market is not completely efficient as there in fact are information asymmetries
(Copeland, Weston & Shastri, 2014). These asymmetries arise as insiders, i.e. the
management of a firm, have more information than outsiders, i.e. security holders. A

20
signal is defined as an action that is taken by the more informed part, which in turn
provides credible information to the less informed part with the purpose of reducing
the asymmetry (ibid; Van Horne & Wachowicz, 2005). Consequently, managers may
send out signals by taking certain actions to indicate e.g. the future direction of the
firm, which is used by less-informed parties when making decisions (Van Horne &
Wachowicz, 2005). In addition, as managers’ compensation and benefits may depend
on the firm’s market value, they utilize information that other parties do not have in
order to maximize the value of the firm (ibid).
Greening & Turban (2000) make a separate link between signalling theory and
corporate social performance of firms. They suggest that a firm’s social performance
affects its attractiveness as an employer since their CSR engagement signals certain
values and norms to applicants. The arguments behind this statement are based on
previous research stating that applicants do not have complete information about the
potential employer, and therefore use the information they receive as signals about the
firm’s working conditions.
2.3.3 Valuation and the Investors’ Stock Price
When assessing the market value of a company, and hence the fair price of the stock
from the investors’ point of view, a discounted cash flow-analysis can be used, which
is calculated by using formula 2.2 presented below (Brealey et al., 2014). A firm’s
enterprise value is dependent on future expected cash flows, the weighted average
cost of capital as well as the perpetuity growth rate. As previously mentioned, the
analysis is used for estimation of the future cash flows, which then are discounted
back to today’s value.
Formula 2.2. The formula for calculating Enterprise Value
𝐸𝑛𝑡𝑒𝑟𝑝𝑟𝑖𝑠𝑒 𝑣𝑎𝑙𝑢𝑒 = 𝐹𝐶𝐹𝐹!
(1 +𝑊𝐴𝐶𝐶)!
!
!!!
+ 𝐹𝐶𝐹𝐹!!!
(𝑊𝐴𝐶𝐶 − 𝑔) 𝑥
1(1 +𝑊𝐴𝐶𝐶)!
where; FCFF = Free Cash flow to Firm; WACC = Weighted average cost of capital;
g = Perpetuity growth rate; n = number of periods
Future cash flows can be estimated through a strategic and a financial analysis
(Brealey et al., 2014). The strategic analysis should focus on both micro and macro

21
factors, and can for example consist of classic frameworks such as Porter’s five
forces, a PESTEL-analysis and a SWOT-analysis, while the financial analysis takes
into account the historical data in the formulated analytical income statement and
balance sheet, and can for example include a profitability analysis, a growth analysis
and a risk/liquidity-analysis (Petersen & Plenborg, 2012). The results of the three
mentioned analyses are then incorporated into the appropriate value drivers, in order
to assess an estimate of the company’s future performance (ibid).
The frameworks applied in the strategic analysis consider different important factors
affecting the company. While the PESTEL-framework analyses the macro-
environmental influences that can affect the potential cash flow and risk, such as
political, economic, or technological aspects, Porter’s five forces assess the industry
factors that could affect the cash flow potential and risks (Petersen & Plenborg, 2012).
The five forces include buyer- and supplier power, entry barriers, rivalry, and
substitutes. The two described frameworks can be combined with an analysis on
company specific factors that can influence the cash flow potential and risks, such as
human resources, physical resources, financial resources, and intangibles (i.e. brand,
image, stakeholders relationships, etc.). Finally, this opens up for a concluding
SWOT-analysis on the company’s strengths, weaknesses, threats, and opportunities,
and hence a final estimation of potential future cash flow can be added to the financial
analysis (ibid).
2.3.4 Incorporating CSR into a Valuation
The understanding of how CSR can create value is still being discussed. Some CSR
initiatives, such as cutting down energy usage, produce more immediate results and
are hence easier to assess the value of (Bhattacharya, Korschun & Sen, 2011). Other
CSR activities, such as letting employees engage in voluntary activities, that might
lead to value creation in the form of employee motivation and hence efficiency, are
more long-term benefits, and are hence harder to assess (ibid). As suggested by
Petersen & Plenborg (2012), social responsibility activities could be included as a
value adding (reducing) factor in the SWOT-analysis, under opportunities and
strengths (threats and weaknesses). However, a survey by McKinsey shows that a
significant proportion of investors asked do not fully consider the value of CSR in

22
their valuations, as the value is too long-term, too indirect or too hard to measure
accurately (Bonini, Brun & Rosenthal, 2009). Notable is that three-quarters of
investment professionals agree that CSR activities does create value, only not how
much, and that the most important value sources are maintaining a good corporate
reputation and building brand equity. One of the exhibits from the survey results,
presented in figure 2.2 below, shows that 49 (43) per cent of the respondents are
substantially positive that environmental (social) programs contribute to short-term
shareholder value, and that 85 (74) per cent are substantially positive that
environmental (social) programs will contribute to the long-term value for
shareholders (ibid).
Figure 2.2. Contribution of Environmental and Social programs to shareholder value (Bonini et al., 2009)
The results presented by El Ghoul et al. (2011) related to CSR and cost of capital,
mentioned previously in this chapter, have an important implication for how CSR
engagement may affect the valuation of a firm. The authors claim that a high
engagement in CSR, among other things, leads to a lower equity cost of capital. As
can be seen in Formula 2.3 below, the weighted average cost of capital is an
independent factor in the DCF-analysis, which plays an important part (Petersen &
Plenborg, 2012). The equity cost of capital is linked to the weighted average cost of
capital through the following formula (ibid):
Formula 2.3. The weighted average cost of capital formula
𝑊𝐴𝐶𝐶 =𝐸𝑉∗ 𝑅! +
𝐷𝑉∗ 𝑅! ∗ (1 − 𝜏!)
where; 𝐸 = Equity value; 𝑉 = Total value; 𝐷 = Debt value;
𝑅! = Cost of equity; 𝑅! = Cost of debt; 𝑇! = Corporate tax rate
% of respondents. n=150
Substantially positive/positive Neutral/can’t evaluate Negative/substantially negative
Short term Long term
Contribution of given program to shareholder value

23
As a result, a lower equity cost of capital, i.e. Re, will give a lower WACC, which in
turn will result in a higher enterprise value when incorporated in the DCF-analysis.
2.3.5 Characteristics of the Swedish Equity Market
Together with the fixed-income and foreign exchange markets, the equity market has
an important function in the Swedish financial system and is defined as trading in
equities and equity-related instruments listed on Swedish market places (Riksbanken,
2014). Currently, there are two regulated markets, i.e. Stock Exchanges, in Sweden,
namely NASDAQ OMX Stockholm and Nordic Growth Market (NGM Equity). In
addition, there are three trading platforms, which are also called Multilateral Trading
Facilities (MTFs) and have simpler regulations compared to regulated markets. These
three trading platforms are First North Stockholm, Nordic MTF, and Aktietorget. In
the year-end 2013, approximately 513 public limited companies were listed on the
Swedish market, where 266 and 247 companies were listed on the regulated market
and MTF respectively. Among the Swedish marketplaces, NASDAQ OMX
Stockholm is by far the largest with a market value of the listed equities that
represents 99 per cent of all listed Swedish equities (Riksbanken, 2014).
The ownership of Swedish equities is widespread and extensive. In the end of 2013,
the total market value of equities listed on Swedish marketplaces amounted to almost
SEK 5000 billion, where the value belonging to the Swedish households, both directly
and indirectly, was estimated to 27 per cent of the total market value. The foreign
investors’ share of the market was 41 per cent in the year-end 2013, which
corresponds to the largest category of shareholders (Riksbanken, 2014).
Companies that are listed, and thus available for trading, on the Swedish marketplaces
are obliged to publicly publish information concerning decisions and events that may
influence the prices of the stocks. The reasoning behind this regulation is that all
traders should have the opportunity to have access to the same information at the
same time, which according to the Swedish Central Bank (Riksbanken) creates
confidence in the market and protects investors (Riksbanken, 2014). In fact, strong
consumer protection is a main objective for the Swedish government (Regeringen,
2014). An important part of this is to maintain transparency and mobility in the

24
market. According to the Swedish Central Bank, trade on the organised marketplaces
makes up an important base for transparency in the market and helps reduce market
abuse. Due to clear and transparent rules for trading and collection of information on
volumes and prices, all information is available to all market participants
(Riksbanken, 2014).
In addition, new and continuously developing regulations in EU regarding market
supervision and the enforcement of financial information affect how the Swedish
securities and financial markets are developed and how the companies and the
monitoring parties should react (Finansinspektionen, 2015). Finansinspektionen is
responsible for supervision of the securities market and according to the law of
market abuse, it is required that stock exchanges, marketplaces, and companies selling
securities report to Finansinspektionen if they discover suspicious transactions that
can be related to insider crimes or unjustified market impact (Finansinspektionen,
2015).
All companies listed on NASDAQ OMX Stockholm are included on NASDAQ OMX
Nordic, which is a Nordic list that also incorporates all companies listed on the stock
exchanges in Copenhagen, Helsinki, and Reykjavik (Riksbanken, 2014). To be listed,
the companies need to fulfil a range of requirements, e.g. that the market value of the
equities must be equal to or larger than EUR 1 million, that they have enough
shareholders and that the company can show a stable profitability or financial
resources that cover operations for at least 12 months. The Nordic list consists of
three segments, namely large cap, mid cap and small cap, which are divided based on
the market value of the companies. The Nordic list includes companies with a market
capitalisation of at least EUR 1 billion on large cap, while companies listed on small
cap have a market capitalisation smaller than EUR 150 million. Companies with a
market value of between EUR 150 million and EUR 1 billion are listed on mid cap
(NASDAQ, 2011; Riksbanken, 2014). On the 18th of November 2013, 1 EUR
amounted to 8,9556 SEK (Riksbanken, 2015).
In their annual report of the Swedish financial market, Riksbanken presents the
historical turnover and market capitalisation on NASDAQ OMX Stockholm. As can
be seen in figure 2.3 below, the levels of both turnover and market capitalisation have
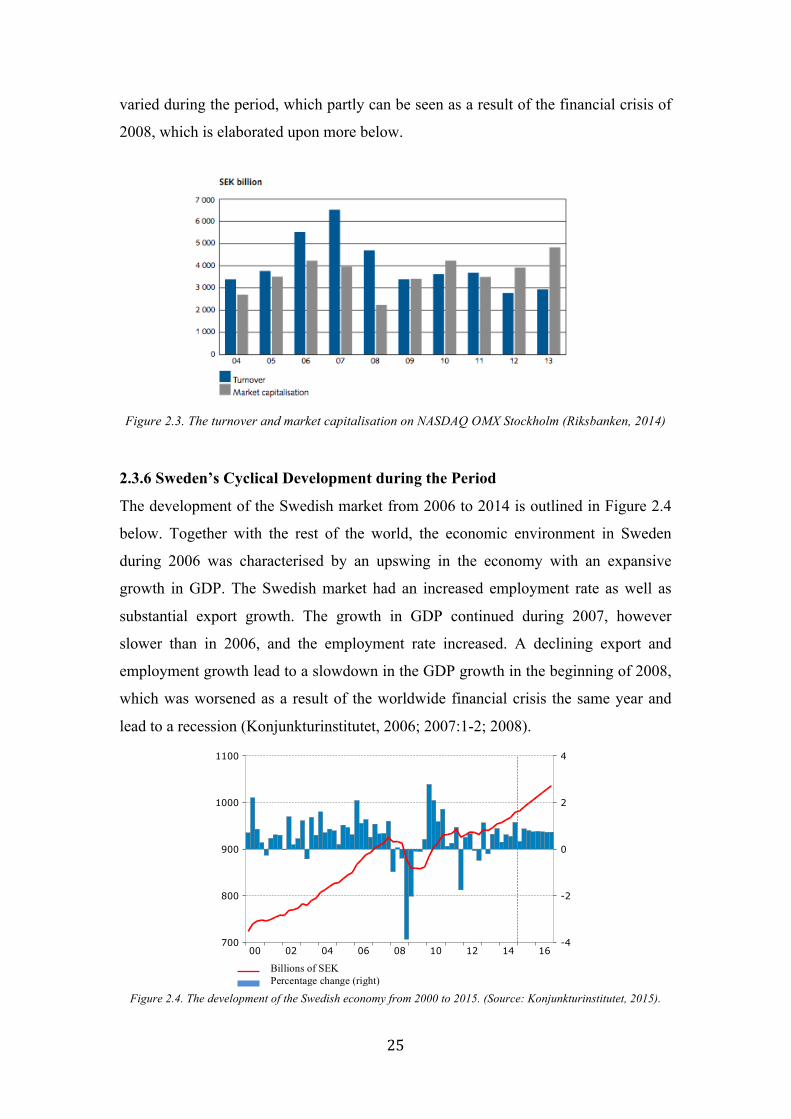
25
varied during the period, which partly can be seen as a result of the financial crisis of
2008, which is elaborated upon more below.
Figure 2.3. The turnover and market capitalisation on NASDAQ OMX Stockholm (Riksbanken, 2014)
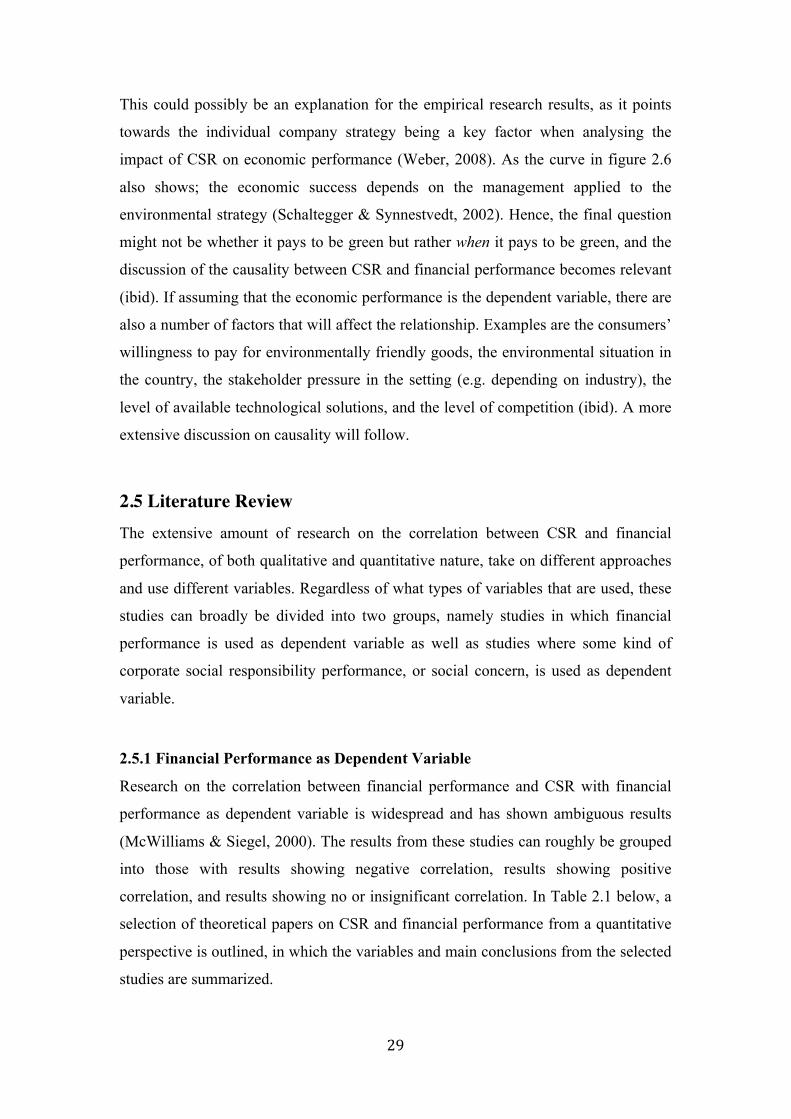
2.3.6 Sweden’s Cyclical Development during the Period
The development of the Swedish market from 2006 to 2014 is outlined in Figure 2.4
below. Together with the rest of the world, the economic environment in Sweden
during 2006 was characterised by an upswing in the economy with an expansive
growth in GDP. The Swedish market had an increased employment rate as well as
substantial export growth. The growth in GDP continued during 2007, however
slower than in 2006, and the employment rate increased. A declining export and
employment growth lead to a slowdown in the GDP growth in the beginning of 2008,
which was worsened as a result of the worldwide financial crisis the same year and
lead to a recession (Konjunkturinstitutet, 2006; 2007:1-2; 2008).
Figure 2.4. The development of the Swedish economy from 2000 to 2015. (Source: Konjunkturinstitutet, 2015).
161412100806040200
1100
1000
900
800
700
4
2
0
-2
-4
Miljarder kronorProcentuell förändring (höger)
Billions of SEK Percentage change (right)

26
The bankruptcy of the American investment bank Lehman Brothers during the fall of
2008 was followed by a sharp drop of the stock exchanges all over the world where
Stockholm NASDAQ OMX was severely hit with a total fall of 42 per cent during
2008 (Andersson, 2008). This is clearly distinguished in the figure above by the
sudden fall of GDP growth and value. The international crisis affected Sweden
considerably and in 2009, the Swedish GDP had fallen more than in the US, OECD
and Eurozone. In addition, there was a considerate increase in unemployment. Year
2010 was mainly characterised by recovery thanks to fiscal policies and increased
demand for Swedish export goods. In 2011, the recovery of the economy was slowed
down as a result of financial turbulence in the surrounding world, e.g. the debt crisis
in the Eurozone, leading to stock exchange falls. During the initial months of 2012,
the households’ and the companies’ confidence in the economy was strengthened,
however the recovery declined once again in the middle of 2012 due to the weak
world development. A similar development was present in 2013 with both positive
and negative future outlooks leading to a variable GDP development. However, from
the middle of 2013 and forward the GDP growth curve has shown a positive slope,
but the recovery has in general been slow due to a weak demand for Swedish export
goods. Today, the economic outlooks for Sweden are more optimistic, partly as a
result of an export growth, and the Swedish GDP growth is expected to increase
steadily (Konjunkturinstitutet, 2009; 2010; 2011:1-2; 2012:1-3; 2013:1-2; 2014;
2015:1-2).
The OMX Nordic Stockholm Price Index (OMXSPI) is the index used in daily speech
to indicate the movement of the stock exchange, and hence gives a good overview of
the development of the Swedish stock exchange (NASDAQ, 2015:1-2). It is a
weighted index of all stocks that are listed on the OMX Nordic Exchange Stockholm.
The developments and fluctuations of OMXSPI during the period 2006-2015 are
outlined in Figure 2.5 below. As can be seen, the index has to a large extent followed
the development in the Swedish market with a peak in 2006-2007, followed by a large
downturn as a result of the economic crisis in 2008-2009 and a stable recovery from
2012 onwards.

27
Figure 2.5. The development of OMX Stockholm PI from 1995 to 2015 (Dagens Nyheter, 2015)
2.4 CSR and Financial Performance The relationship between CSR and financial performance is of importance within the
business and management area, and is also in the interest of investors (Weber, 2008).
Several empirical papers and theoretical research have examined this relationship in
different ways over the years, and the correlation as well as the potential conflict
between the two aspects have been subject to investigation over the last 40 years
(Bird et al., 2007).
Despite the companies’ primary responsibility of earning profits, they can at the same
time contribute to social and environmental goals. They can integrate social
responsibility as a strategic investment in the central corporate strategy, management
instrument, and the business (Folksam, 2013). There is no guarantee that socially
responsible activities automatically lead to an increased value for the shareholders.
However, evidence indicates that it could be a type of insurance protection and
therefore maintains the value for them (ibid).
2.4.1 Previous Empirical Papers
The previous empirical papers on the relationship between CSR activities and firm
performance can be divided into qualitative and quantitative studies. The qualitative
studies have often focused on the relationship between CSR and the firm’s
competitiveness, which in turn implies an increased financial performance. The
quantitative studies on the other hand have mainly been conducted as either
regression studies or event studies, which often have lead to inconclusive results
(Weber, 2008). For example, Aupperle et al. (1985) and McWilliams & Siegel (2000)

28
found that there is a neutral relation between socially-responsible activities and
profitability, while Waddock and Graves (1997) found that CSR activities result in an
improvement in firm performance. Negative correlations have also been found,
however those have not been as common (Vance, 1975; Hassel, Nilsson & Nyquist,
2011). Most of the critique pointed towards these studies has been related to the
inconsistency of variables and methodology used in the research (Weber, 2008;
McWilliams & Siegel, 2000). It has also been discussed whether there are missing
factors in previous research and that this deficiency may lead to misleading results.
Examples could be cultural differences of CSR importance, industry differences, the
causality between CSR and financial performance, or if a correlation actually is
dependent on a hidden variable, such as R&D or advertising (McWilliams & Siegel,
2000). The different results from previous studies are presented in more detail in
section 2.5 below.
2.4.2 Previous Theoretical Research
The previous theoretical research has often argued that the relationship between
economic performance and the environmental/social performance follows an inverse
U-shaped curve (Weber, 2008). This curve shows how the net marginal benefits from
environmental efforts will decrease sooner or later, which follows the logic that an
indefinite number of environmental activities cannot infinitely increase economic
performance (Schaltegger & Synnestvedt, 2002).
Figure 2.6. Figure of possible relations between corporate environmental protection and economic success
(Schaltegger & Synnestvedt, 2002, s.341) The upper (lower) curve shows a more efficient (inefficient) management
regarding its environmental activities, and hence a lower (higher) marginal cost.
29
This could possibly be an explanation for the empirical research results, as it points
towards the individual company strategy being a key factor when analysing the
impact of CSR on economic performance (Weber, 2008). As the curve in figure 2.6
also shows; the economic success depends on the management applied to the
environmental strategy (Schaltegger & Synnestvedt, 2002). Hence, the final question
might not be whether it pays to be green but rather when it pays to be green, and the
discussion of the causality between CSR and financial performance becomes relevant
(ibid). If assuming that the economic performance is the dependent variable, there are
also a number of factors that will affect the relationship. Examples are the consumers’
willingness to pay for environmentally friendly goods, the environmental situation in
the country, the stakeholder pressure in the setting (e.g. depending on industry), the
level of available technological solutions, and the level of competition (ibid). A more
extensive discussion on causality will follow.
2.5 Literature Review The extensive amount of research on the correlation between CSR and financial
performance, of both qualitative and quantitative nature, take on different approaches
and use different variables. Regardless of what types of variables that are used, these
studies can broadly be divided into two groups, namely studies in which financial
performance is used as dependent variable as well as studies where some kind of
corporate social responsibility performance, or social concern, is used as dependent
variable.
2.5.1 Financial Performance as Dependent Variable
Research on the correlation between financial performance and CSR with financial
performance as dependent variable is widespread and has shown ambiguous results
(McWilliams & Siegel, 2000). The results from these studies can roughly be grouped
into those with results showing negative correlation, results showing positive
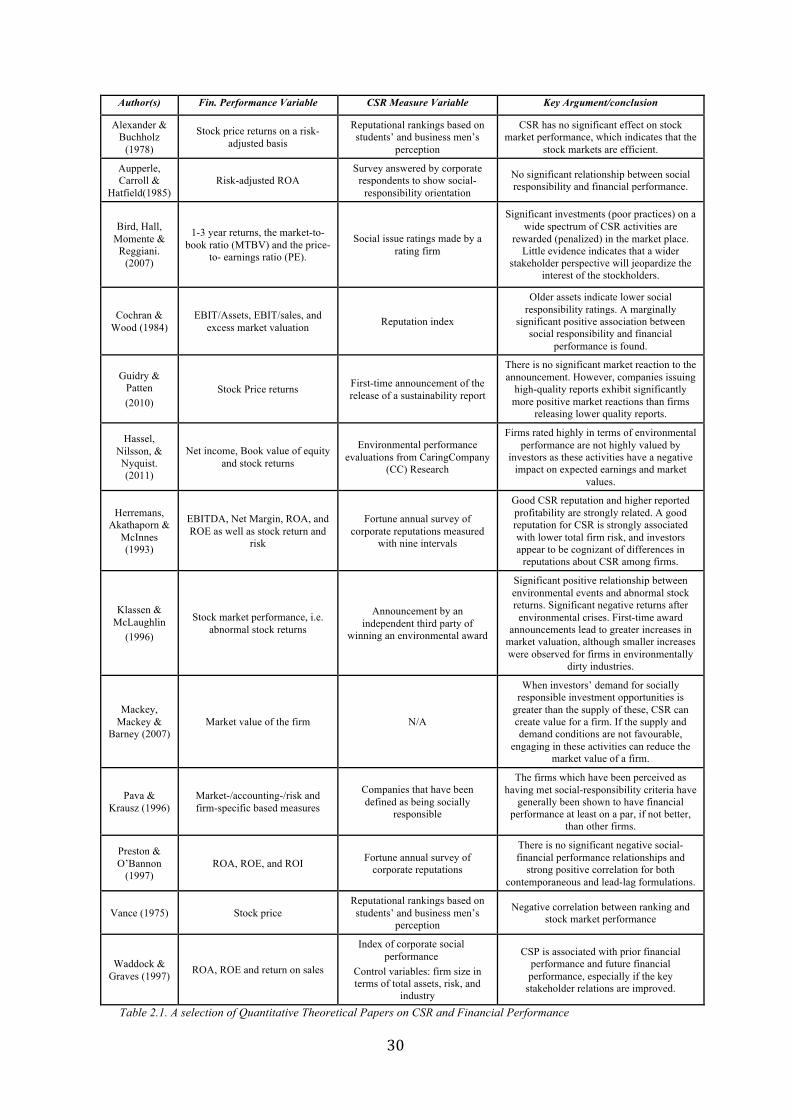
correlation, and results showing no or insignificant correlation. In Table 2.1 below, a
selection of theoretical papers on CSR and financial performance from a quantitative
perspective is outlined, in which the variables and main conclusions from the selected
studies are summarized.
30
Author(s) Fin. Performance Variable CSR Measure Variable Key Argument/conclusion
Alexander & Buchholz
(1978)
Stock price returns on a risk-adjusted basis
Reputational rankings based on students’ and business men’s
perception
CSR has no significant effect on stock market performance, which indicates that the
stock markets are efficient.
Aupperle, Carroll &
Hatfield(1985) Risk-adjusted ROA
Survey answered by corporate respondents to show social-
responsibility orientation
No significant relationship between social responsibility and financial performance.
Bird, Hall, Momente &
Reggiani. (2007)
1-3 year returns, the market-to-book ratio (MTBV) and the price-
to- earnings ratio (PE).
Social issue ratings made by a rating firm
Significant investments (poor practices) on a wide spectrum of CSR activities are
rewarded (penalized) in the market place. Little evidence indicates that a wider
stakeholder perspective will jeopardize the interest of the stockholders.
Cochran & Wood (1984)
EBIT/Assets, EBIT/sales, and excess market valuation Reputation index
Older assets indicate lower social responsibility ratings. A marginally
significant positive association between social responsibility and financial
performance is found.
Guidry & Patten (2010)
Stock Price returns First-time announcement of the release of a sustainability report
There is no significant market reaction to the announcement. However, companies issuing
high-quality reports exhibit significantly more positive market reactions than firms
releasing lower quality reports.
Hassel, Nilsson, & Nyquist. (2011)
Net income, Book value of equity and stock returns
Environmental performance evaluations from CaringCompany
(CC) Research
Firms rated highly in terms of environmental performance are not highly valued by
investors as these activities have a negative impact on expected earnings and market
values.
Herremans, Akathaporn &
McInnes (1993)
EBITDA, Net Margin, ROA, and ROE as well as stock return and
risk
Fortune annual survey of corporate reputations measured
with nine intervals
Good CSR reputation and higher reported profitability are strongly related. A good reputation for CSR is strongly associated with lower total firm risk, and investors appear to be cognizant of differences in
reputations about CSR among firms.
Klassen & McLaughlin
(1996)
Stock market performance, i.e. abnormal stock returns
Announcement by an independent third party of
winning an environmental award
Significant positive relationship between environmental events and abnormal stock returns. Significant negative returns after environmental crises. First-time award
announcements lead to greater increases in market valuation, although smaller increases were observed for firms in environmentally
dirty industries.
Mackey, Mackey &
Barney (2007) Market value of the firm N/A
When investors’ demand for socially responsible investment opportunities is
greater than the supply of these, CSR can create value for a firm. If the supply and demand conditions are not favourable,
engaging in these activities can reduce the market value of a firm.
Pava & Krausz (1996)
Market-/accounting-/risk and firm-specific based measures
Companies that have been defined as being socially
responsible
The firms which have been perceived as having met social-responsibility criteria have
generally been shown to have financial performance at least on a par, if not better,
than other firms.
Preston & O’Bannon
(1997) ROA, ROE, and ROI Fortune annual survey of
corporate reputations
There is no significant negative social-financial performance relationships and
strong positive correlation for both contemporaneous and lead-lag formulations.
Vance (1975) Stock price Reputational rankings based on students’ and business men’s
perception
Negative correlation between ranking and stock market performance
Waddock & Graves (1997) ROA, ROE and return on sales
Index of corporate social performance
Control variables: firm size in terms of total assets, risk, and
industry
CSP is associated with prior financial performance and future financial performance, especially if the key
stakeholder relations are improved.
Table 2.1. A selection of Quantitative Theoretical Papers on CSR and Financial Performance

31
2.5.1.1 Studies Indicating a Negative Relationship
‘There is one and only one social responsibility of business – to use its resources and
engage in activities designed to increase profits so long as it stays within the rules of
the game, which is to say, engages in open and free competition without deception
and fraud’ (Friedman, 1970).
This well-known quotation made by Friedman (1970) supports the neo-classical
theory stating that the role of the management of a company is to make decisions
solely based on maximization of the corporation’s long-term market value, which
includes the wealth of the company’s owners (Bird et al., 2007). As the management
of a company acts as an agent for shareholders, it has no mandate to take initiatives on
socially responsible activities that do not generate increased incomes to the firm (Pava
& Krausz, 1996 based on Friedman 1970). This neo-classical view implicates that
investments in CSR activities will put the company at a competitive disadvantage,
which in turn leads to a negative relationship between these socially-responsible
activities and market performance (Aupperle et al., 1985).
Among the selected studies in Table 2.1, there are only a few that find a significant
negative relationship between CSR activities and financial performance.
Consequently, there is little evidence supporting the neo-classical advocates’ belief in
the sole responsibility of the business, namely to increase profits.
An early study showings a negative relationship is Vance (1975), where the CSR
engagement is measured as firms’ degree of social responsibility based on subjective
perception and ratings made by businessmen and students. Vance (1975) uses the
ratings as a proxy for CSR to find a correlation with stock price, and it is concluded
that CSR firms are not good investments for investors as a negative correlation is
found between CSR and stock price.
In a more recent study, Hassel, Nilsson & Nyquist (2011) present similar results as
they examine how CSR affects the financial performance of Swedish companies,
where CSR and financial performance are represented and measured by
environmental information and market value, respectively. The study concludes that
high environmental performance is costly and that this type of investment therefore

32
negatively affects the expected earnings and market value. They explain their results
by using three different factors. First of all, they state that companies’ environmental
performances are perceived as window dressing of book values and financial
performance among investors. Secondly, they argue that environmental activities are
made at the expense of increased profits, which investors react negatively upon as
their return decreases without a corresponding reduction in risk. The last factor used
as explanation is the fact that the market is short-term oriented, which makes
investors ignore longer-term environmental information when making investment
decisions. Companies with a highly rated environmental performance are therefore
not rewarded by investors (Hassel et al., 2011).
2.5.1.2 Studies Indicating a Positive Relationship
The traditional view of stock investors as being profit maximizers exclusively
interested in earning the highest level of future cash-flow for a given amount of risk
has over the years become criticized (Pava & Krausz, 1996). Initially, it was often
assumed that investors were unwilling to pay a premium for socially responsible
corporate behaviour, however this has proven to be changed (ibid). In contrast to the
neo-classical view, the stakeholder theory takes a different approach, which often is
seen to conflict with the former (Bird et al., 2007). Instead of benefiting shareholders
only, the stakeholder theory claims that companies have obligations to a wider group
of stakeholders and that resources should be utilized in a way that not only benefits
the shareholders (Freeman, 1984). This has been criticized, but evidence shows that a
wider perspective is not necessarily negative. Instead, several studies have found a
positive relationship between different types of CSR activities and financial
performance. In fact, it has been suggested that there is no conflict between the two
approaches as long as outlays on CSR activities have positive influence or no
influence at all on the market valuation of a company (Bird et al., 2007).
Among the older studies of the relationship between CSR activities and financial
performance with financial performance as dependent variable, Cochran & Wood
(1984) use reputation index as CSR proxy and various financial performance
indicators. They study the correlation between these variables over two five-year
periods across a wide range of US industries, 29 and 28 respectively. Cochran &
Wood find a marginally significant positive correlation between the social

33
performance proxy and various financial performance indicators and use asset age as
an explaining factor. They state that firms with higher CSR rankings have higher
reported asset values as they use their assets differently, which affects the financial
results positively compared to older competitors (Cochran & Wood, 1984).
Together with 20 other studies from 1972 to 1992, the study made by Cochran &
Wood (1984) forms a base for a later study made by Pava & Krausz (1996). Pava &
Krausz use the results from these 21 studies, namely twelve studies finding a positive
correlation, eight finding no correlation, and only one finding a negative correlation,
to argue that there is an indication that firms investing in CSR perform at least as well
as other firms. In their own study, they examine the long-term financial performance,
defined by various market-, accounting-, risk- and firm-specific based measures of
performance, of a group of US firms that have been identified as being socially
responsible by the Council on Economic Priorities. The results from the study are
consistent with the majority of the previous studies they have presented as they find
evidence supporting a positive correlation between socially responsible activities and
financial performance (Pava & Krausz, 1996).
Herremans et al. (1993) examine the correlation between corporate reputations and
various accounting-based financial measures, stock return and risk respectively,
among manufacturing companies in the US. They divide the companies into two
groups depending on to what extent they are perceived to encounter social conflicts,
to analyse differences. The results show that there is a positive relationship between
socially responsible activities and financial performance for both groups. However,
for the industries that are more exposed to social concerns, e.g. chemicals, the
profitability and stock market performance effects are more noticeable. A control
variable testing leverage also shows that companies with a poorer socially responsible
reputation have slightly greater leverage.
Klassen & McLaughlin (1996) make a similar study, however using an event study
approach, in which they examine the correlation between public announcements of
environmental performance rewards and stock market performance, i.e. abnormal
stock returns. In their study, they present evidence supporting the hypothesis that
strong environmental management has a significant positive impact on stock returns.
34
In addition, they find differences between industries and for first-time awards. In
general, first-time awards have shown to have a greater impact on market valuation,
but the impact on stock return for firms acting in environmentally dirty industries is
shown to be less than the impact on other firms. Consequently, it is concluded that the
market rewards firms that receive awards for investing in socially responsible areas
(Klassen & McLaughlin, 1996).
Preston & O’Bannon (1997) study the correlation between social performance,
defined as social reputation in terms of different social aspects, and financial
performance specified as accounting-based financial measures. The study is
conducted on 67 large US firms in the time-span of 1982-1992. The results presented
support that there is a strong positive correlation between social reputation and
financial performance, which is strongly backed up by the stakeholder theory.
A more recent study within the field made by Mackey et al. (2007) takes a different
approach and they claim that the impact of CSR investments on a firm’s market value
mainly is dependent on the relative supply of and demand for CSR investment
opportunities among investors. The study is based on the assumption that some
investors prefer to invest in firms engaging in socially responsible activities, which
companies use as a way to sell their product to current and potential investors. By
engaging in CSR activities, the companies reach investors who value such activities,
despite the investments’ negative impact on the firm’s present value of cash flows.
The authors suggest that there can be a positive correlation between socially
responsible investments and firm value, despite the investments’ negative impact on
present value of cash flows. Mackey et al. construct a model that shows the
equilibrium in which the demand and supply for socially responsible investment
opportunities meet. The authors conclude that if investors’ demand for socially
responsible investment opportunities exceeds the supply of these investment
opportunities, meaning that there are not enough companies engaging in socially-
responsible activities, then such investments can create economic value for a firm.
Bird et al. (2007) find various results including evidence showing a correlation
between financial performance and CSR efforts. They examine a range of CSR
activities’ impact on the value of listed firms in the US market, where CSR

35
performance is measured as positive or negative scores of five different activities. The
results show a positive relationship between financial performance and one of the
CSR variables, namely strength score for diversity. This implies that the market
rewards companies for engaging in diversity matters. In addition, Bird et al. find
evidence that companies that are associated with significant investments in a wide
range of CSR activities will be rewarded in the marketplace, which implies that there
are reputational benefits to gain from engaging in CSR activities other than those one
might consider to be related directly to the CSR activities (Bird et al., 2007).
Alexander & Buchholz (1978) state another explanation for this positive correlation,
which is based on a view developed by Moskowitz (1972). Simply, managers that are
socially aware and concerned and pursue those types of activities are more skilled
managers overall and are hence able to generate higher profitability, thus making its
company a better investment.
2.5.1.3 Studies Indicating No or Insignificant Relationship
As mentioned above, there should be no conflict between the neo-classical view of a
corporation and the stakeholder theory as long as CSR investments have a neutral or
positive influence on the company’s market valuation (Bird et al., 2007). The studies
finding a positive correlation were specified in the previous section, however there are
also several studies that indicate no or insignificant relationships between socially
responsible activities and financial performance.
In their early study, Alexander & Buchholz (1978) use social responsibility rankings
made by students and business men as CSR measure and aim to examine if there is a
correlation between this measure and stock return on a risk-adjusted basis. The risk of
the stock was approximated based on the beta coefficient. The firms examined were
US firms over a five-year period. The results and analysis showed that there was no
correlation between the two variables. They link their results to the efficient market
theory, which states that positive or negative effects associated with the degree of
social responsibility of a firm are reflected immediately in its stock price. As the
majority of the firms included in the study did not show abnormal stock returns, the
authors conclude that social responsibility does not affect stock prices. In addition,
36
they conclude that there is an insignificant relationship between risk and degree of
social responsibility.
Aupperle et al. (1985) make use of a forced-choice survey method answered by CEOs
from American corporations to find a firm’s social-responsibility orientation. The
social concerns are then correlated to the firms’ profitability measured as return on
assets. None of the different tests and results shows a significant relationship between
a strong orientation toward CSR and financial performance. In addition, they
conclude that having a corporate social responsibility committee on the board does
not lead to higher profitability in comparison to firms who do not have a CSR
committee on their board.
Guidry & Patten (2010) examine announcements of the release of a first-time
sustainability report among publicly traded US-based corporations over an 8 year
period, and how these announcements affect the financial performance measured by
stock price. They use an event study methodology where the standard CAR
calculation model is supplemented with two variables incorporating industry risk and
size of the firm. The authors also study the importance of report quality and test if
differences in the report quality have an impact on how the market reacts on the
announcements. The authors find no significant market reaction related to the
issuance of a sustainability report, which indicates that there is no correlation between
this type of CSR and financial performance, and that investors do not assign value to
sustainability reports. However, Guidry & Patten (2010) present evidence stating that
high-quality reports with meaningful disclosures do have an impact on the market as
they yield more positive market reactions than lower quality reports.
McWilliams & Siegel (2000) support the results presented above as they argue that
the reason for previous studies’ inconsistent results is the usage of misspecified
models. In their study, they want to adjust for this and take a research & development
(R&D) variable into account as they claim that the exclusion of this in other studies
have lead to upwardly biased estimates of the CSR measure. They argue that many
companies that engage in CSR also are pursuing a differentiation strategy including
significant investments in research and development (R&D), and that it is these R&D
investments that affect the firm performance rather than the CSR activities. Their

37
study is based on two models, one including R&D intensity and the other one
excluding the same, and they conclude that when the model incorporates the R&D
aspect, CSR has a neutral impact on financial performance (McWilliams & Siegel,
2000).
2.5.2 CSR as Dependent Variable
There is also some previous research made on the opposite relation between the two
variables, i.e. the financial performance being the independent variable and CSR
being the dependent variable. Waddock & Graves (1997) find a positive relationship
between corporate social performance (CSP) and financial performance where CSP is
the dependent variable. This is supported by the slack resources theory, which argues
that firms with slack resources, possibly available from strong financial performance,
may have greater opportunities to invest in CSR (Waddock & Graves, 1997).
Waddock & Graves’ (1997) results further indicate a possible relationship in the other
direction as well, and hence they suggest financial performance as being both the
dependent and independent variable. Based on these findings, they discuss a possible
virtuous cycle, and where that cycle begins. The question concerns whether it is the
initial availability of slack resources due to good financial performance that first leads
to CSR performance, or if those initial extra resources stem from good CSR
performance. In any case, the authors conclude that better CSR in some way is related
to better financial performance (ibid).
Preston & O’Bannon (1997) draw similar conclusions as they examine whether there
is a connection between corporate social- and financial performance, and in that case
the direction of the relationship, i.e. which variable affects the other, and if there is a
synergistic relationship. The study is based on six different hypotheses and the
proxies used for social and financial performance are the Fortune annual corporate
reputation survey and three different accounting-based measures (ROE, ROA, ROI),
respectively. The evidence found shows significant positive correlations between the
variables, and no negative correlations, which supports the stakeholder theory.
Specifically, the authors’ ‘available funds hypothesis’ is supported in 16 out of 30
tests while contemporaneous positive correlations are dominating in 14 cases. The
‘available funds hypothesis’ states that “.. although firms may wish to follow the
38
normative rules of good corporate citizenship at all times, their actual behaviour may
depend on the resources available” (Preston & O’Bannon, 1997). In practice, this
would imply that a strong financial performance enables, or at least facilitates,
investments in CSR activities. Based on these results, the authors conclude that the
best explanations for the social-financial performance correlation are either positive
synergies or the ‘available funding hypothesis’ (ibid).
2.5.3 Critique of Various CSR Measures
The studies presented above have used various proxies to express companies’
engagement in environmental and social issues, and some of them have been under
some criticism, which is presented below.
First of all, Cochran and Wood (1988) criticize the use of different types of
reputational indexes as a proxy for social responsibility, as these indexes are based on
surveys and therefore are highly subjective. This may cause significant variation of
perception from one observer to another. Ullman (1985) directs similar criticism
towards reputation indexes and add that the ratings reflect other unknown influences.
Pava & Krausz (1996) direct criticism towards the use of one specific survey, namely
the Fortune corporate reputation survey. Despite being regarded as authoritative by
some authors, Pava & Krausz question the measures’ appropriateness, as it is not clear
whether it measures CSR properly since only two of the eight reputation variables are
linked to CSR (Herremans et al., 1993; Pava & Krausz, 1996).
Instead of a reputational index as CSR measure, a content analysis is often found in
studies on the relationship between CSR and financial performance (Cochran &
Wood, 1988). A content analysis is a relatively objective method where the reporting
of CSR activities in company publications is measured. The major criticism directed
towards this CSR measure is the subjectivity related to the choice of variables to
measure. Another drawback with the content analysis is that it relies on what the firms
say they are doing, which may not reflect what the companies actually are doing
(Cochran & Wood, 1988).
In some studies social disclosure has been used as a proxy for social performance,
which also has been criticised (Ullman, 1985). Ullman (1985) argues that there is no

39
significant link between social disclosure and social performance, which makes social
disclosure an unreliable proxy for social performance.
2.6 Clarification As has been seen in this chapter, the relationship between CSR activities and financial
performance can be measured in various ways and by using different variables. Pava
& Krausz (1996) categorise financial variables into four major sections, namely
accounting-based measures, market-based measures, measures of risk, and other firm-
specific characteristics. Among the studies presented above, the most frequently used
appear to be accounting-based and market-based measures. Accounting-based
measures are different key ratios calculated based on financial statements, while
market-based performance measures are based on market data, such as the stock price
(Pava & Krausz, 1996). According to Ullman (1985), the choice of variable is linked
to the time period of the study. The majority of studies using accounting based
measures cover a medium- to long-term time period, corresponding to 1 to 10 years.
Market-based studies on the other hand are often more short-term and do not cover
more than 24 months. As for the measurement of financial performance, various
variables have been used as proxies for companies’ engagement in CSR activities in
these previous studies. Many of them have been criticised, which was discussed
above (Pava & Krausz, 1996; Ullman, 1985).
For the purpose of this study, the main criteria for the measures chosen are objectivity
and measurability. It is deemed necessary that the measure is objective in order to
avoid subjectivity, which has been subject to much criticism before and may be
affected by opinions about the company that are not related to the CSR activities and
may lead to misleading results. As a result, a ranking and/or report that is based on
publicly available data and made by a third party appears to be suitable as a proxy for
CSR engagement and is considered to be more objective than other proxies due to its
transparency. A report available for the Swedish market is the Folksam CSR ranking
report, which includes an evaluation of the work on environmental and human rights
issues among publicly listed companies on the Stockholm Stock Exchange. A detailed
description of the report and its characteristics will be presented in the Method
chapter.

40
The Folksam CSR ranking report was published every year from 2006 until 2009 and
thereafter it has been published every other year. In order to see how this CSR
ranking report publication is received among investors, it is deemed interesting to see
if and how the publication affects the stock price, and hence the underlying value, of
the firm. The purpose of the ranking report is to compare the listed companies’ work
on CSR, and even though the information is publicly available for each company, the
Folksam CSR report may add value to investors’ decision-making as it gives a spot on
view of a specific company’s CSR engagement in relation to other companies. As the
objective is to see the direct reaction related to the publishing, a market-based
financial performance measure is preferable due to the short time period involved, as
was stated by Ullman (1985). In this study, stock price is considered to be the most
suitable measure when examining the potential effect of the release of a CSR ranking
report as any new information, according to the efficient market theory, immediately
should be reflected in the stock price. According to the semi-strong efficient market
theory, the stock price should incorporate all information that is available for the
company. Consequently, the stock price should be immediately affected in case the
ranking creates value to the investors.
In the next chapter, the hypotheses used to test the CSR report publication’s impact on
the value/financial performance of the Swedish listed firms are presented.

41
3. Hypothesis Formation In this chapter, the hypotheses that this thesis intends to test are presented. First of
all, the main hypothesis is justified. This will be followed by four sub-hypotheses.
3.1 The Study’s Hypotheses In the development of the hypotheses, this study bases its assumptions on the second
efficient market theory, i.e. the semi-strong efficient market, which suggests that
investors can only use information that is not publicly available to be able to benefit
from abnormal returns on investments, and that this is only possible in the short-run.
This implies that when investors receive new information about a company’s
activities, they take this information into account when making decisions about
buying or selling that company’s stock. Based on this, the release of new information
about a company should immediately and unbiasedly lead to a modification of the
company’s share price, and this makes long-run abnormal returns unachievable
(Brealey et al., 2014).
In the case of the CSR ranking report that is published by Folksam every other year,
which is based on publicly available data, it is reasonable to believe that the
publication should not have any influence on the stock price. According to the semi-
strong market theory, the information should already be reflected in the stock price.
However, despite the fact that all information that is used for the CSR rankings is
publicly available, this does not guarantee that the investors are aware of the
companies’ actual CSR engagement in relation to other companies. Consequently,
there is a possibility that the ranking adds new information, and thus value, to the
investors’ decision making and therefore affects their investment decisions. If this is
the case, the new information should be reflected in the stock price immediately. This
can be linked to the signalling theory, which indicates that a release of CSR
information could send a signal to investors on which they react and base their
investment decisions. The impact from the CSR rating publication is dependent on
what signal the published information sends to the investors. If a specific rating is
considered positive by investors, the market should react thereby, and vice versa.
Since the investors’ reaction to Folksam’s CSR ranking report is difficult to predict,
42
the idea behind this study is to investigate whether the ranking has any impact at all
on the stock returns. The formulated hypotheses are therefore double-sided in order to
avoid making assumptions of the impact beforehand.
When reviewing earlier studies and literature discussed in the previous chapter, there
seems to be no consistent view on if and how CSR creates financial value or not.
Several different measures and variables have been tested for, and there is little
evidence supporting that CSR and financial performance are directly related.
However, as mentioned, the interest for CSR is growing, as are the efforts put in CSR
activities. Consequently, this study’s first and main hypothesis investigates whether it
is true that CSR does not create direct financial value. It is stated as follows:
Hypothesis 1: Folksam’s publication of CSR rankings does not have an impact on the
companies’ stock returns in the form of abnormal returns
In addition, four separate sub-hypotheses will examine whether the impact on stock
returns differs over time, or whether it depends on what segments the data is grouped
into. The sub-hypotheses used are presented next.
1. As the interest for and attention towards CSR seems to be continuously
increasing, it is likely that there is a difference in how much the release of
Folksam’s report affected stock returns in 2013, in comparison to when the report
was released for the first time. To examine these differences over time, 2006 has
been chosen as a reference year to which the test results from 2013 separately are
compared. In addition to being the first year of the release, 2006 is similar to
2013 in terms of economic situation of the Swedish market and value of the
OMX Stockholm PI. Based on the general perception that the interest for CSR
has increased over time, the first sub-hypothesis is formulated as follows:
Sub-hypothesis 1: There is a difference between the impact of Folksam’s CSR
report release on stock returns in the beginning of the studied period (2006) and
in 2013
43
2. As can be seen in the CSR and Financial Markets chapter, the economic
development in Sweden and the rest of the world has fluctuated over the past 10
years. Specifically for Sweden, the years of 2006 and 2007 were characterized by
growth, while the following years were hit by the financial crisis. This lead to an
economic downturn that lasted until 2012. Consequently, the economic
environment in which the Swedish companies operated during these years has
varied. A financial crisis could potentially have an impact on how investors
prioritise CSR investments/engagement and how they value these. In addition, as
pointed out by Schwert (1989), stock price volatility is higher during a recession
than during times of prosperity. It is therefore considered relevant to examine if
there are any differences between the cycle periods and if, in a recession, CSR is
not as high a priority as during other times, since resources and focus need to be
put elsewhere. To distinguish between the different economic situations, the
years have been bundled into pre-crisis 2006-2007, crisis 2008-2011 and post-
crisis 2013. The hypothesis to test for the economic fluctuations is formulated as
follows:
Sub-hypothesis 2: There is a difference between the impact of Folksam’s CSR
report release on stock returns pre-, during- and post-crisis
3. As some industries or fields have a naturally higher operational risk, companies
operating in these industries are often regarded as being ‘bad’ and are hence more
exposed to the risk of criticism and accidents, while others are “better” and less
exposed to this risk (Klassen & McLaughlin, 1996). In this study, the industries
regarded as having a high operational risk are those with issues of high
greenhouse gas emissions, high energy consumption, as well as other industry
specific issues. For the Swedish market, those industries deemed to have a high
operational risk are utilities, energy, capital goods, materials and transportation.
This is also supported by several other authors (e.g. Guidry & Patten, 2010;
Herremans et al., 1993; Brammer & Millington, 2005; Klassen & McLaughlin,
1996). After identifying the companies with a high operational risk, it is
interesting to see if the reaction when the ranking report is released differs within
this group for those that receive a high ranking versus a low ranking. The
motivation for this is that it might be more important for investors that a company

44
that is considered to be an operationally high-risk company is engaging in CSR.
This leads to the third sub-hypothesis:
Sub-hypothesis 3: Within the group of operationally high-risk companies, there is
a difference between the impact of Folksam’s CSR report release on stock returns
for companies that receive top environmental rankings compared to those that
receive low environmental rankings
4. As Herremans et al. (1993) and other previous researchers highlight, larger
companies are more visible and consequently more vulnerable to negative
publicity related to CSR. As a result, it is likely that there is a difference in how
investors react to high and low rankings in Folksam’s CSR report. These
companies are often multi-national and multi-divisional companies who are
exposed to differing business norms and standards, regulatory frameworks, and
stakeholder demand for CSR across the nations they are operating in. Hence, they
are more dependent on good relations with stakeholders and maintaining their
“license to operate”. To test for the investors’ reactions, companies listed on large
cap are grouped depending on top-, bottom- and zero- ranking, and tested
separately. Thus, the final sub-hypothesis is:
Sub-hypothesis 4: There is a difference between the impact of Folksam’s CSR
report release on stock returns for large cap companies with a high ranking
compared to those with a low ranking
3.2 Delimitations In all hypotheses, the companies are grouped into segments depending on ranking.
The main hypothesis is limited to investigating the top, bottom, and zero companies
for all years, while the first sub-hypothesis tests for 2006 and 2013 only. The second
sub-hypothesis includes data from all years, which are distinguished by pre-, during-
and post-crisis. The third and fourth sub-hypotheses on the other hand investigate top-
and bottom performing companies within the selected sample from 2013 only. In
addition, the third sub-hypothesis is limited to investigating environmental rankings
only, as these rankings separately are more closely related to operational risk.

45
4. Method In this chapter, the approach and execution of the study is presented. First of all, a
description of the Folksam CSR ranking report is given together with a presentation
of other CSR indexes on the global market and a comparison between these and
Folksam’s report. Secondly, a theoretical methodology section presents the literature
and theories behind the chosen methodology. This is followed by data collection,
criticism of data, and adjustment of data. Further, a comprehensive description is
made of the event study approach used and the statistical testing procedure of the
hypotheses. Lastly, the study’s validity, reliability and replication is evaluated.
4.1 The Folksam CSR Ranking Report Folksam is one of Sweden’s largest asset managers, insurance- and pension
companies (Folksam, 2015). They have approximately four million customers and
manage more than 230 billion SEK on behalf of their clients. Since 2006 Folksam has
released a report on Swedish listed companies work within CSR yearly until 2009,
and since then every other year. The main purpose of this CSR report is, as stated on
their website, to affect companies to take on more responsibility for the environment
and for human rights (Folksam, 2013).
The report includes a study and ranking of the Swedish listed companies on OMX
Nordic Stockholm exchange’s large-, mid- and small cap (Folksam, 2013). The report
is based on information on the companies’ engagement in the environment and in
human rights, with focus on each company’s ability to handle risks concerning these
two areas, namely environmental risks and risks related to human rights. The
assessment of these two areas is based on the companies’ publically available
information, which is found on their websites, in their annual reports, in possible
sustainability reports as well as in similar other reports and press releases. Moreover,
information is collected from other sources such as media, international organisations,
governments, etc., to complement and check the information collected directly from
the companies. Then, a final judgement is made based on all collected material (ibid).

46
The analyses of the two areas, environment and human rights, are based on the
criteria defined by the UN Global Compact & OECD’s guidelines for multinational
companies, which are presented in figure 4.1 below (UN Global Compact, 2015).
These principles are in turn based on internationally approved standards, such as
ISO14001 and SA8000 (Folksam, 2013).
Figure 4.1. The UN & OECD's guidelines for global compact (UN Global Compact, 2015)
In the Folksam ranking report, five essential components of the companies’
management systems are examined for each of the criteria. The definition of a
management system is the same as the one used in several other recognized
international standards, such as ISO9000, i.e. based on the PDCA-cycle (Plan, Do,
Check, Act). The five components of the analysis are:
1. Policy: Does the company have a relevant policy, e.g. to promote health and
safety?
2. Management system: Are there routines and procedures and an organisation
that can ensure compliance with the policy?
The UN Global Compact's 10 Principles The ten principles have universal consensus and are derived from The Universal Declaration of Human Rights, The
International Labour Organization's Declaration on Fundamental Principles and Rights at Work, The Rio Declaration on Environment and Development and The United Nations Convention against Corruption
Human Rights
Principle 1: Businesses should support and respect the protection of internationally proclaimed human rights Principle 2: Make sure that they are not complicit in human rights abuses
Labour Standards
Principle 3: Businesses should uphold the freedom of association and the effective recognition of the right to collective bargaining
Principle 4: The elimination of all forms of forced and compulsory labour Principle 5: The effective abolition of child labour
Principle 6: The elimination of discrimination in respect of employment and occupation
Environment Principle 7: Businesses should support a precautionary approach to environmental challenges
Principle 8: Undertake initiatives to promote greater environmental responsibility Principle 9: Encourage the development and diffusion of environmentally friendly technologies
Anti-Corruption
Principle 10: Businesses should work against corruption in all its forms, including extortion and bribery

47
3. Plans/programs: Is the policy broken down into relevant targets and
objectives, and are there concrete plans of action for these?
4. Accounting: Is there available information to be able to assess to which
extent improvements are achieved?
5. Verification: Does any third party verify the management system?
The two areas of consideration, the environment and human rights, are briefly
described below.
4.1.1 The Environmental Analysis
The environmental analysis consists of a general assessment of the environmental
management system, i.e. environmental management, and a control of significant
direct or indirect environmental impact, i.e. environmental performance.
The evaluation of the environmental management has the following criteria:
1. Environmental policy and plans: Evaluates the company’s overall ambition
level of environmental engagement. Proactive ambitions and plans will be
rewarded
2. Management systems & the organisation: Evaluates whether a management
system is implemented in the organisation
3. External certificates: Evaluates whether the management system is certified
against a relevant standard
4. Environmental reporting: Assesses the overall quality of the reporting systems
5. Supply chain management: Assesses whether the suppliers are part of the
management system
The second part, the environmental performance, assesses whether the company can
handle their most significant environmental impact, under the following criteria:
1. Emission of greenhouse gases
2. Energy consumption
3. Industry specific criteria3
3 Examples of industry specific criteria are emissions of hazardous substances, transport usage etc. (Folksam, 2015).
48
4.1.2 The Analysis of Human Rights
The analysis of human rights has three main areas of interest; the employees, the role
of the company in the surrounding society, and human rights in the supply chain. The
criteria for these are as follows:
4.1.3 The Rating System
For each criteria evaluated in the environmental analysis and the analysis on human
rights, companies are given points on a scale from 0 to 7. Maximum number of points
is given to those companies who cover all five components of the criteria in their
reporting, or if there are other clear indications of the company in question being very
well prepared in the matter. If the reporting indicates improvement work regarding
policy, management system or plans, some points may be received. An example could
be a graph over energy consumption over time, signalling a clear and steady
improvement curve. For each main area, the sum is calculated of the points given for
the different criteria. Thereafter, the mean for the main area is calculated, which is the
final point used in the ranking (Folksam, 2013).
4.1.4 The Industry Classification
In the report, Folksam also assesses the industry performance and industry-risk,
respectively, within the area of CSR. The industry classification used in Folksam’s
CSR ranking report has gone from being based on Affärsvärlden’s industry
classification, one of the biggest business magazines in Sweden, for the years of 2006
to 2009, to classifying the industries as suggested by MSCI/Standard & Poor’s Global
Industry Classification Standard (GICS) since 2011. Henceforth, as the industry
classification differs slightly from the first reports to the more recent ones, only the
latter classification has been chosen to use for this study, as it has the advantage of
Supply chain:
1. Codes of conduct
2. Management systems &
plans/verification systems
3. Reporting
Society:
1. Business-related social responsibility 2. Corruption
Employees:
1. Health & safety 2. Discrimination 3. Freedom of association 4. Work & wages 5. Child labour 6. Forced labour
49
being in English and fully international. An overview of the two systems can be found
in Appendix 9.1.
As mentioned, the report also assesses the general risk associated with the industries,
as high, medium or low, based on a global perspective. The overall assessment of
industry risk is used as a reference or measurement of how important it is for the
companies within the industry to consider these types of social responsibility issues
(Folksam, 2013). The same guidelines as used for grading the companies, i.e. the
OECD and UN Global Compact, are used to determine the risk of each specific
industry. For example, any industry with a high frequency of serious and/or
systematic deviations from the standards as defined by the UN & OECD, are
classified as a higher risk industry.
4.1.5 Other CSR Indexes
As for the Swedish market, Folksam appears to be the single available well-renowned
index that ranks all listed companies on the Swedish stock market. However, there are
a couple of other known indexes and rankings internationally. These do most of times
not consider all, or even some, of the Swedish companies, but are interesting to
review to benchmark the Folksam ranking report against other available indexes
overall.
A selection of other considerable reports and indexes are described shortly below, and
thereafter a section on critique of the Folksam ranking report is presented. These are
presented in alphabetic order.
1. Business in the community (BITC): BITC is a more than 30 years old, business-
led, charity organisation, with HRH The Prince of Wales as president. With a
network of over 800 organisations as members, they offer practical guides and
programmes, training and peer learning, as a part of making the business
community more responsible. Since 2002, they also release a business
responsibility report, namely the CR Index of BITC. The index report is, in
contrast to Folksam’s report, based on an online survey for the companies
followed by a self-assessment process to identify strengths and gaps, and is based

50
on a five star rating system. All submissions from the companies must be signed
at board level, and BITC then reviews the consistency and validity of the
submissions. Any organisation, regardless of location, size, industry or similar
can join, but it requires an active engagement. In the BITC report of 2014, the
rating includes 77 companies, defined as either UK only-coverage, National
coverage, Global coverage, or as two companies under Australia-coverage.
Moreover, the companies are classified according to industry sector (BITC,
2015:1; BITC, 2015:2).
2. Calvert Social Index: This index was created in 2000 by Calvert Investments and
covers only US based companies. In contrast to Folksam, the Calvert Index has
chosen to take the 1 000 largest companies included in the Dow Jones TMI,
measured on total market capitalisation, and then assesses whether they satisfy
the criteria that the Calvert Social Index requires, to be included in the index. The
criteria to satisfy are 1) environment, 2) community relations, 3) governance and
ethics, 4) human rights, 5) indigenous people’s rights, 6) product safety &
impact, and 7) workplace. Just as Folksam, they base their decision on whether
the criteria are satisfied for each company, by looking at the companies’ publicly
available information, advocacy organisations, corporate engagement, and their
own former Calvert Reports. However, in contrast to Folksam’s ranking report,
only those companies who satisfy all criteria will be included in the index
(Calvert, 2015:1-3).
3. CDP A-list Index: CDP works with businesses, investors, cities and governments
to analyse the global climate situation around the world. They release different
indexes, for example divided by supply chains, global forests, global cities and
the so-called A-list of companies. The A-list index, launched in 2010, is probably
the most relevant one to be discussed in relation to Folksam. It is however, in
contrast to Folksam’s report, based on responses by the companies themselves
about greenhouse gas emissions, water usage, climate strategies, etc. The
companies receiving an “A-grade” are then presented on a list segmented by
industry, and the number of years the company has been on the A-list, or if they
are new, is also stated (CDP, 2014; CDP, 2015).

51
4. CR Magazine 100 Best Corporate Citizens: Since 2009, the CR Magazine
releases a ranking of the 100 best corporate citizens, covering the Russell 1000
index which is an index of the largest US companies, every year. The ranking is
however, just as Folksam’s, based on publicly available information, and points
are given for “Disclosure”, “Policy” and “Performance” (Thecro, 2015).
5. Dow Jones Sustainability Index: This index was first released in 1999, and has
since the beginning been an informative platform for investors who are interested
in investing in socially responsible companies, as well as an engagement platform
for companies interested in engaging in CSR practises. The index considers the
financial performance of handpicked socially responsibly engaged companies,
rather than the level of CSR engagement, which Folksam does. Only companies
determined to be global industry group leaders are included in the index (Dow
Jones, 2014:1; Dow Jones, 2014: 2; Dow Jones, 2015).
6. Ethisphere’s World’s Most Ethical Companies: The Ethisphere Institute is
engaged in defining and developing business ethics standards, and since 2007
they have released a ranking of the world’s most ethical companies. Companies
pay a fee of approximately 500 - 1500 USD as they apply to participate, and the
evaluation of their ethical performance is then based on responses they hand in on
a specific questionnaire. Hence, the ranking differs from Folksam’s rankings in
several possible ways, for example as it is based on voluntary applications made
by companies to apply and a payment is required. Hence, it is imaginable that
only bigger companies find the ranking interesting or worthwhile to participate in
(Ethisphere, 2015:1; Ethisphere, 2015:2).
7. FTSE4GOOD Index Series: FTSE is a global market leader in indexing in
general, and the organisation creates and calculates indexes covering all corners
of the world and all possible types of markets. The index covering CSR, namely
FTSE4GOOD, was launched in 2001, and measures the performance of
companies engaging and showing strong performance in ESG (Environmental,
Social & Governmental) practises. The index covers a global basis of companies,
and FTSE has together with a broad range of stakeholders (e.g. NGOs,
consultants, governments and academics) set up criteria that companies have to

52
meet to be included in the index, in contrast to Folksam, who uses the UN &
OECD Global Compact as a basis for the chosen criteria. The main reason behind
the launching of the index was to facilitate for investors to invest in responsible
companies (FTSE, 2015:1-3).
8. MSCI World ESG Index (from KLD global sustainability index series (GSI)):
In 2007, KLD Research & Analytics released their social responsibility index,
which in 2010 was transitioned into MSCI World ESG Index. The index includes
only the best-in-class CSR performers in each sector in the report. In contrast to
how Folksam creates their ranking report, eligible companies for this index are
those that comprise approximately 85 % of the market capitalisation of each
sector in over 23 developed markets. MSCI also releases a couple of similar
indexes, based on e.g. size, industry, regions, systematic risks, and other specifics
(MSCI, 2015:1; MSCI, 2015:2). None of these are however any more relevant to
discuss in this study than the World ESG Index, and will therefore not be
discussed further.
9. Thomson Reuters: Based on the former ASSET4 ESG database, which was
acquired in 2009, Thomson Reuters launched a sustainability index in 2013. The
index is based on a large number of ESG key performance indicators, and the
first two sets of indexes covered the US and North America. However, they state
in the report that the intention is to expand the universe of companies in the index
by approximately 300 per year, and the rankings are completely quantitative, e.g.
emission reduction, and hence as objective as possible. For each KPI the
companies are given a raw score and then their ranking, respectively (Thomson
Reuters, 2013:1-4; Thomson Reuters, 2015:1). This index methodology is the
most similar to the Folksam’s methodology, but as the index is not yet available
for the Swedish Market, it is unusable for this study.
4.1.6 Assessment of Folksam’s CSR Ranking Report
From the previous section, it can be concluded that the indexes and rankings of
sustainable companies today do vary to a large extent in terms of both methodology
and purpose. It can for example be seen that Folksam seems to be the only
53
organisation basing their ranking report, at least outspoken, on the guidelines of UN
& OECD. Those guidelines are created to be used as a worldwide standard, and
Folksam may therefore gain validity from using these as a benchmark compared to
other reports using performance indicators that some may think are chosen arbitrarily
or at least subjectively.
Moreover, it seems that there is little consistency in the methodologies across the
indexes. For example, the universe of companies that the indexes are based on differs
substantially. Several indexes choose for example only to consider top-performing
companies in the CSR area, and within different markets, while Folksam considers all
listed companies on one specific market only, namely the Swedish stock exchange.
This implies that even those companies performing worse, or not at all, within the
area of CSR, are still analysed and ranked by Folksam. By doing this, potential users
of the ranking report can easily assess an overall picture and also follow companies’
progress when moving from one ranking to a better ranking the year after. The
indexes that do not include all companies for a certain market give no indication of
the relative performance of the companies within that market, which is deemed to be a
shortage and prevents transparency.
Throughout the indexes the problem of subjectivity in scoring seems to be
unavoidable. This may not come as a surprise as CSR, as discussed in the theoretical
chapter, is hard to define and can only be measured in a subjective and qualitative
way. Among the different indexes above, it is most common to either base the
rankings on the indexes' own subjective assessment or on the companies’ self-
assessments or questionnaire responses. When comparing these two approaches, the
first may be perceived to be the most objective and accurate as it is made by a third
party rather than the company itself. This is an advantage with the Folksam ranking
report, where the rankings are made by Folksam, through information both directly
from the companies, but also from other sources. However, subjectivity may also be a
problem when the ranking is made by a third party as the underlying intentions of the
organisation or people standing behind the indexes are not always known. They may
be subjective or biased in their assessment to favour or disfavour a certain company.
A problem related to this subjectivity for the Folksam ranking report is that users may
question why a company is given for example a 5 instead of a 6 in grades. Hence,

54
there is room for improvement and clarity, and Folksam might benefit from adding a
section on explaining more carefully the reasoning behind each company's’ ranking.
Finally, it could be questioned whether these indexes/rankings are used at all by
investors, or even to what extent investors or other stakeholders are aware of the
existence of them. This will be further discussed in the analysis section once the
results are available.
Despite these critical arguments, the foundation of this study is still to consider
whether companies’ CSR activities affect the stock price in the Swedish stock market,
and hence the most straightforward approach is to use the release of a ranking such as
the above discussed, as there seems to be no other given events related to CSR that
happens annually/semi-annually. Limited by this approach, the Folksam ranking
report is the only appropriate choice within the Swedish Market. In addition, the
methodology used by Folksam for measuring and marketing their CSR report has not
changed considerably during the studied years, which indicates that any impact on the
stock price stems from how the market perceived the ranking, and not from how the
report is structured.
4.2 Theoretical Methodology When deciding on choices regarding methodology, the problem statement plays an
important role (Bryman & Bell, 2005). This study aims to examine whether CSR
engagement is financially value adding for companies measured by stock price. Since
this requires quantifiable parameters, a quantitative approach is justified. Initially, the
influence on stock price was conceived to be examined most accurately through a
correlation analysis between the two parameters, which was supported by several
previous studies (e.g. Preston & O’Bannon, 1997; Herremans et al., 2003; Hassel et
al., 2011). However, developing a measurable variable for CSR engagement would
require several delimitations and definitions, which by previous researchers has
proven to be difficult, and a common variable is clearly lacking. The chosen research
approach in the form of an event study would circumvent this issue by not having to
define and quantify CSR in terms of such a variable. Instead, the impact from the
announcement of CSR engagement on stock price, in the form of a CSR ranking, is
55
measured by looking at abnormal returns. In addition, the publishing of Folksam’s
CSR ranking report is deemed to be a good approximation of Swedish listed
companies’ CSR engagement, which makes it convenient to use as CSR proxy as the
necessary data is already publicly available. This, in combination with being
interested in different time periods to be able to define normal versus abnormal
returns for the remaining variable, i.e. stock price returns, led to the conclusion that
the most suitable type of study for this thesis is an event study, which is a recognized
methodology approach within the research field. Among the event studies found, only
two investigate the effect of any kind of “CSR-event” on stock price, namely Klassen
& McLaughlin (1996) and Guidry & Patten (2010). In other event studies, it has been
more common to investigate the effect of events such as mergers and acquisitions,
earnings announcement, issues of new debt/equity etc. (Campbell et al., 1997). In
these studies, several differences have been identified in terms of observations used
for estimating normal and abnormal returns and the number of days to include in the
event window. For example, Strong (1992) identifies studies using 60 to 600
observations for the estimation window for daily data. As for event windows, studies
have used event windows that are both short-term and long-term (e.g. Guidry &
Patten, 2010; Auerbach & Hasset, 2005; Klassen & McLaughlin, 1996; Koh &
Venkatraman, 1991). However, a similarity observed in the majority of the studies is
the model used when estimating the normal and abnormal returns, namely the market
model. Moreover, there are several renowned books and articles about the event study
methodology supporting the same choice of model, and these also suggest rules of
thumbs regarding both the choice of the number of days in the estimation window as
well as in the event window. Due to this, the event in itself is irrelevant, and the
previous studies can be used as a foundation and stepping stone for choices made in
this study, which are based on both these guidelines and previous studies. However,
due to the available data and the purpose of the study some modifications are made.
4.3 Data Collection and Source Criticism
4.3.1 Data Collection
This study consists of a secondary analysis, as the data is collected by other
institutions and for other purposes than for this specific study. There are several

56
advantages of using this type of data, particularly if the quality of the data can be
secured (Bryman & Bell, 2005). Firstly, it is a cost- and time effective approach to
gathering data. Secondly, the quality of the data is often very high, meaning that
sampling has been rigorous, the organisations responsible are accredited and reliable,
the researchers responsible are highly experienced, and the data has gone through
several quality checks and similar procedures. However, it is important to remember
the absence of control over the quality checking, and hence to the extent possible,
some caution should be taken when using and analysing the data (ibid).
To enable the examination of this study’s problem statement and answer the chosen
research question, quantitative data in the form of daily stock prices for all companies
in the population, i.e. all listed Swedish companies within the event- and estimation
windows between May 10th 2006 and November 21st 2013, as well as daily index
prices for OMX Nordic Stockholm, are retrieved from Thomson Reuters Datastream.
Thomson Reuters Datastream is also used for extraction of data on market capital,
total assets, turnover, and number of employees for 2013. The chosen database is a
widely used and acknowledged source, and is hence considered a reliable and
authentic mean for data gathering. An alternative source could for example be
Bloomberg, but as they have similar reputation as Thomson Reuters Datastream, and
both are widely used, the choice between these would not make a difference for the
study and its results (ThomsonReuters, 2015:2; Bloomberg, 2015). As for the market
index, used for example to calculate normal and abnormal returns, OMX Nordic
Stockholm Price Index (OMXSPI) is chosen. OMXSPI includes all stocks that are
listed on OMX Nordic Exchange Stockholm and is cleared from dividends
(NASDAQ, 2015:1-2). An alternative could be to use OMXS 30, i.e. the index of the
thirty most sold stocks on the Stockholm Stock Exchange. As can be seen in Figure
4.2 below, these two indexes correlate highly, which indicates that the choice of index
would most likely not have any significant effects on the results of the study.
However, as mentioned, OMXSPI includes all listed stocks, and hence the use of the
first index is justified.

57
Figure 4.2. Correlation between OMX StockholmPI and OMX Stockholm30Index 1995-2015 (DN Ekonomi, 2015).
Further, organisational documents are used to approach the event of CSR-rankings in
the Swedish stock market. The chosen ranking report is Folksam’s CSR ranking
report, as described in section 4.1. As mentioned, the report is based on the UN
Global Compact guidelines, and would hence be applicable on a global basis, which
simplifies the analysis of applicability of this study’s results on other local markets.
4.3.2 Data Criticism
To the greatest possible extent, only well-cited articles from well-reputed journals are
used as a theoretical base. In this study, well cited implies both the number of
citations, but especially the quality of them. As for the journals used, they are
considered being of high quality and high reputation, which is also shown in rankings
made by e.g. the Financial Times. The books chosen have either been used during
courses at Copenhagen Business School, or are other well-cited books by famous
researchers. The chosen articles are often also cross-cited, which implies a connection
and a clear platform for existing research. However, the previous literature has had
different views on, and results from, looking at the relationship between CSR and
financial performance, and therefore the arguments and results from both sides have
been highlighted. Throughout the thesis, a critical approach is taken, and the intention
and goal is to be as objective as possible.
As for the event study methodology, theoretical and methodological books, as well as
previous event study based research articles, are used to assess how the best possible
event study is executed for the purpose of this study’s research question. As the
majority of the articles found focus on other types of events, and hence have different

58
research questions than this study, it is rather the choices of models within the event
studies that are considered interesting to examine to ensure a stable ground for the
methodology. Since the methods used in these various event studies are similar and
follow similar patterns based on renowned theory and methodology, it is considered
reliable to base this study’s models on the same.
4.3.3 Data Adjustment
During the execution of the event study, some data adjustment is made to ensure
accurate results. When estimating the normal returns of the stocks, the returns
included in the estimation window described below are used in a linear regression to
estimate what the normal return would be in the event window. These are then
compared to the actual returns during the event window to estimate the potential
abnormal return during the period, as further described in section 4.4.3 Normal
returns.
To ensure that the normal return estimation is as unbiased and accurate as possible,
bigger events such as mergers and acquisitions are adjusted for. Hence, companies
that have had these types of events within the estimation period will be removed from
the analysis. A list of these adjustments can be found in Appendix 9.2.
4.3.4 Analysis of Missing/Excluded Data
As mentioned in the previous section, the aim is to generate results that are as
unbiased as possible. Hence, any events that may affect the results of the study
considerably need to be removed in order to avoid any bias. This is especially relevant
during the period of estimation of normal returns, as these numbers are an important
component when finding abnormal returns.
In total, 4 companies have been excluded as a result of having a substantial event
during the period that may have a significant influence on the study results. However,
any potential name change during the period is not considered to be a large event and
is hence not excluded, as this is not considered to have any significant effect on the
value of the company.

59
In addition, all companies that do not have complete data during the whole estimation
period are excluded, as these companies do not meet the criteria of being listed 126
days prior to the event. This can for example occur when companies go from listed to
unlisted and back to listed. More on the criteria is presented in section 4.4.2 below. In
addition, the companies that are no longer listed on the day of the event or any of the
event days are also excluded as that indicate that no abnormal returns can be
calculated, which would lead to an error. As Folksam ranks all companies that are
listed on the 31st of May for each year, there is an inherent risk that some of the
companies merge or acquire other companies, or become acquired, stop their
business, or leave the stock exchange during the estimation or event period and hence
do not have complete data for the period. The number of companies excluded for this
reason amounts to 4.
4.4 Event Study and its Criticism Event studies have been used since the 1930’s, however the methodology has
developed during the decades (Campbell, Lo & MacKinlay, 1997). The event study
methodology that is used today was introduced by Fama in 1969, and has since
become a widely used methodology in the areas of finance and accounting to study
security price reactions to some specified event or announcement (Binder, 1998;
Campbell et al., 1997; Benninga, 2014). An event study attempts to examine whether
a given event during the life of a company has affected the company’s performance in
the stock market, i.e. caused abnormal returns (ibid). Two major reasons for using the
event study methodology can be stated; the first being to test a null hypothesis that the
market is efficient, i.e. incorporates information, and the second being (under the
same hypothesis, assuming publicly available information) testing how some event
affects the wealth of the security holders in question (Binder, 1998; Benninga, 2014;
Campbell et al., 1997).
Some criticism has been directed towards the event study method, which mainly
focuses on uncertainty in event dates and possible impacts from other happenings that
surround the main event (Wright, Ferris, Hiller & Kroll, 1995). To avoid this type of
noise, an effort has been made to avoid any major events close to the event, which
was presented in the previous section. In addition, the problem of defining the event

60
date is not a cause for concern in this study as the event day is clearly defined as the
date when Folksam releases their ranking report. Both these issues are elaborated on
more below.
Another critique against the event study methodology is the possibility of collected
daily prices being biased and assumed to be daily prices when in fact they are closing
prices, i.e. the last price of a stock sold during that day (Campbell et al., 1997). Hence
there is an inherent problem of assuming daily prices to be equally spaced over a 24-
hour interval, when in fact it is not (ibid). However, as this should not give any
significant effects on the estimations of normal and abnormal returns, it will be
ignored.
MacKinlay (1997) describes an event study as a seven-step process including event
definition, sample criteria, calculation of normal returns, estimation, abnormal
returns, accumulation of abnormal returns, and lastly interpretation and conclusion.
The seven-step process is presented in the following sections.
4.4.1 Event Definition
The first step in performing an event study is defining the event in question, and the
time frame in which the event takes place, which is called an event window
(Benninga, 2014; MacKinlay, 1997). The event day can for example be on the day the
press release or similar actually takes place, and the event window, in which the
method detects abnormal returns, usually consists of the following three, five or ten
working days (Benninga, 2014). Fama (1998) criticises longer-term event windows,
as he suggests that these cannot capture the true movement caused by the event, but
rather will consist of a lot of noise. Hence, even though a specific event might create
more long-term abnormal effects, the event study methodology might not be able to
capture this due to all other factors affecting the possible abnormal returns during the
same time period. Instead, Fama suggests that a short-term period of a few days after
the event, and sometimes also a day before, is more suitable (ibid).
The event of this study is defined as the release of the Folksam CSR ranking report
every (second) year in between 2006-2008 and (2009-2013). The event date, i.e. day

61
0, for each year is hence defined as the day of the press release announcing each
report. According to website press releases by Folksam, it is clear that the CSR
ranking reports have been released in November or December each year, while the
specific dates have varied. Therefore, the data collection period of stock prices differs
slightly from year to year.
4.4.2 Sample Criteria
The second step is to identify the companies to be included in the study (MacKinlay,
1997). Since the Folksam CSR ranking report grades and ranks all companies listed
on the OMX Stockholm Stock Exchange on the 31st of May that specific year, the
population is defined as all companies listed on OMX Stockholm on the 31st of May
in 2006, 2007, 2008, 2009, 2011 and 2013 respectively. Among this population, three
different segments are selected based on their CSR ratings, namely the thirty highest
and the thirty lowest rated companies as well as those companies that have proven no
CSR engagement and consequently have not received any rating (henceforth referred
to as “zero companies”).
The selection of companies and specific stock data is based on the following criteria,
which are all described further below:
• The chosen thirty-one highest (lowest) rated companies have the highest
(lowest) total rating, i.e. environmental and human points combined
• The zero companies are defined as those who are not given any environmental
or human points
• The companies must have been listed at least 126 business days in a row before
the event window and also during the whole event period
• As for companies with more than one stock type with different voting rights, the
stock type with the highest turnover on OMX Stockholm has been used,
normally the “B” stock
• When calculating abnormal returns, dividends are not considered, which as
stated above is in compliance with the market index used which does not take
dividends into considerations
To be able to detect differences between how high or low rankings are perceived
among investors, it has been decided to only use the companies with the highest

62
grades, lowest grades and no engagement. These rankings are believed to be more
likely to affect the stock price as they indicate something distinctly positive or
negative. They may therefore add value to the investors’ decision-making in contrast
to the companies that are middle-ranked and are neither very good nor very bad in
terms of their CSR performance.
First of all, the points given for the two different CSR measures (human and
environment) are added to get an aggregated score for each company. An aggregated
ranking list is then developed, by using those scores, and hence only the companies
that work with both human right and environments are in the top, and only the
companies that work the least with human rights and environment are in the bottom.
By combining the points, there is no risk of mixing companies that are performing
badly in one of the areas and good in the other, which potentially could even-out any
potential effect on the stock price and provide misleading results. These companies do
not end up in any of the ranking segments as they have one good ranking and one bad
ranking and therefore get a total point that is in between the top and bottom.
Based on the ranking list, the highest rated top 31 companies, the lowest rated bottom
31 companies, and all zero companies, are used as samples for each year.
Consequently, the chosen sample is what Bryman & Bell (2005) would call a non-
probability sample, as it has not been selected using a random selection method. The
reasoning behind this sample selection is based on the data available. As the CSR
ranking report provides an overview of all listed companies’ CSR engagements, the
companies are required to be divided into different segments to examine if there is
any difference between the segments. While Bryman & Bell (2005) argue that the
sample size often is determined by time and cost limitations, the sample size in this
study is limited due to the required distinction between the different segments. Since
the top/bottom companies are clearly distinguished from other companies in the mid
range, in terms of points received in the ranking, it is deemed necessary to limit the
number in each group to keep this distinction. For the purpose of this study, 31
companies in the top and bottom of the ranking list have been chosen. This is to fulfil
the minimum requirement of n>30 for the sample to be assumed approximately
normally distributed, which is an underlying assumption for the parametric t-test
(Newbold et al., 2013). The total population of companies varies between 220 and

63
300 depending on year, and if a larger number of companies would be chosen for
each group, it would leave too little difference between the points received for the top
and bottom. This might make conclusions more difficult to draw, as the companies in
this case would not be as uniform in terms of points received. A smaller sample in
each group on the other hand could be considered to give too few observations, and is
therefore not considered to be an option. Hence, 31 companies for each year is
considered to be a good sample size as it brings a solid number of observations for the
significance tests that are made later in the study.
The criteria of a minimum of 126 listed days before the event is chosen for several
reasons and is supported by theory, however the chosen number is different from
many other event studies that include more days in their estimation windows. For
example, Klassen & McLaughlin (1996) who investigate the impact of environmental
management on financial performance use 200 trading days as estimation window.
Many other event studies include even more business days, often a full business year,
i.e. 252 trading days. However, Benninga (2014) considers the minimum number of
days to be 126 as a thumb rule to be able to make sure that the true stock price
movements are captured (Benninga, 2014; MacKinlay, 1997). Due to the nature of the
data of this study, 126 days is deemed to be the most reasonable number to use for
this study. For example, it is believed that using 252 days could potentially bias the
estimate of the normal return, since that would imply that the days in the event
window from the previous year would be included in the estimation window. In
addition, in order to reduce the impact of large events and the release of the annual
report in particular, 126 days is deemed to be a valid number in order to avoid an
overlap as the earliest estimation window starts in the beginning of May while the
annual reports for most companies on the Swedish Stock Exchange are published in
February/March each year as they have standard fiscal years. Finally, if using a larger
number of days than 126, those companies that were not listed much earlier than the
31st of May (i.e. the date Folksam uses every year for choosing which companies to
include in the report) would have to be excluded from the sample, as 126 listed days
before the release date in November or December would not have been reached. In
addition, the companies that are included in the study must have been listed during the
whole event period as data otherwise is missing leading to inability to calculate
abnormal returns for the event.
64
As for the stock types, only the stock type with the highest turnover on OMX
Stockholm, usually stock type “B” is considered. Stock type “A” normally empowers
the owner to a higher number of votes, and hence these stocks are often held by the
original stockowners (Swedbank, 2015).
Criteria used for segments:
• The years of 2006-2007 are defined as pre-crisis when the Swedish market was
characterized by an upswing in the economy and an expansive GDP-growth
• The years of 2008-2011 are defined as the financial crisis characterised by a
slowdown in GDP growth as well as a fall in the stock market and recession
• The year of 2013 is defined as post-crisis and is the year when the GDP growth
and the equity market had recovered from the crisis
• Operationally risky companies are those operating in industries that are
considered being more exposed to environmental hazard risk, namely Energy,
Capital Goods, Material, Utilities and Transportation
• Large companies are defined as those listed on OMXPI Stockholm large cap,
i.e. has a market capitalisation of more than 1 billion EUR
The different periods chosen for the second sub-hypothesis are based on the
characteristics of the Swedish market and the development during the past 10 years.
Specifically for Sweden, the years 2006-2007 were characterized by growth, while the
following years were hit by the financial crisis, which lead to an economic downturn
that lasted until 2012. These economic situations will define the three groups of years,
i.e. the pre-crisis years (2006-2007), the crisis years (2008-2011), and the post-crisis
years (2013).
As mentioned in the hypothesis chapter, some industries have a higher operational
risk by nature, and are often regarded as being ‘bad’. Therefore they are also more
exposed to the risk of criticism and accidents, than other industries that are considered
“better” and less exposed to this risk. In this study, the industries regarded as having a
high operational risk are those with issues of high greenhouse gas emissions, high
energy consumption, as well as other industry specific issues. For the Swedish
65
market, those industries deemed to have a high operational risk are utilities, energy,
capital goods, materials and transportation, which is justified by previous studies too.
The companies listed on OMXPI Stockholm are divided into three different segments
depending on size, namely large cap, mid cap and small cap, which were described in
the theoretical chapter. This segmentation system is used in this study as size
differentiator since it is regarded to be more objective than arbitrarily chosen limits of
market capitalisation or any other financial or accounting measure, for segmenting the
companies based on size. For the purpose of this study, however, only the large cap
companies will be used since the purpose is to examine the impact on large
companies. The data retrieved for the 31st of May each year from Thomson Reuters
Datastream on market capitalisation for the companies is stated in SEK. Hence, the
exchange rate for EUR/SEK has been retrieved from Riksbanken for these dates to be
able to adjust the values for market capitalisation from SEK to EUR (Riksbanken,
2015).
4.4.3 Normal Returns
The normal return is defined as the return that would be expected if the event did not
take place. It can be estimated based on the returns in the estimation window, and
calculated in several different ways. The possible methods used to calculate normal
returns can be categorised under statistical or economic methods (MacKinlay, 1997).
Those falling into the statistical category follow statistic assumptions concerning
returns, and might hence be more flexible, while the economic methods also take into
consideration economic arguments such as investors’ behaviour. It can therefore be
argued that choosing an economic model would give a more precise answer, however
due to the lack of any completely valid economic model, it could instead lead to
validity restrictions (ibid). For example, the capital asset pricing model (CAPM) and
the arbitrage pricing model (APM), that are two of the most commonly used
economic models, both suffer from different drawbacks (MacKinlay, 1997; Binder,
1998). While CAPM suffers from research during the past decade showing deviations
from the restrictions that the model imposes, APM suffers from complicating the
calculations in an event study while still not adding much extra value compared to a
commonly used statistical model, such as the market model (ibid).

66
The market model is the most common model for calculation of normal returns, and is
essentially a least squares regression of the correlation between the stocks’ returns
and the returns of the market index (Benninga, 2014). Nevertheless, as all models can
be considered to be only representations of reality, the market model has as most
other models received some critique. For example, the beta value for each company is
based on historical numbers, which implies that the model assumes the same constant
beta over the coming event period. However, this assumption may not always be
accurate since stock price volatility (i.e. beta) seems to be higher during a recession
than during times of prosperity, meaning that the efficiency of the market model
might be decreased (Schwert, 1989).
Another possible statistical model to use is the constant-mean-return model, which
assumes a constant average return over time, and hence is simpler than the market
model. However, it suffers from critique suggesting that the model lacks sensitivity
and it has been proposed that the market model is an improvement of the constant-
means-return model (Campbell et al., 1997).
For the purpose of this study, the market model has been chosen, as it is deemed to be
the most appropriate choice for this study and also the model that is best supported by
previous studies. The choice is based on theories and previous event studies indicating
that no other model would give a more precise or accurate result, but only be more
time consuming and costly. Moreover, the market model considers the return that is
related to the return of the market index, potentially leading to increased ability to
detect the effect of an event (Campbell et al., 1997). However, as Brown and Warner
(1985) show, the results of an event study with a larger number of observations is not
that sensitive to the choice of model for estimating normal returns.
The market model can be expressed as (MacKinlay, 1997):
Formula 4.1. The market model
𝐸𝑅!" = 𝛼! + 𝛽! ∗ 𝑅!"#$%&' + 𝜀!" where;
𝐸𝑅!" = 𝐸𝑥𝑝𝑒𝑐𝑡𝑒𝑑 𝑟𝑒𝑡𝑢𝑟𝑛 𝑜𝑛 𝑠𝑡𝑜𝑐𝑘 𝑖 𝑜𝑛 𝑑𝑎𝑦 𝜏; 𝛼! = 𝐴𝑙𝑝ℎ𝑎 𝑣𝑎𝑙𝑢𝑒 𝑓𝑜𝑟 𝑠𝑡𝑜𝑐𝑘 𝑖 𝛽! = 𝐵𝑒𝑡𝑎 𝑣𝑎𝑙𝑢𝑒 𝑠𝑦𝑠𝑡𝑒𝑚𝑎𝑡𝑖𝑐 𝑟𝑖𝑠𝑘 𝑓𝑜𝑟 𝑠𝑡𝑜𝑐𝑘 𝑖; 𝑅!"#$%&' = 𝑅𝑒𝑡𝑢𝑟𝑛 𝑜𝑛 𝑂𝑀𝑋𝑆𝑃𝐼 𝑜𝑛 𝑑𝑎𝑦 𝜏
𝜀!" = 𝐸𝑟𝑟𝑜𝑟 𝑡𝑒𝑟𝑚 𝑖𝑛 𝑡ℎ𝑒 𝑚𝑜𝑑𝑒𝑙 𝑜𝑛 𝑑𝑎𝑦 𝜏

67
To be able to use the market model, an estimation of the included variables needs to
be performed. The calculations of these variables are outlined in the following
paragraphs.
To start off, the daily returns for the sample companies’ stocks are calculated as:
Formula 4.2 Daily Return for the Individual Stock
𝑅!" = 𝑃!" − 𝑃!!!!𝑃!"!!
where;
𝑅!" = 𝑅𝑒𝑡𝑢𝑟𝑛 𝑜𝑛 𝑠𝑡𝑜𝑐𝑘 𝑖 𝑜𝑛 𝑑𝑎𝑦 𝜏; 𝑃!" = 𝐶𝑙𝑜𝑠𝑖𝑛𝑔 𝑝𝑟𝑖𝑐𝑒 𝑓𝑜𝑟 𝑠𝑡𝑜𝑐𝑘 𝑖 𝑜𝑛 𝑑𝑎𝑦 𝑃!"!! = 𝐶𝑙𝑜𝑠𝑖𝑛𝑔 𝑝𝑟𝑖𝑐𝑒 𝑓𝑜𝑟 𝑠𝑡𝑜𝑐𝑘 𝑖 𝑜𝑛 𝑑𝑎𝑦 𝜏 − 1, 𝑖. 𝑒. 𝑡ℎ𝑒 𝑑𝑎𝑦 𝑏𝑒𝑓𝑜𝑟𝑒 𝜏
Then, the return of the market index is calculated, by using the following formula;
Formula 4.3. The daily return on OMXSPI
𝑅!"#$%&' = 𝑃!"#$%&' − 𝑃!"#$%&!!!
𝑃!"#$%&'!!
where;
𝑅!"#$%&' = 𝑅𝑒𝑡𝑢𝑟𝑛 𝑜𝑛 𝑠𝑡𝑜𝑐𝑘 𝑖 𝑜𝑛 𝑑𝑎𝑦 𝜏; 𝑃!"#$%&' = 𝐶𝑙𝑜𝑠𝑖𝑛𝑔 𝑝𝑟𝑖𝑐𝑒 𝑓𝑜𝑟 𝑠𝑡𝑜𝑐𝑘 𝑖 𝑜𝑛 𝑑𝑎𝑦 𝑃!"!! = 𝐶𝑙𝑜𝑠𝑖𝑛𝑔 𝑝𝑟𝑖𝑐𝑒 𝑓𝑜𝑟 𝑠𝑡𝑜𝑐𝑘 𝑖 𝑜𝑛 𝑑𝑎𝑦 𝜏 − 1, 𝑖. 𝑒. 𝑡ℎ𝑒 𝑑𝑎𝑦 𝑏𝑒𝑓𝑜𝑟𝑒 𝜏
The calculation of the beta value is based on the following formula:
Formula 4.4. The beta value for the individual stock
𝛽!" = 𝐶𝑜𝑣(𝑅!" ,𝑅!"#$%&!)
𝜎!!"#$%&'
where;
𝐶𝑜𝑣(𝑅!",𝑅!"#$%&!) = 𝐶𝑜𝑣𝑎𝑟𝑖𝑎𝑛𝑐𝑒 𝑏𝑒𝑡𝑤𝑒𝑒𝑛 𝑡ℎ𝑒 𝑟𝑒𝑡𝑢𝑟𝑛 𝑜𝑛 𝑠𝑡𝑜𝑐𝑘 𝑖 𝑎𝑛𝑑 𝑂𝑀𝑋𝑆𝑃𝐼 𝑜𝑛 𝑑𝑎𝑦 𝜏 𝜎!!"#$%&' = 𝑉𝑎𝑟𝑖𝑎𝑛𝑐𝑒 𝑓𝑜𝑟 𝑜𝑀𝑋𝑆𝑃𝐼 𝑜𝑛 𝑑𝑎𝑦 𝜏
And finally, the alpha is estimated by using:
Formula 4.5. Alpha value for the individual stock
𝛼! = 𝑅!" + 𝛽! ∗ 𝑅!"#$%&'

68
4.4.4 Estimation Procedure
In an event study, three time frames can be included, namely the estimation window,
the event window, and the post-event window (Benninga, 2014). As previously
indicated, the estimation window is used to calculate a stock’s normal return based on
a fixed time period before the event window. The event window on the other hand
often starts a few trading days before the actual event day and its length varies from 3,
5 or 10 days. The purpose of the event window is to investigate whether the event
announcement was anticipated or leaked and how fast the market is to absorb the
event information. The purpose of a post-event window is to examine the longer-term
impact on the company following an event (ibid). Supported by Fama (1998), the
long-term post-event window is excluded in this study, as it is possible that the true
movement caused by the event might be hard to distinguish from noise, and therefore
does not add any value. The chosen time frame divided into estimation- and event
period/windows for this study is illustrated in Figure 4.3 below. As stated and argued
for earlier, the chosen number of days for the estimation window is 126 days before
the event period. The event itself takes place on day 0, i.e. when t = 0, when
Folksam’s CSR ranking report is published. The event window consists of five days,
from the day before the event day, the event day itself, and the following three
business days, i.e. day -1 to day 3. It has been decided to include the day before the
event day as part of the event period in order to detect any potential insider or leaked
information, as proposed by Benninga (2014).
Figure 4.3. Time Frame for Event Study
4.4.5 Abnormal Returns
The calculations of abnormal returns are based on the estimation of normal returns as
subtracted from the actual spotted returns (Benninga, 2014; Campbell et al., 1997).
This number shows the return that can be explained by the event, and not by the
general market development (ibid). The formula used is (MacKinlay, 1997):

69
Formula 4.6. Abnormal return for the individual stock
𝐴𝑅!" = 𝑅!" − 𝐸𝑅!"
where; 𝐴𝑅!" = 𝐴𝑏𝑛𝑜𝑟𝑚𝑎𝑙 𝑟𝑒𝑡𝑢𝑟𝑛 𝑓𝑜𝑟 𝑠𝑡𝑜𝑐𝑘 𝑖 𝑜𝑛 𝑑𝑎𝑦 𝜏; 𝑅!" = 𝑅𝑒𝑡𝑢𝑟𝑛 𝑓𝑜𝑟 𝑠𝑡𝑜𝑐𝑘 𝑖 𝑜𝑛 𝑑𝑎𝑦 𝜏;
𝐸𝑅!" = 𝐸𝑥𝑝𝑒𝑐𝑡𝑒𝑑 𝑟𝑒𝑡𝑢𝑟𝑛 𝑓𝑜𝑟 𝑠𝑡𝑜𝑐𝑘 𝑖 𝑜𝑛 𝑑𝑎𝑦 𝜏
4.4.6 Accumulation of Abnormal Returns
When the abnormal returns have been calculated, they need to be aggregated both
across stocks and time, in order to enable drawing of overall conclusions. First, the
average return for all companies’ abnormal returns per day are calculated, which as
proposed by Campbell et al. (1997) is defined as:
Formula 4.7. Average Abnormal Return
𝐴𝐴𝑅! = 1𝑁
𝐴𝑅!"
!
!!!
Then, the cumulative abnormal return for each company over the event window can
be defined as (Campbell et al., 1997):
Formula 4.8. Cumulative Abnormal Return
𝐶𝐴𝑅! !!,!! = 𝐴𝑅!"
!!
!!!!
Finally, the cumulative average abnormal return can be calculated by taking the
average of the sum of all abnormal returns over all event windows (Campbell et al.,
1997): Formula 4.9. Cumulative Average Abnormal Return
𝐶𝐴𝐴𝑅(!!,!!) = 1𝑁
𝐴𝑅!
!
!!!
4.4.7 Interpretation and Conclusion
At this point the results from the empirical study need to be statistically tested against
zero to secure the significance, but also to be able to analyse and distinguish between

70
explanations (Campbell et al., 1997). Hence, a testing of the formulated hypotheses
will be performed, which is presented in the next section.
4.5 Testing Procedure In order to assess to what degree the results in this study can be generalised, statistical
tests of significance need to be performed. These tests provide information on how
valid the results in this study are, but also indicate the risk of concluding that the
publishing of the CSR rankings induces abnormal returns when in fact it does not
(Bryman & Bell, 2005). A common criteria for test selection is power; the most
powerful test should be used (Siegel, 1957). Power is defined as 1 minus the
probability of a Type II error. This equals the probability of rejecting the null
hypothesis when it is false and hence shall be rejected. In other words, a statistical test
is considered to be good when the probability of rejecting H0 when H0 is true is low,
and the probability of rejecting H0 when it is false is high (ibid).
Campbell et al. (1997) suggest two possible types of statistical tests, namely
parametric and nonparametric tests, which differ in terms of distribution and the size
of the data. A parametric test is based on a number of assumptions regarding the
nature of the population sample and is only applicable on numerous data (Siegel,
1957). For example, it requires that the data is approximately normally distributed and
according to the central limit theorem (CLT), a sample of at least 30 observations
(n>30) can be considered normally distributed (Agresti & Finlay, 2014). If the sample
fulfils the normal distribution requirement and the other assumptions, a parametric
test is often preferable as it provides more information and is stronger and more
precise compared to its non-parametric counterpart (Siegel, 1956). A non-parametric
test, on the other hand, does not make any strict assumptions about the population and
may be used with data that is not numerical (ibid). Consequently, there is no
requirement for the sample to be normally distributed (Campbell et al., 1997).
However, the nonparametric tests do require that the data can be ranked or ordered
(Lind, Marchal & Wathen, 2015).
For the purpose of this study, both a parametric and a nonparametric test are used in
order to deal with the potential risk of violating any of the underlying assumptions of

71
the parametric tests. This choice is supported by both MacKinlay (1997) and Brown
and Warner (1985) who state that the two tests should be used in conjunction rather
than isolation when testing the significance of abnormal returns. In fact,
nonparametric tests can be used as robustness checks of conclusions that are made
based on parametric tests (MacKinlay, 1997). Moreover, and maybe more important
in relation to studies performed on stock returns, a study by Campbell and Wasley
from 1993 shows that a non-parametric rank test provides more reliable results than
its parametric counterpart for daily stocks returns on NASDAQ stocks (Campbell et
al., 1997).
One of the most commonly used parametric tests is the t-test, which has been chosen
in this study due to its simplicity and widespread usage. As the purpose is to test
whether the abnormal returns (AR) and the cumulative abnormal return (CAR) is
greater or less than zero against the possibility that these are equal to zero, the
hypothesis is formulated on the basis of a double-sided test. The significance level
used for the t-test is 5%, which corresponds to a critical t-value of 1.96. This implies
that if the absolute t-value is greater or less than 1.96 and -1.96, respectively, the null
hypothesis should be rejected and evidence support the alternative-hypothesis stating
that AR and/or CAR is different from zero. In that case, it is evidenced that the CSR
rating publication affects the stock price. If the t-value on the other hand is
somewhere between the critical values, i.e. between -1.96 and 1.96, the null
hypothesis fails to be rejected as a result of a true null hypothesis or a lack of
evidence supporting the alternative hypothesis (Newbold et al., 2013). The decision
rule for the t-test is presented in Formula 4.10 below (ibid).
𝑅𝑒𝑗𝑒𝑐𝑡 𝐻! 𝑖𝑓 𝑥 − 𝜇0𝜎𝑛
< −𝑧!! 𝑜𝑟
𝑥 − 𝜇0𝜎𝑛
> 𝑧!!
The nonparametric test chosen for this study is Wilcoxon’s signed rank-test, which is
a common choice of nonparametric tests for event studies (Mackinlay, 1997; Agresti
& Finlay, 2014; Bryman & Bell, 2005; Campbell et al., 1997). An alternative non-
parametric test to use would be the sign test, which is simpler and based on the sign of
Formula 4.10: Decision rule according to the double-sided t-test

72
the difference (sign of the abnormal return for an event study) between two
observations (Lind et al., 2015). Two requirements for this test are that the cumulative
abnormal returns are independent across securities/stocks and that the expected
proportion of positive abnormal returns is 0,5 under the null hypothesis (MacKinlay,
1997). A weakness of the sign test is that it only takes the sign into consideration
(Newbold et al., 2013). In addition, if the distribution of abnormal returns is skewed,
the sign test will not be well specified, which is often the case for daily data. Hence, it
is more relevant to use Wilcoxon’s signed rank test, which makes up for the potential
weaknesses of the sign test, and is more justifiable as there is no guarantee that the
sign test would add any value to the testing (MacKinlay, 1997). In addition to
providing the sign of the difference, Wilcoxon’s signed rank test ranks the absolute
size of the differences, hence additional information is incorporated compared to the
sign test, which adds value to the study (Newbold et al., 2013). According to Corrado
(1989), the rank test is expected to be more powerful than its parametric counterpart
in case of abnormal performance due to the highly non-normal distribution
characteristics of daily security returns. This comes as no surprise, as non-normal
returns implies statistic outliers, and hence the median, which is used for non-
parametric test, might give more accurate results than the mean, which is used in
parametric tests.
For the purpose of this study, the nonparametric test chosen examines whether the
median of the abnormal and cumulative abnormal returns differ from zero, as
mentioned above. The Wilcoxon signed-rank test is formulated as a double-sided test
and is, as the parametric test, tested at a 5 % significance level.
As suggested by Newbold et al. (2013), the sample of this study can be approximately
normally distributed for the non-parametric test given that the number of observations
exceeds 20 (n>20). The decision rule for the non-parametric test is presented in
Formula 4.11 below (ibid).
𝑅𝑒𝑗𝑒𝑐𝑡 𝐻! 𝑖𝑓 𝑍!"# =!!!!!!
< −𝑧!! 𝑤ℎ𝑒𝑟𝑒 𝜎! =
! !!! !!!!!"
𝑎𝑛𝑑 𝜇! = !(!!!)
!
Formula 4.11: Decision rule for double-sided Wilcoxon’s signed-rank test

73
The testing procedure has the following structure, which is supported by several
previous researchers (e.g. Agresti & Finlay, 2014; Bryman & Bell, 2005):
1. A null hypothesis is formulated. In the main case of this thesis, the null
hypothesis is defined such as that there is no relationship between the release of
the Folksam CSR ranking and abnormal returns of stock prices. This is based on
the intention to see if investors consider the CSR ranking made by Folksam to
be value creating and supportive to their investment decisions. Based on
theories presented by Newbold et al. (2013), the only way to prove that the CSR
ranking adds value leading to abnormal returns is that the null hypothesis is
rejected. Consequently, the null hypothesis reflects the theory this study
attempts to investigate and refute.
The main hypotheses tested are:
H0: Folksam’s publication of CSR rankings does not have an impact on the
companies’ stock returns in the form of abnormal returns
H1: Folksam’s publication of CSR rankings does have an impact on the
companies’ stock returns in the form of abnormal returns
Here, the abnormal return (AR) for each day within the event window, as well as the
cumulative abnormal return (CAR) for the whole event window, will be tested
statistically against zero for all years. An alternative could be to use the cumulative
average abnormal return (CAAR) for the test. However, as CAAR gives an average of
all CARs, i.e. one single number across both time and all securities, this would result
in a total sample size of six CAARs, i.e. one CAAR for each of the six events. This
sample size is not considered to be big enough to function as a basis on which general
conclusions can be drawn and will therefore not be tested in this study.
In addition, the study aims to test four complementing sub-hypotheses. The first sub-
hypothesis investigates whether the results have changed from the first release of the
report in 2006, to the release of the latest published report in 2013. The set of
hypotheses is hence:

74
H0: There is no difference between the impact of Folksam’s CSR report release
on stock returns in the beginning of the studied period (2006) and in 2013
H1: There is a difference between the impact of Folksam’s CSR report release on
stock returns in the beginning of the studied period (2006) and in 2013
The second sub-hypothesis considers the possibility of economic cycles influencing
the results. As Schwert (1989) points out, the volatility of stock prices seems to be
higher during recession than during times of prosperity. Hence it is deemed
interesting to test the robustness of the former results by separating the years into pre-
crisis, financial crisis, and post-crisis, formulated as:
H0: There is no difference between the impact of Folksam’s CSR report release
on stock returns pre-, during- and post-crisis
H1: There is a difference between the impact of Folksam’s CSR report release on
stock returns pre-, during- and post-crisis
As with the main test of this study, the two sub-hypotheses defined above will be
tested for top-, bottom- and zero companies only. The reasoning behind the choice of
only testing the top-, bottom- and zero companies, rather than all companies ranked,
is that this will support the main hypothesis in the form of a robustness check; both
for the potential change of influence of CSR over time, and for the potential
differences in reactions to CSR pre-, during-, and post-crisis. Therefore, it will
generate more detailed information about the impact on the main groups as defined in
the main hypothesis, i.e. top-rankings, bottom-rankings and zero-rankings.
The third sub-hypothesis regards whether operational risk is an affecting variable,
where operationally risky companies are defined as those facing a naturally higher
risk of environmental hazard as a result of operating in certain industries. The purpose
is to investigate whether the stock returns of companies acting within these industries
and perform well are differently affected by the high ranking compared to companies
within same industries receiving a low ranking. In other words, it will investigate if

75
investors specifically seem to reward (punish) companies in these industries that
receive a high (low) ranking. Hence, the set of hypotheses is as follows:
H0: Within the group of operationally high-risk companies, there is no difference
between the impact of Folksam’s CSR report release on stock returns for
companies that receive top environmental rankings compared to those that
receive low environmental rankings
H1: Within the group of operationally high-risk companies, there is a difference
between the impact of Folksam’s CSR report release on stock returns for
companies that receive top environmental rankings compared to those that
receive low environmental rankings
For this test, the companies of 2013 are divided into industries where the industries
that are considered to be operationally high-risk industries are selected as sample. The
companies are then segmented into groups of top-, and bottom companies depending
on their performance on Folksam’s ranking list of environmental work.
The fourth and final test is performed to investigate whether there is a difference
between the impact on large sized companies depending on a high or low ranking. As
indicated by several authors, larger firms seem to work more with environmental
issues and human rights compared to smaller firms since they often face more strict
requirements, but also generally have more resources. Therefore, it is possible that
investors react differently to how large companies specifically perform in the ranking,
which is considered interesting to test. The final set of sub-hypotheses is consequently
formulated as follows:
H0: There is no difference between the impact of Folksam’s CSR report
release on stock returns for large cap companies with a high ranking
compared to those with a low ranking
H1: There is a difference between the impact of Folksam’s CSR report release
on stock returns for large cap companies with a high ranking compared to
those with a low ranking

76
For this test, the market capitalisation of all Swedish listed companies is retrieved and
converted to EUR. All companies with a market capitalisation above 1 billion EUR,
i.e. all large cap companies, are selected as sample for the test. Finally, the testing is
conducted separately on the best and worst performing half of companies,
respectively, both in terms of environmental and human issues.
Regarding the testing procedure of the sub-hypotheses, the first sub-hypothesis test
procedure will be the same as for the main hypothesis. Hence, both the abnormal
return (AR) for each day within the event window, as well as the cumulative
abnormal return (CAR) for the whole event window will be tested statistically against
zero, however for 2006 and 2013 separately. Since the days separately could show
differences within the event window that a test of CAR only would not detect, it is
deemed necessary to test both AR and CAR in order to explore all potential
differences between the two years. For the second sub-hypotheses, i.e. pre-, during-
and post-crisis, only the CAR for the full event window will be tested against zero.
This is justified as these tests detect the differences in the segmented groups over the
whole event period. To explore the potential total effect aggregated over the whole
event period is deemed to be more interesting and relevant for this study instead of
testing each day separately, which is considered to not add any specific value. For the
third and fourth sub-hypotheses, the testing procedure is the same as for the main
hypothesis and the first sub-hypothesis testing both AR for each day as well as CAR
over the whole event period, however for 2013 only.
2. A for this study acceptable level of significance (denoted α) is established. This is a
measure of the degree of risk of rejecting the null hypothesis when it should be
accepted, which is called a Type I error. A p-value will be calculated, which expresses
the probability of that risk. The smaller the p-value, the stronger the evidence against
H0. Among most researchers, an acceptable p-value would be p < 0.05, which implies
that it is fewer than five out of hundred chances that this study’s sample shows a
relationship when there is none, and corresponds to the critical t-value of 1.96
(Bryman & Bell, 2005; Agresti & Finlay, 2014).
3. Determination of the statistical significance of this specific empirical study. If the
calculated t-value is less than or higher than the critical values of -1.96 and 1.96,
77
respectively, the test will provide evidence that the market is not affected by the event
defined in this study. If the t-value is within the range of the two critical values, the
there is evidence supporting that the returns are not affected by the event and hence
not different from zero (Agresti & Finlay, 2014). For the purpose of this study, the
test is two-tailed with 2,5% in each tail as a result of the choice of a two-sided
alternative to the null hypothesis.
4. Conclusions can be drawn on whether the null hypotheses can be rejected or not.
4.6 Testing Schedule The testing schedules for both the main hypothesis and sub-hypotheses as well as for
the robustness tests are presented in the following section.
4.6.1 Statistical Tests for the Main Hypothesis
1. T-test for each segment, i.e. top-, bottom- and zero- performers, using
abnormal returns (AR) for each day within the event window respectively,
accumulated over all years
2. T-test for each segment as above, but for the whole event window, i.e. day -1
to day 3, using the cumulative abnormal return (CAR), and accumulated over
all years
3. Wilcoxon signed-rank test for the same as 1 and 2, as there are outliers to
consider (see Appendix 9.3)
4.6.2 Statistical Tests for the Sub-hypotheses:
1. Both T-test and Wilcoxon signed-rank test for all sub-hypotheses:
a) Top-, bottom- and zero-performers for 2013 and 2006 respectively tested per
day using AR, and over the whole event window using CAR
b) Top-, bottom- and zero performing companies within the different economic
cycles are bundled and tested separately over the whole event window using
CAR
c) For 2013, the top and bottom performing companies in industries considered
to be more operationally risky are tested both daily through abnormal returns
and over the whole event window using CAR
78
d) The top- and bottom performing companies listed on large cap in 2013 are
tested both daily through abnormal returns and over the whole event window
using CAR
4.6.3 Robustness Tests
a) Considerable events: When estimating normal and abnormal returns using the
market model, a presumption is that the estimation period chosen will reflect
the actual normal return. However, even though the period chosen is rather
short to avoid as many big events as possible, e.g. mergers and acquisitions,
there are still considerable events taking place for several companies that
potentially could bias the estimation. Therefore, a robustness test is performed
to measure these events’ influence and ensure that examples of these events do
not have a significant impact. This robustness test will hence function as a
sensitivity analysis, and is used to further validate our results. The following
events will be excluded from the normal estimation:
i. A release of a report related to increased raw material prices/cost
ii. A change of CEO
iii. A release of a Q2 report with positive information
b) Environmental versus human rights issues: The main test will be divided into
two separate tests, namely for the environmental ranking in 2013 and human
ranking in 2013, respectively. This is to ensure that any potential effect related
to one of the areas specifically is detected, if it was not detected when the
points were combined into one ranking.
c) Size: For sub-hypothesis 4 testing large sized companies separately, the choice
of size-measure can be discussed. In the sub-hypothesis, the cap on which the
companies are listed has been chosen as distinguisher, where the market
values of the firms determine the size. Hence, as the largest companies in
terms of market value are listed on large cap, the large cap companies are used
for the size test. To test how robust the choice of size measure in this study is,
compared to possible other measures of size, data will be collected for all

79
companies from 2013 on total sales, total assets and number of employees,
and then tested for correlation with market value. These measures are chosen
as comparison as they are considered to cover important perspectives of how
each company could be measured, in addition to the financial measure, i.e.
market value reflecting the market size. The “operational size” is measured by
total sales, which reflects the income statement, while the “accounting size”
measured by total assets reflects the balance sheet. The number of employees
is the final size measure tested for and reflects the “organizational size” of the
firms.
4.7 Validity, Reliability and Replication For evaluation of business and management research, three criteria are prominent,
namely reliability, replication, and validity. Reliability concerns whether the results of
a study are repeatable and if concepts are consistent, which is particularly relevant for
quantitative studies. Replication on the other hand concerns whether a study has
clearly specified study procedures, and therefore is replicable. Lastly, validity can
take many different forms, e.g. internal and external, but is overall linked to the
integrity of the conclusions that are generated from a research study (Bryman & Bell,
2005). The applicability of each criterion for this study is specified below.
4.7.1 Internal validity
The internal validity concerns whether a conclusion about a causal relationship
between at least two variables hold tight, i.e. is valid, and is per definition weak for
most types of research designs. An exception is experimental designs, which however
is not an option for this thesis (Bryman & Bell, 2005). The weakness is explained by
the fact that causality never can be established, but only detection of a relationship in
any direction is possible, which is also the case for this study (ibid). Just as discussed
in the literature review, it could potentially go in any, or both, of directions. As
MacKinlay et al. (1997) suggest, the chosen event window is rather short, and hence
the risk of other events affecting the stock returns is minimised, which does increase
the validity in the sense of excluding potential noise. However, the potential noise can
never be fully excluded, and even if some relationship is detected, the causality can
only be speculated on.

80
4.7.2 External Validity
The external validity examines whether the sample is typical, and if the results
therefore can be applied outside the local context, i.e. if the results are generalizable
(Bryman & Bell, 2005). The results in this study are however within some bounds.
The results could be applicable on other geographical markets, as long as the rankings
chosen are similar to the one in this study. In addition, the other markets must have
the same transparency as the Swedish market with strong regulations on CSR
disclosures etc. in order to be comparable. This is not a major problem for companies
listed on European stock exchanges as these are governed by the European union and
are subject to the same regulations. However, companies outside the European market
on the other hand may have different regulations and may not need to disclose the
same information regarding CSR activities. Furthermore, the results are only
considered applicable to other listed companies, since the methodology in this study
requires daily stock prices as a quantitative measure. Nevertheless, a similar type of
research question could be applied to non-listed companies, for example by using a
case study, or by using some accounting measure instead of stock price. This will
further be discussed under the section of Future research.
4.7.3 The Validity of Concepts
The concept of CSR is as discussed throughout the thesis vague. Critique against
quantifying CSR engagement has especially focused on whether the measure has
measured what it was supposed to, and whether all aspects of CSR have been
included in the measure. This has further been used as a main criticism against
previous studies, and is circumvented by using the event study methodology.
Moreover, the Folksam CSR ranking is based on global guidelines from the UN
Global Compact in combination with an objective collection of public materials
regarding CSR engagement from both the companies in question and more objective
sources such as media and governments. Therefore, the ranking is considered a solid
event.
As for (ab)normal returns, the validity of the concept depends on the reliability of the
measure. As long as the measure does not fluctuate, as further discussed below, the
validity of the concept is high.
81
4.7.4 Reliability
When assessing the reliability, defined as the quality of chosen measures and whether
the measure is stable or not, both the stability of measures and the inter-observer
consistency are considered (Bryman & Bell, 2005).
4.7.4.1 Stability
The consistency and stability of measuring stock price over time and place is
considered very high (Bryman & Bell, 2005). Firstly, the use of Thomson Reuters
Datastream allows an objective collection of daily prices, which will be the same for
anyone collecting those at any time. Moreover, the measures of return are globally
established and the formula for daily returns (based on actual stock prices) is logical
and of common sense. Continuing with the formula for estimating normal returns, the
chosen method (i.e. the market model) is considered both reliable as it is frequently
used by other researchers, as well as based on proper statistical foundations, and is
hence of high stability (Campbell et al., 1997; Benninga, 2014; Binder, 1998; Brown
& Warner, 1984). In this study, the calculations of these measures have been
performed in Excel, based on Benninga’s (2014) guidelines, and spot-checks have
been performed systematically. This minimises the risk of random errors made in the
study.
As for the chosen CSR ranking report, which is based on the UN Global Compact
Guidelines that were established as a global platform for how to engage in CSR, the
stability is considered high as long as the report continues to exist. So far, Folksam
has used the same methodology for their CSR ranking report since the first report was
released. However, since the definition of CSR engagement and how to measure it is
unclear, it cannot be concluded that the creation of CSR rankings would have given
the same result in another setting. It can be argued that CSR and its effect on which
ever chosen variable, might have to be analysed locally, as the definitions and
importance of CSR may vary over geographical areas. Hence, the stability and
reliability is considered more stable for the Swedish market, than in a global setting.
4.7.4.2 Inter-observer consistency
The level of subjective judgement in this study is limited, as both the CSR rankings
and stock prices are gathered from external and independent sources. Therefore, both

82
variables would be consistent for any other researcher gathering the same data, as
described above. However, a separate aspect to consider is the classification of high-
risk industries and the definition of a large company in this study. As the definition of
high operational risk has been supported by several other researchers, the inter-
observer consistency is rather high, but it is important to remember that each choice
of placing an industry into the group of operationally high-risk industries is more or
less subjective, and hence might have been slightly different if done by someone else.
Similarly, the definition of a large company could be based on different variables, e.g.
capital, turnover, certain ratios etc. It is therefore possible that another variable would
be used if someone else conducted the same study.
4.7.5 Replication
The methodology of this study has been described in detail through this chapter. The
collection of data, the models chosen, the calculations and estimations performed and
the coming analysis of the results, are accounted for, and should hence be easy to
replicate (Bryman & Bell, 2005). However, a replication in other markets or settings
could be more complicated, as the definition of the local CSR-event in question might
be different from the CSR report Folksam publishes. As for the performance of the
actual event study, a replication is deemed to be possible at any time since the event
study process is supported by previous studies and follows a clear and generally
approved 7-step process.
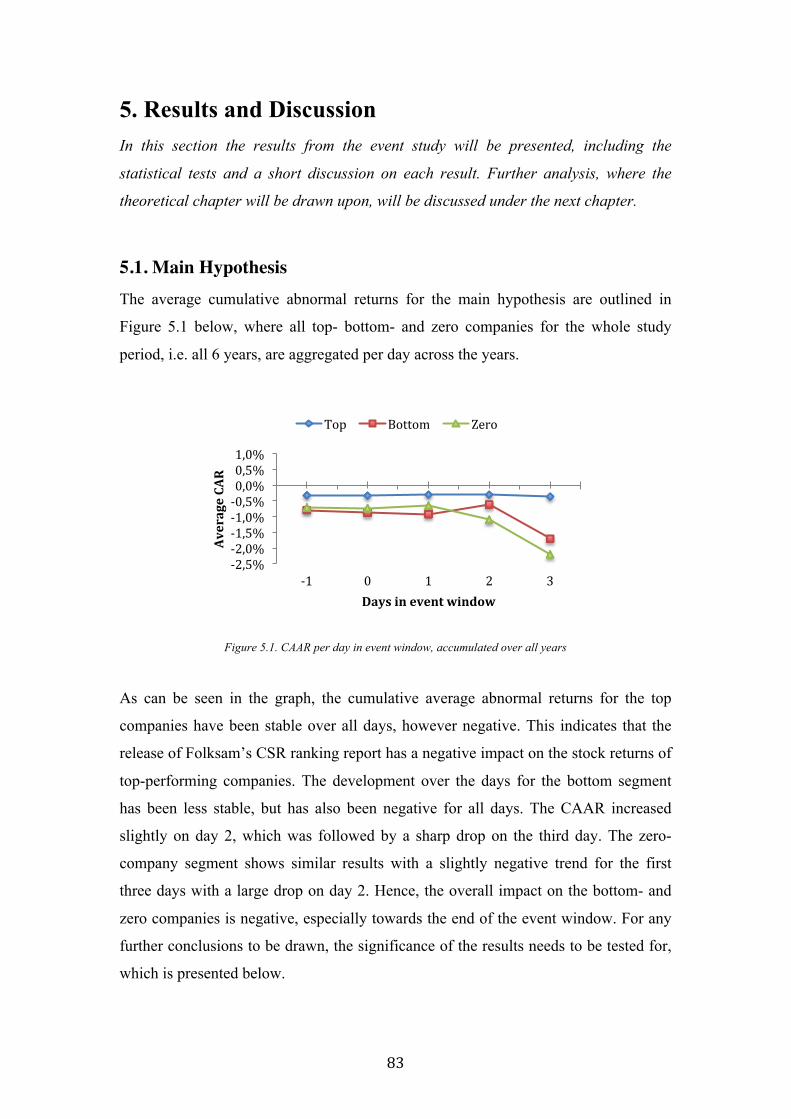
83
5. Results and Discussion In this section the results from the event study will be presented, including the
statistical tests and a short discussion on each result. Further analysis, where the
theoretical chapter will be drawn upon, will be discussed under the next chapter.
5.1. Main Hypothesis The average cumulative abnormal returns for the main hypothesis are outlined in
Figure 5.1 below, where all top- bottom- and zero companies for the whole study
period, i.e. all 6 years, are aggregated per day across the years.
Figure 5.1. CAAR per day in event window, accumulated over all years
As can be seen in the graph, the cumulative average abnormal returns for the top
companies have been stable over all days, however negative. This indicates that the
release of Folksam’s CSR ranking report has a negative impact on the stock returns of
top-performing companies. The development over the days for the bottom segment
has been less stable, but has also been negative for all days. The CAAR increased
slightly on day 2, which was followed by a sharp drop on the third day. The zero-
company segment shows similar results with a slightly negative trend for the first
three days with a large drop on day 2. Hence, the overall impact on the bottom- and
zero companies is negative, especially towards the end of the event window. For any
further conclusions to be drawn, the significance of the results needs to be tested for,
which is presented below.
-‐2,5% -‐2,0% -‐1,5% -‐1,0% -‐0,5% 0,0% 0,5% 1,0%
-‐1 0 1 2 3
Average CAR
Days in event window
Top Bottom Zero

84
5.1.1 Main Hypothesis Results
The results from the statistical tests for the main hypothesis are presented in Table 5.1
to 5.3 below. All tests show significant results to some extent, however the days and
type of test for which the results are significant, differ. Both the parametric t-test and
the non-parametric Wilcoxon signed-rank test shows that there is no abnormal
reaction of the stock returns, for any of the segments, on the event day itself or the
following two days. A general trend of a negative impact can be observed for all
segments, indicating that the report release overall is negatively perceived among
investors. This is especially observable for the bottom and zero companies, for which
the parametric results are significantly negative over the whole event period.
N=186 T-‐test Wilcoxon’s
signed-‐rank test
Day T-‐value Mean Std. p-‐value
-‐1 -‐2,682** -‐0,324% 1,648% 0,007**
0 -‐,124 -‐0,015% 1,682% 0,594
1 ,246 0,035% 1,940% 0,996
2 -‐,056 -‐0,007% 1,697% 0,706
3 -‐,379 -‐0,057% 2,036% 0,671
CAR event -‐1,189 -‐0,368% 4,220% 0,065
*** p<0.001, ** p<0.01, * p<0.05
Table 5.1 Parametric and non-parametric test results for top companies
For the top performing companies, both the parametric and non-parametric tests
suggest that for all tests except for day -1, the null hypothesis cannot be rejected as no
statistically significant AR nor CAR is presented. This implies that there are no
abnormal returns as an effect of the publication of Folksam’s CSR ranking. From the
results, a slightly negative trend is observed, both for the separate days and the whole
event window (CAR).
N=184 T-‐test Wilcoxon’s signed-‐rank test
Day T-‐value Mean Std. p-‐value
-‐1 -‐3,530*** -‐0,797% 3,061% 0,000***
0 -‐,444 -‐0,087% 2,661% 0,069
1 -‐,232 -‐0,044% 2,601% 0,083
2 1,677 0,308% 2,493% 0,172
3 -‐4,486*** -‐1,085% 3,280% 0,000***
CAR event -‐4,076*** -‐1,705% 5,673% 0,000***
*** p<0.001, ** p<0.01, * p<0.05
Table 5.2 Parametric and non-parametric test results for bottom companies

85
For the bottom performers, both the parametric and non-parametric tests for day -1,
day 3, and the overall CAR, show statistically significant abnormal returns at a 0,1 %
level. The significant results for these days show a negative impact on the abnormal
returns. In general, there is a clear negative trend, which is also the case for CAR.
N=61 T-‐test Wilcoxon’s
signed-‐rank test
Day T-‐value Mean Std. p-‐value
-‐1 -‐1,833 -‐0,710% 3,025% 0,207
0 ,365 0,127% 2,716% 0,883
1 -‐,938 -‐0,244% 2,028% 0,223
2 -‐,273 -‐0,103% 2,954% 0,580
3 -‐2,830** -‐1,27% 3,522% 0,015*
CAR event -‐2,169* -‐2,2062% 7,946% 0,105
*** p<0.001, ** p<0.01, * p<0.05
Table 5.3 Parametric and non-parametric test results for zero companies
Finally, the tests for the zero companies show statistically significant results for one
of the days, namely day three, as well as the whole event period (CAR). While day 3
is significant for both tests, CAR is significant when using the parametric test only.
The non-parametric test for day 3 is significant at a 5 % level, while its parametric
counterpart is significant at a 1 % level. CAR is significant at a 5 % level. As for the
bottom companies, a clear trend of negative impact is observed.
The total number of zero companies tested for during the six years is 61, as can be
seen in Table 5.3 above. When separating these per year, a clear downward sloping
trend can be observed, as presented in Figure 5.2, suggesting that the number of
companies not engaging in CSR at all has decreased over time, 2013 being the only
exception. However, when looking closer at the development from 2011 to 2013, it
can be seen that the total number of zero companies has increased by one and that
only two of the companies that had a zero rating in 2011 stayed in the zero segment in
2013. The other three zero companies in 2013 were newly listed.
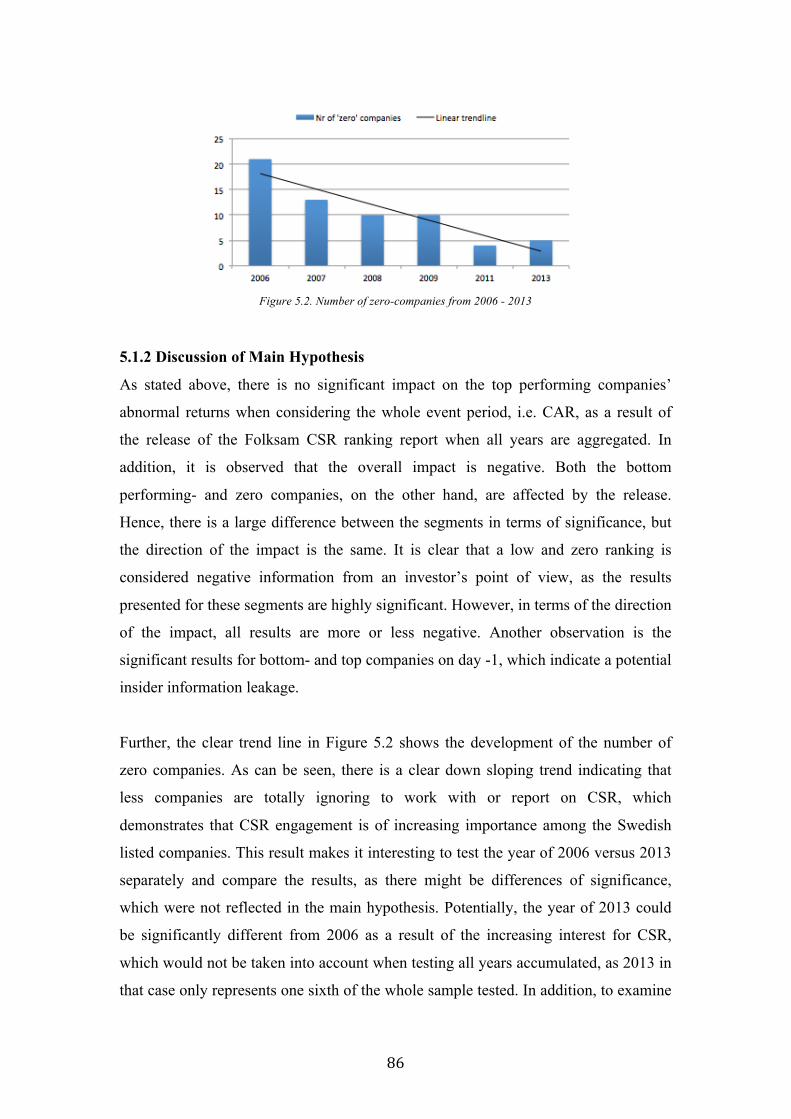
86
Figure 5.2. Number of zero companies each year from 2006-2013
Figure 5.2. Number of zero-companies from 2006 - 2013
5.1.2 Discussion of Main Hypothesis
As stated above, there is no significant impact on the top performing companies’
abnormal returns when considering the whole event period, i.e. CAR, as a result of
the release of the Folksam CSR ranking report when all years are aggregated. In
addition, it is observed that the overall impact is negative. Both the bottom
performing- and zero companies, on the other hand, are affected by the release.
Hence, there is a large difference between the segments in terms of significance, but
the direction of the impact is the same. It is clear that a low and zero ranking is
considered negative information from an investor’s point of view, as the results
presented for these segments are highly significant. However, in terms of the direction
of the impact, all results are more or less negative. Another observation is the
significant results for bottom- and top companies on day -1, which indicate a potential
insider information leakage.
Further, the clear trend line in Figure 5.2 shows the development of the number of
zero companies. As can be seen, there is a clear down sloping trend indicating that
less companies are totally ignoring to work with or report on CSR, which
demonstrates that CSR engagement is of increasing importance among the Swedish
listed companies. This result makes it interesting to test the year of 2006 versus 2013
separately and compare the results, as there might be differences of significance,
which were not reflected in the main hypothesis. Potentially, the year of 2013 could
be significantly different from 2006 as a result of the increasing interest for CSR,
which would not be taken into account when testing all years accumulated, as 2013 in
that case only represents one sixth of the whole sample tested. In addition, to examine

87
different segments of the company data from 2006 and 2013 separately enables
exploration of any other possible trends, and thereafter more specific conclusions can
be drawn from the main hypothesis results (see Hypothesis 3).
To conclude, the overall impact on all segments is negative. However, it is possible
that there are differences between the segments depending on for example industries,
companies and years respectively, which makes further tests necessary. Hence, the
data needs to be grouped further to test if there are any significant abnormal returns
that would be uncovered. The groupings used for this study are pre-, during- and post-
crisis, operationally high-risk industries and large sized companies, as described and
justified in the Hypotheses and Method chapters. The results from the tests of these
sub-hypotheses are presented below.
5.2 Sub-hypotheses The sub-hypotheses covered in this thesis are mainly based on data from 2013 only,
except for the first sub-hypothesis where 2006 is used as a comparative year, and the
second sub-hypothesis where all years are included. As supported by the main
hypothesis above, showing a distinct declining trend in the number of zero
companies, the engagement in CSR activities has differed between the years.
Therefore, a separate testing of 2013 and 2006 is justified. To start with, the top-,
bottom-, and zero companies for 2013 and 2006 respectively are tested, where the
testing procedure is the same as for the main hypothesis, however only for these two
years. This is followed by a test which aims to investigate whether there are any
differences between the years when grouped depending on economic situation, i.e.
pre-crisis, crisis, and post-crisis. Finally, two tests are performed to examine the
impact on operationally high-risk companies and large companies, respectively. These
two tests are based on data from the final year of 2013.

88
5.2.1 Sub-hypothesis 1: 2006 versus 2013
As can be seen in Table 5.4 and 5.5 below, the results for the different segments differ
substantially for 2013. The top companies have no significant abnormal returns for
any day nor for CAR for any of tests, and the direction of the impact is slightly
negative. The bottom companies’ abnormal returns are however statistically
significant for all days except for day 1 for both tests, and day 0 for the parametric t-
test. The impact is negative and the significance increases over the event period, with
a 5 % significance level on day -1 and a 1 % significance level of day 3. The results
indicate that the release of the CSR ranking report had a clear negative impact on the
stock prices of bottom-performing companies, and hence the CAR for the full event
period is also significantly negative at a 0,1 % level for both tests.
Top companies 2013, n = 31 Bottom companies 2013, n = 31
T-‐test Wilcoxon’s signed-‐rank test T-‐test Wilcoxon’s
signed-‐rank test
Day T-‐value Mean Std. p-‐value T-‐value Mean Std. p-‐value
-‐1 -‐1,241 -‐0,170% 0,763% 0,189 -‐2,003* -‐1,119% 3,109% 0,033* 0 -‐,392 -‐0,082% 1,160% 0,158 -‐1,219 -‐0,702% 3,204% 0,025*
1 -‐,525 -‐0,065% 0,689% 0,531 ,349 0,163% 2,602% 0,327
2 ,077 0,012% 0,856% 0,610 -‐2,073* -‐0,881% 2,365% 0,044*
3 ,075 0,018% 1,349% 0,583 -‐2,890** -‐1,343% 2,587% 0,006**
CAR event -‐,821 -‐0,287% 1,944% 0,481 -‐3,914*** -‐3,880% 5,520% 0,000***
*** p<0.001, ** p<0.01, * p<0.05
Table 5.4. Top- and bottom performing companies, 2013
For zero-companies during the same year, as presented in Table 5.5 below, no
statistically significant results are observed for the parametric test, indicating that a
“zero-ranking” does not have any impact on stock price. For the non-parametric test
however, day 3 is significant at a 5 % significance level. The results from this
significance test are however not reliable as the number of observations is only 5 in
2013, due to the few number of companies not reporting on CSR at all that year.

89
Zero companies 2013, n = 5
T-‐test Wilcoxon’s signed-‐rank test
Day T-‐value Mean Std. p-‐value
-‐1 -‐1,167 -‐1,846% 3,535% 0,345
0 -‐,185 -‐0,363% 4,387% 0,893
1 -‐1,656 -‐1,290% 1,741% 0,138
2 -‐1,513 -‐4,319% 6,383% 0,225
3 -‐1,803 -‐3,918% 4,859% 0,043*
CAR event -‐1,707 -‐11,735% 15,369% 0,138
*** p<0.001, ** p<0.01, * p<0.05
Table 5.5. Zero performing companies, 2013
The results described for 2013 differ drastically from those found for 2006, which are
presented in Table 5.6 and 5.7 below. The bottom companies’ abnormal returns are
only significant for day 1 at 1 % level for the parametric test and at a 5 % level for its
non-parametric counterpart. Moreover, the top and zero segments show no
significance at all. For the bottom performing companies, it should be noted that the
sample size of 29 is slightly below the required sample size (n>30) for the normal
distribution assumption of the parametric test.
Top companies 2006, n = 31 Bottom companies 2006, n = 29
T-‐test Wilcoxon’s signed-‐rank test T-‐test Wilcoxon’s
signed-‐rank test
Day T-‐value Mean Std. p-‐value T-‐value Mean Std. p-‐value
-‐1 -‐1,502 -‐0,379% 1,404% 0,092 1,651 0,663% 2,163% 0,144
0 1,151 0,219% 1,060% 0,232 ,904 0,292% 1,742% 0,405
1 -‐1,341 -‐0,218% 0,906% 0,290 -‐2,611** -‐0,831% 1,714% 0,030*
2 ,065 0,016% 1,362% 0,814 -‐,663 -‐0,168% 1,363% 0,611
3 -‐1,386 -‐0,249% 1,000% 0,290 -‐,253 -‐0,124% 2,632% 0,538
CAR event -‐1,293 -‐0,611% 2,632% 0,085 -‐,285 -‐0,167% 3,158% 0,611
*** p<0.001, ** p<0.01, * p<0.05
Table 5.6. Top- and bottom performing companies, 2006

90
Zero companies 2006, n = 20
T-‐test Wilcoxon’s signed-‐rank test
Day T-‐value Mean Std. p-‐value
-‐1 1,441 0,504% 1,563% 0,232
0 1,020 0,394% 1,726% 0,067
1 -‐,282 -‐0,132% 2,101% 0,263
2 ,474 0,260% 2,456% 0,823
3 1,100 0,404% 1,643% 0,411
CAR event 1,546 1,429% 4,136% 0,351
*** p<0.001, ** p<0.01, * p<0.05
Table 5.7. Zero performing companies, 2006
The first conclusion that can be drawn from the results presented above is that the
results for the bottom segment differ between the two years. This indicates that
overall, the ranking has had significantly more impact in later years. This can be
linked to the main hypothesis, and that performing the same tests in the future could
lead to more significant results, as more (potentially) significant years are added to
the previous years. Another similarity to the main test is the negative, however
insignificant, impact on the top-performing companies, which has been observed for
both 2006, 2013 as well as for all years in the main hypothesis.
Except from an increasing interest in CSR, another potential explanation to the
difference in significance between the years may be the awareness of the ranking
report among investors. Even though Folksam is a well-known company within
finance and insurance in Sweden, 2006 was the first year in which the ranking report
was released, and it is likely that the awareness has grown over time and that only a
small portion of the investors, if any, used it for their investment decisions in the
beginning. Similarly, CSR may not have been as high a priority among investors in
2006, since it has gained increased recognition in later years, thus having no impact
on the stock price back then.
Also, as the financial crisis occurred in between these years, it is interesting to test for
different economic situations, and investigate whether these further have biased the
main hypothesis results. These results are presented next.

91
5.2.2 Sub-hypothesis 2: Economic Cycles
The results from the tests of CAR for the segments separated by pre-crisis, crisis and
post-crisis are presented in Table 5.8 and 5.9 below. As the results show, the tests do
partially confirm previous test results, but there are also differences between the time
periods. For example, while the years before the crisis show no significant results for
the bottom performers, the most significant results are those for bottom performers
after the crisis. During the crisis, the stock returns for both bottom- and zero
performers were significantly negative, while the stock returns for zero companies
were significant and positively affected in the pre-crisis period.
2006-‐2007 2008-‐2011
T-‐test Wilcoxon’s signed
rank test T-‐test
Wilcoxon’s signed rank test
Ranking No of obs. T-‐value Mean Std. p-‐value No of
obs. T-‐value Mean Std. p-‐value
Top 62 -‐,964 -‐0,438% 3,579% 0,237 93 -‐,658 -‐0,348% 5,106% 0,225
Bottom 60 ,917 0,484% 4,084% 0,556 93 -‐3,732*** -‐2,392% 6,180% 0,000***
Zero 32 2,155* 1,588% 4,167% 0,085 24 -‐3,636*** -‐5,280% 7,113% 0,001**
*** p<0.001, ** p<0.01, * p<0.05
Table 5.8. Main ranking segments, pre-crisis and during crisis tested for CAR
2013
T-‐test Wilcoxon’s signed-‐rank test
Ranking (no of obs)
T-‐value Mean Std. p-‐value
Top (31) -‐,821 -‐0,287% 1,944% 0,481
Bottom (31) -‐3,914*** -‐3,880% 5,520% 0,000***
Zero (5) -‐1,707 -‐11,735% 15,369% 0,138
*** p<0.001, ** p<0.01, * p<0.05
Table 5.9. Main company segments, post-recession tested for CAR
The statistical tests for the cumulative abnormal returns over the full event windows
grouped by pre-crisis, crisis and post-crisis, and divided into the main segments of
top-, bottom-, and zero companies, show that the recession might not have affected
investors to rethink priorities during that time. Instead, the release of Folksam’s CSR
report did have an impact on the stock returns of bottom- and zero companies. The
results point towards CSR not being less important during recession than other times,
leading them to punish bad CSR performance even during the recession years. This
could be explained by the fact that investors do value good CSR performance,
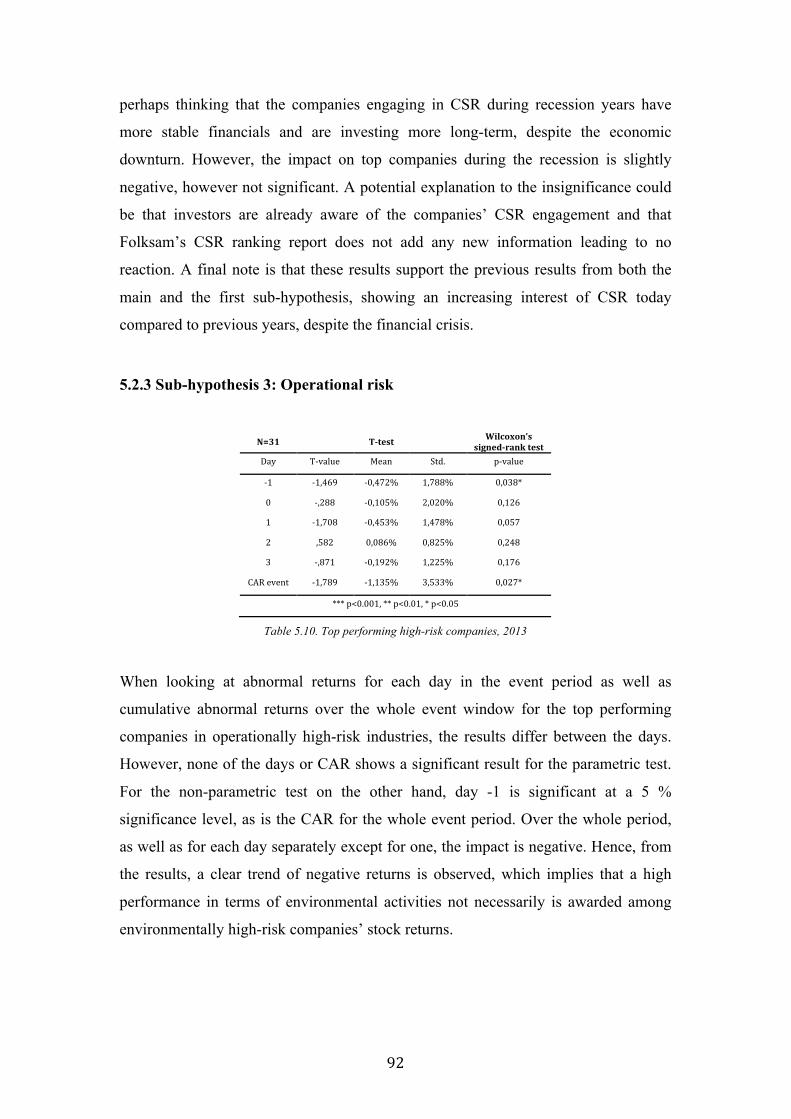
92
perhaps thinking that the companies engaging in CSR during recession years have
more stable financials and are investing more long-term, despite the economic
downturn. However, the impact on top companies during the recession is slightly
negative, however not significant. A potential explanation to the insignificance could
be that investors are already aware of the companies’ CSR engagement and that
Folksam’s CSR ranking report does not add any new information leading to no
reaction. A final note is that these results support the previous results from both the
main and the first sub-hypothesis, showing an increasing interest of CSR today
compared to previous years, despite the financial crisis.
5.2.3 Sub-hypothesis 3: Operational risk
N=31 T-‐test Wilcoxon’s signed-‐rank test
Day T-‐value Mean Std. p-‐value
-‐1 -‐1,469 -‐0,472% 1,788% 0,038*
0 -‐,288 -‐0,105% 2,020% 0,126
1 -‐1,708 -‐0,453% 1,478% 0,057
2 ,582 0,086% 0,825% 0,248
3 -‐,871 -‐0,192% 1,225% 0,176
CAR event -‐1,789 -‐1,135% 3,533% 0,027*
*** p<0.001, ** p<0.01, * p<0.05
Table 5.10. Top performing high-risk companies, 2013
When looking at abnormal returns for each day in the event period as well as
cumulative abnormal returns over the whole event window for the top performing
companies in operationally high-risk industries, the results differ between the days.
However, none of the days or CAR shows a significant result for the parametric test.
For the non-parametric test on the other hand, day -1 is significant at a 5 %
significance level, as is the CAR for the whole event period. Over the whole period,
as well as for each day separately except for one, the impact is negative. Hence, from
the results, a clear trend of negative returns is observed, which implies that a high
performance in terms of environmental activities not necessarily is awarded among
environmentally high-risk companies’ stock returns.

93
N=31 T-‐test Wilcoxon’s signed-‐rank test
Day T-‐value Mean Std. p-‐value
-‐1 -‐,486 -‐0,326% 3,733% 0,557
0 -‐1,341 -‐0,556% 2,308% 0,337
1 -‐,694 -‐0,220% 1,764% 0,367
2 -‐1,966* -‐1,049% 2,972% 0,164
3 -‐2,842** -‐1,622% 3,178% 0,003**
CAR event -‐2,679** -‐3,549% 7,376% 0,009**
*** p<0.001, ** p<0.01, * p<0.05
Table 5.11. Bottom performing high-risk companies, 2013
For the bottom performing companies, the results show an even more negative trend.
In this case, all days show a negative impact, in which day 2, 3 and the whole event
window-CAR are significant at a 5 % and 1 % level, respectively, for the parametric
test. For the non-parametric test, day 3 and the whole event window are significant at
a 1 % level. Hence, the null hypothesis can be rejected at a 1 % level for the whole
event. These results imply that companies that are considered environmentally risky
as they are operating in high-risk industries, and perform badly in terms of
environmental activities, are punished through a negative effect on stock return.
When comparing the impact from the CSR ranking release on the top- and bottom
performing companies respectively, a negative trend is observed for both segments.
For almost all days, the abnormal returns are negative and the same is shown for the
whole event period. This is particularly observable for the bottom performing
companies where the null hypothesis should be rejected at a 1 % level for the whole
event period, implying that CSR engagement, or in this case poor CSR engagement,
in fact has an impact on the investors’ perception of the firms. Companies who are
operationally risky and do not put enough efforts into CSR activities are clearly
punished.

94
5.2.4 Sub-hypothesis 4: Company Size as Defined by Market Capitalisation
N=30 T-‐test Wilcoxon’s
signed-‐rank test Day T-‐value Mean Std. p-‐value
-‐1 -‐2,341** -‐0,313% 0,732% 0,016*
0 -‐,832 -‐0,083% 0,557% 0,422
1 -‐,161 -‐0,020% 0,691% 0,922
2 ,097 0,013% 0,757% 0,583
3 ,247 0,043% 0,969% 0,769
CAR event -‐,963 -‐0,280% 1,595% 0,229
*** p<0.001, ** p<0.01, * p<0.05
Table 5.12. Top performing large cap companies, 2013
The fourth sub-hypothesis shows significant results for the first day of the event
period for the top-performing large cap companies. The impact on stock returns are
significantly negative at a 1 % significance level when using the parametric test,
while the results are significantly negative at a 5 % level for the non-parametric test.
The direction of impact is varying between the days, but over the whole event period
the impact is slightly negative, although non-significant.
As the test shows, only the first day of the event period, i.e. day -1, is significant and
the overall direction is varying between the days. This could be regarded as
contradicting to theories about large companies and the importance of their
responsibility-taking as a corporate citizen. However, the results might simply be
explained by an efficient market and investors’ awareness, indicating that the CSR
information already is incorporated in the stock price. Another potential explanation
to the insignificant results could be a lack of interest for CSR and Folksam’s CSR
ranking report among investors. This will be further elaborated on in the Analysis
chapter.
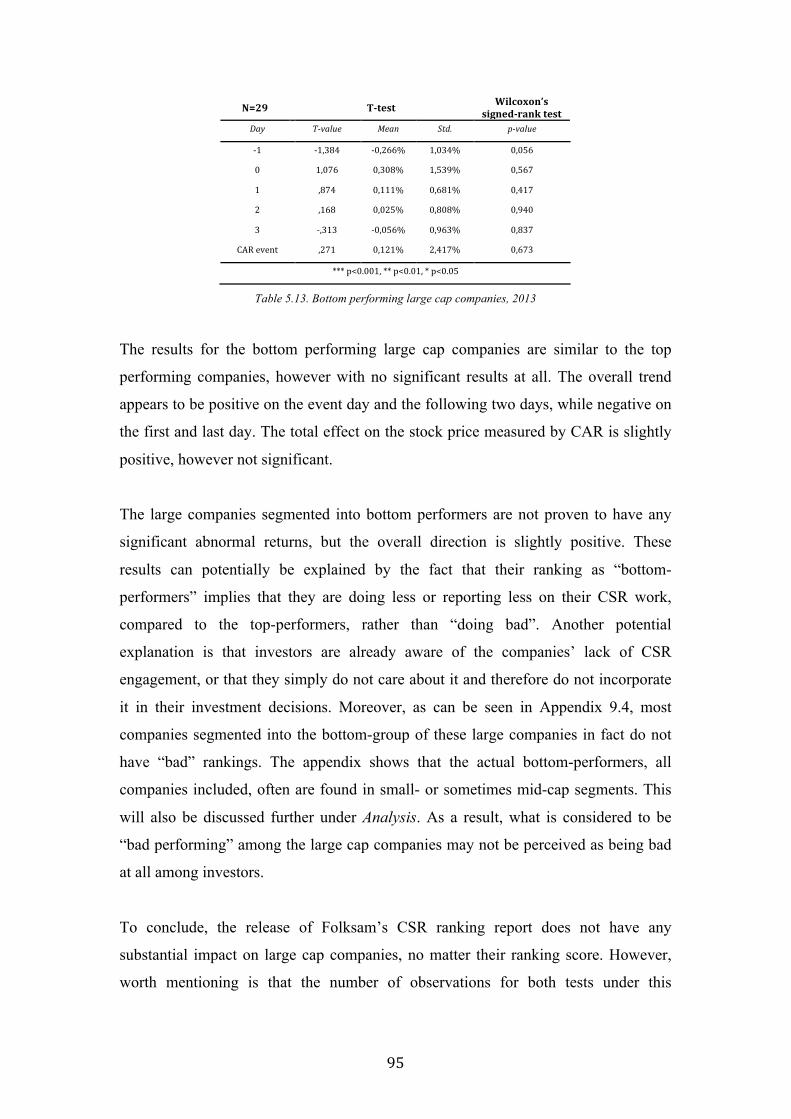
95
N=29 T-‐test Wilcoxon’s signed-‐rank test
Day T-‐value Mean Std. p-‐value
-‐1 -‐1,384 -‐0,266% 1,034% 0,056
0 1,076 0,308% 1,539% 0,567
1 ,874 0,111% 0,681% 0,417
2 ,168 0,025% 0,808% 0,940
3 -‐,313 -‐0,056% 0,963% 0,837
CAR event ,271 0,121% 2,417% 0,673
*** p<0.001, ** p<0.01, * p<0.05
Table 5.13. Bottom performing large cap companies, 2013
The results for the bottom performing large cap companies are similar to the top
performing companies, however with no significant results at all. The overall trend
appears to be positive on the event day and the following two days, while negative on
the first and last day. The total effect on the stock price measured by CAR is slightly
positive, however not significant.
The large companies segmented into bottom performers are not proven to have any
significant abnormal returns, but the overall direction is slightly positive. These
results can potentially be explained by the fact that their ranking as “bottom-
performers” implies that they are doing less or reporting less on their CSR work,
compared to the top-performers, rather than “doing bad”. Another potential
explanation is that investors are already aware of the companies’ lack of CSR
engagement, or that they simply do not care about it and therefore do not incorporate
it in their investment decisions. Moreover, as can be seen in Appendix 9.4, most
companies segmented into the bottom-group of these large companies in fact do not
have “bad” rankings. The appendix shows that the actual bottom-performers, all
companies included, often are found in small- or sometimes mid-cap segments. This
will also be discussed further under Analysis. As a result, what is considered to be
“bad performing” among the large cap companies may not be perceived as being bad
at all among investors.
To conclude, the release of Folksam’s CSR ranking report does not have any
substantial impact on large cap companies, no matter their ranking score. However,
worth mentioning is that the number of observations for both tests under this
96
hypothesis does not fulfil the requirements of the normality assumption of 30
observations for the parametric test.
5.3 Robustness Tests To strengthen the validity of the results above, three separate robustness tests are
performed. First of all, three considerable events that potentially could bias the main
test’s results are considered. Secondly, two separate tests are run for top-, bottom-,
and zero performers in terms of human rights points and environmental engagement
points, respectively, as a validity check of the main test. Finally, a correlation test is
made between different measures of size to validate the choice of using market
capitalization as size distinguisher.
5.3.1 Considerable Events
During the studied period, several considerable events have taken place for the
Swedish listed companies, which have not been incorporated in this study. If these
events would have taken place during the estimation period, they could potentially
have biased the expected return, hence providing a misleading abnormal return. It is
therefore considered relevant to test whether examples of such big events have had
any impact, to ensure that the results from the main test are reliable. The events tested
for are an announcement of a substantial raw material cost increase and weaker
demand in July 2011 affecting Electrolux, a press release stating a CEO change in
June 2013 for TeliaSonera, and a release of a positive Q2 2011 financial report for
Volvo.
In the data gathered for Electrolux, it is observed that the announcement of a
substantial raw material cost increase and weaker demand lead to a fall in stock price
of almost 15 %, from 144,60 to 123,10 SEK. During the second event, i.e. the
announcement of a CEO change for TeliaSonera on the 16th of June 2013, the reaction
of the stock market has been positive with a stock price increase of 3,3 % from the
day before. In absolute terms the price went from 43,36 to 44,78 SEK. For the final
event chosen, i.e. Volvo’s release of the Q2 report in 2011, the stock price increased
from 102,0 to 105,7 SEK, i.e. 3,6 %. The releases of interim reports are, for all
companies, made three times yearly. However, it is not deemed to be such a big an

97
event that it would give misleading numbers during the estimation periods. Hence,
these events are not excluded, but instead this test aims to show that the release, in
this case of a positive report, does not have a considerable impact.
All three companies are top-performers in the respective years, and hence the main
test for the top performing companies has been run four more times with updated
numbers for each test separately and then for all events together in the same test. The
results are presented in Table 5.14 below.
N=186 Main test Electrolux TeliaSonera CEO change Volvo Q2 report All events
Day T-‐value p-‐value T-‐value p-‐value T-‐value p-‐value T-‐value p-‐value T-‐value p-‐value
-‐1 -‐2,682** 0,007** -‐2,683** 0,007** -‐2,681** 0,007** -‐2,682** 0,007** -‐2,681** 0,007**
0 -‐,124 0,594 -‐,124 0,594 -‐,122 0,597 -‐,124 0,594 -‐,122 0,597
1 ,246 0,996 ,246 0,996 ,246 0,995 ,246 0,996 ,246 0,995
2 -‐,056 0,706 -‐,056 0,706 -‐,056 0,706 -‐,056 0,706 -‐,056 0,706
3 -‐,379 0,671 -‐,379 0,671 -‐,378 0,671 -‐,379 0,671 -‐,378 0,671
CAR event -‐1,189 0,065 -‐1,189 0,065 -‐1,189 0,065 -‐1,189 0,065 -‐1,187 0,066
*** p<0.001, ** p<0.01, * p<0.05
Table 5.14. AR and CAR for main test with updated numbers for each event separately and all events together
As can be seen in Table 5.14, none of the events have had a significant impact on the
main test. All events show the same results for both the parametric t-test and the non-
parametric test, i.e. that only day -1 is significant at a 1 % significance level for both
tests.
Based on the results above, it is concluded that the examples of considerable events
that have taken place during the estimation window does not have any significant
impact whatsoever on the estimation of abnormal returns. The probable explanation is
that the impact of a single day out of 126 in total in the estimation window is too
small to have any significant impact on the slope and intercept used when calculating
the expected return using the market model. Hence, as the expected return when
incorporating the specific events does not differ substantially from when not
incorporating the specific events, the total impact on the test is trivial. In addition, if
an event would have a large impact on the expected return and hence on the abnormal
return, it is likely that it still would not affect the main test results considerably since

98
it would only comprise 5 observations (day -1 to 3 for one company) out of the total
sample of 186 observations.
5.3.2 Environmental and Human points
Folksam’s CSR report presents separate rankings for human rights performance and
environmental performance for each company listed on the Swedish Stock Exchange.
For the purpose of this study, the rankings have been added together in order to get
one overall ranking for each company. However, there might be differences in how
investors react to the two rankings separately, which could give different results from
what has been provided previously in this study. In fact, in none of the tests the
differences in points related to human rights versus environmental performance are
reflected. To examine whether there is a considerable distinction between how
investors react to human rights and environmental engagement separately, a sample
consisting of the top- and bottom performing companies within each area are chosen.
Investors are believed to have cared more about CSR in 2013 than in previous years
due to the increasing interest for the subject in general, and hence it is deemed to be a
good year to choose a sample from, as this should reflect the largest differences, if
there are any.
In Table 5.15 and 5.16 below, the main test for 2013 is presented together with the
separate results for the top- and bottom companies for human rights and
environmental performance respectively. As can be seen, the results between the two
areas are similar, especially for the top companies tests. For the bottom companies’
tests, some differences are observed. One of these is for day 0 for bottom performing
companies within the human rights segment, where the parametric test is significantly
negative at a 5 % significance level. which differs from both the main- and
environment tests. Another exception is for day 2, for bottom performers within the
environmental area, where the impact is negatively significant at a 1 % level, while no
significant results are proven for the human rights area. However, the direction of the
impact is negative for both areas.

99
N=31 Main Test Top Top Human Top Environment
Day T-‐value p-‐value T-‐value p-‐value T-‐value p-‐value
-‐1 -‐1,241 0,189 -‐,328 0,248 -‐,523 0,389
0 -‐,392 0,158 -‐1,185 0,240 ,710 0,557
1 -‐,525 0,531 ,619 0,875 -‐,007 0,922
2 ,077 0,610 ,663 1,000 -‐,974 0,875
3 ,075 0,583 ,027 0,938 -‐,608 0,784
CAR event -‐,821 0,481 ,146 0,845 -‐,483 0,769
*** p<0.001, ** p<0.01, * p<0.05
Table 5.15. The top performing human and environmental companies, respectively
N=31 Main Test Bottom Bottom Human Bottom Environment
Day T-‐value p-‐value T-‐value p-‐value T-‐value p-‐value
-‐1 -‐2,003* 0,033* -‐1,731 0,203 -‐,739 0,112
0 -‐1,219 0,025* -‐2,090* 0,096 -‐1,070 0,088
1 ,349 0,327 -‐,233 0,030* ,530 0,814
2 -‐2,073* 0,044* -‐1,405 0,367 -‐2,157** 0,057
3 -‐2,890** 0,006** -‐2,054* 0,063 -‐2,880** 0,004**
CAR event -‐3,914*** 0,000*** -‐3,311*** 0,005** -‐3,643*** 0,000***
*** p<0.001, ** p<0.01, * p<0.05
Table 5.16. The bottom performing human and environmental companies, respectively
To conclude, there are some differences between the two ranking areas. However, the
main test seems to capture the overall picture.
5.3.3 Correlation Test of Size Measures
For the purpose of the sub-hypothesis testing large companies, companies listed on
large cap with a market value above 1 billion EUR have been chosen, implying that
market value is the chosen measure of size. However, since there are different
opinions on how to measure the size of a company most accurately, it is deemed
important to examine other size measures as well and test the correlation between
these. If only market cap, or any of the other measures, is used in isolation, the results
of the sub-hypothesis could be biased and misleading. The test of how well the
different possible measures of size are correlated includes the following four variables
for each of the 240 companies in 2013; total sales, total assets, number of employees,
and finally market capitalisation, which was used as size differentiator in the sub-
hypothesis test. Among previous studies on the subject, several different size
measures can be found, and the measures found to fit the specific tests and the

100
methodology in this study best were chosen for this robustness test. However, as the
test shows, presented in Table 5.17 below, all variables correlate significantly with
each other, which enables conclusion that the measure chosen would not have
mattered much regardless of choice.
N=240 (all
variables) Total Assets Total Sales Market Cap Employees
Total Assets 1 ,824** ,831** ,607**
Total Sales ,824** 1 ,784** ,849**
Market Cap ,831** ,784** 1 ,600**
Employees ,607** ,849** ,600** 1
Table 5.17. Correlation matrix between Total assets, Sales, Market Cap and Employees

101
6. Analysis In this chapter, the empirical findings of the event study presented in the previous
section are analysed, starting with the main hypothesis followed by an analysis of the
sub-hypotheses.
6.1 Analysis of Main Hypothesis Overall, the results from the main hypothesis indicate no significant relationship
between the release of the CSR report and financial performance of the Swedish firms
listed in the top of the ranking over the whole period from 2006-2013. The same tests
for the bottom- and zero companies do however prove a significant impact on
financial performance as a result of the publication of Folksam’s CSR report.
Top performers did generally not have any positively statistically significant
abnormal returns as a result of the report release event. This can potentially have
several different explanations. The first is that investors actually do not care much
about CSR, and that they prioritise financial aspects more, which is supported by the
neoclassical theory claiming that the only responsibility of the management of a
company is to maximize the corporation’s long-term value. As discussed in the theory
chapter, engaging in CSR entails several monetary costs, both one-time and
continuous ones, which might be regarded as negative among investors if the financial
results are affected. In addition, companies engaging in CSR are more exposed to
scrutinisation and are therefore more likely to be hit by bad publicity if a mistake,
even a small one, is made. However, this explanation appears unlikely since it is
proved that CSR has gained an increased importance in the society and among
investors in general, which was also proven in the McKinsey survey made by Bonini
et al. (2009). This is particularly applicable on the Swedish market since Sweden is
regarded as a pioneer within the CSR field. Moreover, it is believed that the interest
for CSR has increased since the first release in 2006 and that this also could be a
potential explanation to why no significant abnormal returns are found for the whole
period.

102
A second explanation for the lack of positive impact on the top performing companies
could be that investors do think that CSR can add value, financially as well, but that
they are already aware of top performing companies’ CSR engagement and that the
reports therefore do not provide any new information. This explanation is more in line
with Freeman’s (1984) view of satisfying a number of stakeholders who can influence
the firm’s performance and outcomes, and is aligned with the conclusions drawn by
Alexander & Buchholz (1978) and Guidry & Patten (2010), among others. If the
investors are already aware of the companies’ CSR engagement, all information is
already incorporated in the stock price and no adjustment of the stock price is made,
which is in accordance with the semi-strong efficient market theory. For the publicly
listed Swedish companies, the information is in fact already available to the investors
and it is therefore likely that the information is already incorporated before the
release. However, as previously suggested, it is possible that a ranking in fact adds
new information to investors when the CSR performance of one company is put in
relative comparison to another company’s performance.
A final explanation to the insignificant results for top-performing companies could be
that, when assessing the value of a company, and hence its stock price, investors
perceive CSR engagement as such a long-term value adding activity that it cannot be
included in a valuation forecast horizon, and thus does not make a difference for the
final value. As was shown in the study made by Bonini et al. (2009), only 40 per cent
of the respondents were substantially positive that environmental (social) programs
contribute to short-term shareholder value, and that 85 per cent were substantially
positive that environmental (social) programs will contribute to the long-term value
for shareholders. Therefore, when not even one half of the investment professionals
regard CSR to be value adding in the short-term, it is understandable that the CSR
ranking report does not have a major impact on the stock prices of the Swedish listed
firms.
Moreover, the question of whether investors actually are aware of the report should be
considered. As described in the theory section on Characteristics of the Swedish Stock
Market, 41 per cent of stockholders of the Swedish listed companies are foreign
investors, and as the report is released by a Swedish company, and in addition, in
Swedish, it is unlikely that these investors have any knowledge or full understanding

103
of the report. However, no clear numbers are available on the characteristics of these
investors, i.e. if they are private investors or investors who trade via an agent. Most
likely, the shares are owned by funds. If the latter is the case, this issue is irrelevant,
as they should consider all activities concerning the companies in question. Therefore,
awareness should not be an issue. The same reasoning applies for Swedish investors
and as for the assumption above that the general interest for CSR has increased
among investors, it is also believed that the awareness of Folksam’s CSR ranking
report has increased over time.
An observation related to the analysis above is that the awareness of and interest for
CSR, and the ranking report in particular, has grown over time, which could be a
natural explanation for the generally non-significant results for the top companies. If
the beginning of the period was insignificant with investors not using the report as an
input for investment decision-makings, no significant abnormal returns are presented
for the whole period, thus providing misleading results for the whole period under
which the report has been released.
When it comes to the significant results for bottom and zero companies, they can
generally be explained by the argument that investors punish bad behaviour more than
reward good behaviour related to CSR. Similar results were found by Johnson (2003),
who states that being bad has a negative impact, while being good only pays off to a
limited extent, further supporting the results for the top-performing companies. A
potential explanation to why only companies with bad rankings are affected, and
companies with good rankings are not, is that investors expect companies to engage in
CSR. Hence, no abnormal returns occur for top-performing companies, as their work
comes as no surprise in relation to investors’ expectations. Bad performance, on the
other hand, comes as a surprise for investors who expects better CSR performance,
and hence they punish companies for this.
The strongly negative reaction of stock returns for bottom- and zero companies
indicate that the market was not fully efficient, and that the new information was
absorbed by investors and that it added value to their investment decisions. A low
ranking within CSR could have signalled both bad priorities from management as
well as lack of financial resources. The latter is, particularly in combination with the
104
fact that Swedish investors have shown an increased demand for CSR engagement, in
accordance with the slack resource theory suggesting that CSR potentially follows
slack resources. This implies that the absence of CSR engagement must be a
consequence of the companies’ lacking financial resources, which would send a
negative signal to investors.
Another thing to consider is what the definition of “bottom companies” actually
implies, i.e. those that receive the lowest points for both environmental and human
CSR combined. Worth pointing at is that some companies may only be “short-time
visitors” in the bottom-segment, which may be explained by several factors. One
could be that they are new to working with CSR, and hence have not had the time to
improve their work. Another could be that they are less good at reporting their CSR
efforts, in comparison to other companies.
Zero companies on the other hand, are “bad” in the sense that they not at all engage in
CSR. The number of these companies does however follow a clear decreasing trend
over the years studied, which suggests that working with CSR is more important to
companies, investors and other stakeholders today than in the beginning of the studied
period. Potentially this could be another sign of investors valuing CSR engagement.
Consequently, it can be concluded that an increasing number of companies work with
CSR issues, despite the insignificant impact on the stock price, but that they still
consider CSR work to be worthwhile. In addition, as investors apparently react to bad
rankings, they seem to consider CSR in their investment decisions. An interesting
question is therefore why no positive abnormal returns follow the ranking release. It
could potentially be the difficulty in measuring the value of the CSR activities that
leads to non-inclusion in the valuation. The long-term and rather diffuse added value
could, as discussed in the theoretical section, stem from an improved brand image and
company reputation, as supported by the study made in 1997 by Preston & O’Bannon
as well as by Bird et al., in 2007. It could also stem from the value added through
increased employee motivation and improved retention and recruitment, as well as
increased revenues from higher sales or capturing a larger market share. These
sources of value creation are also in line with both Burke & Logsdon’s results from
1996, where they link the mentioned benefits to improved customer loyalty and hence

105
financial performance, as well as with Greening & Turban’s (2000) conclusions about
employees having a higher self-image and feeling better overall when they work for a
green company.
Potentially, the value added and reasoning behind working with CSR could also be an
effect of cost savings from engaging in CSR and hence avoiding potential lawsuits or
similar issues that increase costs for the company. Finally, and perhaps more
importantly in a long-term perspective than the reasons just mentioned, engaging in
CSR can improve stakeholder relations and hence ensure the company’s “license to
operate”. As discussed in the theoretical section, ensuring goodwill and support from
governments can be crucial, especially when companies grow and start to operate as
multi-nationals, with divisions as well as supply chains in other countries or regions.
Good relations to stakeholders can be an important competitive advantage both when
for example entering new markets or trading with new regions. It should also be
mentioned that it is possible, and believable, that regulations will be stricter in the
future, as the world’s resources are getting scarcer. As recent as in the fall of 2014,
the European Union introduced an EU regulation on mandatory CSR reporting among
large companies, and the regulations on companies around the world are likely to be
stricter over time. Therefore, working with CSR can be seen as a long-term
investment for companies, especially if they are first-movers within that subject.
When viewing CSR from this perspective, the engagement could be incorporated into
a valuation forecast by seeing it as a strategic entry barrier for new potential entrants.
This way, CSR could be incorporated into a valuation either by including it in Porter’s
model, or in a SWOT analysis as strength. It would also be a competitive edge when
looking at PESTEL factors since a high CSR engagement both considers political,
environmental and social aspects. Either way, this would affect the forecast of sales,
or similar advantages, or reduce costs and expenses as discussed above.
Further, companies that are highly engaged in CSR should have a lower cost of equity
in comparison to companies showing low CSR engagement, which increases the
value of the company when for example using the discounted cash flow model for
valuation. The disclosures of CSR related actions would spread a positive image of
the company, which in turn would attract more investors leading to a wider
investment base and lower perceived risk in comparison to companies not engaging in

106
CSR. The CSR disclosures send positive signals to investors, on which they may react
if they find the information to be value adding, which is in line with the signalling
theory. An announcement related to CSR engagement may also signal that a company
has recovered from a financial downturn and hence have more resources available for
CSR investments and therefore can prioritise these types of activities to a larger
extent. CSR engagement could also, as discussed, send a positive signal to potential
employees to show good working conditions, as suggested by Greening & Turban
(2000), which hence attracts and motivates employees also leading to a better long-
term financial performance.
Despite all these arguments, CSR does not always seem to be included in valuations.
The most straightforward explanation for this, in spite of all possible value adding
advantages, is that in the end there is no guarantee for investors that CSR does add
value, and if it does, how much. Therefore, it might be reasonable to assume that
investors may wait to include CSR into a valuation until they know in what way and
how much value is added. This is confirmed by the survey by McKinsey, in which it
was concluded that a significant proportion of investors asked did not fully consider
the value of CSR in their valuations, as the value was too long-term, too indirect or
too difficult to measure accurately. Some studies even show the opposite. An example
is the study made by Hassel et al. (2011), which shows that high environmental
performance is costly and that this type of investments therefore negatively affects the
expected earnings and market value. They also suggest that investors potentially
ignore longer-term environmental information when making investment decisions.
Investors do therefore not reward companies with a highly rated environmental
performance, which is confirmed by the results of this study.
The fact that a company increasing its engagement in CSR activities may signal an
improved financial situation can also be linked to the causality discussion mentioned
earlier. It should be discussed whether it is the CSR engagement that affects the
financial performance of a firm, or if it is other way around. According to the slack
resources theory, firms with slack resources may have greater opportunities to invest
in CSR and when investors receive new information on CSR investments or CSR
engagement, they may see this as a signal of a better financial situation and an
indication of better future outlooks, thus leading to a higher stock price. As can be

107
seen in Appendix 9.4, many of the top-performing companies are also the largest
companies, which indicates that there is a connection in the other direction too.
The only sure thing is that CSR can add value, but potentially also reduce value, and
that it all depends on several factors that might be too intangible to test by using an
event study methodology. The study made by Waddock & Graves (1997) suggests
that it is dependent on slack resources, and that a firm with more of these have greater
opportunities to invest in CSR, as well as a possibly more approving crowd of
shareholders. The latter is in line with Barnett’s (2007) theory about stakeholder
influence capacity (SIC). He discusses the importance of knowing and understanding
the involved stakeholders, and through that predict when CSR actually can be value
adding. CSR could thus add financial value, but depending on the stakeholder
influence capacity of the firm, and hence he suggests that SIC should be perceived as
a firm-level intangible resource. This reasoning is also related to using CSR as an
intangible strategic advantage in accordance with the resource-based view.
Mackey et al. (2007) claim that the value added by engaging in CSR activities is
dependent on the investors’ demand for CSR. This conclusion is similar to Barnett’s
(2007) idea of CSR being value adding only when it suits the will of stakeholders, i.e.
that investing in CSR is about timing and knowing your crowd, and knowing how
well you can influence your stakeholders. This is potentially also a reason for the
results in this study being partially inconclusive, since the stakeholders related to all
companies included in this study are many and sometimes diverse. Moreover, as
Schaltegger and Synnestvedt (2002) discuss, knowing your stakeholders also implies
knowing at what level CSR investments add value. In their article they suggest that
economic success can follow environmental engagement, but only to a certain level,
where instead the costs are too high and the crowd does no longer approve. At this
point, the CSR efforts add no more value. This is another potential reason for the top
companies results being non-significant, and rather negative, as it would imply that
investors believe that these companies’ CSR engagement is over the top, and that the
costs related to CSR have come to a level where they exceed the benefits gained from
the engagement, hence destroying value.

108
A final observation is the significant result on the day before the release, i.e. day -1,
for both top- and bottom performing companies. This could indicate that insider
information is leaked beforehand to investors.
To sum up, the results from the main hypothesis do not give any significant results for
the top ranked companies, but rather shows a negative direction of the impact, while
bottom- and zero ranked companies are punished. Good performance is not
significantly rewarded; nevertheless companies spend considerable amounts of money
on CSR. Therefore, several sub-hypotheses are needed to explore if certain groups
within the population are rewarded by top rankings. These are elaborated on and
analysed next.
6.2 Analysis of Sub-hypotheses An observation from the sub-hypotheses results is that CSR seems to be regarded as
more important today in comparison to the beginning of the period. When the concept
of CSR was new in the end of the 20th century, it was often assumed that investors
were unwilling to pay a premium for socially-responsible corporate behaviour,
however this was proven to be changed already in 1996 by Pava & Krausz. Since
then, the interest for and importance of CSR seems to have increased even more
among investors, which is supported by both Folksam and Dow Jones who have
identified a growing CSR interest among investors for their investment strategies.
Only by looking at the results from sub-hypothesis 1 and 2, a clear trend between the
years of 2006 to 2013 can be observed. For 2006, only one observation is statistically
significant, indicating that no abnormal returns related to the release of the Folksam
report occurred. For bottom companies in 2013, the results show the opposite from
the bottom companies in 2006; several significantly negative results are presented.
For top companies, no significance is observed for any of the two years.
The results for the top companies in 2013 can be explained by Schaltegger &
Synnestvedt’s (2002) theory that CSR is value adding only to a certain extent. As a
result, top companies might be perceived to spend too much on CSR, sending a signal
to investors that the costs for the CSR engagement at that point might be higher than
the benefits gained, hence explaining the negative reaction. The negative results

109
related to the bottom companies in 2013 can be linked to the signalling theory, which
indicates that the release of information on CSR engagement acts as a signal to
investors with new and value-adding information and has immediate impact on stock
prices in accordance with the semi-strong efficient market theory. The direction of the
impact, i.e. positive or negative, will depend on the signal that is provided from the
released information to the investors. If they consider the bottom rankings to be
negative information, and they were not aware of this before the ranking report
release, the market should react negatively. In the case of the bottom performing
companies of 2013, it is seen that the investors react significantly negatively over the
whole event period, while no significant impact is seen for the top-performing
companies. A potential interpretation is that investors are aware of the potential
benefits of CSR engagement and find the ranking report to be disappointing in terms
of the bottom-performers.
The zero-companies on the other hand do not show any significant results for 2013. It
should however be remembered that for this test the sample size was only five, as
there has been a clear decreasing trend for the number of companies who do not
engage in CSR at all.
When exploring further, by separating the years into segments of pre-crisis, crisis and
post-crisis, similar results are found. These indicate that in 2013 (post-crisis) investors
seem to have reacted more to the release of the report than in 2006-2007 (pre-crisis).
During the crisis, negative significant results were found for both bottom- and zero
companies. Based on these results it can be concluded that even during recession
investors do value CSR and hence punish bad performance. Additionally, not
performing well in terms of CSR potentially sends a signal to investors suggesting
that the absence might be a consequence of lacking financial resources. Especially if
the demand for CSR engagement is high at all times, which this sub-hypothesis’
results indicate, there is no other reason for companies to not engage in CSR than
lacking resources.
Looking closer at the results from testing the crisis-period and post-crisis, the most
clearly negative results are observed for the bottom companies. As for this segment,
most of the companies are listed on small cap, and were often newly introduced to the

110
market at the time of the report release. Two straightforward arguments could explain
the results for this segment. The first being that these, many times small and newly
listed companies, do not have enough resources or time to expand their CSR
activities, and hence are stuck in the bottom rankings. However, as CSR is perceived
as more and more important by share- and stakeholders, they still do engage in CSR
to a certain extent, explaining why they are not zero-companies. The second
explanation for why the results for top companies’ cumulative abnormal return over
the whole event window are not significant, is that investors already know that the top
companies are engaged in CSR issues. Hence, the report comes as no surprise in
relation to investors’ expectations. This leads to the question of how to test whether
CSR engagement actually leads to financial value creation or not, and in that case,
how.
The third sub-hypothesis has investigated the inherent operational risk within certain
industries and for specific companies, for example those that are more exposed to
environmental hazard problems, and whether investors reward these companies
particularly for engaging and performing better within CSR issues. The companies
defined as operationally high-risk companies, which have received a good ranking, do
not seem to be rewarded for being “good”, as there are no statistically significant
abnormal returns related to the report release. Furthermore, the direction of the
reaction, although not significant, is mainly negative. The most reasonable
explanations for this would be, as for some of the results from the main hypothesis,
that investors are already aware of good CSR efforts and hence good rankings and
that the report therefore is no surprise, as well as the investors’ perceived equilibrium
in which CSR costs become higher than benefits is exceeded.
Another potential explanation for the negative, though insignificant, direction for top-
performing operationally high-risk companies is that CSR engagement may hurt the
company image if the motives behind are perceived to be insincere, as suggested by
Yoon et al. (2006). This might be the case for the top-performing companies acting in
environmentally dirty and bad industries, since being environmentally friendly is not
the reasoning behind making business in a dirty industry. Hence, the CSR
engagement among these companies may be perceived to contradict the companies’
business ideas, which indicates that they only do it in order to improve their image.
111
This behaviour may make investors and other stakeholders suspicious. However,
Folksam’s ranking report is supposed to reflect actions that have a real environmental
impact in comparison to more superficial actions, such as window-dressing. Actions
that have a real impact should also be in the interest of the companies, since they face
a lower risk of harming themselves through CSR activities by being genuine and open
with their motives in the market as well as pursuing genuine CSR objectives, which
was also concluded by Bhattacharya et al., (2011). In addition, this risk of bad
publicity is mitigated by satisfying the specific needs of the customers and aligning
the company goals with the stakeholder goals, which also can be linked to the
stakeholder influence capacity argued for by Barnett (2007).
The results presented above are partly in agreement with the results presented by
Klassen & McLaughlin (1996) who also use the event study approach to look at
abnormal stock returns. They find differences between industries where the impact on
stock return for firms acting in environmentally dirty industries is shown to be less
than the impact on other firms. This again may be linked to how the CSR engagement
is perceived by investors and stakeholders, i.e. that companies engage in CSR only to
improve their own image, and not because of a genuine care for the environment.
For those companies within the “environmentally risky industries” that perform
worse, the cumulative abnormal return for the event window is clearly significantly
negative, signalling that investors punish companies who according to several
stakeholders should take on more corporate social responsibility, but clearly do not.
This is in accordance with the results presented by Klassen & McLaughlin (1996)
finding that environmental crises were significantly related to negative returns. If
investors do value CSR engagement, it makes sense that for those companies that are
more scrutinized as they operate in risky industries, a bottom ranking is perceived
worse than for companies operating in industries where CSR engagement is more
diffuse and less relevant in relation to the business area operated within. Thus, it can
be concluded that investors seem to value CSR more when it is considered a strategic
driver than when it is more of philanthropic act, which in the eyes of investors
probably is perceived as a cost more than something value adding, and as mentioned
above as window-dressing rather than anything else. These results are similar to those
of Herremans et al. (1993), showing that among companies that are more exposed to

112
social conflicts, there is a positive relationship between CSR activities and financial
performance.
The fourth and final sub-hypothesis has examined whether good or bad rankings
affect large sized companies specifically, as these companies, according to for
example Herremans et al. (1993), are more visible and vulnerable to negative
publicity related to CSR. The results for the top companies were significant for day -1
only, while no significance was observed among the bottom companies. The
similarities between the highest and lowest ranked companies within the large
company group, can be explained by the fact that the bottom-performing companies
in the large cap segment actually are not performing bad at all. As can be seen in
Appendix 9.4, most companies segmented into the bottom-group of these large
companies do not have “bad” rankings. The appendix shows that the actual bottom-
performers, all companies included, are often found in small- or sometimes mid-cap
segments. As a result, what is considered to be “bad performing” within the group of
large cap companies may not be perceived as being bad at all by investors. Hence, the
impact is not as distinct and the investors do not punish them since they are still
performing at an acceptable level.
What can also be seen in Appendix 9.4 is that there is a clear trend of large cap
companies being top-performing companies, indicating that these companies
generally are better in terms of CSR engagement. This is understandable as these
companies, as suggested by Herremans (1993) are more publically exposed and hence
have more to lose by performing bad. In addition, they are often multi-national, multi-
divisional companies who are exposed to differing business norms and standards,
regulatory frameworks as well as stakeholder demand for CSR, and hence are more
dependent on good relations with stakeholders. These companies are more likely to
perform at a high level in terms of CSR in order to fulfil the minimum requirements
on CSR and environmental issues in all countries they operate in. Moreover, this
again opens up for the discussion about causality. These companies do generally have
more money to spend on CSR, especially if they have slack resources, as discussed
earlier. Therefore it would not be surprising if an investigation showed that top-
performers are top-performers as a result of a good financial situation, rather than the
other way around. Previous research has investigated both directions of the variables,

113
but no common view has been established, and probably the causality could go in
both directions.
A potential explanation for the large cap companies’ insignificant results is related to
investors’ awareness of the companies’ CSR engagement. If they already, at the time
of the release of Folksam’s CSR report, are aware of the companies performing at a
certain level, this information is already incorporated in the stock price and hence no
impact is observed. This is in accordance with the efficient market theory. If the same
test was performed on companies of similar size in another country characterised by a
lower transparency than the Swedish market, the results might have been different
since it is believed that these investors might have access to less information and that
a CSR ranking report hence would add new information and value to their investment
decisions.
The insignificant, but negative, impact on stock returns for top-performing large cap
companies’ could also be explained by the cost and benefit equilibrium theory
suggested above for the other tests. Again, investors may not reward companies that
put too much effort into CSR since it destroys, rather than creates, value at that point.
A final note is that the sample includes 29 observations only, which is not a complete
sample for the parametric test’s normal distribution assumption and hence may not be
fully representative. However, since only two observations are lacking, the sample
could be considered to indicate the direction of the impact on these companies.
For the final sub-hypothesis, the market capitalisation was used as a size
distinguisher. However, as was shown in the robustness test, the companies’ market
cap, total sales, total assets and employees, correlate highly, and hence the choice of
size measure is considered to be valid. In addition, if any of the other tests would have
been chosen, a limit for what is considered to be a large company would have been
needed, which could be considered to be too ambiguous and subjective and hence not
reliable.

114
7. Conclusion This chapter summarises the results and the analysis that this study has presented as
well as discusses the impact of the findings and how these can be used for future
research.
There is a clear trend towards increased engagement in CSR activities among
companies and their stakeholders, and in Sweden, there is a long tradition of active
CSR engagement. However, the impact on firm value from these activities has been
debated and there are schools and studies supporting both positive and negative
relationships between CSR and firm value as well as studies indicating no
relationship. Further, the question of causality has been raised, asking whether it is the
CSR engagement that affects the financial performance or the financial performance
that affects the CSR engagement. The general perception is that there is no clear
answer, and connections can be found in both directions, however there is little
evidence supporting that CSR and financial performance are directly related.
The objective of this thesis was to fill the gap in existing research by empirically
investigate whether CSR engagement has a direct impact on the financial value of a
firm. This was done by using a specific business case, namely a CSR ranking report
published by Folksam during six years from 2006-2013, to investigate the releases’
impact on the companies listed on the Swedish Stock Exchange. Top-ranked, bottom-
ranked and “zero”-ranked companies for each of the six years were studied. The
purpose was to examine whether the stock returns of the companies were affected as a
result of the release of the CSR ranking reporting and if there was a difference
between the three ranking groups. In addition, the study made use of four sub-
hypotheses to determine whether there was any difference in the potential impact
between the beginning and end of the period, between the years pre-crisis, during-
crisis, and post-crisis, as well as to investigate whether the impact on highly ranked
companies that are operating in industries that are considered to be operationally risky
and high ranked large sized companies is different from the impact on operationally
risky and large companies that have received a low ranking.
115
The empirical investigation of the effect on the market value of the Swedish listed
companies was conducted through an event study, where the publications of the
Folksam Index of Corporate Social Responsibility were defined as the events. For the
estimation of normal returns, the market model was used with 126 trading days prior
to the event in the estimation window. The cumulative abnormal returns were
calculated over one event window, from the day prior to the event, day -1, to day 3,
where day 0 corresponds to the event day.
The results from the event study showed that CSR engagement has no direct positive
impact on the financial value of the firm. A poor CSR engagement on the other hand
has proven to have a negative impact on the financial value of the firm. The
companies with high CSR rankings were neither rewarded nor punished, while the
companies with bottom rankings were punished. In short, this is explained by bottom
companies not fulfilling investors’ expectations. For the top-performing segment, no
significant results were found, but the overall impact appeared to be somewhat
negative. Two potential explanations to these findings were identified. The first being
that investors already are aware of the highly-ranked companies’ CSR engagement
and hence that no impact on stock price was shown due to an efficient market. This is
applicable on the Swedish market with its transparency and requirements for
companies to report all information that may influence the prices of the stocks, but it
could limit the applicability of this study to other countries. The second explanation is
that investors only value CSR investments up to a certain point where they perceive
the costs of CSR to equal the benefits. Once this equilibrium point is exceeded, the
investors no longer reward the efforts put into CSR, but rather punish the companies
for not acting in the best interest of shareholders.
When grouping the companies into more specific segments, as defined in the sub-
hypotheses, some further significant results were found. Firstly, the results clearly
confirm previous theory and research that has suggested that the interest in CSR has
increased over time and is continuously increasing. When comparing the same groups
of companies in 2006 to those in 2013, it was concluded that the results for 2013 were
more substantially more significant than the results for 2006, particularly for the
bottom performing firms.

116
Secondly, it was found that during the financial crisis, there was still a demand for
CSR among investors and it was discussed whether the absence of CSR engagement
might have functioned as a signal of an unstable financial situation and lack of
resources. During the three-year period when the market was in recession, the impact
on the bottom- and zero companies was negatively significant, indicating that the
release of Folksam’s CSR report did have a direct impact on stock returns as investors
punished bad performance. For all periods, there was no significant reaction for the
top performing companies’ stock returns, but the general direction of the impact was
negative.
Thirdly, the nature of the industries has shown to be of considerable importance.
When only selecting the companies operating in environmentally high-risk industries
as a sample, it became clear that those companies within this segment that received
worse rankings were punished as significantly negative returns followed the release of
the rankings. This result was aligned with the overall perception when considering all
tests; it was shown that negative performance was more punished than good
performance was rewarded.
Finally, when considering the size of companies, the main conclusion following the
results was that investors seem to be fully aware of the companies’ good performance,
and since almost all top-ranked companies were large cap companies, it follows
naturally that the ranking release comes as no surprise. As discussed above, an
alternative explanation is that the companies’ CSR efforts are considered to be too
costly and destroy more value than they create.
This study gives both companies and investors as well as other stakeholders, who
benefit from companies’ CSR work, a better insight into CSR efforts and provides an
overview of the potential long-term benefits that CSR engagement may incur. The
key finding is that companies that do not engage in CSR at all clearly are punished by
investors. Hence, this thesis may function as a motivator for companies for
continuous development of their work on CSR, at least to a certain point, since it has
identified an increased importance of CSR among investors and society in general
that is likely to grow over time, and also has discussed when CSR investments are
optimal and most profitable. It has also emphasized several positive CSR aspects and

117
how these efforts may add value to a business, despite the fact that they are not
always directly reflected in the stock price. Further, it has touched the issue of CSR
hurting the image and the competitiveness of a firm, and how to mitigate the risks of
bad publicity and negative effects as a result of CSR.
The results and topics covered may also be valuable to investors since they have
received insights into how CSR can be incorporated in a valuation. However, the
main issue with CSR, as indicated throughout the thesis, is that it is difficult to
measure, and even though investors know how to incorporate the CSR aspects of a
firm, they still find it difficult to measure the impact and determine the exact number
in which costs will be saved or avoided, or sales or market share will increase, as a
result of socially responsible activities. Hence, the results will be valuable for both
these parties, as well as for other stakeholders who benefit from companies’ CSR
work.
7.1 Limitations As with most studies, some limitations naturally follow the choices made during the
process. When limiting the research to the Swedish market, the first limitation that
followed was the potential ranking reports that could be used as a case. Folksam is, as
explained above, considered a reliable source of releasing such reports, and as
discussed in the method chapter, the potential problems with this report specifically
are outweighed by the advantages. When comparing to the alternatives, that is if
looking at other markets than the Swedish one specifically, it can be concluded that
the two most common problems among other rankings are subjectivity and the criteria
on which the company evaluations are based. While the issue of subjectivity is a
concern for Folksam’s report too, the criteria are not. As opposed to several of the
other rankings and indexes, Folksam bases their evaluations on the UN Global
Compact criteria, which are the most valid worldwide definitions and criteria for how
to be a good corporate citizen as of today. The issue of subjectivity is also regarded as
something that follows naturally when investigating CSR in general, since the
definition of CSR itself is subjective and still “under construction”.
118
Another limitation related to the above discussion is that CSR is a relatively new area
of research compared to many other areas, and therefore the number of observations
even when including all possible data related to the existing reports, is limited. The
largest test in this thesis comprised a number of 186 observations, which is by far
enough to achieve significant results, but can still not be considered a huge amount of
data, by most standards. This also limited the sub-hypotheses, as the total population
from where samples were found was small. Also, as companies not engaging at all in
CSR has decreased to a total number of five in 2013, the existing sample for testing
how investors perceive companies that do not engage in CSR is too small to be
significant according to common rules of thumbs about sample sizes.
Another issue that follows looking at relative returns, which an event study requires,
is that for those stocks that only are worth small amounts of money in absolute terms,
even the smallest increase or decrease in stock price has a large impact. This is
however something that follows the event study methodology, and hence the same
goes for all event studies, and the perceived advantages of the methodology
overweight this disadvantage.
An additional concern related to the results is the CSR measure chosen for the
purpose of this study. In general, CSR is difficult to measure and to avoid
shortcomings of CSR measures used in previous studies, a ranking made by a third
party has been used. Due to the lack of information about the exact number of
investors making use of Folksam’s ranking report, it cannot be taken for granted that
it is an appropriate measure of whether CSR engagement affects the stock price of a
firm. However, Folksam’s CSR report, which is publically available, is considered to
be the best available option for measuring CSR on the Swedish market. Any other
alternative would incur a larger amount of subjectivity and would require limitations
of the study that would be even more subjective than Folksam’s report itself. In
addition, Folksam is one of Sweden’s largest investment- and insurance companies,
and therefore it is believed that the report is known among investors and that the
release of this report thus is valid as an event for this event study.
The final limitation identified in this study is the number of days included in the
estimation window and the whole event window. The number of days used in
119
previous studies varies, and hence no direct choice can be made based on these.
Instead, a subjective assessment of what is considered to be reasonable has been used,
which may bias the results. However, based on the data available and all events that
occur close to the event and estimation period, the period chosen is regarded to be the
most appropriate and it is unlikely that any other number of days in any of the
windows would have given a more accurate result.
7.2 Suggestions for Future Research Several of the conclusions drawn in the analysis point towards the limitations that
follow the event study methodology. A more in-depth case specific study would
complement this study well, by further investigating those thoughts that have surfaced
during the process of this study. For example, taking a closer look at the specific
stakeholders of companies investing heavily in CSR would answer several questions,
such as if different stakeholders’ demand for CSR affects the financial value related to
increased CSR engagement.
Moreover, as Schaltegger and Synnestvedt (2002) discuss, knowing your stakeholders
also implies knowing at what level CSR investments continue to add value. In their
article they suggest that economic success does follow environmental engagement,
but only to a certain level, where instead the costs become too high and the crowd no
longer approves. At this point, the CSR efforts add no more value. This thesis
methodology limits the possibilities to explore this further, and it is reasonable to
assume that a more in-depth case study also could explore this issue better.
For the publicly listed Swedish companies, the information included in Folksam’s
report for each company separately is in fact already available to the investors and it
is therefore possible that the information is incorporated before the release and that
the ranking does not affect the stock prices due to the efficient market. Hence, it could
instead be interesting to look at stock indexes that only include companies that are
good corporate citizens, and see how these perform in relation to normal stock
indexes covering other companies’ stocks.

120
8. References Agresti, A. & Finlay, B. 2014. Statistical Methods for the Social Sciences. (4th
Edition). Harlow England: Pearson
Alexander, G. & Buchholz, R. 1978. Research Notes. Corporate Social Responsibility
and Stock Market Performance. Academy of Management Journal, 21 (3): 479-486
Andersson, K. 2008. 2008 - Ett rekorduselt börsår. Svenska Dagbladet.
http://www.svd.se/naringsliv/2008-ett-rekorduselt-borsar_2260997.svd. Published:
2008-12-30. Retrieved: 2015-04-12
Auerbach, A. J. & Hasset, K. A. 2005. The 2003 Dividend Tax Cuts and the Value of
the Firm: An Event Study. National Bureau of Economic Research, Working Paper
No. 11449
Aupperle, K., Carroll, A., & Hatfield, J. 1985. An Empirical Examination of the
Relationship between Corporate Social Responsibility and Profitability. Academy of
Management Journal, 28 (2): 446-463
Barnett, M. 2007. Stakeholder Influence Capacity and the Variability of Financial
Returns to Corporate Social Responsibility. Academy of Management Review, 32
(3): 794-816
Benninga, S. 2014. Financial Modeling. (4th Edition). Cambridge, MA: MIT Press
Bhattacharya, C.B. & Sen, S. 2004. Doing Better at Doing Good: When, Why, and
How Consumers Respond to Corporate Social Initiatives. California Management
Review, 47 (1): 9-24
Bhattacharya, C.B., Korschun, D. & Sen, S. 2011. What really drives value in
corporate responsibility?. McKinsey & Company.
http://www.mckinsey.com/insights/corporate_social_responsibility/what_really_drive
s_value_in_corporate_responsibility. Published: 2011-12. Retrieved: 2015-02-13
Binder, J.J. 1998. The Event Study Methodology since 1969. Review of Quantitative
Finance and Accounting, 11: 111-137
121
Bird, R., Hall, A. D., Momentè, F., & Reggiani, F. 2007. What Corporate Social
Responsibility Activities are Valued by the Market?. Journal of Business Ethics, 76
(2): 189-206
BITC. 2015:1. CR Index 2014: Company listing. Business in the Community.
http://www.bitc.org.uk/services/benchmarking/cr-index/results-and-insight-
2014/company-listing. Retrieved: 2015-04-12
BITC. 2015: 2. The Corporate Responsibility Index. Business in the Community.
http://www.bitc.org.uk/services/benchmarking/cr-index. Retrieved: 2015-04-12
Bloomberg. 2015. History & Facts.
http://www.bloomberg.com/company/bloomberg-facts/. Retrieved: 2015-02-02
Bonini, S., Brun, N., & Rosenthal, M. 2009. Valuing corporate social responsibility:
McKinsey Global Survey Results. McKinsey & Company.
http://www.mckinsey.com/insights/corporate_finance/valuing_corporate_social_respo
nsibility_mckinsey_global_survey_results. Published: 2009-02. Retrieved: 2015-02-
13
Brammer, S. & Millington, A. 2005. Corporate Reputation and Philanthropy: An
Empirical Analysis. Journal Of Business Ethics, 61 (1): 29-44
Brealey, R.A., Myers, S.C., & Allen, F. 2014. Principles of Corporate Finance. (11th
Edition). New York: McGraw-Hill Education
Brammer, S., & Millington, A. 2005. Corporate Reputation and Philanthropy: An
Empirical Analysis. Journal Of Business Ethics, 61 (1): 29-44
Bryman, A. & Bell, E. 2011. Business research methods. (3rd Edition). Oxford:
Oxford University Press
Burke, L. & Logsdon, J. 1996. How corporate social responsibility pays off. Long
Range Planning, 29 (4): 495-502
Campbell, J., Lo, A.W., & MacKinlay, A.C. 1997. The Econometrics of Financial
Markets. Princeton, N.J: Princeton University Press
Calvert. 2015:1. Calvert Social Index. Calvert Investments.
http://www.calvert.com/sri-index.html. Retrieved: 2015-04-12

122
Calvert. 2015:2. Calvert Social Index Frequently Asked Questions. Calvert
Investments. http://www.calvert.com/resources/calvert-social-index/calvert-social-
index-frequently-asked-questions. Retrieved: 2015-04-12
Calvert. 2015:3. Calvert Social Index Performance. Calvert
Investments. http://www.calvert.com/resources/calvert-social-index/calvert-social-
index-performance. Retrieved: 2015-04-12
CDP. 2014. The CDP Climate Performance Leadership Index 2014. CDP.
https://www.cdp.net/CDPResults/CDP-climate-performance-leadership-index-
2014.pdf. Published: 2014.
CDP. 2015. Annual CDP program Reports. CDP. https://www.cdp.net/en-
US/Results/Pages/reports.aspx. Retrieved 2015-04-12.
Cochran, P. and Wood, R. 1984. Corporate Social Responsibility and Financial
Performance. Academy of Management Journal, 27(1): 42-56
Copeland, T., Weston, J., & Shastri, K., 2005. Financial theory and corporate policy.
(4th Edition). International Edition: Pearson Education
Corrado, C., 1989. A Nonparametric Test for Abnormal Security-Price Performance
in Event Studies, Journal of Financial Economics, 23 (2): 385-95
Dagens Nyheter, 2015. Börsen idag. Dagens Nyheter.
http://www.dn.se/ekonomi/bors/bors-hem/. Accessed: 2015-04-22
Dechant, K. & Altman, B. 1994. Environmental leadership: From compliance to
competitive advantage. Academy of Management Perspectives, 8 (3): 7-27
Dow Jones. 2014:1. DJSI 2014 Review Results. ROBECOSAM Sustainability
Investing. http://www.sustainability-
indices.com/images/DJSI_Review_Presentation_09_2014_final.pdf
Dow Jones. 2014:2. Dow Jones Sustainability Indices Methodology. ROBECOSAM
Sustainability Investing.
http://www.djindexes.com/mdsidx/downloads/meth_info/Dow_Jones_Sustainability_
Indices_Methodology.pdf

123
Dow Jones. 2015. http://www.sustainability-indices.com/sustainability-
assessment/sustainability-investing.jsp. Retrieved: 2015-04-12.
El Ghoul, S., Guedhami, O., Kwok, C.C.Y., & Mishra, D.R., 2011. Does corporate
social responsibility affect the cost of capital? Journal of Banking & Finance, 35
(9): 2388-2406
Epstein, M.J. & Roy, M-J. 2001. Sustainability in Action: Identifying and Measuring
the Key Performance Drivers. LRP: Long Range Planning, 34 (5): 585-604
Ethisphere. 2015:1. WME FAQs. Ethisphere Institute. http://ethisphere.com/worlds-
most-ethical/wme-faq/#C1. Retrieved: 2015-04-12
Ethisphere. 2015:2. Scoring & Methodology. Ethisphere
Institute. http://ethisphere.com/worlds-most-ethical/scoring-methodology/. Retrieved:
2015-04-12
European Commission. 2015. Non-financial reporting.
http://ec.europa.eu/finance/accounting/non-financial_reporting/index_en.htm. 2015-
04-04. Retrieved: 2015-04-08
Fama, E. 1970. Efficient Capital Markets: A Review of Theory and Empirical Work.
The Journal of Finance, 25 (2): 383-417
Financial Times. 2011. Electrolux hit by high raw material costs.
http://www.ft.com/intl/cms/s/d1cc048a-b1e9-11e0-a06c-
00144feabdc0,Authorised=false.html?_i_location=http%3A%2F%2Fwww.ft.com%2
Fcms%2Fs%2F0%2Fd1cc048a-b1e9-11e0-a06c-
00144feabdc0.html%3Fsiteedition%3Dintl&siteedition=intl&_i_referer=#axzz3Zixr
YSqX. Published: 2011-07-19. Retrieved: 2015-05-02
Finansinspektionen. 2015. Marknadsmissbruk.
http://www.fi.se/Tillsyn/Statistik/Marknadsmissbruk/. Retrieved: 2015-04-07.
Folksam. 2006. Folksams Index för ansvarsfullt företagande 2006.
Folksam. 2007. Folksams Index för ansvarsfullt företagande 2007.
Folksam. 2008. Folksams Index för ansvarsfullt företagande 2008.

124
Folksam. 2009. Folksams Index för ansvarsfullt företagande 2009.
Folksam. 2011. Folksams Index för ansvarsfullt företagande 2011.
Folksam. 2013. Folksams Index för ansvarsfullt företagande 2013.
Folksam. 2013. This is Folksam. http://omoss.folksam.se/inenglish/aboutfolksam.
Retrieved: 2015-01-20
Freeman, R.E. 1984. Strategic Management: A Stakeholder Approach. Boston, MA:
Pitman
Friedman, M. 1970. The social responsibility of business is to increase its profits.
New York Times Magazine, September 13: 32-33.
FTSE. 2015:1. FTSE4Good Index Series. FTSE
Group. http://www.ftse.com/products/indices/FTSE4Good. Retrieved: 2015-04-12.
FTSE. 2015:2. FTSE4Good Index Series Fact Sheet. FTSE Group.
http://www.ftse.com/Analytics/FactSheets/temp/466ea14c-2bcc-4b6a-9e85-
22e7edcb8e7c.pdf. Published: 2015-03-31
FTSE. 2015:3. FTSE4Good Global Index Fact Sheet. FTSE
Group. http://www.ftse.com/Analytics/FactSheets/temp/3d2b1af6-ccb3-48c3-a1b6-
7ca07bfeec8b.pd. Publish: 2015-03-31
Greening, D.W. & Turban, D.B. 2000. Corporate Social Performance as a
Competitive Advantage in Attracting a Quality Workforce. Business & Society 39
(3): 354-280
Guidry, R. & Patten, D. 2010. Market reactions to the first-‐time issuance of corporate
sustainability reports. Sustainability Accounting, Management and Policy Journal,
1 (1): 33-50
Hassel, L., Nilsson, H. & Nyquist, S., 2005. The value relevance of environmental
performance. European Accounting Review, 14 (1): 41-61
Herremans, I., Akathaporn, P. & McInnes, M. 1993. An investigation of corporate
social responsibility reputation and economic performance. Accounting,
Organizations and Society, 18 (7-8): 587-604
125
Johnson, H. 2003. Does it pay to be good? Social responsibility and financial
performance. Business Horizons, 46 (6): 34-40
Klassen, R. & McLaughlin, C. 1996. The Impact of Environmental Management on
Firm Performance. Management Science, 42 (8): 1199-1214
Koh, J., & Venkatraman, N. 1991. Joint Venture Formations and Stock Market
Reactions: An Assessment in the Information Technology Sector. The Academy of
Management Journal, 34 (4): 869-892
Koller, T., Goedhart, M. & Wessels, D. 2010. Valuation: Measuring and Managing
the Value of Companies. (5th Edition). New Jersey: John Wiley & Sons, Inc.
Konjunkturinstitutet. 2006. Konjunkturläget.
http://www.konj.se/download/18.70c52033121865b13988000105755/December_200
6.pdf. Published: 2006-12. Retrieved: 2015-04-07
Konjunkturinstitutet. 2007:1. Stark arbetsmarknad och högre avtal ökar trycket på
löner och inflation. http://www.konj.se/removed_782.html. Published: 2007-03-29.
Retrieved: 2015-04-07
Konjunkturinstitutet. 2007:2. Fortsatt hög tillväxt med många nya jobb.
http://www.konj.se/removed_783.html. Published: 2007-08-29. Retrieved: 2015-04-
07
Konjunkturinstitutet. 2008. Svensk ekonomi går in i en lågkonjunktur.
http://www.konj.se/removed_787.html. Published: 2008-08-27. Retrieved: 2015-04-
07
Konjunkturinstitutet. 2009. Det kraftiga BNP-fallet bromsar upp men arbetslösheten
ökar snabbt fram till 2011. http://www.konj.se/443.html. Published: 2009-07-17.
Retrieved: 2015-04-07
Konjunkturinstitutet. 2010. Tydlig återhämtning skuggas av orosmoln.
http://www.konj.se/1673.html. Published: 2010-06-23. Retrieved: 2015-04-07
Konjunkturinstitutet. 2011. Den högsta sysselsättningen på 20 år.
http://www.konj.se/221.html Published: 2011-03-31. Retrieved: 2015-04-07

126
Konjunkturinstitutet. 2011. Återhämtningen i ekonomin tar en paus.
http://www.konj.se/347.html. Published: 2011-08-31. Retrieved: 2015-04-07
Konjunkturinstitutet. 2012. Flera tecken på en snar konjunkturuppgång.
http://www.konj.se/545.html. Published: 2012-03-28. Retrieved: 2015-04-07
Konjunkturinstitutet. 2012. Lågkonjunkturen fortsätter.
http://www.konj.se/579.html. Published: 2012-06-20. Retrieved: 2015-04-07
Konjunkturinstitutet. 2012. Lågkonjunkturen fördjupas.
http://www.konj.se/693.html. Published: 2012-12-19. Retrieved: 2015-04-07
Konjunkturinstitutet. 2013. Små steg mot bättre tider. http://www.konj.se/792.html.
Published: 2013-03-27. Retrieved: 2015-04-07
Konjunkturinstitutet. 2013. Tydligare tecken på snar vändning.
http://www.konj.se/891.html. Published: 2013-08-28. Retrieved: 2015-04-07
Konjunkturinstitutet. 2014. Svagt Euroområde hämmar svensk tillväxt.
http://www.konj.se/1129.html. Published: 2014-12-18. Retrieved: 2015-04-07
Konjunkturinstitutet. 2015. Ljusning för konjunkturen och svensk export.
http://www.konj.se/1177.html. Published: 2015-03-25. Retrieved: 2015-04-07
Konjunkturinstitutet. 2015. Konjunkturen i Sverige.
http://www.konj.se/346.html?overviewid=5.1734e80814bc5f7dc5b452. Published:
2015-03-25. Retrieved: 2015-04-07.
Lind, D.A., Marchal, W.G. & Wathen, S.A., 2015. Statistical Techniques in Business
& Economics. London: McGraw-Hill Education
MacKinlay, A.C. 1997. Event Studies in Economics and Finance. Journal of
Economic Literature, 35 (1): 13-39
Mackey, A., Mackey, T., & Barney, J. 2007. Corporate Social Responsibility and
Firm Performance: Investor Preferences and Corporate Strategies. Academy of
Management Review, 32 (3): 817-835
Marrewijk, M. 2003. Concepts and Definitions of CSR and Corporate Sustainability:
Between Agency and Communication. Journal of Business Ethics, 44: 95–105
127
McWilliams, A. & Siegel, D. 2000. Corporate social responsibility and financial
performance: correlation or misspecification?. Strategic Management Journal, 21
(5): 603-609
McWilliams, A. & Siegel, D. 2001. Corporate Social Responsibility: A Theory of the
Firm Perspective. Academy of Management Review, 26 (1): 117-127
McWilliams, A., Siegel, D. & Wright, P. 2006. Corporate Social Responsibility:
Strategic Implications*. J Management Studies, 43 (1): 1-18
MSCI. 2015:1. MSCI WORLD INDEX (USD).
http://www.msci.com/resources/factsheets/index_fact_sheet/msci-world-index.pdf.
Retrieved: 2015-03-18
MSCI. 2015:2. Indexes.
http://www.msci.com/products/indexes/country_and_regional/dm/. Retrieved: 2015-
03-18
NASDAQ. 2015:1. OMXSPI Overview.
https://indexes.NASDAQomx.com/Index/Overview/OMXSPI. Retrieved: 2015-04-07
NASDAQ. 2015:2. Vad är aktieindex?.
http://www.NASDAQomxnordic.com/utbildning/aktier/vadaraktieindex?languageId=
3. Retrieved: 2015-04-07
NASDAQ, 2011. NASDAQ OMX Nordic Market Model 2.1.
http://www.NASDAQomx.com/digitalAssets/73/73450_NASDAQ_omx_nordic_mar
ket_model_2_1_21_march_2011.pdf. Retrieved: 2015-04-07
Newbold, P., Carlson, W., & Thorne, B. 2013. Statistics for business and economics.
(8th Edition). Harlow: Pearson Education
Pava, M. & Krausz, J. 1996. The association between corporate social-responsibility
and financial performance: The paradox of social cost. Journal of Business Ethics,
15 (3): 321-357
Peloza, J. & Shang, J. 2011. How can corporate social responsibility activities create
value for stakeholders? A systematic review. Journal of the Academy of Marketing
Science, 39 (1): 117-135

128
Petersen, C. & Plenborg, T. 2012. Financial statement analysis. Harlow, England:
Financial Times/Prentice Hall
Preston, L. & O'Bannon, D. 1997. The Corporate Social-Financial Performance
Relationship: A Typology and Analysis. Business & Society, 36 (4): 419-429
Regeringen. 2014. Stärkt konsumentskydd på finansmarknaden.
http://www.regeringen.se/sb/d/2425/a/251370. Published: 2014-12-09.
Retrieved: 2015-04-07
Riksbanken. 2014. The Swedish Financial Market 2014. Riksbanken.
Riksbanken. 2015. Sök räntor och valutakurser. http://www.riksbank.se/sv/Rantor-
och-valutakurser/Sok-rantor-och-valutakurser/. Retrieved: 2015-05-03
Schaltegger, S. & Synnestvedt, T. 2002. The link between `green' and economic
success: environmental management as the crucial trigger between environmental and
economic performance. Journal of Environmental Management, 65: 339-346
Schwert, G. 1989. Why Does Stock Market Volatility Change Over Time?. The
Journal Of Finance, 44 (5): 1115-1153
Siegel, S. 1957. Nonparametric Statistics. The American Statistician, 11 (3): 13-19
Sprinkle, G. & Maines, L. 2010. The benefits and costs of corporate social
responsibility. Business Horizons, 53 (5): 445-453
Standard & Poor & MSCI. 2010. Global Industry Classification Standard.
http://www.standardandpoors.com/servlet/BlobServer?blobheadername3=MDT-
Type&blobcol=urldata&blobtable=MungoBlobs&blobheadervalue2=inline%3B+filen
ame%3DGICS_MAPBOOK_electronic_0711.pdf&blobheadername2=Content-
Disposition&blobheadervalue1=application%2Fpdf&blobkey=id&blobheadername1=
content-type&blobwhere=1243945221356&blobheadervalue3=UTF-8. Retrieved:
2015-01-26
Strong, N. 1992. Modelling abnormal returns: A review article. Journal of Business,
Finance and Accounting, 19 (4): 533-553
Swedbank, 2015. Frågor och Svar. https://www.swedbank.se/privat/spara-och-
placera/aktier/fragor-och-svar/index.htm. Retrieved: 2015-04-06
129
Sweden.se, 2015. Corporate Social Responsibility in Sweden.
https://sweden.se/business/csr-in-sweden/. Retrieved: 2015-03-25
TeliaSonera. 2013. Johan Dennelind ny VD och koncernchef för TeliaSonera.
http://www.teliasonera.com/sv/newsroom/pressmeddelanden/2013/6/johan-dennelind-
ny-vd-och-koncernchef-for-teliasonera/. Published: 2013-06-16. Retrieved: 2015-05-
02
Thecro. 2015. CR Magazine Corporate Citizenship Lists Methodology.
http://thecro.com/content/cr-magazine-corporate-citizenship-lists-methodology
Retrieved: 2015-04-12
ThomsonReuters. 2013. Thomson Reuters Corporate Responsibility Indices - Index
Methodology. http://thomsonreuters.com/content/dam/openweb/documents/pdf/tr-
com-financial/methodology/corporate-responsibility-indices-methodology.pdf.
Published: 2013-05. Retrieved: 2015-02-17
ThomsonReuters. 2013. Thomson Reuters Corporate Responsibility Ratings
(TRCRR). http://thomsonreuters.com/content/dam/openweb/documents/pdf/tr-com-
financial/methodology/corporate-responsibility-ratings.pdf. Published: 2013-08.
Retrieved: 2015-02-17
ThomsonReuters. 2013. Thomson Reuters launches corporate responsibility indices.
http://sustainability.thomsonreuters.com/2013/04/29/thomson-reuters-launches-
corporate-responsibility-indices/. Published: 2013-04-29. Retrieved: 2015-02-17
ThomsonReuters. 2013. Thomson Reuters Launches Corporate Responsibility
Indices.
http://www.reuters.com/article/2013/04/23/idUSnHUGd2V3+72+ONE20130423
Published: 2013-04-23. Retrieved: 2015-02-17
ThomsonReuters. 2015:1. Corporate Responsibility Indices.
http://thomsonreuters.com/en/products-services/financial/market-indices/corporate-
responsibility-indices.html. Retrieved: 2015-02-17
ThomsonReuters. 2015:2. About Us. http://thomsonreuters.com/about-us/company-
history/ Retrieved: 2015-04-06

130
Ullmann, A. 1985. Data in Search of a Theory: A Critical Examination of the
Relationships Among Social Performance, Social Disclosure, and Economic
Performance of U.S. Firms. Academy of Management Review, 10 (3): 540-557
UN Global Compact, 2015. The Ten Principles.
https://www.unglobalcompact.org/AboutTheGC/TheTenPrinciples/index.html
Retrieved: 2015-02-04
Van Horne, J. C. & Wachowicz, J. M. 2005. Fundamentals of Financial
Management. (12th Edition). Harlow: Pearson Education Ltd.
Vance, S. C. 1975. Are Socially Responsible Corporations Good Investment Risks?
Management Review, 64: 18-24
Volvo. 2011. Volvokoncernen - De sex första månaderna 2011.
http://www.volvogroup.com/group/sweden/sv-
se/aktieagare/reports/delarsrapporter/Pages/kvartalsrapport_2011q2.aspx. Retrieved:
2015-05-02
Waddock, S. & Graves, S. 1997. The Corporate Social Performance-Financial
Performance Link. Strategic Management Journal, 18 (4): 303-319
Weber, M. 2008. The Business Case for Corporate social responsibility: A company-
level measurement approach for CSR. European Management Journal, 26: 247-261
Wright, P., Ferris, S.P., Hiller, J.S. & Kroll, M. 1995. Competitiveness through
Management of Diversity: Effects on Stock Price Valuation. Academy of
Management Journal, 38 (1): 272-287
Yoon, Y., Gürhan-Canli, Z. & Schwarz, N. 2006. The effect of Corporate social
responsibility (CSR) activities on companies with bad reputations. Journal of
Consumer Psychology, 16 (4): 377-390
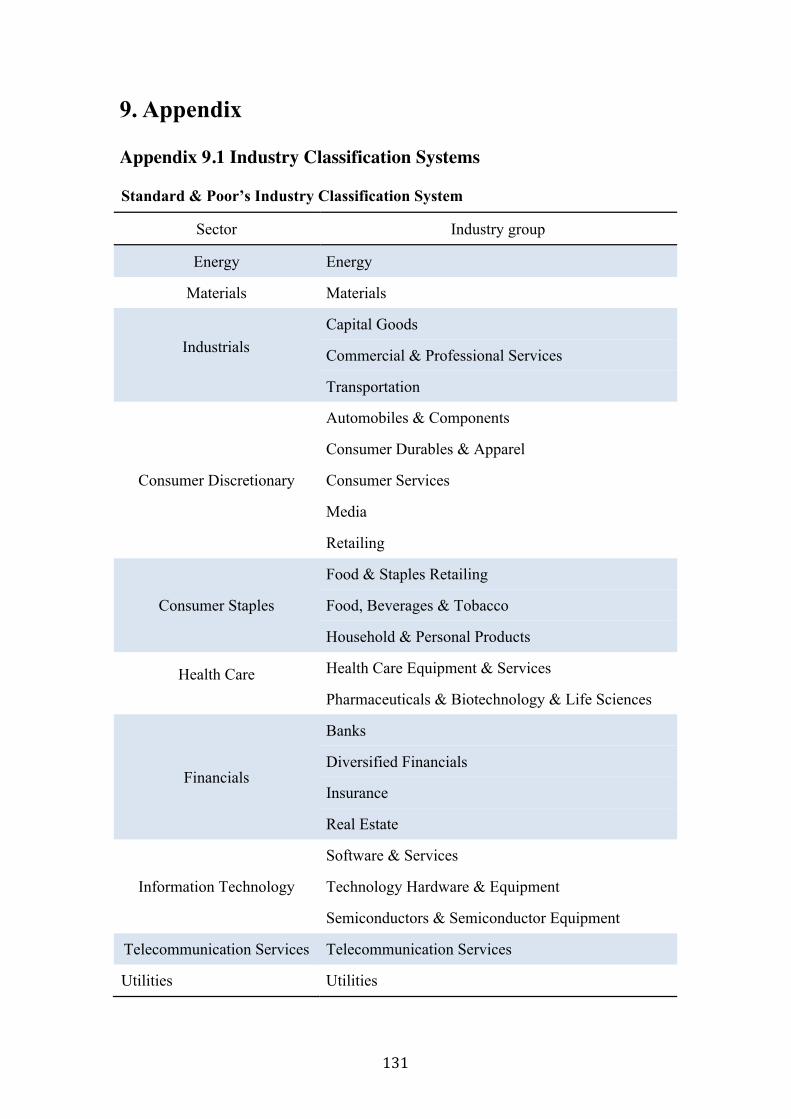
131
9. Appendix
Appendix 9.1 Industry Classification Systems
Standard & Poor’s Industry Classification System
Sector Industry group
Energy Energy
Materials Materials
Industrials Capital Goods
Commercial & Professional Services
Transportation
Consumer Discretionary
Automobiles & Components
Consumer Durables & Apparel
Consumer Services
Media
Retailing
Consumer Staples
Food & Staples Retailing
Food, Beverages & Tobacco
Household & Personal Products
Health Care
Health Care Equipment & Services
Pharmaceuticals & Biotechnology & Life Sciences
Financials
Banks
Diversified Financials
Insurance
Real Estate
Information Technology
Software & Services
Technology Hardware & Equipment
Semiconductors & Semiconductor Equipment
Telecommunication Services Telecommunication Services
Utilities Utilities

132
Affärsvärlden’s Industry Classification System
Sector (Swedish name)
Industry group (Swedish name)
Materials (Råvaror)
Chemistry (Kemi) Oil & Gas (Olja & Gas) Mining & Metals (Gruv & Metaller) Forestry (Skog)
Industrials (Industri)
Transportation (Transport) Vehicles & Machinery (Fordon & Maskiner) Construction & Engineering (Bygg & Anläggningsrelaterat) Industrial Conglomerats (Industriella Konglomerat) Wholesales (Grossister) Printing & Office Supplies (Tryckerier & Kontorsvaror) Technical Consultants (Tekniska Konsulter) Other Industries (Övrig industri)
Consumer Goods (Konsumentvaror) All Sub-Sectors (Samtliga underbranscher)
Healthcare (Hälsovård) All Sub-Sectors (Samtliga underbranscher)
Telecommunication (Telekommunikation) All Sub-Sectors (Samtliga underbranscher)
Media & Entertainment (Media & Underhållning)
Sub-Sectors Missing (Indelning för underbransch saknas)
Services (Tjänster) Sub-Sectors Missing (Indelning för underbransch saknas)
IT Companies (IT-företag) All Sub-Sectors (Samtliga underbranscher)
Finance (Finans)
Real Estate (Fastigheter) Banks & Insurance (Bank och försäkring) Investment- & Management Companies (Investment- och förvaltningsbolag) Other Financial Services (Övriga finansiella tjänster)
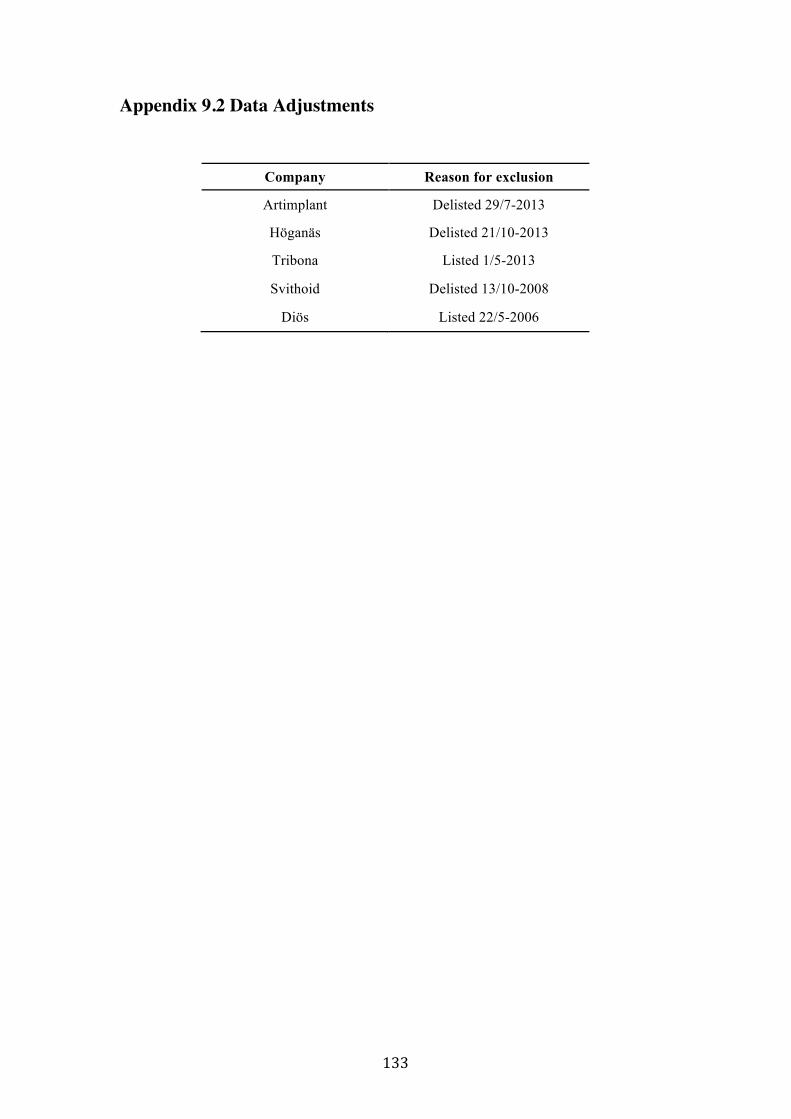
133
Appendix 9.2 Data Adjustments
Company Reason for exclusion
Artimplant Delisted 29/7-2013
Höganäs Delisted 21/10-2013
Tribona Listed 1/5-2013
Svithoid Delisted 13/10-2008
Diös Listed 22/5-2006
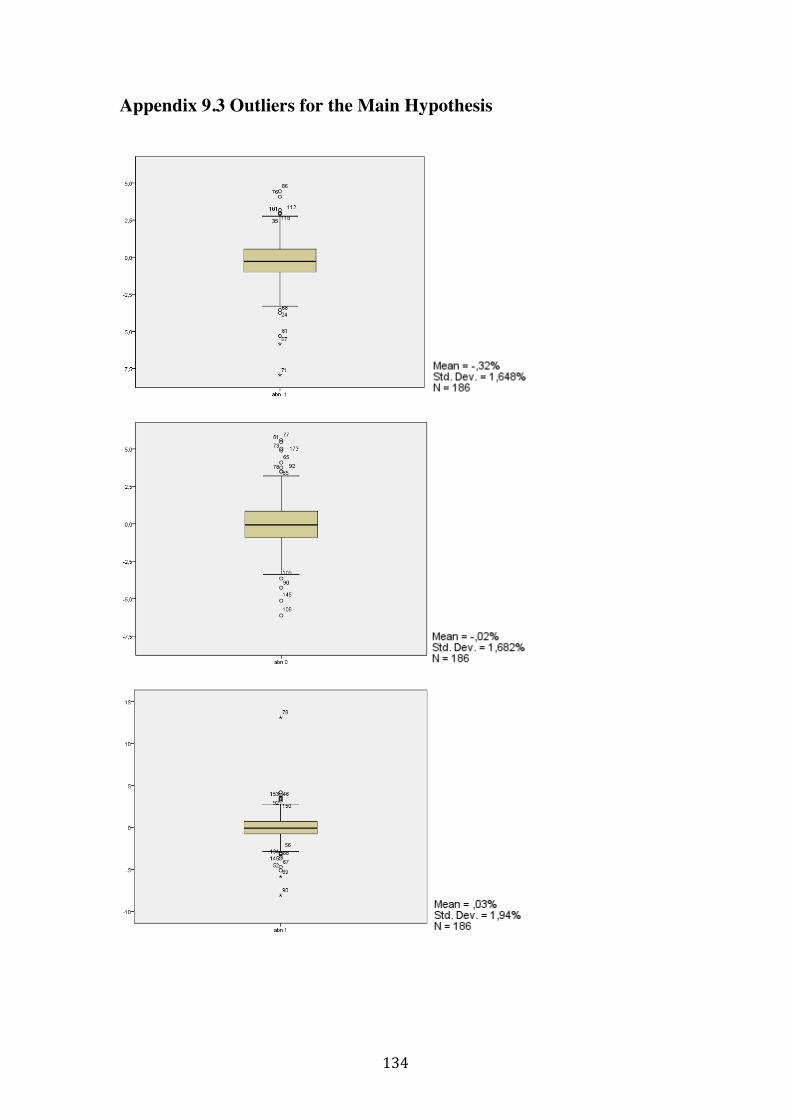
134
Appendix 9.3 Outliers for the Main Hypothesis

135
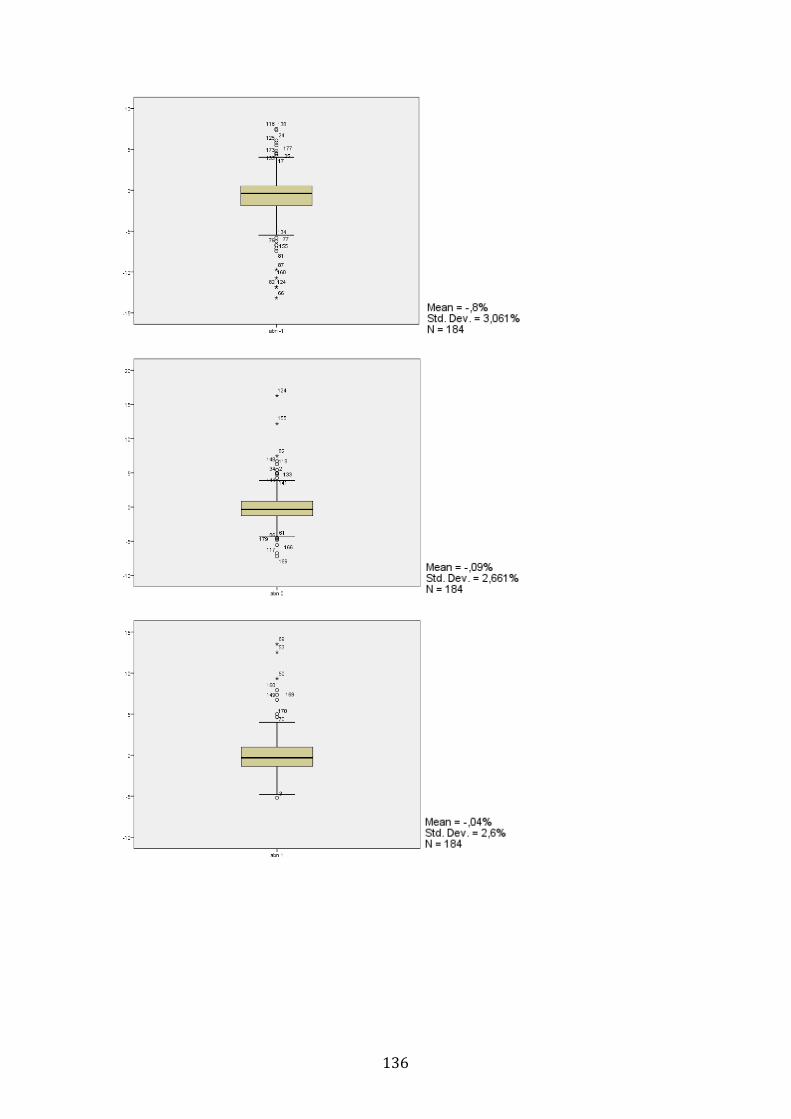
136

137

138
Appendix 9.4 Size versus Ranking
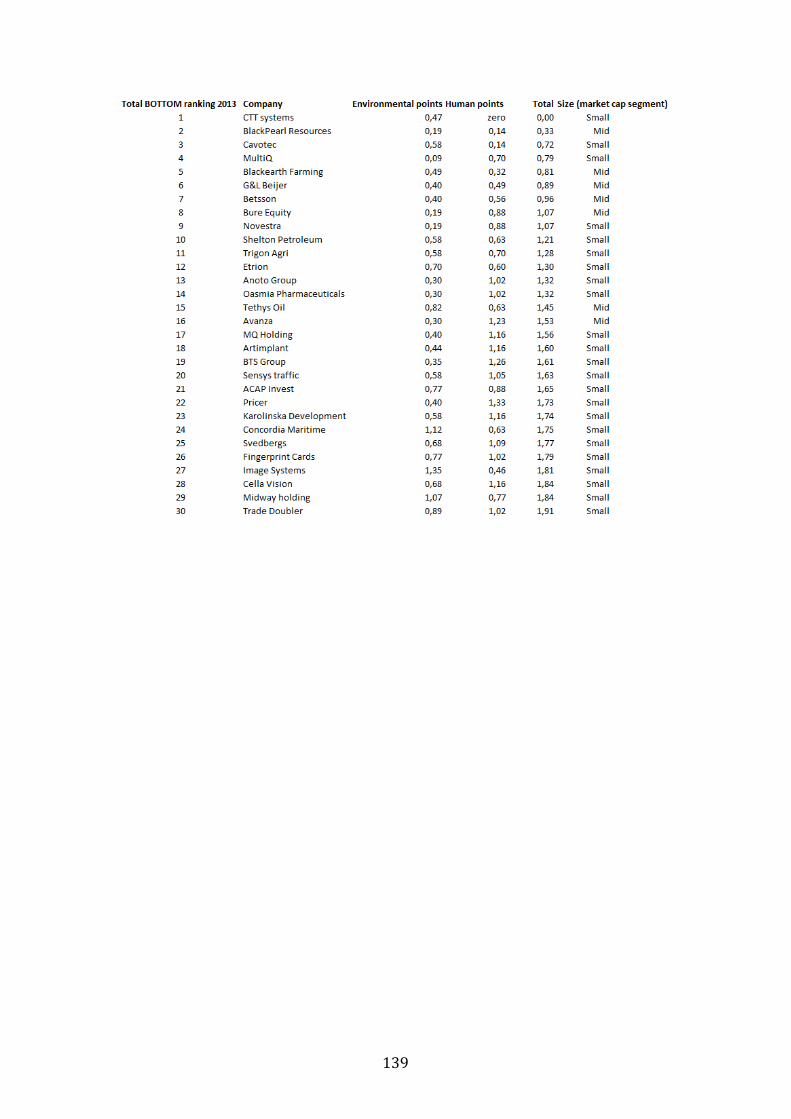
139