the impact of cumulative impact factors - eugene · pdf fileproceedings of the 8th ifse...
TRANSCRIPT
Proceedings of the 8th IFSE Conference. Barcelona 1995 1
Impact of Cumulative Impact Factors
EUGENE GARFIELD
Chairman Emeritus, Institute for Scientific Information, Philadelphia, PA 19104, USA
Most of you have heard about journal impact factors and even used them in one fashion or another? And probably you’re also aware that there is considerable controversy about the use of citation analysis to evaluate scientists and institutions. But remarkably, journal impact factors seem to be minimally controversial. Of the many quantitative measures derived from the Science Citation Index@, impact factors are probably of the SCI Journal Citation Reports@ but it may also be due to the lack of any subjective approach that is manageable in evaluating thousands of publications.
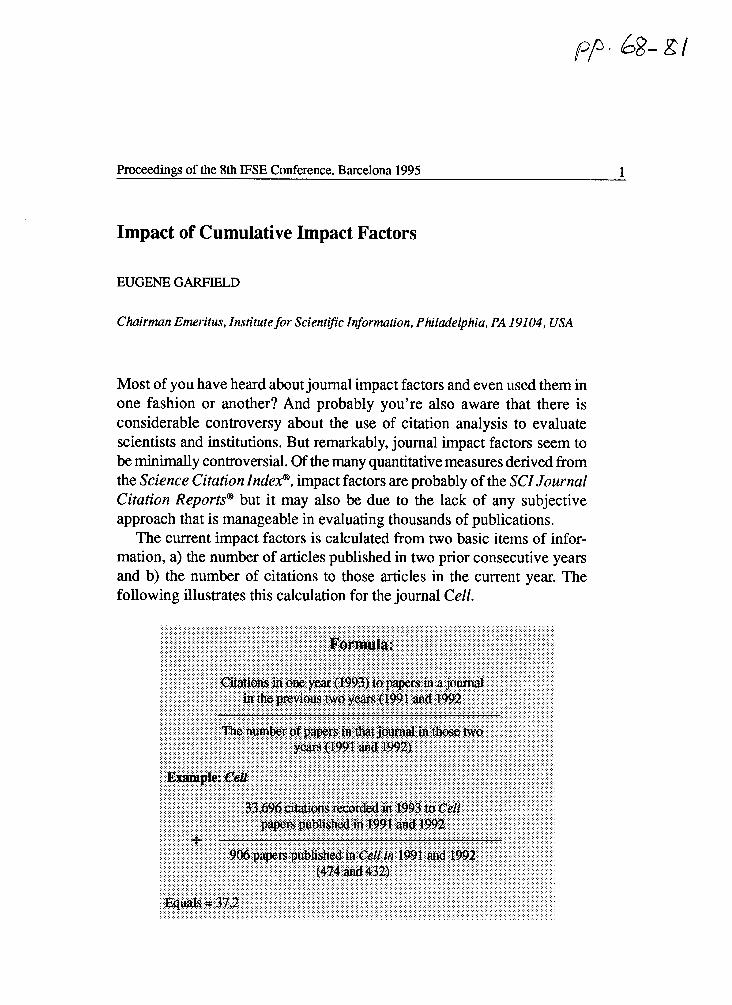
The current impact factors is calculated from two basic items of infor- mation, a) the number of articles published in two prior consecutive years and b) the number of citations to those articles in the current year. The following illustrates this calculation for the journal Ceil.
2 Proceedings of the 8th IFSE Conference. Barcelona 1995
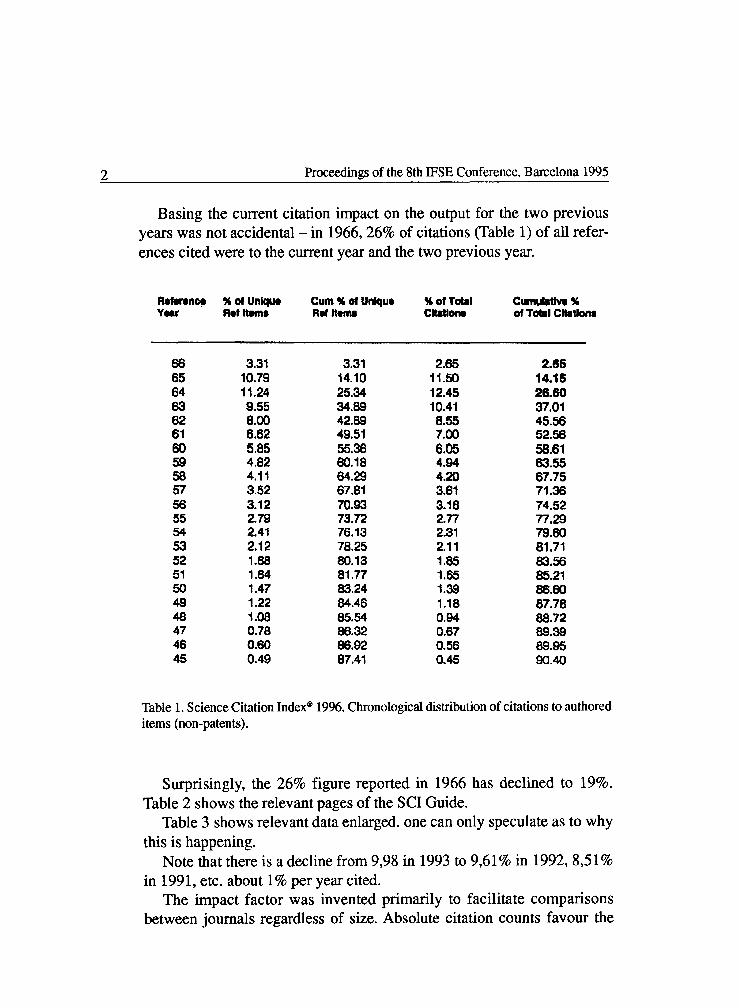
Basing the current citation impact on the output for the two previous years was not accidental - in 1966,26% of citations (Table 1) of all refer- ences cited were to the current year and the two previous year.
96 of Unlqm Rot Item8
Cum 96 of Rof Item8
Un)eltJe
66 3.31 3.31 2-65 2.85 65 10.79 14.10 11.50 14.15 64 11.24 25.34 12.45 26.60 63 9.55 34.89 10.41 37.01 62 8.00 42.88 8.55 45.56 61 6.62 49.51 7.00 52.56 60 585 55.36 6.05 58.61 59 4.82 60.18 4.94 63.55 58 4.1t 64.29 4.20 67.75 57 3.52 67.81 3.61 71.36 56 3.12 70.93 3.16 74.52 55 2.79 73.72 2.77 77.29 54 2.41 76.13 2.31 79.60 53 2.12 70.25 2.11 81.71 52 1.88 80.13 1.85 83.56 51 1.64 al.77 1.65 85.21 50 1.47 83.24 I.39 86.60 49 1.22 84.46 1.18 07.70 48 I.08 05.54 0.84 80.72 47 0.78 86.32 0.67 89.39 46 0.60 86.92 0.56 89.95 45 0.49 87.41 0.45 QcMo
Table 1. Science Citation Index@ 19%. Chronological distribution of citations to authored items (non-patents).
Surprisingly, the 26% figure reported in 1966 has declined to 19%. Table 2 shows the relevant pages of the SC1 Guide.
Table 3 shows relevant data enlarged. one can only speculate as to why this is happening.
Note that there is a decline from 9,98 in 1993 to 9,61% in 1992,8,5 1% in 1991, etc. about 1% per year cited.
The impact factor was invented primarily to facilitate comparisons between journals regardless of size. Absolute citation counts favour the

Proceedings of the 8th IFSE Conference. Barcelona 1995 3
F 5 D
1987 V86 198s 1964 VU3
1982 1981 1986
1979
1977 1976 1915 1974 1973
1972 197J
m 1969
F i
Perentage of Total Citadons
CITING YEARS
1975 l97s IM 1978 1979 la0 ml s9u 190 1964 l9u l986 lrn
1.86 1.77 7.52
1.77 7s 10.08 1.80 7.62 1022 9.68
1.88 7AS IO.32 9.62 8.45
1.88 7.76 10.19 9.s a.39 731 1.49 1.73 10.34 9-a 8.40 729 6.24
1.43 7.13 10.57 9.86 6.62 7.47 6.44 S.S8 1.43 7.16 1038 9,70 8.47 733 630 S.46 4.72
1.50 7.32 10,68 9.90 Ui 7.33 633 5.45 473 4.09 153 7wS8 10.68 10.13 8.9 7.37 6.33 5.50 4-V 4.16 3.63
1.73 759 1486 9.98 6.71 7.335 631 3.45 4.72 4.11 3.59 3.15 1.81 8.25 Il.13 LO.06 6.73 731 d4l 3.53 4.81 4.18 3.U 3.22 2.81 8.82 11&l lQ,JS 8.68 7.44 6.40’ 548 4.70 4.08 3.58 3.13 2.75 2.44
11.37 10.17 8.84 7.S2 6.46 553 4.79 4.11 3.53 3.14 275 2.44 216 10.21 8.84 7.a 646 537 4.8t 4.19 3.62 3.16 2.79 246 219 133 6.65 7.43 6.45 5.49 4.76 4.11 3.62 3.13 2.74 2.44 216 1.92 1.71 7.33 632 5.49 4.76 4.13 3.61 I.22 2.N 2.SO 2.23 200 1~ 1.61 6.29 J.45 4.75 4.11 359 3.14 360 2U 2.16 1.92 1.71 153 137 5.46 4.75 4.16 3.62 3.19 2.78 2.49 218 I.92 1.73 1.34 1.38 123 4.72 4.15 3.63 3.21 2.82 2.48 223 133 1.73 J.SS 1.40 I.25 l.J3 3.95 3.48 3m 2.69 239 2.11 I.#) 1.67 1.48 1.M 1.21 1.08 0.97 355 3.13 275 2.44 2.17 1.91 1.7s 1.54 137 1a 1.13 lb1 091
Cumulative Percentage of Total Citations
CmG YEARS
l975 I976 1977 1978 1919 JHO V8J 1982 1963 1964 VSS VU V8l
I,86 177 938.
1.77 9.31 19.46 1.80 9.39 19.61 29.15
168 9.53 19.71 29.33 37.60 1.88 9.U 19.83 29.26 37.65 U.81
1.49 9.61 1938 29.60 37.66 44.95 X04 1.43 162 20.18 29.64 36.46 4S.13 U.01 56.62
1.43 839 i9.00 29.88 #31 4S.64 51.43 51.43 61.34
l.!m 8.75 19.27 28.90 38.39 4sb4 51$7 %A6 %$2 6s.43 1.53 9.08 19.43 29.40 37.48 45.76 3137 57.47 61.63 61.64 69.06
1.73 9.12 19.94 29.41 38.11 44.83 32.07 57.40 62,l2 6S.H 65.80 ?2.20 JJ1 9098 2k25 30,oO 38.14 4SA2 S 1.U ~7.60 62.21 66.93 69.38 69.40 75-02
lOb3 21.00 MO 36b$ 4S.M Sun 56.72 62.30 66.29 76.47 72.51 72.61 77.46
2200 31.17 39.24 462Q 5204 57s 6lJl 66.41 $a4 73.42 ‘75.26 7x37 79.62 32.21 40.01 46A4 5266 57.61 6236 65.70 70.03 73-m 76.14 77.72 77.81 8157
40.86 47.44 53.29 $8.15 62.37 66.47 69.32 7116 75.74 783 79.88 8O.W 83.27 48.19 53.76 S8.78 6291 6650 70.08 72.54 75.97 7834 80.68 81.88 81.92 8489 54.48 59.21 63.53 67.02 10.09 73.22 75.34 78.41 8Oby) 82.63 83.59 83.73 16.26 S9.95 63.96 67.69 70.64 73.28 76.00 77.83 UO.S9 8232 84.24 8X1.13 853 87.49 64.66 68.11 71.32 73.85 76810 78.48 80.06 8254 Ma b5.78 66.S3 8663 88.62 66.61 rLS9 7437 76.54 78.49 8059 II,% 8421 65.53 67.06 87.74 87m88 USi59 72.16 74.72 77.12 7838 8Oh6 82.SO 83.71 6S.75 66.90 66.14 66.67 66.% 9050
19u Vu un 1991 1992 J993 J994 135
1.60 737 L65 7.3a 9.99
Jb4 7.47 9.98 9.30 1.65 7.47 10.13 9.61 6.M
1.69 7.42 10.21 9.60 8.51 7.43 1.76 7.5s 10.12 9,5!I 8.43 7.33 6.32 7.7-I 10.23 9.5ll 8.48 7.33 636 SJO
10111 9.46 833 7l23 6.23 5.39 4.66 93 6.32 7.24 6.24 3.38 4b7 4.04 8.39 7.28 6.34 s.43 4.71 4.06 355 7.29 6.33 4.46 4.69 4.07 3.56 3.10 6.29 X46 4.75 4.11 356 3.13 2.75 S,U 4.72 4.12 338 3.13 275 2.44 4.84 4.22 3.71 3.23 2.81 249 221 4,aP 3.59 3.15 2,76 2.42 tlS 1.90
3.56 3.13 275 241 2.12 1.88 1.67 3.u 280 2111 k.19 1.94 1.73 1s 2.77 246 219 1.94 I,74 1.56 1.38 249 119 1.95 1.73 1.54 1.39 124 2.15 1.91 1.71 132 1~ 1.22 1.11
1.92 1.72 1.54 1.38 1P l.11 LO1 I.74 1.56 1.40 1.26 1.14 1.03 Q93 I.52 I.37 1.23 1.10 1.00 0.89 Q82 1.46 1.32 1.20 1.10 l.aI 0.90 0.82 133 1.10 1.00 0.90 OA2 0.73 0.68 1.10 1.00 0.91 0.82 0.74 0.67 0.61 1.01 b92 0.83 0.75 0.68 0.61 0.56 0.18 O.&I 0.73 0.65 0.59 0.54 0.49 0.82 475 0.69 0.63 0.57 OS2 0.47
1w 1989 1996 1991 lWp92 1993 1994
13s 1.64 8.92
1.65 8.M 16.91 I.64 9.12 18.96 28.41
1.6s 9.10. 19.25 2857 36.95 1.69 9.07 1931 28.85 37.08 46.38
1.76 9.23 19.19 28.90 372d 44.41 Ia70 953 19.47 28.77 37.38 44.61 50.77 56.20
19.60 2892 37.10 44.61 B.84 56.16 60.86 29.11 37.24 44.34 m8 56.22 60.83 My0 37s US2 5068 56.26 40.93 64.91 68.4s 44.79 S&US 56.14 60$7 65.m 68.47 7155 51,06 56.33 60.69 6S.08 t&S6 71.66 74.30 S6.S3 6l.B 6S.01 68.66 71.69 74.35 7474 6136 65.28 66.72 71.90 7450 X84 71195 63.411 68.87 71.88 74.65 76.92 7199 80.6s 69.01 7200 74.63 77.06 79.04 80.67 6252 7218 74.80 77.11 79.25 80.96 8260 84.06 74$5 77.26 7930 81.19 82.?2 84.16 05.44 n.43 79.4s 812s a.93 8426 G~3.55 8648 7958 81.39 82% 84.45 8S.62 86.77 87.79 61.50 83.09 6450 8SA2 86o85 87.83 88.80 $324 $4.65 8!Mo 87.08 87.!?9 a.91 19,73 U4.76 MAI2 87.13 88%.18 88.99 89.M 9OJ5 $62 87.36 88.34 89.28 a9.99 90.70 91.37
87.44 IL44 t933 90.19 9041 91.43 92.05 883s 89.44 90.24 91.01 91s 9210 92.66 89956 90.36 91-07 91.76 9223 92.71 93.22 90.44 9Ll6 91.80 92.41 92.82 93.25 93.71 9lZJ6 91.90 9248 93.04 93.39 93.77 94.18
Table 2. Science Citation Index* 1975-94. Chronological distribution of citations to authored items (non-patents). Citation data for citing years earlier than 1975 and for cited years earlier than 1965 are available in editions of the SCl@ published prior to 1989.

4 Proceedings of the 8th IFSE Conference. Barcelona 1995
Reference Year %Total Cumulative 96
1994 1993 1992 1991 1990
I 1989 1988
1.55 4.55 7.37 8.92 9.99 18.91 9.50 28.41 8.54 36.95 7.43 44.38 6.32 50.70
Table 3. Science Citation Index’@ 1994. Chronological distribution of citations to authored items (non-patents).
largest journals whether in current output or in cumulative output over the past century. Thus even a defunct journal might receive more citations than an existing one. For many years the Journal of Agricultural Research which ceased publication about 1950, was cited more than other living journals.
Table 4 shows a ranked list of journals in the 1993 Journal Citation Reports arranged by total citations to all years. Deceased journals are omit- ted. This ranking does not discriminate between journals on the basis of age or size. Current productivity or output is also an important indicator of a journal’s influence. Table 5 shows the top 50 journals in terms of items processed for the 1993 SCI - all published over 950 articles per year.
This is a good place to show another version of these data. Figure 1
- CITED JOURNALS
- - SOURCE JOURNALS ---------
1 .lO L loo 1000 2000
NUMBER OF JOURNALS
Figure 1. Distribution of published items and citations among science journals, 1989 SCI.
Proceedings of the 8th IFSE Conference. Barcelona 1995 5
0 I
8 9 40 41 4 4 3 44 45 4 4 s 48
JOURNAL TITLE
3 NATI- ACAD SC1 USA 234319 I _- WV_ w-v- - -_- --
3 010L WE- NATW SCIE NE f ’ 3 -AH CHEN SOC CELL- WYS REV 8 1 3 CHEM WYS -1 m=ivS RfV L FTT t
8RAfN r-i! - CANCER ii z s J-u-y
3 CELL 810Lv 3. PtiYS CH 81W-t M 8 OR4 wcL& E
f f”l46
RES Co--- c ACIDS RES
EFBO J- $ AP?L PHYS 3 GEOPWS RES- APPL Pt=NS LET1 _i mc; ruFIu_ -w- ---
Blow J EXP BLm
__ x-m---- -1 i
- : -
---- ;‘i AM MED ASSOC. l _
.
. 3 cm N&u3~t----- ~TROENTEROLOCI' Jd'HAFtMCOL EXP THEf+--
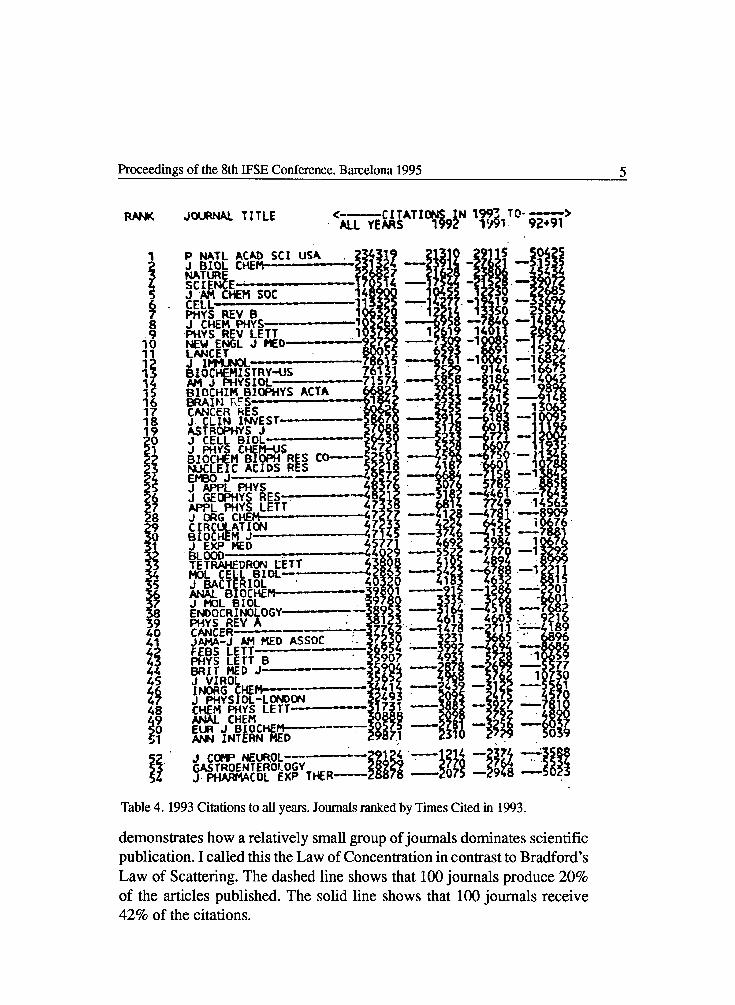
Table 4.1993 Citations to all years. Journals ranked by Times Cited in 1993.
demonstrates how a relatively small group of journals dominates scientific publication. I called this the Law of Concentration in contrast to Bradford’s Law of Scattering. The dashed line shows that 100 journals produce 20% of the articles published. The solid line shows that 100 journals receive 42% of the citations.

6 Proceedings of the 8th IFSE Conference. Barcelona 1995
RANK
1
s 4 5 6 7 8 9 10 11 1 1 s 14 75 76 17 18 39
59 L 2 5
z 4 S
26 27 28
s 9 0
39 40 41 c 4 s 44 4s 46 47 48 49 50
JOURNAL TITLE
wr’s REV 8 3 0 3 BlQL WEPI- ~~--~--~--1 0 3 Am Ptws f P MTL ACAD SC1 USA-----k AM J PHYSIOL AWL PHYS LETT-----?- : 3 NY CttEM SOC FWS REV KU------ : 3 CWI FWS 3 * TETRAHEDRW LETT--o--- . JPN J APR. PHYS f J f'!iYS CHEt+US---9-r-3: BlOCHIH BfWtNS ACTA i? * IWRCHWYS J -3 0 J GEOWYS RES
* 9 BIocHmlsTRY-us--- l
BRAIN RES BlOCHEM BfCPH RES Co-------- PHI’S LETT B CHEM PWS LEfT------- FEBS LETT
3 ItwaL 7. MltL LNSTRtlVI MEW 8---1.
THVS REV A f
. ELECTRON LET17w--_-q l
PHYS REV f CANCER wm--~rr---~ . MACROMOlECULES NUCLEIC ACIDS RfS------ FIK? _I r%-WMAfc)I
159 793 784 35 s 19 SO 36 3 11 1 i
!4f s
395 47
$ 7
96 1 89 a4
31 07 6 08 39 0 2P 1
0°5 of I? 7
iii92
IWACT C/TAT ONS FACTWZ
f f NW9 TO
SOURCE I~OIACY IT PI
993 ITEMS IN Fd 3 INDEX
mK-aEM J-- AN NV ACAD SC1 3 CHEH SO& CHEM COP?+-- SCfENCE .--- ~~ .I f'ws-CCh?DEhJS HAT----_-t-l CANCER RES 6 PWS LETT A-- 1 AsTR(W J4sTROQHYS blMmE-------
-; ww--II--y-
r&JCL WY’S 8 f PHYTOCHEmTfw------+1
2 t 67 -- 17
859 -----_3608
872 -m6
--a 0 f 4 1
416 -- 504
879 --------638
P -4
-1999 lE90
-787 177 !I
-177 .I 65 8
-1636 7 17 !i ml99
1509
0.560 -7.
0. 0 Y$ -1~~78
0.371 ----0.482
O.GSl ;I--o.
0. $8 --O.ES7
Table 5. SC1 Journal citation reports. Journals ranked by source items in 1993.
ity. It is a preliminary indicator of influence. However, there are some jour- nals which achieve a remarkably high impact in spite of, or maybe even because of, their size. Thus, one might reasonably argue for a combined measure reflecting size, citation and currency.
That is illustrated in Table 6 which shows the journals most-cited in 1993 for their 199 1 and 1992 articles. Undoubtedly this tells us something

Proceedings of the 8th IFSE Conference. Barcelona 1995 7
3 BIOL WEM s 2 153 P MTL MAD SC1 USA---- 042 kAi=iiE
$8 IENCE --‘b
LL PWS REV Pws REV B J #I CHEM SOC- t&u Et&L J MED
3-MO BIOL k . .--ii! 07 PHYSCAC 87
581 - 19
?8 39 -16 1
1947
7586 '-4
20 5 T '-184
. .*..a
Table 6. SC1 Journal citation reports. Journals rankings 1993. Ranked by time 1991 and 1992 items were cited in 1993.
about their overall current influence. However, it is important to mention that there are differences between fields as to the rate at which knowledge is accumulated. But surprisingly even a field like astrophysics has a cited half-life less than 10 years, as is also the case for plant science journals. While a journal like Cell has a cited half-life of four years, it would require more study to say anything authoritative. The new CD-ROM version of

8 Proceedings of the 8th IFSE Conference. Barcelona 1995
JCR will allow this to be done more easily. If you compare Table 6 to Table 4 you can see how the rankings change.
JBC moves to 1st place and PNAS moves to 2nd. Nature moves from 46th place to 3rd and Science moves from 41st to 4th.
I much regret that IS1 did not originally publish long-term cumulative factors in the Journal Citation Reports. However, the urgencies of meeting annual schedules and the lower priority it received as a give-away product discouraged this from happening. As I often demonstrated in Current Contents essays, you can easily combine data for consecutive issue of JCR to obtain such information.
Keep in mind, however, that a five -or ten - year impact number can be calculated in two ways. The first is to use one base year as a baseline and create a moving five-year window. The other is to use several base years and include all citations for the same base years. The latter would generally produce a lower value, but not always. For example, JAMA published 627 articles in 1989 (see Equation 2). In the five years 1989-93, it received 11,320 citations. This gives a five-year impact of 18.05. It published 3,101 articles from 1989 to 1993 and received 29,047 citations in those five years
Equation 2. Five-year impact for Jam.
or a five-year impact of 9.37. This gives you a preliminary idea of the pos- sible differences in current and cumulative impact.
The following Equation 3, I’ve done the same exercise for Nature and

Proceedings of the 8th IFSE Conference. Barcelona 1995 9
Science. The current year impact and the most recent five-year impact, how- ever, do not give us an absolute picture of the long-term performance of journals. And as we will see, there turns out to be considerable variance from year-to-year depending upon whether the journal published one or more super-cited articles.
As editors you know that it is not always easy to categorize or character-
Equation 3. Five-year impact for Nature and Science.
ize different types of editorial matter. Not all review articles are labelled as such and many reviews contain original research data as well. Such hybrids are also to be observed in characterizing letters to the editor, which vary rnncidmddy in qlJ&t,y md wnp That, is why 1 hswp. nlw~y~ 1Jrgd ditnrc rivrrllurir-vr WI_ UVV A Il64VW &4ATTI, vu VUICVI u
to conduct an item-by-item citation audit. These audits may or may not confirm your own subjective estimate of the best quality articles - or the most innovative or the most premature. But they will give you some objec- tive indicators of the way they have influenced your readers and the scien- tific community. Let me turn now to the presentation of my main slides. -VW* a With the advent of fhe ISI Journal Performance Indicators databases, I real- ized that it would be relatively easy to obtain long- term measures of im- pact. These had never before been published. In the next tables I’ve compiled such cumulative data for the single year 198 1 as well as for the five-year period 1981-5.
Table 7 shows the top 34 research journals ranked by current impact

10 Proceedings of the 8th IFSE Conference. Barcelona 1995
Table 7 shows the top 34 research journals ranked by current impact factor for 1993. Later, I’ll show you data for review journals. The rank by current impact is shown on the left followed by the cumulative impact for 198 1 articles followed in turn by a number showing the rank by cumulative impact. Lest the folks at Cell jump to any conclusions, let me point out that about 20% of their articles are classified as reviews. So it would be reasonable to separate these two classes of articles in a deeper analysis.
1983 WB3 1981 1901 RankJoluw hplcr Av/clo cum
lam* Rank
1. Cdl 372 12&S 1 2 UEJM 23.8 Ia8 * 2 3. WmJre 22.3 70.5 8 4. science 21.1 61 .l 10 ci. Lanmt 18.9 61.8 17 8. JExpMed 93.7 89a3 3 7. 3 Ceil Bioi 11.7 80.7 b 8. PMS (Biol) 10.3 86.9 4 9. Arch Qem Psych 9.5 7899 6 10. Ann Int Mod 9.3 53.7 lb 11. Am J Hum Tenet 9w2 24.3 31 12. Moi ceil Biol 9-2 4&8 20 13. Cifculation 9.0 54.3 13 14. CA Cancer J 8.9 1oa 34 15. 3 Ciin invaat 8.5 77.q 7 16. Blood 8.1 e2.7 16 17. J Neuroaci 8.0 70.1 9 18. J Natl Cant I 7.5 30.6 29 19. Phys Rev L 7.1 43.0 21 20. 3 lmmunol 7.1 S&O 12 21. Ann Neuroi 7.0 36.6 26 22. SyM zoo1 6.8 42.8 22 23. JBC 6.8 48.7 18 24. Angcrw Chem 6.2 21.0 32 2s. carK!w Re8 6.0 36.7 25 26. Qastroenteroiogy 5.9 47.4 19 27. Circulation Ras 6.8 54.1 14 28. 3 Moi Hoi 6.7 60.7 11 29. J Viroiogy 5.7 32s 28 30. Am3Patboi 5.7 42.2 23 31. JAMA 6.6 20.7 33 32. Eur J immunoi 6.6 41.9 24 33. ArthritM Rhaum 5.5 27.3 30 34. Lab Invert 5.5 35.6 27
Table 7. Current vs cumulative impact
In Table 8, I’ve shown these 34 journals ranked by the cumulative im- pact number for their 1981 articles. In the second column, the current 1993 impact is shown. As you can see, the order is quite different. While Cell


12 Proceedings of the 8th IFSE Conference. Barcelona 1995
Nature, Science, Circulation Research, and Annals of Internal Medicine. The Table 9 covers another aspect of journalology that has distressed me since the publication of David Hamilton’s ill conceived diatribe in Science in which he mischievously misquoted data he did not understand concem- ing citedness in science and the humanities. As you can see from these data, the journals that produce the highest impact articles have an extremely low degree of uncitedness. Even this, by itself, does not say enough be-
‘-4. c011 303 2. NEJM 378 3. JExpMed 343 4. WAS (Bid) 1550 5. J Cell Biol 6. Arch Gen Psych 152 7. J Clin Inve$t 410 8. Nature 1375 8. 3 Neuroeci lo6 10. sdenoe 1077 11. J Mel Biol 301 12 J lmmunol 989 13. aralwon 416 14, CircuWon Ree 207 45. Ann Int Mod 290 16. 8lood 360 17. Cancet 641 18. JBC 2220 19. Gdroenterology 32s 20. Ma1 Cell BidI I22 21. Phy$ Rev L 992 22. syst Zaal 34 23. Am J Pathd 367 24. Eur J lmmunol 171 25. Cancer Ra8 861 2& Ann Neural 222 27. Lab Inwt 139 28. J Wrdogy 29. J Nati Cant I 306 30. Arthrftls Rheum 204 31. Am J Hum Genet 78 32. Anger Chem 413 33. JAMA 661 34. CA Cancer 3 36
125.6 128.6 0.W 115.8 117.1 1.06 89.3 89.6 a29 86.9 06.0 0.13 80.7 80.7 0.00 ‘t8.8 79.8 1.31 77.1 77.5 0.48 70.5; 72.5 2.76 70.1 70.1 0.00 61.1 63.9 4.36 60.7 61.3 0.99 56.0 66.1 OS!0 6493 66.4 1 .Q2 64.1 64.1 0.00 63.7 64.9 2.10 S2.7 62.1 0.00 St.6 69.3 26.60 46.7 49.0 0.59 4x4 48.0 1.23 46.8 4x2 0.81 43.0 4382 0.40 42.0 44.1 2.66 42.2 42.8 1.19 43.9 42.9 2.33 36.7 36.9 0.59 36.6 37.6 2.69 35.6 36.9 0.71 32.2 32.s 0.83 30.6 30.8 0.65 27.3 28.0 2.44 24.3 24.6 1.27 21.0 21.6 2.66 20.7 22.8 9.20 10.3 13.8 24.32
.
49,3Q7 43,784 3Q,-
133,136 29,629 11,970 32,226 96,881
7,432 65,831 18,629 64,380 22,601 14,439
16,528 18,963
106,10? 16,408 6,713
42,463 1,466 7,063 7,156
31246 8,131 4,=
l&SW @3?5
b,S77 1,896 &a
11,382 372
Table 9. Cumulative impact and uncitedness. 1981 articles cited 1981-93

Proceedings of the 8th IFSE Conference. Barcelona 1995 13
cause we need to study the meaning of uncitedness. Many articles may be cited only one or two times because their content is superseded by subse- quent papers reporting on studies conducted over a long period of time. That also should be the subject of a separate investigation. This is a good way to segue into Table 10 covering review journals. As you can see, An- nual Review of Biochemistry achieves an impact of over 320 for the 188 articles it published from 1981-86.
\ 1
COUNTRY 6yr avg SumOfCITATIONS SumOfSOURCES / ANN R BIOCH 320.31 60219 188 ANN R CELL 231.35 7866 34 . _._.- ADV PROTEIN 205.29 4311 21 __ .._. ANN R IMMUN 194.59 16929 87
PHYSIOL REV 176.53 22066 125 REV M PHYS 167.85 21821 130 ADV 1MMUNOL 159.19 6686 42
MICROBIOL R 145.28 18015 124
ANN R NEUR 141.60 13877 98
-- - PHARM REV 138.26 10646 77 ._. .- ANN R PLANT 138.22 17139! 1241 _ _ . ANN R GENET 131.99 13199 100 ENDOCR REV 128.49 17731 138
ADV PHYSICS 108.93 6318 58 ANN R PHARM 107.59 15493 144
ADV CARB C 96.80 3388 35
ANN R ASTRO 94.43 8782 93
ADV ORGMET ---90.62 3534 39
--- CHEM REV 90.54 13853 153 BRAIN RES R 89.74 9602 107
ANN R PH CH 85.64 10277 120 IMMUNOL REV. 80.12 22753 284
Q REV BIOPH 77.37 3946 51 REV PHYS B 76.94! 38471 501
-. ANN R PHYSL 75.35 PROG NUCL 74.16 2373 32
PSYCHOL REV 73.71 13646 158 CRC C R B1 72.47 7754 107
ANN R ECOL 70.42 8239 117 REC PROG H 70.05 4273 61
ANN R MICRO 68.73 9829 143 ACC CHEM RE 68.44 23887 349
.- . ANN R 8lOPH 65.31 7184 110
ADV ENZYM 56.98 2963 52
EPIDEMIOL R 53.32 3039 57 PHYS REPORT 52.06 24259 466
IPROG NEUROB 1 50.341 5789 115 ._
I
207221 2751
Table 10. Cumulative impact 1981-94. review journal articles published 1981-6
