the impact of diabetes on employment in mexico · accepted manuscript title: the impact of diabetes...
TRANSCRIPT

Accepted Manuscript
Title: The Impact of Diabetes on Employment in Mexico
Author: Till Seuring Yevgeniy Goryakin Marc Suhrcke
PII: S1570-677X(15)00034-9DOI: http://dx.doi.org/doi:10.1016/j.ehb.2015.04.002Reference: EHB 511
To appear in: Economics and Human Biology
Received date: 1-8-2014Revised date: 4-3-2015Accepted date: 14-4-2015
Please cite this article as: Till Seuring, Yevgeniy Goryakin, Marc Suhrcke, The Impactof Diabetes on Employment in Mexico, Economics and Human Biology (2015),http://dx.doi.org/10.1016/j.ehb.2015.04.002
This is a PDF file of an unedited manuscript that has been accepted for publication.As a service to our customers we are providing this early version of the manuscript.The manuscript will undergo copyediting, typesetting, and review of the resulting proofbefore it is published in its final form. Please note that during the production processerrors may be discovered which could affect the content, and all legal disclaimers thatapply to the journal pertain.

Page 1 of 40
Accep
ted
Man
uscr
ipt
Highlights
We investigate the impact of diabetes on employment chances in Mexico.
We find an employment penalty of diabetes for men and women.
The adverse effect is strongest for men, particularly if they are poor or older.
We find no evidence for omitted variable bias or reverse causality.
Highlights (for review)

Page 2 of 40
Accep
ted
Man
uscr
ipt
The Impact of Diabetes on Employment inMexico
Till Seuringa,*, Yevgeniy Goryakina,b, Marc Suhrckea,b,c
* Corresponding author at: Health Economics Group, Norwich Medical School, Universityof East Anglia, Norwich, UKaHealth Economics Group, Norwich Medical School, University of East Anglia, Norwich,UKbUKCRC Centre for Diet and Activity Research (CEDAR), Institute of Public Health,Cambridge, UKcCentre for Health Economics, University of York, York, UK
Contact details: Till Seuring, Health Economics Group, Norwich Medical School, Univer-sity of East Anglia, Norwich Research Park, NR4 7TJ Norwich, UKEmail: [email protected];Telephone: +49 6648 3988672Fax: +44 1603 593752

Page 3 of 40
Accep
ted
Man
uscr
ipt
Abstract
This study explores the impact of diabetes on employment in Mexico using data fromthe Mexican Family Life Survey (MxFLS) (2005), taking into account the possibleendogeneity of diabetes via an instrumental variable estimation strategy. We findthat diabetes significantly decreases employment probabilities for men by about10 percentage points (p<0.01) and somewhat less so for women — 4.5 percentagepoints (p<0.1) — without any indication of diabetes being endogenous. Furtheranalysis shows that diabetes mainly affects the employment probabilities of menand women above the age of 44 and also has stronger effects on the poor thanon the rich, particularly for men. We also find some indication for more adverseeffects of diabetes on those in the large informal labour market compared to thosein formal employment. Our results highlight — for the first time — the detrimentalemployment impact of diabetes in a developing country.
Keywords: diabetes, employment, instrumental variable, Mexico
JEL: I10; J01

Page 4 of 40
Accep
ted
Man
uscr
ipt
1 Introduction
Diabetes, similar to other conditions that have been coined ”diseases of affluence”, hastraditionally been seen as mostly a problem of the developed, more affluent countries. Onlyin recent years the awareness has been growing of the sheer size of the problem in healthterms (Yach et al., 2006; Hu, 2011). Mexico is one example of a middle-income countrythat has seen diabetes rates increase sharply over the last years, from about 7.5 percent in2000 (Barquera et al., 2013) to 12.6 percent in 2013 (International Diabetes Federation,2013). The high prevalence of diabetes in Mexico reflects an epidemiological transitionfrom a disease pattern previously characterized by high mortality and infectious diseasesto low-mortality rates and non-communicable diseases (NCDs) affecting predominantlyadults (Stevens et al., 2008). This transition has likely been reinforced by nutritionalchanges away from a traditional diet towards an energy dense, but nutritionally poor dietwith an increasing amount of processed foods and sugars (Barquera et al., 2008; Basuet al., 2013; Rivera et al., 2004), a reduction in physical activity, as well as what appearsto be a particular genetic predisposition of many Mexicans to develop type 2 diabetes(Williams et al., 2014). While many of the high-income countries may be in a positionto cope resource-wise with the health care consequences of diabetes, this will be less sothe case for Mexico and other low- and middle-income countries (LMICs). The mostrecent ”cost-of-illness” estimates put the costs of diabetes to the Mexican society at morethan US$778 million in 2010, with a large part of these costs being paid out-of-pocket(Arredondo and De Icaza, 2011). While the above includes some estimate of indirectcosts, meant to capture the cost burden attributable to foregone productivity resultingfrom diabetes, there exists no rigorous, econometric assessment of the effect of diabeteson employment chances for Mexico, as the research has thus far focused on high-incomecountries (Lin, 2011; Latif, 2009; Brown et al., 2005; Minor, 2011; Bastida and Pagán,2002; Vijan et al., 2004; Zhang et al., 2009).
There are several reasons to expect a significant adverse effect of diabetes on employmentchances in Mexico and that this effect might be stronger than in high-income countries. InMexico type 2 diabetes is increasingly affecting people in their productive age, raising thepossibility that a larger share of people with diabetes will have to cope with debilitatingcomplications already relatively early in life (Barquera et al., 2013; Villalpando et al.,2010). Further, only a minority of Mexicans appears to successfully manage their diabetescondition, with as much as 70 percent of the people with diabetes having poor controlover their disease (Villalpando et al., 2010). In addition, many Mexicans are working
1
Page 5 of 40
Accep
ted
Man
uscr
ipt
in the large informal economy1, possibly limiting their access to quality health care andhence to appropriate treatment options. All these factors are likely to both increase therisk of developing debilitating diabetes complications as well as to reduce productivity as aresult. Against this background, the aim of this study is to investigate how diabetes affectsemployment probabilities in a middle-income country such as Mexico. To the best of ourknowledge this is the first such paper on Mexico and indeed on any low- or middle-incomecountry (LMIC). We also investigate if the impact of diabetes on employment chancesdiffers across age groups and — again for the first time in this field — by wealth, as wellas between those formally and informally employed.
The majority of the more recent studies on the labour market impact of diabetes triedto account for the possible endogeneity of diabetes using family history of diabetes as aninstrument. Endogeneity might arise due to reverse causality: employment status and itseffect on a person’s lifestyle may also influence the odds of developing diabetes. A job withlong office working hours might push a person’s diet or exercise pattern towards a moreunhealthy and sedentary lifestyle due to reduced leisure time, increasing the person’s riskfor diabetes. In addition, unobserved factors, such as personal traits, could simultaneouslyinfluence a person’s employment as well as his or her diabetes status and introduce anomitted variable bias. A less ambitious person could be less productive in a job, increas-ing the risk of being laid off, and he or she could simultaneously have only modest, ifany, exercise goals or healthy eating habits, thereby increasing the chances of developingdiabetes.
Brown et al. (2005) estimated the impact of the disease on employment in 1996–1997 inan older population of Mexican Americans in the United States (US) close to the Mexicanborder, using a recursive bivariate probit model. They found diabetes to be endogenousfor women but not for men. The results of the instrumental variable (IV) estimationsuggested no significant effect on women which, compared to the adverse effect found inthe probit model, indicated an overestimation of the effect for women when endogeneitywas not accounted for. For men, the probit estimates showed a significant adverse effect ofabout 7 percentage points. Latif (2009) estimated the effect of the disease on employmentprobabilities in Canada in 1998. Contrary to Brown et al. (2005), he found diabetes to beexogenous for females and endogenous for males; taking this into account he obtained asignificant negative impact on the employment probabilities for women, but not for men.Because the simple probit model showed a significant negative effect for males, Latif (2009)concluded that not accounting for endogeneity resulted in an overestimation of the effect
1In 2005 around 58 percent of the working population in Mexico were employed in the informal sector(Aguila et al., 2011).
2

Page 6 of 40
Accep
ted
Man
uscr
ipt
on male employment chances. Minor (2011) investigated the effect of diabetes on femaleemployment, among other outcomes, in the US in 2006. This particular study differedfrom earlier work in that it not only analysed the effects of diabetes in general, but alsoof type 1 and type 2 diabetes separately. The study found diabetes to be endogenousand underestimated if exogeneity was assumed. In the IV estimates, type 2 diabeteshad a significant negative effect on female employment chances. For Taiwan, Lin (2011)found diabetes to be endogenous, with the IV results showing significant changes in theemployment effect of diabetes. The impact was found to be significantly negative for menin the IV model indicating an underestimation in the standard probit model, where thediabetes coefficient was also significant but much smaller in size. For women, no significanteffect was found in the IV estimation after the probit model had indicated a significantand negative impact of diabetes.
Accordingly, at least in some cases, there seems to be the risk of biased estimates ofthe impact of diabetes on employment, when exogeneity is assumed, with an a prioriambiguous bias. Hence, our decision in this study to also assess if diabetes is endogenousand how precisely taking account of endogeneity might affect the estimates. In order toaccount for this possible endogeneity we use data from the second wave of the MexicanFamily Life Survey (MxFLS) from 2005, which not only provides information on people’sdiabetes status and socioeconomic background, but also on parental diabetes, enablingus to construct an instrumental variable similar to what has been used in the previousliterature on high-income countries.2 The data also allows the extension of the analysis totest if the inclusion of information on parental education as an additional control variableaffects the IV parameter estimates.
The remainder of the paper is structured as follows. Section 2 provides details about theused dataset and the econometric specification; and section 3 presents and discusses theempirical results. Section 4 concludes.
2Studies that have used the family history of diabetes as an instrument for diabetes are Brown et al.(2005) for a Mexican-American community, Latif (2009) for Canada, Minor (2011) for females in the USand Lin (2011) for Taiwan.
3

Page 7 of 40
Accep
ted
Man
uscr
ipt
2 Methodology
2.1 Dataset and descriptive statistics
The dataset used for the empirical analysis is the Mexican Family Life Survey (MxFLS).It is a nationally representative household survey which was conducted in 2002 and 2005.We use data from the second wave in 2005, which includes almost 40,000 individuals.Interviews were conducted with all household members aged 15+, and information ona wide range of social, demographic, economic and health related topics was collected(Rubalcava and Teruel, 2008). While there are more recent datasets available on Mexico,none of these provide as extensive information on parental characteristics as does theMxFLS which includes information on parental diabetes and education status, even ifparents were not alive anymore or were living in a non-surveyed household at the time ofthe survey. Diabetes is self-reported and 3.7 percent of males and 5.1 percent of femalesreport a diagnosis by a doctor.3 Unfortunately we cannot — with the data at hand —distinguish between the different types of diabetes. It can be assumed, however, thatabout 90 percent of the reported diagnoses are due to type 2 diabetes, which is by far themost common type of diabetes (Sicree et al., 2011). The sub-sample used for analysis islimited to the age group of 15 to 64 years, which represents the majority of the workingpopulation. To allow for heterogeneity in the coefficients across gender, the sample hasbeen split to estimate the male and female groups separately.
The descriptive statistics presented in Table I suggest that the groups of respondents withand without diabetes differ significantly in various aspects. Both males and females withdiabetes have a lower employment rate than their counterparts. This would suggest thatdiabetes has a negative impact on the employment chances of both males and females with
3 This is well below the estimated prevalence rate for 2013 of almost 12 percent. This is likely due tothe fact that, according to the International Diabetes Federation (IDF), more than half of the people withdiabetes in Mexico are undiagnosed and consequently did not report it (International Diabetes Federation,2013). Further, the sample in the survey at hand is restricted to people between the age of 15 to 64, whichdoes not match exactly with the population the IDF used for the diabetes prevalence estimates (20 – 79).Hence, our used sample includes a greater share of young people with a very low diabetes prevalence andexcludes people above 64 years of age, which likely have a higher than average prevalence rate. Takentogether, this — as well as a further increase in prevalence since 2005 — should explain the differencebetween the diabetes prevalence in our sample and the one estimated by the IDF.
4

Page 8 of 40
Accep
ted
Man
uscr
ipt
Table I: Summary statistics for males and females with and without diabetes
Males FemalesMean with diabetes Mean without diabetes p (t-test) Mean with diabetes Mean without diabetes p (t-test)
Employed 0.714 0.804 0.000 0.229 0.313 0.000Age 50.945 35.016 0.000 48.955 34.717 0.000Age 15–24 0.008 0.294 0.000 0.036 0.282 0.000Age 25–34 0.043 0.232 0.000 0.076 0.250 0.000Age 35–44 0.161 0.196 0.162 0.180 0.221 0.042Age 45–54 0.392 0.166 0.000 0.366 0.159 0.000Age 55–64 0.396 0.111 0.000 0.342 0.089 0.000Rural 0.337 0.399 0.047 0.391 0.399 0.723Small city 0.082 0.126 0.038 0.144 0.123 0.204City 0.145 0.102 0.028 0.103 0.098 0.737Big city 0.435 0.372 0.042 0.362 0.379 0.475Southsoutheast 0.208 0.203 0.864 0.184 0.206 0.270Central 0.243 0.184 0.017 0.231 0.195 0.062Westcentral 0.173 0.213 0.124 0.191 0.210 0.343Northeastcentral 0.196 0.177 0.446 0.209 0.186 0.236Northwestcentral 0.180 0.223 0.112 0.184 0.202 0.355No education 0.090 0.062 0.070 0.151 0.081 0.000Primary 0.518 0.352 0.000 0.607 0.368 0.000Secondary 0.231 0.308 0.009 0.171 0.314 0.000Highschool 0.059 0.158 0.000 0.043 0.138 0.000College or university 0.102 0.120 0.379 0.029 0.098 0.000Indigenous 0.137 0.121 0.448 0.133 0.118 0.341Married 0.812 0.535 0.000 0.663 0.539 0.000Children (under 15) 1.118 1.510 0.000 1.207 1.600 0.000Wealth 0.179 -0.010 0.003 0.004 -0.003 0.885Diabetes 1.000 0.000 . 1.000 0.000 .Diabetes father 0.180 0.071 0.000 0.146 0.079 0.000Diabetes mother 0.251 0.107 0.000 0.236 0.113 0.000Education parents 0.596 0.697 0.001 0.528 0.699 0.000Formal employment 0.286 0.306 0.508 0.083 0.140 0.001Informal employment 0.529 0.560 0.342 0.191 0.220 0.155N 255 6031 7798 445
diabetes. However, since the groups with diabetes are also significantly older and differ interms of education, this may be a spurious relationship. As a result, only a multivariateanalysis will provide more reliable information on how diabetes truly affects employmentprobabilities.
2.2 Econometric specification
We first estimate a probit model with the following specification
Employedi = β0 + β1Diabetesi + β2Xi + ui (1)
where diabetes is assumed to be exogenous. Employedi takes the value of 1 if person i isemployed and 0 if unemployed. Employment status is defined as having worked or carriedout an activity that helped with the household expenses for at least ten hours over thelast week. This explicitly includes those employed informally, for instance people working
5

Page 9 of 40
Accep
ted
Man
uscr
ipt
in a family business. Diabetesi denotes the main independent variable of interest, takingthe value of 1 if individual i has reported a diagnosis of diabetes and 0 otherwise. Xi
contains various control variables. Because no information on job history is available inthe data to adequately account for work experience, we need to rely on the combinationof age and education to proxy for work experience (Aaronson, 2010). The effect of age iscaptured through dummy variables for age intervals. Education is taken into account bydummy variables indicating if the highest level of schooling attained was either primaryschool, secondary school, high school, university or some other form of higher educationwith no education serving as the reference category, to control for the impact of educa-tion on employment and to account for the relationship between diabetes and education(Agardh et al., 2011). Since Mexico is a large and diverse country with regional socioeco-nomic differences we also include dummies for five different Mexican regions4. Apart fromthe more obvious effects economic differences between regions can have on employmentchances and diabetes through their impact on employment opportunities and lifestyles, thedummies should also account for less obvious effects that macroeconomic problems, suchas a high unemployment rate, could have on employment chances and diabetes by affectingpsychological well-being and sleeping patterns (Antillón et al., 2014). Because differencesin economic opportunities and lifestyles should also be expected between rural and urbanareas, three dummy variables are included to capture the effects these factors might haveon employment chances and diabetes, with living in a rural area being the reference cat-egory5 (Villalpando et al., 2010). Further, to control for labour market discrimination andpossible differences in genetic susceptibility to diabetes of indigenous populations (Yu andZinman, 2007), a dummy for being a member of an indigenous group is included. Wealso account for for the marital status to control for the impact of marriage on employ-ment chances and lifestyle habits. Further a variable capturing the number of childrenresiding in the household below the age of 15 is inlcuded, to control for their impact onemployment chances and for the effect of childbearing and related gestational diabetes onthe probabilities of women to develop type 2 diabetes (Bellamy et al., 2009). To accountfor the effect that household wealth might have on diabetes and employment chances, weuse the well established method of principal component analysis of multiple indicatorsof household assets and housing conditions to create an indicator for household wealth(Filmer and Pritchett, 2001). Our composite wealth index consists of owning a vehicle,
4The region variables have been constructed after recommendations on the MxFLS-Homepage. South-southeastern Mexico: Oaxaca, Veracruz, Yucatan; Central Mexico: Federal District of Mexico, State ofMexico, Morelos, Puebla; Central northeast Mexico: Coahuila, Durango, Nuevo Leon; Central westernMexico: Guanajuato, Jalisco, Michoacan; Northwest Mexico: Baja California Sur, Sinaloa, Sonora.
5Rural: < 2,500 inhabitants; Small city: 2,500 to 15,000 inhabitants; City: 15,000 to 100,000 inhabit-ants; Big city: > 100,000 inhabitants.
6

Page 10 of 40
Accep
ted
Man
uscr
ipt
owning a house or other real estate, owning another house, owning a washing machine,dryer, stove, refrigerator or furniture, owning any electric appliances, owning any domesticappliances, owning a bicycle and owning farm animals. It further accounts for the physicalcondition of the house, proxied by the floor material of the house, and the type of wateraccess.
The error term is denoted as ui. We do not control for the general health status andother diabetes related chronic diseases as they are likely determined by diabetes itselfand, hence, could bias the estimates and compromise a causal interpretation of the effectof diabetes on employment (Angrist and Pischke, 2008).
As diabetes could be endogenous, the probit model might deliver biased estimates. There-fore we employ an IV strategy, using a bivariate probit model to estimate the followingtwo equations simultaneously:
Diabetesi = δ0 + δ1Xi + δ2diabetesmotheri + δ3diabetesfatheri + ηi (2)
Employedi = β0 + β1Diabetesi + β2Xi + ui (3)
In equation 2, Diabetesi is a dummy variable and is modelled as a function of the samesocioeconomic and demographic factorsXi as in equation 1 and of the instrumental dummyvariables diabetesmotheri and diabetesfatheri, indicating if the father or the mother hadbeen diagnosed with diabetes. The error term is denoted as ηi. Equation 3 is identical tothe probit specification (equation 1) and estimates the effect of diabetes on employment,now taking into account the possible endogeneity of diabetes. Diabetes is exogenous if theerror terms of both equations are independent of each other (Cov(uiηi) = 0). Endogeneityis tested using a likelihood ratio test based on the idea that if Cov(uiηi) = 0, the log-likelihood for the bivariate probit will be equal to the sum of the log-likelihoods fromthe two univariate probit models (Knapp and Seaks, 1998). If ui and ηi are correlated,the estimation of equation 1 using a probit model will not provide consistent estimatesof the impact of diabetes on employment. In this case the simultaneous estimation ofboth equations using the bivariate probit should be preferred. For the estimation of thebivariate probit model it is assumed that ui and ηi are distributed randomly and bivariatenormal. To test the assumption of normality, we use Murphey’s goodness-of-fit score testwith the null-hypothesis of bivariate normally distributed errors, as suggested by Chiburiset al. (2012).6
6Murphey’s score test ”. . . embeds the bivariate normal distribution within a larger family of distribu-tions by adding more parameters to the model and checks whether the additional parameters are all zerosusing the score for the additional parameters at the bivariate probit estimate.” (Chiburis et al., 2012, p.19).
7

Page 11 of 40
Accep
ted
Man
uscr
ipt
We choose the bivariate probit model over the linear IV model to account for endogeneity,as there is evidence that it performs better if the sample is relatively small (<5,000) and— more important in our case — when treatment probabilities are low. In such casesthe linear IV can produce uninformative estimates while the bivariate probit model hasbeen shown to provide much more reasonable results (Chiburis et al., 2012). Because only4 percent of males and 5.4 percent of females report a diagnosis of diabetes, treatmentprobabilities are indeed low in the given case, providing good justification for the use ofthe bivariate probit model.
In order to fulfil the conditions of a valid instrument, parental diabetes needs to impactthe diabetes risk of the offspring while at the same time being unrelated to the offspring’semployment chances. It has been shown that there is a strong hereditary componentof type 2 diabetes which predisposes the offspring of people with diabetes to developthe condition as well (Herder and Roden, 2011; The Interact Consortium, 2013). Thisis supported by the notion that genes seem to play a crucial role, besides the recentepidemiological transition and the migration from rural to urban areas, in explainingMexico’s high diabetes prevalence according to a recent study by Williams et al. (2014).The authors identified a specific gene particularly prevalent in Mexican and other LatinAmerican populations with native American ancestry, which is associated with a 20 percentincrease in the risk of developing type 2 diabetes. Furthermore, research has shown thatparental lifestyle factors, socioeconomic background as well as parental body mass index(BMI) can explain but a very small fraction of the increased risk of type 2 diabetes in theoffspring, which is why we assume that the increased risk is mainly due to genetic factorsunrelated to lifestyle (Herder and Roden, 2011; The Interact Consortium, 2013). This issupported by Hemminki et al. (2010), who find that adoptees whose biological parentshad type 2 diabetes, had an increased risk of developing type 2 diabetes even though theywere living in a different household, while if their adopted parents had the disease, theyhad no elevated risk.
Nonetheless, there might still be the chance that parental diabetes decreases the offspring’semployment chances. The additional financial burden of diabetes or an early death dueto diabetes could have prevented the parents from investing in their children’s educationthe way they would have liked to or it could have led to the child dropping out of schoolin order to support the family. However, controlling for education should account forthese effects if they exist. Therefore parental diabetes should be a valid instrument whichpredicts diabetes while not affecting employment probabilities through other unobservedpathways. To further improve instrument validity we also account for the possibility thatparental education is simultaneously correlated with the parental diabetes status as well
8

Page 12 of 40
Accep
ted
Man
uscr
ipt
as their children’s employment chances, by including a dummy variable indicating if anyof the parents had attained more than primary education.
A possible limitation of using parental diabetes as our instrument is that it might directlyaffect the offspring’s employment decision through other pathways than education. Con-ceivably, diabetes might deteriorate parental health in such a way that the offspring hasor had to give up its own employment in order to care for its parents or is forced to takeup work to financially provide for the parents. With the data at hand we are unable toaccount for this, but if this effect exists it should be picked up by the overidentificationtest.
We also estimate the linear probability model (LPM) and the linear IV model as they areconsistent even under non-normality (Angrist and Pischke, 2008). The linear IV modeltakes the following form of a first (Equation 4) and a second stage (Equation 5).
Diabetesi = π0 + π1Xi + π2diabetesmotheri + π3diabetesfatheri + ηi (4)
Employedi = β0 + β1Diabetesi + β2Xi + ui (5)
In the second stage, the potentially endogenous actual diabetes values are replaced withthe predicted values from the first stage. The covariates are the same as in the bivariateprobit case described in equations 2 and 3. In the linear IV model the Hausman test is usedto identify endogeneity. Validity of the instruments is tested using first stage diagnosticsof the linear IV model, as similar tests are not available for the bivariate probit model.The results of the LPM are available on request as they do not differ meaningfully fromthe presented probit estimates.
3 Results
This section presents the estimation results using 1) a probit model model that assumesdiabetes to be exogenous and 2) IV models with parental diabetes as an instrument fordiabetes, to determine if diabetes is endogenous or if instead the results from the probitmodel can be used.
3.1 Probit results
Table II indicates that the effect of diabetes is negative for both sexes. For males, itreduces the probability of being employed by 10 percentage points (p<0.01).
9

Page 13 of 40
Accep
ted
Man
uscr
ipt
For females, the effect is also negative but smaller, and shows a reduction in employmentprobabilities of about 4.5 percentage points (p<0.1).
Table II: Impact of diabetes on employment probabilities (probit)
(1) (2)Males Females
Age 25–34 0.124∗∗∗ (0.011) 0.121∗∗∗ (0.017)Age 35–44 0.133∗∗∗ (0.012) 0.232∗∗∗ (0.018)Age 45–54 0.085∗∗∗ (0.014) 0.170∗∗∗ (0.022)Age 55–64 −0.034 (0.020) 0.039 (0.026)Small city −0.013 (0.017) 0.043∗∗ (0.020)City −0.036∗ (0.019) 0.042∗∗ (0.021)Big city 0.029∗∗ (0.013) 0.101∗∗∗ (0.014)Central 0.027 (0.015) −0.032∗ (0.018)Westcentral 0.020 (0.015) −0.008 (0.018)Northeastcentral 0.003 (0.016) −0.053∗∗∗ (0.017)Northwestcentral −0.037∗∗ (0.016) −0.100∗∗∗ (0.016)Primary 0.056∗∗∗ (0.020) −0.006 (0.022)Secondary 0.051∗∗ (0.021) 0.058∗∗ (0.025)Highschool 0.040∗ (0.023) 0.126∗∗∗ (0.029)College or university 0.047∗∗ (0.023) 0.297∗∗∗ (0.033)Indigenous 0.005 (0.016) −0.005 (0.020)Married 0.092∗∗∗ (0.012) −0.231∗∗∗ (0.012)Children (under 15) 0.010∗∗ (0.004) −0.018∗∗∗ (0.004)Wealth 0.002 (0.006) 0.037∗∗∗ (0.007)Education parents −0.007 (0.013) 0.000 (0.013)Diabetes −0.100∗∗∗ (0.029) −0.045∗ (0.023)Log likelihood −2897.807 −4508.573N 6286 8243Marginal effects; Robust standard errors in parentheses.* p < 0.1, ** p < 0.05, *** p < 0.01
The other covariates largely show the expected relationships. Employability increaseswith age and is highest for the 35–44 years age group. Especially for women, living ina more urban environment increases employment chances compared to women living inrural areas. Also, women seem to benefit substantially from higher education in terms of
10

Page 14 of 40
Accep
ted
Man
uscr
ipt
employment chances. For men the effects of education are also positive, though, not asmarked as for women. Perhaps surprisingly, being part of an indigenous population doesnot affect employment probabilities, neither for males or females.
The probit results suggest a significant negative effect of diabetes on the employment prob-abilities of males and likely also females in Mexico. In light of the concern that diabetescould be endogenous the following section presents the results of the IV estimations.
3.2 IV results
Using the bivariate probit model, the diabetes coefficient for males increases in size andremains negative whereas for females it decreases but also remains negative. However,standard errors increase in both models and the results turn insignificant, suggestingconsiderable loss of efficiency (see Table III). The likelihood-ratio test does not reject thenull hypothesis of no correlation between the disturbance terms of equations 2 and 3 formales and females, suggesting exogeneity of diabetes. The test for normality of the errorterm does not reject the null hypothesis of normality for the male and the female model,increasing our confidence in the estimates. Nonetheless we also consider the results of thelinear IV model: the test statistics indicate sufficiently strong and valid instruments, asshown by the Kleibergen-Paap Wald F statistic for weak instruments of 20.48 for menand 27.71 for women, being above the critical value of 19.93 for ten percent IV size andwell above the rule of thumb of 10 for weak identification not to be considered a problem(Staiger and Stock, 1997; Baum and Schaffer, 2007). The Sargan test does not reject thenull hypothesis of instruments uncorrelated with the error term and instruments correctlyexcluded from the estimated equation. The coefficients of the linear IV model are verydifferent from the bivariate probit model, turning positive for males and females, butalso very imprecise as indicated by the large standard errors (see Table IV displaying themain results and Table A1 in the appendix presenting the complete first and second stageestimates). As mentioned before, Chiburis et al. (2012) show that the estimates of thelinear IV model are likely to be imprecise when low treatment probabilities exist and candiffer substantially from the bivariate probit model, which seems to be the case here.7
Since the linear IV models fail to reject exogeneity of diabetes as well, we are confident7It could also be the case that the difference in estimates is due to the fact that while the bivariate
probit model estimates the average treatment effect (ATE) of the variable of interest for the whole sample,the linear IV model estimates the local average treatment effect (LATE), which estimates the effect ofdiabetes on employment only for those that have diabetes and whose parents have or have had diabetesas well. Therefore, the estimates of both models can be different (Angrist and Pischke, 2008; Chiburiset al., 2012).
11

Page 15 of 40
Accep
ted
Man
uscr
ipt
Table III: Impact of diabetes on employment probabilities (bivariate probit)
(1) (2)Males Females
Age 25–34 0.125∗∗∗ (0.012) 0.109∗∗∗ (0.015)Age 35–44 0.134∗∗∗ (0.012) 0.207∗∗∗ (0.016)Age 45–54 0.089∗∗∗ (0.016) 0.149∗∗∗ (0.021)Age 55–64 −0.025 (0.025) 0.032 (0.029)Small city −0.014 (0.017) 0.039∗∗ (0.018)City −0.035∗∗ (0.018) 0.038∗∗ (0.019)Big city 0.030∗∗ (0.013) 0.093∗∗∗ (0.013)Central 0.027 (0.018) −0.030∗ (0.015)Westcentral 0.019 (0.018) −0.007 (0.016)Northeastcentral 0.002 (0.018) −0.049∗∗∗ (0.017)Northwestcentral −0.038∗∗ (0.017) −0.091∗∗∗ (0.015)Primary 0.057∗∗∗ (0.020) −0.006 (0.021)Secondary 0.052∗∗ (0.023) 0.052∗∗ (0.022)Highschool 0.040 (0.025) 0.113∗∗∗ (0.027)College or university 0.046∗ (0.025) 0.273∗∗∗ (0.032)Indigenous 0.006 (0.017) −0.005 (0.016)Married 0.093∗∗∗ (0.012) −0.215∗∗∗ (0.011)Children (under 15) 0.010∗∗ (0.004) −0.016∗∗∗ (0.004)Wealth 0.002 (0.006) 0.033∗∗∗ (0.007)Parental education −0.006 (0.013) 0.000 (0.012)Diabetes −0.185 (0.143) −0.021 (0.108)Instruments
Diabetes father 0.048∗∗∗ (0.011) 0.041∗∗∗ (0.010)Diabetes mother 0.037∗∗∗ (0.008) 0.054∗∗∗ (0.008)
Log likelihood −3737.766 −5939.588Score goodness-of-fit (H0=normality of errors) 12.32 8.85
p value 0.196 0.451Endogeneity (H0: Diabetes exogeneous) 0.443 0.039
p value 0.506 0.844N 6286 8243Marginal effects; Robust standard errors in parentheses.The presented coefficients and standard errors for the instruments result from the estimation of the model specified in Equation II,indicating the effect of parental diabetes on a person’s diabetes risk.* p < 0.1, ** p < 0.05, *** p < 0.01
that the standard probit model provides unbiased and efficient estimates of the effect ofdiabetes on employment chances in Mexico and should therefore be used for inference.
The next section investigates the effects of diabetes for two different age groups, 15–44 and45–64, to explore whether, and if so, how the effect of diabetes on employment chancesdiffers between older and younger people. There might be reason to believe that diabeteshas a more adverse effect in older age groups, when those suffering from diabetes are likelyto have accumulated more years lived with diabetes, and hence are more likely to develop
12

Page 16 of 40
Accep
ted
Man
uscr
ipt
Table IV: Impact of diabetes on employment probabilities (linear IV)
(1) (2)Males Females
Diabetes 0.098 (0.215) 0.239 (0.214)R2 0.067 0.120F stat (H0: weak instruments) 20.483 27.706Sargan test (H0: valid instruments) 0.862 0.295
p value 0.353 0.587Endogeneity (H0: Diabetes exogenous) 0.864 1.796
p value 0.353 0.180N 6286 8243Robust standard errors in parentheses.Instruments: diabetes of mother, diabetes of father.Other control variables: age, region, urban, education, indigenous, marital status, children, wealth,parental education.Critical values for weak identification test F statistic: 10 percent maximal IV size 19.93, 15 percentmaximal IV size 11.59, 20 percent maximal IV size 8.75, 25 percent maximal IV size 7.25.∗ p < 0.1, ∗∗ p < 0.05, ∗∗∗ p < 0.01
complications.
3.3 Differences by age groups
When divided into an older and younger age group using the cut-off point of 45 years,thenegative effect of diabetes is mainly found in the older age group, for males and femalesalike (see Table V), where 12.5 percent report having diabetes, compared to only 1.7percent in the younger age group. The probability of being employed is reduced by about10 percentage points for men between 45 and 64 years at the one percent significance level,while there is no significant effect on younger men. For women, the employment probabilityis reduced by about 6 percentage points, with the effect being significant at the five percentlevel. Similar to men, there is no effect of diabetes on younger women. To investigatein more detail for which age group the effect is strongest, we run separate regressions forboth age groups above 44 years. The results (Table B1 in the appendix) show that for menthe strongest effect appears in the oldest age group (i.e. 55–64 years), where employmentchances are reduced by almost 13 percentage points. For females, a significant effect isfound solely for those between 45 and 54 years, where employment chances are reduced by
13

Page 17 of 40
Accep
ted
Man
uscr
ipt
Table V: Impact of diabetes on employment probabilities by age group (probit)
15-44 45-64(1) (2) (3) (4)
Males Females Males FemalesDiabetes −0.009 −0.004 −0.110∗∗∗ −0.057∗∗
(0.062) (0.042) (0.034) (0.025)Log likelihood −1987.285 −3354.003 −925.409 −1167.491N 4415 5997 1871 2246Marginal effects; Robust standard errors in parentheses.For the younger age group, the model contains the age categories 25–34 and 35–44 with 15–24as the reference category. For the older age group, the model contains the age category 55–64with 45–54 as the reference category.Other control variables: region, urban, education, indigenous, marital status, children, wealth,parental education.* p < 0.1, ** p < 0.05, *** p < 0.01
7.6 percentage points. Hence, there appear to be relevant differences between males andfemales in the age at which the biggest adverse effect of diabetes on employment chancesoccurs.
The use of IV methods in the age stratified samples is compromised due to a reductionin instrument power, sample size and particularly treatment probabilities. Especiallyfor the younger age group, where treatment probabilities are close to zero, a meaningfulinterpretation of the IV results is difficult. Further, because no endogeneity was found inthe pooled samples for males and females presented in section 3.2, we would not expectendogeneity of diabetes in the age stratified samples. We nonetheless test for the possibilityof diabetes being endogenous using the bivariate probit model and an approach suggestedby Lewbel (2012), to improve instrument strength. The results and interpretation of thisanalysis are available in the appendix (Section D) and support our reliance on the standardprobit estimates for inference (see Table D1 and Table D2).
14
Page 18 of 40
Accep
ted
Man
uscr
ipt
3.4 Differences by wealth
To explore the heterogeneity of the effect of diabetes on employment across different levelsof wealth, we divide the sample into two wealth groups at the 50th percentile of ourconstructed wealth index.
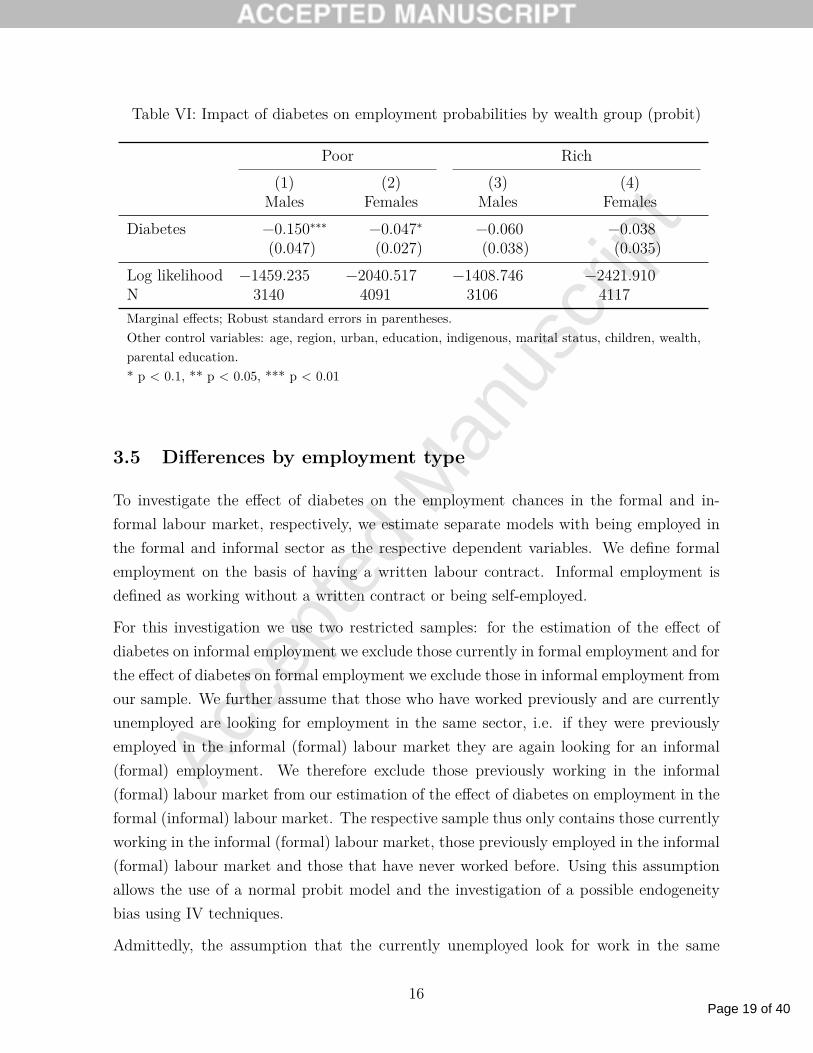
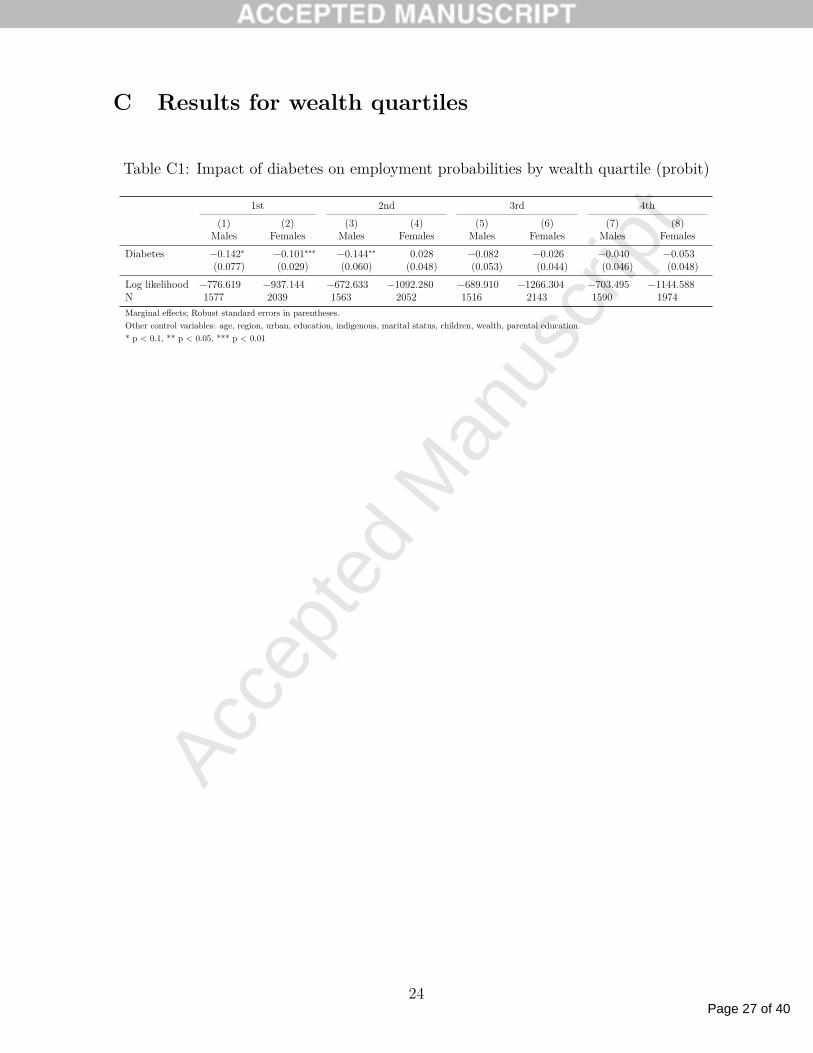
We run separate regressions for both groups stratified by gender, finding the strongestnegative effect for less wealthy males, where employment chances are reduced by 15 per-centage points, and a smaller and less significant effect for less wealthy females (see TableVI). Whereas the coefficients for wealthier males and females have a negative sign, theyare not significant at the ten percent significance level. This indicates that mainly the lesswealthy experience an adverse effect from diabetes. To further explore this, we stratifiedthe sample into wealth quartiles (see Table C1 in the appendix), finding that significantadverse effects for males appear in the first and second wealth quartile, where employmentchances are reduced by about 14 percentage points. For females a highly significant andstrong effect is only found in the poorest quartile, were employment chances are reducedby 10 percentage points. Together these results indicate that the impact of diabetes onemployment chances varies with wealth, with men and women being more affected whenbeing in the lower wealth quartiles.
To consider the possible endogeneity of diabetes in the upper and lower wealth half,we again present the results of the IV models. The stratification into wealth groupssignificantly reduces instrument power as well as sample size. For none of the wealthgroups the bivariate probit model indicates endogeneity (see Table E1 in section E ofthe appendix). This does not change even when using the Lewbel approach to increaseinstrument strength and we therefore rely on the probit results for inference.
15
Page 19 of 40
Accep
ted
Man
uscr
ipt
Table VI: Impact of diabetes on employment probabilities by wealth group (probit)
Poor Rich(1) (2) (3) (4)
Males Females Males FemalesDiabetes −0.150∗∗∗ −0.047∗ −0.060 −0.038
(0.047) (0.027) (0.038) (0.035)Log likelihood −1459.235 −2040.517 −1408.746 −2421.910N 3140 4091 3106 4117Marginal effects; Robust standard errors in parentheses.Other control variables: age, region, urban, education, indigenous, marital status, children, wealth,parental education.* p < 0.1, ** p < 0.05, *** p < 0.01
3.5 Differences by employment type
To investigate the effect of diabetes on the employment chances in the formal and in-formal labour market, respectively, we estimate separate models with being employed inthe formal and informal sector as the respective dependent variables. We define formalemployment on the basis of having a written labour contract. Informal employment isdefined as working without a written contract or being self-employed.
For this investigation we use two restricted samples: for the estimation of the effect ofdiabetes on informal employment we exclude those currently in formal employment and forthe effect of diabetes on formal employment we exclude those in informal employment fromour sample. We further assume that those who have worked previously and are currentlyunemployed are looking for employment in the same sector, i.e. if they were previouslyemployed in the informal (formal) labour market they are again looking for an informal(formal) employment. We therefore exclude those previously working in the informal(formal) labour market from our estimation of the effect of diabetes on employment in theformal (informal) labour market. The respective sample thus only contains those currentlyworking in the informal (formal) labour market, those previously employed in the informal(formal) labour market and those that have never worked before. Using this assumptionallows the use of a normal probit model and the investigation of a possible endogeneitybias using IV techniques.
Admittedly, the assumption that the currently unemployed look for work in the same
16

Page 20 of 40
Accep
ted
Man
uscr
ipt
labour market they had previously worked in is quite strong and is likely not true foreverybody. We therefore additionally estimate a multinomial logit model which is mostuseful if the decision to work is not binary but there are more than two choices, such asthe choice of being either unemployed, employed in the informal or employed in the formallabour market (Wooldridge, 2002). Being unemployed is used as the reference category.
All estimated models (see Tables VII and F1), regardless of the estimation approach,indicate that diabetes significantly reduces the chances of being in informal employment,while it has no effect on formal employment.8 This applies to both males and females.This indicates that people with diabetes are less likely to be working in the informal labourmarket relative to being unemployed, while there is no difference for those working in theformal labour market. We further find no indication of endogeneity (see Tables F2 and F3in the appendix). Overall, there seem to be strong differences in terms of the impact ofdiabetes on people in formal and informal employment, with diabetes having a strongernegative effect for those without a written contract.
Table VII: Impact of diabetes on employment probabilities by employment status (probit)
Males Females(1) (2) (3) (4)
Informal Formal Informal FormalDiabetes −0.063∗∗ −0.041 −0.051∗∗ 0.019
(0.031) (0.043) (0.022) (0.022)Log likelihood −1780.023 −1021.771 −3818.588 −1859.048N 4604 2204 6983 5652Marginal effects; Robust standard errors in parenthesesOther control variables: age, region, urban, education, indigenous, marital status,children, wealth, parental education.* p < 0.1, ** p < 0.05, *** p < 0.01
8Please note, however, that the coefficients of the multinomial logit and the probit model cannot bedirectly compared as they are based on different assumptions. The former takes into account that a personcan choose from more than two employment outcomes (i.e. being unemployed, being formally employedor being informally employed), while the latter only allows for a binary outcome without considering anyother options (e.g. being unemployed or informally employed without considering the possibility of formalemployment).
17

Page 21 of 40
Accep
ted
Man
uscr
ipt
4 Conclusion
The contribution of this paper has been to analyse — for the first time for a LMIC — theimpact of diabetes on employment in Mexico, taking into account the potential endogeneityin the relationship between diabetes and employment chances. The presented results addto the growing literature on the adverse economic effects of diabetes. They indicate thathaving diabetes substantially reduces the chances to work for men and likely also forwomen. Hence, diabetes may contribute to a reduction in the pool of the productiveworkforce available to the Mexican economy.
We have also shown that diabetes reduces employment chances particularly in older people,likely because in this age group people are more common to already have developeddiabetes-related complications which reduce their productivity and eventually force theminto unemployment. Further, particularly for men the effects of diabetes on employmentchances seem to be particularly strong when they belong to the poorer half of the pop-ulation. While there might be some self-selection into the poorer group by those wholost their job due to diabetes and as a result descended into the lower wealth group, thisfinding is indicative of potentially substantial adverse equity impacts. This is also in linewith our finding that diabetes reduces employment chances particularly for the informallyemployed, whereas those in formal employment seem to be less affected. Nonetheless, inorder to establish causality more research in this area will be needed.
While in parts of the earlier literature diabetes was found to be exogenous only for eithermales or females (Brown et al., 2005; Latif, 2009), our study found diabetes to be exo-genous using the samples stratified into males and females, allowing the use of the moreefficient probit model to arrive at a consistent estimate of the effect of diabetes on em-ployment chances. Further, we found no endogeneity of diabetes for the sample comprisedof the age group above the age of 44, for the samples stratified into an upper and lowerwealth half and for the samples stratified by employment type. For the younger age groupthe bivariate probit model only indicated exogeneity of diabetes for males, while for fe-males diabetes was shown to be endogenous and showing a significant positive effect ofdiabetes on employment. This result is rather counterintuitive because there is no obviousreason why diabetes should increase employment chances. Because all samples stratifiedinto age,wealth and employment groups suffered from reduced instrument strength whichcould cause biased IV estimates, we used a method proposed by Lewbel (2012) to createadditional instruments and increase instrument power. Using this method we no longerfound a significant positive effect of diabetes on female employment chances in the youngerage group and could not reject the assumption of exogeneity of diabetes in this sample.
18

Page 22 of 40
Accep
ted
Man
uscr
ipt
Also, for all other wealth, age and employment samples, the Lewbel IV method did notreject the assumption of exogeneity. We are therefore confident that we can rely on theprobit estimates for inference.
Why was diabetes found to be exclusively exogenous in the Mexican case? We can onlyspeculate on the potential reasons. Diabetes being exogenous seems to indicate that aperson’s employment status might not have such a strong effect on his or her diabetes riskthrough the potential pathways such as lifestyle changes. Rather, the rapid epidemiologicaltransition experienced in Mexico over the last decades (Barquera and Hotz C, Rivera JA,Tolentino ML, Espinosa J, Campos I, 2006; Barquera et al., 2008; Rivera et al., 2002)together with the heightened genetic susceptibility of Mexicans to diabetes (Williamset al., 2014), seem to have increased the risk of developing diabetes in both employed andunemployed Mexicans.
Taking our results for the older age group and comparing them to those of Brown et al.(2005) for the US, whose sample of Mexican Americans 45 years and older might be thebest suited for a meaningful comparison, our findings indicate a stronger negative impactof diabetes on males and particularly females residing in Mexico.9 This finding lends somesupport to our hypothesis that the adverse impact of diabetes on employment could belarger in LMICs than in high-income countries. Comparing the study to Lin (2011) forTaiwan, who also uses a sample of people between 45 and 64 years of age, our results aresimilar in that a larger effect is found for males than for females. We found a somewhatstronger effect for females while the effect for males was lower in our study. However,when compared to other studies in more developed countries, with more advanced healthsystems and very different populations, such as Latif (2009) for Canada and Minor (2011)for women in the US, our results differ in that they do not indicate very strong effects forwomen.
It is difficult to say precisely what might cause these differences. Potentially, they arerelated to the differences in the physical demands placed on males and females in their re-spective jobs. Men in Mexico might need to rely more on their physical fitness to performwell in their jobs than women, causing men to drop out of the labour market earlier dueto diabetes complications. Due to the large informal and physically demanding labourmarket in Mexico compared to Canada or the US, men in Mexico possibly experience agreater reduction in their employment chances due to diabetes than men in higher-incomecountries. Further, the larger impact diabetes has on males in the poor to middle wealth
9This is based on comparing our estimates to the appropriate models in Brown et al. (2005) based ontheir test for endogeneity, which indicates the use of the bivariate probit results for women and the probitresults for men.
19

Page 23 of 40
Accep
ted
Man
uscr
ipt
quartiles and the informal sector could indicate that employers more rapidly replace work-ers with diabetes with healthy workers, especially if jobs are not particularly specialized orlack regulatory protection and other workers with a similar skill set can be easily found,which is likely the case in Mexico. Higher skilled male workers residing in the richerwealth quartile or in the formal sector might be able to prevent losing their job becauseof diabetes due to physically less demanding jobs, a more unique skill set which is harderto replace and possibly stronger regulatory job protection. The same seems to be true forwomen. In higher-income countries jobs are likely more similar between men and womenand generally less physical demanding so that physical attributes are not as importantand diabetes might not limit men to a greater extent than women. In these countries thestronger impact of diabetes on female employment chances might be explained by moresevere health consequences of diabetes for women compared to men (Huxley et al., 2006).Nonetheless, explaining these differences remains speculative and more research is neededto investigate this.
A limitation of this study is the use of cross-sectional data, which does not allow for theuse of fixed effects and hence for the control of unobserved time-invariant heterogeneity.Data spanning a longer time period of 10 to 15 years would be required to be able toobserve changes in the diabetes and employment status which would allow the use of fixedeffects. A further limitation is the somewhat old data from 2005, which precedes the mainimplementation period of the public health insurance scheme called Seguro Popular. Thisshould be taken into account when interpreting our results as the effects might be differenttoday, where most Mexicans have access to some sort of health insurance (Knaul et al.,2012). The presented results rather show the effects of diabetes on employment chancesin 2005 in an environment were insufficient healthcare coverage was common for partsof the Mexican population. Further, the data only provided self-reported information ondiabetes, which might have caused some attenuation bias in our estimated parameters,making them rather conservative (Lewbel, 2007). We nonetheless deliberately chose thisparticular data as it provided us with a sensible instrument in parental diabetes as wellas an array of other socioeconomic information which — as far as we have been ableto ascertain — is not provided by any other dataset in LMICs. Finally, due to datalimitations, we were not able to investigate the relationship between diabetes durationand employment chances and how long it takes for an employment penalty to develop.Recent research by Minor (2013) on the US has shown that the effect of diabetes onemployment chances changes with the duration of diabetes and is strongest in the firstfive years after diagnosis for males, whereas for females a strong effect appears only about11–15 years after diagnosis.
20
Page 24 of 40
Accep
ted
Man
uscr
ipt
Looking ahead, it would evidently be worthwhile to investigate the effects of diabeteson employment in Mexico using more recent data. In light of the recently completedimplementation of Seguro Popular — which increased its coverage from about 10 millionpeople in 2005 to over 50 million in 2012 and now provides almost all previously uninsuredMexicans with access to healthcare (Knaul et al., 2012) — the results of this paper mightbe used as a baseline to judge the success of Seguro Popular in reducing the adverse effectsof diabetes on employment. In addition, the reasons for the differences between males andfemales in the estimated effects remain a matter of speculation and more research is neededto explore the underlying pathways. This information would be valuable in the design ofmore effective measures to reduce the negative effects of diabetes for both males andfemales.
In conclusion, this paper shows that diabetes represents a large burden for people in Mexicoand likely in other LMICs, not only due to the associated disease and medical cost burdenbut also because of its effect on employment chances. This is particularly a problem forthe poor who are more adversely affected by diabetes than the more affluent. To alleviatesome of the negative effects of diabetes Seguro Popular may provide an opportunity tofurther improve the prevention and treatment of diabetes in the poor, especially if thehealth system adapts to the challenges presented by chronic diseases (Samb et al., 2010).Evidence of possible cost-effective interventions for secondary prevention in the context ofSeguro Popular already exists (Salomon et al., 2012). There remains, however, an evidencegap on cost-effective strategies for the primary prevention of diabetes.
21

Page 25 of 40
Accep
ted
Man
uscr
ipt
Appendix
A Linear IV estimates (1st and 2nd stage)
Table A1: Impact of diabetes on employment probabilities (linear IV, 1st and 2nd stage)
linear IV male linear IV female(1) (2) (3) (4)
Diabetes Employed Diabetes EmployedAge 25–34 −0.001 (0.005) 0.151∗∗∗ (0.015) 0.003 (0.005) 0.111∗∗∗ (0.015)Age 35–44 0.016∗ (0.009) 0.154∗∗∗ (0.019) 0.032∗∗∗ (0.008) 0.198∗∗∗ (0.017)Age 45–54 0.081∗∗∗ (0.014) 0.098∗∗∗ (0.028) 0.108∗∗∗ (0.014) 0.122∗∗∗ (0.028)Age 55–64 0.101∗∗∗ (0.016) −0.052 (0.039) 0.198∗∗∗ (0.021) 0.001 (0.040)Small city 0.001 (0.010) −0.010 (0.019) −0.005 (0.011) 0.034∗∗ (0.017)City 0.014 (0.014) −0.041∗∗ (0.020) −0.009 (0.013) 0.032∗ (0.019)Big city 0.008 (0.008) 0.027∗ (0.014) −0.004 (0.009) 0.093∗∗∗ (0.013)Central 0.011 (0.011) 0.024 (0.017) 0.015 (0.011) −0.035∗∗ (0.017)Westcentral −0.002 (0.010) 0.021 (0.017) −0.002 (0.010) −0.006 (0.018)Northeastcentral 0.007 (0.012) 0.005 (0.017) 0.009 (0.012) −0.051∗∗∗ (0.017)Northwestcentral −0.006 (0.009) −0.033∗∗ (0.017) 0.007 (0.011) −0.095∗∗∗ (0.017)Primary −0.009 (0.020) 0.060∗∗ (0.027) 0.017 (0.018) −0.011 (0.019)Secondary −0.003 (0.020) 0.056∗ (0.030) −0.005 (0.018) 0.052∗∗ (0.021)Highschool −0.027 (0.020) 0.045 (0.031) −0.008 (0.020) 0.117∗∗∗ (0.026)College or university −0.018 (0.023) 0.057∗ (0.032) −0.028 (0.020) 0.291∗∗∗ (0.025)Indigenous 0.009 (0.010) 0.005 (0.017) 0.012 (0.013) −0.006 (0.018)Married 0.015∗∗ (0.007) 0.086∗∗∗ (0.012) −0.002 (0.007) −0.216∗∗∗ (0.011)Children (under 15) −0.005∗∗ (0.002) 0.010∗∗ (0.004) 0.003 (0.002) −0.016∗∗∗ (0.004)Wealth 0.003 (0.004) −0.001 (0.007) 0.003 (0.004) 0.030∗∗∗ (0.006)Parental education 0.019∗∗ (0.009) −0.010 (0.013) 0.014 (0.009) −0.001 (0.011)Diabetes father 0.068∗∗∗ (0.020) 0.035∗∗ (0.014)Diabetes mother 0.043∗∗∗ (0.016) 0.055∗∗∗ (0.013)Diabetes 0.098 (0.215) 0.239 (0.214)Constant −0.015 (0.022) 0.607∗∗∗ (0.036) −0.020 (0.021) 0.289∗∗∗ (0.027)R2 0.075 0.067 0.090 0.120F stat (H0: weak instruements) 20.483 27.706Sargan test (H0: valid instruments) 0.862 0.295
p value 0.353 0.587Endogeneity (H0: Diabetes exogenous) 0.864 1.796
p value 0.353 0.180N 6228 6286 8186 8243Robust standard errors in parentheses.Instruments: diabetes of mother, diabetes of father.Other control variables: age, region, urban, education, indigenous marital status, children, wealth, parental education.∗ p < 0.1, ∗∗ p < 0.05, ∗∗∗ p < 0.01
22

Page 26 of 40
Accep
ted
Man
uscr
ipt
B Results for older age groups
Table B1: Impact of diabetes on employment probabilities by age groups older than 44(probit)
45-54 55-64(1) (2) (3) (4)
Males Females Males FemalesDiabetes −0.083∗ −0.076∗∗ −0.128∗∗ −0.033
(0.048) (0.034) (0.056) (0.039)Log likelihood −451.544 −764.722 −458.632 −392.174N 1101 1399 770 847Marginal effects; Robust standard errors in parentheses.Other control variables: age, region, urban, education, indigenous, marital status, children,wealth, parental education.* p < 0.1, ** p < 0.05, *** p < 0.01
23
Page 27 of 40
Accep
ted
Man
uscr
ipt
C Results for wealth quartiles
Table C1: Impact of diabetes on employment probabilities by wealth quartile (probit)
1st 2nd 3rd 4th(1) (2) (3) (4) (5) (6) (7) (8)
Males Females Males Females Males Females Males FemalesDiabetes −0.142∗ −0.101∗∗∗ −0.144∗∗ 0.028 −0.082 −0.026 −0.040 −0.053
(0.077) (0.029) (0.060) (0.048) (0.053) (0.044) (0.046) (0.048)Log likelihood −776.619 −937.144 −672.633 −1092.280 −689.910 −1266.304 −703.495 −1144.588N 1577 2039 1563 2052 1516 2143 1590 1974Marginal effects; Robust standard errors in parentheses.Other control variables: age, region, urban, education, indigenous, marital status, children, wealth, parental education.* p < 0.1, ** p < 0.05, *** p < 0.01
24

Page 28 of 40
Accep
ted
Man
uscr
ipt
D Instrumental variable analysis for age groups
The results of the bivariate probit models do not indicate endogeneity for the older agegroup and for males in the younger age group (see Tables D1 and D2), suggesting thatparticularly for males the results of the more efficient probit model (Table V) show thetrue effect of diabetes on employment chances. Only for females in the younger age groupthe test for endogeneity rejects the assumption of exogeneity and the diabetes coefficient— surprisingly — shows a strong positive effect of diabetes on female employment chances.Instrument strength, however, is reduced significantly, which together with the very lowtreatment probabilities questions the validity of the IV results for the sample of the youngerage group, as weak instruments possibly introduce a bias similar to or stronger than thepotential bias in the probit estimates (Staiger and Stock, 1997). We therefore additionallyapply a method proposed by Lewbel (2012), which uses heteroscedasticity in the estimatedmodels to construct additional instruments. Instruments are generated by multiplying theheteroscedastic residuals from the first-stage regressions with a subset of the includedexogenous variables. Lewbel (2012) recommends the use of this method when traditionalinstruments are not available or if it is suspected that the traditional instrument is tooweak for identification, which is the issue at hand. The approach has been widely used overthe last years both in health economics (Drichoutis et al., 2011; Kelly et al., 2012; Schroeteret al., 2012; Brown, 2014) and in other economic disciplines (Huang et al., 2009; Emranand Shilpi, 2012; Denny and Oppedisano, 2013). Using this method to construct additionalinstruments by using our age group dummies, we are able to increase instrument strengthsignificantly in the younger age group and the overidentification test indicates validity ofthe instruments. The results of the linear IV model with the additional instruments showexogeneity of diabetes for males and females and do not indicate a significant positiveeffect of diabetes on employment chances.
Apart from the results of the Lewbel approach, we also think that there are theoreticalreasons why diabetes is likely exogenous in the younger age group. While we cannotdistinguish between the types of diabetes with the data at hand, it is likely that a relativelylarge proportion of the people reporting diabetes in this age group have type 1 diabetes,which people tend to get at a younger age (Maahs et al., 2010). The disease has a stronggenetic component and it is very unlikely that there are unobserved factors that affectthe chances to develop type 1 diabetes and being employed at the same time, nor thatemployment status would affect the development of type 1 diabetes. Therefore, for a largepart of the people reporting diabetes in the younger age group, endogeneity should notpresent a problem because they have type 1 diabetes. Furthermore, it is also less likely
25

Page 29 of 40
Accep
ted
Man
uscr
ipt
that reverse causality is a problem for those having type 2 diabetes in this age group,because any effects of being employed on developing type 2 diabetes take time to develop.It would be reasonable to expect that if being employed affected a person’s weight orany other diabetes risk factor, this would happen by changing the person’s lifestyle due tochanges in income or available leisure time, or by reducing or increasing a person’s activitylevels at work. Until these changes are expressed in changes in weight or any other riskfactor for diabetes and finally cause a development of type 2 diabetes, a considerable timeperiod of various years has likely passed and people have reached an advanced age. Wetherefore believe, that the risk of diabetes being affected by employment is much lower inthe younger age group based on the nature of the disease, compared to the older age group.Hence we think that the assumption of exogeneity of diabetes in the younger age groupis valid — which is also supported by the Lewbel estimates — and that the endogeneityindicated for younger females in the bivariate probit model is likely the result of the lowprevalence rates, and consequently the very low treatment probabilities, together withweak instruments, making a meaningful IV analysis difficult (Chiburis et al., 2012). Weare therefore confident that we can rely on our probit estimates for inference.
Table D1: IV estimates for the age group 15–44
BP Lewbel IV(1) (2) (3) (4)
Males Females Males FemalesDiabetes 0.171∗∗∗ 0.496∗∗∗ 0.007 0.051
(0.046) (0.080) (0.053) (0.071)R2 0.093 0.143Score goodness-of-fit (H0=normality of errors) 9.56 14.25
p value 0.387 0.114F stat (H0: weak instruments) 4.288a 10.835a 366.480 65.872Sargan test (H0: valid instruments) 0.008a 0.044a 1.817 3.487
p value 0.930a 0.834a 0.611 0.322Endogeneity (H0: Diabetes exogenous) 1.422 12.948 1.065 1.429
p value 0.233 0.000 0.302 0.232N 4415 5997 4415 5997Marginal effects for bivariate probit (BP); robust standard errors in parentheses.Instruments: diabetes of mother, diabetes of father; for Lewbel additionally created age groups instruments.The models contain the age categories 25–34 and 35–44 with 15–24 as the reference category.Other control variables: region, urban, education, indigenous, marital status, children, wealth, parental education.a The test statistics are taken from the linear IV model not presented here.∗ p < 0.1, ∗∗ p < 0.05, ∗∗∗ p < 0.01
26

Page 30 of 40
Accep
ted
Man
uscr
ipt
Table D2: IV estimates for the age group 45–64
BP Lewbel IV(1) (2) (3) (4)
Males Females Males FemalesDiabetes −0.022 −0.112 −0.178 −0.042
(0.138) (0.111) (0.160) (0.104)R2 0.058 0.118Score goodness-of-fit (H0=normality of errors) 7.00 11.10
p value 0.637 0.269F stat. (H0: weak instruments) 15.408a 18.305a 12.534 18.897Sargan test (H0: valid instruments) 2.717a 0.482a 4.397 1.688
p value 0.067a 0.487a 0.111 0.430Endogeneity (H0: Diabetes exogenous) 0.688 0.574 0.082 0.024
p value 0.407 0.449 0.774 0.876N 1871 2246 1871 2246Marginal effects for bivariate probit (BP); robust standard errors in parentheses.Instruments: diabetes of mother, diabetes of father; for Lewbel additionally created age groups instruments.The models contain the age category 55–64 with 45–54 as the reference category.Other control variables: age, region, urban, education, indigenous, marital status, children, wealth, parental education.a The test statistics are taken from the linear IV model not presented here.∗ p < 0.1, ∗∗ p < 0.05, ∗∗∗ p < 0.01
27

Page 31 of 40
Accep
ted
Man
uscr
ipt
E Instrumental variable analysis for wealth groups
To consider the possible endogeneity of diabetes in the upper and lower wealth half, weagain present the results of the bivariate probit and the Lewbel model. The stratificationinto wealth groups significantly reduces instrument power as well as sample size. Fornone of the wealth groups the bivariate probit model indicates endogeneity (see Table E1and Table E2). This does not change even when using the Lewbel approach to increaseinstrument strength. Accordingly, we do not find any indication of endogeneity of diabetesin the wealth groups and rely on our probit estimates for inference.
Table E1: IV results for lower wealth half
BP Lewbel IV(1) (2) (3) (4)
Males Females Males FemalesDiabetes −0.354 −0.064 −0.142∗∗∗ −0.054∗
(0.241) (0.139) (0.050) (0.032)R2 0.071 0.099Score goodness-of-fit (H0=normality of errors) NAa 7.41
p value NAa 0.594F stat (H0: weak instruments) 6.322b 15.420b 2589.091 1311.647Sargan test (H0: valid instruments) 0.342b 1.106b 4.169 2.804
p value 0.558b 0.293b 0.525 0.730Endogeneity (H0: Diabetes exogenous) 1.190 0.016 0.005 0.156
p value 0.275 0.901 0.941 0.693N 3169 4111 3169 4111Marginal effects for bivariate probit (BP); robust standard errors in parentheses.Instruments: diabetes of mother, diabetes of father; for Lewbel additionally created age groups instruments.Other control variables: age, region, urban, education, indigenous, marital status, children, wealth, parental education.a The command SCOREGOF failed to produce the test statisitic for this subsample.b The test statistics are taken from the linear IV model not presented here.∗ p < 0.1, ∗∗ p < 0.05, ∗∗∗ p < 0.01
28

Page 32 of 40
Accep
ted
Man
uscr
ipt
Table E2: IV results for upper wealth half
BP Lewbel IV(1) (2) (3) (4)
Males Females Males FemalesDiabetes −0.142 0.103 −0.057 0.000
(0.199) (0.203) (0.037) (0.039)R2 0.089 0.142Score goodness-of-fit (H0=normality of errors) 11.40 12.92
p value 0.249 0.166F stat (H0: weak instruments) 14.003a 13.215a 28673.088 1225.456Sargan test (H0: valid instruments) 0.848a 0.019a 10.180 5.787
p value 0.357a 0.889a 0.070 0.327Endogeneity (H0: Diabetes exogenous) 0.238 0.730 0.955 1.807
p value 0.626 0.393 0.329 0.179N 3117 4132 3117 4132Marginal effects for bivariate probit (BP); robust standard errors in parentheses.Instruments: diabetes of mother, diabetes of father; for Lewbel additionally created age groups instruments.Other control variables: age, region, urban, education, indigenous, marital status, children, wealth, parental education.a The test statistics are taken from the linear IV model not presented here.∗ p < 0.1, ∗∗ p < 0.05, ∗∗∗ p < 0.01
29

Page 33 of 40
Accep
ted
Man
uscr
ipt
F Multinomial logit and IV results for formal andinformal employment
Table F1: Impact of diabetes on employment probabilities by employment status (multi-nomial logit)
Males Females(1) (2) (3) (4)
Informal Formal Informal FormalDiabetes −0.073∗∗ 0.031 −0.044∗∗ 0.008
(0.031) (0.026) (0.019) (0.018)Log likelihood −4997.064 −4997.064 −6267.941 −6267.941N 6286 6286 8243 8243Marginal effects; Robust standard errors in parentheses.Base category is being unemployed.Other control variables: age, region, urban, education, indigenous, marital status,children, wealth, parental education.* p < 0.1, ** p < 0.05, *** p < 0.01
30

Page 34 of 40
Accep
ted
Man
uscr
ipt
To consider the possible endogeneity of diabetes when estimating its effect on formaland informal employment, we again present the results of the bivariate probit and theLewbel model. The stratification into formal and informal employment groups significantlyreduces instrument power as well as sample size. For none of the employment groups thebivariate probit model indicates endogeneity (see Table F2 and Table F3). This does notchange even when using the Lewbel approach to increase instrument strength. Accordingly,we do not find any indication of endogeneity of diabetes for the stratification into formaland informal employment and rely on our probit estimates for inference.
Table F2: IV results for informal employment
BP Lewbel IV(1) (2) (3) (4)Male Female Male Female
Diabetes −0.046 0.069 −0.048 −0.037(0.123) (0.130) (0.030) (0.025)
R2 0.103 0.088Score goodness-of-fit (H0=normality of errors) 13.84 17.37
p value 0.128 0.043F stat (H0: weak instruments) 13.565a 25.123a 5349.118 2536.362Sargan test (H0: valid instruments) 0.551a 1.684a 4.067 4.063
p value 0.458a 0.194a 0.540 0.540Endogeneity (H0: Diabetes exogenous) 0.025 1.152 1.128 0.722
p value 0.873 0.283 0.288 0.395N 4604 6983 4604 6983
Marginal effects for bivariate probit (BP); robust standard errors in parentheses.Instruments: diabetes of mother, diabetes of father; for Lewbel additionally created age groups instruments.Other control variables: age, region, urban, education, indigenous, marital status, children, wealth, parental education.a The test statistics are taken from the linear IV model not presented here.∗ p < 0.1, ∗∗ p < 0.05, ∗∗∗ p < 0.01
31

Page 35 of 40
Accep
ted
Man
uscr
ipt
Table F3: IV results for formal employment
BP Lewbel IV(1) (2) (3) (4)Male Female Male Female
Diabetes 0.098 −0.103 −0.022 0.003(0.195) (0.069) (0.049) (0.021)
R2 0.256 0.262Score goodness-of-fit (H0=normality of errors) 12.95 8.03
p value 0.165 0.531F stat (H0: weak instruments) 8.518a 19.996a 2764.273 1647.887Sargan test (H0: valid instruments) 1.111a 1.075a 9.286 6.741
p value 0.292a 0.300a 0.098 0.241Endogeneity (H0: Diabetes exogenous) 0.516 1.833 1.602 0.318
p value 0.473 0.176 0.206 0.573N 2204 5652 2204 5652Marginal effects for bivariate probit (BP); robust standard errors in parentheses.Instruments: diabetes of mother, diabetes of father; for Lewbel additionally created age groups instruments.Other control variables: age, region, urban, education, indigenous, marital status, children, wealth, parental education.a The test statistics are taken from the linear IV model not presented here.∗ p < 0.1, ∗∗ p < 0.05, ∗∗∗ p < 0.01
Acknowledgement
We are grateful to the participants in the 2013 Economics of Disease conference (Darmstadt,Germany), participants in the Health Economics Group Seminar at the University of East Angliaand Marcello Morciano, Veronica Toffolutti, Pieter Serneels, Ruth Hancock and three anonymousreferees for helpful comments.
References
Aaronson, S., 2010. Comment on "Measuring Labor Composition. A Comparison of Altern-ate Methodologies" Chapter. In: Abraham, K. G., Spletzer, J. R., Harper, M. (Eds.),Labor in the New Economy. University of Chicago Press, Ch. Comment on, pp. 485 –491.
Agardh, E., Allebeck, P., Hallqvist, J., Moradi, T., Sidorchuk, A., 2011. Type 2 diabetes
32

Page 36 of 40
Accep
ted
Man
uscr
ipt
incidence and socio-economic position: a systematic review and meta-analysis. Interna-tional journal of epidemiology 40 (3), 804–18.
Aguila, E., Diaz, C., Fu, M. M., Kapteyn, A., Pierson, A., 2011. Living longer in Mexico:Income security and health. RAND Corporation.
Angrist, J., Pischke, J., 2008. Mostly Harmless Econometrics: An Empiricist’s Companion.Princeton University Press.
Antillón, M., Lauderdale, D. S., Mullahy, J., Jul. 2014. Sleep behavior and unemploymentconditions. Economics and human biology 14, 22–32.
Arredondo, A., De Icaza, E., 2011. The cost of diabetes in Latin America: evidence fromMexico. Value in health: the journal of the International Society for Pharmacoeconomicsand Outcomes Research 14 (5 Suppl 1), S85–8.
Barquera, S., Campos-Nonato, I., Aguilar-Salinas, C., Lopez-Ridaura, R., Arredondo, A.,Rivera-Dommarco, J., 2013. Diabetes in Mexico: cost and management of diabetes andits complications and challenges for health policy. Globalization and health 9 (1), 3.
Barquera, S., Hernandez-Barrera, L., Tolentino, M. L., Espinosa, J., Ng, S. W., Rivera,J. A., Popkin, B. M., 2008. Energy intake from beverages is increasing among Mexicanadolescents and adults. The Journal of nutrition 138 (12), 2454–61.
Barquera, S., Hotz C, Rivera JA, Tolentino ML, Espinosa J, Campos I, S. T., 2006. Foodconsumption, food expenditure, anthropometric status and nutrition-related diseases inMexico. In: Kennedy, G., Nantel, G., Shetty, P. (Eds.), The double burden of malnu-trition: case studies from six developing countries. Food and Agriculture Organizationof the United Nations, Rome, pp. 161–204.
Bastida, E., Pagán, J. A., 2002. The impact of diabetes on adult employment and earningsof Mexican Americans: findings from a community based study. Health economics 11 (5),403–13.
Basu, S., Yoffe, P., Hills, N., Lustig, R. H., 2013. The relationship of sugar to population-level diabetes prevalence: an econometric analysis of repeated cross-sectional data. PloSone 8 (2), e57873.
Baum, C., Schaffer, M., 2007. Enhanced routines for instrumental variables/generalizedmethod of moments estimation and testing. Stata Journal.
33

Page 37 of 40
Accep
ted
Man
uscr
ipt
Bellamy, L., Casas, J.-P., Hingorani, A. D., Williams, D., 2009. Type 2 diabetes mellitusafter gestational diabetes: a systematic review and meta-analysis. Lancet 373 (9677),1773–9.
Brown, H. S., Pagán, J. A., Bastida, E., 2005. The impact of diabetes on employment:genetic IVs in a bivariate probit. Health economics 14 (5), 537–44.
Brown, T. T., Mar. 2014. How effective are public health departments at preventing mor-tality? Economics and human biology 13, 34–45.
Chiburis, R. C., Das, J., Lokshin, M., 2012. A practical comparison of the bivariate probitand linear IV estimators. Economics Letters 117 (3), 762–766.
Denny, K., Oppedisano, V., Aug. 2013. The surprising effect of larger class sizes: Evidenceusing two identification strategies. Labour Economics 23, 57–65.
Drichoutis, A. C., Nayga, R. M., Lazaridis, P., Mar. 2011. Food away from home ex-penditures and obesity among older Europeans: are there gender differences? EmpiricalEconomics 42 (3), 1051–1078.
Emran, M. S., Shilpi, F., Aug. 2012. The extent of the market and stages of agriculturalspecialization. Canadian Journal of Economics/Revue canadienne d’économique 45 (3),1125–1153.
Filmer, D., Pritchett, L., 2001. Estimating wealth effects without expenditure data-Ortears: An application to educational enrollments in states of India. Demography 38 (1),115–132.
Hemminki, K., Li, X., Sundquist, K., Sundquist, J., 2010. Familial risks for type 2 diabetesin Sweden. Diabetes care 33 (2), 293–7.
Herder, C., Roden, M., 2011. Genetics of type 2 diabetes: pathophysiologic and clinicalrelevance. European journal of clinical investigation 41 (6), 679–92.
Hu, F. B., 2011. Globalization of diabetes: the role of diet, lifestyle, and genes. Diabetescare 34 (6), 1249–57.
Huang, H.-C. R., Lin, Y.-C., Yeh, C.-C., Jun. 2009. Joint determinations of inequality andgrowth. Economics Letters 103 (3), 163–166.
Huxley, R., Barzi, F., Woodward, M., Jan. 2006. Excess risk of fatal coronary heartdisease associated with diabetes in men and women: meta-analysis of 37 prospectivecohort studies. BMJ (Clinical research ed.) 332 (7533), 73–8.
34

Page 38 of 40
Accep
ted
Man
uscr
ipt
International Diabetes Federation, 2013. Diabetes Atlas, 6th Edition. International Dia-betes Federation.
Kelly, I. R., Dave, D. M., Sindelar, J. L., Gallo, W. T., Oct. 2012. The impact of earlyoccupational choice on health behaviors. Review of Economics of the Household 12 (4),737–770.
Knapp, L. G., Seaks, T. G., 1998. A Hausman test for a dummy variable in probit.
Knaul, F. M., González-Pier, E., Gómez-Dantés, O., García-Junco, D., Arreola-Ornelas,H., Barraza-Lloréns, M., Sandoval, R., Caballero, F., Hernández-Avila, M., Juan, M.,Kershenobich, D., Nigenda, G., Ruelas, E., Sepúlveda, J., Tapia, R., Soberón, G., Cher-torivski, S., Frenk, J., 2012. The quest for universal health coverage: achieving socialprotection for all in Mexico. Lancet 380 (9849), 1259–79.
Latif, E., 2009. The impact of diabetes on employment in Canada. Health economics18 (5), 577–89.
Lewbel, A., 2007. Estimation of Average Treatment Effects with Misclassification. Econo-metrica 75 (2), 537–551.
Lewbel, A., Jan. 2012. Using Heteroscedasticity to Identify and Estimate Mismeasuredand Endogenous Regressor Models. Journal of Business & Economic Statistics 30 (1),67–80.
Lin, S., 2011. Estimating the impact of diabetes on employment in Taiwan. EconomicsBulletin 31 (4), 3089–3102.
Maahs, D. M., West, N. A., Lawrence, J. M., Mayer-Davis, E. J., Sep. 2010. Epidemiologyof type 1 diabetes. Endocrinology and metabolism clinics of North America 39 (3),481–97.
Minor, T., 2011. The effect of diabetes on female labor force decisions: new evidence fromthe National Health Interview Survey. Health economics 20 (12), 1468–86.
Minor, T., Dec. 2013. An investigation into the effect of type I and type II diabetesduration on employment and wages. Economics and human biology 11 (4), 534–44.
Rivera, J. a., Barquera, S., Campirano, F., Campos, I., Safdie, M., Tovar, V., 2002. Epi-demiological and nutritional transition in Mexico: rapid increase of non-communicablechronic diseases and obesity. Public health nutrition 5, 113–122.
35

Page 39 of 40
Accep
ted
Man
uscr
ipt
Rivera, J. A., Barquera, S., González-Cossío, T., Olaiz, G., Sepúlveda, J., Jul. 2004. Nu-trition Transition in Mexico and in Other Latin American Countries. Nutrition Reviews62 (July), S149–S157.
Rubalcava, L., Teruel, G., 2008. User’s Guide for the Mexican Family Life Survey SecondWave.
Salomon, J. a., Carvalho, N., Gutierrez-Delgado, C., Orozco, R., Mancuso, A., Hogan,D. R., Lee, D., Murakami, Y., Sridharan, L., Medina-Mora, M. E., Gonzalez-Pier,E., 2012. Intervention strategies to reduce the burden of non-communicable diseases inMexico: cost effectiveness analysis. BMJ 344, e355.
Samb, B., Desai, N., Nishtar, S., Mendis, S., Bekedam, H., Wright, A., Hsu, J., Martiniuk,A., Celletti, F., Patel, K., Adshead, F., McKee, M., Evans, T., Alwan, A., Etienne, C.,2010. Prevention and management of chronic disease: a litmus test for health-systemsstrengthening in low-income and middle-income countries. Lancet 376 (9754), 1785–97.
Schroeter, C., Anders, S., Carlson, A., Nov. 2012. The Economics of Health and VitaminConsumption. Applied Economic Perspectives and Policy 35 (1), 125–149.
Sicree, B. R., Shaw, J., Zimmet, P., 2011. The Global Burden: Diabetes and ImpairedGlucose Tolerance. International Diabetes Federation, Brussels, Belgium.
Staiger, D., Stock, J., 1997. Instrumental variables regression with weak instruments.Econometrica 65 (3), 557–586.
Stevens, G., Dias, R. H., Thomas, K. J. A., Rivera, J. A., Carvalho, N., Barquera, S., Hill,K., Ezzati, M., 2008. Characterizing the epidemiological transition in Mexico: nationaland subnational burden of diseases, injuries, and risk factors. PLoS medicine 5 (6), e125.
The Interact Consortium, 2013. The link between family history and risk of type 2 diabetesis not explained by anthropometric, lifestyle or genetic risk factors: the EPIC-InterActstudy. Diabetologia 56 (1), 60–9.
Vijan, S., Hayward, R. A., Langa, K. M., 2004. The impact of diabetes on workforceparticipation: results from a national household sample. Health services research 39 (6Pt 1), 1653–69.
Villalpando, S., de la Cruz, V., Rojas, R., Shamah-Levy, T., Avila, M. A., Gaona, B., Re-bollar, R., Hernández, L., 2010. Prevalence and distribution of type 2 diabetes mellitus
36

Page 40 of 40
Accep
ted
Man
uscr
ipt
in Mexican adult population: a probabilistic survey. Salud pública de México 52 Suppl1 (1), S19–26.
Williams, A. L., Jacobs, S. B. R., Moreno-Macías, H., Huerta-Chagoya, A., Churchhouse,C., Márquez-Luna, C., García-Ortíz, H., Gómez-Vázquez, M. J., Burtt, N. P., Aguilar-Salinas, C. a., González-Villalpando, C., Florez, J. C., Orozco, L., Haiman, C. a., Tusié-Luna, T., Altshuler, D., 2014. Sequence variants in SLC16A11 are a common risk factorfor type 2 diabetes in Mexico. Nature 506 (7486), 97–101.
Wooldridge, J., 2002. Econometric Analysis of Cross Section and Panel Data. The MITpress.
Yach, D., Stuckler, D., Brownell, K. D., 2006. Epidemiologic and economic consequencesof the global epidemics of obesity and diabetes. Nature medicine 12 (1), 62–6.
Yu, C. H. Y., Zinman, B., 2007. Type 2 diabetes and impaired glucose tolerance in abori-ginal populations: a global perspective. Diabetes research and clinical practice 78 (2),159–70.
Zhang, X., Zhao, X., Harris, A., 2009. Chronic diseases and labour force participation inAustralia. Journal of health economics 28 (1), 91–108.
37