the impact of disclosures of internal control weaknesses ... · clients’ icofr and express...
TRANSCRIPT

The Impact of Disclosures of Internal Control Weaknesses
and Remediations on Investor-Perceived Earnings Quality
Luo He Concordia University
Montréal, Canada [email protected]
Daniel B. Thornton Queen’s University Kingston, Canada [email protected]
May 18, 2010
Acknowledgements: The authors are grateful for helpful comments from Michael Welker, Steven Salterio, Jean Bédard, William Scott, Hollis Ashbaugh-Skaife, Terry Shevlin, Sarah McVay, Pamela Murphy, Shiheng Wang, Xin Zhang, Liandong Zhang, Arthur Cockfield, anonymous reviewers of the Canadian Academic Accounting Association Annual Conference 2010 and of the Chinese Accounting Professors’ Association of North America 2010 Conference, and workshop participants at Queen’s University, Concordia University, the University of Waterloo, McGill University, the University of Saskatchewan, and Brock University. They thank Jeffery Doyle, Weili Ge, and Sarah McVay for sharing their sample of firms with material weaknesses in internal control. They thank Frank Ecker, Jennifer Francis, Irene Kim, Per Olsson, and Katherine Schipper for sharing their AQfactor data. They acknowledge financial support from the Social Sciences and Humanities Research Council of Canada (Grant No. 410-2007-0352), the Chartered Accountants of Ontario Professorship, the CA-Queen’s Centre for Governance, and the Faculty Research Development Program at Concordia University.
The Impact of Disclosures of Internal Control Weaknesses
and Remediations on Investor-Perceived Earnings Quality
Abstract
We hypothesize and find that firms making SOX-mandated disclosures of material weaknesses
in internal control over financial reporting (ICOFR) exhibit lower investor-perceived earnings
quality (IPEQ) than non-disclosers. We measure IPEQ using e-loading, a market-returns-based
representation of earnings quality developed by Ecker et al. (2006). Firms do not exhibit
decreases in IPEQ after initially disclosing material weaknesses, consistent with investors having
anticipated ICOFR strength based on observable firm characteristics. However, firms exhibit
increases in IPEQ after receiving their first clean audit reports confirming the remediation of
previously disclosed weaknesses. This indicates that although investors do not find initial
weakness disclosures to be incrementally informative, SOX motivates firms to remediate weak
controls and provides a venue for credible remediation disclosures, enhancing investors’
perception of financial reporting reliability. These findings are consistent with the existence of
regulatory benefits associated with SOX’s internal control disclosure and audit requirements.
Keywords: perceived earnings quality, internal control, material weakness, e-loading, Sarbanes Oxley Act, SOX 302, SOX 404 Data Availability: All data used in the paper are available from publicly available sources noted in the text. JEL Classifications: M40, M41, M49, G34

1
1. Introduction
We investigate whether US firms’ disclosures about internal control over financial
reporting (ICOFR), mandated by the Sarbanes-Oxley Act of 2002 (SOX), are associated with
levels of investor-perceived earnings quality (IPEQ) and with changes in IPEQ over time. We
measure IPEQ using e-loading, a market-returns-based representation of accrual quality
developed by Ecker, Francis, Kim, Olsson, and Schipper (2006). Our focus on associations
between SOX-related ICOFR disclosures and investor-perceived earnings quality augments prior
research that has focused on associations between ICOFR disclosures and earnings quality
measures based on reported accounting numbers. Since investor confidence is perception-based,
our focus is consistent with SOX’s goal of enhancing investor confidence in the reliability of
financial reporting.
We hypothesize and find that firms making SOX-mandated disclosures of material
weaknesses in ICOFR exhibit lower IPEQ than firms not disclosing such weaknesses. On
average, however, firms’ initial disclosures of material weaknesses do not alter IPEQ. This
finding is consistent with investors having inferred firms’ ICOFR weaknesses in the absence of
explicit SOX-mandated disclosures. We also hypothesize and find that firms making audited
disclosures of the remediation of previously identified ICOFR weaknesses exhibit increases in
IPEQ. This finding is consistent with SOX remediation disclosures achieving the regulatory aim
of enhancing investors’ perception of the reliability of financial reporting. Our interpretation of
the results is that SOX motivates firms to remediate ICOFR weaknesses and provides a credible
venue for remediation disclosures, thereby enhancing investor perceptions of the reliability of
firms’ financial reporting.
2
E-loading is an appropriate proxy for IPEQ in the SOX regulatory setting despite
controversy in the literature over whether accrual quality is a market-priced risk factor (Core,
Guay, & Verdi, 2008) because enhancing investors’ perception of the reliability of firms’
accounting information can increase investor participation in equity markets and improve the
efficiency of capital allocation (Lev, 1988). These regulatory benefits can occur even in the
absence of direct pricing or cost-of-capital effects.
The study proceeds as follows. Reviews of the institutional setting and prior research
leading to the development of hypotheses occupy sections 2 and 3. Section 4 describes sample
selection and outlines the research design. Section 5 presents the results of empirical tests. The
sixth section concludes and discusses the implications of the findings.
2. Institutional background
2.1 SOX provisions relating to ICOFR
SOX (An Act to Protect Investors by Improving the Accuracy and Reliability of
Corporate Disclosure) is cited as the most important US securities legislation since the 1930s
(Prentice, 2007). Nicolaisen (2004), a former Chief Accountant of the US Securities and
Exchange Commission (SEC), maintains that SOX’s provisions related to ICOFR “have the
greatest potential to improve the reliability of financial reporting.” Auditing Standard (AS) No. 2
defines a firm’s ICOFR as “a process designed … to provide reasonable assurance regarding the
reliability of financial reporting and the preparation of financial statements for external purposes
in accordance with generally accepted accounting principles” (Public Company Accounting
Oversight Board, 2004, paragraph 7).1 Policymakers aimed to enhance financial reporting
reliability and restore investor confidence by enacting SOX’s internal control provisions in
Sections 302 and 404 of the Act.
3
2.1.1 SOX Sections 302 and 404
SOX Sections 302 and 404 relate to ICOFR: Section 302 requires senior management to
evaluate internal controls quarterly and certify the effectiveness of ICOFR in quarterly and
annual financial statements. SEC interim rules regarding Section 302 are effective August 29,
2002, applying to all SEC filers.
Section 404 mandates that firms’ annual reports contain management’s evaluation of
ICOFR effectiveness at each fiscal year end; it also requires auditors to conduct annual audits of
clients’ ICOFR and express opinions on the effectiveness of ICOFR. Section 404 is effective for
fiscal years ending on or after November 15, 2004. To date, however, Section 404’s ICOFR
audit requirement only applies to accelerated SEC filers, a category of filers comprising public
companies with a market capitalization of at least $75 million.2
Sections 302 and 404 are the first widely applied legal requirements mandating public
disclosure and audit of ICOFR effectiveness. Before SOX, the Foreign Corrupt Practices Act of
1977, which was aimed at curbing bribes to foreign officials, required US public companies to
maintain systems of internal controls to ensure that transactions were accurately recorded;
however, US companies were not required to publicly disclose internal control deficiencies
except in Forms 8-K filed after changing auditors (Krishnan, 2005).
2.1.2 Levels of ICOFR deficiencies
AS No. 2 identifies three, increasingly serious levels of ICOFR deficiencies: control
deficiencies, significant deficiencies, and material weaknesses. A material weakness is “…a
significant deficiency, or combination of significant deficiencies, that results in more than a
remote likelihood that a material misstatement of the annual or interim financial statements will
not be prevented or detected” (AS No. 2, paragraph 10).3 Sections 302 and 404 mandate only
4
material weakness disclosures; disclosures of the two less serious internal control deficiencies
are voluntary. We focus on only material weakness disclosures to circumvent self-selection
issues relating to voluntary disclosure (Doyle, Ge, & McVay, 2007b) and because material
weaknesses are more likely to be associated with low IPEQ than the two less serious types of
ICOFR deficiencies are.
2.2 SOX compliance costs
SOX internal control provisions have evoked criticism relating to allegedly excessive
costs of complying with the new regulations. Section 404 is cited as “…the most expensive and
most burdensome piece of Sarbanes-Oxley” (Atkins, 2005); the SEC (2003) initially estimated
annual implementation costs to be about $91,000 per firm but actual costs are much higher.
According to a recent study (SEC, 2009a), firms’ average out-of-pocket costs of complying with
Section 404 are $2.3 million even after 2007 when costs have fallen due to learning-curve
economies and improved regulatory guidance. Besides incurring direct out-of-pocket compliance
costs, firms incur opportunity costs when managerial attention is diverted from business issues to
comply with complex SOX regulations (Bryan & Lilien, 2005; Solomon & Bryan-Low, 2004).
Companies and business associations bemoan SOX compliance costs, appealing for amendments
or abolishment of the requirements (Garrett & Adler, 2009; American Electronics Association,
2005; Financial Executives International, 2005). In view of the on-going cost/benefit debate, it is
important to investigate whether there is evidence consistent with benefits associated with
mandated ICOFR disclosures, as we do in this study.

5
3. Prior literature and hypothesis development
3.1 Prior literature
The disclosure of reliable internal control data pursuant to SOX has facilitated ICOFR
research. In this section, we review the two streams of research that are most germane to our
study: research on the association of ICOFR strength with earnings quality (focusing on accrual
quality) and research on the association of ICOFR strength with firms’ cost of equity.
3.1.1 Internal control and earnings quality
Among the many accounting numbers firms report, earnings constitute a premier source
of firm-specific information (Francis, LaFond, Olsson, & Schipper, 2004). Investors, analysts,
senior executives, and boards of directors see earnings as the most important item in public
firms’ financial reports (Degeorge, Patel, & Zeckhauser, 1999). Investors rely on earnings more
than any other summary measures of firm performance (Biddle, Seow, & Siegel, 1995; Francis,
Schipper, & Vincent, 2003; Liu, Nissim, & Thomas, 2002).4 Survey results indicate that
managers see earnings as the key metric investors and analysts rely on to evaluate firm
performance (Graham, Harvey, & Rajgopal, 2005).
Three studies of internal control and earnings quality are closely related to ours but focus
on firms’ earnings quality based on reported accounting numbers, in contrast to our focus on
perceived earnings quality. Using a modified Dechow and Dichev (2002) accrual-quality model,
Doyle, Ge, & McVay (2007b) find that firms disclosing material ICOFR weaknesses tend to
exhibit lower accrual quality than non-disclosers. They describe low accrual quality as evidence
of “poorly estimated accruals that are not realized as cash flows” (p. 1141). Ashbaugh-Skaife,
Collins, Kinney, & LaFond (2008) and Bédard (2006) primarily use modified Jones (1991)
abnormal-accruals models to derive proxies for accrual quality. Tracking weakness disclosers

6
over time, Bédard finds that abnormal accruals in weakness-disclosure years exceed those in pre-
disclosure years. He sees this as evidence of higher accrual quality in weakness-disclosure years
when managers are motivated by auditors or liability concerns to reverse inflated accruals that
accumulated in prior years. Ashbaugh-Skaife et al. perform cross-sectional comparisons of
weakness disclosers vs. non-disclosers and find that weakness disclosers exhibit higher abnormal
accruals (lower accrual quality) than non-disclosers. They also find that when auditors confirm
the remediation of previously reported ICOFR deficiencies, firms exhibit lower absolute
abnormal accruals (higher accrual quality) than when they first reported ICOFR deficiencies.
We seek to augment the literature by investigating similar associations of ICOFR
deficiencies with perceived earnings quality. Since investor confidence is perception-based, our
focus on perceived earnings quality is consistent with SOX’s goal of enhancing investor
confidence in the reliability of financial reporting. Focusing on IPEQ is also consistent with the
FASB’s Conceptual Framework, in which reliability has long been among the qualitative
characteristics of useful accounting information (Statement of Financial Accounting Concepts
No. 2, 1980). Reliability and usefulness are at least partially perception-based.
3.1.2 Internal control and the cost of equity
Three studies report diverse results regarding the association of ICOFR strength with
firms’ costs of equity. Ashbaugh-Skaife, Collins, Kinney, & LaFond (2009) find that firms
reporting internal control deficiencies tend to have significantly higher costs of equity than those
with problem-free internal control systems. Ogneva, Subramanyam, & Raghunandan (2007) and
Beneish, Billings, & Hodder (2008) report somewhat contradictory findings. Focusing on firms
providing Section 404 internal control disclosures for the first time, Ogneva et al. do not find any
association between internal control weaknesses and equity costs after controlling for firm
7
characteristics and analyst forecast bias. Beneish et al. find that firms reporting internal control
deficiencies under Section 302 exhibit significant increases in equity costs but do not find any
evidence of changes in the equity costs of firms filing under Section 404.
Our study is closely related to studies in this research stream in that it is directed at the
same fundamental research question—whether internal control weaknesses are associated with
greater information risk in the capital market. Given the diverse results in extant cost-of-equity
studies, further research is needed to shed light on this issue. Our study extends the literature by
focusing on IPEQ, a different manifestation of information risk. To the extent that enhancing
IPEQ boosts investor participation in equity markets and improves allocational efficiency,
regulators are interested in enhancing IPEQ even if doing so does not lower firms’ costs of
capital.
3.2 Hypothesis development
3.2.1 Association of ICOFR strength with IPEQ
Studies reviewed in Section 3.1 indicate that ICOFR strength is positively associated with
earnings quality because ICOFR reduces information risk associated with reported earnings
numbers. Weak ICOFR impairs firms’ earnings quality in two ways: by introducing noise
(imprecision) and by imparting bias in accounting numbers.
As to noise, weak ICOFR tends to trigger unintentional errors due to ineffective
information systems, inadequate training, or lackadaisical managerial attitudes toward financial
reporting. Unintentional errors stemming from weak ICOFR include inventory miscounting and
mispricing, failure to record credit sales/purchases, imprecise bad debt estimates due to
inadequate credit screening, inadequate inventory obsolescence allowances, and mistakenly
capitalizing items that should be expensed and vice-versa; all of these errors directly impact

8
earnings and are likely to degrade earnings quality (Ashbaugh-Skaife, Collins, Kinney, &
LaFond, 2008; Doyle, Ge, & McVay, 2007b; Bédard, 2006; Knechel, Salterio, & Ballou, 2007).
As to bias, weak ICOFR affords fraud opportunities, facilitating intentional earnings
management (Doyle, Ge, & McVay, 2007b; Ashbaugh-Skaife, Collins, Kinney, & LaFond,
2008). Managerial incentives to manipulate earnings include maximizing compensation (Healy,
1985), ensuring job security (Fudenberg & Tirole, 1995), influencing capital market pricing
(Murphy, 1985; Rangan, 1998; Teoh, Welch, & Wong, 1998), and relaxing debt covenant
constraints (Watts & Zimmerman, 1978) or regulatory constraints based on accounting numbers
(Jones, 1991; Cahan, 1992).
Analytical accounting research germane to our hypotheses is predicated on the
assumption that firms’ equity investors perceive any diminution in information quality and are
compensated for it. Holthausen and Verrecchia’s (1988) model predicts that when investors
observe firms’ earnings, they revise their beliefs about firms’ performance to a lesser degree
when they perceive accounting earnings to be noisier (less precise). Analytical models developed
by Easley & O’Hara (2004) and Lambert, Leuz, & Verrecchia (2007) imply that biased
information contains a non-diversifiable component perceived and priced by investors. Our first
hypothesis related to investor perceptions, stated in alternative form, is:
H1: Firms disclosing internal control material weaknesses (ICMW) exhibit
lower IPEQ than firms not disclosing any internal control deficiencies (Non-
ICD).
9
3.2.2 Severity levels of material weaknesses and their association with IPEQ
Investor perceptions of the impact of material weaknesses on financial reporting
reliability are likely to vary with the severity of the deficiencies and the extent to which auditors
can compensate for the deficiencies before firms issue their financial statements. Material
ICOFR weaknesses include account-specific lapses, deficient revenue-recognition policies, lack
of segregation of duties, inadequate training of accounting personnel, deficiencies in period-end
reporting protocols, and careless senior management attitudes toward ICOFR (Ge & McVay,
2005). External auditors can often compensate for or audit around (in the auditing vernacular)
account-specific ICOFR weaknesses by conducting substantive tests, thereby ensuring that the
numbers reported in financial statements are reliable even when clients’ ICOFR is weak
(Simunic, 1980; Lu, Richardson, & Salterio, 2009). It is costly or impossible, however, for
auditors to compensate for severe control weaknesses related to deficiencies in firms’ overall
control environment.
Moody’s Investors Service expresses a view on the auditability of different types of
internal control material weaknesses, and the implications for the credit ratings issued by the
Service, as follows:
We are less concerned about material weaknesses that relate to controls over specific account balances or transaction-level processes. We refer to these material weaknesses as “Category A” material weaknesses. In most cases, we believe that the auditor can effectively “audit around” these material weaknesses by performing additional substantive procedures in the area where the material weakness exists. We expect to give companies reporting Category A material weaknesses the benefit of the doubt and not take any related rating action… Other material weaknesses relate to company-level controls such as the control environment or the financial reporting process. These material weaknesses, which we refer to as “Category B” material weaknesses, may result in us bringing a company to rating committee to determine whether a rating action is necessary. We are concerned about these material weaknesses because we question the ability of the auditor to effectively “audit around” problems that have a pervasive effect on a company’s financial reporting. Also, Category B material weaknesses call into question not only management’s ability to prepare accurate financial reports but also its ability to control the business. (Doss & Jonas, 2004, p. 1)

10
Consistent with Moody’s skepticism about auditors’ ability to compensate for severe company-
level material ICOFR weaknesses, four audit partners and a senior audit manager participating in
a study by Hammersley et al. (2008) cite examples of company-level weaknesses that are costly
to audit. They include lack of key personnel, evidence of management overriding controls,
integrity issues, inadequate financial statement closing procedures, and insufficient
documentation or oversight to effectively vet transactions or adjusting entries. Hammersley et al.
find that firms disclosing these less-auditable internal control weaknesses exhibit lower market
returns measured over a three-day event window containing the disclosures.5 Doyle et al.
(2007b) find that accrual quality is negatively associated with the presence of severe company-
level material weaknesses but not with the presence of more auditable, account-specific material
weaknesses.
We expect to observe similar associations between the two categories of ICOFR
weaknesses and IPEQ. Therefore, our second hypothesis is stated in alternative form for
company-level weaknesses and in null form for account-specific weaknesses:
H2: A. Firms disclosing company-level material weaknesses (CLMW) in
internal control exhibit lower IPEQ than firms not disclosing any internal
control deficiencies (Non-ICD).
H2: B. There is no difference in IPEQ between firms disclosing account-
specific material weaknesses (ASMW) and firms not disclosing any internal
control deficiencies (Non-ICD).

11
3.2.3 Within-firm IPEQ changes following material weakness disclosures
Verrecchia (2001) shows analytically that the disclosure of new information about firm
value is expected to be associated with changes in the activities of utility-maximizing investors,
resulting in changes in stock prices, trading volume, and market liquidity. Ecker et al. (2006)
find that firms’ e-loading deteriorates in years leading up to three events that are likely to be
associated with poor earnings quality: earnings restatements, material lawsuits, and delisting due
to bankruptcy. To the extent that ICOFR disclosures provide investors with new information
concerning firms’ earnings quality, we expect to observe increases (decreases) in IPEQ for firms
announcing improvement (deterioration) in ICOFR relative to market expectations.
We expect that investors form rational expectations, on average, about firms’ ICOFR
based on observable firm characteristics before firms make SOX-mandated disclosures. Doyle et
al. (2007a) and Ashbaugh-Skaife, Collins, & Kinney (2007) find that, compared with firms not
disclosing any ICOFR deficiencies under Sections 302 and 404, those disclosing deficiencies
tend to be smaller, younger, financially weaker, more complex, more rapidly growing, and more
likely to be undergoing restructuring. To the extent that investors anticipate ICOFR deficiencies
based on such firm characteristics, we do not expect IPEQ to change upon SOX-mandated
disclosures. It is an empirical question whether, and to what extent, the disclosures convey new
information to the market, so we state the third hypothesis in null form:
H3: Firms disclosing internal control material weaknesses experience no
change in IPEQ.

12
3.2.4 Within-firm IPEQ changes following remediation disclosures
Although it is unclear on the basis of a priori arguments whether the initial ICOFR
disclosures contain information that investors cannot glean from observing firm characteristics
over time, we expect that the first audited disclosures of firms successfully remediating
previously disclosed material weaknesses convey positive new information to investors. We
expect that the initial disclosure of ICOFR deficiencies increases firms’ net benefits (or
decreases net costs) of remediating ICOFR deficiencies. Even if investors expect that firms will
strive to remediate ICOFR deficiencies, however, it is uncertain when and to what extent firms
can ameliorate ICOFR sufficiently to obtain clean audit reports. So, we expect that audited
remediation disclosures are associated with investors positively revising their prior perception of
firms’ earnings quality. Our fourth hypothesis, stated in alternative form, is:
H4: Firms disclosing remediation of internal control material weaknesses
exhibit increases in IPEQ.
4. Data, sample selection and research design
4.1 Data and sample selection
4.1.1 Data sources and preliminary screening
We begin with 1,210 sample firms provided by Doyle, Ge, & McVay (2007b).6 After
searching Forms 10-K, 10-Q, and 8-K on 10KWizard.com for the phrases “material weakness”
and “material weaknesses” during August 1, 2002 to October 31, 2005, they identify 1,210 firms
disclosing at least one material ICOFR weakness. We obtain detailed coding data regarding
13
material weakness types from the authors directly. From Audit Analytics we glean firms’ first
disclosures of unqualified SOX 404 audit reports evincing remediation of material weaknesses.
Daily return data for AQfactor, used to calculate the IPEQ measure, come from Ecker et
al. (2006).7 Data related to the Fama-French three-factor model come from French’s on-line data
library.8 Firms’ daily market return data are from the Center for Research in Security Prices
(CRSP) and companies’ accounting data are from Compustat North America.
[Insert Table 1]
To ensure the accuracy of dates when firms initially disclose ICOFR material
weaknesses, we compare event dates from Doyle et al. with dates obtained by directly searching
Audit Analytics. We include sample firms disclosing ICOFR material weaknesses for the first
time during August 1, 2002 to December 31, 2006. We then compare event dates of the Doyle et
al. sample with those of the Audit Analytics sample.9 Table 1 presents details of the event-date
verification process. As shown in Panel A, 242 of the 1,210 Doyle et al. firms are excluded from
the sample because they lack identification information. Among the remaining 968 firms, 129
are not covered by Audit Analytics. Of the remaining 839 firms, 382 have the same event dates
per Doyle et al. and per Audit Analytics and 457 have different dates. For the 457 firms with
inconsistent dates, the difference between the Audit Analytics date and the Doyle et al. date
ranges from –898 to 1,315 days, with the mean of 82 and the median of 26 days.10
In view of these event-date discrepancies, we verify the dates via 10K-Wizard.11 For the
968 firms with required identification information, we search 10K-Wizard for all SEC filings
containing the phrase “material weakness” or “material weaknesses” from 2001 to the event-
dates provided by Doyle et al. and Audit Analytics. We peruse the filings to identify the earliest
dates companies disclose material weaknesses in ICOFR. As Panel B of Table 1 shows, we
remove ten of the 968 firms with erroneous identification information; we exclude another ten

14
because their first disclosure dates fall before August 2002 when SOX internal control provisions
became effective. We do not find material weakness disclosures for four companies and
therefore exclude them from the sample. This date verification process yields a 944-firm sample
as a basis for identifying sub-samples available for testing our four hypotheses. Table 2
summarizes this sub-sample selection process.
[Insert Table 2]
4.1.2 H1 and H2 samples
For H1, 61 firms are excluded because they receive unqualified SOX 404 audit opinions
during the three-quarter testing period, denoted as (0, +270), i.e., day 0 through day +270 in
event-time. Day 0 is the date when a firm first discloses material weaknesses under SOX. As
discussed in the next section about the study’s research design, we require three quarters of daily
stock return data to measure a firm’s IPEQ after the firm’s first disclosure of weaknesses. The 61
firms are excluded to avoid the possible confounding effect of favorable disclosures regarding
remediation of weaknesses during the testing period. Of the remaining 883 firms, 147 are either
not covered by the CRSP Daily Stock File or lack daily stock return data required by our tests (at
least 100 daily returns in three quarters) and 27 lack the Compustat data needed to construct a
matched sample, leaving 709 observations for H1 univariate tests. As 67 of the 709 firms lack
data for control variables, 642 observations are available for H1 multivariate analysis.
The sub-sample available for testing H2 is similar except that one firm is excluded
because it lacks the Doyle et al. code for material weakness type. This leaves subsamples of 708
firms for H2 univariate tests and 641 firms for multivariate tests. Among the 708 firms, 250 have
company-level weaknesses and 458 have account-specific weaknesses. Among the 641 firms,
226 have company-level weaknesses and 415 have account-specific weaknesses.

15
4.1.3 H3 sample
For H3 testing, we again start with 944 eligible firms; for the reason discussed previously
we exclude 61 firms receiving unqualified SOX 404 audit opinions during (0, +270). We exclude
120 firms disclosing non-material weakness deficiencies, such as significant deficiencies and
control deficiencies, during (-270, 0) for the following reason. As discussed in the next section
about research design, we test H3 by comparing firms’ IPEQ three quarters before and three
quarters after they first disclose ICOFR material weaknesses. We exclude the 120 firms to create
a more powerful test, free from the possible dilutive effect of negative internal control
disclosures that are similar to the first material weakness disclosure in nature but milder in
severity. The data relating to firms’ disclosure of any other internal control deficiencies except
material weaknesses come from Audit Analytics. We exclude 147 firms not covered by the
CRSP Daily Stock File or lacking adequate daily stock return data to conduct our tests. These
procedures generate a final sample of 616 firms for H3 testing.
4.1.4 H4 sample
H4 rests on the maintained assumption that unqualified SOX 404 audit opinions signal
remediation of previously disclosed ICOFR weaknesses. Assembly of the sub-sample for testing
H4 again starts with the initial 944 firms. Referring to Audit Analytics, we identify firms
receiving their first clean opinions during 2004-2006 after filing material weaknesses,
eliminating 483 firms that do not receive such opinions. We exclude 57 firms because there are
less than three quarters between when they first disclose weaknesses and when they reveal clean
opinions. We also exclude 11 firms disclosing material weaknesses again under SOX 302 during
the three quarters after receiving clean opinions. The research design choice to eliminate these 68
firms is consistent with using a full three quarters of daily stock return data before and after
16
remediation disclosures to estimate IPEQ in the pre-remediation and post-remediation. We
exclude 77 firms receiving clean opinions after March 31, 2006 because AQfactor data are only
available up to December 31, 2006. This ensures that sample firms have three quarters of post-
remediation AQfactor data for the tests. After removing 15 firms that are not covered by the
CRSP Daily Stock File or lack adequate daily stock return data, we retain 301 sample firms for
H4 testing.
4.2 Research design
4.2.1 E-loading proxy for IPEQ
We use e-loading, a market-returns-based measure, to proxy for investor-perceived
earnings quality (IPEQ). This measure was developed by Ecker et al. (2006). It is the slope
coefficient obtained from a regression of a firm’s daily excess returns in year T on a factor-
mimicking portfolio capturing earnings quality, controlling for other factors known to affect
excess returns (market risk premium, size, and book-to-market ratio). Researchers have recently
begun using this measure to address research questions pertaining to IPEQ.
Chen, Shevlin, & Tong (2007) apply e-loading to investigate whether changes in IPEQ
(which they refer to as “the pricing of financial reporting quality”) are associated with changes in
firms’ dividend policies. They find that dividend-initiating and dividend-increasing firms exhibit
decreases in e-loadings, reflecting IPEQ improvements; dividend-decreasing firms exhibit
increase in e-loadings, reflecting IPEQ declines. Their interpretation is that dividend initiations
and increases signal increased stability of current earnings, reduced uncertainty of future
earnings, and stronger links between current earnings and future payoffs to investors, leading to
higher IPEQ. In contrast, dividend-decreasing firms tend to be investing in new projects with
relatively uncertain future cash flows; consequently, the link between current earnings and future

17
cash flows is more tenuous, leading to lower IPEQ. To our knowledge, ours is the first study to
use e-loading to examine IPEQ in the setting of ICOFR disclosures.12
The basis of e-loading is firms’ accrual quality, which Dechow and Dichev (2002)
measure as the precision with which current accruals map into past-, current-, and future-period
cash flows. A key role of accruals is to shift or adjust the representation of cash flows over time
so that accounting earnings better measure firm performance than cash flows do. Accruals,
however, are imprecise since they are based on assumptions and estimates concerning the
amounts, timing, and uncertainty of unrealized future cash flows. Dechow and Dichev argue that
the quality of accruals and earnings is negatively associated with the magnitude of estimation
errors in accruals. They develop an empirical measure of accrual quality as the standard
deviation of the residuals from firm-specific regressions of changes in working capital on past,
present, and future cash flows from operations. Francis, LaFond, Olsson, & Schipper (2004) find
that among seven investigated earnings attributes, accrual quality is “the dominant attribute in
terms of cost of equity effects” (p. 1006). They propose that accrual quality has the most direct
link of any accounting measure to information risk as it captures variation in pay-off structures
that investors are interested in.
To construct the e-loading measure, Ecker et al. (2006) begin by measuring accrual
quality using the modified Dechow-Dichev (2002) model:
TjTjjTjj
TjjTjjTjjjTj
PPEREV
CFOCFOCFOTCA
,,,5,,4
1,,3,,21,,1,0,
(1)
In equation (1), TCAj,T is firm j’s total current accruals in year T; CFOj,T−1 (CFOj,T, CFOj,T+1) is
firm j’s cash flow from operations in year T−1 (T, T+1); ∆REVj,T is firm j’s change in revenues
between year T−1 and year T; and PPEj,T is firm j’s gross value of property, plant, and equipment
in year T. All variables are scaled by average assets.

18
Ecker et al. estimate equation (1) in annual industry cross-sections for each of the 48
Fama and French (1997) industries that contain at least 20 firms in an industry-year. These
estimations produce firm-year residuals Tj,̂ . The accounting-based earnings quality metric for
firm j in year T is the standard deviation of firm j’s residuals over the past five years,
AQj,T = σ ( Tj,̂ ), T = T−5, …, T−1. Larger (smaller) values of AQj,T correspond to lower (higher)
accrual quality.
Next, Ecker et al. construct an accrual-quality factor-mimicking portfolio. They assign
firms to AQ deciles on the first day of each month m based on the firm’s most recent value of AQ
calculated prior to m. Firms with the smallest (largest) AQ values are placed in the first (tenth)
decile. That is, the first decile comprises firms with the best accrual quality; the tenth decile
comprises firms with the worst accrual quality. They then calculate the average daily return for
each decile. The AQ factor-mimicking portfolio, AQfactor, has returns equal to the difference
between the daily returns of the poorest AQ deciles (deciles 7 to 10) and the best AQ deciles
(deciles 1 to 4). This procedure generates a series of daily AQfactor returns. Finally, they obtain
a firm-year-specific returns-based measure of earnings quality by adding AQfactor to the
traditional one-factor and Fama-French three-factor asset-pricing models as shown below:
tjtTjtFtMTjTjtFtj AQfactoreRRRR ,,,,,,,, )( (2)
tjtTjtTjtTjtFtMTjTjtFtj AQfactoreHMLhSMBsRRRR ,,,,,,,,,, )( (3)
In equations (2) and (3) t is an index denoting the trading day in year T; Rj,t is firm j’s return on
day t; RF,t is the risk-free rate of return on day t; RM,t is the market return on day t; SMBt is the
return of a small-minus-big size factor portfolio on day t; and HMLt is the return of the high-
minus-low book-to-market factor portfolio on day t. The slope coefficient of AQfactor, ej,T
represents firm j’s exposure or sensitivity to information risk related to poor earnings quality in
19
year T. Thus ej,T captures the market’s perception of firm j’s earnings quality in year T. Ecker et
al. refer to ej,T as e-loading. We use e-loading to investigate associations between IPEQ and
ICOFR disclosures.
4.2.2 Controversy over whether accrual quality is a priced risk factor
Our use of e-loading as an IPEQ proxy is immune from controversy in the literature over
whether accrual quality is a priced risk factor because, to the extent that IPEQ is positively
associated with investor confidence and participation in capital markets, regulators are interested
in increasing IPEQ even if it is unassociated with firms’ costs of capital. Nonetheless, we briefly
outline the nature of the controversy.
Core, Guay, & Verdi (2008) say that Francis, LaFond, Olsson, & Schipper’s (2005)
regressions examining contemporaneous relations between firms’ excess stock returns and factor
returns do not test the hypothesis that accrual quality is a priced risk factor. Ecker et al. (2006)
use the similar regressions to derive e-loading. It is debatable whether accruals quality is a priced
risk factor.13 However, Ecker et al. (2006) document e-loading increases in three settings that are
likely to exhibit IPEQ declines: earnings restatements, the instigation of lawsuits against firms,
and bankruptcy filings. Since ICOFR weakness is similar to those three situations in terms of its
likely association with IPEQ, e-loading is an appropriate empirical measure for the purposes of
our study.
4.2.3 H1 and H2 univariate tests
H1 tests compare e-loadings of ICMW firms with those of non-ICD firms that do not
report any internal control problems, whether they be material weaknesses, significant
deficiencies, or control deficiencies. Consistent with Doyle et al. (2007b, p. 1147), the stringent
20
condition for non-ICD firms enhances statistical power by comparing IPEQ of firms reporting
the most serious type of ICOFR weaknesses with IPEQ of firms without apparent weaknesses of
any type.
The non-ICD sample consists of firms matched with ICMW firms on year, industry, and
size to control for confounding factors that are likely to affect IPEQ. To construct the non-ICD
sample we first glean from Audit Analytics a list of ICD firms reporting any type of internal
control problems during 2002 to 2006.14 We obtain matching candidates by deleting the ICD
firms and Doyle et al.’s 1,210 ICMW firms from all the firms with the required Compustat and
CRSP data in each year, 2002-2005. Many firms in the Audit Analytics ICD-list and the Doyle et
al. ICMW-list are duplicates, as expected. Matching firms must have valid industry codes and
total assets in Compustat and have 250 or more daily stock returns in one year in CRSP.15
Of the 709 sample firms, 11 disclose ICMW in 2002, 61 in 2003, 194 in 2004, and 443 in
2005. So, we select 11, 61, 194, and 443 matching sample firms from the candidate pool of the
corresponding year, using four-digit Standard Industrial Classification (SIC) codes, then three-
digit SIC codes, and finally two-digit SIC codes if the more stringent criterion does not identify a
match.16 Among firms in the same year-industry group, we select a matching firm as the one
closest in size to the event firm, as measured by the natural logarithm of total assets (Compustat
data item #6). We collect market return data for the event sample and the matched sample. We
then estimate the firm- and year-specific one-factor and three-factor models (2) and (3) for each
of the ICMW firms and matched non-ICD firms during (0, +270).
Appendix 1 illustrates the event-time periods for testing the four hypotheses. For H1 and
H2, the three-quarter period after the first disclosure of weaknesses is termed the “Bad Period.”
Although it would be desirable to use a full year of daily market return data to reliably estimate
firms’ e-loading, we choose a three-quarter period because Section 404 requires annual audits of
21
companies’ internal control. If they are successful in remediating ICOFR weaknesses, ICMW
firms are likely to receive an unqualified SOX 404 audit report approximately one year after
disclosing them, confounding the measurement of IPEQ in the Bad Period. To avoid these
confounding effects, we choose three quarters instead of one year as the estimation period. For
the same reason, we delete 61 companies receiving their first unqualified SOX 404 audit report
during the three-quarter testing period (0, +270).
The test periods for matched non-ICD firms are the same calendar periods as those for
ICMW firms. For example, if firm j discloses material weaknesses on February 1, 2005 and the
test period (0, +270) is February 1, 2005 to October 29, 2005, we use the same dates for firm j’s
matched counterpart. This research design controls for events affecting all firms in a given
period. Similar to Ecker et al. (2006, p. 757) who require firms to have at least 100 daily returns
in year T to estimate annual e-loading, we require each firm to have at least 100 daily returns in
the three-quarter testing period.
The one-factor model (2) generates AQfactor regression coefficients (i.e., Eload-1f) for
the 709 ICMW firms and 709 matched non-ICD firms. Similarly, the three-factor model (3)
generates 709 e-loadings (i.e., Eload-3f) for both samples. Comparing the mean and median
values of e-loadings in the weakness sample and the matched sample provides preliminary
evidence of whether IPEQ is lower for ICMW firms than non-ICD firms. For both models the
testable hypothesis for H1 is 0 ICDnonICMW ee .
Using the codes provided by Doyle et al. (2007b), we divide the sample used to test H1
into two subsamples: one with severe company-level material weaknesses (CLMW) and the
other with account-specific material weaknesses (ASMW).17 We test H2 A (B) by comparing e-
loadings of CLMW (ASMW) firms with those of the matched firms. For both models the testable
hypothesis for H2A is 0 ICDnonCLMW ee ; that for H2B is 0 ICDnonASMW ee .
22
4.2.4 H1 and H2 multivariate regression tests
Prior literature indicates that, compared with firms not disclosing ICOFR deficiencies,
firms disclosing ICOFR deficiencies tend to be smaller, younger, financially weaker, more
complex, growing more rapidly, and more likely undergoing restructuring. These firm
characteristics are likely to be also associated with IPEQ; moreover, our matching process based
on year, industry, and firm size is unlikely to provide a complete control for firm characteristics.
Thus, in our second tests of H1 and H2, we conduct multivariate regression analyses to control
for firm characteristics that are likely to be associated with firms’ ICOFR weaknesses. In the
regression models, the dependent variable is IPEQ, measured by Eload-1f or Eload-3f; the
explanatory variable is an indicator variable equal to one if a firm is an ICMW (CLMW, or
ASMW) firm and zero if it is a matched non-ICD firm. The control variables include measures
for each of the firm characteristics associated with internal control weaknesses: firm size, firm
age, loss proportion, firm segments, sales growth, and restructuring.
Dechow and Dichev (2002) identify innate firm characteristics that are likely to
determine accrual quality, including firm size, financial health, sales volatility, cash flow
volatility, and operating cycle. As accrual quality is the basis for estimating e-loading, those
innate characteristics are likely to be related to IPEQ. So, we include the control variables sales
volatility, cash flow volatility, and operating cycle in addition to the control variables discussed
above. The resulting regression model is:
IPEQ (Eload-1f or Eload-3f) = β0 + β1 Material Weakness (ICMW, CLMW, or ASMW) + β2 Firm Size + β3 Firm Age + β4 Loss Proportion (4) + β5 Firm Segments + β6 Sales Growth + β7 Restructuring + β8 Sales Volatility + β9 Cash Flow Volatility + β10 Operating Cycle + ε

23
Appendix 2 describes the variables. For H1, the testable hypothesis is β1 > 0 since a higher value
of Eload-1f or Eload-3f indicates lower IPEQ. For H2A, the testable hypothesis is β1 > 0; for
H2B the testable hypothesis is β1 = 0.
4.2.5 H3 and H4 tests
We test H3 by analyzing changes in e-loading over (−270, 0, +270), i.e., three quarters
before and after material weakness disclosures, as shown in Appendix 1. The three pre-
disclosure quarters are termed the “Base Period.” Firms disclosing significant deficiencies and
control deficiencies during the Base Period are excluded from the H3 sample since unfavorable
ICOFR disclosures are likely to taint the measurement of IPEQ. As in the H1 and H2 research
design, the three quarters after the first disclosure of material weaknesses are termed the “Bad
Period.” Each firm must have at least 100 daily returns in both Base and Bad Periods. We test for
e-loading increases (IPEQ declines) in the Bad Period relative to the Base Period using the
following regression models (5) and (6):
One-factor model:
tjtjtt
tjtFtMtFtMtjtFtj
DAQfactoreAQfactore
DRRRRDRR
,,10
,,,1,,0,10,, )()(
(5)
Three-factor model:
tjtjtttjtttjt
ttjtFtMtFtMtjtFtj
DAQfactoreAQfactoreDHMLhHMLhDSMBs
SMBsDRRRRDRR
,,10,10,1
0,,,1,,0,10,, )()(
(6)
In models (5) and (6), the indicator variable Dj,t is equal to 1 for firm-trading-days on or after
ICMW disclosures and 0 before. Thus the coefficient e1 captures IPEQ changes associated with
material weakness disclosures. The testable null H3 is e1 = 0 for both models.
The research design for testing H4 is similar. The indicator variable Dj,t is equal to 1 for
firm trading days on or after remediation disclosures and 0 before. As shown in Appendix 1, the
24
test period covers two three-quarter periods: (1) the “Bad Period” (−270, −1) after firms first
disclose material weaknesses but before they later receive their first clean opinions; and (2) the
“Good Period” (0, +270) after remediation disclosures. Again each firm must have at least 100
daily returns in both the Bad and Good Periods; firms disclosing ICMW under SOX 302 during
the Good Period are excluded since such disclosures are likely to taint the measurement of IPEQ
for the period. In models (5) and (6), the coefficient e1 captures changes in IPEQ associated with
firms making audited remediation disclosures. For both models the testable hypothesis is e1 < 0.
[Insert Table 3]
5. Results
5.1 Descriptive statistics
Table 3 gives descriptive statistics for the material-weakness firms and the year-industry-
size matched non-ICD firms used in multivariate regression tests of H1 and H2. Panel A
compares the characteristics of 642 internal control material weakness (ICMW) firms and
matched firms; Panel B compares the subsample of 226 company-level material weakness
(CLMW) firms with matched firms; Panel C compares 415 account-specific material weakness
(ASMW) firms with matched firms. For each variable, we report the results of differences-in-
means tests (two-tailed t-tests) and differences-in-medians tests (two-tailed Wilcoxon tests).
As expected Panel A shows that the ICMW and matched samples are very similar in size.
Both have mean total assets of about $2.2 billion; neither the t- nor the Wilcoxon test indicates
any significant difference in mean or median firm size. Similar results apply to age, volatility of
cash from operations, and length of the operating cycle; however, firms in the weakness sample
exhibit poorer financial condition measured by the proportion of the most recent three years in

25
which firms report losses. On average, weakness firms report losses in 46% whereas matched
firms report losses in only 32% of the years. In terms of the median loss proportion, at least half
of the weakness firms suffer a loss in one or more of the most recent three years (as the median
of 0.33 implies) whereas at least half of the matched firms do not report such losses. The p-
values of less than 0.001 associated with the t- and Wilcoxon tests imply that these differences
are statistically significant. Compared to firms in the matched sample, weakness firms incur
significantly higher restructuring charges in the most recent two years, have higher sales
volatility, and exhibit more complex organizational structures measured by the number of firm
segments. Weakness firms also exhibit lower median sales growth rates (0.09) than matched
firms (0.12) over the past three years. This finding differs from some findings in prior literature,
likely because we use a matched control sample whereas prior studies use universal control
samples.
Panel B statistics display patterns very similar to those in Panel A: the CLMW firms are
close to their matched counterparts in size, age, operating cash flow volatility, and the length of
operating cycle; the two groups differ in their financial health, organizational complexity
(marginally different), restructuring, and sales volatility; weakness firms have a higher mean
sales growth rate in the most recent three years than the matched firms. In Panel C, besides
exhibiting firm characteristics very similar to those in Panel A, the ASMW firms and their
matched counterparts are similar in organizational complexity and sales volatility. The
descriptive statistics imply that firm matching is likely to control for some but not all firm
characteristics that are likely to be related to IPEQ. Thus, the inclusion of control variables for
multivariate testing seems appropriate.
[Insert Table 4]
26
Table 4 presents a correlation matrix of the dependent and independent variables used in
regression model (4). The dummy explanatory variable ICMW indicating material weakness
disclosure is positively correlated with the dependent variables Eload-1f and Eload-3f, i.e.,
material weakness firms exhibit higher e-loading (lower IPEQ) than non-ICD firms. ICMW is
also correlated with some firm characteristics that prior literature finds to be associated with
ICOFR deficiencies or with firms’ accrual quality: it is positively correlated with the proportion
of loss years, the number of firm segments, restructuring charges, and sales volatility. The latter
four variables are generally correlated with Eload-1f and/or Eload-3f, suggesting that firm
characteristics as well as ICMW are associated with lower IPEQ.
[Insert Table 5]
5.2 Hypothesis testing
5.2.1 H1 and H2 univariate tests
Table 5 presents univariate results of testing H1 and H2. Panel A compares e-loadings of
the whole sample of 709 internal control material weakness (ICMW) firms with e-loadings of
matched firms. Panel A 1 compares the mean e-loadings of the two groups using a t-test. For
ICMW firms the mean of e-loadings from the one-factor (three-factor) model is 0.401 (0.323)
and that for the matched firms is 0.283 (0.199). The difference of 0.11918 (0.124) is significantly
greater than zero with a t-statistic of 3.78 (3.58) and a one-tailed p-value less than 0.001 (0.001).
Panel A 2 compares the median e-loadings between the same two groups of firms using
Wilcoxon tests. The results are similar to the t-test results but median e-loadings are smaller than
mean e-loadings. These univariate tests provide preliminary evidence supporting H1: firms
27
disclosing material weaknesses have lower IPEQ than firms not disclosing any internal control
problems.
Panel B compares e-loadings of 250 company-level material weakness (CLMW) firms
with those of the matched firms. Results are similar to those in Panel A. Panel B 1 compares
mean e-loadings. The mean e-loading for CLMW firms from the one-factor (three-factor) model
is 0.513 (0.435) and that for matched firms is 0.323 (0.243). The difference of 0.190 (0.192) is
significantly greater than zero with a t-statistic of 3.41 (3.18) and a one-tailed p-value less than
0.001 (0.001). Results are similar in Panel B 2, which compares median e-loadings. These
univariate tests provide preliminary evidence supporting H2A: firms disclosing company-level
material weaknesses have lower IPEQ than firms not disclosing internal control problems.
Panel C compares the e-loadings of 458 firms disclosing account-specific material
weaknesses (ASMW) with those of the matched firms. We report two-tailed p-values because the
null hypothesis is that there is no difference in IPEQ for ASMW firms and control firms. Panel C
1 shows that the mean one-factor (three-factor) e-loading of ASMW firms exceeds that of
matched firms by 0.079 (0.086). Although the differences are smaller than in Panels A 1 and B 1,
the t-statistics and two-tailed p-values indicate that those differences are significantly different
from zero. Panel C 2 shows similar results with respect to median e-loadings. The univariate
tests thus reject the null hypothesis H2 B. The next section shows that this result vanishes in
multivariate tests, however.
[Insert Table 6]
5.2.2 H1 and H2 multivariate regression tests
Table 6 gives the results of multivariate regression tests. We perform six regressions with
Eload-1f and Eload-3f as the two dependent variables in each of the three samples containing

28
642 ICMW firms, 226 CLMW firms, and 415 ASMW firms with their corresponding matched
non-ICD counterparts. We report one-tailed p-values for the estimated coefficients since all
explanatory variables except the indicator variable ASMW and the intercept have predicted
directional associations with e-loading.
In the first two models used to test H1, ICMW is the chief explanatory variable of
interest. Consistent with prior literature, Firm Size and Firm Age are negatively associated with
Eload-1f and Eload-3f, indicating higher e-loading (lower IPEQ) for smaller and younger firms.
Also in line with prior studies, Restructuring, Loss Proportion, and Operating Cycle are
positively associated with Eload-1f and Eload-3f, reflecting higher e-loading (lower IPEQ) for
firms incurring higher restructuring charges, having higher proportions of loss years, and having
operating with longer cycles. The variables Firm Segments, Sales Volatility, and Cash Flow
Volatility do not have uniformly significant coefficients but any significant coefficients have the
expected signs, indicating lower IPEQ for firms with more complex organizational structures and
with higher volatility in sales and operating cash flows. The control variable Sales Growth does
not exhibit statistically significant coefficients in either model. The coefficient of ICMW is 0.05
in both the one- and three-factor models. It has the expected positive sign and is statistically
significant but the result is marginal in the three-factor model. Thus H1 is supported, although
modestly in the three-factor model: firms disclosing material weaknesses exhibit higher e-
loading (lower IPEQ) after controlling for firm characteristics.
The third and fourth models investigate H2 A regarding firms disclosing company-level
material weaknesses; CLMW is the chief explanatory variable of interest. Results are similar to
those in the two preceding models except that some control variables — including Restructuring,
Operating Cycle, and Cash Flow Volatility — lose their statistical significance. Firm Size and
Firm Age are still significantly negatively associated with e-loading; Loss Proportion is still

29
significantly positively associated with e-loading. CLMW exhibits positive and significant
coefficients in both models, supporting H2 A: firms disclosing company-level material
weaknesses have lower IPEQ than firms not disclosing any internal control deficiencies.
Compared with the coefficients of ICMW, those of CLMW are larger (0.11 and 0.09 versus 0.05
and 0.05 in the one- and three-factor models, respectively) and have higher significance levels
(smaller one-tailed p-values of 0.02 and 0.06 versus 0.04 and 0.09 in the one- and three-factor
models, respectively). This comparison indicates that company-level material weaknesses are
likely to have a greater negative association with IPEQ than general weaknesses have.
The last two regression models test H2B pertaining to firms disclosing account-specific
material weaknesses. The estimated coefficient of ASMW, the chief explanatory variable of
interest, is 0.02 in both models; two-tailed p-values 0.54 and 0.63 indicate that this is not
significantly different from zero. Thus we do not reject the null H2B: there is no significant
difference in IPEQ for firms disclosing account-specific material weaknesses and IPEQ for firms
not disclosing any internal control deficiencies. This result implies that the rejection of H2B in
the univariate analysis in the previous section of the paper can be attributed to differences in firm
characteristics. It also suggests that the significant results regarding material weaknesses in
general, which were found in the first two regression models, are attributable to disclosures of
the more severe company-level weaknesses.
[Insert Table 7]
5.2.3 H3 and H4 tests
Table 7 contains the results of testing within-firm IPEQ changes following ICOFR
weakness and remediation disclosures. Panel A gives the results of testing H3 following initial
weakness disclosures. The coefficient e1 from the one-factor (three-factor) model is 0.01 (0.02)

30
with t-statistic of 0.54 (0.56) and an insignificant two-tailed p-value of 0.59 (0.58). Adjusting for
firm-level clusters yields qualitatively the same results. Thus the null H3 is not rejected: firms
initially making SOX-mandated ICOFR disclosures of material weaknesses do not exhibit
changes in IPEQ, consistent with investors having anticipated firms’ ICOFR weaknesses before
the SOX-mandated disclosures. Panel B gives the results of testing H4 regarding remediation
disclosures using one-tailed p-values since the hypothesis is directional. The coefficient e1 from
the one-factor (three-factor) model is −0.07 (–0.06); this is significantly less than zero with a t-
statistic of −2.51 (–1.87) and a one-tailed p-value of 0.01 (0.03). Adjusting for firm-level clusters
yields still-significant but slightly weaker results. Overall, H4 is supported: firms’ IPEQ
increases after they receive their first clean Section 404 opinions subsequent to prior weakness
disclosures.
6. Summary and conclusions
We find that US firms disclosing SOX-mandated material weaknesses in internal control
over financial reporting (ICOFR) exhibit lower investor-perceived earnings quality (IPEQ) than
firms not disclosing internal control deficiencies. After controlling for firm characteristics,
however, we find that only company-level material weaknesses, as opposed to account-specific
material weaknesses, are likely to be responsible for this association. We do not find any
evidence of changes in IPEQ after firms first disclose material weaknesses. This result suggests
that, on average, investors anticipate firms’ ICOFR deficiencies based on observable firm
characteristics and are not surprised by the disclosures. In contrast, firms exhibit IPEQ increases
after receiving their first unqualified SOX 404 audit reports signaling the remediation of
previously reported ICOFR weaknesses.
31
The results are germane to public-policy debates about the costs and benefits of SOX-like
internal control provisions both in the US and elsewhere. The study provides evidence consistent
with the existence of benefits stemming from SOX internal control provisions aimed at
enhancing investor confidence in financial reporting reliability. Potential benefits include
enhancing investor participation in capital markets and improving capital allocation efficiency.
As is often the case in public policy studies, however, empirical evidence consistent with the
existence of such benefits does not facilitate quantifying the benefits in dollar terms and
comparing them with the associated costs. Whether hard-to-quantify benefits justify the costs is
for regulators to decide.
A key SOX goal is to enhance investor confidence in financial reporting reliability. The
finding that company-level material weaknesses are negatively associated with IPEQ lends
support to regulators’ conviction that sound internal control systems foster investor confidence in
firms’ financial reporting reliability. Legislative benefits are unlikely to stem from incremental
information conveyed by initial weakness disclosures, however. Rather, the disclosures benefit
investors by motivating managers to remediate ICOFR weaknesses and providing a venue for
firms to make credible, audited remediation disclosures, thereby enhancing investors’ perception
of the reliability of financial reporting.
The study has several limitations. First, we do not find evidence consistent with the
existence of such benefits relating to the disclosure of account-specific material weaknesses.
Whether this implies that there are not any benefits or our research design is not powerful
enough to detect evidence consistent with such benefits is an issue left for future work. Second,
we use e-loading to capture the concept of investor-perceived earnings quality. Ecker et al.
(2006) suggest that e-loading is an appropriate measure of IPEQ even though it may not be a
priced risk factor; however, to the extent that e-loading does not capture the concept effectively,

32
our findings should be interpreted with caution. Finally, the material-weakness disclosures
examined in this study occurred during August 2002 to October 2005 and the remediation
sample comprises large, accelerated SEC filers. Whether the findings can be generalized beyond
the sample period and the sample firms is not clear. Future research could examine whether
similar results hold for smaller firms when audit data become available for non-accelerated filers
in 2010.
33
Endnotes
1 AS No. 5 superseded AS No. 2 in 2007. We cite AS No. 2 because it was effective during the period examined.
2 An accelerated SEC filer is one meeting four conditions: (i) it has a worldwide market value of at least $75 million
on the last business day of its most recently completed second fiscal quarter; (ii) it is subject to the requirements of
section 13(a) or 15(d) of the Securities Exchange Act of 1934 for a period of at least twelve calendar months; (iii) it
has filed at least one annual report pursuant to section 13(a) or 15(d) of the Act; and (iv) it is ineligible to use Forms
10-KSB and 10-QSB for its annual and quarterly reports (Securities Exchange Act of 1934, Rule 12b-2). For non-
accelerated filers, Section 404 is effective for fiscal years ending on or after December 15, 2007 for management’s
assessment report; the auditor’s attestation report is not required until fiscal years ending on or after June 15, 2010
(SEC, 2009b).
3 A significant deficiency is a control deficiency, or combination of control deficiencies, that adversely affects the
company's ability to initiate, authorize, record, process, or report external financial data reliably in accordance with
generally accepted accounting principles such that there is more than a remote likelihood that a misstatement of the
company's annual or interim financial statements that is more than inconsequential will not be prevented or detected
(AS No. 2, paragraph 9). A control deficiency exists when the design or operation of a control does not allow
management or employees, in the normal course of performing their assigned functions, to prevent or detect
misstatements on a timely basis (AS No. 2, paragraph 8).
4 Other performance measures include dividends, cash flows, and EBITDA (Earnings Before Interest, Taxes,
Depreciation, and Amortization).
5 It is unclear whether the lower market returns stem from spikes in information risk, expected ICOFR remediation
costs to be incurred by the firms, or investors’ concern about management’s ability to control the business.
6 See http://faculty.washington.edu/geweili/ICdata.html and http://www.business.utah.edu/display.php?module
=facultyDetails&personPageId=3374&personId=1373&orgId=962&fromOrg=962.
7 See http://faculty.fuqua.duke.edu/~fecker/EFKOS_2006.htm. The most recent AQfactor data for 2006 were
obtained directly from the authors.
34
8 See http://mba.tuck.dartmouth.edu/pages/faculty/ken.french/data_library.html.
9 We use a slightly longer period for the Audit Analytics search to allow for Audit Analytics recording the event
after October 2005, the ending point of Doyle et al. (2007b) sample.
10 Reasons for discrepancies include: 1. Audit Analytics does not include Forms 8K, which are important sources of
companies’ initial disclosure of material weaknesses. 2. Audit Analytics does not collect a complete set of Forms
10K/A or 10Q/A for some companies. 3. The Audit Analytics data contain coding errors. 4. The Doyle et al. dataset
contains some event-date errors due to manual collection; however, event-dates errors have little, if any, negative
impact on the results of that study because it uses several years of annual accounting data to investigate firms’
accrual quality; hence, the results are not sensitive to within-year event-dates.
11 Errors in the dates of companies’ first disclosure of ICOFR weakness under SOX are evidently common. For
example, Ashbaugh-Skaife et al. obtain an initial sample of ICOFR deficiency firms from Compliance Week.
Approximately 39% of their sample firms disclose an internal control problem in an SEC document filed before the
one reported in Compliance Week (Ashbaugh-Skaife, Collins, & Kinney, 2007, p. 177).
12 Beneish et al. (2008) use e-loading as a criterion to construct the matched sample. They do not apply e-loading to
directly test perceived earnings quality.
13 Kim and Qi (2010) show that accrual quality is a market priced risk factor using the same technique of two-stage
cross-sectional regression tests that Core et al. (2008) use, after controlling for low-priced stocks.
14 ICD firms during 2006 are collected to avoid matching an event firm disclosing ICMW in late 2005 with a firm
that discloses ICD in early or mid 2006 but not in previous years. As e-loading after disclosure of ICMW is
measured using daily stock return data three quarters immediately after the disclosure, a firm with an ICD disclosure
in early or mid 2006 does not qualify as a clean firm that can be matched with a firm disclosing ICMW in late 2005.
15 The number 250 is chosen because we require at least 100 daily return data in three quarters to calculate e-
loadings for matched firms and statistics show that in each year of 2002 to 2005, approximately 95% of all the non-
ICD firms meeting the Compustat data requirement and covered by the CRSP Daily Stock File have 252 daily stock
35
returns. We subjectively choose 250 to allow firms that miss only one or two days of return data in one year to
qualify as a matching candidate.
16 Of the 709 sample firms, 693 firms are matched on four-digit SIC codes, 7 firms three-digit SIC codes, and 8
firms two-digit SIC codes. One firm with SIC code 4100 (transit and passenger transportation) does not have a two-
digit match. We match it to firms with a two-digit code of 40 (railway service), which is in the same Fama-French-
48-industry group as 41.
17 One sample firm used in H1 is excluded from H2 testing due to lack of the weakness severity code.
18 The difference between the one-factor mean e-loading of ICMW firms and that of matched firms is 0.119 instead
of 0.118 (0.401–0.283) in Panel A due to rounding. Similar situations are marked “§” in Panels B and C.
36
References
American Electronics Association. (2005, February). Sarbanes-Oxley Section 404: The 'Section' of unintended consequences and its impact on small business. http://www.aeanet.org/governmentaffairs/AeASOXPaperFinal021005.asp.
Ashbaugh-Skaife, H., Collins, D. W., & Kinney, W. R. (2007). The discovery and reporting of internal control deficiencies prior to SOX-mandated audits. Journal of Accounting and Economics , 44, 166-192.
Ashbaugh-Skaife, H., Collins, D. W., Kinney, W. R., & LaFond, R. (2008). The effect of SOX internal control deficiencies and their remediation on accrual quality. The Accounting Review , 83 (1), 217-250.
Ashbaugh-Skaife, H., Collins, D. W., Kinney, W. R., & LaFond, R. (2009). The effect of SOX internal control deficiencies on firm risk and cost of equity. Journal of Accounting Research , 47 (1), 1-43.
Atkins, P. S. (2005, February 16). Remarks before the Economis Club of Memphis. Speech by SEC Commissioner , http://www.sec.gov/news/speech/spch021605psa.htm.
Bédard, J. (2006). Sarbanes Oxley Internal Control Requirements and Earnings Quality. Working paper, Université Laval .
Beneish, M. D., Billings, M. B., & Hodder, L. D. (2008). Internal control weaknesses and information uncertainty. The Accounting Review , 83 (3), 665-703.
Biddle, G. C., Seow, G. S., & Siegel, A. F. (1995). Relative versus incremental information content. Contemporary Accounting Research , 12 (1), 1-23.
Bryan, S., & Lilien, S. (2005). Characteristics of firms with material weaknesses in internal control: An assessment of Section 404 of Sarbanes Oxley. Working paper, Wake Forest University .
Cahan, S. (1992). The effect of antitrust investigations on discretionary accruals: A refined test of the political cost hypothesis. The Accounting Review , 67, 77-95.
Chen, S., Shevlin, T., & Tong, Y. H. (2007). Does the pricing of financial reporting quality change around dividend changes? Journal of Accounting Research , 45 (1), 1-40.
Core, J. E., Guay, W. R., & Verdi, R. (2008). Is accruals quality a priced risk factor? Journal of Accounting and Economics , 46 (1), 2–22.
Dechow, P. M., & Dichev, I. D. (2002). The quality of accruals and earnings: The role of accrual estimation errors. The Accounting Review , 77 (s-1), 35-59.
Degeorge, F., Patel, J., & Zeckhauser, R. (1999). Earnings management to exceed thresholds. Journal of Business , 72 (1), 1-33.
Doss, M., & Jonas, G. (2004, October). Section 404 reports on internal control: Impact on ratings will depend on nature of material weaknesses reported. Moody's Investors Service, Global Credit Research.
Doyle, J., Ge, W., & McVay, S. (2007a). Determinants of weaknesses in internal control over financial reporting. Journal of Accounting and Economics , 44, 193-223.
Doyle, J., Ge, W., & McVay, S. (2007b). Accruals quality and internal control over financial reporting. The Accounting Review , 82 (5), 1141-1170.
Easley, D., & O'Hara, M. (2004). Information and the cost of capital. Journal of Finance , 59, 1553-1583.

37
Ecker, F., Francis, J., Kim, I., Olsson, P. M., & Schipper, K. (2006). A returns-based representation of earnings quality. The Accounting Review , 81 (4), 749-780.
Fama, E., & French, K. (1997). Industry costs of equity. Journal of Financial Economics , 43, 153-193.
Financial Executives International. (2005, April). Comments of the committee on corporate reporting submitted to the SEC roundtable on implementation of internal control reporting provisions. http://www.sec.gov/spotlight/soxcomp/soxcomp-brod.pdf.
Francis, J., LaFond, R., Olsson, P. M., & Schipper, K. (2004). Cost of equity and earnings attributes. The Accounting Review , 79 (4), 967-1010.
Francis, J., LaFond, R., Olsson, P. M., & Schipper, K. (2005). The market pricing of accruals quality. Journal of Accounting & Economics , 39, 295-327.
Francis, J., Schipper, K., & Vincent, L. (2003). The relative and incremental explanatory power of earnings and alternative (to earnings) performance measures for returns. Contemporary Accounting Research , 20 (1), 121-164.
Fudenberg, K., & Tirole, J. (1995). A theory of income and dividend smoothing based on incumbency rents. Journal of Political Economy , 103, 75-93.
Garrett, S., & Adler, J. (2009). Garrett/Adler Amendment. http://www.house.gov/apps/list/speech/financialsvcs_dem/ipa_garrett_adler.pdf and http://adler.house.gov/index.php?option=com_content&task=view&id=343&Itemid=59 .
Ge, W., & McVay, S. (2005). The disclosure of material weaknesses in internal control after the Sarbanes-Oxley Act. Accounting Horizons , 19 (3), 137-158.
Graham, J. R., Harvey, C. R., & Rajgopal, S. (2005). The economic implications of corporate financial reporting. Journal of Accounting and Economics , 40, 3-73.
Hammersley, J. S., Myers, L. A., & Shakespeare, C. (2008). Market reactions to the disclosure of internal control weaknesses and to the characteristics of those weaknesses under Section 302 of the Sarbanes Oxley Act of 2002. Review of Accounting Studies , 13 (1), 141-165.
Healy, P. M. (1985). The effect of bonus schemes on accounting decisions. Journal of Accounting and Economics , 7, 85-107.
Holthausen, R. W., & Verrecchia, R. E. (1988). The effects of sequential information releases on the variance of price changes in an inter-temporal multi-asset market. Journal of Accounting Research , 26 (1), 82-106.
Jones, J. J. (1991). Earnings management during import relief investigation. Journal of Accounting Research , 29 (2), 193-228.
Kim, D., & Qi, Y. (2010). Accruals quality, stock returns, and macroeconomic conditions. The Accounting Review , 85 (3), 937-978.
Knechel, W. R., Salterio, S. E., & Ballou, B. (2007). Auditing assurance & risk. Thomson South-Western.
Krishnan, J. (2005). Audit committee quality and internal control: An empirical analysis. The Accounting Review , 80 (2), 649-675.
Lambert, R., Leuz, C., & Verrecchia, R. E. (2007). Accounting information, disclosure, and the cost of capital. Journal of Accounting Research , 45 (2), 385-420.
Lev, B. (1988). Toward a theory of equitable and efficient accounting policy. The Accounting Review , 63 (1), 1-22.
Liu, J., Nissim, D., & Thomas, J. (2002). Equity valuation using multiples. Journal of Accounting Research , 40 (1), 135-172.

38
Lu, H., Richardson, G., & Salterio, S. (2009). Direct and indirect effects of internal control weaknesses and external audit effort on accruals quality: Evidence from a unique Canadian regulatory setting. Working paper, University of Toronto and Queen's University .
Murphy, K. (1985). Corporate performance and managerial remuneration: An empirical analysis. Journal of Accounting and Economics , 7, 11-42.
Nicolaisen, D. T. (2004, October 7). Keynote speech at 11th annual Midwestern financial reporting symposium. http://www.sec.gov/news/speech/spch100704dtn.htm.
Ogneva, M., Subramanyam, K. R., & Raghunandan, K. (2007). Internal control weakness and cost of equity: evidence from SOX Section 404 disclosures. The Accounting Review , 82 (5), 1255-1297.
Prentice, R. A. (2007). Sarbanes-Oxley: The evidence regarding the impact of Section 404. Cardozo Law Review , 29, 703-763.
Rangan, S. (1998). Earnings management and the performance of seasoned equity offerings. Journal of Financial Economics , 50, 101-122.
SEC. (2009a, September). Study of the Sarbanes-Oxley Act of 2002 Section 404 internal control over financial reporting requirements.
SEC. (2009b, October). Small public companies to begin providing audited assessment of internal controls over financial reporting in nine months. http://www.sec.gov/news/press/2009/2009-213.htm .
Simunic, D. (1980). The pricing of audit services: Theory and evidence. Journal of Accounting Research , 18 (1), 161-190.
Solomon, D., & Bryan-Low, C. (2004, February 10). Companies complain about cost of corporate-governance rules. Wall Street Journal (Eastern edition) , A1.
Statement of Financial Accounting Concepts No. 2. (1980, May). Qualitative Characteristics of Accounting Information.
Teoh, S., Welch, I., & Wong, T. (1998). Earnings management and the underperformance of seasoned equity offerings. Journal of Financial Economics , 50, 63-99.
Verrecchia, R. E. (2001). Essays on disclosure. Journal of Accounting and Economics , 32, 97-180.
Watts, R. L., & Zimmerman, J. L. (1978). Towards a positive theory of the determination of accounting standards. The Accounting Review , 53, 112-134.

39
Appendix 1. Research design H1 & H2 (cross sections) First MW “Bad Period” disclosure
+3 quarters 0 (No unqualified audit report) +270
H3 (time series) “Base Period” First MW “Bad Period” disclosure −3 quarters +3 quarters
-270 (No disclosure of 0 (No unqualified audit report) +270 any other ICD)
H4 (time series)
“Bad Period” First unqualified “Good Period” audit report after MW disclosure −3 quarters +3 quarters
-270 0 (No SOX 302 MW disclosure) +270

40
Appendix 2. Variable definitions
Investor-perceived earnings quality (IPEQ) Eload-1f (Eload-3f) The slope coefficient from a regression of a firm’s daily excess returns in year T on a factor-mimicking portfolio capturing earnings quality, controlling for the factor of market risk premium (three factors of market risk premium, size, and book-to-market ratio). Material weakness disclosure ICMW An indicator variable that is equal to one if the firm discloses at least one internal
control material weakness in the sample period (August 2002 to October 2005), and zero otherwise.
CLMW (ASMW) An indicator variable that is equal to one if the firm discloses a company-level (an account-specific) material weakness in internal control in the sample period, and zero if it makes no disclosure of any type of internal control deficiencies.
Material weakness determinants that could be related to perceived earnings quality Firm Size The natural logarithm of total assets [Compustat #6] in year t. Firm Age The natural logarithm of the number of years the firm has Compustat data as of
year t. Loss Proportion The proportion of years during the past three years (t-2, t-1, and t) that a
firm reports negative earnings [Compustat #18]. Firm Segments The natural logarithm of the sum of the number of operating and geographic
segments reported by the Compustat Segments database for the firm in year t. Sales Growth The geometric average growth rate in sales [Compustat #12] from year t-2 to t.
Restructuring The aggregate restructuring charges [Compustat #376 × (–1)] in t-1 and t, scaled by the firm’s year t market capitalization [Compustat #199 × #25].
Additional innate firm characteristics that affect accruals quality and could be related to perceived earnings quality Sales Volatility The standard deviation of sales [Compustat #12], scaled by average assets
[Compustat #6], from year t-6 to year t, requiring at least three years of data.
Cash Flow Volatility The standard deviation of cash from operations [Compustat #308], scaled by average assets, from year t-6 to year t, requiring at least three years of data.
Operating Cycle The natural logarithm of the average of [360/(sales/average accounts receivable) + 360/(cost of goods sold/average inventory)], calculated from year t-6 to year t, requiring at least three years of data. [accounts receivable: Compustat #2; cost of goods sold: Compustat #41; inventory: Compustat #3]

41
Table 1. Verification of dates of first material weakness disclosures
Panel A. Comparison of dates in Doyle et al. (2007b) vs. Audit Analytics
Number of sample firms in Doyle et al. (2007b) disclosing material weaknesses for the
first time under SOX during August 2002 to October 2005 1,210
Less firms lacking identification information –242
Remaining firms 968
Comparison of dates for remaining firms in Doyle et al. vs. Audit Analytics:
Firms not covered by Audit Analytics 129
Firms have the same event dates 382
Firms with different event dates 457
968
Number of days between disclosure dates for the 457 firms that have different event dates – Audit Analytics event date minus Doyle et al. event date: Mean 82
Minimum –89810th percentile –16025th percentile –10Median 2675th percentile 18190th percentile 386Maximum 1,315
Panel B. Date verification via 10K Wizard
Number of firms whose event dates are verified via 10K Wizard 968
Less firms with erroneous identification information –10
Less firms that disclosed material weaknesses before August 1, 2002 –10
Less firms without disclosure of material weaknesses –4
Total valid firms to form the basis for various hypothesis testing 944

42
Table 2. Sample selection
Initial number of sample firms for testing the undernoted hypotheses
944
H1 and H2: 944
Firms receiving unqualified SOX 404 audit opinions during the three-quarter testing period 61
Firms lacking adequate daily stock return data 147
Firms lacking Compustat data required to construct the matched sample 27 –235
Firms with data required for H1 and H2 univariate tests§ 709
Firms lacking Compustat data for control variables –67
Total sample firms with data required for H1 and H2 multivariate tests§ 642
H3: 944
Firms receiving unqualified SOX 404 audit opinions during the three-quarter testing period 61
Firms disclosing other non-material weaknesses during the three-quarter testing period 120
Firms lacking adequate daily stock return data 147 –328
Total sample firms with data required to test H3 616
H4: 944
Firms that did not receive their first unqualified SOX 404 audit reports during year 2004 to 2006 after disclosing material weaknesses
483
Firms with time lags of less than three quarters between the date of receiving the unqualified audit report and the date of first disclosing weaknesses
57
Firms disclosing material weaknesses again under SOX 302 during the three quarters after receiving unqualified audit reports
11
Firms receiving unqualified audit reports after March 31, 2006 77
Firms lacking adequate daily stock return data 15 –643
Total sample firms with data required to test H4 301
§ As one sample firm of H1 lacks the Doyle et al. (2007b) code of material weakness type, the number of total
sample firms for H2 univariate tests is 708 (250 with company-level weaknesses and 458 with account-specific weaknesses) and for H2 multivariate tests is 641 (226 with company-level weaknesses and 415 with account-specific weaknesses).
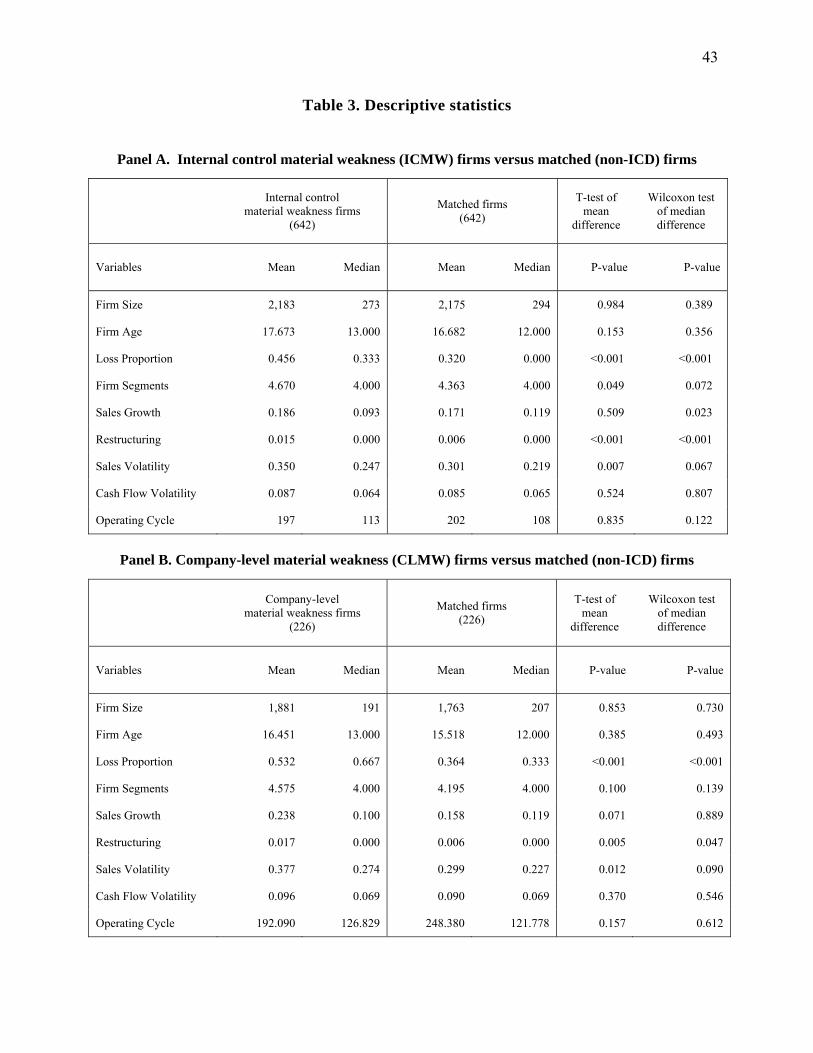
43
Table 3. Descriptive statistics
Panel A. Internal control material weakness (ICMW) firms versus matched (non-ICD) firms
Internal control material weakness firms
(642)
Matched firms (642)
T-test of mean
difference
Wilcoxon test of median difference
Variables Mean Median Mean Median P-value P-value
Firm Size 2,183 273 2,175 294 0.984 0.389
Firm Age 17.673 13.000 16.682 12.000 0.153 0.356
Loss Proportion 0.456 0.333 0.320 0.000 <0.001 <0.001
Firm Segments 4.670 4.000 4.363 4.000 0.049 0.072
Sales Growth 0.186 0.093 0.171 0.119 0.509 0.023
Restructuring 0.015 0.000 0.006 0.000 <0.001 <0.001
Sales Volatility 0.350 0.247 0.301 0.219 0.007 0.067
Cash Flow Volatility 0.087 0.064 0.085 0.065 0.524 0.807
Operating Cycle 197 113 202 108 0.835 0.122
Panel B. Company-level material weakness (CLMW) firms versus matched (non-ICD) firms
Company-level material weakness firms
(226)
Matched firms (226)
T-test of mean
difference
Wilcoxon test of median difference
Variables Mean Median Mean Median P-value P-value
Firm Size 1,881 191 1,763 207 0.853 0.730
Firm Age 16.451 13.000 15.518 12.000 0.385 0.493
Loss Proportion 0.532 0.667 0.364 0.333 <0.001 <0.001
Firm Segments 4.575 4.000 4.195 4.000 0.100 0.139
Sales Growth 0.238 0.100 0.158 0.119 0.071 0.889
Restructuring 0.017 0.000 0.006 0.000 0.005 0.047
Sales Volatility 0.377 0.274 0.299 0.227 0.012 0.090
Cash Flow Volatility 0.096 0.069 0.090 0.069 0.370 0.546
Operating Cycle 192.090 126.829 248.380 121.778 0.157 0.612
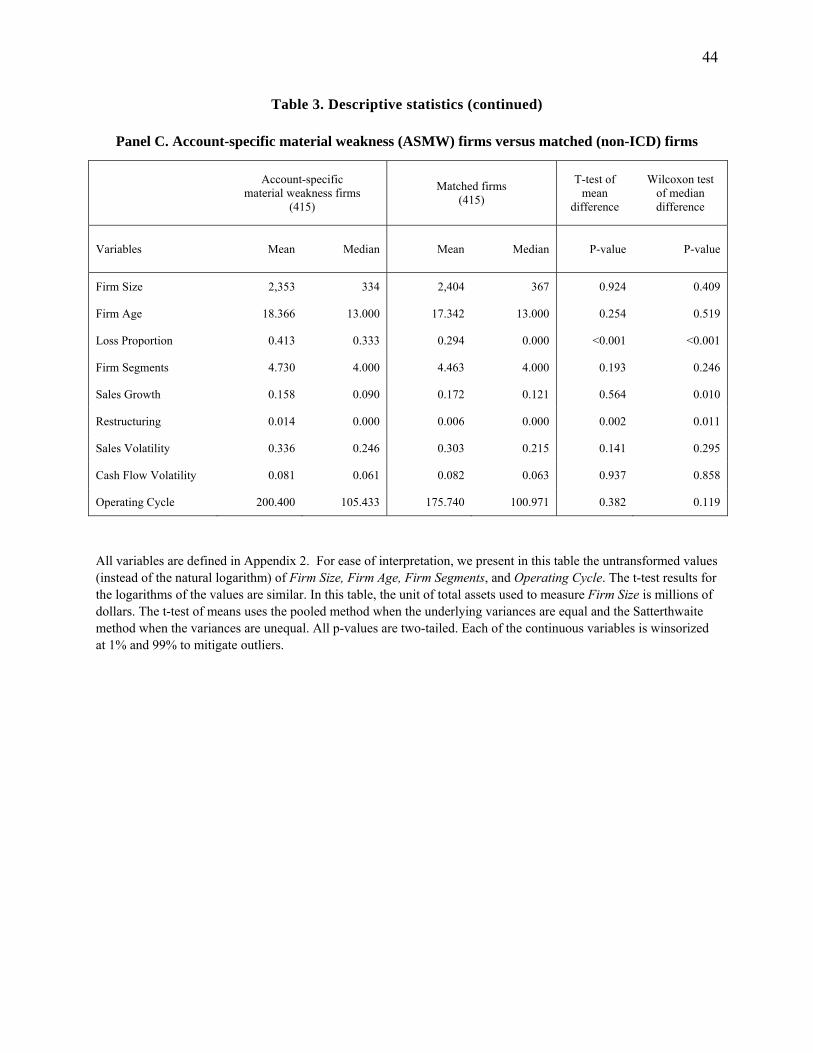
44
Table 3. Descriptive statistics (continued)
Panel C. Account-specific material weakness (ASMW) firms versus matched (non-ICD) firms
Account-specific material weakness firms
(415)
Matched firms (415)
T-test of mean
difference
Wilcoxon test of median difference
Variables Mean Median Mean Median P-value P-value
Firm Size 2,353 334 2,404 367 0.924 0.409
Firm Age 18.366 13.000 17.342 13.000 0.254 0.519
Loss Proportion 0.413 0.333 0.294 0.000 <0.001 <0.001
Firm Segments 4.730 4.000 4.463 4.000 0.193 0.246
Sales Growth 0.158 0.090 0.172 0.121 0.564 0.010
Restructuring 0.014 0.000 0.006 0.000 0.002 0.011
Sales Volatility 0.336 0.246 0.303 0.215 0.141 0.295
Cash Flow Volatility 0.081 0.061 0.082 0.063 0.937 0.858
Operating Cycle 200.400 105.433 175.740 100.971 0.382 0.119
All variables are defined in Appendix 2. For ease of interpretation, we present in this table the untransformed values (instead of the natural logarithm) of Firm Size, Firm Age, Firm Segments, and Operating Cycle. The t-test results for the logarithms of the values are similar. In this table, the unit of total assets used to measure Firm Size is millions of dollars. The t-test of means uses the pooled method when the underlying variances are equal and the Satterthwaite method when the variances are unequal. All p-values are two-tailed. Each of the continuous variables is winsorized at 1% and 99% to mitigate outliers.

45
Table 4. Pearson/Spearman correlation matrix
ICMW Eload-1f Eload-3f
Firm Size
Firm Age
Loss Proportion
Firm Segments
Sales Growth
Restruc-turing
Sales Volatility
Cash Flow Volatility
Operating Cycle
ICMW 0.106 0.097 -0.021 0.029 0.167 0.047 0.018 0.118 0.075 0.018 0.034
(<.001) (<.001) (0.461) (0.302) (<.001) (0.092) (0.509) (<.001) (0.007) (0.524) (0.221)
Eload-1f 0.100 0.865 -0.252 -0.222 0.389 -0.029 0.031 0.162 0.069 0.204 0.070
(<.001) (<.001) (<.001) (<.001) (<.001) (0.297) (0.265) (<.001) (0.013) (<.001) (0.012)
Eload-3f 0.102 0.852 -0.296 -0.207 0.411 -0.015 0.039 0.159 0.020 0.181 0.081
(<.001) (<.001) (<.001) (<.001) (<.001) (0.599) (0.165) (<.001) (0.476) (<.001) (0.004) Firm Size -0.024 -0.278 -0.329 0.208 -0.347 0.243 -0.037 0.039 -0.154 -0.386 0.031
(0.389) (<.001) (<.001) (<.001) (<.001) (<.001) (0.180) (0.165) (<.001) (<.001) (0.275) Firm Age 0.026 -0.254 -0.248 0.190 -0.249 0.192 -0.262 -0.006 -0.102 -0.262 0.000
(0.357) (<.001) (<.001) (<.001) (<.001) (<.001) (<.001) (0.818) (<.001) (<.001) (0.996) Loss Proportion 0.174 0.385 0.418 -0.364 -0.265 -0.012 0.026 0.248 -0.050 0.218 0.105
(<.001) (<.001) (<.001) (<.001) (<.001) (0.667) (0.350) (<.001) (0.074) (<.001) (<.001) Firm Segments 0.050 -0.033 -0.023 0.230 0.158 0.007 -0.084 0.126 -0.080 -0.120 0.141
(0.072) (0.231) (0.416) (<.001) (<.001) (0.810) (0.003) (<.001) (0.004) (<.001) (<.001) Sales Growth -0.063 -0.034 -0.032 0.039 -0.231 -0.182 -0.065 -0.126 0.160 0.221 0.114
(0.023) (0.217) (0.252) (0.161) (<.001) (<.001) (0.020) (<.001) (<.001) (<.001) (<.001) Restructuring 0.090 0.068 0.048 0.178 -0.007 0.182 0.207 -0.196 0.037 0.006 0.032
(0.001) (0.015) (0.088) (<.001) (0.813) (<.001) (<.001) (<.001) (0.183) (0.816) (0.251) Sales Volatility 0.051 0.120 0.075 -0.214 -0.087 -0.046 -0.047 0.206 -0.006 0.267 -0.169
(0.067) (<.001) (0.007) (<.001) (0.002) (0.098) (0.096) (<.001) (0.839) (<.001) (<.001) Cash Flow Volatility 0.007 0.271 0.247 -0.443 -0.287 0.215 -0.129 0.177 -0.083 0.434 0.115
(0.808) (<.001) (<.001) (<.001) (<.001) (<.001) (<.001) (<.001) (0.003) (<.001) (<.001) Operating Cycle 0.043 0.096 0.111 -0.092 0.013 0.132 0.178 0.020 0.042 -0.158 0.113
(0.122) (0.001) (<.001) (0.001) (0.642) (<.001) (<.001) (0.485) (0.129) (<.001) (<.001) All variables are defined in Appendix 2. Pearson correlations are above the diagonal; Spearman correlations below. Each continuous variable is winsorized at 1% and 99% to mitigate the impact of outliers on correlation coefficients. Significant correlation coefficients (two-tailed p-value ≤ 10%) are in bold.

46
Table 5. E-loading comparisons
Panel A. Comparison of e-loadings between internal control material weakness (ICMW) firms and matched firms
Panel A. 1. Comparison of mean e-loadings using the t-test
Model Number of firm pairs
ICMW firms
Matched firms
Difference T-statistic One-tailed
p-value
One-factor 709
0.401 0.283 0.119§ 3.78 <0.001
Three-factor 0.323 0.199 0.124 3.58 <0.001
Panel A. 2. Comparison of median e-loadings using the Wilcoxon test
Model Number of firm pairs
ICMW firms
Matched firms
Difference Z-statistic One-tailed
p-value
One-factor 709
0.275 0.176 0.099 3.52 <0.001
Three-factor 0.190 0.089 0.101 3.64 <0.001
Panel B. Comparison of e-loadings between
company-level material weakness (CLMW) firms and matched firms
Panel B. 1. Comparison of mean e-loadings using the t-test
Model Number of firm pairs
CLMW firms
Matched firms
Difference T-statistic One-tailed
p-value
One-factor 250
0.513 0.323 0.190 3.41 <0.001
Three-factor 0.435 0.243 0.192 3.18 <0.001
Panel B. 2. Comparison of median e-loadings using the Wilcoxon test
Model Number of firm pairs
CLMW firms
Matched firms
Difference Z-statistic One-tailed
p-value
One-factor 250
0.413 0.240 0.173 3.32 <0.001
Three-factor 0.367 0.114 0.252§ 3.19 0.001

47
Table 5. E-loading comparisons (continued)
Panel C. Comparison of e-loadings between account-specific material weakness (ASMW) firms and matched firms
Panel C. 1. Comparison of mean e-loadings using the t-test
Model Number of firm pairs
ASMW firms
Matched firms
Difference T-statistic Two-tailed
p-value
One-factor 458
0.339 0.260 0.079 2.10 0.04
Three-factor 0.262 0.175 0.086§ 2.06 0.04
Panel C. 2. Comparison of median e-loadings using the Wilcoxon test
Model Number of firm pairs
ASMW firms
Matched firms
Difference Z-statistic Two-tailed
p-value
One-factor 458
0.222 0.157 0.065 1.92 0.06
Three-factor 0.129 0.074 0.054§ 2.16 0.03
§ In Panel A, the difference between the one-factor mean e-loading of ICMW firms and that of matched firms is 0.119 instead of 0.118 (0.401–0.283) due to rounding. Similar situations are marked in Panels B and C. E-loading is the estimated coefficient of AQfactor, i.e., ej,T , for each weakness firm (or each matched non-internal control deficiency firm) during the test period covering three quarters after disclosure of material weaknesses, i.e., (0, +270), from the following one-factor and three-factor regression models:
tjtTjtFtMTjTjtFtj AQfactoreRRRR ,,,,,,,, )(
tjtTjtTjtTjtFtMTjTjtFtj AQfactoreHMLhSMBsRRRR ,,,,,,,,,, )(
where t = index for the trading day in the testing period; j = index for firm j; Rj,t = firm j’s return on day t; RF,t = the risk-free rate of return on day t; RM,t = the market return on day t; SMBt = return of the small-minus-big factor-mimicking portfolio on day t; HMLt = return of the high-minus-low book-to-market factor-mimicking portfolio on day t; AQfactort = return of the poor-minus-good accruals quality factor-mimicking portfolio on day t.
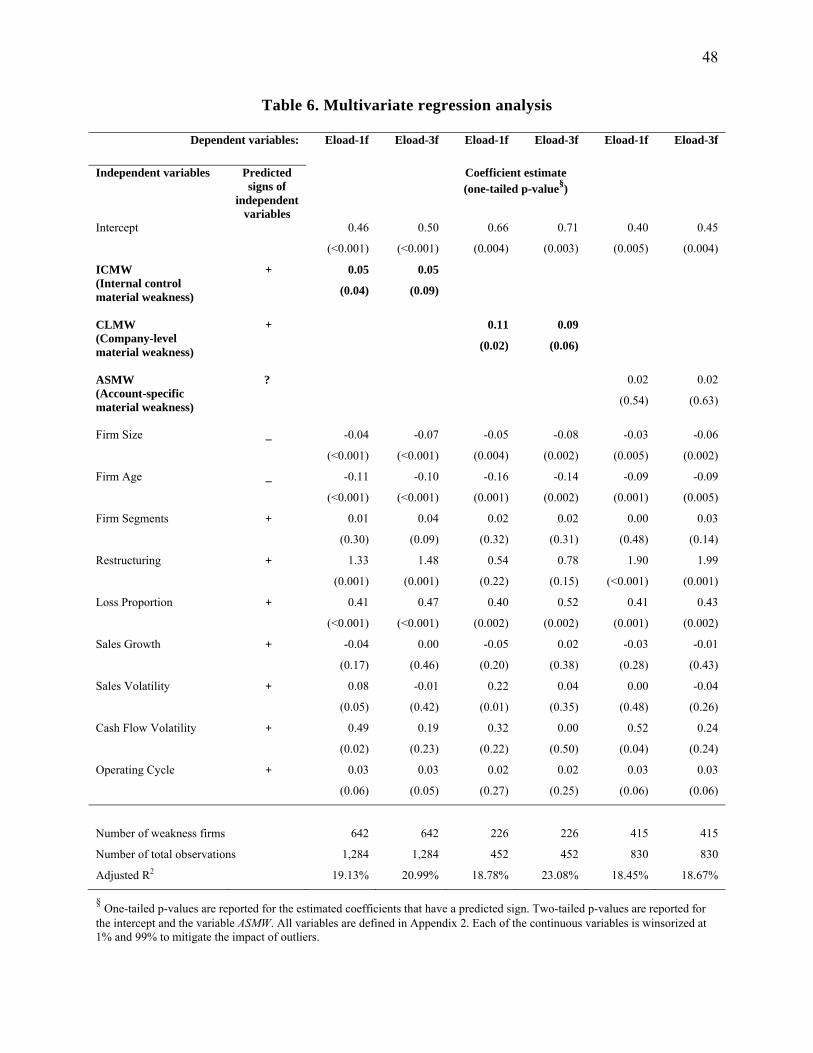
48
Table 6. Multivariate regression analysis
Dependent variables:
Eload-1f Eload-3f Eload-1f Eload-3f Eload-1f Eload-3f
Independent variables Predicted signs of
independent variables
Coefficient estimate (one-tailed p-value§)
Intercept 0.46 0.50 0.66 0.71 0.40 0.45
(<0.001) (<0.001) (0.004) (0.003) (0.005) (0.004)
ICMW (Internal control material weakness)
+ 0.05 0.05
(0.04) (0.09)
CLMW (Company-level material weakness)
+ 0.11 0.09
(0.02) (0.06)
ASMW (Account-specific material weakness)
? 0.02 0.02
(0.54) (0.63)
Firm Size _ -0.04 -0.07 -0.05 -0.08 -0.03 -0.06
(<0.001) (<0.001) (0.004) (0.002) (0.005) (0.002)
Firm Age _ -0.11 -0.10 -0.16 -0.14 -0.09 -0.09
(<0.001) (<0.001) (0.001) (0.002) (0.001) (0.005)
Firm Segments + 0.01 0.04 0.02 0.02 0.00 0.03
(0.30) (0.09) (0.32) (0.31) (0.48) (0.14)
Restructuring + 1.33 1.48 0.54 0.78 1.90 1.99
(0.001) (0.001) (0.22) (0.15) (<0.001) (0.001)
Loss Proportion + 0.41 0.47 0.40 0.52 0.41 0.43
(<0.001) (<0.001) (0.002) (0.002) (0.001) (0.002)
Sales Growth + -0.04 0.00 -0.05 0.02 -0.03 -0.01
(0.17) (0.46) (0.20) (0.38) (0.28) (0.43)
Sales Volatility + 0.08 -0.01 0.22 0.04 0.00 -0.04
(0.05) (0.42) (0.01) (0.35) (0.48) (0.26)
Cash Flow Volatility + 0.49 0.19 0.32 0.00 0.52 0.24
(0.02) (0.23) (0.22) (0.50) (0.04) (0.24)
Operating Cycle + 0.03 0.03 0.02 0.02 0.03 0.03
(0.06) (0.05) (0.27) (0.25) (0.06) (0.06)
Number of weakness firms 642 642 226 226 415 415
Number of total observations 1,284 1,284 452 452 830 830
Adjusted R2 19.13% 20.99% 18.78% 23.08% 18.45% 18.67%
§ One-tailed p-values are reported for the estimated coefficients that have a predicted sign. Two-tailed p-values are reported for
the intercept and the variable ASMW. All variables are defined in Appendix 2. Each of the continuous variables is winsorized at 1% and 99% to mitigate the impact of outliers.

49
Table 7. Within-firm changes in e-loading
Panel A. After disclosure of internal control material weaknesses
Model Number of firms
Coefficient e1
T-statistic Two-tailed
p-value
Adjusted for firm clusters
T-statistic Two-tailed
p-value
One-factor 616
0.01 0.54 0.59 0.39 0.70
Three-factor 0.02 0.56 0.58 0.38 0.70
Panel B. After disclosure of remediation of internal control material weaknesses
Model Number of firms
Coefficient e1
T-statistic One-tailed
p-value
Adjusted for firm clusters
T-statistic One-tailed
p-value
One-factor 301
−0.07 −2.51 0.01 −1.94 0.03
Three-factor −0.06 −1.87 0.03 −1.70 0.05
The coefficient e1 is estimated during the three quarters prior to and after the internal control disclosure, i.e., (-270, 0, +270), from the following one-factor and three-factor regression models: One-factor model:
tjtjt
tjtFtMtFtMtjtFtj
DAQfactoreAQfactore
DRRRRDRR
,,10
,,,1,,0,10,, )()(
Three-factor model:
tjtjtttjtttjt
ttjtFtMtFtMtjtFtj
DAQfactoreAQfactoreDHMLhHMLhDSMBs
SMBsDRRRRDRR
,,10,10,1
0,,,1,,0,10,, )()(
where t = index for the trading day in the testing period; j = index for firm j; Dj,t = a dummy variable indicating whether a trading day is after (including equal to) the day of disclosure (D=1) or before the day of disclosure (D=0); Rj,t = firm j’s return on day t; RF,t = the risk-free rate of return on day t; RM,t = the market return on day t; SMBt = return of the small-minus-big factor-mimicking portfolio on day t; HMLt = return of the high-minus-low book-to-market factor-mimicking portfolio on day t; AQfactort = return of the poor-minus-good accruals quality factor-mimicking portfolio on day t.