the impact of divestiture experience on divestiture types ... · the impact of divestiture...
TRANSCRIPT
The Impact of Divestiture Experience on
Divestiture Types, Performance, and Use-of-Proceeds*
Mark Humphery-Jenner†
Ronan Powell‡
Emma Jincheng Zhang§
This version: December 2013
Abstract
This paper examines the benefits of learning and experience in divestitures. We
find that serial (i.e., experienced) divestors are more likely to sell non-core,
geographically distant or underperforming units. They are also more likely to time
divestitures during industry merger waves, periods normally associated with
higher firm valuations. Experienced divestors earn higher returns on
announcement, and have stronger operating performance post-divestiture.
Furthermore, experienced divestors tend to reinvest sale proceeds in expansion
programs using acquisitions, which on average, are value-creating. These findings
suggest that divestiture experience can improve divestiture performance. We take
steps to mitigate econometric and sample selection concerns.
Keywords: Serial divestiture; Experience; Divested unit; Industry merger wave; Market
reaction; Operating performance; Use of proceeds; M&A
JEL Classification: D83; G34
* This paper benefited from comments received at Finance Research Network Annual Meeting (2013), 2nd SIRCA Young
Researcher Workshop (2013), the 26th Australasian Finance and Banking Conference (2013) and from seminar participants
at Kobe University, Nanyang Technological University and University of New South Wales. We are grateful for
constructive comments received from Renée Adams, Suman Banerjee, Ray da Silva Rosa, Ying Dou, David Feldman, Wei-
Lin Liu, Ron Masulis, Stefan Petry, Peter Pham, Katherine Uylangco, Terry Walter, Limin Xu and Bohui Zhang. † Australian School of Business, UNSW. Email: [email protected] . Phone: +61 2 9385 1000 ‡ Dublin City University Business School, DCU. Email: [email protected] § Australian School of Business, UNSW. Email: [email protected]
The Impact of Divestiture Experience on
Divestiture Types, Performance, and Use-of-Proceeds
Abstract
This paper examines the benefits of learning and experience in divestitures. We
find that serial (i.e., experienced) divestors are more likely to sell non-core,
geographically distant or underperforming units. They are also more likely to time
divestitures during industry merger waves, periods normally associated with
higher firm valuations. Experienced divestors earn higher returns on
announcement, and have stronger operating performance post-divestiture.
Furthermore, experienced divestors tend to reinvest sale proceeds in expansion
programs using acquisitions, which on average, are value-creating. These findings
suggest that divestiture experience can improve divestiture performance. We take
steps to mitigate econometric and sample selection concerns.
Keywords: Serial divestiture; Experience; Divested unit; Industry merger wave; Market
reaction; Operating performance; Use of proceeds; M&A
JEL Classification: D83; G34
1
1 Introduction
Serial divestors account for a significant portion of divestiture activity. Serial divestors are
popularly seen as financially distressed. A number of high-profile cases, such as those of
American International Group and Royal Bank of Scotland, have cemented this impression. 1
However, serial divestors are not uncommon. Over the last two decades, 68.59% of divestors
had prior divestiture experience in the preceding three years (see Table 1),2 with the average
firm conducting at least 2 divestitures in the prior three years (see Table 2). Focusing on the
top quartile shows that experienced divestors have done 5 divestitures, on average, in the past
three years. This pattern is curious given that divestitures are typically complex and
expensive transactions. Indeed, we know little about the benefits of accumulating divestiture
experience, which raises the question of whether such experience could benefit divestors
through better decisions on which units to divest, and when to divest. Importantly, it raises
the issue of whether experience in conducting divestitures is an important additional factor to
consider when examining the drivers of divestiture performance, and if so, what is the
mechanism-of-action through which it influences performance.
In the area of corporate restructuring, the literature on experience has tended to focus
on takeovers (e.g.,Vermeulen and Barkema, 2001; Zollo and Singh, 2004; Aktas et al., 2009,
2011, 2013). This is not surprising since takeovers are arguably much more visible
transactions, and the linkages between deal experience and success are more obvious. It is
also generally accepted that firms view growth strategies achieved through takeovers as more
rewarding when compared to a strategy of divesting assets that once seemed promising. A
successful divestiture, however, is much more about finding a buyer, and getting the right
price. A key factor in driving successful divestitures is in making the right choice about
which unit to divest, while ensuring that future capabilities are not diminished so that the firm
can remain competitive and profitable. Optimal timing is also important in helping to
maximize the return to shareholders. These are skills that one would expect a firm to obtain
through experience.
We examine whether more experienced divestors (‘serial divestors’ hereafter) deliver
better outcomes for the firm and for shareholders. We hypothesize that in undertaking prior
1 AIG has divested over USD 50 billion in a series of divestitures since 2008: http://www.bloomberg.com/news/2010-10-
29/aig-s-divestitures-pass-50-billion-with-aia-initial-share-offering-table.html. RBS has halved its assets since its bailout:
http://www.bloomberg.com/news/2013-07-22/rbs-at-less-than-break-even-valuation-discredits-osborne.html 2 This paper focuses on divestitures in a narrow sense, defined as asset sales of divisions and subsidiaries to another firm.
Spin-offs (i.e., the tax-free distribution of the subsidiary’s shares to its own shareholders) and equity carve-outs (i.e., partial
IPOs where a percentage of the subsidiary’s equity is sold to the public stock market) are not considered.
2
divestitures, firms gain valuable experience which is additional to experience gained through
other activities, including doing takeovers. Divestiture experience is likely to be more
important when it comes to strategic and contingency planning (Alvarez et al., 2013), which
is important when deciding which units to divest, when to divest, and which intermediaries to
use to help operationalize the process. More specifically, we analyze the benefits of
experience in divestitures by exploring the nature of the units divested (i.e., core versus non-
core, geographic location and relative performance), and the ability to time the market. We
further test whether experience leads to better divestiture performance in terms of the
divestor’s announcement returns, future operating performance, and sources of improvement
in operating performance (i.e., profitability or/and cost reduction). We then examine how
serial divestors invest divestiture proceeds. We also control for the firm’s experience as an
acquirer in takeover transactions in order to better capture the additional benefits of
divestiture experience.
We use a sample of 5,992 completed divestitures made by 2,301 US public firms in
4,472 firm-years from 1990 to 2011. The sample includes asset sales (of mostly divisions and
subsidiaries), but excludes spin-offs and equity carve-outs. We construct experience measures
based on the number of successful or unsuccessful divestitures that a divestor has done over
the past { } years. This measure is at the firm-level because organizational memory is
preserved even when key organizational members leave (Weick and Gilfillan, 1971), and
persistently shapes top management decision making (Nelson and Winter, 1982).3 We count
divestitures as valid experience whether they are successful or failed (in terms of market
reactions), completed or uncompleted (in terms of deal status), because failed/pending
attempts may also be useful (Harford and Schonlau (2013).4 We control for acquisition
experience, firm and other factors that might influence the nature or the performance of the
divestiture. Given the cross-sectional structure of the data, we also control for both year fixed
effects and industry fixed effects, and cluster standard errors by firm.
The results suggest that serial divestors tend to do more of the types of divestitures
that are both strategic and beneficial to shareholders. Serial divestors tend to sell non-core,
geographically distant or underperforming units. These are precisely the types of units that
can lead to diseconomies of scale and value-destruction in conglomerates. Serial divestors are
3 However, key results also hold using board-level experience measures (see Section 5.7). 4 The results also hold if we restrict experience to completed deals, if we weight experience by market reactions, if we down-
weight distant experience, or if we recode experience to be indicator variables.
3
also more likely to divest during industry merger waves, which based on the M&A literature,
are more likely to attract higher premiums (see Alexandridis et al., 2012).
Consistent with the observed divestiture attributes, we find that serial divestitures
have better performance in that they earn statistically and economically higher divestiture
announcement returns. A one standard deviation increase in 3-year firm experience raises 3-
day cumulative abnormal returns by approximately 32 basis points. We also find that serial
divestors have stronger future operating performance, which tends to arise from increased
revenues as opposed to cost cutting.
Serial divestors also tend to use the proceeds from the divestiture more productively.
We show that they are not only more likely to conduct post-divestiture acquisitions, but more
importantly, value-enhancing acquisitions. The findings are consistent with the view that
serial divestitures are more likely to be motivated for long-term strategic reasons, as opposed
to temporary financial relief.
We take steps to ensure that the results do not merely reflect other alternative
explanations. First, the results are not merely an artefact of distressed companies undertaking
multiple divestitures. This is because experienced divestors do not appear to be financial
distressed, on average, before divestiture, and they tend to improve performance following
the divestiture. Second, the results are not merely a function of firms splitting one larger
divestiture into several transactions. Experienced divestors tend to divest units that are larger
(relative to the parent’s size), suggesting that they are not more likely to split a transaction.
Further, we observe experiential benefits with experience three years prior to the current
transaction, implying that the results do not merely reflect the recording of multiple deals in
the same short time period for what is essentially one transaction. Last, the results are not
biased by significant restructuring events, and cannot be explained by the correction of past
acquisition mistakes and connections with intermediaries. We also take steps to mitigate
concerns of large-loss and large-gain deals, endogeneity, sample selection, and also use
alternative experience measures.
This paper contributes to the literature in two important ways. First, we provide insight
into the nature of serial divestors. We show that serial divestors benefit from the experience
gained over multiple transactions. The experiential benefits of divestiture experience are not
merely an artifact of distressed firms engaging in multiple divestitures (experienced divestors
are less financial distressed) or of firms splitting one large transaction into multiple
transactions to avoid saturating the market (as serial divestors do larger divestitures). The
4
finding that serial divestors are more likely to invest the divestment proceeds on value-
creative future acquisitions further provides some insights on their strategic nature.
Second, we highlight that divestiture experience influences divestiture performance. This
implies that it is an important factor to control for when analyzing divestiture outcomes. This
manifests in experienced divestors obtaining higher market returns and superior operating
performance. It is also associated with stronger post-divestiture acquisition-performance.
Third, we show the mechanism-of-action through which divestiture experience
influences performance – through the choice of units to divest and the timing of those
divestitures.
The remainder of this paper proceeds as follows. Section 2 develops hypotheses and
predictions. Section 3 describes data. Section 4 presents results. Section 5 discusses
robustness checks. Section 6 concludes.
2 Hypotheses and predictions
The overarching hypothesis is that serial divestors make better divestiture decisions.
While it is possible that serial divestors are merely correcting past inefficiencies (e.g., rent
seeking (Rajan et al., 2000), agency problems (Hanson and Song, 2006)), we anticipate that
divestiture experience will convey several benefits for divestors for the following reasons.
First, the theory of managerial shirking (Alchian and Demsetz, 1972) predicts that
serial divestors will make better decisions than ad-hoc divestors or non-divestors.
Divestitures consume significant managerial effort and time. The fact that serial divestors are
active in making arduous decisions and exercising control suggests their managers are less
likely to substitute leisure for effort for (c.f. Jensen and Meckling, 1976). That is, serial
divestors are less likely to suffer from managerial shirking, or have managers whose
objective is to maintain a ‘quiet life’ (Bertrand and Mullainathan, 2003).
Second, divestiture experience can be useful for subsequent divestitures. Serial
divestors tautologically have more opportunities to learn from prior deals; and thus, could
apply this knowledge to facilitate better deal execution in subsequent deals. It is true that the
generalization of experience is harmful when the past situation is different from the current
(Haleblian and Finkelstein, 1999), and heterogeneity in experience impedes learning
(Barkema and Schijven, 2008; Aktas et al., 2013).5 However, the fact that managers of serial
5 In M&A literature, this is the case of CEO hubris or overconfidence (see Billett and Qian, 2008).
5
divestors are more active and possibly less entrenched suggests they are likely to apply the
experience more carefully. The following sub-sections detail the ways in which divestiture
experience could influence the nature of divestitures and their performance.
2.1 Divested units
The first set of hypotheses pertains to the types of units that serial divestors are likely to
divest. We expect divestors with more experience to sell units of lesser importance, in terms
of business-segment, geographic location and relative performance. Prior literature has shown
that divesting these types of units can create value for the divestor. Divesting units of non-
core business lines is beneficial because it enables refocusing and thereby reduces the
diversification discount (Berger and Ofek, 1995; Dittmar and Shivdasani, 2003), improves
investment efficiency (Rajan et al., 2000; Kaiser and Stouraitis, 2001b; Dittmar and
Shivdasani, 2003), strengthens operating performance (John and Ofek, 1995) and deters
hostile takeover attempts (Comment and Jarrell, 1995). As a result, the market reacts more
positively to their announcements (see e.g., John and Ofek, 1995; Dittmar and Shivdasani,
2003). Refocusing geographically could also improve operational efficiency via better
understanding and cooperation and reduced transactions costs. Divesting underperforming
units is directly related to elimination of rent seeking (Scharfstein and Stein, 2000) and
therefore receives more favorable announcement returns (Meyer et al., 1992; Kaiser and
Stouraitis, 2001a). Overall, selection of these peripheral divisions improves divestiture
performance because it increases divisional transparency and eliminates negative synergies
(Eckbo and Thorburn, 2008).
Prediction 1: Serial divestors are more likely to divest non-core, geographically distant or
underperforming units.
2.2 Market timing
We expect that serial divestors optimally time the market by selling during industry merger
waves. Holding other factors constant, selling during a merger wave will deliver higher
premiums (Alexandridis et al., 2012) than selling outside the wave. The expectation that
serial divestors are more likely to divest during a merger wave is based on two facts. First,
serial divestors might be more able to wait for favorable market conditions, to the extent that
6
they are unlikely to be forced by financial distress. Second, asset reallocation is pro-cyclical
(Shleifer and Vishny, 2003; Rhodes–Kropf et al., 2005; Eisfeldt and Rampini, 2006; Yang,
2008). Thus, prior experience of undertaking takeovers may also enable serial divestors to
better time the market. This gives rise to an alternative hypothesis, that serial divestors are
also serial acquirers who continually churn or divest units, particularly during merger waves,
which creates the appearance of wave timing. We directly examine this alternative by
controlling for takeover experience to both examine the role of such experience in driving
divestiture-timing, and to ensure that it does not explain the relationship between divestiture-
experience and divestiture-timing.
Prediction 2: Serial divestors are more likely to divest during industry merger waves.
2.3 Divestiture experience and divestiture performance
The foregoing hypotheses focus on the types and timing of divestitures that serial divestors
are predicted to undertake. These divestiture-characteristics should also manifest themselves
in improved performance, in terms of divestiture announcement returns and post-divestiture
operating performance. The reasons are three-fold. First, serial divestitures may benefit from
the value of waiting, to the extent that they are completed gradually over time and are not
forced by financial distress. Following the logic of real option valuation, more accurate
information reveals itself over time, leading to more informed decision making, and the
probability of the divestiture earning a larger positive net present value. Second, the literature
finds a positive correlation between announcement cumulative abnormal returns (CARs) and
the divestment of peripheral units (e.g., Kaiser and Stouraitis, 2001a; Dittmar and Shivdasani,
2003) and market timing (Alexandridis et al., 2012). Third, such divestitures are generally
associated with improved post-divestiture operating performance (Berger and Ofek, 1995;
John and Ofek, 1995; Datta et al., 2003; Hanson and Song, 2003; Denis and Shome, 2005;
Bauguess et al., 2012) indicating that market expectations on divestiture announcement are,
on average, realized. Thus, we make the following predictions:
Prediction 3a: Serial divestors earn more positive announcement returns.
Prediction 3b: Serial divestors have stronger operating performance after a divestiture.

7
Stronger operating performance can arise from two sources, namely, increases in
gross margin and decreases in operating expense. Successful restructuring is likely to enable
both. However, because we predict that serial divestitures are likely to be part of longer-term
strategic plans, we expect operating gains to materialize more from increases in gross
margins, as opposed to conservative expense savings, which are more likely in divestitures
motivated by financial constraints. This leads to the following prediction.
Prediction 3c: Serial divestors are more likely to strengthen performance via profit
improvement than via cost reduction.
2.4 Divestiture experience and use of proceeds
Apart from types and performance of divestitures, the strategic nature of serial divestitures
may also be reflected on the use of proceeds from sales. We expect that serial divestors will
invest the proceeds in a way that both fulfills their goal of strategic
repositioning/restructuring and benefits shareholders. A value-creating acquisition could
satisfy both requirements. Kaiser and Stouraitis (2001a) find that divestors earn positive
abnormal returns when sale proceeds are reinvested for expansion via acquisitions. Serial
divestors have more experience in restructuring, which should place them in a better position
to engage in value-creating acquisitions. This leads to the following prediction.
Prediction 4a: Serial divestors are more likely to re-invest via acquisitions after a divestiture.
Prediction 4b: On average, post-divestiture acquisitions undertaken by serial divestors
receive more positive market announcement returns.
3 Data
The full sample includes 5,992 completed divestitures made by US public firms from 1990 to
2011. There are 2,301 unique divestors in 4,472 firm-years (as decomposed in column [3] of
Table 1), with some divestors making multiple divestitures in a single year.6 The data are
cross-sectional rather than panel because it is structured by divestiture. The sample size varies
6 The sample includes both repetitive and first-time divestors.
8
across regressions according to data availability for the variables used in the models. The
divestiture announcements are collected from SDC Platinum’s Mergers and Acquisitions
database. These include asset sales (of mostly divisions and subsidiaries), but exclude spin-
offs and equity carve-outs. We are careful to remove duplicate observations (identified by
date announced, buyer’s CUSIP, seller’s CUSIP and divested unit’s CUSIP) and internal
restructuring activities (i.e., target and acquirer have the same CUSIP). Accounting data are
from Compustat (and the Compustat Segment File for divested units’ accounting
information7) and stock data are from CRSP.
Table AI provides definitions of all variables. We define the amount of experience
earned over the past { } years as the natural log of one plus the number of successful
or unsuccessful divestitures that the firm has done over those years. We measure experience
at the firm-level because organizational memory is preserved even when key organizational
members leave (Weick and Gilfillan, 1971), and persistently shapes top management decision
making (Nelson and Winter, 1982).8 Unlike the divestiture sample that focuses on completed
deals only, the experience variables also account for uncompleted deals. This is because there
is no reason to believe firms cannot learn from failed or pending attempts. Similarly, both
value-creative and value-destroying deals are considered because both types can facilitate
learning (see e.g. Harford and Schonlau, Forthcoming). Log transformation ensures outliers
do not drive the results. The results are robust to the construction of experience measures if
we only look at experience earned over completed divestitures, if we weight experience by
divestiture performance, if we down-weight distant experience (i.e., weight experience by
1/ ), or if we use binary variables to indicate if the company has done at least one divestiture
over the past { } years. 9
We also construct deal-related variables motivated by the predictions. These include
indicators of whether the divested unit is non-core, distant and underperforming, respectively;
relative experience of intermediaries engaged by a divestiture; an indicator of whether the
divestiture occurs during an industry merger wave; measures of stock market reactions to
divestiture announcements (i.e., CARs, MARs and RAWs);10
future operating performance
and its decomposition (i.e., gross margin and operating experience as in Dybvig and
7 Since 1977, firms have been required to report information of segments that constitute more than 10% of consolidated
profits, sales or assets. 8 We also calculate experience measures at the board-level for robustness, and confirm that the key results hold (see Section
5.5). 9 Divestiture performance is proxied by one plus the winsorized 3-day CAR and takes values of 0 to 2. 10 Market-adjusted abnormal returns (MARs) and raw-abnormal returns (RAWs) are used because they have the potential of
minimizing biases caused by contaminated event periods (Aktas et al., 2007).
9
Warachka, 2012);11
an indicator of whether the divesting firm conducts future acquisition(s),
and the average stock market reactions to future acquisitions (if any).
We further gather data on control variables that might influence deal selection,
execution or outcomes. The most commonly used controls in the divestiture literature include
lagged firm size, liquidity (Kim, 1998), leverage (Jensen, 1989; Denis and Shome, 2005),
CAPEX, R&D, advertising, operating performance (Denis and Shome, 2005), Tobin’s Q,
level of diversification12
(Denis and Shome, 2005) and entrenchment indices13
(Owen et al.,
2010). We further control for acquisition experience, because firms that do more acquisitions
would endogenously do more divestitures (Kaplan and Weisbach, 1992), and acquisition
experience may also help in accumulating restructuring experience. We also control for
acquisition experience because we want to show that divestiture experience provides
additional strategic benefits that are important to the divestiture decision. Lastly, the M&A
literature has highlighted the importance of investment banks (Bao and Edmans, 2011; Song
et al., 2013) and law firms (Krishnan et al., 2012; Krishnan and Masulis, 2013), so we control
for the experience of these intermediaries during the year before a divestiture.
Table 1 reports the time series of divestitures, divestors and percentages of
experienced divestors. On average, more than half of the divestors in each year have done at
least one divestiture. The time variations reveal some interesting facts.
First, there is some clustering in divestitures (as per Powell and Yawson, 2005, 2007),
and also some evidence that divestitures occur at a similar time to M&A waves. This is
expected because macro-economic and industry factors are likely to be important in
explaining M&As and divestitures, although different factors are likely to drive more or less
of both restructuring events. For example, while demand/supply shocks can increase both
M&As (e.g., through consolidation) and divestiture activity, technological, regulatory and
energy price changes can have opposite effects on both activities (e.g., Coase, 1937; Gort,
1969; Bradley et al., 1988; Jensen, 1993; Mitchell and Mulherin, 1996; Powell and Yawson,
2005). Also, acquisitions are usually followed by divestitures (Kaplan and Weisbach, 1992).
11 While the gross margin in Dybvig and Warachka (2012) is primarily designed for firms selling goods above cost, it does
provide an indication of how efficient a firm is. 12 We use the number of business lines to proxy diversification (as in John and Ofek, 1995). The results are robust to using
the Herfindahl focus index (as in Opler and Titman, 1993) constructed using segment data from the Compustat Segment
File. 13 In the tabulated results, we use the Bebchuk et al. (2009) entrenchment index. We recode missing values to be state
averages, because the six key anti-takeover provisions are enforced and therefore mostly determined by state laws. Doing so
maintains the sample size at 5,992 instead of 4,344. However, we make sure that results are robust to relaxing the
requirement for this variable and to controlling for the un-recoded BCF index, for the Gompers et al. (2003) of 24
governance provisions, or for the presence of a classified board or poison pill (as per Bebchuk and Cohen, 2005). We also
consider additional governance variables in robustness checks (see Section 5.6).
10
Consequently, it is not surprising that the number of divestitures tend to increase with the
occurrence of merger waves over time.14
We mitigate the concern that these experienced
divestors are merely serial acquirers by controlling for the divestor’s acquisition experience
in our multivariate models. We also show that future divestiture experience is not simply
motivated by past acquisition mistakes in robustness checks (see Sub-section 5.1).
Second, the number of divestitures and the percentage of serial divestors have
gradually decreased in recent years. One reason could be that divestitures have become much
more difficult than before due to higher levels of IT integration, shared support services and
joint facilities, third-party issues caused by outsourcing, potential long-term support that may
require country-by country agreements, disruption threatening both sellers and divested units,
negative impacts on sellers’ cost structure and regulatory requirements.15
Another reason
could be the past process of reverse conglomeration has reduced the number of
conglomerates that need divestment.
[Insert Table 1 about here]
Table 2 Panel A contains summary statistics for the main variables. On average, all
divestors have attempted 0.8, 1.5 and 2 divestitures over the last 1, 2, and 3 years,
respectively, before conducting the next divestiture. About 65% and 59% divest non-core and
distant units, respectively. This is consistent with prior findings that non-core units are more
likely to be divested (Schlingemann et al., 1999) and firms tend to adopt a “pecking order”
and divest out-of-state units before those in-state (Landier et al., 2009). However, only 26%
of divested units are underperforming, and about 20% of divestitures are conducted during
industry merger waves. These suggest that divestors do not always divest strategically, which
distinguishes serial divestors and implies the importance of divestiture experience. On
average, the stock market reacts positively to divestiture announcements, which is consistent
with the prior literature (e.g., Alexander et al., 1984; Jain, 1985; Klein, 1986; Hite et al., 1987;
Afshar et al., 1992; Sicherman and Pettway, 1992; Fluck and Lynch, 1999; Dittmar and
Shivdasani, 2003; Eckbo and Thorburn, 2008; Ang et al., 2012). This is theoretically
expected because raising capital by doing a divestiture (as opposed to issuing equity) can
reflect a general desire to not issue equity; and thus, represents a signal that the stock price is
14 The fifth merger wave started in 1990 and ended in 2009, and the sixth merger wave peaked in 2006 (Alexandridis et al.,
2012). 15 “Seven reasons divestitures are harder than you think” Booz Allen Hamilton, June 11, 2013.
11
undervalued (Nanda and Narayanan, 1998). It also reveals investors tend to interpret
divestitures as positive NPV projects. Variables of acquisition experience and divestiture
experience share similar distributions, based on mean, standard deviation and percentiles.
Another observation is that divestors are typically larger firms, with total assets averaging at
$3,181 million. Finally, divestors are not necessarily bad firms according to their pre-
divestiture operating performance and level of managerial entrenchment (captured by the
BCF index).
Table 2 Panel B provides correlations of the main variables. The results are largely
consistent with expectations. Serial divestors tend to divest non-core, geographically distant
and underperforming units; use intermediaries with more experience, encourage more
bidding competition, and are more likely to divest during an industry merger wave. They are
also more experienced in conducting acquisitions, larger in size, and more diversified. Most
importantly, serial divestors tend to have better pre-divestiture operating performance, which
suggests that serial divestitures, on average, are unlikely to be driven by underperformance,
but more for strategic reasons. Lastly, divestiture experience is significantly negatively
correlated with the BCF index. This is consistent with the intuition that firms that are active
in making tough decisions (i.e., divestment in this paper) are usually well-governed firms.
[Insert Table 2 about here]
4 Analysis
This section contains the analysis. We start by investigating the types of divestitures
conducted by serial divestors. These include the nature of units divested, the experience of
intermediaries used, the number of bids received, and the likelihood of market timing. We
then analyze the performance of serial divestitures, including announcement returns and
future operating performance. More specifically, we examine whether serial divestors
improve performance via improved profitability and/or cost reduction. The regression
analysis takes the general form of equation (1):
y ( ) xperience
( ) (1)
16
16 In unreported robustness tests, we also try adding squared experience measures to this equation. We find no evidence of a
quadratic relationship.
12
where y
includes deal-related variables motivated in Section 2, xperience
is a measure of
firm divestiture experience; is a vector of firm-specific control variables described in
Section 3, is a year dummy and ( ) is an industry dummy for firm i being in industry k
and is the error term clustered by firm.
4.1 Do serial divestors divest non-core, geographically distant or
underperforming units?
We first consider whether serial divestors are more likely to divest peripheral units, such as
those that are unrelated to the divestor’s core line of business, geographically distant from the
divestor’s base-of-operations or those that underperform other units in the firm.
Table 3 reports the odds ratios of logit regressions where models [1] to [3], [4] to [6]
and [7] to [9] account for whether the divested unit is non-core, geographically distant and
underperforming, respectively. An odds ratio of greater than (less than) one indicates that a
particular variable increases (decreases) the likelihood of a particular outcome. The odds
ratios of divestiture experience are all greater than one and statistically significant, with larger
magnitudes for more recent experience. For example, a one unit increase in prior-year
divestiture experience would make a divestor 22% more likely to divest non-core units than
core units, and 14% more likely to divest distant units than relatively close units. The odds
ratios of divestiture experience in the underperforming unit regressions (i.e., models [7] to [9])
are particularly large in magnitude.17
According to the odds ratio of 1-year divestiture
experience, underperforming units are more than 4 times more likely to be divested than
outperforming or average units. This highlights the intention of improving performance of
serial divestors.18
Also, odds ratios of diversification in models [1] to [6] are greater than one
and statistically significant. This reveals more diversified firms are more likely to refocus
operationally or geographically.
Another observation is that intermediaries used in transactions are relatively less
influential in unit selection, which mitigates the concern that intermediaries push the sale of
17 The sample size of models [7] to [9] is limited to 221 due to the difficulty in data matching between SDC and Compustat
Segment Files. Since the latter mainly covers significant units that account for more than 10% of consolidated profits, sales,
or assets, the lack of data availability for divested units suggests many of them are small segments (as in Schlingemann et
al., 2002; Chen and Guo, 2005). 18 Admittedly, a firm may transfer costs to segments to be sold so that an improvement in performance can be observed after
a divestiture. We address this problem by requiring an underperforming unit to have worse performance (measured as
segment operating income before depreciation over segment total assets) than the divestor at the consolidation level for
consecutively two years before a divestiture (instead of one year). The odds ratio of 1-year divestiture experience is
significant at a 10% level, while those of 2-year and 3-year divestiture experience become insignificant. However, the
reduction in significance is likely to be caused by the lack of accounting data for the divested segments two years before a
divestiture because the sample size drops from 221 to 127.
13
particular units. In models [1] to [3] and [6] to [9], odds ratios of intermediaries’ experience
are statistically insignificant. In models [4] to [6] they have smaller economic effects (that are
now statistically significant) than divestiture experience (i.e., the absolute values of their
differences with one are small) and are all less than one. That is, better intermediaries are
more likely to be involved in the sale of geographically close units. Prior acquisition
experience is also important, but only for divesting distant units. For non-core and
underperforming units, acquisition experience odds ratios are less than one, and insignificant.
This suggests that divestiture experience provides greater additional strategic benefits,
particularly when it comes to the decision to divest non-core and underperforming units.
Overall, divestors with more experience tend to retain core and well performing divisions and
sell peripheral or disappointing ones.
[Insert Table 3 about here]
4.2 Are serial divestors more likely to time the market?
We analyze the likelihood of market timing by testing whether a divestiture occurs during an
industry merger wave. We follow Harford (2005) in identifying merger waves of the 48 Fama
and French (1997) industry groups.19
There are 32 merger waves over 1990-2011, 26 of
which occurred in 1990s and are identical to those in Harford (2005). Table AII lists the 6
merger waves in 2000s. A divestiture is defined to be ‘in-merger-wave’ if either the seller or
the buyer or both is in an industry experiencing a merger wave when the divestiture is
announced. By definition, this indicator has significant collinearity with year dummies and
industry dummies. So we drop these dummies in the logit regressions of the in-merger-wave
indicator.20
Table 4 contains the odds ratios from logit models that predict the likelihood that the
divestiture occurs during a M&A wave. In Table 4, the odds ratios of divestiture experience
are all greater than one and statistically significant, with larger magnitudes observed with
more recent experience. The results confirm prediction 2 that divestors with more experience
tend to divest during industry merger waves, which has the benefit of divested units receiving
higher premiums due to greater competition during merger waves (Alexandridis et al.,
19 Classification of the 48 industry portfolios using 4-digit SIC code is found at:
http://mba.tuck.dartmouth.edu/pages/faculty/ken.french/Data_Library/det_48_ind_port.html. 20 The number of observations would drop from 5,992 to 3,830 due to collinearity if we include year dummies and industry
dummies. However, odds ratios of divestiture experience would still be greater than one and mostly significant (at a 5% and
10% level for 1-year and 2-year divestiture experience, respectively).

14
2012).21
That is, serial divestors are likely to be engaged in a strategy of judiciously releasing
assets when market opportunities present themselves. The fact that prior acquisition
experience also helps in timing the market is not surprising, because firms with greater
acquisition experience are more likely to understand the dynamics of industry merger waves.
However, given that we control for prior acquisition experience, the relationship between
divestiture experience and timing does not merely reflect recent acquisition experience. Also,
the presence past M&A failures do not predict the level of future divestiture experience (see
Sub-section 5.1). Another observation is that more recent experience matters more.
[Insert Table 4 about here]
4.3 Do serial divestors enjoy better divestiture performance?
4.3.1 Does the market react more positively?
We test whether the stock market responds more positively to divestors with more
experience. We follow Moeller et al. (2005) in using 3-day CARs (measured from days -1 to
+1) to capture the divestor’s stock price reaction to the divestiture announcement. We also
calculate MARs and raw returns, which are likely to minimize biases caused by contaminated
event periods (Aktas et al., 2007). We calculate their benchmark parameters over days -210
to -11 (as per Masulis et al., 2007). 22
The results in Table 5 show that divestiture experience has a positive and statistically
and economically significant effect on market reactions.23
The results are also economically
significant: a one standard deviation increase in 3-year divestiture experience increases CARs,
MARs and raw returns by 32, 36 and 34 basis points, respectively. These results support
prediction 3a and warrant two interpretations. First, serial divestitures are more likely to
deliver long-term benefits, because the market tends to evaluate divestitures based on long-
term expectations rather than short-run financial gains (Montgomery et al., 1984).24
Montgomery et al. (1984) find that strategically-motivated divestitures are likely to be
rewarded by the market while tactical or forced divestitures are likely to be penalized. This is
21 We cannot directly measure premium of divestitures because divested units are most often unlisted. 22 The results are robust to alternative event windows, including (-5, 5), (-3, 3), (-1, 0) and (0, 1). 23 Controlling for the relative deal size also makes sense (as per Klein, 1986). However, it halves the number of observations
(to 3,359) of the market reaction regressions. Thus, we omit it for reported regressions. We confirm that the results are
qualitatively the same with relative deal size included as a control. 24 Divestors’ CARs represent the market’s expectation of better future performance and the price received for the divested
unit (John and Ofek, 1995). We have confirmed (through regressions analysis) that the more positive the CARs, the higher
the levels of future operating performance.
15
consistent with the notion that the stock market is an efficient processor of strategic
information (see e.g., Fruhan, 1979; Strebel, 1983; Arzac, 1986). Second, serial divestitures
are likely to receive higher premiums, because announcement returns can be viewed as a
proxy for premiums received (John and Ofek, 1995; Schwert, 1996; Aktas et al., 2011).
Premiums are determined by the relative value between the buyer’s offer and seller’s market
value of equity (Officer, 2003). Higher premiums imply an increase in the market value of
the seller’s equity, and therefore a positive abnormal return around the announcement date.
This is confirmed by Clubb and Stouraitis (2002) that sellers’ CARs are positively correlated
with profit on a sale, even after controlling for sell-off motivation, use of sale proceeds and
the presence of agency costs.
The coefficients on the control variables also suggest that larger divestors experience
significantly lower CARs, which is consistent with similar findings of diseconomies of scale
in the M&A literature (see e.g., Moeller et al., 2004). We also find that higher-ranked
intermediaries are associated with higher CARs, which reveals the beneficial role of high-
quality intermediaries in the context of divestitures. Prior acquisition experience is not a
significant determinant of announcement returns, indicating that it is divestiture experience
that matters more to the market when valuing the gains to divestitures.
[Insert Table 5 about here]
4.3.2 Is future operating performance stronger?
The next issue is whether serial divestors also generate stronger future operating performance.
We conduct regressions where the dependent variable is the firm’s industry-adjusted
operating performance. The results are reported in Table 6. The coefficients on the
experience-variables are positive and significant for all measures of operating performance
up to 3 years after a divestiture. This means serial divestors persistently receive stronger
operating performance post-divestiture. So the positive market reaction does not merely
reflect the market’s “belief” that a weak firm is selling assets in order to recapitalize itself.
This provides support for prediction 3b. It is also worth noting that acquisition experience has
no significant relationship with future operating performance. This again suggests that it is
divestiture experience that matters more in delivering real performance improvements. This is
consistent with the hypothesis that divestiture experience brings additional strategic skills that
are important in securing future firm capabilities to remain competitive and profitable.
16
[Insert Table 6 about here]
4.3.3 Does the stronger operating performance arise from profit improvement
or/and cost reduction?
We decompose operating performance into two measures, Rgm (i.e., gross margin) and Rc
(i.e., operating expense), to examine the sources of stronger future performance. The two
measures are proposed by Dybvig and Warachka (2012). While Rgm is primarily designed for
companies with positive margins (i.e. who are not selling goods below cost, on average), it
does provide an indication of how efficient a company is. Both measures are scaled by total
assets and adjusted for industry averages (so industry fixed effects are omitted).
Table 7 Panel A reveals that serial divestors receive significantly higher gross profit
margins after a divestiture, both in the short run and in the relatively long run. Table 7 Panel
B shows regressions of operating expense. The coefficients of divestiture experience are
insignificant.25
Together with the findings of operating performance and gross margins, it
suggests serial divestitures are more likely to be part of strategic plans than motivated by cost
reduction. Also, diversification coefficients are positive and significant, suggesting more
diversified firms have higher operating expenses (including advertising, selling, general and
administrative, staff and rental expenses). Overall, we find divestiture experience to be
associated with higher future gross margins, but it has no significant marginal benefit on
future operating expenses.
[Insert Table 7 about here]
4.4 Are serial divestors more likely to spend the proceeds on value-creating
acquisitions?
Table 8 reports logit regressions of the likelihood of conducting acquisitions within
{ } years after a divestiture. The odds ratios of divestiture experience are all greater
than one and mostly significant at a 1% or 10% level. For example, a one unit increase in
25 The insignificant results are unlikely to be caused by the small sample size, which is caused by the missing values of
compositing variables of operating expense. To confirm this, we omit the one with most missing values (i.e., staff expense)
in computing operating expense, and thereby increase the sample size to 3,356 for models of operating expense in year t+1
(and 3,055 and 2,767 for years t+2 and t+3, respectively). The coefficients of divestiture experience remain insignificant.
17
prior-year divestiture experience would make a divestor 24% more likely to acquire within
one year following the divestiture. This emphasizes the intention of serial divestors to
reinvest the proceeds from the sale on external expansion, and rules out the possibility that it
is financially-distressed firms that repetitively divest to avoid bankruptcy. Together with the
findings of more positive stock market reactions (see Table 5), this result is also consistent
with Kaiser and Stouraitis (2001a)’s finding that the market reacts more positively to
divestitures where sale proceeds are to be reinvested for expansion via acquisitions.26
Not
surprisingly, the odds ratios for acquisition experience are also greater than one and
significant, suggesting that firms with more acquisition experience are more likely to acquire
in the future.
[Insert Table 8 about here]
We also examine whether these acquisitions create value for shareholders. We calculate the
average announcement returns (proxied by CARs, MARs and raw returns) of all acquisitions
conducted by a divestor within { } years after a divestiture, and regress them on
divestiture experience and controls. Table 9 contains the results.27
All coefficients of
divestiture experience are positive and mostly significant at levels of less than 7%, indicating
that the market reacts more positively to subsequent acquisitions conducted by serial
divestors. Overall, the results confirm hypotheses 4a and 4b, and support the hypothesis that
serial divestors are more likely to use the proceeds strategically.28
[Insert Table 9 about here]
26 Admittedly, there can be endogeneity due to the correlation between divestiture activity and M&A activity (see Table 2,
Panel B). However, it does not affect the interpretation of the results. That is, the existence of a bigger restructuring plan can
be consistent with the finding that serial divestors are more likely to actively conduct future acquisitions rather than wait for
product market competition to force restructuring. Also, the results are qualitatively the same if we remove firms that are
likely to be experiencing significant restructuring (defined as those have done more than one divestiture each year for the
past three years). See Table 12 for more details. 27 For brevity, we only report models of 1-year experience. The models of 2-year and 3-year experience demonstrate
qualitatively similar experience coefficients, albeit with lower statistical significance. However, this is justifiable because
more recent restructuring experience would be more useful in selecting value-creative acquisitions. 28 Using logit regressions we also find that divestiture experience is significantly and positively correlated with the
likelihood of earning positive merger CARs, providing additional support for the shareholder value-creation hypothesis.
18
5 Robustness
Due to the large number of robustness tests, for brevity reasons, we only report the results
rather than tabulate them. All the tabulated robustness tests are available from the authors on
request.
5.1 Do the results actually capture an experience effect?
We take steps to mitigate concerns that the results reflect alternative explanations.
Fire sales: One potential criticism is that serial divestitures are typically fire sales that are
undertaken for financial reasons. For example, Yang (2008) theorizes that negative
productivity shocks motivate selling decisions. To address this concern, we test whether
serial divestors are less likely to be financially distressed during the year of and after a
divestiture. Following the literature on bankruptcy and corporate restructuring (Altman, 1968;
Ohlson, 1980; Fitzpatrick and Ogden, 2011; Powell and Yawson, 2012), we estimate distress
prediction models using a sample of distressed firms and a control sample of healthy firms
from the period prior to the prediction year. We roll forward the prediction models each year
to ensure distress probabilities are computed based on the most recent financial data. A cutoff
of 0.5 is imposed to partition divestors into distressed and healthy groups. Details on data
sources and procedures are provided in Appendix B.
Overall, serial divestors are significantly less likely to be financially constrained
before they divest.29
Thus, the experiential benefits of divestiture experience are not merely
an artifact of distressed firms engaging in multiple divestitures. Further, serial divestors are
significantly less likely to be distressed after a divestiture, both in the short run and in the
relatively long run. The greater financial health is consistent with the positive CARs and
superior future operating performance results.
Splitting transactions: Firms may deliberately span divestment over time rather than all-at-
once so that the aggregate adjustment costs (assumed to be convex) of restructuring are lower
(Abel and Eberly, 1994; Dixit, 1994). If more experienced divestors plan divestitures to
minimise aggregate adjustment costs this may help explain our findings. However, we find
that serial divestitures tend to have larger transactions values (measured as the value of
transaction from SDC scaled by the divestor’s total assets from Compustat) than ad-hoc ones,
29 Similarly, we also find that serial divestors have better pre-divestiture operating performance than non-serial divestors.

19
which is inconsistent with the minimising transactions costs motive. Thus, serial divestitures
do not simply split one large transaction into multiple transactions to avoid saturating the
market.
Significant restructuring: We remove from the sample all divestors that have done more
than one divestiture each year for the past three years to make sure that the divestitures are
reasonably distantly spaced. The results are qualitatively the same. This mitigates concerns
that the findings just capture situations where the company engages in significant
restructuring, rather than divestiture ‘experience’ per se.
Correction of past acquisition mistakes: We ensure that experienced divestors are not
merely correcting past acquisition mistakes. We define an acquisition to be bad if it receives
negative 3-day CARs around announcement. We then regress the divestiture experience over
the future 1, 2 or 3 years after an acquisition on the bad acquisition indicator and controls
(lagged firm size, leverage, CAP X, R&D, advertising, operating performance, Tobin’s Q,
level of diversification and BCF index). The coefficients of the bad acquisition indicator are
insignificant.
Connections with intermediaries: Wider and tighter connections might give the divestor
better access to skilled lead-intermediaries/co-intermediaries, and thereby help deliver better
divestitures outcomes. We ensure that the experience effects are not merely reflecting
superior connections with intermediaries (i.e., investment banks and law firms). We create
connections variables as the count of each type of distinct (i.e., the number of different
intermediaries) and repetitive (i.e., the number of contacts with the same intermediary)
intermediaries used by a divestor over the last 1, 2 or 3 years before a divestiture. We then re-
estimate all regressions by replacing the experience variables with the connections variables.
The connections coefficients are insignificant. The only exception is the choice of non-core
units regressions, in which coefficients of connections tend to remain positive and significant.
So we conclude that divestors better connected with intermediaries tend to sell non-core units,
but the reported deal characteristics and outcomes are primarily driven by their learning
through divestiture experience and their strategic nature.
20
5.2 Are the results robust to large loss and large gain deals?
We ensure that the results are robust to the presence of ‘large loss’ and ‘large gain’ deals.
Large loss deals can account for a significant portion of value-destruction in acquisitions
(Moeller et al., 2005); and large gain deals a significant portion of value-creation (Fich et al.,
2012). We address the presence of such large-loss or large-gain deals in several ways (which
are untabulated for brevity, but are available on request). The CARs results are robust to
using a “robust regression” or a “quantile regression” (regression through the median), both
of which are less sensitive to outliers in the dependent variable (i.e. large-loss or large-gain
deals). The results are also robust to omitting deals that have CARs in the top or bottom 1%,
2%, or 5% of the sample. This highlights that the results do not merely reflect the returns
earned from a small number of highly value-creating or value-destroying deals.
5.3 Endogeneity concerns
Reverse causality: Firms may divest in order to generate cash or improve financial
conditions, which in turn induces better divestiture outcomes (Çolak and Whited, 2007).
Following this logic, serial divestors may have performance goals in the first place, which
then motivate them to divest repetitively, and thereby accumulate experience. We thus
perform sub-sample analysis on outperforming firms, improving firms, cash-rich firms and
large firms, respectively.30
Outperforming firms are those that outperform the industry
average prior to a divestiture, measured using operating performance. Improving firms are
those that experience increases in operating performance during the year before a divestiture.
We define firms to be cash-rich and large as the top 50% of the sample in terms of cash/assets
and assets, respectively. These firms are unlikely to divest for financial reasons, so reverse
causality is less likely to be the case. The results are qualitatively similar, and are therefore
not driven by reverse causality or firms with poor prospects.
Simultaneity: The control variables and some of the dependent variables can be
endogenously determined. Masulis et al. (2007) recognizes potential candidates, such as
Tobin’s Q, leverage and free cash flow being endogenous with performance measures. The
regressions include other control variables that are also prone to this form of endogeneity:
Acquisition experience, firm size, liquidity, capital expenditure, R&D, advertising expenses,
diversification, the BCF index, and experience of intermediaries. The divestiture experience
30 The results of other sub-samples (i.e., improving firms, cash-rich firms and large firms) are also qualitatively similar.
21
coefficients could be biased due to these variables. Thus, we follow Gillan et al. (2003) and
Masulis et al. (2007) to address this issue by replacing firm-level control variables with their
industry-median counterparts. This procedure also reduces the number of observations with
missing values for control variables, and thereby increasing the sample size. The results are
robust. Thus, simultaneity does not bias the results.
5.4 Sample selection issues
Opportunity to divest: Serial divestors are likely to be conglomerates with many
subsidiaries and divisions, so the results could merely reflect a sub-sample effect of firms
with a greater opportunity to divest. By the same token, serial divestors may divest particular
units not by intentional selection but due to the large number of those units. However, this
should not be a severe issue because we have controlled for past acquisitions and the level of
diversification. To address the problem more explicitly, we further control for the opportunity
to divest, measured as the number of segments of each divestor. When divestors from the
sample (consisting of matches from SDC, Compustat and CRSP) cannot be matched with the
segments from Compustat Segment File, we recode the number of segments to be one.
Because Compustat Segment Files include all segments that constitute more than 10% of
consolidated profits, sales or assets, those that are unreported are likely to be negligible and
thereby validating the recoding procedure.31
The results are qualitatively the same.
We also perform sub-sample analysis on firms with similar numbers of specific types
of units. We re-estimate non-core unit regressions using firms with the number of non-core
units above the median, and similarly for the underperforming unit regressions. The results
again remain qualitatively similar.32
Systemic differences between serial and ad-hoc divestors: Serial divestors can be
systemically different from ad-hoc divestors; however the regressions implicitly assume the
two groups have the same general trend in divestiture quality and other deal-related variables.
We employ two methods to mitigate this concern. The first one is a propensity score
method. Firstly, we estimate a logit of whether a firm is experienced (indicator equal to 1 if
the firm has divestiture experience in the last 3 years before divestiture) on control variables.
31 Results would be qualitatively the same if we do not recode the number of segments. 32 Compustat Segment Files do not provide the geographic location of each segment. So we cannot account for the number
of distant units in the distant unit regressions.
22
We then find the 10% and 5% cut-offs of the propensity score distribution for serial divestors.
Next, we cut the ad-hoc divestors whose propensity scores are below the identified 10% and
5% cut-offs, respectively. We re-estimate all regressions using these two sub-samples. The
second approach, weighting, is proposed by Busso et al. (2011). Using the same probabilities
as those from the propensity score method, we calculate weighting scores as ( )
[ ( )] ( )
( ). Then, we weight the covariance matrices for the
key regressions by the weighting scores using STATA’s analytic weights command. We omit
logit regressions because analytical weights with logit have no meaningful interpretation.
The results using both methods are qualitatively unchanged. The experience
coefficients are qualitatively similar to the tabulated results. Thus, the results do not merely
reflect the systemic differences between serial and ad-hoc divestors.
Time periods: The financial crisis might distort divestiture characteristics and performance
(Shleifer and Vishny, 1992; Ang and Mauck, 2011; Rudolph and Schwetzler, Forthcoming).
To relieve the concern more explicitly (apart from controlling for year-fixed effects), we omit
crisis years of 2008 onwards. The results remain mostly qualitatively unchanged and are even
stronger for some regressions. This is to be expected because of the disciplinary roles of
economic downturns on the investment behavior of firms.
Reliability of divestiture records: To avoid potential errors in divestiture records on SDC,
we require that firms with divestiture records on SDC also experience a reduction in number
of segments simultaneously according to the Compustat Segment File. The sub-sample of
confirmed data includes 1,270 divestitures by 677 firms in 899 firm-years. Although the
sample size is limited, the findings are qualitatively similar. So the results are not biased by
possible errors in SDC divestiture records.
5.5 Unobserved heterogeneity
It is important to ensure that the results do not merely reflect industry or time effects
(Johnson et al., 2009; Petersen, 2009; Gormley and Matsa, Forthcoming). The key models
generally use industry-adjusted measures of continuous dependent variables (including
intermediaries’ experience, operating performance, gross margin and operating expense).
This is because fixed effects cannot control for within group heterogeneity (Gormley and
Matsa, Forthcoming), but the goal of the regressions is to examine how serial divestors

23
perform compared with their relevant industry benchmark over the same period; a similar
rationale to the use of abnormal returns in event studies. Adjusting the dependent variables by
industry averages each year enables us to capture industry and time effects over the relevant
comparison period. Another reason for adopting this approach is that the sample is cross-
sectional (not panel). However, when we add industry and year fixed effects both with and
without adjusting the dependent variables the findings are similar to the tabulated ones with
one exception: regressions of adjusted operating performance tend to have insignificant
coefficients of divestiture experience when industry and year fixed effects are also in place.
This is likely to be caused by double-demeaning. So overall, the findings are robust to
unobserved heterogeneity.
5.6 Additional control variables
Corporate governance: The most relevant dimension of corporate governance for
restructuring decisions is the level of managerial entrenchment, so the main results include
anti-takeover provisions (i.e., BCF) as a control in regressions. However, there are alternative
dimensions of corporate governance. For example, high product market competition and/or
ownership concentration might compensate the negative governance effects caused by anti-
takeover provisions. We thus include HHI and institutional ownership (together with BCF) as
additional controls to the regressions. The results are qualitatively unchanged.
We also consider board independence, duality and dual class shares as additional
controls for corporate governance (together with BCF, HHI and institutional ownership).
Requirement of these variables reduces the regression sample size by more than half and
renders some regression not interpretable (e.g., the regressions of underperforming units
would have 89 observations only). However, the results survive through regressions with
decent sample sizes (e.g., regressions of market timing, operating performance and future
acquisitions).
5.7 Alternative experience measures
Firm experience is likely to reflect experience amassed by the personnel of a firm. So we
construct two board-level divestiture (acquisition) experience measures - the natural log of
one plus the number of divestitures (acquisition) experienced by all directors on the board of
a divestor over the last { } years before a divestiture, and the natural log of one plus
24
the number of directors with divestiture (acquisition) experience over the last { }
years before a divestiture. Board of directors data are from IRRC/Risk Metrics. We confirm
that the directions of coefficients and odds ratios of divestiture experience survive from these
new definitions.
6 Conclusion
This paper shows that divestiture experience is an important driver of divestiture performance
and shows that this occurs through due to the decision over which units to divest and when to
divest them. We show that serial divestors tend to refocus operationally and geographically
on more important divisions by divesting non-core, geographically distant and
underperforming units. They are also more likely to time the market by divesting during a
merger wave. Consistent with the literature that links these divestiture types with better
divestiture performance, we next find that serial divestors receive more positive market
reactions around announcement, and earn consistently stronger future operating performance.
The superior operating performance arises more from higher profitability rather than from
lower operating expenses. Lastly, serial divestors are more likely to reinvest sale proceeds on
acquisitions, and these acquisitions are value-creating for divestor shareholders. We confirm
that the results are not driven by financially distressed firms. We also take steps to mitigate
concerns of several alternative explanations for our results, including large-loss large-gain
deals, endogeneity, sample selection and alternative experience measures.
These findings provide several important contributions to the existing literature. First,
the paper provides evidence on the nature of serial divestors. Whereas, the high-profile serial
divestors create the impression that serial divestors are financial distressed, we indicate that
this is not the case. Many divestors have prior divestiture experience. Serial divestors do not
appear to be more financial distressed on average, and serial divestors tend to benefit from
the experience that they have accumulated.
Second, this paper highlights an additional driver of divestiture performance –
experience in divestitures (in addition to experience in takeovers). This divestiture experience
also influences takeover returns.
Third, we show the benefits of experience manifest themselves in the decisions over
which units to divest (i.e. geographically distant and non-core units) and when to divest them
(i.e. during a merger wave). We also provide some evidence that experienced divestors are

25
more likely to re-invest that money in value-creating takeovers. Last, we complement
research on serial restructuring which has mainly focused on serial M&As.
26
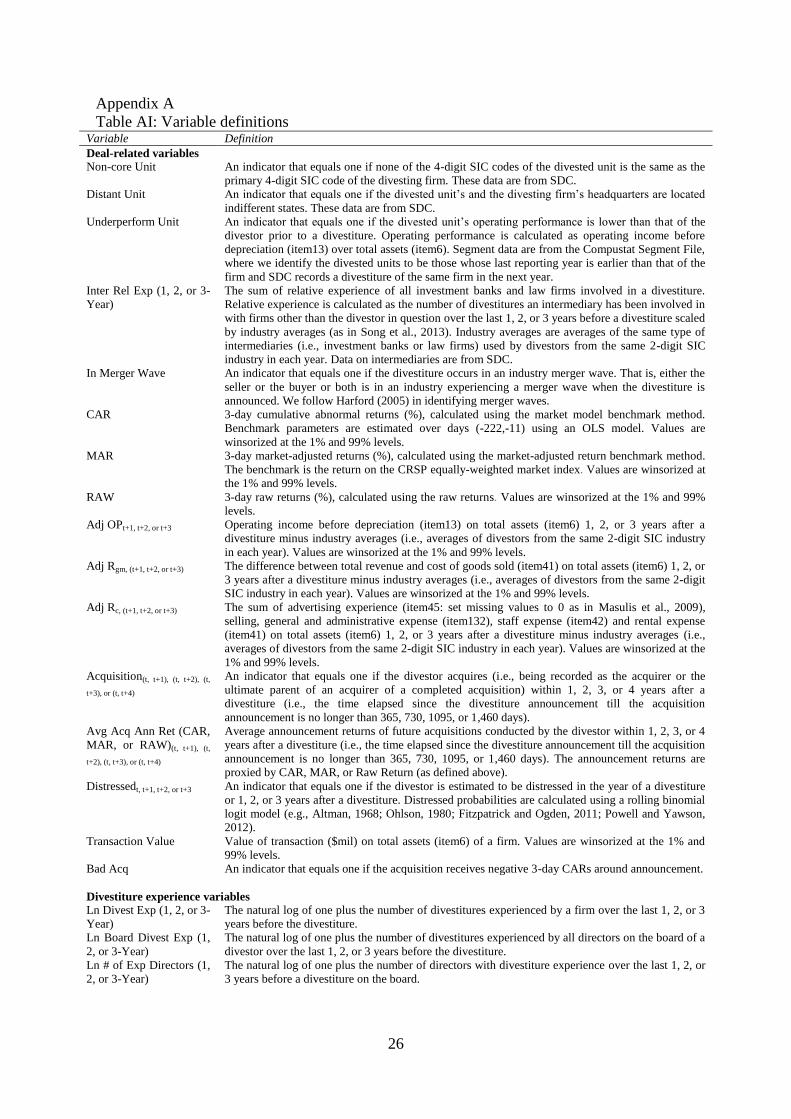
Appendix A
Table AI: Variable definitions Variable Definition
Deal-related variables
Non-core Unit An indicator that equals one if none of the 4-digit SIC codes of the divested unit is the same as the
primary 4-digit SIC code of the divesting firm. These data are from SDC.
Distant Unit An indicator that equals one if the divested unit’s and the divesting firm’s headquarters are located
indifferent states. These data are from SDC.
Underperform Unit An indicator that equals one if the divested unit’s operating performance is lower than that of the
divestor prior to a divestiture. Operating performance is calculated as operating income before
depreciation (item13) over total assets (item6). Segment data are from the Compustat Segment File,
where we identify the divested units to be those whose last reporting year is earlier than that of the
firm and SDC records a divestiture of the same firm in the next year.
Inter Rel Exp (1, 2, or 3-
Year)
The sum of relative experience of all investment banks and law firms involved in a divestiture.
Relative experience is calculated as the number of divestitures an intermediary has been involved in
with firms other than the divestor in question over the last 1, 2, or 3 years before a divestiture scaled
by industry averages (as in Song et al., 2013). Industry averages are averages of the same type of
intermediaries (i.e., investment banks or law firms) used by divestors from the same 2-digit SIC
industry in each year. Data on intermediaries are from SDC.
In Merger Wave An indicator that equals one if the divestiture occurs in an industry merger wave. That is, either the
seller or the buyer or both is in an industry experiencing a merger wave when the divestiture is
announced. We follow Harford (2005) in identifying merger waves.
CAR 3-day cumulative abnormal returns (%), calculated using the market model benchmark method.
Benchmark parameters are estimated over days (-222,-11) using an OLS model. Values are
winsorized at the 1% and 99% levels.
MAR 3-day market-adjusted returns (%), calculated using the market-adjusted return benchmark method.
The benchmark is the return on the CRSP equally-weighted market index. Values are winsorized at
the 1% and 99% levels.
RAW 3-day raw returns (%), calculated using the raw returns. Values are winsorized at the 1% and 99%
levels.
Adj OPt+1, t+2, or t+3
Operating income before depreciation (item13) on total assets (item6) 1, 2, or 3 years after a
divestiture minus industry averages (i.e., averages of divestors from the same 2-digit SIC industry
in each year). Values are winsorized at the 1% and 99% levels.
Adj Rgm, (t+1, t+2, or t+3) The difference between total revenue and cost of goods sold (item41) on total assets (item6) 1, 2, or
3 years after a divestiture minus industry averages (i.e., averages of divestors from the same 2-digit
SIC industry in each year). Values are winsorized at the 1% and 99% levels.
Adj Rc, (t+1, t+2, or t+3) The sum of advertising experience (item45: set missing values to 0 as in Masulis et al., 2009),
selling, general and administrative expense (item132), staff expense (item42) and rental expense
(item41) on total assets (item6) 1, 2, or 3 years after a divestiture minus industry averages (i.e.,
averages of divestors from the same 2-digit SIC industry in each year). Values are winsorized at the
1% and 99% levels.
Acquisition(t, t+1), (t, t+2), (t,
t+3), or (t, t+4)
An indicator that equals one if the divestor acquires (i.e., being recorded as the acquirer or the
ultimate parent of an acquirer of a completed acquisition) within 1, 2, 3, or 4 years after a
divestiture (i.e., the time elapsed since the divestiture announcement till the acquisition
announcement is no longer than 365, 730, 1095, or 1,460 days).
Avg Acq Ann Ret (CAR,
MAR, or RAW)(t, t+1), (t,
t+2), (t, t+3), or (t, t+4)
Average announcement returns of future acquisitions conducted by the divestor within 1, 2, 3, or 4
years after a divestiture (i.e., the time elapsed since the divestiture announcement till the acquisition
announcement is no longer than 365, 730, 1095, or 1,460 days). The announcement returns are
proxied by CAR, MAR, or Raw Return (as defined above).
Distressedt, t+1, t+2, or t+3 An indicator that equals one if the divestor is estimated to be distressed in the year of a divestiture
or 1, 2, or 3 years after a divestiture. Distressed probabilities are calculated using a rolling binomial
logit model (e.g., Altman, 1968; Ohlson, 1980; Fitzpatrick and Ogden, 2011; Powell and Yawson,
2012).
Transaction Value Value of transaction ($mil) on total assets (item6) of a firm. Values are winsorized at the 1% and
99% levels.
Bad Acq An indicator that equals one if the acquisition receives negative 3-day CARs around announcement.
Divestiture experience variables
Ln Divest Exp (1, 2, or 3-
Year)
The natural log of one plus the number of divestitures experienced by a firm over the last 1, 2, or 3
years before the divestiture.
Ln Board Divest Exp (1,
2, or 3-Year)
The natural log of one plus the number of divestitures experienced by all directors on the board of a
divestor over the last 1, 2, or 3 years before the divestiture.
Ln # of Exp Directors (1,
2, or 3-Year)
The natural log of one plus the number of directors with divestiture experience over the last 1, 2, or
3 years before a divestiture on the board.
27
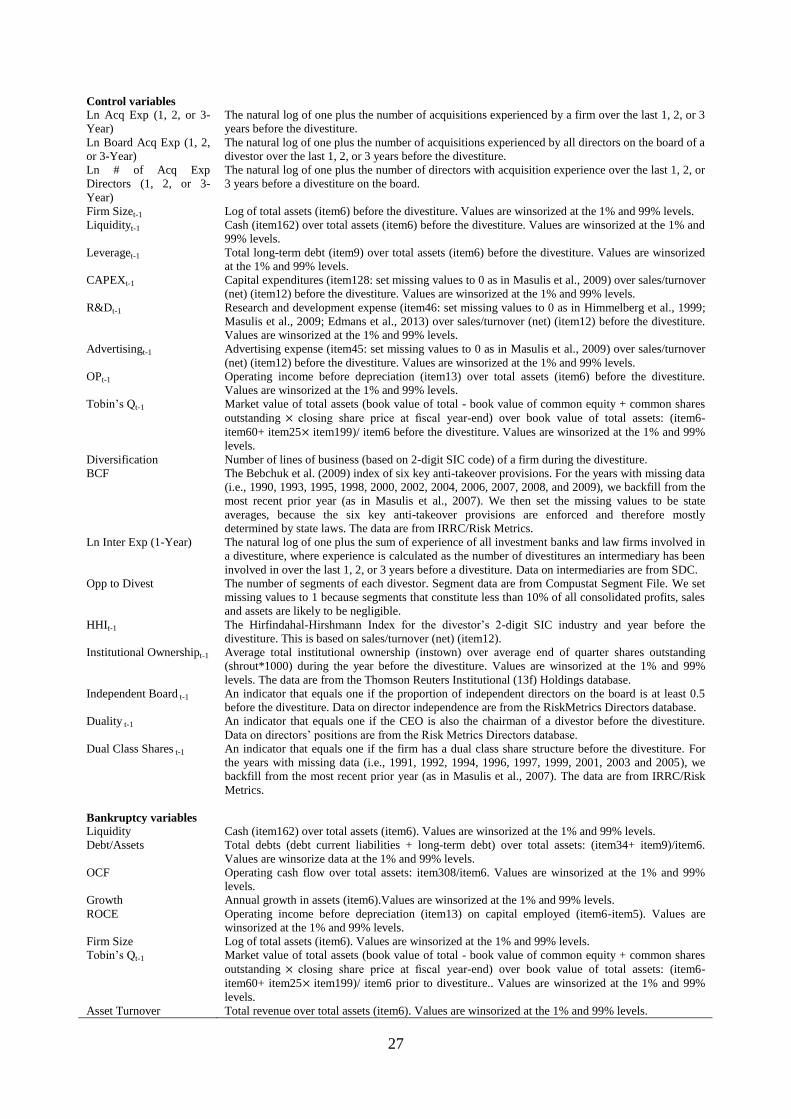
Control variables
Ln Acq Exp (1, 2, or 3-
Year)
The natural log of one plus the number of acquisitions experienced by a firm over the last 1, 2, or 3
years before the divestiture.
Ln Board Acq Exp (1, 2,
or 3-Year)
The natural log of one plus the number of acquisitions experienced by all directors on the board of a
divestor over the last 1, 2, or 3 years before the divestiture.
Ln # of Acq Exp
Directors (1, 2, or 3-
Year)
The natural log of one plus the number of directors with acquisition experience over the last 1, 2, or
3 years before a divestiture on the board.
Firm Sizet-1 Log of total assets (item6) before the divestiture. Values are winsorized at the 1% and 99% levels.
Liquidityt-1 Cash (item162) over total assets (item6) before the divestiture. Values are winsorized at the 1% and
99% levels.
Leveraget-1 Total long-term debt (item9) over total assets (item6) before the divestiture. Values are winsorized
at the 1% and 99% levels.
CAPEXt-1 Capital expenditures (item128: set missing values to 0 as in Masulis et al., 2009) over sales/turnover
(net) (item12) before the divestiture. Values are winsorized at the 1% and 99% levels.
R&Dt-1 Research and development expense (item46: set missing values to 0 as in Himmelberg et al., 1999;
Masulis et al., 2009; Edmans et al., 2013) over sales/turnover (net) (item12) before the divestiture.
Values are winsorized at the 1% and 99% levels.
Advertisingt-1 Advertising expense (item45: set missing values to 0 as in Masulis et al., 2009) over sales/turnover
(net) (item12) before the divestiture. Values are winsorized at the 1% and 99% levels.
OPt-1 Operating income before depreciation (item13) over total assets (item6) before the divestiture.
Values are winsorized at the 1% and 99% levels.
Tobin’s Qt-1 Market value of total assets (book value of total - book value of common equity + common shares
outstanding closing share price at fiscal year-end) over book value of total assets: (item6-
item60+ item25 item199)/ item6 before the divestiture. Values are winsorized at the 1% and 99%
levels.
Diversification Number of lines of business (based on 2-digit SIC code) of a firm during the divestiture.
BCF The Bebchuk et al. (2009) index of six key anti-takeover provisions. For the years with missing data
(i.e., 1990, 1993, 1995, 1998, 2000, 2002, 2004, 2006, 2007, 2008, and 2009), we backfill from the
most recent prior year (as in Masulis et al., 2007). We then set the missing values to be state
averages, because the six key anti-takeover provisions are enforced and therefore mostly
determined by state laws. The data are from IRRC/Risk Metrics.
Ln Inter Exp (1-Year) The natural log of one plus the sum of experience of all investment banks and law firms involved in
a divestiture, where experience is calculated as the number of divestitures an intermediary has been
involved in over the last 1, 2, or 3 years before a divestiture. Data on intermediaries are from SDC.
Opp to Divest The number of segments of each divestor. Segment data are from Compustat Segment File. We set
missing values to 1 because segments that constitute less than 10% of all consolidated profits, sales
and assets are likely to be negligible.
HHIt-1 The Hirfindahal-Hirshmann Index for the divestor’s 2-digit SIC industry and year before the
divestiture. This is based on sales/turnover (net) (item12).
Institutional Ownershipt-1 Average total institutional ownership (instown) over average end of quarter shares outstanding
(shrout*1000) during the year before the divestiture. Values are winsorized at the 1% and 99%
levels. The data are from the Thomson Reuters Institutional (13f) Holdings database.
Independent Board t-1 An indicator that equals one if the proportion of independent directors on the board is at least 0.5
before the divestiture. Data on director independence are from the RiskMetrics Directors database.
Duality t-1 An indicator that equals one if the CEO is also the chairman of a divestor before the divestiture.
Data on directors’ positions are from the Risk Metrics Directors database.
Dual Class Shares t-1 An indicator that equals one if the firm has a dual class share structure before the divestiture. For
the years with missing data (i.e., 1991, 1992, 1994, 1996, 1997, 1999, 2001, 2003 and 2005), we
backfill from the most recent prior year (as in Masulis et al., 2007). The data are from IRRC/Risk
Metrics.
Bankruptcy variables
Liquidity Cash (item162) over total assets (item6). Values are winsorized at the 1% and 99% levels.
Debt/Assets Total debts (debt current liabilities + long-term debt) over total assets: (item34+ item9)/item6.
Values are winsorize data at the 1% and 99% levels.
OCF Operating cash flow over total assets: item308/item6. Values are winsorized at the 1% and 99%
levels.
Growth Annual growth in assets (item6).Values are winsorized at the 1% and 99% levels.
ROCE Operating income before depreciation (item13) on capital employed (item6-item5). Values are
winsorized at the 1% and 99% levels.
Firm Size Log of total assets (item6). Values are winsorized at the 1% and 99% levels.
Tobin’s Qt-1 Market value of total assets (book value of total - book value of common equity + common shares
outstanding closing share price at fiscal year-end) over book value of total assets: (item6-
item60+ item25 item199)/ item6 prior to divestiture.. Values are winsorized at the 1% and 99%
levels.
Asset Turnover Total revenue over total assets (item6). Values are winsorized at the 1% and 99% levels.
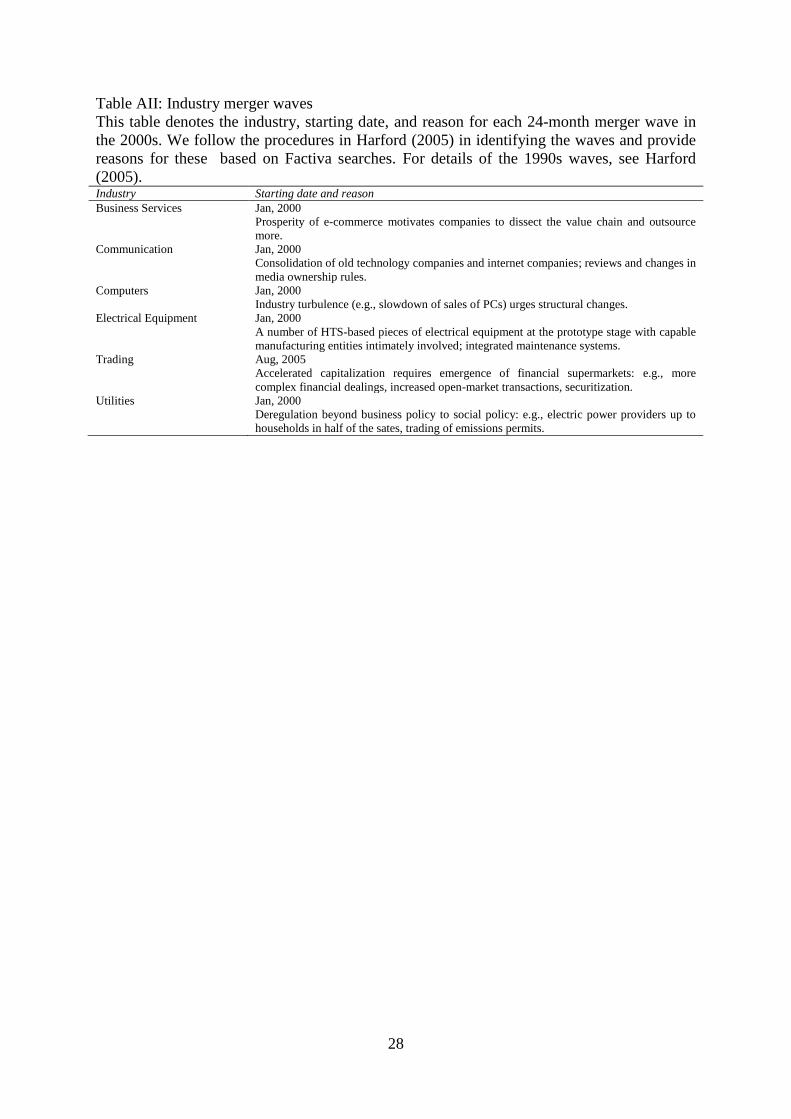
28
Table AII: Industry merger waves
This table denotes the industry, starting date, and reason for each 24-month merger wave in
the 2000s. We follow the procedures in Harford (2005) in identifying the waves and provide
reasons for these based on Factiva searches. For details of the 1990s waves, see Harford
(2005). Industry Starting date and reason
Business Services Jan, 2000
Prosperity of e-commerce motivates companies to dissect the value chain and outsource
more.
Communication Jan, 2000
Consolidation of old technology companies and internet companies; reviews and changes in
media ownership rules.
Computers Jan, 2000
Industry turbulence (e.g., slowdown of sales of PCs) urges structural changes.
Electrical Equipment Jan, 2000
A number of HTS-based pieces of electrical equipment at the prototype stage with capable
manufacturing entities intimately involved; integrated maintenance systems.
Trading Aug, 2005
Accelerated capitalization requires emergence of financial supermarkets: e.g., more
complex financial dealings, increased open-market transactions, securitization.
Utilities Jan, 2000
Deregulation beyond business policy to social policy: e.g., electric power providers up to
households in half of the sates, trading of emissions permits.

29
Appendix B
Identification of financially distressed divestor-years: Data on actual financial health is
sourced from three datasets:
(i) Mergent FSID where we collect distressed firm-years as those that defaulted or went
bankrupt;
(ii) CRSP stock header information where we gather distressed firm-years as those in
liquidation or dropped (i.e., delist code: 400-599);37
and
(iii) Compustat Ratings where we obtain distressed firm-years as those that are
downgraded in terms of S&P quality rating (i.e., spcsrc), S&P domestic long term
issuer credit rating (i.e., splticrm) and S&P domestic short term issuer credit rating
(i.e., spsticrm).
These records only identify 3-8% of all firms in each year (from Compustat) as distressed.
Therefore, we construct financial health indicators following the bankruptcy and corporate
restructuring literature (Altman, 1968; Ohlson, 1980; Fitzpatrick and Ogden, 2011; Powell
and Yawson, 2012). The method uses values of major bankruptcy variables in year t-1 to
estimate probabilities of financial distress in year t. We further required the distressed firms
identified above to have non-missing values for bankruptcy variables in year t-1. This leads
to a total of 10,200 distressed firms.
The detailed procedures of calculating distressed probabilities are as follows. We first
randomly select a control group of 10,200 distressed firms by year. This control group
together with the treatment group of distressed firms makes up the full sample for the
estimation of distress probabilities. Using this full sample, we then estimate binomial logit
models on bankruptcy measures (i.e., Liquidity, Debt/Assets, OCF, Growth, ROCE, Firm
Size, Tobin’s Q and Asset Turnover as defined in Appendix A). The estimation period is 3
years to ensure a reliable number of observations. We roll forward the estimation model one
year at a time to ensure the regression coefficients reflect the most recent financial data. That
is, to estimate distress coefficients in year t (β), we use the distress data in years t-3 to t-1.
For each estimation period, the number of observations ranges from 1,578 to 3,380.38
Next,
we apply the regression coefficients to the divestiture sample to calculate the probability of
financial distress for each firm. Firm-years with distress probabilities above 0.5 are classified
as distressed. Distressed firms on average account for 25% of the universe (i.e., all firms in
Compustat) each year.
37 NYSE and NASDAQ have minimum listing requirements (i.e. $1 share price). The firm can be forced to delist if its share
price falls too low. This would be a sign of bankruptcy even if the firm does not list bankruptcy as the reason for delisting. 38 We do not match by both industry and year, because it reduces the number of observations a range of 84 to 260 per
estimation period (when identifying industries by GICS sector, which has more non-missing values than SIC industry code)
due to data limitation. However, the predicted distress probabilities regression results are qualitatively the same using the
two methods of matching.
30
7 References Abel AB, Eberly JC. 1994. A Unified Model of Investment under Uncertainty. The American
Economic Review, 84(5).
Afshar K, Taffler R, Sudarsanam P. 1992. The Effect of Corporate Divestments on
Shareholder Wealth: The Uk Experience. Journal of Banking & Finance, 16(1): 115-
135.
Aktas N, de Bodt E, Cousin J-G. 2007. Event Studies with a Contaminated Estimation
Period. Journal of Corporate Finance, 13(1): 129-145.
Aktas N, De Bodt E, Roll R. 2009. Learning, Hubris and Corporate Serial Acquisitions.
Journal of Corporate Finance, 15(5): 543-561.
Aktas N, De Bodt E, Roll R. 2011. Serial Acquirer Bidding: An Empirical Test of the
Learning Hypothesis. Journal of Corporate Finance, 17(1): 18-32.
Aktas N, de Bodt E, Roll R. 2013. Learning from Repetitive Acquisitions: Evidence from the
Time between Deals. Journal of Financial Economics, 108(1): 99-117.
Alchian AA, Demsetz H. 1972. Production, Information Costs, and Economic Organization.
The American Economic Review, 62(5): 777-795.
Alexander GJ, Benson PG, Kampmeyer JM. 1984. Investigating the Valuation Effects of
Announcements of Voluntary Corporate Selloffs. The Journal of Finance, 39(2): 503-
517.
Alexandridis G, Mavrovitis CF, Travlos NG. 2012. How Have M&as Changed? Evidence
from the Sixth Merger Wave. The European Journal of Finance, 18(8): 663-688.
Altman EI. 1968. Financial Ratios, Discriminant Analysis and the Prediction of Corporate
Bankruptcy. The Journal of Finance, 23(4): 589-609.
Alvarez E, Waller S, Filsoof A. 2013. The Secret to a Successful Divestiture. Strategy and
Business, Autumn(72).
Ang J, Jong Ad, Poel A. 2012. Does Ceos' Familiarity with Business Segments Affect Their
Divestment Decisions? Working Paper.
Ang J, Mauck N. 2011. Fire Sale Acquisitions: Myth Vs. Reality. Journal of Banking &
Finance, 35(3): 532-543.
Arzac ER. 1986. Do Your Business Units Create Shareholder Value? Harvard Business
Review, 64(1): 121-126.
Barkema HG, Schijven M. 2008. How Do Firms Learn to Make Acquisitions? A Review of
Past Research and an Agenda for the Future. Journal of Management, 34(3): 594-634.
Bauguess SW, Slovin MB, Sushka ME. 2012. Large Shareholder Diversification, Corporate
Risk Taking, and the Benefits of Changing to Differential Voting Rights. Journal of
Banking & Finance, 36(4): 1244-1253.
Bebchuk L, Cohen A, Ferrell A. 2009. What Matters in Corporate Governance? Review of
Financial Studies, 22(2): 783-827.
Bebchuk LA, Cohen A. 2005. The Costs of Entrenched Boards. Journal of Financial
Economics, 78(2): 409-433.
Berger PG, Ofek E. 1995. Diversification's Effect on Firm Value. Journal of Financial
Economics, 37(1): 39-65.
Bertrand M, Mullainathan S. 2003. Enjoying the Quiet Life? Corporate Governance and
Managerial Preferences. Journal of Political Economy, 111(5): 1043-1075.
Billett MT, Qian Y. 2008. Are Overconfident Ceos Born or Made? Evidence of Self-
Attribution Bias from Frequent Acquirers. Management Science, 54(6): 1037-1051.
Bradley M, Desai A, Kim EH. 1988. Synergistic Gains from Corporate Acquisitions and
Their Division between the Stockholders of Target and Acquiring Firms. Journal of
Financial Economics, 21(1): 3-40.
31
Busso M, DiNardo J, McCrary J. 2011. New Evidence on the Finite Sample Properties of
Propensity Score Reweighting and Matching Estimators. Working Paper.
Chen H-L, Guo R-J. 2005. On Corporate Divestiture. Review of Quantitative Finance and
Accounting, 24(4): 399-421.
Clubb C, Stouraitis A. 2002. The Significance of Sell-Off Profitability in Explaining the
Market Reaction to Divestiture Announcements. Journal of Banking & Finance,
26(4): 671-688.
Coase RH. 1937. The Nature of the Firm. Economica, 4(16): 386-405.
Çolak G, Whited TM. 2007. Spin-Offs, Divestitures, and Conglomerate Investment. Review
of Financial Studies, 20(3): 557-595.
Comment R, Jarrell GA. 1995. Corporate Focus and Stock Returns. Journal of Financial
Economics, 37(1): 67-87.
Datta S, Iskandar-Datta M, Raman K. 2003. Value Creation in Corporate Asset Sales: The
Role of Managerial Performance and Lender Monitoring. Journal of Banking &
Finance, 27(2): 351-375.
Denis DK, Shome DK. 2005. An Empirical Investigation of Corporate Asset Downsizing.
Journal of Corporate Finance, 11(3): 427-448.
Dittmar A, Shivdasani A. 2003. Divestitures and Divisional Investment Policies. The Journal
of Finance, 58(6): 2711-2744.
Dixit AK. 1994. Investment under Uncertainty: Princeton university press.
Dybvig P, Warachka M. 2012. Tobin's Q Does Not Measure Performance: Theory, Empirics,
and Alternative Measures. Working Paper.
Eckbo BE, Thorburn SK. 2008. Corporate Restructuring: Breakups and Lbos. Handbook of
Corporate Finance: Empirical Finance, 2.
Edmans A, Fang VW, Lewellen KA. 2013. Equity Vesting and Managerial Myopia. Working
Paper.
Eisfeldt AL, Rampini AA. 2006. Capital Reallocation and Liquidity. Journal of Monetary
Economics, 53(3): 369-399.
Fama EF, French KR. 1997. Industry Costs of Equity. Journal of Financial Economics,
43(2): 153-193.
Fich E, Nguyen T, Officer M. 2012. Large Wealth Creation in Mergers and Acquisitions.
Working Paper.
Fitzpatrick J, Ogden JP. 2011. The Detection and Dynamics of Financial Distress*.
International Review of Finance, 11(1): 87-121.
Fluck Z, Lynch AW. 1999. Why Do Firms Merge and Then Divest? A Theory of Financial
Synergy. The Journal of Business, 72(3): 319-346.
Fruhan WE. 1979. Financial Strategy: Studies in the Creation, Transfer, and Destruction of
Shareholder Value: RD Irwin Homewood, IL.
Gillan S, Hartzell J, Starks L. 2003. Explaining Corporate Governance: Boards, Bylaws, and
Charter Provisions. Weinberg Center for Corporate Governance Working Paper.
Gompers P, Ishii J, Metrick A. 2003. Corporate Governance and Equity Prices. The Quarterly
Journal of Economics, 118(1): 107-156.
Gormley TA, Matsa DA. Forthcoming. Common Errors: How to (and Not to) Control for
Unobserved Heterogeneity. Review of Fiancial Studies.
Gort M. 1969. An Economic Disturbance Theory of Mergers. The Quarterly Journal of
Economics, 83(4): 624-642.
Haleblian J, Finkelstein S. 1999. The Influence of Organizational Acquisition Experience on
Acquisition Performance: A Behavioral Learning Perspective. Administrative Science
Quarterly, 44(1): 29-56.
32
Hanson RC, Song MH. 2003. Long-Term Performance of Divesting Firms and the Effect of
Managerial Ownership. Journal of Economics and Finance, 27(3): 321-336.
Hanson RC, Song MH. 2006. Corporate Governance and Asset Sales: The Effect of Internal
and External Control Mechanisms. Financial Review, 41(3): 361-386.
Harford J. 2005. What Drives Merger Waves? Journal of Financial Economics, 77(3): 529-
560.
Harford J, Schonlau R. 2013. Does the Director Labor Market Offer Ex Post Settling-up for
Ceos? The Case of Acquisitions. Journal of Financial Economics, 110(1): 18-36.
Himmelberg CP, Hubbard RG, Palia D. 1999. Understanding the Determinants of Managerial
Ownership and the Link between Ownership and Performance. Journal of Financial
Economics, 53(3): 353-384.
Hite GL, Owers JE, Rogers RC. 1987. The Market for Interfirm Asset Sales: Partial Sell-Offs
and Total Liquidations. Journal of Financial Economics, 18(2): 229-252.
Jain PC. 1985. The Effect of Voluntary Sell‐Off Announcements on Shareholder Wealth.
The Journal of Finance, 40(1): 209-224.
Jensen MC. 1989. Active Investors, Lbos, and the Privatization of Bankruptcy. Journal of
Applied Corporate Finance, 2(1): 35-44.
Jensen MC. 1993. The Modern Industrial Revolution, Exit, and the Failure of Internal
Control Systems. The Journal of Finance, 48(3): 831-880.
Jensen MC, Meckling WH. 1976. Theory of the Firm: Managerial Behavior, Agency Costs
and Ownership Structure. Journal of Financial Economics, 3(4): 305-360.
John K, Ofek E. 1995. Asset Sales and Increase in Focus. Journal of Financial Economics,
37(1): 105-126.
Johnson SA, Moorman TC, Sorescu S. 2009. A Reexamination of Corporate Governance and
Equity Prices. Review of Financial Studies, 22(11): 4753-4786.
Kaiser KM, Stouraitis A. 2001a. Agency Costs and Strategic Considerations Behind Sell‐Offs: The Uk Evidence. European Financial Management, 7(3): 319-349.
Kaiser KM, Stouraitis A. 2001b. Reversing Corporate Diversification and the Use of the
Proceeds from Asset Sales: The Case of Thorn Emi. Financial Management: 63-102.
Kaplan SN, Weisbach MS. 1992. The Success of Acquisitions: Evidence from Divestitures.
The Journal of Finance, 47(1): 107-138.
Kim CE. 1998. The Effects of Asset Liquidity: Evidence from the Contract Drilling Industry.
Journal of Financial Intermediation, 7(2): 151-176.
Klein A. 1986. The Timing and Substance of Divestiture Announcements: Individual,
Simultaneous and Cumulative Effects. The Journal of Finance, 41(3): 685-696.
Landier A, Nair VB, Wulf J. 2009. Trade-Offs in Staying Close: Corporate Decision Making
and Geographic Dispersion. Review of Financial Studies, 22(3): 1119-1148.
Masulis RW, Wang C, Xie F. 2007. Corporate Governance and Acquirer Returns. The
Journal of Finance, 62(4): 1851-1889.
Masulis RW, Wang C, Xie F. 2009. Agency Problems at Dual‐Class Companies. The
Journal of Finance, 64(4): 1697-1727.
Meyer M, Milgrom P, Roberts J. 1992. Organizational Prospects, Influence Costs, and
Ownership Changes. Journal of Economics & Management Strategy, 1(1): 9-35.
Mitchell ML, Mulherin JH. 1996. The Impact of Industry Shocks on Takeover and
Restructuring Activity. Journal of Financial Economics, 41(2): 193-229.
Moeller SB, Schlingemann FP, Stulz RM. 2004. Firm Size and the Gains from Acquisitions.
Journal of Financial Economics, 73(2): 201-228.
Moeller SB, Schlingemann FP, Stulz RM. 2005. Wealth Destruction on a Massive Scale? A
Study of Acquiring‐Firm Returns in the Recent Merger Wave. The Journal of
Finance, 60(2): 757-782.
33
Montgomery CA, Thomas AR, Kamath R. 1984. Divestiture, Market Valuation, and Strategy.
Academy of Management Journal, 27(4): 830-840.
Nanda V, Narayanan M. 1998. Disentangling Value: Misvaluation and Divestitures. Working
Paper.
Nelson RR, Winter SG. 1982. An Evolutionary Theory of Economic Change. Cambridge,
MA: Belknap press.
Officer MS. 2003. Termination Fees in Mergers and Acquisitions. Journal of Financial
Economics, 69(3): 431-467.
Ohlson JA. 1980. Financial Ratios and the Probabilistic Prediction of Bankruptcy. Journal of
Accounting Research, 18(1): 109-131.
Opler T, Titman S. 1993. The Determinants of Leveraged Buyout Activity: Free Cash Flow
Vs. Financial Distress Costs. The Journal of Finance, 48(5): 1985-1999.
Owen S, Shi L, Yawson A. 2010. Divestitures, Wealth Effects and Corporate Governance.
Accounting & Finance, 50(2): 389-415.
Petersen MA. 2009. Estimating Standard Errors in Finance Panel Data Sets: Comparing
Approaches. Review of Financial Studies, 22(1): 435-480.
Powell R, Yawson A. 2005. Industry Aspects of Takeovers and Divestitures: Evidence from
the Uk. Journal of Banking & Finance, 29(12): 3015-3040.
Powell R, Yawson A. 2007. Are Corporate Restructuring Events Driven by Common
Factors? Implications for Takeover Prediction. Journal of Business Finance &
Accounting, 34(7&8): 1169-1192.
Powell R, Yawson A. 2012. Internal Restructuring and Firm Survival. International Review
of Finance, 12(4): 435-467.
Rajan R, Servaes H, Zingales L. 2000. The Cost of Diversity: The Diversification Discount
and Inefficient Investment. The Journal of Finance, 55(1): 35-80.
Rhodes–Kropf M, Robinson DT, Viswanathan S. 2005. Valuation Waves and Merger
Activity: The Empirical Evidence. Journal of Financial Economics, 77(3): 561-603.
Rudolph C, Schwetzler B. Forthcoming. Conglomerates on the Rise Again? A Cross-
Regional Study on the Impact of the 2008-2009 Financial Crisis on the Diversification
Discount. Journal of Corporate Finance.
Scharfstein DS, Stein JC. 2000. The Dark Side of Internal Capital Markets: Divisional
Rent‐Seeking and Inefficient Investment. The Journal of Finance, 55(6): 2537-2564.
Schlingemann FP, Stulz RM, Walkling RA. 1999. Corporate Focusing and Internal Capital
Markets. Working Paper.
Schlingemann FP, Stulz RM, Walkling RA. 2002. Divestitures and the Liquidity of the
Market for Corporate Assets. Journal of Financial Economics, 64(1): 117-144.
Schwert GW. 1996. Markup Pricing in Mergers and Acquisitions. Journal of Financial
Economics, 41(2): 153-192.
Shleifer A, Vishny RW. 1992. Liquidation Values and Debt Capacity: A Market Equilibrium
Approach. The Journal of Finance, 47(4): 1343-1366.
Shleifer A, Vishny RW. 2003. Stock Market Driven Acquisitions. Journal of Financial
Economics, 70(3): 295-311.
Sicherman NW, Pettway RH. 1992. Wealth Effects for Buyers and Sellers of the Same
Divested Assets. Financial Management: 119-128.
Song W, Wei JD, Zhou L. 2013. The Value of “Boutique” Financial Advisors in Mergers and
Acquisitions. Journal of Corporate Finance, 20(1): 94-114.
Strebel PJ. 1983. The Stock Market and Competitive Analysis. Strategic Management
Journal, 4(3): 279-291.
Vermeulen F, Barkema H. 2001. Learning through Acquisitions. Academy of Management
Journal: 457-476.

34
Weick KE, Gilfillan DP. 1971. Fate of Arbitrary Traditions in a Laboratory Microculture.
Journal of Personality and Social Psychology, 17(2): 179-191.
White H. 1980. A Heteroskedasticity-Consistent Covariance Matrix Estimator and a Direct
Test for Heteroskedasticity. Econometrica, 48(4): 817-838.
Yang L. 2008. The Real Determinants of Asset Sales. The Journal of Finance, 63(5): 2231-
2262.
Zollo M, Singh H. 2004. Deliberate Learning in Corporate Acquisitions: Post‐Acquisition
Strategies and Integration Capability in Us Bank Mergers. Strategic Management
Journal, 25(13): 1233-1256.
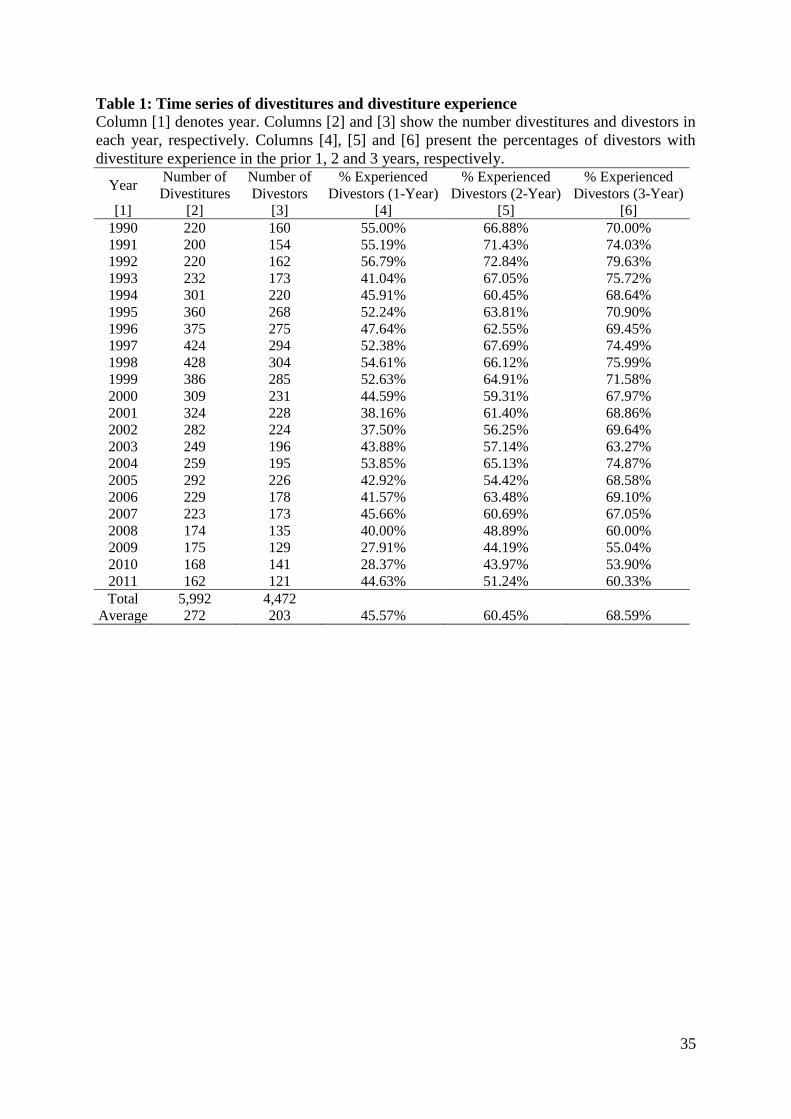
35
Table 1: Time series of divestitures and divestiture experience
Column [1] denotes year. Columns [2] and [3] show the number divestitures and divestors in
each year, respectively. Columns [4], [5] and [6] present the percentages of divestors with
divestiture experience in the prior 1, 2 and 3 years, respectively.
Year Number of
Divestitures
Number of
Divestors
% Experienced
Divestors (1-Year)
% Experienced
Divestors (2-Year)
% Experienced
Divestors (3-Year)
[1] [2] [3] [4] [5] [6]
1990 220 160 55.00% 66.88% 70.00%
1991 200 154 55.19% 71.43% 74.03%
1992 220 162 56.79% 72.84% 79.63%
1993 232 173 41.04% 67.05% 75.72%
1994 301 220 45.91% 60.45% 68.64%
1995 360 268 52.24% 63.81% 70.90%
1996 375 275 47.64% 62.55% 69.45%
1997 424 294 52.38% 67.69% 74.49%
1998 428 304 54.61% 66.12% 75.99%
1999 386 285 52.63% 64.91% 71.58%
2000 309 231 44.59% 59.31% 67.97%
2001 324 228 38.16% 61.40% 68.86%
2002 282 224 37.50% 56.25% 69.64%
2003 249 196 43.88% 57.14% 63.27%
2004 259 195 53.85% 65.13% 74.87%
2005 292 226 42.92% 54.42% 68.58%
2006 229 178 41.57% 63.48% 69.10%
2007 223 173 45.66% 60.69% 67.05%
2008 174 135 40.00% 48.89% 60.00%
2009 175 129 27.91% 44.19% 55.04%
2010 168 141 28.37% 43.97% 53.90%
2011 162 121 44.63% 51.24% 60.33%
Total 5,992 4,472
Average 272 203 45.57% 60.45% 68.59%
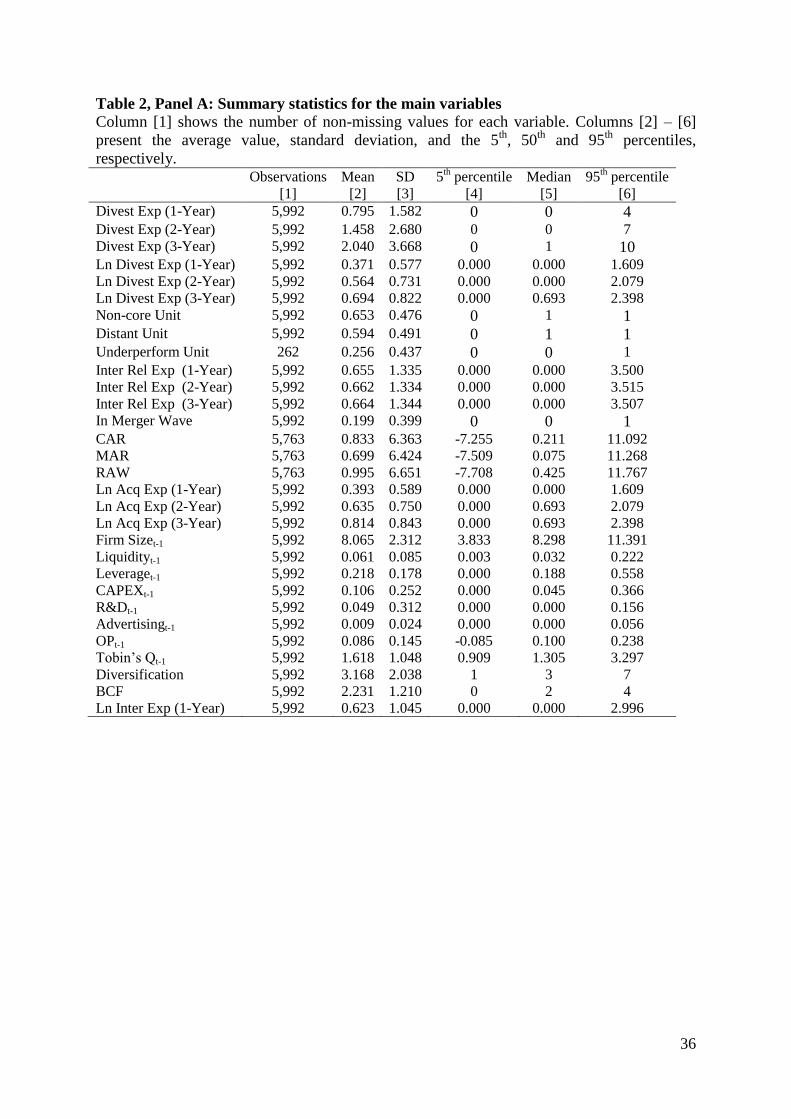
36
Table 2, Panel A: Summary statistics for the main variables
Column [1] shows the number of non-missing values for each variable. Columns [2] – [6]
present the average value, standard deviation, and the 5th
, 50th
and 95th
percentiles,
respectively. Observations Mean SD 5
th percentile Median 95
th percentile
[1] [2] [3] [4] [5] [6]
Divest Exp (1-Year) 5,992 0.795 1.582 0 0 4
Divest Exp (2-Year) 5,992 1.458 2.680 0 0 7
Divest Exp (3-Year) 5,992 2.040 3.668 0 1 10
Ln Divest Exp (1-Year) 5,992 0.371 0.577 0.000 0.000 1.609
Ln Divest Exp (2-Year) 5,992 0.564 0.731 0.000 0.000 2.079
Ln Divest Exp (3-Year) 5,992 0.694 0.822 0.000 0.693 2.398
Non-core Unit 5,992 0.653 0.476 0 1 1
Distant Unit 5,992 0.594 0.491 0 1 1
Underperform Unit 262 0.256 0.437 0 0 1
Inter Rel Exp (1-Year) 5,992 0.655 1.335 0.000 0.000 3.500
Inter Rel Exp (2-Year) 5,992 0.662 1.334 0.000 0.000 3.515
Inter Rel Exp (3-Year) 5,992 0.664 1.344 0.000 0.000 3.507
In Merger Wave 5,992 0.199 0.399 0 0 1
CAR 5,763 0.833 6.363 -7.255 0.211 11.092
MAR 5,763 0.699 6.424 -7.509 0.075 11.268
RAW 5,763 0.995 6.651 -7.708 0.425 11.767
Ln Acq Exp (1-Year) 5,992 0.393 0.589 0.000 0.000 1.609
Ln Acq Exp (2-Year) 5,992 0.635 0.750 0.000 0.693 2.079
Ln Acq Exp (3-Year) 5,992 0.814 0.843 0.000 0.693 2.398
Firm Sizet-1 5,992 8.065 2.312 3.833 8.298 11.391
Liquidityt-1 5,992 0.061 0.085 0.003 0.032 0.222
Leveraget-1 5,992 0.218 0.178 0.000 0.188 0.558
CAPEXt-1 5,992 0.106 0.252 0.000 0.045 0.366
R&Dt-1 5,992 0.049 0.312 0.000 0.000 0.156
Advertisingt-1 5,992 0.009 0.024 0.000 0.000 0.056
OPt-1 5,992 0.086 0.145 -0.085 0.100 0.238
Tobin’s Qt-1 5,992 1.618 1.048 0.909 1.305 3.297
Diversification 5,992 3.168 2.038 1 3 7
BCF 5,992 2.231 1.210 0 2 4
Ln Inter Exp (1-Year) 5,992 0.623 1.045 0.000 0.000 2.996
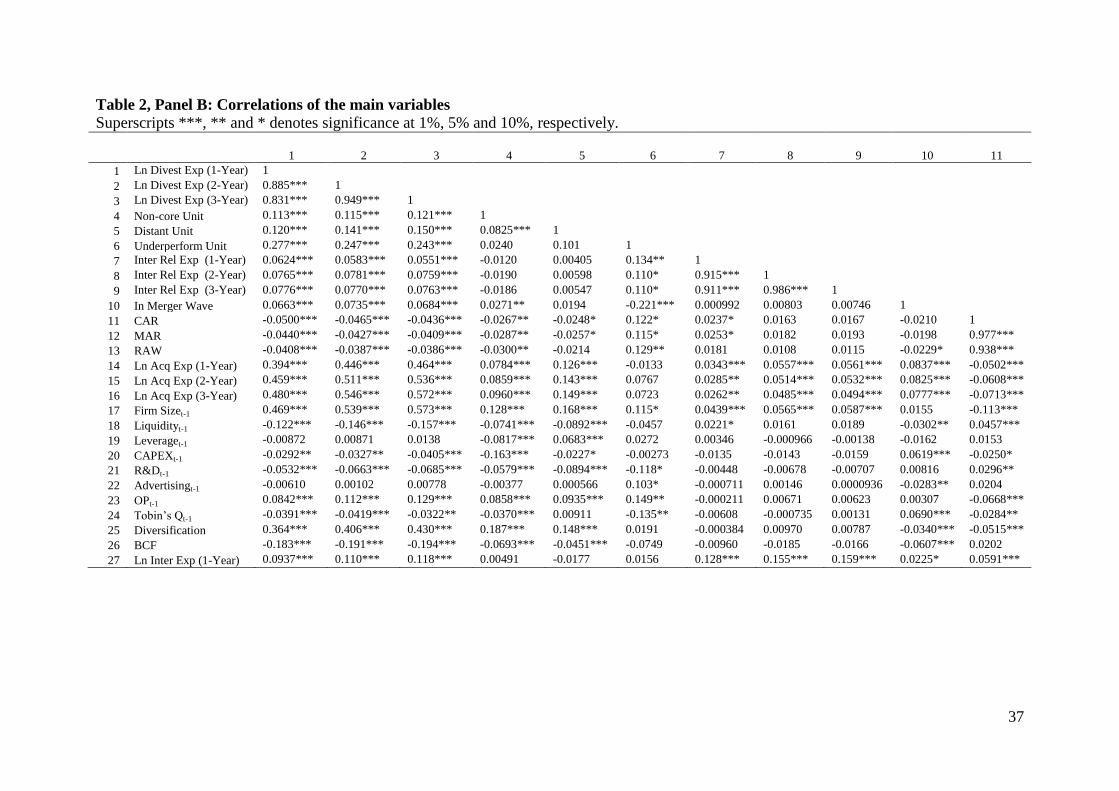
37
Table 2, Panel B: Correlations of the main variables
Superscripts ***, ** and * denotes significance at 1%, 5% and 10%, respectively.
1 2 3 4 5 6 7 8 9 10 11
1 Ln Divest Exp (1-Year) 1
2 Ln Divest Exp (2-Year) 0.885*** 1
3 Ln Divest Exp (3-Year) 0.831*** 0.949*** 1
4 Non-core Unit 0.113*** 0.115*** 0.121*** 1
5 Distant Unit 0.120*** 0.141*** 0.150*** 0.0825*** 1
6 Underperform Unit 0.277*** 0.247*** 0.243*** 0.0240 0.101 1
7 Inter Rel Exp (1-Year) 0.0624*** 0.0583*** 0.0551*** -0.0120 0.00405 0.134** 1
8 Inter Rel Exp (2-Year) 0.0765*** 0.0781*** 0.0759*** -0.0190 0.00598 0.110* 0.915*** 1
9 Inter Rel Exp (3-Year) 0.0776*** 0.0770*** 0.0763*** -0.0186 0.00547 0.110* 0.911*** 0.986*** 1
10 In Merger Wave 0.0663*** 0.0735*** 0.0684*** 0.0271** 0.0194 -0.221*** 0.000992 0.00803 0.00746 1
11 CAR -0.0500*** -0.0465*** -0.0436*** -0.0267** -0.0248* 0.122* 0.0237* 0.0163 0.0167 -0.0210 1
12 MAR -0.0440*** -0.0427*** -0.0409*** -0.0287** -0.0257* 0.115* 0.0253* 0.0182 0.0193 -0.0198 0.977***
13 RAW -0.0408*** -0.0387*** -0.0386*** -0.0300** -0.0214 0.129** 0.0181 0.0108 0.0115 -0.0229* 0.938***
14 Ln Acq Exp (1-Year) 0.394*** 0.446*** 0.464*** 0.0784*** 0.126*** -0.0133 0.0343*** 0.0557*** 0.0561*** 0.0837*** -0.0502***
15 Ln Acq Exp (2-Year) 0.459*** 0.511*** 0.536*** 0.0859*** 0.143*** 0.0767 0.0285** 0.0514*** 0.0532*** 0.0825*** -0.0608***
16 Ln Acq Exp (3-Year) 0.480*** 0.546*** 0.572*** 0.0960*** 0.149*** 0.0723 0.0262** 0.0485*** 0.0494*** 0.0777*** -0.0713***
17 Firm Sizet-1 0.469*** 0.539*** 0.573*** 0.128*** 0.168*** 0.115* 0.0439*** 0.0565*** 0.0587*** 0.0155 -0.113***
18 Liquidityt-1 -0.122*** -0.146*** -0.157*** -0.0741*** -0.0892*** -0.0457 0.0221* 0.0161 0.0189 -0.0302** 0.0457***
19 Leveraget-1 -0.00872 0.00871 0.0138 -0.0817*** 0.0683*** 0.0272 0.00346 -0.000966 -0.00138 -0.0162 0.0153
20 CAPEXt-1 -0.0292** -0.0327** -0.0405*** -0.163*** -0.0227* -0.00273 -0.0135 -0.0143 -0.0159 0.0619*** -0.0250*
21 R&Dt-1 -0.0532*** -0.0663*** -0.0685*** -0.0579*** -0.0894*** -0.118* -0.00448 -0.00678 -0.00707 0.00816 0.0296**
22 Advertisingt-1 -0.00610 0.00102 0.00778 -0.00377 0.000566 0.103* -0.000711 0.00146 0.0000936 -0.0283** 0.0204
23 OPt-1 0.0842*** 0.112*** 0.129*** 0.0858*** 0.0935*** 0.149** -0.000211 0.00671 0.00623 0.00307 -0.0668***
24 Tobin’s Qt-1 -0.0391*** -0.0419*** -0.0322** -0.0370*** 0.00911 -0.135** -0.00608 -0.000735 0.00131 0.0690*** -0.0284**
25 Diversification 0.364*** 0.406*** 0.430*** 0.187*** 0.148*** 0.0191 -0.000384 0.00970 0.00787 -0.0340*** -0.0515***
26 BCF -0.183*** -0.191*** -0.194*** -0.0693*** -0.0451*** -0.0749 -0.00960 -0.0185 -0.0166 -0.0607*** 0.0202
27 Ln Inter Exp (1-Year) 0.0937*** 0.110*** 0.118*** 0.00491 -0.0177 0.0156 0.128*** 0.155*** 0.159*** 0.0225* 0.0591***
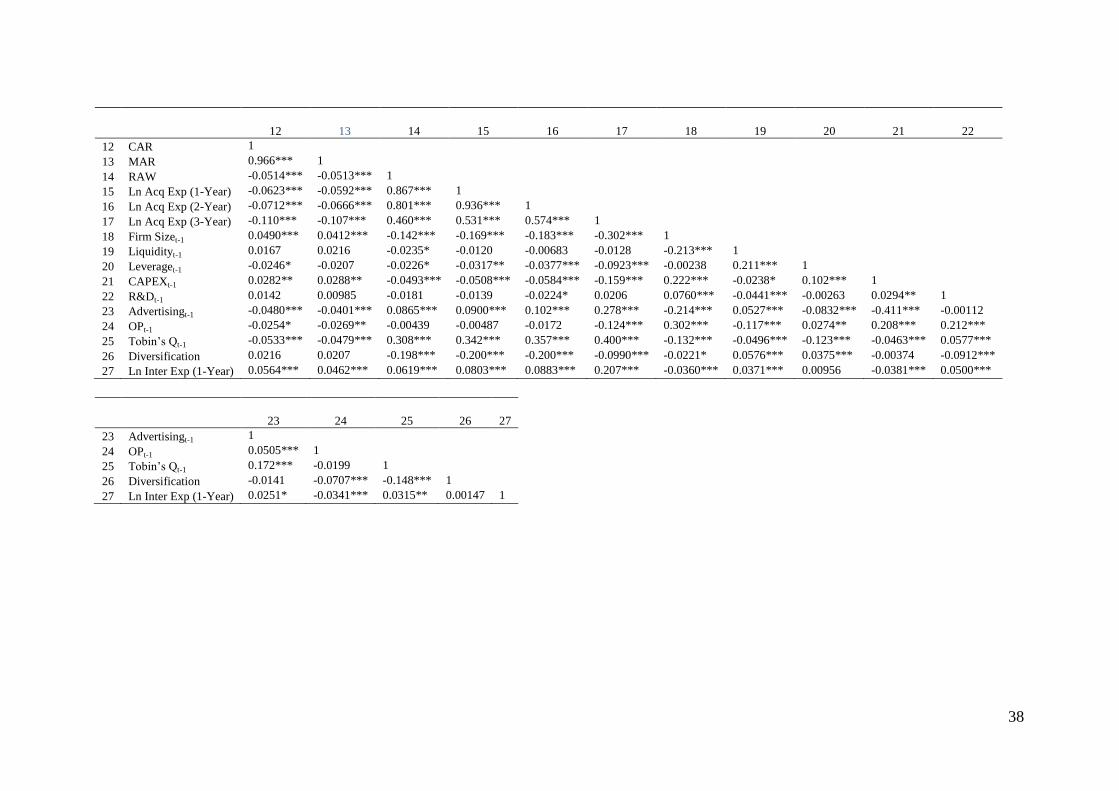
38
12 13 14 15 16 17 18 19 20 21 22
12 CAR 1
13 MAR 0.966*** 1
14 RAW -0.0514*** -0.0513*** 1
15 Ln Acq Exp (1-Year) -0.0623*** -0.0592*** 0.867*** 1
16 Ln Acq Exp (2-Year) -0.0712*** -0.0666*** 0.801*** 0.936*** 1
17 Ln Acq Exp (3-Year) -0.110*** -0.107*** 0.460*** 0.531*** 0.574*** 1
18 Firm Sizet-1 0.0490*** 0.0412*** -0.142*** -0.169*** -0.183*** -0.302*** 1
19 Liquidityt-1 0.0167 0.0216 -0.0235* -0.0120 -0.00683 -0.0128 -0.213*** 1
20 Leveraget-1 -0.0246* -0.0207 -0.0226* -0.0317** -0.0377*** -0.0923*** -0.00238 0.211*** 1
21 CAPEXt-1 0.0282** 0.0288** -0.0493*** -0.0508*** -0.0584*** -0.159*** 0.222*** -0.0238* 0.102*** 1
22 R&Dt-1 0.0142 0.00985 -0.0181 -0.0139 -0.0224* 0.0206 0.0760*** -0.0441*** -0.00263 0.0294** 1
23 Advertisingt-1 -0.0480*** -0.0401*** 0.0865*** 0.0900*** 0.102*** 0.278*** -0.214*** 0.0527*** -0.0832*** -0.411*** -0.00112
24 OPt-1 -0.0254* -0.0269** -0.00439 -0.00487 -0.0172 -0.124*** 0.302*** -0.117*** 0.0274** 0.208*** 0.212***
25 Tobin’s Qt-1 -0.0533*** -0.0479*** 0.308*** 0.342*** 0.357*** 0.400*** -0.132*** -0.0496*** -0.123*** -0.0463*** 0.0577***
26 Diversification 0.0216 0.0207 -0.198*** -0.200*** -0.200*** -0.0990*** -0.0221* 0.0576*** 0.0375*** -0.00374 -0.0912***
27 Ln Inter Exp (1-Year) 0.0564*** 0.0462*** 0.0619*** 0.0803*** 0.0883*** 0.207*** -0.0360*** 0.0371*** 0.00956 -0.0381*** 0.0500***
23 24 25 26 27
23 Advertisingt-1 1
24 OPt-1 0.0505*** 1
25 Tobin’s Qt-1 0.172*** -0.0199 1
26 Diversification -0.0141 -0.0707*** -0.148*** 1
27 Ln Inter Exp (1-Year) 0.0251* -0.0341*** 0.0315** 0.00147 1
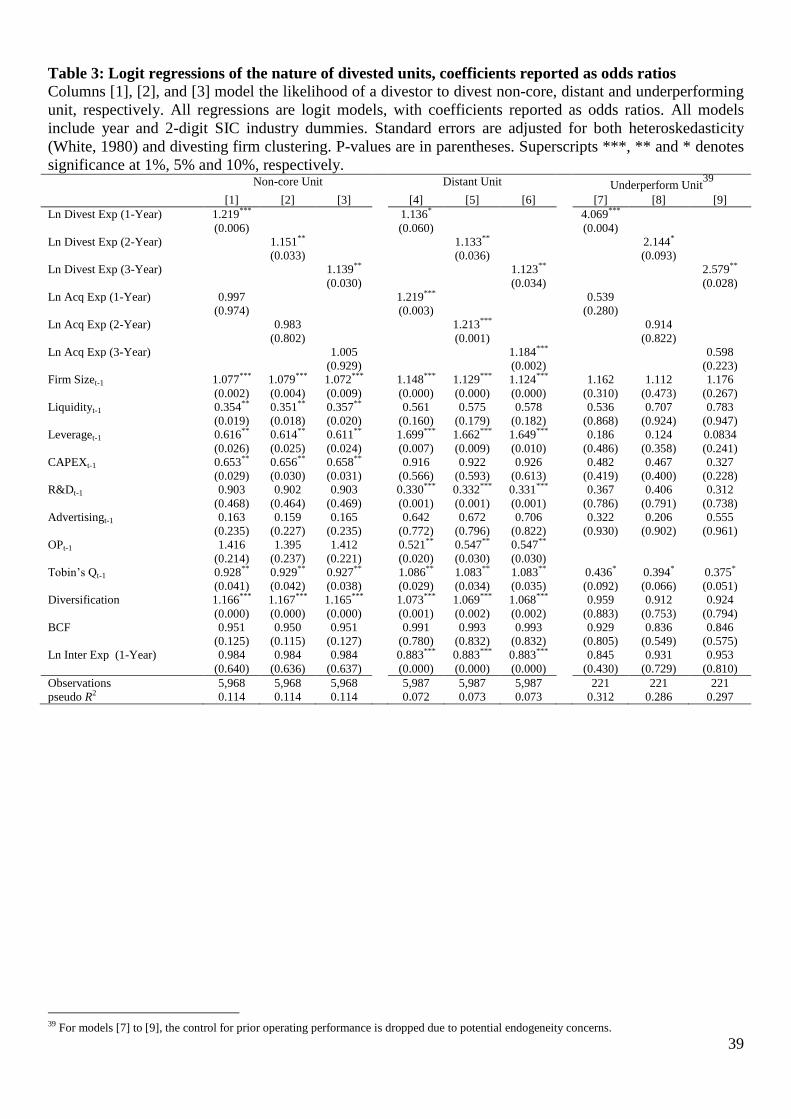
39
Table 3: Logit regressions of the nature of divested units, coefficients reported as odds ratios
Columns [1], [2], and [3] model the likelihood of a divestor to divest non-core, distant and underperforming
unit, respectively. All regressions are logit models, with coefficients reported as odds ratios. All models
include year and 2-digit SIC industry dummies. Standard errors are adjusted for both heteroskedasticity
(White, 1980) and divesting firm clustering. P-values are in parentheses. Superscripts ***, ** and * denotes
significance at 1%, 5% and 10%, respectively. Non-core Unit Distant Unit Underperform Unit
39
[1] [2] [3] [4] [5] [6] [7] [8] [9]
Ln Divest Exp (1-Year) 1.219*** 1.136* 4.069***
(0.006) (0.060) (0.004)
Ln Divest Exp (2-Year) 1.151** 1.133** 2.144*
(0.033) (0.036) (0.093)
Ln Divest Exp (3-Year) 1.139** 1.123** 2.579**
(0.030) (0.034) (0.028)
Ln Acq Exp (1-Year) 0.997 1.219*** 0.539
(0.974) (0.003) (0.280)
Ln Acq Exp (2-Year) 0.983 1.213*** 0.914
(0.802) (0.001) (0.822)
Ln Acq Exp (3-Year) 1.005 1.184*** 0.598
(0.929) (0.002) (0.223)
Firm Sizet-1 1.077*** 1.079*** 1.072*** 1.148*** 1.129*** 1.124*** 1.162 1.112 1.176
(0.002) (0.004) (0.009) (0.000) (0.000) (0.000) (0.310) (0.473) (0.267)
Liquidityt-1 0.354** 0.351** 0.357** 0.561 0.575 0.578 0.536 0.707 0.783
(0.019) (0.018) (0.020) (0.160) (0.179) (0.182) (0.868) (0.924) (0.947)
Leveraget-1 0.616** 0.614** 0.611** 1.699*** 1.662*** 1.649*** 0.186 0.124 0.0834
(0.026) (0.025) (0.024) (0.007) (0.009) (0.010) (0.486) (0.358) (0.241)
CAPEXt-1 0.653** 0.656** 0.658** 0.916 0.922 0.926 0.482 0.467 0.327
(0.029) (0.030) (0.031) (0.566) (0.593) (0.613) (0.419) (0.400) (0.228)
R&Dt-1 0.903 0.902 0.903 0.330*** 0.332*** 0.331*** 0.367 0.406 0.312
(0.468) (0.464) (0.469) (0.001) (0.001) (0.001) (0.786) (0.791) (0.738)
Advertisingt-1 0.163 0.159 0.165 0.642 0.672 0.706 0.322 0.206 0.555
(0.235) (0.227) (0.235) (0.772) (0.796) (0.822) (0.930) (0.902) (0.961)
OPt-1 1.416 1.395 1.412 0.521** 0.547** 0.547**
(0.214) (0.237) (0.221) (0.020) (0.030) (0.030)
Tobin’s Qt-1 0.928** 0.929** 0.927** 1.086** 1.083** 1.083** 0.436* 0.394* 0.375*
(0.041) (0.042) (0.038) (0.029) (0.034) (0.035) (0.092) (0.066) (0.051)
Diversification 1.166*** 1.167*** 1.165*** 1.073*** 1.069*** 1.068*** 0.959 0.912 0.924
(0.000) (0.000) (0.000) (0.001) (0.002) (0.002) (0.883) (0.753) (0.794)
BCF 0.951 0.950 0.951 0.991 0.993 0.993 0.929 0.836 0.846
(0.125) (0.115) (0.127) (0.780) (0.832) (0.832) (0.805) (0.549) (0.575)
Ln Inter Exp (1-Year) 0.984 0.984 0.984 0.883*** 0.883*** 0.883*** 0.845 0.931 0.953
(0.640) (0.636) (0.637) (0.000) (0.000) (0.000) (0.430) (0.729) (0.810)
Observations 5,968 5,968 5,968 5,987 5,987 5,987 221 221 221
pseudo R2 0.114 0.114 0.114 0.072 0.073 0.073 0.312 0.286 0.297
39 For models [7] to [9], the control for prior operating performance is dropped due to potential endogeneity concerns.
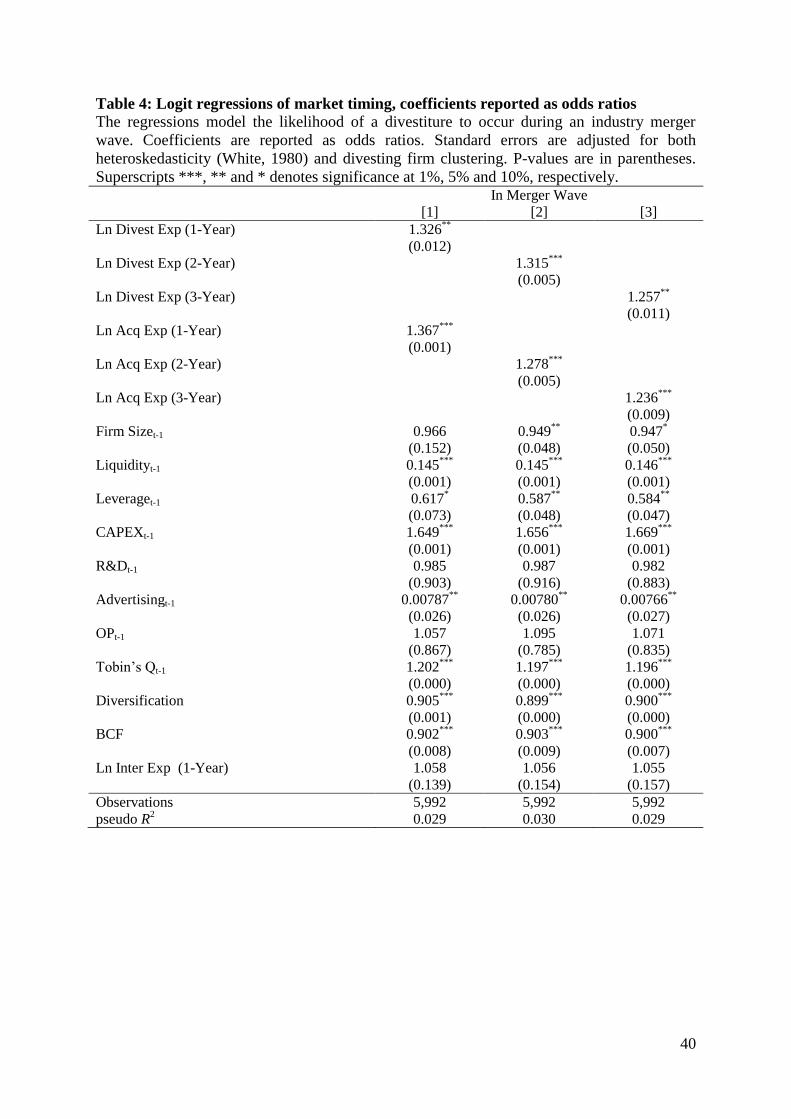
40
Table 4: Logit regressions of market timing, coefficients reported as odds ratios
The regressions model the likelihood of a divestiture to occur during an industry merger
wave. Coefficients are reported as odds ratios. Standard errors are adjusted for both
heteroskedasticity (White, 1980) and divesting firm clustering. P-values are in parentheses.
Superscripts ***, ** and * denotes significance at 1%, 5% and 10%, respectively. In Merger Wave
[1] [2] [3]
Ln Divest Exp (1-Year) 1.326**
(0.012)
Ln Divest Exp (2-Year) 1.315***
(0.005)
Ln Divest Exp (3-Year) 1.257**
(0.011)
Ln Acq Exp (1-Year) 1.367***
(0.001)
Ln Acq Exp (2-Year) 1.278***
(0.005)
Ln Acq Exp (3-Year) 1.236***
(0.009)
Firm Sizet-1 0.966 0.949**
0.947*
(0.152) (0.048) (0.050)
Liquidityt-1 0.145***
0.145***
0.146***
(0.001) (0.001) (0.001)
Leveraget-1 0.617* 0.587
** 0.584
**
(0.073) (0.048) (0.047)
CAPEXt-1 1.649***
1.656***
1.669***
(0.001) (0.001) (0.001)
R&Dt-1 0.985 0.987 0.982
(0.903) (0.916) (0.883)
Advertisingt-1 0.00787**
0.00780**
0.00766**
(0.026) (0.026) (0.027)
OPt-1 1.057 1.095 1.071
(0.867) (0.785) (0.835)
Tobin’s Qt-1 1.202***
1.197***
1.196***
(0.000) (0.000) (0.000)
Diversification 0.905***
0.899***
0.900***
(0.001) (0.000) (0.000)
BCF 0.902***
0.903***
0.900***
(0.008) (0.009) (0.007)
Ln Inter Exp (1-Year) 1.058 1.056 1.055
(0.139) (0.154) (0.157)
Observations 5,992 5,992 5,992
pseudo R2 0.029 0.030 0.029
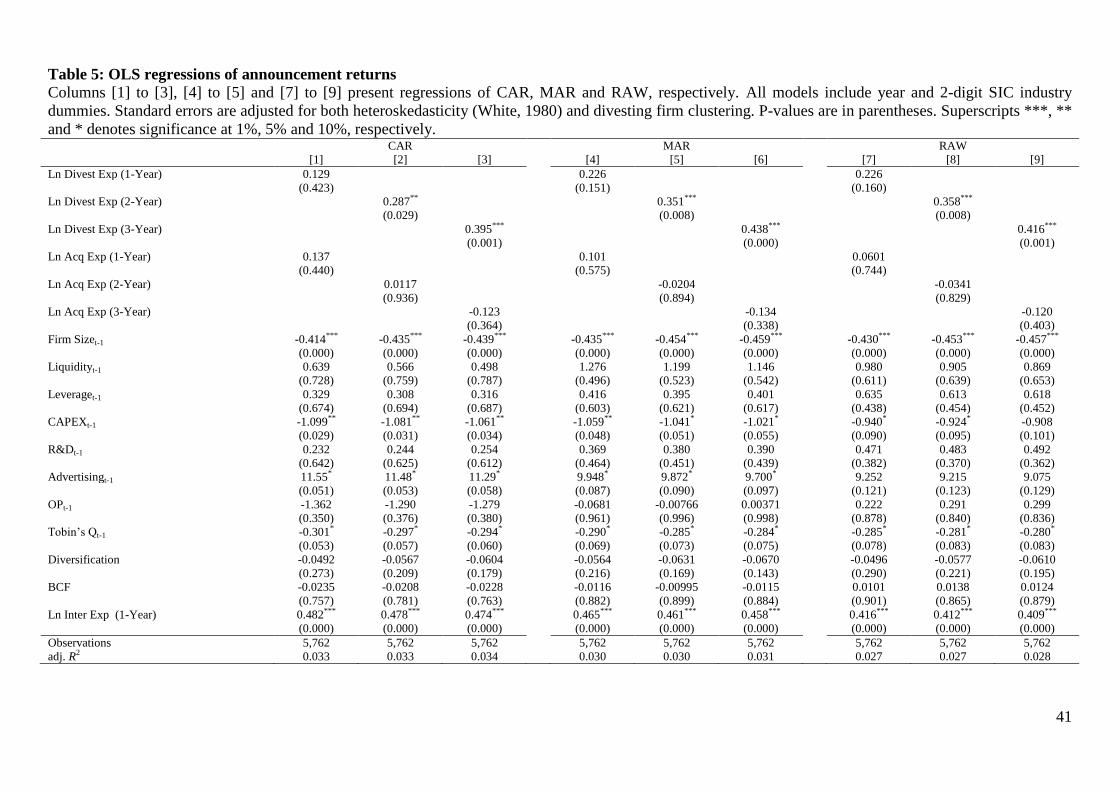
41
Table 5: OLS regressions of announcement returns
Columns [1] to [3], [4] to [5] and [7] to [9] present regressions of CAR, MAR and RAW, respectively. All models include year and 2-digit SIC industry
dummies. Standard errors are adjusted for both heteroskedasticity (White, 1980) and divesting firm clustering. P-values are in parentheses. Superscripts ***, **
and * denotes significance at 1%, 5% and 10%, respectively. CAR MAR RAW
[1] [2] [3] [4] [5] [6] [7] [8] [9]
Ln Divest Exp (1-Year) 0.129 0.226 0.226
(0.423) (0.151) (0.160)
Ln Divest Exp (2-Year) 0.287** 0.351*** 0.358***
(0.029) (0.008) (0.008)
Ln Divest Exp (3-Year) 0.395*** 0.438*** 0.416***
(0.001) (0.000) (0.001)
Ln Acq Exp (1-Year) 0.137 0.101 0.0601
(0.440) (0.575) (0.744)
Ln Acq Exp (2-Year) 0.0117 -0.0204 -0.0341
(0.936) (0.894) (0.829)
Ln Acq Exp (3-Year) -0.123 -0.134 -0.120
(0.364) (0.338) (0.403)
Firm Sizet-1 -0.414*** -0.435*** -0.439*** -0.435*** -0.454*** -0.459*** -0.430*** -0.453*** -0.457***
(0.000) (0.000) (0.000) (0.000) (0.000) (0.000) (0.000) (0.000) (0.000)
Liquidityt-1 0.639 0.566 0.498 1.276 1.199 1.146 0.980 0.905 0.869
(0.728) (0.759) (0.787) (0.496) (0.523) (0.542) (0.611) (0.639) (0.653)
Leveraget-1 0.329 0.308 0.316 0.416 0.395 0.401 0.635 0.613 0.618
(0.674) (0.694) (0.687) (0.603) (0.621) (0.617) (0.438) (0.454) (0.452)
CAPEXt-1 -1.099** -1.081** -1.061** -1.059** -1.041* -1.021* -0.940* -0.924* -0.908
(0.029) (0.031) (0.034) (0.048) (0.051) (0.055) (0.090) (0.095) (0.101)
R&Dt-1 0.232 0.244 0.254 0.369 0.380 0.390 0.471 0.483 0.492
(0.642) (0.625) (0.612) (0.464) (0.451) (0.439) (0.382) (0.370) (0.362)
Advertisingt-1 11.55* 11.48* 11.29* 9.948* 9.872* 9.700* 9.252 9.215 9.075
(0.051) (0.053) (0.058) (0.087) (0.090) (0.097) (0.121) (0.123) (0.129)
OPt-1 -1.362 -1.290 -1.279 -0.0681 -0.00766 0.00371 0.222 0.291 0.299
(0.350) (0.376) (0.380) (0.961) (0.996) (0.998) (0.878) (0.840) (0.836)
Tobin’s Qt-1 -0.301* -0.297* -0.294* -0.290* -0.285* -0.284* -0.285* -0.281* -0.280*
(0.053) (0.057) (0.060) (0.069) (0.073) (0.075) (0.078) (0.083) (0.083)
Diversification -0.0492 -0.0567 -0.0604 -0.0564 -0.0631 -0.0670 -0.0496 -0.0577 -0.0610
(0.273) (0.209) (0.179) (0.216) (0.169) (0.143) (0.290) (0.221) (0.195)
BCF -0.0235 -0.0208 -0.0228 -0.0116 -0.00995 -0.0115 0.0101 0.0138 0.0124
(0.757) (0.781) (0.763) (0.882) (0.899) (0.884) (0.901) (0.865) (0.879)
Ln Inter Exp (1-Year) 0.482*** 0.478*** 0.474*** 0.465*** 0.461*** 0.458*** 0.416*** 0.412*** 0.409***
(0.000) (0.000) (0.000) (0.000) (0.000) (0.000) (0.000) (0.000) (0.000)
Observations 5,762 5,762 5,762 5,762 5,762 5,762 5,762 5,762 5,762
adj. R2 0.033 0.033 0.034 0.030 0.030 0.031 0.027 0.027 0.028
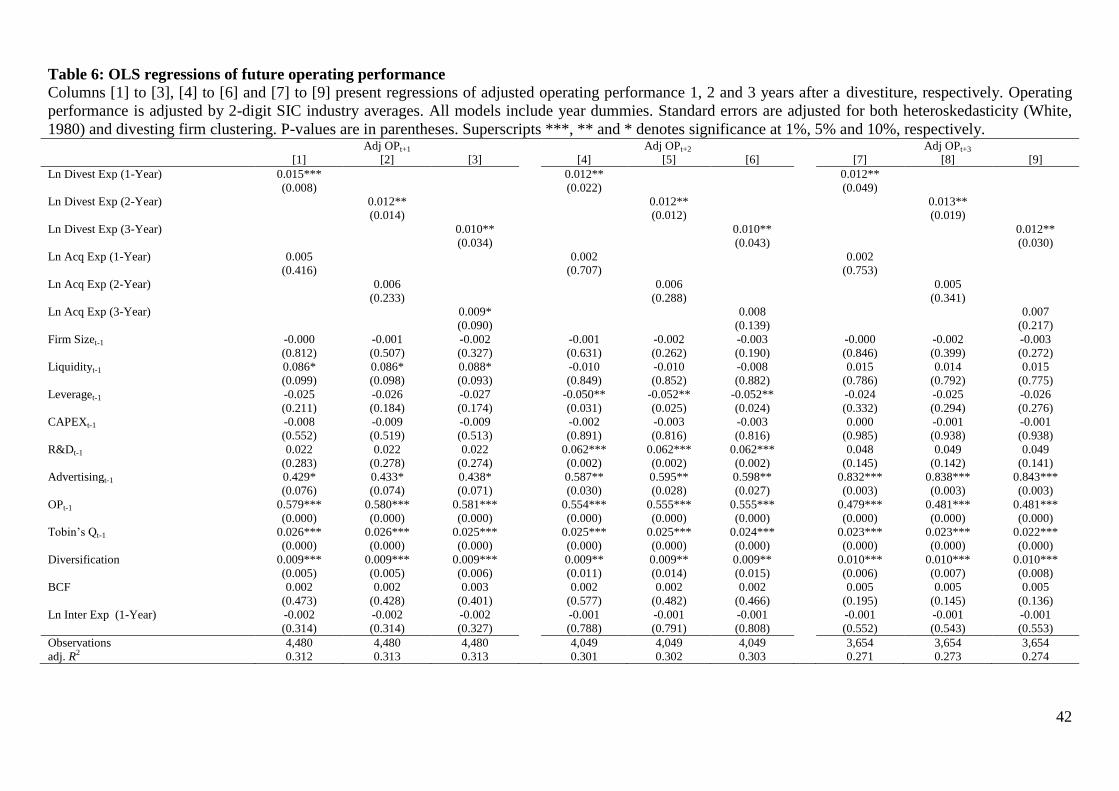
42
Table 6: OLS regressions of future operating performance
Columns [1] to [3], [4] to [6] and [7] to [9] present regressions of adjusted operating performance 1, 2 and 3 years after a divestiture, respectively. Operating
performance is adjusted by 2-digit SIC industry averages. All models include year dummies. Standard errors are adjusted for both heteroskedasticity (White,
1980) and divesting firm clustering. P-values are in parentheses. Superscripts ***, ** and * denotes significance at 1%, 5% and 10%, respectively. Adj OPt+1 Adj OPt+2 Adj OPt+3
[1] [2] [3] [4] [5] [6] [7] [8] [9]
Ln Divest Exp (1-Year) 0.015*** 0.012** 0.012**
(0.008) (0.022) (0.049)
Ln Divest Exp (2-Year) 0.012** 0.012** 0.013**
(0.014) (0.012) (0.019)
Ln Divest Exp (3-Year) 0.010** 0.010** 0.012**
(0.034) (0.043) (0.030)
Ln Acq Exp (1-Year) 0.005 0.002 0.002
(0.416) (0.707) (0.753)
Ln Acq Exp (2-Year) 0.006 0.006 0.005
(0.233) (0.288) (0.341)
Ln Acq Exp (3-Year) 0.009* 0.008 0.007
(0.090) (0.139) (0.217)
Firm Sizet-1 -0.000 -0.001 -0.002 -0.001 -0.002 -0.003 -0.000 -0.002 -0.003
(0.812) (0.507) (0.327) (0.631) (0.262) (0.190) (0.846) (0.399) (0.272)
Liquidityt-1 0.086* 0.086* 0.088* -0.010 -0.010 -0.008 0.015 0.014 0.015
(0.099) (0.098) (0.093) (0.849) (0.852) (0.882) (0.786) (0.792) (0.775)
Leveraget-1 -0.025 -0.026 -0.027 -0.050** -0.052** -0.052** -0.024 -0.025 -0.026
(0.211) (0.184) (0.174) (0.031) (0.025) (0.024) (0.332) (0.294) (0.276)
CAPEXt-1 -0.008 -0.009 -0.009 -0.002 -0.003 -0.003 0.000 -0.001 -0.001
(0.552) (0.519) (0.513) (0.891) (0.816) (0.816) (0.985) (0.938) (0.938)
R&Dt-1 0.022 0.022 0.022 0.062*** 0.062*** 0.062*** 0.048 0.049 0.049
(0.283) (0.278) (0.274) (0.002) (0.002) (0.002) (0.145) (0.142) (0.141)
Advertisingt-1 0.429* 0.433* 0.438* 0.587** 0.595** 0.598** 0.832*** 0.838*** 0.843***
(0.076) (0.074) (0.071) (0.030) (0.028) (0.027) (0.003) (0.003) (0.003)
OPt-1 0.579*** 0.580*** 0.581*** 0.554*** 0.555*** 0.555*** 0.479*** 0.481*** 0.481***
(0.000) (0.000) (0.000) (0.000) (0.000) (0.000) (0.000) (0.000) (0.000)
Tobin’s Qt-1 0.026*** 0.026*** 0.025*** 0.025*** 0.025*** 0.024*** 0.023*** 0.023*** 0.022***
(0.000) (0.000) (0.000) (0.000) (0.000) (0.000) (0.000) (0.000) (0.000)
Diversification 0.009*** 0.009*** 0.009*** 0.009** 0.009** 0.009** 0.010*** 0.010*** 0.010***
(0.005) (0.005) (0.006) (0.011) (0.014) (0.015) (0.006) (0.007) (0.008)
BCF 0.002 0.002 0.003 0.002 0.002 0.002 0.005 0.005 0.005
(0.473) (0.428) (0.401) (0.577) (0.482) (0.466) (0.195) (0.145) (0.136)
Ln Inter Exp (1-Year) -0.002 -0.002 -0.002 -0.001 -0.001 -0.001 -0.001 -0.001 -0.001
(0.314) (0.314) (0.327) (0.788) (0.791) (0.808) (0.552) (0.543) (0.553)
Observations 4,480 4,480 4,480 4,049 4,049 4,049 3,654 3,654 3,654
adj. R2 0.312 0.313 0.313 0.301 0.302 0.303 0.271 0.273 0.274
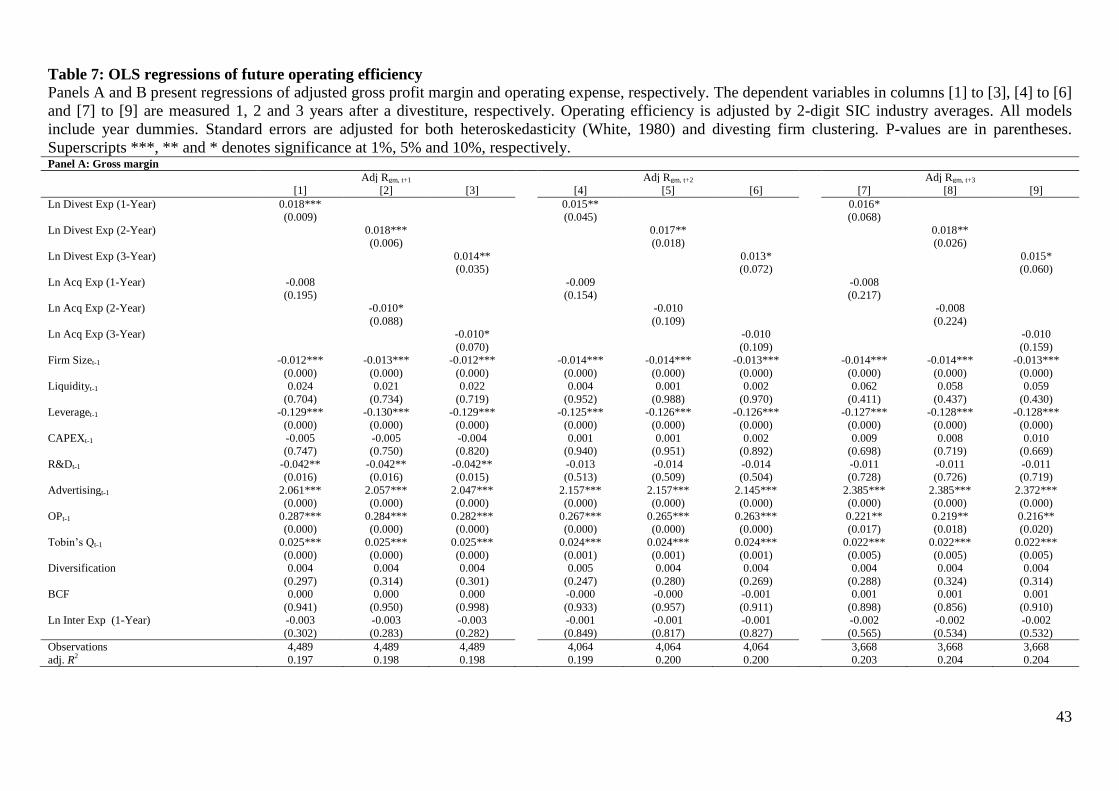
43
Table 7: OLS regressions of future operating efficiency
Panels A and B present regressions of adjusted gross profit margin and operating expense, respectively. The dependent variables in columns [1] to [3], [4] to [6]
and [7] to [9] are measured 1, 2 and 3 years after a divestiture, respectively. Operating efficiency is adjusted by 2-digit SIC industry averages. All models
include year dummies. Standard errors are adjusted for both heteroskedasticity (White, 1980) and divesting firm clustering. P-values are in parentheses.
Superscripts ***, ** and * denotes significance at 1%, 5% and 10%, respectively. Panel A: Gross margin
Adj Rgm, t+1 Adj Rgm, t+2 Adj Rgm, t+3
[1] [2] [3] [4] [5] [6] [7] [8] [9]
Ln Divest Exp (1-Year) 0.018*** 0.015** 0.016*
(0.009) (0.045) (0.068)
Ln Divest Exp (2-Year) 0.018*** 0.017** 0.018**
(0.006) (0.018) (0.026)
Ln Divest Exp (3-Year) 0.014** 0.013* 0.015*
(0.035) (0.072) (0.060)
Ln Acq Exp (1-Year) -0.008 -0.009 -0.008
(0.195) (0.154) (0.217)
Ln Acq Exp (2-Year) -0.010* -0.010 -0.008
(0.088) (0.109) (0.224)
Ln Acq Exp (3-Year) -0.010* -0.010 -0.010
(0.070) (0.109) (0.159)
Firm Sizet-1 -0.012*** -0.013*** -0.012*** -0.014*** -0.014*** -0.013*** -0.014*** -0.014*** -0.013***
(0.000) (0.000) (0.000) (0.000) (0.000) (0.000) (0.000) (0.000) (0.000)
Liquidityt-1 0.024 0.021 0.022 0.004 0.001 0.002 0.062 0.058 0.059
(0.704) (0.734) (0.719) (0.952) (0.988) (0.970) (0.411) (0.437) (0.430)
Leveraget-1 -0.129*** -0.130*** -0.129*** -0.125*** -0.126*** -0.126*** -0.127*** -0.128*** -0.128***
(0.000) (0.000) (0.000) (0.000) (0.000) (0.000) (0.000) (0.000) (0.000)
CAPEXt-1 -0.005 -0.005 -0.004 0.001 0.001 0.002 0.009 0.008 0.010
(0.747) (0.750) (0.820) (0.940) (0.951) (0.892) (0.698) (0.719) (0.669)
R&Dt-1 -0.042** -0.042** -0.042** -0.013 -0.014 -0.014 -0.011 -0.011 -0.011
(0.016) (0.016) (0.015) (0.513) (0.509) (0.504) (0.728) (0.726) (0.719)
Advertisingt-1 2.061*** 2.057*** 2.047*** 2.157*** 2.157*** 2.145*** 2.385*** 2.385*** 2.372***
(0.000) (0.000) (0.000) (0.000) (0.000) (0.000) (0.000) (0.000) (0.000)
OPt-1 0.287*** 0.284*** 0.282*** 0.267*** 0.265*** 0.263*** 0.221** 0.219** 0.216**
(0.000) (0.000) (0.000) (0.000) (0.000) (0.000) (0.017) (0.018) (0.020)
Tobin’s Qt-1 0.025*** 0.025*** 0.025*** 0.024*** 0.024*** 0.024*** 0.022*** 0.022*** 0.022***
(0.000) (0.000) (0.000) (0.001) (0.001) (0.001) (0.005) (0.005) (0.005)
Diversification 0.004 0.004 0.004 0.005 0.004 0.004 0.004 0.004 0.004
(0.297) (0.314) (0.301) (0.247) (0.280) (0.269) (0.288) (0.324) (0.314)
BCF 0.000 0.000 0.000 -0.000 -0.000 -0.001 0.001 0.001 0.001
(0.941) (0.950) (0.998) (0.933) (0.957) (0.911) (0.898) (0.856) (0.910)
Ln Inter Exp (1-Year) -0.003 -0.003 -0.003 -0.001 -0.001 -0.001 -0.002 -0.002 -0.002
(0.302) (0.283) (0.282) (0.849) (0.817) (0.827) (0.565) (0.534) (0.532)
Observations 4,489 4,489 4,489 4,064 4,064 4,064 3,668 3,668 3,668
adj. R2 0.197 0.198 0.198 0.199 0.200 0.200 0.203 0.204 0.204
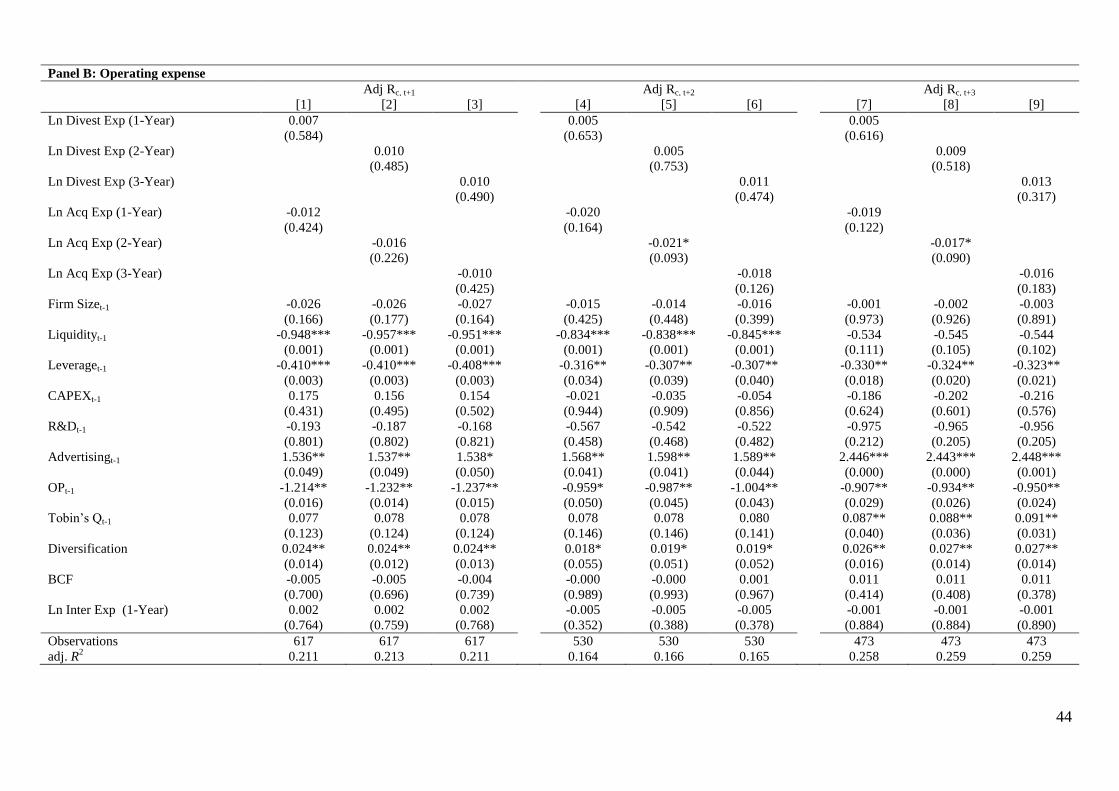
44
Panel B: Operating expense
Adj Rc, t+1 Adj Rc, t+2 Adj Rc, t+3
[1] [2] [3] [4] [5] [6] [7] [8] [9]
Ln Divest Exp (1-Year) 0.007 0.005 0.005
(0.584) (0.653) (0.616)
Ln Divest Exp (2-Year) 0.010 0.005 0.009
(0.485) (0.753) (0.518)
Ln Divest Exp (3-Year) 0.010 0.011 0.013
(0.490) (0.474) (0.317)
Ln Acq Exp (1-Year) -0.012 -0.020 -0.019
(0.424) (0.164) (0.122)
Ln Acq Exp (2-Year) -0.016 -0.021* -0.017*
(0.226) (0.093) (0.090)
Ln Acq Exp (3-Year) -0.010 -0.018 -0.016
(0.425) (0.126) (0.183)
Firm Sizet-1 -0.026 -0.026 -0.027 -0.015 -0.014 -0.016 -0.001 -0.002 -0.003
(0.166) (0.177) (0.164) (0.425) (0.448) (0.399) (0.973) (0.926) (0.891)
Liquidityt-1 -0.948*** -0.957*** -0.951*** -0.834*** -0.838*** -0.845*** -0.534 -0.545 -0.544
(0.001) (0.001) (0.001) (0.001) (0.001) (0.001) (0.111) (0.105) (0.102)
Leveraget-1 -0.410*** -0.410*** -0.408*** -0.316** -0.307** -0.307** -0.330** -0.324** -0.323**
(0.003) (0.003) (0.003) (0.034) (0.039) (0.040) (0.018) (0.020) (0.021)
CAPEXt-1 0.175 0.156 0.154 -0.021 -0.035 -0.054 -0.186 -0.202 -0.216
(0.431) (0.495) (0.502) (0.944) (0.909) (0.856) (0.624) (0.601) (0.576)
R&Dt-1 -0.193 -0.187 -0.168 -0.567 -0.542 -0.522 -0.975 -0.965 -0.956
(0.801) (0.802) (0.821) (0.458) (0.468) (0.482) (0.212) (0.205) (0.205)
Advertisingt-1 1.536** 1.537** 1.538* 1.568** 1.598** 1.589** 2.446*** 2.443*** 2.448***
(0.049) (0.049) (0.050) (0.041) (0.041) (0.044) (0.000) (0.000) (0.001)
OPt-1 -1.214** -1.232** -1.237** -0.959* -0.987** -1.004** -0.907** -0.934** -0.950**
(0.016) (0.014) (0.015) (0.050) (0.045) (0.043) (0.029) (0.026) (0.024)
Tobin’s Qt-1 0.077 0.078 0.078 0.078 0.078 0.080 0.087** 0.088** 0.091**
(0.123) (0.124) (0.124) (0.146) (0.146) (0.141) (0.040) (0.036) (0.031)
Diversification 0.024** 0.024** 0.024** 0.018* 0.019* 0.019* 0.026** 0.027** 0.027**
(0.014) (0.012) (0.013) (0.055) (0.051) (0.052) (0.016) (0.014) (0.014)
BCF -0.005 -0.005 -0.004 -0.000 -0.000 0.001 0.011 0.011 0.011
(0.700) (0.696) (0.739) (0.989) (0.993) (0.967) (0.414) (0.408) (0.378)
Ln Inter Exp (1-Year) 0.002 0.002 0.002 -0.005 -0.005 -0.005 -0.001 -0.001 -0.001
(0.764) (0.759) (0.768) (0.352) (0.388) (0.378) (0.884) (0.884) (0.890)
Observations 617 617 617 530 530 530 473 473 473
adj. R2 0.211 0.213 0.211 0.164 0.166 0.165 0.258 0.259 0.259

45
Table 8: Logit regressions of the likelihood of future acquisitions (coefficients are reported as odds ratios)
Columns [1] to [3], [4] to [6], [7] to [9] and [10] to [11] model the likelihood of a divestor to acquire within 1, 2, 3 and 4 years after a divestiture, respectively.
All regressions are logit models, with coefficients reported as odds ratios. All models include year and 2-digit SIC industry dummies. Standard errors are
adjusted for both heteroskedasticity (White, 1980) and divesting firm clustering. P-values are in parentheses. Superscripts ***, ** and * denotes significance at
1%, 5% and 10%, respectively. Acquisitiont, t+1 Acquisition t, t+2 Acquisition t, t+3 Acquisition t, t+4
[1] [2] [3] [4] [5] [6] [7] [8] [9] [10] [11] [12]
Ln Divest Exp (1-Year) 1.239** 1.352*** 1.223* 1.189
(0.022) (0.002) (0.081) (0.131)
Ln Divest Exp (2-Year) 1.254*** 1.344*** 1.225** 1.208**
(0.005) (0.000) (0.030) (0.043)
Ln Divest Exp (3-Year) 1.172** 1.245*** 1.156* 1.163*
(0.029) (0.004) (0.094) (0.081)
Ln Acq Exp (1-Year) 2.030*** 1.961*** 1.952*** 1.880***
(0.000) (0.000) (0.000) (0.000)
Ln Acq Exp (2-Year) 1.847*** 1.810*** 1.837*** 1.762***
(0.000) (0.000) (0.000) (0.000)
Ln Acq Exp (3-Year) 1.667*** 1.622*** 1.701*** 1.651***
(0.000) (0.000) (0.000) (0.000)
Firm Sizet-1 1.440*** 1.383*** 1.390*** 1.478*** 1.419*** 1.426*** 1.536*** 1.479*** 1.475*** 1.560*** 1.506*** 1.496***
(0.000) (0.000) (0.000) (0.000) (0.000) (0.000) (0.000) (0.000) (0.000) (0.000) (0.000) (0.000)
Liquidityt-1 0.858 0.901 0.916 1.041 1.108 1.129 1.187 1.290 1.321 0.561 0.611 0.628
(0.834) (0.887) (0.905) (0.950) (0.870) (0.847) (0.782) (0.678) (0.649) (0.356) (0.429) (0.453)
Leveraget-1 1.149 1.032 1.026 1.003 0.912 0.908 0.824 0.758 0.750 0.774 0.719 0.709
(0.672) (0.924) (0.937) (0.992) (0.767) (0.758) (0.543) (0.385) (0.365) (0.436) (0.315) (0.295)
CAPEXt-1 1.000 1.005 1.020 1.084 1.111 1.131 0.865 0.883 0.895 0.792 0.809 0.819
(0.999) (0.986) (0.945) (0.745) (0.673) (0.623) (0.570) (0.626) (0.667) (0.389) (0.431) (0.460)
R&Dt-1 1.198 1.211 1.206 1.098 1.104 1.099 1.086 1.089 1.085 1.116 1.119 1.118
(0.496) (0.465) (0.476) (0.673) (0.653) (0.667) (0.699) (0.692) (0.707) (0.563) (0.550) (0.557)
Advertisingt-1 0.0176* 0.0171* 0.0169* 0.0100** 0.00870** 0.00870** 0.0562 0.0514 0.0592 0.0201 0.0188 0.0236
(0.053) (0.057) (0.060) (0.036) (0.031) (0.031) (0.207) (0.191) (0.211) (0.114) (0.109) (0.130)
OPt-1 11.10*** 12.17*** 11.37*** 8.242*** 8.918*** 8.488*** 7.611*** 8.284*** 8.034*** 7.134*** 7.820*** 7.728***
(0.001) (0.000) (0.000) (0.000) (0.000) (0.000) (0.000) (0.000) (0.000) (0.000) (0.000) (0.000)
Tobin’s Qt-1 1.084 1.078 1.078 1.093 1.088 1.091 1.149** 1.144** 1.147** 1.163*** 1.158** 1.160**
(0.167) (0.197) (0.206) (0.103) (0.123) (0.118) (0.012) (0.016) (0.015) (0.009) (0.011) (0.010)
Diversification 1.059 1.050 1.054 1.079** 1.073** 1.073** 1.068* 1.063 1.061 1.070 1.066 1.063
(0.104) (0.174) (0.144) (0.031) (0.044) (0.045) (0.092) (0.119) (0.129) (0.111) (0.131) (0.146)
BCF 0.842*** 0.840*** 0.836*** 0.877*** 0.874*** 0.872*** 0.899** 0.896** 0.897** 0.905* 0.902* 0.903*
(0.000) (0.000) (0.000) (0.004) (0.003) (0.003) (0.034) (0.029) (0.030) (0.063) (0.055) (0.059)
Ln Inter Exp (1-Year) 0.939* 0.934* 0.935* 0.960 0.958 0.958 0.967 0.967 0.966 0.944 0.944 0.943
(0.090) (0.062) (0.066) (0.236) (0.218) (0.219) (0.332) (0.326) (0.315) (0.108) (0.109) (0.103)
Observations 5,728 5,728 5,728 5,583 5,583 5,583 5,420 5,420 5,420 5,248 5,248 5,248
pseudo R2 0.234 0.236 0.231 0.238 0.242 0.237 0.246 0.250 0.248 0.250 0.253 0.252

46
Table 9: OLS regressions of average announcement returns to future acquisitions
Columns [1] to [3], [4] to [6], [7] to [9] and [10] to [11] present regressions of average announcement returns for acquisitions conducted by a divestor within 1,
2, 3 and 4 years after a divestiture, respectively. All models include year and 2-digit SIC industry dummies. Standard errors are adjusted for both
heteroskedasticity (White, 1980) and divesting firm clustering. P-values are in parentheses. Superscripts ***, ** and * denotes significance at 1%, 5% and 10%,
respectively. Avg Acq Ann Rett, t+1 Avg Acq Ann Rett, t+2 Avg Acq Ann Rett, t+3 Avg Acq Ann Rett, t+4
CAR MAR RAW CAR MAR RAW CAR MAR RAW CAR MAR RAW
[1] [2] [3] [4] [5] [6] [7] [8] [9] [10] [11] [12]
Ln Divest Exp (1-Year) 0.002* 0.002 0.003* 0.003* 0.003* 0.003* 0.003* 0.003* 0.003** 0.003* 0.003* 0.003**
(0.098) (0.118) (0.092) (0.063) (0.084) (0.076) (0.057) (0.057) (0.044) (0.063) (0.054) (0.034)
Ln Acq Exp (1-Year) 0.002 0.001 0.001 0.001 0.000 -0.000 0.000 -0.000 -0.001 0.000 -0.000 -0.001
(0.151) (0.404) (0.544) (0.448) (0.788) (0.934) (0.875) (0.787) (0.503) (0.784) (0.861) (0.491)
Firm Sizet-1 -0.003*** -0.003*** -0.003*** -0.003*** -0.003*** -0.003*** -0.002* -0.002** -0.002** -0.002** -0.002** -0.002**
(0.010) (0.008) (0.008) (0.003) (0.002) (0.004) (0.055) (0.034) (0.038) (0.024) (0.014) (0.011)
Liquidityt-1 0.027 0.020 0.008 0.001 -0.001 -0.011 -0.019 -0.022 -0.030 -0.022 -0.024 -0.032
(0.318) (0.427) (0.782) (0.949) (0.951) (0.667) (0.456) (0.381) (0.241) (0.353) (0.294) (0.192)
Leveraget-1 0.014 0.015 0.013 -0.002 -0.002 -0.006 -0.004 -0.005 -0.008 -0.003 -0.004 -0.007
(0.244) (0.227) (0.336) (0.874) (0.883) (0.647) (0.768) (0.730) (0.565) (0.854) (0.782) (0.618)
CAPEXt-1 -0.024** -0.017** -0.013* -0.024** -0.016** -0.009 -0.026** -0.018** -0.010* -0.025** -0.017** -0.009*
(0.032) (0.030) (0.059) (0.029) (0.016) (0.107) (0.034) (0.012) (0.072) (0.037) (0.017) (0.087)
R&Dt-1 -0.046 -0.035 -0.043 -0.020 -0.020 -0.032 -0.024 -0.026 -0.039* -0.015 -0.017 -0.029*
(0.128) (0.208) (0.143) (0.390) (0.360) (0.168) (0.297) (0.246) (0.097) (0.358) (0.273) (0.069)
Advertisingt-1 0.019 0.017 0.021 -0.021 -0.026 -0.013 -0.033 -0.038 -0.026 -0.044 -0.051 -0.042
(0.778) (0.813) (0.779) (0.717) (0.658) (0.834) (0.594) (0.557) (0.694) (0.533) (0.480) (0.566)
OPt-1 0.017 0.003 -0.006 -0.011 -0.024 -0.041* -0.009 -0.023 -0.041* -0.001 -0.014 -0.031
(0.532) (0.895) (0.831) (0.646) (0.306) (0.087) (0.720) (0.344) (0.094) (0.957) (0.545) (0.191)
Tobin’s Qt-1 -0.001 -0.000 0.001 -0.000 0.000 0.001 0.000 0.000 0.001 -0.000 0.000 0.001
(0.745) (0.878) (0.715) (0.992) (0.902) (0.631) (0.972) (0.767) (0.471) (0.859) (0.951) (0.677)
Diversification 0.000 0.000 0.000 0.000 -0.000 -0.000 -0.000 -0.001 -0.001 -0.000 -0.001 -0.001
(0.557) (0.793) (0.965) (0.828) (0.836) (0.838) (0.462) (0.256) (0.357) (0.387) (0.193) (0.268)
BCF -0.000 -0.000 0.000 -0.000 -0.000 0.000 -0.000 0.000 0.000 -0.000 -0.000 0.000
(0.644) (0.810) (0.792) (0.611) (0.853) (0.668) (0.911) (0.868) (0.593) (0.709) (0.991) (0.804)
Ln Inter Exp (1-Year) 0.000 0.000 -0.000 0.000 0.000 -0.000 0.000 0.000 0.000 0.000 0.000 0.000
(0.689) (0.611) (0.853) (0.694) (0.636) (0.957) (0.802) (0.721) (0.965) (0.705) (0.615) (0.913)
N 1,682 1,682 1,682 2,337 2,337 2,337 2,703 2,703 2,703 2,914 2,914 2,914
adj. R2 0.117 0.114 0.123 0.097 0.096 0.098 0.098 0.098 0.106 0.086 0.088 0.094