the impact of e-wallet fertilizer subsidy scheme and its...
TRANSCRIPT
AF
RIC
AN
EC
ON
OM
IC R
ES
EA
RC
H C
ON
SO
RT
IUM
CO
NS
OR
TIU
M P
OU
R L
A R
ECH
ERC
HE
ÉCO
NO
MIQ
UE
EN A
FRIQ
UE
Bringing Rigour and Evidence to Economic Policy Making in Africa
Research Paper 390
The Impact of E-Wallet Fertilizer Subsidy
Scheme and its Implication on Food Security in Nigeria
Reuben Adeolu Alabiand
Oshobugie Ojor Adams

The Impact of E-Wallet Fertilizer Subsidy
Scheme and its Implication on Food Security in Nigeria
By
Reuben Adeolu AlabiUniversität Bremen,
Germany
and
Oshobugie Ojor AdamsAmbrose Alli University, Ekpoma Edo State,
Nigeria
AERC Research Paper 390African Economic Research Consortium, Nairobi
January 2020
THIS RESEARCH STUDY was supported by a grant from the African Economic Research Consortium. The findings, opinions and recommendations are those of the author, however, and do not necessarily reflect the views of the Consortium, its individual members or the AERC Secretariat.
Published by: The African Economic Research Consortium P.O. Box 62882 - City Square Nairobi 00200, Kenya
ISBN 978-9966-61-083-6
© 2020, African Economic Research Consortium.
ContentsList of tablesList of figuresList of abbreviations and acronymsAbstractAcknowledgements
1. Introduction 1
2. Literature review 4
3. Research methodology 13
4. Results and discussions 16
5. Conclusion and recommendations 22
Notes 23
References 27
Appendixes 31
List of tables1 Distribution of e-wallet fertilizer subsidy scheme in Nigeria based on the 18 socioeconomic characteristics of the farmers2. Average treatment effects (ATT) of e-wallet fertilizer subsidy scheme 193. DD Estimates using regression approach for all the farmers 20 (fixed effects model)4. DD estimates for small scale farmers (fixed effects model) 21
A. Probit regression for estimating the propensity score 31B. Estimated propensity score 31C. DD estimates based on common support 32D. DD Estimates using regression approach for all the farmers (OLS) 32

List of figures1. Farmers registration, roll-out and redemption of fertilizer in 17 e-wallet fertilizer scheme
Listof abbreviationsADP Agricultural Development ProjectDFID Department for International DevelopmentEA Enumeration AreasFAO Food and Agriculture Organization of the United NationsFCT Federal Capital TerritoryFGN Federal Government of NigeriaFISP Farm Input Subsidy ProgrammeFMARD Federal Ministry of Agriculture and Rural DevelopmentFMSP Fertilizer Market Stabilization ProgrammeFPDD Fertilizer Procurement and Distribution DivisionFSFC Federal Superphosphate Fertilizer CompanyFVP Fertilizer Voucher ProgrammeGESS Growth Enhancement Support SchemeGHS General Household SurveyHNLSS Harmonized National Living Standards SurveyIDEP Institut Africain de Développement Economique et de Planification IFDC International Fertilizer Development CentreIFPRI International Food Policy Research InstituteLGA Local Government AreaLSMS-ISA Living Standards Measurement Study - Integrated Surveys on AgricultureNAFCON National Fertilizer Company of NigeriaNASS National Agricultural Sample SurveyNBS Nigeria Bureau of StatisticsPSM Propensity Score Matching
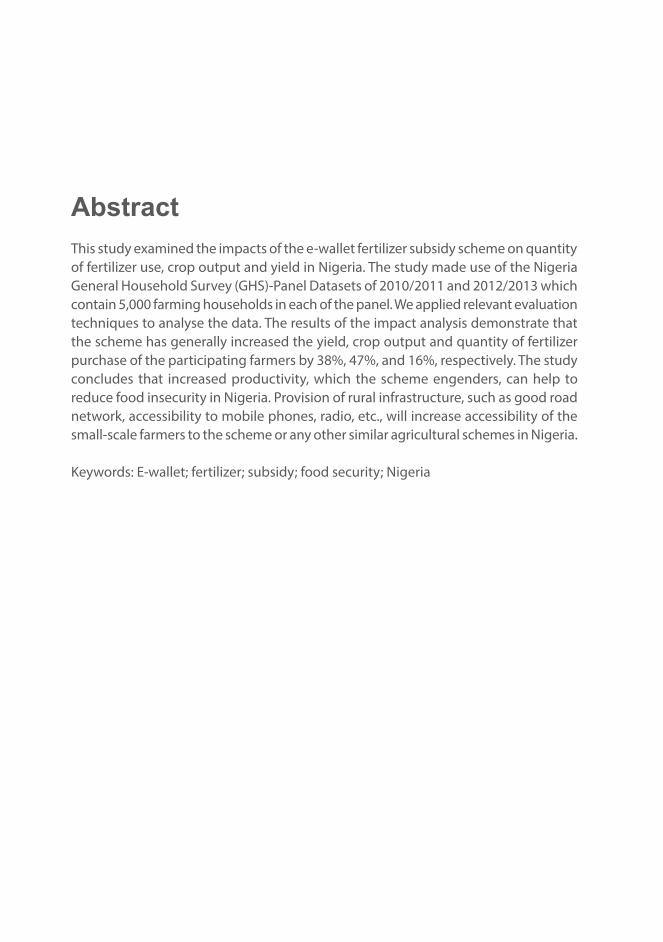
Abstract This study examined the impacts of the e-wallet fertilizer subsidy scheme on quantity of fertilizer use, crop output and yield in Nigeria. The study made use of the Nigeria General Household Survey (GHS)-Panel Datasets of 2010/2011 and 2012/2013 which contain 5,000 farming households in each of the panel. We applied relevant evaluation techniques to analyse the data. The results of the impact analysis demonstrate that the scheme has generally increased the yield, crop output and quantity of fertilizer purchase of the participating farmers by 38%, 47%, and 16%, respectively. The study concludes that increased productivity, which the scheme engenders, can help to reduce food insecurity in Nigeria. Provision of rural infrastructure, such as good road network, accessibility to mobile phones, radio, etc., will increase accessibility of the small-scale farmers to the scheme or any other similar agricultural schemes in Nigeria.
Keywords: E-wallet; fertilizer; subsidy; food security; Nigeria
AcknowledgementsWe are most grateful for the constructive comments from Thematic Group E of AERC. Their suggestions gave this study a focus and direction. The contributions from the internal and external reviewers cannot be over-emphasized. We appreciate all their efforts. The financial support from AERC is acknowledged. The usual disclaimer applies.

The ImpacT of e-WalleT ferTIlIzer SubSIdy Scheme and ITS ImplIcaTIon on food SecurITy In nIgerIa 1
1
1. Introduction
Background information
In order to reduce poverty in rural areas and promote food security by developing agriculture, successive Nigerian Government put in place several programmes/schemes. These programmes/schemes include: Fertilizer Subsidy Scheme, Commodity Boards, National Accelerated Food Production, Nigerian Agricultural Cooperative Banks, and Agricultural Development Projects (FEWSNET, 2007). Others are River Basin Development Authorities, Operation Feed the Nation, Green Revolution, Directorate of Food, Roads and Rural Infrastructure, and National Agricultural Land Development. Furthermore, Presidential Initiatives on cocoa, cassava, rice, livestock, fisheries and vegetables and National Special Programme on Food Security were also implemented. Most of these schemes and programmes have come and gone but the most persistent of them all is the fertilizer subsidy scheme. The fertilizer subsidy in Nigeria aims at making fertilizer price affordable by smallholder farmers in order to increase agricultural productivity and its efficiency, thereby increase the income of the farmers and reduce poverty and food insecurity in the country. Adesina (2013) pointed out that the old fertilizer scheme used in supplying agricultural inputs to the farmers was weak, inefficient and fraudulent, hence a large proportion of the farmers could not benefit from it. He stressed that the inputs meant for the farmers were diverted by political elites for personal gains. He concluded that the gains of the old fertilizer subsidy schemes are also not widely spread among the targeted beneficiaries. An attempt to overcome these difficulties led to the introduction of the Growth Enhancement Support Scheme (GESS) and the use of Electronic Wallet (e-wallet) approach to distribute fertilizer to the farmers.
According to the Federal Ministry of Agriculture and Rural Development (FMARD), GESS represents a policy and pragmatic shift within the existing Fertilizer Market Stabilization Programme (FMSP), and it puts the resource constrained farmer at its centre through the provision of a series of incentives to encourage the critical actors in the fertilizer value chain to work together to improve productivity, household food security and income of the farmer (FMARD, 2014). The goals of GESS are to target five million farmers in each year for four years that will receive fertilizer through mobile phone technology. The scheme intends to provide direct support to 20 million farmers at the end of 4 years to enable them to procure fertilizer and seeds at affordable

2 reSearch paper 390
prices, at the right time, and at the right place. Finally, the scheme intends to increase productivity of farmers across the length and breadth of the country through increased use of fertilizer. The aims of the GESS is to migrate smallholder farmers from subsistence farming to commercialized systems over a four-year period in order to facilitate trade and competitiveness.1 The $2.5 billion programme is projected to generate an overall benefit/cost ratio of 16 to 1, with an estimated annual cost per farmer of US$30, and an anticipated yearly individual benefit of US$500 (GrowAfrica, 2015).
The GESS guarantees registered farmer e-wallet vouchers with which they can redeem fertilizers and seeds from agro-dealers at below the cost prices, the other remaining costs are being borne by the federal and state governments in Nigeria in equal ratios (Atofarati, 2014). The interested farmers have to register by filling a questionnaire at the registration centre.2 The information on the questionnaire has to be later transferred to an electronic database. The registration exercise takes place across every ward in each of the 36 states of the federation, including the Federal Capital Territory (FCT). The requirements for getting registered are that you must be an adult farmer, possess valid means of identification, have a cellphone with a registered SIM card with at least sixty naira credit in the cellphone. You must also possess a passport size photograph and should also know the size or approximate size of your farm beforehand. After the registration, you will be issued with an identity card that contains your passport size photograph and right hand thumb print. Although all adult farmers have rights to apply for the e-wallet fertilizer, the target farmers are small scale farmers who do not have enough resources to purchase two bags (100kg) of fertilizer on their own.3 The selection of beneficiaries is based on the fact that the individual must be proved to be a farmer with a landholding size of three hectares or less (GrowAfrica, 2015).4 Once the targeted farmers were determined, supply chain managers (selected private companies) were in charge of sending text messages (SMS) to farmers to let them know the location of redemption centre5, quantity and kinds of inputs, and the period of the redemption. This is called roll-out or activation of the e-wallet fertilizer voucher. An authentication code will be provided in the SMS for presentation in return for the inputs. The redemption supervisor helps in verifying farmer’s identity as well as a farmer’s code in the text message received by the farmer, and then compares it with the name and code listed in the farmers register which the supervisor received from the Cellulant Limited (the mobile commerce network operator that designs and delivers the e-wallet voucher to the farmers)6. Once the farmers pay the balance of 10% of the cost of seeds and 50% cost of fertilizers to the selected agro-dealer, the farmers will collect two bags (100kg) of fertilizer and one bag (50kg) of maize or rice seed.7 This is called redemption of the inputs (fertilizer and the seeds). This completes the transaction and the agro-dealer8, seeds and fertilizer companies will automatically get their accounts credited from the escrow account at the Central Bank of Nigeria (Fadairo et al, 2015). It is expected that this scheme will improve agricultural input distribution and marketing. In addition, it can provide incentives to encourage actors along the fertilizer value chain to work together towards the common purpose of improving agricultural productivity, household food security, and income (Olomola, 2015).

The ImpacT of e-WalleT ferTIlIzer SubSIdy Scheme and ITS ImplIcaTIon on food SecurITy In nIgerIa 3
Research questions and objectives of the study
The few studies that evaluated newly introduced e-wallet fertilizer subsidy scheme used descriptive methodology and are therefore subject to serious problems arising from selection bias (Amurtiya et al, 2018; Ejiogu, 2017; Enemchukwu et al, 2017). One major weakness associated with these studies is the implicit assumption that all farmers who have access to e-wallet fertilizer scheme and those who did not are respectively identical with respect to their fertilizer subsidy demand or supply situation. In addition, there is also the problem of endogeneity which arises from the fact that access to e-wallet fertilizer subsidy scheme is either voluntary or some farmers are in a better position than others to have access to the scheme. For example, wealthy, educated, or more productive farmers are more likely to have access to the scheme than others. Thus, self-selection into access to the scheme is the major source of endogeneity in these past studies (Obayelu, 2016). With the problem of selection bias which can arise as a result of endogenous programme placement, the past studies on the impact of e-wallet fertilizer subsidy scheme are likely not to give a consistent estimate of the impact of the scheme on agricultural productivity or output. This implies that the accurate impact of e-wallet fertilizer subsidy scheme on agricultural productivity in developing countries like Nigeria is still missing. It is crucial to specifically evaluate the extent of the expected gains in productivity arising from the e-wallet fertilizer subsidy scheme using appropriate evaluation techniques. This is a vacuum this study intends to fill.
The measure of performance of e-wallet fertilizer scheme is based on how many registered farmers activated their e-wallets on the GESS platform-wallet. The registered farmers are the farmers whose names are on the farmer’s register at the redemption centre. The measure of service delivery is how many farmers received inputs? Therefore, it is expedient to ask questions on the scheme performance based on these objectives. Part of such questions includes: are the small-scale farmers able to register for and redeem the fertilizers using e-wallet system? Has the scheme benefited the small-scale farmers more than the large-scale farmers? Did non-poor farmers, urban farmer and male farmers benefit more proportionately than poor farmer, rural farmer and female farmer? Has the scheme increased the fertilizer use and crop productivity among the participating farmers? These questions are relevant because they will have implication on the sustainability of the scheme and its ability to improve food security situation in Nigeria. Furthermore, the empirical answers to some of these questions and the salient lessons derived from this study will help in re-designing and implementation of the scheme and other similar agricultural schemes in Nigeria and other African countries. This study will provide the government with feedback required for making adjustments in input subsidy policies and spending in Nigeria. The broad objective of this study is to analyse the impact of the fertilizer subsidy scheme on fertilizer use, crop output and yield, and establish its implication on food security in Nigeria.

4 reSearch paper 390
2. Literature review
Impact assessment using propensity score matching
In determining the impact of an intervention like e-wallet fertilizer subsidy scheme, an impact assessment must estimate the counterfactual, that is, what would have happened had the intervention or programme never taken place or what otherwise would have been. To determine the counterfactual, it is essential to net out the effect of the intervention from other factors. This is accomplished through the use of control groups which are compared with the treatment group. The control groups should resemble the treatment group except in programme participation. The choice of a good counterfactual is therefore crucial in impact assessment. Propensity scores are an alternative method to estimate the effect of receiving treatment when random assignment of treatments to subjects is not feasible.9 Propensity score matching (PSM) refers to the pairing of treatment and control units with similar values on the propensity score, and possibly other covariates, and the discarding of all unmatched units. Diaz and Handa (2004) suggest that PSM works well as long as the survey instrument used for measuring outcomes is identical for treatment and control participants. Hence, the success of PSM hinges critically on the data available, as well as the variables used for matching (Adebayo and Olagunju, 2015). .
The concept of PSM was first introduced by Rosenbaum and Rubin (1983) while Heckman et al (1997) also played a role in the development of propensity score matching methods. He focused on selection bias, with a primary emphasis on making casual inferences when there is non-random assignment. As a programme evaluation technique, PSM is based on the idea of comparing the outcomes of programme participants with the outcomes of “equivalent” non-participants. Since the two groups are comparable on all observed characteristics with the exception of programme participation, the differences in the outcomes are attributed to the programme. The estimated propensity score for subject e(Xi), (i = 1,…, N ) is the conditional probability of being assigned to a particular treatment given a vector of observed covariates Xi (Rosenbaum and Rubin, 1983):
e(Xi) = Pr (Zi =1|Xi) (1)
4
The ImpacT of e-WalleT ferTIlIzer SubSIdy Scheme and ITS ImplIcaTIon on food SecurITy In nIgerIa 5
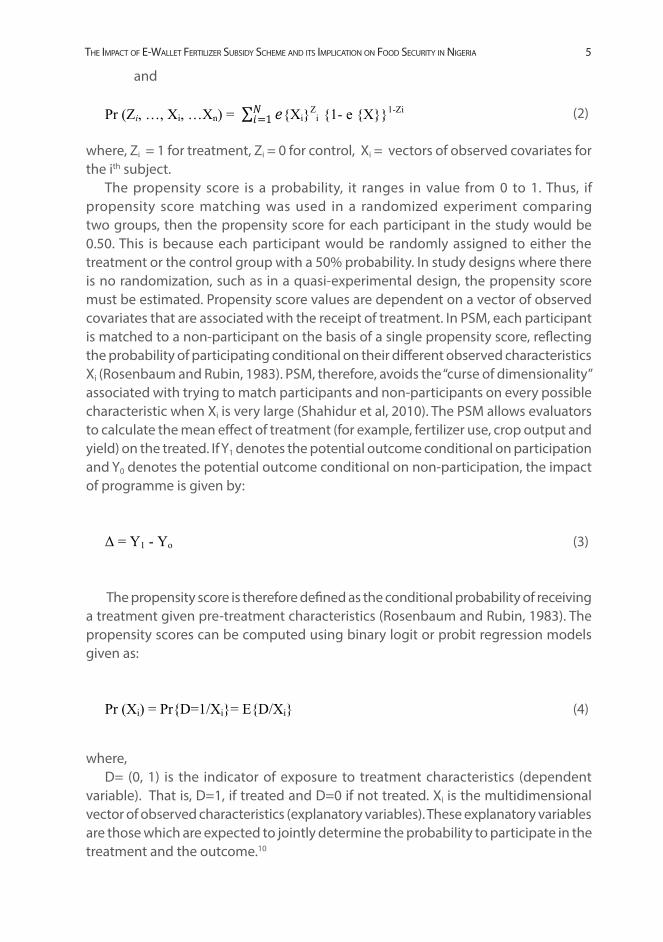
and
Pr (Zi, …, Xi, …Xn) = ∑ 𝑒𝑒𝑁𝑁𝑖𝑖=1 {Xi}Z
i {1- e {X}}1-Zi (2)
where, Zi = 1 for treatment, Zi = 0 for control, Xi = vectors of observed covariates for the ith subject.
The propensity score is a probability, it ranges in value from 0 to 1. Thus, if propensity score matching was used in a randomized experiment comparing two groups, then the propensity score for each participant in the study would be 0.50. This is because each participant would be randomly assigned to either the treatment or the control group with a 50% probability. In study designs where there is no randomization, such as in a quasi-experimental design, the propensity score must be estimated. Propensity score values are dependent on a vector of observed covariates that are associated with the receipt of treatment. In PSM, each participant is matched to a non-participant on the basis of a single propensity score, reflecting the probability of participating conditional on their different observed characteristics Xi (Rosenbaum and Rubin, 1983). PSM, therefore, avoids the “curse of dimensionality” associated with trying to match participants and non-participants on every possible characteristic when Xi is very large (Shahidur et al, 2010). The PSM allows evaluators to calculate the mean effect of treatment (for example, fertilizer use, crop output and yield) on the treated. If Y1 denotes the potential outcome conditional on participation and Y0 denotes the potential outcome conditional on non-participation, the impact of programme is given by:
Δ = Y1 - Yo (3)
The propensity score is therefore defined as the conditional probability of receiving a treatment given pre-treatment characteristics (Rosenbaum and Rubin, 1983). The propensity scores can be computed using binary logit or probit regression models given as:
Pr (Xi) = Pr{D=1/Xi}= E{D/Xi} (4)
where,D= (0, 1) is the indicator of exposure to treatment characteristics (dependent
variable). That is, D=1, if treated and D=0 if not treated. Xi is the multidimensional vector of observed characteristics (explanatory variables). These explanatory variables are those which are expected to jointly determine the probability to participate in the treatment and the outcome.10

6 reSearch paper 390
Heckman et al (1997, 1999) have shown that the bias in PSM programme estimates can be low, given three broad provisions. First, if the same survey instrument or source of data is used for participants and nonparticipants.11 Also, the larger the sample of eligible nonparticipants is, the better matching will be facilitated.12 A related point is that participants and non-participants should be facing the same economic incentives that might drive choices such as programme participation (Ravallion, 2008). Such incentives might include access to similar markets. One could account for this factor by choosing participants and non-participants from the same geographic area (Shahidur et al, 2010)13.
After the propensity score is estimated and the score computed for each unit, the next step is the actual matching.14 Different matching criteria can be used to assign participants to non-participants on the basis of the propensity score. Doing so entails calculating a weight for each matched participant-non-participant set. The choice of a particular matching technique may therefore affect the resulting programme estimate through the weights assigned.15 One of the most frequently used matching techniques is nearest-neighbour (NN) matching, where each treatment unit is matched to the comparison unit with the closest propensity score.16 Matching can be done with or without replacement. Matching with replacement, for example, means that the same non-participant can be used as a match for different participants. Calliper/radius matching procedure involves matching with replacement, only among propensity scores within a certain range. A higher number of dropped non-participants may likely increase the chance of sampling bias. Stratification or interval matching procedure partitions the common support into different strata (or intervals) and calculates the programme’s impact within each interval. Specifically, within each interval, the programme effect is the mean difference in outcomes between treated and control observations. A weighted average of these interval impact estimates yields the overall programme impact, taking the share of participants in each interval as the weights. One risk with the methods just described is that only a small subset of non-participants will ultimately satisfy the criteria to fall within the common support and thus construct the counterfactual outcome. Non-parametric matching estimators, such as kernel matching and local linear matching, use a weighted average of all non-participants to construct the counterfactual match for each participant (Shahidur et al, 2010).
A unique advantage of PSM is that instead of matching subjects on a vector of characteristics, we only need to match on a single item, the propensity score that measures the probability of participating in the programme. Given that the Conditional Independence Assumption17 and the Common Support Assumption18 hold, then we can estimate the mean effect of the treatment through the mean difference in the outcomes of the matched pairs:
ATT = E[Y1|D=1, P(X)]=E[Yo|D=0, P(X)] (5)
The ImpacT of e-WalleT ferTIlIzer SubSIdy Scheme and ITS ImplIcaTIon on food SecurITy In nIgerIa 7
Equation 5 is applicable to single treatment programme where the treatment variable is a categorical variable that has only two mutually exclusive categories. The ATE, i.e., the average effect of the treatment for an individual drawn at random from the overall population at random is:
ATE = N1/N x ATT + N0/N x ATU (6)
where, N1 is the number of treatment group and N0 is the number of control group. Equation 6 shows the relationship between ATT (average treatment on the treated), ATE (average treatment effect on an individual) and ATU (average treatment on the untreated).
Impact assessment using double difference matching method
The main drawback of PSM relies on the degree to which observed characteristics drive programme participation. If selection bias from unobserved characteristics is likely to be great, then PSM may not produce a valid estimate. Double-difference or Difference–in-Difference (DD) methods, compared with propensity score matching (PSM), assume that unobserved heterogeneity in participation is present—but that such factors are time invariant. With data on project and control observations before and after the programme intervention, this fixed component can be differenced out. DD essentially compares treatment and comparison groups in terms of outcome changes over time relative to the outcomes observed for a pre-intervention baseline. That is, given a two-period setting where t = 0 before the programme and t = 1 after programme implementation, letting Yt
T and YtC be the respective outcomes for a
programme beneficiary and non-beneficiary units in time t, the DD method will estimate the average programme impact as follows:
DD=E(Y1T – Y0
T |T1=1)- E(Y1C– Y0
C |T1=0) (7)
In Equation 7, T1 =1 denotes treatment or the presence of the programme at t = 1, whereas T1 =0 denotes lack of treatment or programme participation.
Unlike PSM alone, the DD estimator allows for unobserved heterogeneity (the unobserved difference in mean counterfactual outcomes between treated and untreated units) that may lead to selection bias. For example, one may want to account for factors unobserved such as differences in soil fertility across treated and control subjects or the effects of non-random programme placement at the policy making level. DD assumes this unobserved heterogeneity is time invariant, so the bias cancels

8 reSearch paper 390
out through differencing. The DD estimate can also be calculated within a regression framework (Ravallion, 2008); the regression can be weighted to account for potential biases in DD. The estimating equation can be specified as:
Yit = α + βTi1t + ρTi1+ υt + ԑit (8)
In Equation 8, the coefficient β on the interaction between the post-programme treatment variable (Ti1) and time (t = 1 . . . T) give the average DD effect of the programme. Thus, using the notation from Equation 8, β = DD. In addition to this interaction term, the variables Ti1 and t are included separately to pick up any separate mean effects of time as well as the effect of being targeted versus not being targeted in the programme intervention. For DD estimator to be valid, the model in the equation (outcome) must be correctly specified. For example, the assumption of additive structure imposed must hold. The error term must be uncorrelated with the other variables in the equation. The last of these assumptions means that unobserved characteristics affecting programme participation do not vary over time with treatment status.
The two-period model can be generalized with multiple time periods, which may be called the panel fixed-effects model. This possibility is particularly important for a model that controls, not only for the unobserved time-invariant heterogeneity, but also for heterogeneity in observed characteristics over a multiple-period setting. More specifically, Yit can be regressed on Tit , a range of time-varying covariates Xit, and unobserved time-invariant individual heterogeneity ηt that may be correlated with both the treatment and other unobserved characteristics ԑit . Equation 8 can be revised to become
Yit = ϕTit + δXit + ηi + ԑit (9)
Differencing both the right- and left-hand side of Equation 9 over time, one would obtain the following differenced equation:
(Yit – Yit – 1) = ϕ(Tit – Tit – 1) + δ(Xit – Xit – 1) + (ηi – ηi) + (εit – εit – 1) (10)
⇒ ΔYit = ϕΔTit + δΔXit + Δεit (11)
In this case, because the source of endogeneity (that is, the unobserved individual characteristics ηt) is dropped from differencing, ordinary least squares (OLS) can be

The ImpacT of e-WalleT ferTIlIzer SubSIdy Scheme and ITS ImplIcaTIon on food SecurITy In nIgerIa 9
applied to Equation 11 to estimate the unbiased effect of the programme (ԑ). With two time periods, ԑ is equivalent to the DD estimate in Equation 8 controlling for the same covariates Xit; the standard errors, however, may need to be corrected for serial correlation (Bertrand et al, 2004).
Critique of the past fertilizer schemes in Nigeria
The past fertilizer market in Nigeria was originally driven by government policies of direct participation in production, procurement and distribution (Olomola, 2015). For many years, all fertilizer used in the country was imported by the Federal Government of Nigeria (FGN) and state governments. By the early 1970s, the FGN established the Fertilizer Procurement and Distribution Division (FPDD) to facilitate the formulation and coordination of all fertilizer policies at the national level and to centralize procurement and distribution. By the mid 1970s, the FGN started to implement domestic production of fertilizer under the FPDD, making large investments for the establishment of production and blending plants. This initiative was supported by the private sector with the purpose of meeting the country fertilizer needs. Under this initiative, two major fertilizer plants were established: the Federal Superphosphate Fertilizer Company (FSFC) in 1973 and the National Fertilizer Company of Nigeria (NAFCON) in 1981. Since their establishment, FSFC and NAFCON never utilized their full potentials; hence FSFC was shut down in 2000 and NAFCON stopped operating in 1997 (IFDC/PROMIDIA, 2008).19 As a result, their respective administrative structures prefer to keep the fertilizer operations by competing for the government tenders for supplying imported fertilizers to the market under the subsidy programme (Fuentes et al, 2012).20
The federal government under the Fertilizer Market Stabilization Programme (FMSP) procures fertilizer for sale to states at a subsidy of 25%. In addition to this, extra subsidy is provided by the states and local government councils (IDEP, 2011). However, the review of Nigerian fertilizer subsidy indicates an inconsistency of government fertilizer policy over the years (Nagy and Edun, 2002; Ogunfowora and Odubola, 1994; Kwa, 2002). Policies kept changing almost year by year to try to answer problems of availability, leakage and arbitrage. The Federal Government of Nigeria (FGN) monopoly on pre-1996 fertilizer procurement and the subsidy policy stymied the private sector (Ogunfowora, 2000; Salman, 2014). The FGN did not properly follow through on the liberalization process started in 1997 by ensuring that the preconditions for a transition to a privatized fertilizer sector were implemented (Banful and Olayide, 2010; Olomola, 2015). The FGN opted for a full withdrawal from fertilizer procurement and subsidy, leaving the industry stranded. The private sector did respond, but the ad hoc procurement/subsidy policies of the FGN in 1999, 2001 and 2002 were damaging to the growth of the private sector (IDEP, 2011).21 Annual fertilizer use fell by about 50% in the post-1996 as compared with the pre-1996 period. The main constraints to fertilizer use were high prices, low fertilizer quality and non-availability of fertilizer at

10 reSearch paper 390
the time required (Salman, 2014). Government fertilizer policies also had an effect on national, state, and local government budgets. Between 1975 and 2007, the fertilizer subsidy cost as a percentage of the national agricultural budget ranged from 0% to as high as 80% (FAO, 2012). Government fertilizer policy also failed to capture the benefits of using the considerable resources available in Nigeria to produce fertilizer for in-country use and for export to the rest of Africa.
In May 2006, the Federal Executive Council approved the National Fertilizer Policy with the objective to facilitate farmers' timely access to adequate quantity and quality of both organic and inorganic fertilizers at competitive but affordable prices in the country. Based on experiences from other countries such as Malawi and Mozambique, the International Fertilizer Development Centre (IFDC) in collaboration with the Federal Ministry of Agriculture and Rural Development, piloted a Fertilizer Voucher Programme (FVP) in Kano and Bauchi states in 2008. The programme was expanded incrementally in 2009 and 2010. It demonstrated the feasibility and efficiency of a voucher system to administer subsidies to farmers which indicated that smallholder farmers could benefit directly from the private sector supply of subsidized fertilizers. Arising from above, in March 2011, the Fertilizer Voucher Programme (as a policy instrument) was adopted nationwide. The ministry has therefore designed the Growth Enhancement Support Scheme (GESS) for implementation in all the states and FCT. The rationale for the GESS is premised on building on the successes achieved through the Voucher Scheme to target beneficiaries through the electronic system (e-wallet) via the development of private sector distribution channels (FMARD, 2012).
Review of fertilizer subsidy schemes
The main reason for advocating fertilizer subsidies is that farmers are very poor and typically lack sufficient cash resources to buy productive inputs, which can result in suboptimal input use. Indeed, poverty combined with financial constraints may generate high discount rates that can lead to low investment on the farms (Holden et al, 1998). In 2005, Malawi was the first country to reintroduce high levels of input subsidies to improve national food self-sufficiency and reduce its dependence on food aid. In a short time, Malawi managed to turn a food deficit into a food surplus and was considered to be a success story (Denning et al, 2009). Other countries have copied Malawi, and similar programmes have arisen and expanded in Ghana, Kenya, Tanzania and Zambia (Dorward and Chirwa, 2011; Minde et al, 2008).
Chirwa et al. (2011) revealed that the main goal of the Farm Input Subsidy Programme (FISP) in Malawi is to raise incomes and household food security of up to two million (out of 3.4 million) smallholder farmers through improvements in their agricultural productivity. The programme targets smallholder farmers who have land but cannot afford to purchase inputs (principally maize seed and fertilisers) at market prices. However, Holden and Lunduka (2013b) working on experiment on input subsidies, cash constraints and timing of supply suggest that low use of
The ImpacT of e-WalleT ferTIlIzer SubSIdy Scheme and ITS ImplIcaTIon on food SecurITy In nIgerIa 11
agricultural inputs in Malawi is primarily caused by limited ability to buy inputs and not time-inconsistent behaviour. They recommended that the current input subsidy design in Malawi should be replaced by smarter and more cost-effective designs that involve smaller packages of fertilizer and delivery of inputs at harvest time, as well as at planting time. Dorward and Chirwa (2011) in their study on agricultural input subsidy programme in Malawi showed that the use of voucher as smart subsidy had similar shortcomings just like the universal subsidy programme. Similar findings were also observed by Holden and Lunduka (2013a) in Malawi, where a subsidy programme aimed to provide coupons for purchase of subsidized fertilizer and seeds targeted at poor rural households also faced serious problem. The critical findings were that the poverty and vulnerability reduction potentials of the programme were not optimal, leakages of coupons and fertilizers and misallocation of coupons away from the needy resulted through rent-seeking.
Chirwa et al (2011), working on conceptualizing graduation from agricultural inputs subsidies in Malawi, considered ways in which the concept of graduation may be usefully applied to the Farm Input Subsidy Programme (FISP). They set out a broad conceptualization of graduation for potential application in programme design and implementation. For the Malawian farmers to graduate from relying on fertilizer subsidy and be able to purchase fertilizer at competitive price, Chirwa et al (2011) recommended potential graduation conditions which include reduced input prices, substitution with cheaper inputs, increased working capital for input purchases, diversification out of maize production, and access to low cost credit for input purchases.
Duflo et al (2008) tested the hypothesis in Kenya, of the possibility that, while fertilizer and hybrid seed increase yield on model farms, they are actually not profitable on many small farms, where conditions are less than optimal. They revealed that the mean estimates of yield increases due to fertilizer use are in the range of the estimates found on model farms. They found that the mean rate of return to using the most profitable quantity of fertilizer they examined was 36% over a season, or 69.5% on an annualized basis. However, other levels of fertilizer use, including the combination of fertilizer plus hybrid seed recommended by the Kenya Ministry of Agriculture, are not profitable for farmers in their sample. Thus, while fertilizer can be very profitable when used correctly, one reason why farmers may not use fertilizer and hybrid seeds is that the official recommendations are not adapted to many farmers in Kenya. This also suggests that fertilizer is not necessarily easy to use correctly, which implies that it may not be profitable for many farmers who do not use the right quantity.
Duflo et al (2011) conducted a study and social experiments in Kenya and found that poor households are willing to invest in response to small, time-limited discounts in the form of free fertilizer delivery just after harvest. Indeed, a 50% subsidy on fertilizer at planting time did not increase fertilizer use more than this harvest-time free delivery discount. These authors’ finding may indicate that the distribution and sales of fertilizer just after harvest can be a more effective system than the sale of fertilizers at planting time, when households may no longer have sufficient funds remaining from the sale of the previous year’s harvest. The purchase of inputs at harvest time

12 reSearch paper 390
for the next growing season may serve as a commitment device (DellaVigna, 2009) and reduce the need for subsidies.
Banful (2010) evaluated Ghana’s 2008 fertilizer subsidy programme. He observed the role that political influence can play in a fertilizer subsidy even in programmes that incorporate the new best practices of fertilizer subsidies (e.g., voucher system). He noticed the evidence of “vote-buying” activity in Ghana’s 2008 subsidy programme which suggests that, despite the innovations in design and implementation of fertilizer subsidies, the new programmes have the potential to experience at least some of the significant pitfalls of former subsidy programmes. The innovations are not enough to make the new fertilizer subsidy programmes economically and socially efficient in Ghana. He indicated that the farmers collected vouchers that they had no intention of using or could not afford to use. They rightly predicted that there would be periods of shortage of vouchers and sold the vouchers to other farmers who desperately needed to apply fertilizer.
Banful and Olayide (2010) opined that the parallel sales of subsidized and market fertilizer (unsubsidized) in Nigeria tend to create an avenue for lower-priced subsidized fertilizers to be diverted for sale at higher market prices. These shortcomings of fertilizer subsidies led to introduction of vouchers or smart subsidies or coupons. The vouchers imply farmers are given vouchers and make purchases from private input suppliers. The cost of the fertilizer to the farmer is reduced by the value of the voucher. The supplier in turn is reimbursed for its value at designated banks. A number of advantages were attributed to the use of vouchers, notably building the private sector distribution network, serves as a sure opportunity to secure the input by a farmer holding a voucher and a replacement for food aid in case of need, among others (Minot and Benson, 2009).
Salman (2014) conducted a study on political economy of fertilizer subsidy in Nigeria. He indicated that the trend of leadership in the country has led to inconsistencies and instability in fertilizer subsidy polices in Nigeria. He also concluded that the gains of fertilizer subsidy are not widely spread among the targeted beneficiaries, hence a negative implication on the increased food production programme. He showed further in his study that majority of the farmers disagreed that the fertilizer subsidy was timely available (65.3%). He recommended that the Nigerian government involvement in procurement and distribution of fertilizer should be redefined.
The shortcomings associated with past fertilizer subsidy policies led the Nigerian government to adopt an e-wallet fertilizer subsidy scheme, where the private sector played the role of supplying and distribution of fertilizer and the government involved the registration and payment of 50% of the fertilizer and other agro inputs received by the farmers. The hope is that this would better serve the intended beneficiaries who are farmers and reduce the fiscal burden of universal fertilizer subsidy from the government and makes it more effective. However, there is a need to find out if this new scheme has impacted the quantity of fertilizer use by the farmers, crop output and yield of the farmers more than the previous fertilizer subsidy schemes that have been implemented in Nigeria.
The ImpacT of e-WalleT ferTIlIzer SubSIdy Scheme and ITS ImplIcaTIon on food SecurITy In nIgerIa 13
3. Research methodology
Data sources and collection
This study was carried out in Nigeria. Nigeria lies between 40161 and 130531 North Latitude and between 20401 and 140411 East Longitude. It is located in west Africa bordered on the west by the Republic of Benin, on the north by the Republic of Niger and on the east by the Republic of Cameroon. To the south, Nigeria is bordered by approximately 800 kilometres of the Atlantic Ocean, stretching from Badagry in the west to the Rio del Rey in the east. The country also occupies a land area of 923,768 square kilometres, and the vegetation ranges from mangrove forest on the coast to desert in the far North. Administration-wise, Nigeria consists of 36 states and a Federal Capital Territory (FCT). Each state is further divided into Local Government Areas (LGAs). There are presently 774 LGAs in the country. The total population of Nigeria stood at 166.2 million in 2012 according to the estimate from Nigeria Bureau of Statistics (NBS).22
The study made use of the Nigeria General Household Survey (GHS)-Panel Datasets of 2010/2011 and 2012/2013. The Nigeria General Household Survey (GHS)-Panel was carried out by the National Bureau of Statistics (NBS).23 The panel component applies to 5,000 farming households with information on multiple agricultural activities and household consumption. The GHS-Panel drew heavily on the Harmonized National Living Standards Survey (HNLSSԑa multi-topic household survey) and the National Agricultural Sample Survey (NASSԑthe key agricultural survey) to create a new survey instrument to shed light on the role of agriculture in households’ economic wellbeing that can be monitored over time. The first wave of the GHS-Panel was carried out in two visits to the panel households (post-planting visit in August-October 2010 and post-harvest visit in February-April 2011). The second wave of the GHS-Panel was carried out also in two visits to the panel households (post-planting visit in September-November 2012 and post-harvest visit in February-April 2013). The panel data set are downloadable at the Living Standards Measurement Study - Integrated Surveys on Agriculture (LSMS-ISA) website address. 24
The sample design was a two-stage probability sampling. The primary sampling units (PSU) were the Enumeration Areas (EA). These were selected based on probability proportional to size (PPS) of the total EAs in each state and FCT and the total household listed in those EAs. A total of 500 EAs were selected using this
13
14 reSearch paper 390
method. Households were selected randomly using the systematic selection of 10 households per EA. This involved obtaining the total number of households listed in a particular EA, and then calculating a sampling interval (SI) by dividing the total households by 10. The next step was to generate a random start ‘r’ from the table of random numbers which stands as the first selection. Consecutive selection of households was obtained by adding the sampling interval to the random start. In all, 500 clusters/EAs and 5,000 households were interviewed. These samples were proportionally selected in the states such that different states had different sample sizes. However, the selection covers all the LGAs and all the states in Nigeria. The urban and rural areas were also included in the sample.
Estimating the impact of fertilizer subsidy scheme using propensity score matching
In estimating the impact of e-wallet fertilizer scheme on fertilizer use, crop output and yield, we first obtained the propensity score matching estimator through the probit regression. The propensity score P(X) was calculated on the basis of all observed covariates X that jointly affect participation in e-wallet fertilizer subsidy scheme and the outcome of interest (quantity of fertilizer use, crop output and yield). The probit regression model used to estimate the propensity score has a Chi-square static of 25.10, which is statistically significant at the 1% confidence level, therefore implying that all the predictors that have been included in the model are capable of jointly predicting participation in the e-wallet fertilizer scheme (Appendix A). The estimated propensity score is 0.3026. So probability that a particular household will be a participant in e-wallet fertilizer scheme is 30.26% with respect to quantity of fertilizer, crop output and yield (Heckman et al, 1999). The mean propensity score is tabulated in Appendix B. Balancing test was also conducted to check whether, within each quintile of the propensity score distribution, the average propensity score and mean of X are the same. For PSM to work, the treatment and comparison groups must be balanced in that similar propensity scores are based on similar observed X. Although a treated group and its matched non-treated comparator might have the same propensity scores, they are not necessarily observationally similar if misspecification exists in the participation equation. The distributions of the treated group and the comparator were found to be in close range, which is what balance implies (Becerril and Abdulai, 2010).
Using propensity scores for participation generated by the probit regression model, households in the intervention were matched on the basis of the proximity of their propensity scores of participation to households in the counterfactual. All other households whose propensity scores for participation were different from the range of scores for the intervention households were dropped from the analysis by dropping all the counterfactual households whose probability of participation was very different from the households in the intervention. Differences in quantity of
The ImpacT of e-WalleT ferTIlIzer SubSIdy Scheme and ITS ImplIcaTIon on food SecurITy In nIgerIa 15
fertilizer use, crop output and yield were then compared between households that were more similar and therefore comparable and as such any differences in outcome variables between the participants and non-participants in e-wallet fertilizer subsidy scheme are attributed to e-wallet fertilizer subsidy scheme (Blundell and Costa-Dias, 2000; Caliendo and Kopeinig, 2008).
Estimating the impact of fertilizer subsidy scheme usingdouble difference method
With data on participant and non-participant farmers before and after e-wallet fertilizer subsidy scheme, DD estimator was constructed by estimating the
difference in average outcome (yield, crop output and quantity of fertilizer used) in the farmers that participated in e-wallet fertilizer subsidy scheme before and after the scheme minus the difference in average outcome (yield, crop output and quantity of fertilizer used) among non-participant farmers before and after the scheme. We also estimated DD using regression approach following the procedure of Ravallion (2008). The basic assumption behind the simple estimation of DD is that other covariates do not change over the years. However, since those variables do change over time we accounted for them in the regression model to get the net effect of programme participation on the outcome. The covariates we controlled for in the regression model are age of the farmers, precipitation, temperature, application of pesticide, use of storage facilities, seed purchase and literacy level of the farmers. We used ordinary least squares (OLS) approach to estimate the programme impact in our estimating regression equation. We went further to use a fixed effects regression model to control for household’s unobserved and time-invariant characteristics that may influence the outcome variable (Khandker et al, 2009).
We finally combined PSM with DD methods to better match participants and non-participants on pre-programme characteristics. Specifically, we used the propensity score with base (2010/2011) year data to make certain that the comparison group is similar to the treatment group and then applied DD to the matched sample within the common support. In this way we are able to deal with the initial local area conditions that may bias our estimates (Hirano et al, 2003).
16 reSearch paper 390
4. Results and discussion
Assessment of performance of e-wallet fertilizer scheme in Nigeria
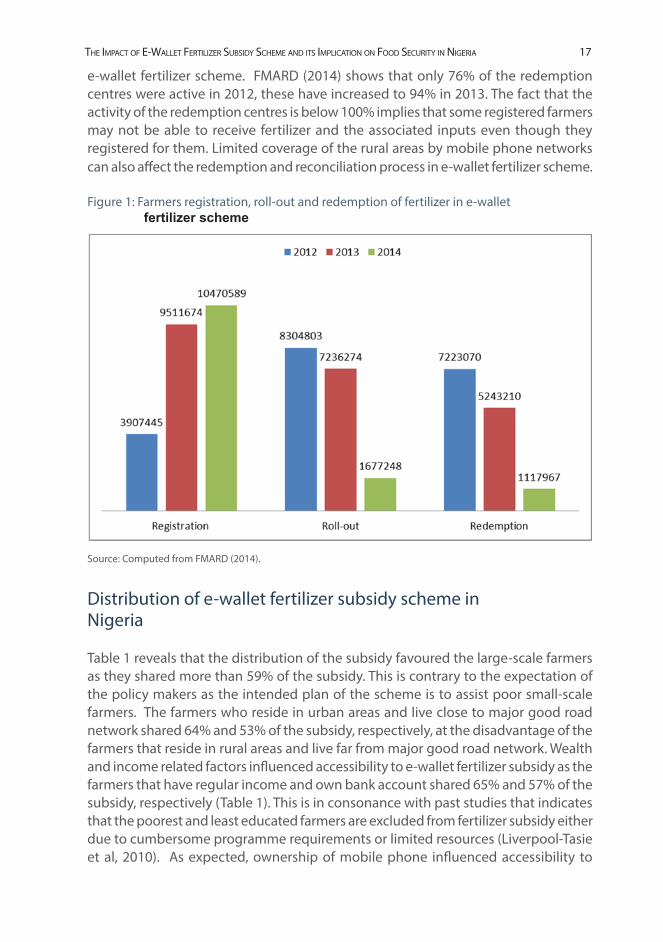
The e-wallet scheme target was five million farmers annually. Figure 1 shows that 3,907,445 and 9,511,674 farmers were registered in 2012 and 2013, respectively, while and 10,470,589 farmers were registered in 2014 (FMARD, 2014). The sharp increase in farmers’ registration between 2012 and 2013 implies that initial lull about the scheme was replaced with interest and enthusiasm, which however started to decline between 2013 and 2014. If we compare 3,907,445 in 2012 with 10,470,589 in 2014, farmers’ registration has increased by 170%. If 10,470,589 registered farmers are compared with 15 million target for the third year of the scheme, it means that the scheme achieved only about 70% of the expected registered farmers. According to Adesina (2013), the low turnout rate for registration by the farmers reflects the current low adoption of inorganic fertilizer and improved seeds by smallholder farmers in Nigeria. It may also be due to distrust of the government fertilizer procurement system of the past where poor-quality fertilizer and seeds were distributed (Olomola, 2015). Figure 1 also indicates that the roll-out rate (proportion of the farmers who received text message to collect fertilizer and seed to the total number of registered farmers) increased from 1,677,248 in 2012 to 8,304,803 in 2014. This translates into 395% increase in the roll-out rate between 2012 and 2014. However, if 8,304,803 is compared with the 15 million farmers tageted for 2014, this translates into redemption rate of 55%. Obayelu (2016) has indicated that delayed registration and the fact that reconciliation of claims had problems because documents submitted from the field had serious quality control problems may be attributed to lower rate of farmers being served with the inputs. Figure 1 demonstrates further that redemption rate (proportion of farmers who received fertilizer relative to the proportion of registered farmers) varied from 1,117,967 in 2012 to 7,223,070 in 2014. This is about 546% increase in the redemption rate between the two periods. When we compared the targeted redemption of fertilizer and seed for 15 million farmers with 7,223,070 farmers being served in 2014, it suggests that the scheme has achieved 48% success in redemption rate. Ejiogu (2017) has attributed this below expectation redemption phenomenon to the limited resources farmers possess to purchase fertilizer. The fact that redemption centre operations were not optimal due to the quality of staff and pressure of crowds during redemption may also be implicated for low redemption rate witnessed in the
16
The ImpacT of e-WalleT ferTIlIzer SubSIdy Scheme and ITS ImplIcaTIon on food SecurITy In nIgerIa 17
e-wallet fertilizer scheme. FMARD (2014) shows that only 76% of the redemption centres were active in 2012, these have increased to 94% in 2013. The fact that the activity of the redemption centres is below 100% implies that some registered farmers may not be able to receive fertilizer and the associated inputs even though they registered for them. Limited coverage of the rural areas by mobile phone networks can also affect the redemption and reconciliation process in e-wallet fertilizer scheme.
Figure 1: Farmers registration, roll-out and redemption of fertilizer in e-wallet fertilizer scheme
Source: Computed from FMARD (2014).
Distribution of e-wallet fertilizer subsidy scheme in Nigeria
Table 1 reveals that the distribution of the subsidy favoured the large-scale farmers as they shared more than 59% of the subsidy. This is contrary to the expectation of the policy makers as the intended plan of the scheme is to assist poor small-scale farmers. The farmers who reside in urban areas and live close to major good road network shared 64% and 53% of the subsidy, respectively, at the disadvantage of the farmers that reside in rural areas and live far from major good road network. Wealth and income related factors influenced accessibility to e-wallet fertilizer subsidy as the farmers that have regular income and own bank account shared 65% and 57% of the subsidy, respectively (Table 1). This is in consonance with past studies that indicates that the poorest and least educated farmers are excluded from fertilizer subsidy either due to cumbersome programme requirements or limited resources (Liverpool-Tasie et al, 2010). As expected, ownership of mobile phone influenced accessibility to

18 reSearch paper 390
e-wallet fertilizer subsidy, as 64% of the farmers that accessed the subsidy owned mobile phone (Table 1). This implies that poor quality of mobile phone infrastructure in rural areas may put the farmers in rural areas at a disadvantage in participating in e-wallet fertilizer subsidy scheme (Ejiogu, 2017). Obayelu (2016) reported that limited coverage of the rural areas by mobile phone networks may plague the redemption and reconciliation process in e-wallet fertilizer scheme in Nigeria. Ownership of radio also influenced accessibility to e-wallet fertilizer subsidy scheme as 67% of participating farmers owned radio. The radio can improve accessibility to relevant agricultural information that will aid the farmers to access the agricultural schemes and programmes (Fadairo et al, 2015). Table 1 also shows that e-wallet scheme has increased the use of improved seeds as it indicates that 53% of the farmers that access the subsidy also purchased improved seeds. This is because agro dealers that supplied subsidized fertilizer equally sell other agricultural inputs that the farmers can purchase (Amurtiya et al, 2018). FMARD (2016) has also indicated that the scheme increased the adoption of high yielding rice seed among the participating farmers. Adoption of high yielding seed may result in positive impact on the productivity of the participating farmers (Ejiogu, 2017). Table 1 indicates further that the male and female farmers’ shares in the e-wallet scheme were 52% and 48%, respectively.
Table 1: Distribution of e-wallet fertilizer subsidy scheme in Nigeria based on the socioeconomic characteristics of the farmers
Socioeconomic Characteristics % Share of the Subsidy
T-Statistics
Large Scale Farm+ 59.34 6.7370**
Small Scale Farm 40.66
Purchased Improved Seeds 53.03 2.4196**
Not Purchased Improved Seeds 46.97
Male 51.99 1.9590**
Female 48.01
Regular Income 65.22 4.4170**
No Regular Income 34.78
Urban 63.61 10.2104**
Rural 36.39
Reside Far from the Major Road 47.44 -2.4462**
Reside Close to the Major Road 52.56
Owned Bank Account 56.79 2.4295**
Not Owned Bank Account 43.21
Owned Mobile Phone 64.02 6.8636**
No Mobile Phone 35.98
Owned Radio 66.87 5.6412**
No Radio 33.13
Source: Computed by the Authors. +Farmers whose farm size is less than the average farm size of all the sampled farmers; ** Significant at 5%.

The ImpacT of e-WalleT ferTIlIzer SubSIdy Scheme and ITS ImplIcaTIon on food SecurITy In nIgerIa 19
Results and discussion of PSM estimates
Table 2 indicates that average treatment effects estimated using nearest-neighbour, radius and kernel matching procedures gave almost similar conclusions on the treatment effect of e-wallet fertilizer subsidy. The table shows that the farmers who participated in e-wallet scheme used more fertilizer and had higher output than non-participating farmers. However, the mean yield of the farmers who participated in the scheme was not significantly higher than non-participants. The non-significant impact of the scheme implies that there may be unobserved heterogeneity which PSM estimator did not account for. This led us to the use of DD approach.
Table 2: Average treatment effects (ATT) of e-wallet fertilizer subsidy schemeMatching Algorithm
Logarithm of Outcome
Sample Treated Control Difference T-stat
Kernel Yield ATT 0.9730 0.9658 0.0072 0.03
Quantity of Fertilizer Purchased
ATT 5.1863 4.5330 0.6533 2.08***
Quantity of Harvest ATT 4.3494 3.4982 0.8512 2.31***
Nearest Neighbour
Yield ATT 0.9281 1.1702 0.24211 0.84
Quantity of Fertilizer Purchased
ATT 5.1818 4.3436 0.838192 2.51***
Quantity of Harvest ATT 4.3088 3.8746 0 .4342 0.97
Radius Yield
ATT 1.0671 1.0403 0.0268 0.13
Quantity of Fertilizer Purchased
ATT 5.1825 4.3704 0.8121 5.81***
Quantity of Harvest ATT 4.4767 3.3417 1.1350 4.45***
Source: Computed by the Authors. *** Significant at 1%.
The results and discussion of DD estimates
The DD results estimates we derived when we combined PSM with DD based on common support are presented in Appendix C. The results show that the e-wallet fertilizer scheme has increased the yield, crop output and fertilizer use of the participating farmers by about 48%, 68%, and 18%, respectively. DD results obtained when we used regression approach (Fixed Effects Model) where we controlled for age of the farmers, precipitation, temperature, application of pesticide, use of storage facilities, seed purchase and literacy level of the farmers are presented in Tables 3 (The OLS estimates are reported in Appendix D). The fixed effects models in Table 3 demonstrate that the scheme increased the yield, crop output and quantity fertilizer use of the beneficiaries of the scheme by 38%, 47% and 16%, respectively.25 This positive and significant impact of the scheme in increasing the production

20 reSearch paper 390
output of the farmers in Kwara State in Nigeria has been reported by Adebo (2014) and in Adamawa State by Ahmed et al (2016). Enemchukwu et al (2017) claimed that the e-wallet scheme has increased the income of the participating farmers in Anambra State in Nigeria. The positive impact of the scheme on the yield of the farmers in Imo State has also been noted by Nwaobiala and Ubor (2016) and Amurtiya et al (2018).
Table 3: DD Estimates using regression approach for all the farmers (fixed effects model)
Log of Yield Log of Quantity of Harvest
Quantity of Fertilizer Purchased
Coefficient P>|t| Coefficient P>|t| Coefficient P>|t|
Subsidy -0. 6543*** 0.000 -0. 4186*** 0.000 0. 3325*** 0.000
Year -0. 1740*** 0.000 -0. 3825 *** 0.000 0. 0248 0.102
DD 0. 3758*** 0.000 0. 4678*** 0.000 0. 1566*** 0.000
Age 0. 0007 0.300 -0. 0025*** 0.003 0. 0006 0.112
Precipitation 0. 1881*** 0.000 0. 2832*** 0.000 0. 0769*** 0.000
Temperature 0. 3407*** 0.000 0. 1762*** 0.029 0. 0182 0.628
Application of Pesticide
-0. 4090*** 0.000 -0.2967*** 0.000 -0. 3198*** 0.000
Use of Storage Facilities
-0. 0323 0.350 0. 0307 0.496 -0. 1354*** 0.000
Purchase of Seed
0. 5150*** 0.025 0. 2405*** 0.051 0. 5874*** 0.000
Literacy 0. 46378*** 0.000 0.9825*** 0.000 -0. 0582 0.385
Constant -273.6462*** 0.002 - 321.4936 ***
0.000 -76.1264*** 0.000
Prob > F 0.0000*** 0.0000*** 0.0000***
R-squared 0.0151 0.0040 0.0529
Sigma_u 76.6672 116.9932 32.0224
Sigma_e 1.0086 1.3135 0. 6135
Rho 0.9999 0.9999 0. 9996
Source: Computed by the Authors. *** Significant at 1%, **Significant at 5%, * Significant at 10%.
We estimated the impact of the scheme on small scale farmers (these are the farmers whose farm sizes are less than the average farm size of all the farmers in the survey) and present the result in Table 4. Table 4 indicates that the scheme has higher impact on the yield, crop output and the quantity of fertilizer used by the participating small-scale farmers. The scheme increased the yield, crop output and quantity of fertilizer used by the participating small-scale farmers by 66%, 49%, and 23%, respectively. This implies that the impact of the scheme could have been higher on the average if the scheme is well targeted at the poor small-scale farmers.

The ImpacT of e-WalleT ferTIlIzer SubSIdy Scheme and ITS ImplIcaTIon on food SecurITy In nIgerIa 21
Table 4: DD estimates for small scale farmers (fixed effects model)Log of Yield Log of Quantity
of HarvestLog of Quantity of
Fertilizer Purchased
Coefficient P>|t| Coefficient P>|t| Coefficient P>|t|
Subsidy -0. 6985 *** 0.000 -0. 6370 *** 0.000 0.1946*** 0.000
Year -0. 1875 *** 0.000 -0. 2612 0.102 0. 1111*** 0.000
DD 0. 6584 *** 0.000 0. 4867*** 0.000 0. 2257*** 0.000
Age 0. 0022 *** 0.001 -0. 0025 0.112 0. 0012** 0.002
Precipitation 0. 2399*** 0.000 0. 3728*** 0.000 -0. 05367*** 0.000
Temperature 0. 0968 0.265 0. 7133 0.628 -0. 2832*** 0.000
Application of Pesticide
-0. 4985 *** 0.000 -0. 1665*** 0.000 -0. 2215*** 0.000
Use of Storage Facilities
-0. 0501 0.174 -0. 2440*** 0.000 -0. 0623** 0.003
Purchase of Seed
0. 3818*** 0.000 0. 0697*** 0.000 0. 3383*** 0.000
Literacy 0. 4408*** 0.000 1.0181 0.385 -0. 0075 0. 903
Constant -258.33*** 0.000 -547.9597 *** 0.000 26.62 0.256
Prob > F 0.0000*** 0.0000*** 0.0000***
R-squared 0.0233 0.0059 0.0399
Sigma_u 99.2363 152.9198 23.8564
Sigma_e 0.9853 1.1729 0. 5566
Rho 0.9999 0. .9999 0. 9995
Source: Computed by the Authors. *** Significant at 1%, **Significant at 5%, * Significant at 10%.
22 reSearch paper 390
5. Conclusion and recommendationsIf the e-wallet estimated yield impact of 66% on the participating small-scale farmers is compared with 38% estimated as the impact of the scheme on the yield of average farmers participating in the scheme, it suggests that the impact of the scheme could be higher if the scheme is well targeted at small scale poor farmers. Increased productivity, which the scheme engenders, can reduce food insecurity in Nigeria. Provision of rural infrastructure, such as good road network, accessibility to mobile phones, radio, etc., will increase accessibility of the small-scale farmers to the scheme or other similar agricultural schemes.
22

The ImpacT of e-WalleT ferTIlIzer SubSIdy Scheme and ITS ImplIcaTIon on food SecurITy In nIgerIa 23
Notes1. The target farmers are small-scale farmers who do not have enough resources to
purchase two bags of fertilizer on their own. The scheme is designed for "core poor" farmers who are not able to purchase fertilizer and agro-inputs at the competitive prices in the market.
2. The GESS uses an “on demand” registration process, whereby eligible individuals are invited to register for the programme at designated centres established at the ward level. Complementary outreach and information campaigns use radio and broad-based advertising and public notices to inform farmers about registration. Registration takes place over a period of 1-2 weeks in each location; there are no limits to the number of farmers who can register in each location.
3. Since the registration is at individual level, there can be more than one member who applied to receive subsidized fertilizer per household.
4. Farmers are self-declared and provide information on their land size at registration. It is challenging for farmers to declare accurately their land size because the land tenure system may not clearly delineate land owned or used. It is also not possible to verify whether a farmer is, indeed, a farmer.
5. Redemption centre is a warehouse where an agro-dealer stores its products for sale. The farmer has to show the text message and one of their IDs (identity card issued by GESS, voter’s card, or national identity card). When an e-voucher is redeemed, voucher number and the beneficiary’s ID are recorded and reported electronically to GESS office.
6. The scheme is managed by a technical facilitator, Cellulant Limited, that oversees the GESS technology platform through which farmers are registered and the input subsidy delivered. Cellulant Limited also provides a set of standard operating procedures for checks, balances and penalties for non-compliance. The system also plays a key role in reconciliation and provides regular reports directly to the FMARD.
7. However, a three-hectare plot requires a higher quantity of inputs; for example, 500kg fertilizer is recommended for one hectare of rice (Yoko, 2016). The challenge for the e-wallet fertilizer scheme is to stimulate purchase of inputs by farmers beyond the quantity available under the subsidy programme. A possible way to increase sales could be to shift redemption from warehouses to agro-dealer retail outlets to provide farmers with greater exposure to a broader range of available products.
8. Adebo (2014) further indicated that for an agro input dealer to participate in the programme, he/she must own a cell phone with a registered SIM card, understand the
23

24 reSearch paper 390
process of using e-wallets, and attend training programmes designed for the project. The agro dealers are expected to be honest and guard against fraud; choose and prepare a location for the business transaction; provide storage facilities and be available at the appropriate time to attend to farmers’ needs. Other prominent agents in the scheme are the helpline personnel and redemption supervisors. Each state Agricultural Development Project (ADP) supplied the helpline staffs, and about 3-5 helpline staffs are assigned to each of the Local Government Area. The helpline staff and supervisors connect to the farmers on a daily basis to attend to their needs.
9. Among the strengths of observational studies is the ability to estimate treatment effect in real world conditions. On the contrary, a limitation of observational studies is the lack of treatment assignment. Non-randomized groups usually differ in observed and unobserved characteristics, resulting in differential selection into treatment groups causing selection bias when evaluating the effect of treatment. Observational studies that lack randomization of subjects into treatment groups must address selection bias to properly estimate the effect of the treatment. Regression adjustment, matching, and stratification using propensity scores are widely used techniques to compare groups, usually comparing a treatment group to a non-treatment group. Instrumental variable (IV) analysis is the standard method used to control for selection bias in economic circles. An advantage of IV is that it accounts for unmeasured factors correlated with the outcome; this is especially helpful when analysing data sets that were not created for the purposes of the research question. Weakness of IV is that the instrument can be challenging to find and difficult to validate and must be agreed upon by subject matter experts (Leslie and Ghomrawi, 2008).
10. As for the relevant covariates Xi, PSM will be biased if covariates that determine participation are not included in the participation equation for other reasons. These reasons could include poor-quality data or poor understanding of the local context in which the programme is being introduced (Shahidur et al, 2010).
11. Using the same data source helps ensure that the observed characteristics entering the logit or probit model of participation are measured similarly across the two groups and thereby reflect the same concepts.
12. If the two samples come from different surveys, then they should be highly comparable surveys (same questionnaire, same interviewers or interviewer training, same survey period, and so on).
13. Nevertheless, including too many X variables in the participation equation should also be avoided; over-specification of the model can result in higher standard errors for the estimated propensity score Pˆ(X ) and may result in perfectly predicting participation for many households (Pˆ(X ) = 1). In the latter case, such observations would drop out of the common support assumption. Determining participation is less of an issue in the participating equation than obtaining a distribution of participation probabilities (Shahidur et al, 2010).

The ImpacT of e-WalleT ferTIlIzer SubSIdy Scheme and ITS ImplIcaTIon on food SecurITy In nIgerIa 25
14. The aim of matching is to find the closest comparison group from a sample of non-participants to the sample of programme participants. “Closest” is measured in terms of observable characteristics not affected by programme participation.
15. Different matching methods reach different points on the frontier of the trade-off between quality and quantity of the matches, and none of them is a priori superior to the others. Their joint consideration, however, offers a way to assess the robustness of the estimate (Becker and Ichino, 2002).
16. One major advantage of this approach is the lower variance which is achieved because more information is used. Therefore, the absolute difference between the estimated propensity scores for the control and treatment groups is minimized.
17. Conditional independence states that, given a set of observable covariates X that are not affected by treatment, potential outcomes (Y) are independent of treatment assignment T. If Yi
1 represent outcomes for participants and Yi0 outcomes for non-
participants, conditional independence implies (Yi1, Yi
0) ⊥ Ti | Xi .This assumption is also called unconfoundedness (Rosenbaum and Rubin, 1983), and it implies that uptake of the programme is based entirely on observed characteristics.
18. Common support or overlap condition ensures that treatment observations have comparison observations “nearby” in the propensity score distribution (Heckman et al, 1999). That is 0 < P(Ti = 1|Xi) < 1 . Specifically, the effectiveness of PSM also depends on having a large and roughly equal number of participant and non-participant observations so that a substantial region of common support can be found. Treatment units will therefore have to be similar to non-treatment units in terms of observed characteristics unaffected by participation; thus, some non-treatment units may have to be dropped to ensure comparability. Heckman et al (1997) encouraged dropping treatment observations with weak common support. Only in the area of common support can inferences be made about causality.
19. In addition to FSFC and NAFCON, a handful of bulk-blending plants with varying production/processing capacities were established across the country in different states (FMARD, 2008). Ownership of these blending plants ranged from state governments to private ownership or mixed capital investments. Out of more than 30 established blending plants, only a few reached active production after installation. Even at the peak of production, the combined output of all plants operating in Nigeria was less than one million metric tonnes of products, accounting for about one-third of the country's installed capacity.
20. Nigeria imports the bulk of its fertilizer and is a price taker in the international market. Thus, the increased price fluctuation in the international market may explain the high price farmers pay for fertilizer in the Nigerian market (FAOSTAT, 2011). Additionally, there is ample evidence suggesting that in Nigeria, there are market constraints throughout the domestic supply chain that contribute to about 42% of the total fertilizer domestic cost, almost doubling the price farmers ultimately pay relative to the international/border price (Banful and Olayide, 2010).

26 reSearch paper 390
21. Fertilizer imports declined sharply between 1993 and 1997 following the disengagement of the FGN from fertilizer production and importation as a result of market liberalization policy and the elimination of subsidies (Olomola et al, 2014). This disengagement caused problems with the supply of fertilizer since the private sector was not able to take over the responsibility of imports and distribution. Consequently, during the 1997/98 farming season, the fertilizer market suffered shortages resulting in low agricultural production.
22. Nigeria population available on the internet at http://www.tradingeconomics.com/nigeria/population
23. The Nigeria (GHS)-Panel) was supported by the Living Standards Measurement Study - Integrated Surveys on Agriculture (LSMS-ISA) project undertaken by the Development Research Group at the World Bank. The LSMS-ISA project aims to support governments in seven sub-Saharan African countries to generate nationally representative household panel data with a strong focus on agriculture and rural development. The surveys under the LSMS-ISA project are modelled on the multi-topic integrated household survey design of the LSMS; Household, Agriculture, and Community questionnaires are an integral part of every survey effort.
24. http://econ.worldbank.org/WBSITE/EXTERNAL/EXTDEC/EXTRESEARCH/EXTLSMS/0,,contentMDK:22949589~menuPK:4196952~pagePK:64168445~piPK:64168309~theSitePK:3358997~isCURL:Y~isCURL:Y~isCURL:Y,00.html
25. It is obvious that the impact of the scheme on the yield, crop output and fertilizer used by the farmers is lower when we net out the effects of precipitation, temperature, application of pesticide, use of storage facilities, seed purchase and literacy level of the farmers on the outcomes we investigated in this study.
The ImpacT of e-WalleT ferTIlIzer SubSIdy Scheme and ITS ImplIcaTIon on food SecurITy In nIgerIa 27
ReferencesAdebayo, O. and K. Olagunju. 2015. "Impact of agricultural innovation on improved livelihood
and productivity outcomes among smallholder farmers in rural Nigeria”. The Maastricht School of Management Working Paper No. 2015/07.
Adebo, G.M. 2014. “Effectiveness of e-wallet practice in grassroots agricultural services delivery in Nigeria - A case study of Kwara State growth enhancement support scheme”. Journal of Experimental Biology and Agricultural Sciences, 2: 4‒12.
Adesina, A. 2013. “Agricultural Transformation Agenda: Mid-Term Report”. Federal Ministry of Agriculture and Rural Development, Abuja, Nigeria.
Ahmed, F.F., A.B. Yusuf and J. Dunnah. 2016. “Effect of growth enhancement support on food security status of rural farming households in Adamawa State, Nigeria”. International Journal of Economic and Business Review, 4(5):14‒24.
Amurtiya, M., A.K. Tashikalma and D.C. Maurice. 2018. “Agricultural inputs subsidy in Nigeria: An overview of the growth enhancement support scheme (GESS)”. Acta Universitatis Agriculturae et Silviculturae Mendelianae Brunensis, 66(3): 781‒89.
Atofarati, Y. 2014. “Growth enhancement support scheme: Towards the transformation of Nigeria agricultural sector”. At http://www.ciuci.us/wp content/uploads/2013/03/Growth-Enhancement-Support-Scheme.pdf.
Banful, A.B. 2010. “Old problems in the new solution? Politically motivated allocation of programme benefits and the ‘new’ fertilizer subsidies”. International Food Policy Research Institute (IFPRI). At http://www.ifpri.org/publication/old-problems-new-solutions.
Banful, A.B. and O. Olayide. 2010. “Perspectives of varied stakeholders in Nigeria on the federal and state fertilizer subsidy programmes”. Nigeria Strategy Support Programme Working Paper Number 08. International Food Policy Research Institute, Washington, D.C.
Becerril, J. and A. Abdulai. 2010. “The impact of improved maize varieties on poverty in Mexico: The propensity matching approach”. World Development, 38(7): 1024‒35.
Becker, S.O. and A. Ichino. 2002. “Estimation of the average treatment effects based on propensity score matching”. The Stata Journal, 2(4): 358‒77.
Bertrand, M., E. Duflo and S. Mullainathan. 2004. “How much should we trust differences-in-differences estimates?” Quarterly Journal of Economics, 119(1): 249‒75.
Blundell, R. and M. Costa-Dias. 2000. “Evaluation methods for non-experimental data”. Fiscal Studies, 21: 427‒68.
Caliendo, M. and S. Kopeinig. 2008. “Some practical guidance for the implementation of propensity score matching”. Journal of Economic Surveys, 22(1): 31‒72.
27

28 reSearch paper 390
Chirwa, E.W., A. Dorward and M. Matita. 2011. “Conceptualizing graduation from agricultural inputs subsidies in Malawi”. Future Agricultures Working Paper No. 029. U.K Department for International Development (DFID). Also available at www.future-agricultures.org.
DellaVigna, S. 2009. “Psychology and economics: Evidence from the field”. Journal of Economic Literature, 47(2): 315‒72.
Denning, G., P. Kabembe, P. Sanchez, A. Malik, R. Flor, R. Harawa and P. Nkhoma. 2009. “Input subsidies to improve smallholder maize productivity in Malawi: Toward an African green revolution”. PLoS Biology, 7(1): 11‒18.
Diaz, J.J. and S. Handa. 2004. “Propensity score matching as a non-experimental impact estimator: Evidence from Mexico’s PROGRESA”. Mimeo. UNC-CH, Department of Public Policy.
Dorward, A. and E. Chirwa. 2011. “The Malawi agricultural input subsidy programme: 2005/06 to 2008/09”. International Journal of Agricultural Sustainability, 9(1): 232‒47.
Duflo, E., M. Kremer and J. Robinson. 2008. “How high are rates of return to fertilizer? Evidence from field experiments in Kenya”. American Economic Review, 98(2): 482‒88.
Duflo, E., M. Kremer and J. Robinson. 2011. “Nudging farmers to use fertilizer: Theory and experimental evidence from Kenya”. American Economic Review, 101(6): 2350‒90.
Ejiogu, A.O. 2017. “Growth enhancement support scheme of the Nigerian agricultural transformation agenda: Looking back and thinking ahead”. Nigerian Agricultural Policy Research Journal, 3(1): 28‒41.
Enemchukwu, D.C., C.O.A. Ugwumba and U.O. Uche. 2017. “Performance of the growth enhancement support scheme among food crop farmers in Anambra State, Nigeria”. International Journal of Multidisciplinary Research and Analysis, 1(1): 13‒22.
Fadairo, O.S., N.S. Olutegbe and A.M. Tijani. 2015. “Attitude of crop farmers towards e-wallet platform of the growth enhancement support scheme for input delivery in Oke-Ogun area of Oyo State”. Journal of Agricultural Informatics, 6(2): 62‒71.
FAO. 2012. Statistical Yearbook, 2012. Italy, Rome. Food and Agriculture Organization Statistical Year Book
FAOSTAT. 2011. “Fertilizer consumption in Nigeria”. Italy, Rome. Food and Agriculture Organization Statistical Year Book
FEWSNET. 2007. “Nigeria food security update”. Famine Early Warning Systems Network. Washington, D.C.: U.S. Agency for International Development.FMARD. 2016. “The agriculture promotion policy (2016–2020)”. Federal Ministry of Agriculture
and Rural Development, Abuja, Nigeria.FMARD. 2014. “Ten million farmers captured in agric e-wallet scheme”. Abuja, Nigeria. Federal
Ministry of Agriculture and Rural Development. FMARD. 2012. “Growth enhancement support scheme”. Abuja, Nigeria. Federal Ministry of
Agriculture and Rural Development. FMARD. 2008. "National Fertilizer Policy for Nigeria." Abuja, Nigeria. Federal Ministry of
Agriculture and Rural Development, Federal Fertilizer Department Fuentes, P.A., B. Bumb and M. Johnson. 2012. “Improving fertilizer market in West Africa: The
fertilizer supply chain in Nigeria”. Washington, D.C. IFDC and IFPRI Report,GrowAfrica. 2015. “Accelerating agricultural transformation in Africa”. At https://www.
growafrica.com/resources/all
The ImpacT of e-WalleT ferTIlIzer SubSIdy Scheme and ITS ImplIcaTIon on food SecurITy In nIgerIa 29
Heckman, J., H. Ichimura and P. Todd. 1997. “Matching as an econometric evaluation estimator”. Review of Economic Studies, 65(2): 261‒94.
Heckman, J.J., R. LaLonde and J. Smith. 1999. “The economics and econometrics of active labour market programmes”. In O. Ashenfelter and D. Card, eds., Handbook of Labour Economics, vol. 3. Amsterdam: North-Holland.
Hirano, K., G.W. Imbens and G. Ridder. 2003. “Efficient estimation of average treatment effects using the estimated propensity score”. Econometrica, 71(4): 1161‒89.
Holden, S. and R. Lunduka. 2013a. “Who benefit from Malawi's input subsidy programme?” Forum for Development Studies, 40(1): 1‒25.
Holden, S. and R. Lunduka. 2013b. “Input subsidies, cash constraints and timing of inputs supply”. American Journal of Agricultural Economics, 1‒18.
Holden, S.T., B. Shiferaw and M. Wik. 1998. “Poverty, market imperfections, and time preferences of relevance for environmental policy”. Environment and Development Economics, 3: 105‒130.
IDEP. 2011. “Towards improved fertilizer subsidy programme in Nigeria. Drawing lessons from promising practices in SSA”. At http://www.npc.gov.ng/vault/files/IDEP%20Study%20doc.pdf.
IFDC/PROMIDIA. 2008. "An Assessment of the Nigeria Seed and Fertilizer Markets." Abuja, Nigeria. IFDC
Khandker, S.R., Z. Bakht and G.B. Koolwal. 2009. “The poverty impacts of rural roads: Evidence from Bangladesh”. Economic Development and Cultural Change, 57(4): 685‒722.
Kwa, A.R. 2002. “Policy initiatives relating to fertilizer production and marketing and fertilizer regulations in Nigeria”. Paper presented at the National Workshop for Fertilizer Blending Plants in Nigeria, organized by the IFDC/DAIMINA Project. Abuja, Nigeria, 25‒26 June.
Leslie, R.S and H. Ghomrawi. 2008. “The use of propensity scores and instrumental variable methods to adjust for treatment selection bias”. USA, SAS Global Forum.
Liverpool-Tasie, L.S.O., A.B. Banful and B. Olaniyan. 2010. “An assessment of the 2009 fertilizer voucher programme in Kano and Taraba, Nigeria”. Policy Note No.30. International Food Policy Research Institute. At http://www.ifpri.org/sites/default/files/publications/nssppn30.pdf.
Minde, I., T.S. Jayne, J. Ariga and E. Crawford. 2008. “Fertilizer subsidies and sustainable agricultural growth in Africa: Current issues and empirical evidence from Malawi, Zambia and Kenya”. Food Security Group, Michigan State University. Paper prepared for the Regional Strategic Agricultural Knowledge Support System (Re-SAKSS) for Southern Africa.
Minot, N. and T. Benson. 2009. “Fertilizer subsidies in Africa: Are vouchers the answer?” International Food Policy Research Institute (IFPRI). Issue Brief 60, July 2009.
Morris, M., V. Kelly, R.J. Kopicki and D. Byerlee. 2007. Fertilizer Use in African Agriculture: Lessons Learned and Good Practice Guidelines. Washington, D.C.: The World Bank.
Nagy, J.G. and O. Edun. 2002. “Assessment of Nigerian Government fertilizer policy and suggested alternative market friendly policies”. At http://pdf.usaid.gov/pdf_docs/PNADB846.pdf
Nwaobiala, C.U. and V.U. Ubor. 2016. “Effectiveness of electronic wallet system of growth enhancement support scheme distribution among arable crop farmers in Imo State, South Eastern Nigeria”. Scientific Papers Series Management, Economic Engineering in Agriculture and Rural Development, 16(1): 355‒60.

30 reSearch paper 390
Obayelu, A.E. 2016. “Cross-country comparison of voucher-based input schemes in sub-Sahara Africa agricultural transformation: Lessons learned and policy implications”. Agriculturae Conspectus Scientificus, 81(4): 251‒67.
Ogunfowora, O. 2000. “The travails of Nigerian agricultural inputs supply system: Which way forward?” 5th Tai Solarin Memorial Lecture, Mayflower School, Ikenne, Nigeria. ACS ABISE Consulting System (NIG) Ltd.
Ogunfowora, O. and B. Odubola. 1994. “A conceptual framework for a phased subsidy withdrawal programme under a liberalized fertilizer sector”. Draft, Lomé. IFDC/Africa.
Olomola, A.S. 2015. “Understanding the framework for intergovernmental interactions in the implementation of Nigeria’s agricultural transformation agenda”. IFPRI Working Paper No. 27. International Food Policy Research Institute, Washington, D.C.
Olomola, A., T. Mogues, T. Olofinbiyi, C. Nwoko, E. Udoh, R. Alabi and J. Onu. 2014. Analysis of Agricultural Public Expenditures in Nigeria. Examination at the Federal, State and Local Government Levels. IFPRI Discussion Paper No. 01395. International Food Policy Research Institute, Washington, D.C.
Ravallion, M. 2008. “Evaluating anti-poverty programmes”. In T.P. Schultz and J. Strauss, eds., Handbook of Development Economics, vol. 4. Amsterdam: North-Holland.
Rosenbaum, P.R. and D.B. Rubin. 1983. “The central role of the propensity score in observational studies for causal effects”. Biometrika, 70(1): 41‒55.
Salman. K.K. 2014. “Political economy of fertilizer subsidy process in Nigeria”. A Final Research Report Submitted to African Economic Research Consortium, Nairobi, Kenya.
Shahidur, R.K., G.B. Koolwal and H.A. Samad. 2010. Handbook on Impact Evaluation: Quantitative Methods and Practices. Washington, D.C.: The World Bank.
Yoko, K. 2016. “Can electronic agricultural input voucher enhance fertilizer demand? Evidence from rice growing households in North Central Nigeria”. Mimeo. University of Tsukuba, Japan.

The ImpacT of e-WalleT ferTIlIzer SubSIdy Scheme and ITS ImplIcaTIon on food SecurITy In nIgerIa 31
AppendixesAppendix A: Probit regression for estimating the propensity score
Independent Variables Coefficient P>|Z|
Application of Pesticides -0.1671 0.468
Application of Herbicides 0.0750 0.741
Animal Traction 0.8103 0.001***
Irrigation -0.8380 0.0327**
Distance to the Nearest Major Road 0.0255 0.128
Distance to the Nearest Market 0.0019 0.499
Agro-ecological Zone -1.0083 0.001***
Numbers of Wife -0.1481 0.473
Numbers of Days of Reported Sickness -0.1032 0.798
Constant 314.9008 0.001***
Pseudo R2 0.1069
Chi2 25.10***
Prob > Chi2 0.0029
Log-likelihood -105.07
The region of common support is [0.07611171…… 0.90730645].Source: Computed by the Authors. *** Significant at 1%.
Appendix B: Estimated propensity scoreStatistics Value
Mean 0.3026
Standard Deviation 0.1658
Variance 0.0275
Skewness 0.6747
Kurtosis 2.7065
Source: Computed by the Authors.
31

32 reSearch paper 390
Appendix C: DD estimates based on common support Log of Yield Log of Quantity of Harvest Log of Quantity of Fertilizer
Purchased
Baseline P>|Z| Baseline P>|Z| Baseline P>|Z|
Control(C)
1.609 Control(C)
4.525 Control
4.563
Treated (T) 1.487 Treated (T)
4.197 Treated 4.676
(T-C) -0.121 0.031** (T-C) -0.327 0.000*** (T-C) 0.114 0.000***
Follow Up Follow Up Follow Up
Control(C)
1.189 Control(C)
4.103 Control(C)
4.586
Treated (T) 1.546 Treated (T)
4.453 Treated (T)
4.881
(T-C) 0.357 0.000*** (T-C) 0.350 0.000*** (T-C) 0.295 0.000***
DD 0.479 0.000*** DD 0.678 0.000*** DD 0.181 0.000***
Source: Computed by the Authors. *** Significant at 1%, **Significant at 5%, * Significant at 10%.
Appendix D: DD Estimates using regression approach for all the farmers (OLS)Log of Yield Log of Quantity
of HarvestQuantity of Fertilizer
Purchased
Coefficient P>|t| Coefficient P>|t| Coefficient P>|t|
Subsidy 0. 0267 0.697 -0. 2779*** 0. 000 0. 1125** 0.004
Year 0. 2124 *** 0.000 -0.4738*** 0.000 0.0265*** 0.270
DD 0. 2298 *** 0.009 0.8060*** 0.000 0. 1804*** 0.000
Age 0. 0005 0.581 0.0016 0.128 -0. 0025*** 0.000
Precipitation 0. 0005 *** 0.000 -0. 0007*** 0.000 -0. 0005 *** 0.000
Temperature -0.0057 *** 0.000 -0.0265*** 0.000 -0. 0042*** 0.000
Application of Pesticide
0. 1477 *** 0.000 0.0738*** 0.096 -0. 2159*** 0.000
Use of Storage Facilities
0. 3103 *** 0.000 0. 1643*** 0.003 -0. 0498* 0.075
Purchase of Seed
0. 2918 *** 0.025 0.3831*** 0. 009 -0. 3156*** 0.000
Literacy 0.5720*** 0.000 0. 6157*** 0.000 -0. 4677*** 0.000
Constant 1.5000** 0.002 11.2648** 0.000 7.0048*** 0.000
Prob > F 0.0000*** 0.0000*** 0.0000***
R-squared 0.0281 0.0422 0.0708
Source: Computed by the Authors. *** Significant at 1%, **Significant at 5%, * Significant at 10%.

The ImpacT of e-WalleT ferTIlIzer SubSIdy Scheme and ITS ImplIcaTIon on food SecurITy In nIgerIa 33
MissionTo strengthen local capacity for conducting independent,
rigorous inquiry into the problems facing the management of economies in sub-Saharan Africa.
The mission rests on two basic premises: that development is more likely to occur where there is sustained sound management of the economy, and that such
management is more likely to happen where there is an active, well-informed group of locally based professional economists to conduct policy-relevant research.
Contact UsAfrican Economic Research Consortium
Consortium pour la Recherche Economique en AfriqueMiddle East Bank Towers,
3rd Floor, Jakaya Kikwete RoadNairobi 00200, Kenya
Tel: +254 (0) 20 273 4150 [email protected]
www.facebook.com/aercafrica
twitter.com/aercafrica
www.instagram.com/aercafrica_official/
www.linkedin.com/school/aercafrica/
Learn More
www.aercafrica.org