the impact of economic specialization on regional economic
TRANSCRIPT

economies
Article
The Impact of Economic Specialization on Regional EconomicDevelopment in the European Union: Insights for Formation ofSmart Specialization Strategy
Giedre Dzemydaite
Citation: Dzemydaite, Giedre. 2021.
The Impact of Economic
Specialization on Regional Economic
Development in the European Union:
Insights for Formation of Smart
Specialization Strategy. Economies 9:
76. https://doi.org/10.3390/
economies9020076
Academic Editors: Luís Carvalho and
Joana Costa
Received: 23 March 2021
Accepted: 11 May 2021
Published: 13 May 2021
Publisher’s Note: MDPI stays neutral
with regard to jurisdictional claims in
published maps and institutional affil-
iations.
Copyright: © 2021 by the author.
Licensee MDPI, Basel, Switzerland.
This article is an open access article
distributed under the terms and
conditions of the Creative Commons
Attribution (CC BY) license (https://
creativecommons.org/licenses/by/
4.0/).
Faculty of Economics and Business Administration, Vilnius University, Sauletekio av. 9, LT-10222 Vilnius,Lithuania; [email protected]
Abstract: The smart specialization concept was implemented in the EU in 2014, stating that regionshave to specify specialization areas for development of innovations. Economic specialization revealsa comparative advantage in that field. However, there are different arguments linking specializationto economic development. This study analyzes these arguments and aims to investigate the impactof economic specialization on regional economic development and to give insights into identifyingprospective areas in regional economies. A panel fixed effect estimation of industry-level regionaldata suggests that economic specialization in broader regional employment, called relative special-ization, is ambiguously associated with economic development. Our findings suggest that neithereconomic specialization nor economic diversity are a clear-cut solution for ensuring economic growth.Economic structure in EU regions differs, and there is no one answer for which approach is betterfor economic development. Specialization measures, particularly the location quotient, cannot fullycapture the dynamics in the industry structure that could be essential for formation of regionaldevelopment strategy.
Keywords: economic structure; economic specialization; smart specialization; economic growth; EUregions; tradable sectors
1. Introduction
European regional development policy has been counted for more than two decades.As stated in the Treaty of Rome, the general focus of this policy is to reduce regionaldifferences throughout the common European market. About one-third of the EU budgetwas dedicated to reducing regional disparities for programming periods of 2007–2013and 2014–2020. Due to emerging challenges and global competition, European CohesionPolicy was reformed in 2014, strengthening the innovation-led industrial policy perspective(McCann and Ortega-Argilés 2013; Benner 2020). The specific features of the EU contextsignificantly influenced the logic of the changes.
Industrial change focusing on innovation is one of the critical challenges of the 21stcentury that refers to ongoing economic and social development in all industries and fieldsof activity—both emerging and traditional sectors in decline. At the European level, thevast majority of socio-economic players agreed on the need for a proactive approach toindustrial change from two perspectives: fostering higher value-added activities in regionsand dealing with social consequences due to changes in the economy and the Europeanlabor market. Such a proactive approach to industrial change was introduced in the EU in2014. The European Commission stated prerequisite requirements for the EU regions toreceive funding from the European Regional Development Fund. Regions had to choosetheir specific specialization areas for innovation and to adopt research and innovationstrategies for smart specialization.
Smart specialization strategy reveals a place-based policy approach to regional eco-nomic development (Barca et al. 2012). Regions identified strategic areas for intervention
Economies 2021, 9, 76. https://doi.org/10.3390/economies9020076 https://www.mdpi.com/journal/economies
Economies 2021, 9, 76 2 of 15
based on the analysis of the economy’s strengths and the potential of regional innovationsystems (European Commission 2015, 2017a, 2017b; McCann and Ortega-Argilés 2015).Place-based policies are supposed to stimulate private sector investment and economicgrowth in the treated place, and as such, they are sometimes difficult to appraise andevaluate (Duranton and Venables 2018).
This approach to regional innovation policy spreads worldwide. Other countriesand regions outside the EU (in Latin America, sub-Saharan Africa, Eastern partnershipcountries, and others) investigate opportunities to apply regional research and innovationstrategies for smart specialization (Dosso et al. 2020; Barroeta et al. 2017; Kleibrink et al.2017). At the core of policy formation comes the selection of smart specialization areas andraises a question of the role of economic specialization in this process.
The main question behind the policymaking is how to shift regional economic de-velopment into more smart growth and how to facilitate new prospective industries andactivities to flourish. The idea behind this is that regions have to use their strengths anddevelop sectors and activities where regional actors had a related experience. This leadsto a diversification process in relation to a current specialization (Foray et al. 2009, 2011;Balland et al. 2019). Diversification means that new prospective activities are emerging.Specialization means that these activities relate to the regional context and previous prac-tice. Therefore, in the first step of policy formation comes an analysis of regional economicstructure and current specialization and innovation areas.
One of the available methods is an analysis of regional economic specialization (Forayet al. 2011). It is a quantitative analysis to calculate degrees of specialization of regionaleconomies based on employment or value-added data. Specialization indexes, usually thelocation quotient (LQ) index, indicate critical masses of activity. Even though it does notreveal innovation-driven linkages, it still gives evidence of a regional economy where valueadded and exports are generated in the economy and where knowledge and competenciesare concentrated (Foray 2015). Various EU regions applied the LQ index for specializationanalysis as the first step of formation of a smart specialization strategy. Then, through theentrepreneurial discovery process, regional actors further discussed prospective futureeconomic growth areas and formulated smart specialization strategies.
Even though a measurement of economic specialization in the sense of LQ indexesare broadly involved in a policy formation around the EU and other countries (Forayet al. 2011; Postoiu and Dachin 2014), there is still a gap in the scientific literature forgiving more evidence and critical analysis of the applicability of quantitative measuresfor policy formation. A recent discussion of Hassink and Gong (2019), Foray (2019), andBenner (2020) underlined a need for rigorous measurements of prospective areas and acritical judgment of the currently applied techniques in policy formation.
Prioritization of prospective areas proved difficult and limited capacities of imple-menting agencies, especially in lagging regions (e.g., Capello and Kroll 2016; Karo et al.2017; Gianelle et al. 2019; Trippl et al. 2020). Proper quantitative or qualitative techniquescould reduce the risk of local actors’ incapacity. Most recently, Balland et al. (2019) sug-gested involving a new measurement of relatedness in policy formation that is expandingknowledge in this field. Kemeny and Storper (2014) critically analyzed absolute and relatedspecialization for the USA regions and suggested that relative specialization cannot capturedynamics in the economic structure. For this reason, a critical assessment of quantitativetechniques is a question for further scientific research that is not sufficiently covered for theEU regions.
In this paper, we followed these thoughts and aimed to investigate the impact ofeconomic specialization on regional economic development and give insights about identi-fying prospective areas in regional economies. The research question was to what extenthigher specialization rates, measured by location quotient, reveal prospective areas foreconomic growth and to what extent such analysis could be valuable in the policy for-mation of smart specialization strategies. The novelty of the paper is that we match animpact evaluation with insights for formation of smart specialization strategies. Most

Economies 2021, 9, 76 3 of 15
studies present the economic nature of how regions evolve rather than give insights intothe application of economic specialization measures in the process of policy formation,apart from some research, e.g., Kemeny and Storper (2014), who analyzed USA regionaldata, or Balland et al. (2019), who suggested a new framework. This paper gives insightsinto how to divide tradable and non-tradable sectors essential for economic specializationanalysis. It supplements previous explanations (Jensen and Kletzer 2005; Moretti andThulin 2012; Kemeny and Storper 2014). A dataset covers the most recent data of the EUregions that gives a sense of a broader EU perspective rather than a case study of a regionor country, but still with economic activities distributed in comparatively disaggregatedlevels (48 sectors). Case studies could be found from a variety of researchers, i.e., Postoiuand Dachin (2014), Paliokaite et al. (2015), and Sotarauta and Suvinen (2019).
The paper consists of four main parts. Section 2 systemizes related literature andgives a general image of the impact of an economic specialization on regional economicdevelopment. It reveals the gains and drawbacks of an economic specialization to aregional economy. Section 3 explains research methods and data. This section also presentsan approach to the division between tradable and non-tradable sectors that supports aselection of economic sectors involved in the analysis. Section 4 reveals the estimationresults of the panel data model. Sections 5 and 6 summarize the main findings and explainpolicy implications.
2. Related Literature
There are two sides of the coin while analyzing the economic specialization and itsimpact on economic development. Both specialization and diversification processes ofeconomic structure could benefit the regional economy from different perspectives. Fromthe most recent literature overview, new innovative activities are supposed to emerge as adiversification process in current specialization areas (Foray et al. 2011; Hassink and Gong2019). Regions need to continuously reinvent themselves by developing new activities thatmean a process of diversification (Balland et al. 2019).
The explanation of specialization and diversification processes and their impact on eco-nomic development comes from the works of Jacobs (1969), Marshall (1920), Arrow (1962),and Romer (1990), who analyzed agglomeration effects and high spatial concentrationof companies in the same or different sectors. These evolved into dominant theoreticalconcepts, most recently analyzed by Boschma and Martin (2010), Content et al. (2019), andother researchers.
Because of the limited size of a local market, economic specialization of a region formswhen firms sell goods or services in foreign markets (Kemeny and Storper 2014). Highereconomic specialization rates relate to higher exports and reflect a comparative advantageof companies in that field. Change of production level in exporting sectors influencesregional income directly and indirectly through income-multiplying effects (Moretti andThulin 2012; Capello 2016, p. 122). The output of tradable sectors is not limited by localincome and market size. If an external demand is growing and the region’s output enjoysincreasing rations of its unit price relative to imports, it benefits the economy’s overallincome. The tradable sectors considerably impact overall productivity in the EuropeanUnion (Friesenbichler and Glocker 2019).
Increasing the size of localized activity, which means a process of economic specializa-tion, could also enhance the productivity of firms through sharing of input suppliers, aspecialized labor market and its development, and technological learning and spillovereffects through actors spread across different organizations (Duranton and Puga 2004;Henderson 2003). Industrial concentration and economic specialization lead to positiveexternalities in the local economy that could affect economic development, employment,and income (De Groot et al. 2009).
On the other hand, arguments are linking a more diversified economic structure toregional economic development. The greater diversity in the economy could generate thegreater capacity to create more types of goods and services (Jacobs 1969). The spatial prox-

Economies 2021, 9, 76 4 of 15
imity of companies from different sectors could create positive externalities to economicdevelopment. It contributes to the exchange and combination of ideas between differentsectors, which is beneficial for creating new activities. Even though knowledge is spreadprimarily within the individual economic sector, it could also spread across sectors. If thevariety of companies and skills are related, it is supposed to give more opportunities forregional economic development (Mameli et al. 2012; Van Oort et al. 2015; Misiak and Dykas2021). Regions are more likely to diversify into complex technologies when relatedness ishigh (Balland et al. 2019).
An additional shortcoming of the specialization of regions is the risk of changing tech-nologies or black swans. When a particular economic sector is affected by an unfavorablebusiness cycle, a highly specialized territory may experience a severe economic downturn(Dietz and Garcia 2002; Šidlauskaite-Riazanova and Miškinis 2019). One example is theCOVID-19 crisis that revealed an uncompromising slump of regions specialized in tourism(Šidlauskaite-Riazanova 2020; Skare et al. 2021; Zhang et al. 2021). Highly specializedregions could become a hostage of their economic structure. The question is to what extentsuch regions can diversify in new economic activities in general and in the case of a crisis.Different goods and activities are associated with differed technological and learning op-portunities. Regions specialized in dynamic and innovative industries are better positionedto achieve sustained economic growth than others (Hausmann et al. 2007). Diversificationinto more complex technologies is attractive but challenging for European Union regionsto accomplish (Balland et al. 2019). A critical mass of capabilities to develop collectivelearning and compete at a global level is needed (Iacobucci and Enrico 2016). There is a riskof a lack of local preconditions for innovation development in regions with few researchinstitutions and high-tech clusters. These conditions form challenges for developing newspecializations in more complex activities where regions do not have an existing practice.
According to Capello and Kroll (2016), there are issues in developing high value-added specializations in peripheral regions. If the regional economy is highly dependenton multinational enterprises (MNEs) that are settled in the region, a repositioning of regionsin international value chains can often not be controlled by policymakers from within theseregions alone. MNEs have their global corporate strategies and could not be specificallyinterested in becoming engaged with these regional local development strategies. MNEsremain vulnerable to more general corporate plans. Decisions to reallocate activities areout of the control of the regional government.
Even though different arguments link more specialized or diversified economic struc-ture to economic development, a variety of arguments comes for economic specializationthrough the lenses of comparative advantage, intra-sectoral dissemination and knowledgespillover within the sector, and localization externalities that come from the economicspecialization. The extent to which economic specialization influences regional economicdevelopment remains a question for scientific debate.
3. Research Methodology3.1. Model Specification
In this paper, we investigated the relationship between economic specialization andregional economic growth in European regions. The research framework is built on aneoclassical growth theory (Solow 1952) that is commonly applied for modeling economicgrowth in various research (Liu 2019). Control variables in a model represent changesin capital and labor expressed by indicators of gross fixed capital formation, personswith tertiary education, or working-age population. These variables are common inan economic growth analysis (Akcigit 2017). For this study, we involved a measure ofeconomic specialization in the model as an independent variable.
There are different approaches on how to measure economic specialization. Moststudies measure the level of relative specialization by location quotients following Glaeseret al.’s (1992) idea. This measure is applied in the policymaking process to evaluateprospective smart specialization areas (Foray et al. 2011). For this reason, we used a
Economies 2021, 9, 76 5 of 15
relative specialization indicator based on location quotient calculations. A coefficient oflocations quotients (LQri) incorporates the effect of regional industrial scale by the followingexpression (Lu et al. 2011):
LQri =Eri/(∑N
i=1 Eri)(∑M
r=1 Eri
)/(∑N
i=1 ∑Mr=1 Eri)
=SriSi
(1)
where LQri—the location quotient of industry i in region r, r = 1, . . . , M, i = 1, . . . , N;E—the number of employees (employment); Sri—the employment share of industry i inregion r; Si—the employment share of industry i in total employment.
The relative specialization of region r was measured by the average location quotientweighted by the number of people employed:
Specializationr = ∑Ni
EriEr
LQri (2)
where Eri denotes the number of employees in region r in industry i, r = 1, . . . , M, i = 1,. . . , N; Er—the total number of employees in region r.
We applied a panel fixed effect estimation for industry-level regional data based on aneoclassical growth theory. We estimated an equation with and without year fixed effectsto consider time-specific shocks and their impact on estimated results. Estimated model (2)was as follows:
GDPgrit = β1Specit + β2GDPit−1 + β3Employit + β4GFCFit + β5EDUit +µi + ηt + εit (3)
where GDPgrit—an annual growth of GDP per inhabitant in region i and period t, r = 1,. . . , M; Specit—regional specialization (Specializationr in Equation (3)); GDPit−1—laggedGDP per inhabitant; Employit—an annual growth of employed persons; GFCFit—grossfixed capital formation per inhabitant; EDUit—a percentage of the population with tertiaryeducation; µi—unobserved individual fixed effects; ηt—time effects; εit—an error term.GDPit−1 is involved due to the dependence of regional economic growth on the level ofeconomic development (Monfort 2008). In the EU context, European regions with lowerGDP per capita obtained higher cohesion funds related to the level of development forcatching up with economically developed regions.
We have chosen to analyze the regional level rather than the national level. Smartspecialization strategies were developed in the EU at the regional level. Additionally, forrelative specialization analysis, regional data is more suitable for comparing units that aremore similar in size from a territorial perspective and density of resources. Regions in theEuropean Union are divided into administrative units according to the Nomenclature ofTerritorial Units for Statistics (NUTS). The NUTS classification was applied into a formalRegulation of the European Parliament and the Council in 2003 (Eurostat 2015). TheNUTS harmonizes the collection of regional data, ensures comparable regional statistics foranalysis, and for the comparison of the socio-economic situation and policy measures.
NUTS2 is a regional level for the application of regional policies in the EU. However,industry-level data of NUTS2 was limited for the analysis. Therefore, we analyzed dataof NUTS1 level of 2008–2016, assuming that economic specialization is reflected in moreaggregated territorial units. A time period was selected due to the regional and industrialdata availability.
3.2. Selection of Economic Sectors for Analysis
Local markets are limited in size. For a region to achieve a higher specialization ratein some economic activities, it has to have at least part of the demand from foreign markets.For this reason, tradable sectors are involved in the analysis of economic specialization.Tradable sectors are those whose output is traded internationally, and it could be bothgoods and services (Gervais and Jensen 2019; Francois and Hoekman 2010).
Economies 2021, 9, 76 6 of 15
A set of studies have focused on the manufacturing sector, implicitly assuming thatservices are non-tradable, but this traditional assumption that goods are tradable andservices are non-tradable is increasingly inadequate. Gervais and Jensen (2019) stated thatservice trade has grown over time and now accounts for about 20% of global internationaltransactions, and tradable service industries account for about the same share of valueadded as tradable manufacturing industries in the US. The potential welfare gains fromtrade liberalization in the service sector seem considerable (Francois and Hoekman 2010).In a globalized economy, services form a significant part of international trade. Therefore,service sectors have to be included in the analysis of economic specialization.
There is a discussion on how to separate tradable vs. non-tradable sectors. Forexample, Moretti and Thulin (2012) defined the non-tradable sector as locally producedand consumed services and the tradable sector as manufacturing and a part of the servicesector that were exported outside the local economy. Kemeny and Storper (2014) calculatedthe Herfindahl index of geographical concentration to find a cut-off point in the distributionof concentration values at which tradable activities are distinguished from non-tradablein the US metropolitan areas, stating that if sectors are spatially ubiquitous, they had tobe generally non-tradable (Jensen and Kletzer 2005). Herfindahl index of geographicalconcentration (Concj) is evaluated by the formula:
Concj = ∑Kk=1
(ejk
Ej
)2
(4)
where e—employment in industry j and city k; E is the total employment across all citiesin industry j. Herfindahl index values vary from 0 to 1, while industries with values near0 exhibit a uniform distribution over space, while values closer to 1 indicate sectors withhighly concentrated activity in only a few locations.
With no clear theoretical guidance on such a cut-off, Kemeny and Storper (2014)have chosen to eliminate sectors with a lower Herfindahl index rate (lower than 0.036)that seemed to differentiate non-tradable from tradable sectors in practice. For example,eliminated sectors were death care services, retail stores, car repairing, architectural services,etc. We used this approach to evaluate the distribution of economic activities betweenEuropean regions with an expansion.
While analyzing the Herfindahl index of geographical concentration for sectors inthe EU, some sectors with a comparatively low Herfindahl index have high specializationvalues (LQ, Equation (1)). For example, almost all regions in the EU had wholesale andretail trade and repair of motor vehicles and motorcycle activities (sector code—G45). TheHerfindahl index was close to 0 (0.0161) because such activities are in all regions. However,for example, in the LT0 region, the LQ index of this sector was high (LQ = 1.42), revealingthat a variety of companies in LT0 were repairing and re-exporting motor vehicles andmotorcycles to foreign markets and it was a significant part of their value added. The samesituation occurred with accommodation and food and beverage services activities (codes ofsectors—I55 and I56). All regions in the EU had such activities that meant low HI (0.0187and 0.0185). However, some regions focused on tourism, e.g., the Crete region, which washighly specialized in these sectors with high LQ values.
For this reason, we did not cut off all sectors with a comparatively small Herfindahlindex in the way Kemeny and Storper (2014) did with the US data. This approach seemednot suitable for EU data because there were considerable differences in economic activitiesbetween EU regions and their economic structure. Therefore, we involved the LQ indexin analysis for identifying the tradable sectors (Equation (1)). Rather than estimating theimpact of specialization in the full range of all sectors, we focused on tradable sectors. Weeliminated such sectors as veterinary activities, rental and leasing activities, employmentactivities, retail trade, water supply, etc. Moreover, we did not involve sectors such asC32—other manufacturing or M74—other professional, scientific, and technical activitiesbecause of the aggregated data of different types of economic activities under the same
Economies 2021, 9, 76 7 of 15
code. We involved 48 industries in the analysis according to NACE classification. NACEclassification groups together economic activities that have similar input and productiontechniques and similar outputs. A final list of sectors involved in the analysis is presentedin Appendix A.
4. Results
This part first represents an overview of the level of economic specialization in theEU regions during the period analyzed and then gives insights about estimation results ofeconomic specialization impact on economic growth. A broader discussion of the results ispresented in the following part.
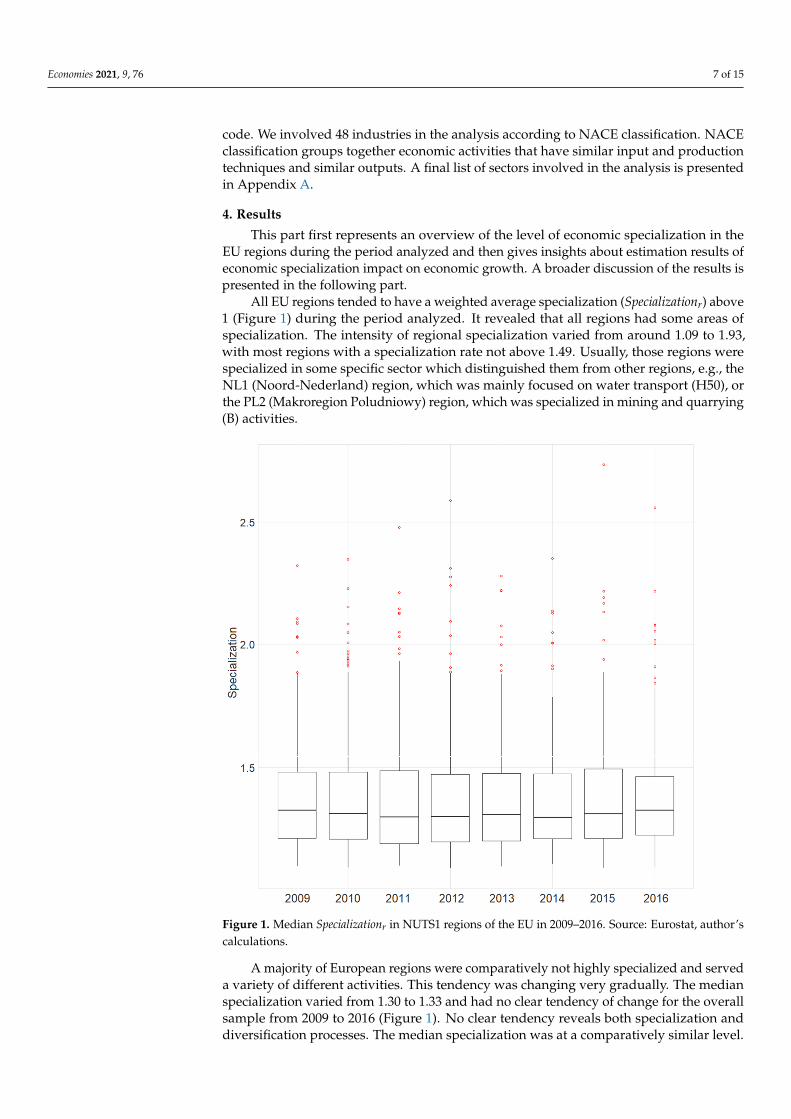
All EU regions tended to have a weighted average specialization (Specializationr) above1 (Figure 1) during the period analyzed. It revealed that all regions had some areas ofspecialization. The intensity of regional specialization varied from around 1.09 to 1.93,with most regions with a specialization rate not above 1.49. Usually, those regions werespecialized in some specific sector which distinguished them from other regions, e.g., theNL1 (Noord-Nederland) region, which was mainly focused on water transport (H50), orthe PL2 (Makroregion Poludniowy) region, which was specialized in mining and quarrying(B) activities.
Economies 2021, 9, x FOR PEER REVIEW 7 of 15
impact of specialization in the full range of all sectors, we focused on tradable sectors. We eliminated such sectors as veterinary activities, rental and leasing activities, employment activities, retail trade, water supply, etc. Moreover, we did not involve sectors such as C32—other manufacturing or M74—other professional, scientific, and technical activities because of the aggregated data of different types of economic activities under the same code. We involved 48 industries in the analysis according to NACE classification. NACE classification groups together economic activities that have similar input and production techniques and similar outputs. A final list of sectors involved in the analysis is presented in Appendix A.
4. Results This part first represents an overview of the level of economic specialization in the
EU regions during the period analyzed and then gives insights about estimation results of economic specialization impact on economic growth. A broader discussion of the re-sults is presented in the following part.
All EU regions tended to have a weighted average specialization (Specializationr) above 1 (Figure 1) during the period analyzed. It revealed that all regions had some areas of specialization. The intensity of regional specialization varied from around 1.09 to 1.93, with most regions with a specialization rate not above 1.49. Usually, those regions were specialized in some specific sector which distinguished them from other regions, e.g., the NL1 (Noord-Nederland) region, which was mainly focused on water transport (H50), or the PL2 (Makroregion Poludniowy) region, which was specialized in mining and quarry-ing (B) activities.
Figure 1. Median Specializationr in NUTS1 regions of the EU in 2009–2016. Source: Eurostat, au-thor’s calculations.
Figure 1. Median Specializationr in NUTS1 regions of the EU in 2009–2016. Source: Eurostat, author’scalculations.
A majority of European regions were comparatively not highly specialized and serveda variety of different activities. This tendency was changing very gradually. The medianspecialization varied from 1.30 to 1.33 and had no clear tendency of change for the overallsample from 2009 to 2016 (Figure 1). No clear tendency reveals both specialization anddiversification processes. The median specialization was at a comparatively similar level.
Economies 2021, 9, 76 8 of 15
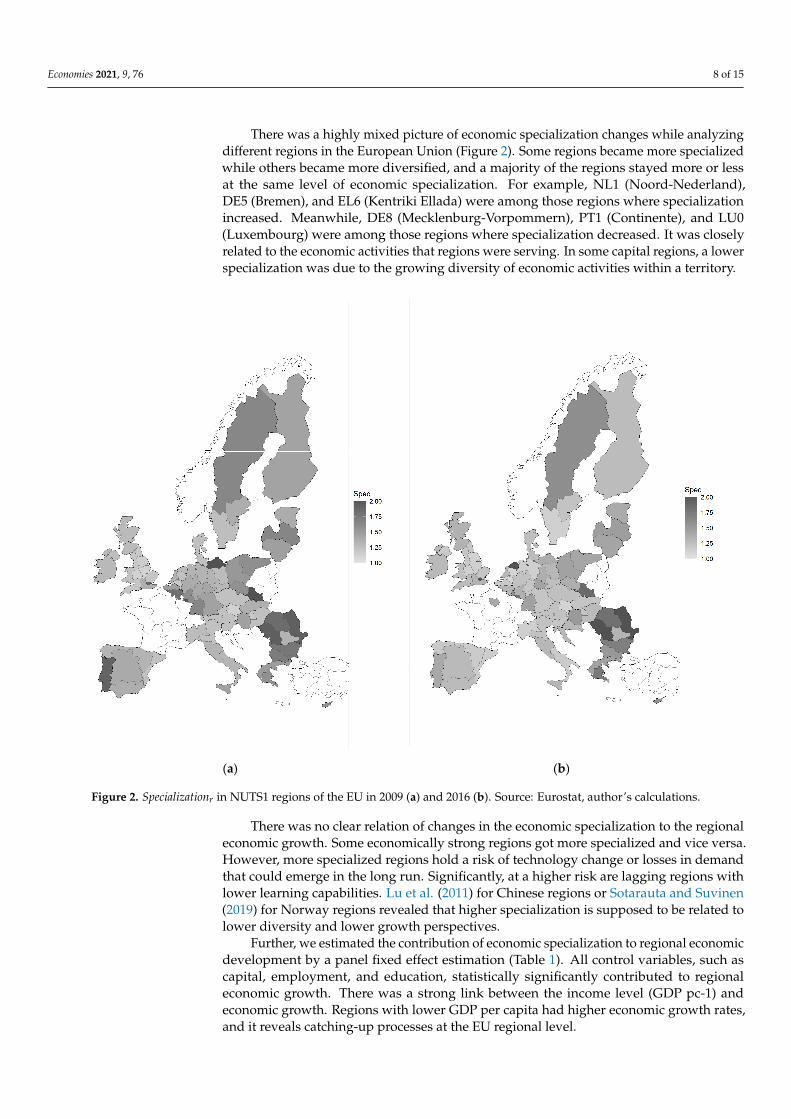
There was a highly mixed picture of economic specialization changes while analyzingdifferent regions in the European Union (Figure 2). Some regions became more specializedwhile others became more diversified, and a majority of the regions stayed more or lessat the same level of economic specialization. For example, NL1 (Noord-Nederland),DE5 (Bremen), and EL6 (Kentriki Ellada) were among those regions where specializationincreased. Meanwhile, DE8 (Mecklenburg-Vorpommern), PT1 (Continente), and LU0(Luxembourg) were among those regions where specialization decreased. It was closelyrelated to the economic activities that regions were serving. In some capital regions, a lowerspecialization was due to the growing diversity of economic activities within a territory.
Economies 2021, 9, x FOR PEER REVIEW 8 of 15
A majority of European regions were comparatively not highly specialized and served a variety of different activities. This tendency was changing very gradually. The median specialization varied from 1.30 to 1.33 and had no clear tendency of change for the overall sample from 2009 to 2016 (Figure 1). No clear tendency reveals both speciali-zation and diversification processes. The median specialization was at a comparatively similar level.
There was a highly mixed picture of economic specialization changes while analyz-ing different regions in the European Union (Figure 2). Some regions became more spe-cialized while others became more diversified, and a majority of the regions stayed more or less at the same level of economic specialization. For example, NL1 (Noord-Nederland), DE5 (Bremen), and EL6 (Kentriki Ellada) were among those regions where specialization increased. Meanwhile, DE8 (Mecklenburg-Vorpommern), PT1 (Continente), and LU0 (Luxembourg) were among those regions where specialization decreased. It was closely related to the economic activities that regions were serving. In some capital regions, a lower specialization was due to the growing diversity of economic activities within a ter-ritory.
(a) (b)
Figure 2. Specializationr in NUTS1 regions of the EU in 2009 (a) and 2016 (b). Source: Eurostat, author’s calculations.
There was no clear relation of changes in the economic specialization to the regional economic growth. Some economically strong regions got more specialized and vice versa. However, more specialized regions hold a risk of technology change or losses in demand that could emerge in the long run. Significantly, at a higher risk are lagging regions with lower learning capabilities. Lu et al. (2011) for Chinese regions or Sotarauta and Suvinen
Figure 2. Specializationr in NUTS1 regions of the EU in 2009 (a) and 2016 (b). Source: Eurostat, author’s calculations.
There was no clear relation of changes in the economic specialization to the regionaleconomic growth. Some economically strong regions got more specialized and vice versa.However, more specialized regions hold a risk of technology change or losses in demandthat could emerge in the long run. Significantly, at a higher risk are lagging regions withlower learning capabilities. Lu et al. (2011) for Chinese regions or Sotarauta and Suvinen(2019) for Norway regions revealed that higher specialization is supposed to be related tolower diversity and lower growth perspectives.
Further, we estimated the contribution of economic specialization to regional economicdevelopment by a panel fixed effect estimation (Table 1). All control variables, such ascapital, employment, and education, statistically significantly contributed to regionaleconomic growth. There was a strong link between the income level (GDP pc-1) andeconomic growth. Regions with lower GDP per capita had higher economic growth rates,and it reveals catching-up processes at the EU regional level.

Economies 2021, 9, 76 9 of 15
Table 1. Estimation results.
Dependent Variable: GDP Growth
Estimation 1 Estimation 2
Specialization 0.037 0.047(0.031) (1.199)
GDP pc-1 −0.416 *** −0.337 ***(0.078) (0.07)
Employment 0.768 *** 0.500 ***(0.127) (0.103)
Gross fixed capital formation 0.163 *** 0.134 ***(0.024) (0.021)
Education 0.006 *** −0.0005(0.001) (0.001)
Individual effects Yes YesTime effects No YesObservations 586 586R2 0.318 0.185Adjusted R2 0.201 0.031F statistic 46.603 *** 22.284 ***
(df = 5; 499) (df = 5; 492)
Note: *** p < 0.01; models are estimated with heteroskedasticity- and autocorrelation-consistent (HAC) stan-dard errors.
The estimation results revealed an ambiguous impact of economic specializationon economic growth in the EU regions that complements the visual analysis presentedin Figure 2. Higher specialization rates were associated with higher gross value added,indicated by positive coefficient signs. However, this effect was statistically insignificant inboth estimations, so we cannot affirm economic specialization or diversification impact foreconomic growth in the EU.
We may argue that either economic specialization or diversification of the economicstructure does not necessarily reveal its prospect to economic growth, and it is very casespecific in the EU. Regions in the EU differ in many senses—catching-up economiesor advanced economies, rural or urban areas, innovation leaders or modest innovators.Therefore, this research revealed that the impact of the economic specialization in the EU isnot as straightforward as it was for the cases of one country’s inner regions. For example,in China tendency was definite. Specialization increased in economically shrinking regions,and diversification processes took place in mostly urbanized and economically advancedareas (Lu et al. 2011). These findings reveal the complexity of formation of regionalinnovation policy in the EU.
5. Discussion
From the scientific literature, the economic specialization or diversification processesare supposed to drive regional economic development, but it is not straightforward in theEU regions, and our finding supports that. Related research findings with an ambiguousrelationship between economic specialization and regional economic development could befound in other research, i.e., Kemeny and Storper (2014), Russu (2015), and Kaulich (2012).
Different cases supplement our research finding by explaining a multiplicity of theimpact of economic specialization on economic growth. If specialization emerges in morecomplex and knowledge-intensive areas, it most likely gives a promising path for furtherregional development (Hausmann et al. 2007; Iacobucci and Enrico 2016; Capello and Kroll2016; Balland and Boschma 2021). If specialization happens in less urbanized territorieswith traditional manufacturing sectors, it commonly reveals a shrinking economy withdiminishing concentration of economic resources and a lowering of the variety of economicactivities (i.e., Lu et al. 2011; Russu 2015; Sotarauta and Suvinen 2019). Likewise, it is ques-tionable whether a higher diversification in the region is due to new emerging industries
Economies 2021, 9, 76 10 of 15
or because of current specialization areas in decline. This idea of the different nature of eco-nomic specialization and diversification comprises a space for further research—capturingthese dynamics in the economic structure and forming guidance for policy formation. Theanswer is not straightforward.
The relative specialization index of location quotient reveals a degree of economicspecialization but does not reveal the nature of specialization or diversification. Increasingor decreasing specialization could be of positive or negative influence on regional economicdevelopment, and it is very case specific, especially for broadly diversified regions in theEU.
The case of Finland illustrates the complexity of economic specialization or diversifi-cation processes. From first sight, specialization in the ICT could be an essential path forregional development in the context of the fourth industrial revolution and the rise of theICT sector (Dzemydiene et al. 2020). However, many jobs were lost in the ICT industryin Finland because of sharp technological change and global competition (Sotarauta andSuvinen 2019). Such cases reveal the fast-changing global environment and a need forregions to have a capacity to reinvent themselves and to adapt to the market changes(Balland et al. 2019). Specialization in some high-tech sectors does not necessarily guar-antee a key for regional economic development in the end. We consider it essential forregional economic growth in the long run whether the region can learn and develop acontinuous stream of competitive products for the global markets.
While coming to the question to what extent higher specialization rates, measured bylocation quotient, reveal prospective areas for economic growth and to what extent suchanalysis could be valuable in the policy formation of smart specialization strategies, theanswer is considerably straightforward. Our research results supplement the findings ofKemeny and Storper (2014) in a sense of critically assessing a measure of relative specializa-tion and its impact on economic development. These researchers found that the larger scaleof the industry made a significant contribution to wages and productivity. However, therelative footprint of an industrial specialization in broader regional employment, measuredby location quotient, was not significantly associated with wages. We may agree that eco-nomic specialization measures, particularly the location quotient, cannot capture dynamicsin the industry structure that could be essential for economic development. This techniquereveals changes in the economic structure but does not necessarily reveal prospectivegrowth areas.
The paper has some limitations, however. Qualitative methods seem to be needed tofully understand the features of structural change in the regional economies (Grillitsch andAsheim 2018). Economic specialization measure by location quotient and other quantitativetechniques (Foray et al. 2011; Balland et al. 2019) has considerable limitations. One of thelimitations is that quantitative techniques cannot capture processes of social innovationthat are of growing importance (Marques et al. 2018). The patent data that is also widelyapplied for a search of potential areas (Kogler et al. 2017; D’Adda et al. 2019; Ballandet al. 2019; Balland and Boschma 2021) cannot thoroughly capture innovative processesin service sectors or areas where new knowledge is generally not patented (Witell et al.2016; Izsak et al. 2020). How to capture these dynamics in the economic structure remainsa question for further research.
One more limitation of this research is the availability of industrial data at the NUTS2territorial level. We had unbalanced datasets with aggregated industrial data that were notsuitable for more in-depth economic specialization analysis for such regions. The NUTS1level was selected to solve this shortcoming. However, we may argue that some specificdynamics could be captured at a lower territorial breakdown, e.g., higher specializationrates could emerge because of the size of the economy. A lower territorial breakdown couldbe a case for further research.

Economies 2021, 9, 76 11 of 15
6. Conclusions
The main issue behind the policymaking for formation of smart specialization strate-gies is how to shift regional economic development towards smart growth and how tofacilitate success of new prospective economic activities. Various EU regions applied theLQ index for specialization analysis as the first step in the formation of smart specializationstrategy. Economic specialization concerns not only location quotients, but also regionalconcentration of competencies and knowledge. It is supposed to reveal regional industrialstructures where higher value added and exports are generated.
This paper aimed to investigate the impact of economic specialization on regionaleconomic development and to give insights into identification of prospective areas in re-gional economies. The main findings suggest that economic specialization is inconsistentlyassociated with higher gross value added with positive but statistically insignificant effects.Both economic specialization or diversification processes took place in EU regions and hada different impact on economic growth. The relative specialization index of the locationquotient identifies a degree of economic specialization. However, it does not reveal thebroader context of specialization or diversification process that could reflect the potentialof economic activities in a broader perspective. These findings confirm the complexity ofregional innovation policy formation in the EU. There is a need for a mixture of differentapproaches, also a qualitative approach, for identification of prospective growth areas.
Based on our findings, neither economic specialization nor economic diversity areclear-cut solutions for ensuring economic growth. Economic structure in EU regionsdiffers and there is no one answer to which approach is better for economic development.Economic specialization measures, particularly the location quotient, cannot capture thedynamics in industry structure that could be essential for identification of prospectivegrowth areas. Formation of smart specialization strategy remains case specific. A place-based approach for policy formation is a solution because the ‘one policy suits all’ approachis not suitable for regional development in the EU.
Funding: This research received no external funding.
Institutional Review Board Statement: Not applicable.
Informed Consent Statement: Not applicable.
Data Availability Statement: Publicly available datasets were analyzed in this study. This data canbe found here: [https://ec.europa.eu/eurostat/data/database, code: sbs_r_nuts06_r2], (accessed on20 February 2021).
Conflicts of Interest: The author declares no conflict of interest.
Appendix A
Table A1. Herfindahl index for geographic concentration of sectors (NACE) in EU NUTS 1 regions.
Code Description Herfindahl Index
Sectors involved in the analysis (tradable sectors)
B Mining and quarrying 0.0541C10 Manufacture of food products 0.0150C11 Manufacture of beverages 0.0205C12 Manufacture of tobacco products 0.1359C13 Manufacture of textiles 0.0327C14 Manufacture of wearing apparel 0.0391C15 Manufacture of leather and related products 0.0657
C16 Manufacture of wood and of products of wood and cork, except furniture; manufacture ofarticles of straw and plaiting materials 0.0201
C17 Manufacture of paper and paper products 0.0197C18 Printing and reproduction of recorded media 0.0184

Economies 2021, 9, 76 12 of 15
Table A1. Cont.
Code Description Herfindahl Index
Sectors involved in the analysis (tradable sectors)
C19 Manufacture of coke and refined petroleum products 0.0534C20 Manufacture of chemicals and chemical products 0.0315C21 Manufacture of basic pharmaceutical products and pharmaceutical preparations 0.0275C22 Manufacture of rubber and plastic products 0.0226C23 Manufacture of other non-metallic mineral products 0.0201C24 Manufacture of basic metals 0.0344C25 Manufacture of fabricated metal products, except machinery and equipment 0.0227C26 Manufacture of computer, electronic, and optical products 0.0304C27 Manufacture of electrical equipment 0.0352C28 Manufacture of machinery and equipment N.E.C. 0.0435C29 Manufacture of motor vehicles, trailers, and semi-trailers 0.0398C30 Manufacture of other transport equipment 0.0345C31 Manufacture of furniture 0.0242D D Electricity, gas, steam, and air conditioning supply 0.0329F41 Construction of buildings 0.0178F42 Civil engineering 0.0166F43 Specialized construction activities 0.0165G45 Wholesale and retail trade and repair of motor vehicles and motorcycles 0.0161G46 Wholesale trade, except of motor vehicles and motorcycles 0.0177H49 Land transport and transport via pipelines 0.0174H50 Water transport 0.0580H51 Air transport 0.0680H52 Warehousing and support activities for transportation 0.0210H53 Postal and courier activities 0.0334I55 Accommodation 0.0187I56 Food and beverage service activities 0.0185J58 Publishing activities 0.0315
J59 Motion picture, video and television program production, sound recording, and musicpublishing activities 0.0418
J60 Programming and broadcasting activities 0.0450J61 Telecommunications 0.0258J62 Computer programming, consultancy, and related activities 0.0254J63 Information service activities 0.0259L L Real estate activities 0.0178M69 Legal and accounting activities 0.0201M70 Activities of head office; management consultancy activities 0.0283M71 Architectural and engineering activities; technical testing and analysis 0.0185M72 Scientific research and development 0.0259M73 Advertising and market research 0.0272
Sectors excluded from the analysis (non-tradable sectors and other sectors)
M75 Veterinary activities 0.0173N77 Rental and leasing activities 0.0188N78 Employment activities 0.0252N79 Travel agency, tour operator, reservation service, and related activities 0.0211N80 Security and investigation activities 0.0210N81 Services to building and landscape activities 0.0233N82 Office administrative, office support, and other business support activities 0.0258G47 Retail trade, except motor vehicles and motorcycles 0.0166E Water supply; sewerage, waste management and remediation activities 0.0184C32 Other manufacturing 0.0232C33 Repair and installation of machinery and equipment 0.0171M74 Other professional, scientific, and technical activities 0.0230
Economies 2021, 9, 76 13 of 15
ReferencesAkcigit, Ufuk. 2017. Economic growth: The past, the present, and the future. Journal of Political Economy 125: 1736–47. [CrossRef]Arrow, Kenneth. 1962. Economic welfare and the allocation of resources for invention. In The Rate and Direction of Inventive Activity:
Economic and Social Factors. Princeton: Princeton University Press, pp. 609–26. Available online: http://www.nber.org/chapters/c2144.pdf (accessed on 20 February 2021).
Balland, Pierre-Alexandre, and Ron Boschma. 2021. Mapping the potentials of regions in Europe to contribute to new knowledgeproduction in Industry 4.0 technologies. Regional Studies 1–15. [CrossRef]
Balland, Pierre-Alexandre, Ron Boschma, Joan Crespo, and David Rigby. 2019. Smart specialization policy in the European Union:Relatedness, knowledge, complexity, and regional diversification. Regional Studies 53: 1252–68. [CrossRef]
Barca, Fabrizio, Philip McCann, and Andrés Rodríguez-Pose. 2012. The case for regional development intervention: Place-based versusplace-neutral approaches. Journal of Regional Science 52: 134–52. [CrossRef]
Barroeta, Belen, Javier Gómez Prieto, Jonatan Paton, Manuel Palazuelos, and Marcelino Cabrera Giraldez. 2017. Innovation andregional specialisation in Latin America. EUR 28511 EN. [CrossRef]
Benner, Maximilian. 2020. Six additional questions about smart specialization: Implications for regional innovation policy 4.0. EuropeanPlanning Studies 28: 1667–84. [CrossRef]
Boschma, Ron, and Ron Martin. 2010. The Handbook of Evolutionary Economic Geography. Cheltenham: Edward Elgar.Capello, Roberta, and Henning Kroll. 2016. From theory to practice in smart specialization strategy: Emerging limits and possible
future trajectories. European Planning Studies 24: 1393–406. [CrossRef]Capello, Roberta. 2016. Regional Economics, 2nd ed. New York: Routledge.Content, Jeroen, Koen Frenken, and Jacob Jordaan. 2019. Does related variety foster regional entrepreneurship? Evidence from
European regions. Regional Studies 53: 1531–43. [CrossRef]D’Adda, Diego, Enrico Guzzini, Donato Iacobucci, and Roberto Palloni. 2019. Is smart specialisation strategy coherent with regional
innovative capabilities? Regional Studies 53: 1004–16. [CrossRef]De Groot, Henri, Jacques Poot, and Martijn Smit. 2009. Agglomeration Externalities, Innovation and Regional Growth: Theoretical
Perspectives and Meta-analysis. In Handbook of Regional Growth and Development Theories. Cheltenham: Edward Elgar PublishingLtd., pp. 256–81.
Dietz, Richard, and Ramon Garcia. 2002. Economic Diversity and New York State. The Regional Economy of Upstate New York. New York:Federal Reserve Bank of New York.
Dosso, Mafini, Alexander Kleibrink, and Monika Matusiak. 2020. Smart specialisation strategies in sub-Saharan Africa: Opportunities,challenges and initial mapping for Côte d’Ivoire. African Journal of Science, Technology, Innovation and Development. [CrossRef]
Duranton, Gilles, and Anthony James Venables. 2018. Place-based policies for development. In Policy Research Working Paper, WPS 8410.Washington, DC: World Bank Group.
Duranton, Gilles, and Diego Puga. 2004. Micro-foundations of urban agglomeration economies. In Handbook of Regional and UrbanEconomics. Edited by John Vernon Henderson and Jacques-François Thisse. Amsterdam: Elsevier, pp. 2063–117.
Dzemydiene, Dale, Giedre Dzemydaite, and Dinesh Gopisetti. 2020. Application of multicriteria decision aid for evaluation of ICTusage in business. Central European Journal of Operations Research 1–21. [CrossRef]
European Commission. 2015. Territorial Agenda 2020 Is Put in Practice. Enhancing the Efficiency and Effectiveness of Cohesion Policy by aPlace-Based Approach. Milan: CSIL, Centre for Industrial Studies.
European Commission. 2017a. Challenges Ahead: Boosting Innovation-Led Growth in EU Regions. Memo-17-1995. Brussels: EuropeanCommission, July 18.
European Commission. 2017b. Communications from the Commission to the European Parliament, the Council, the European Economic andSocial Committee and the Committee of the Regions. Strengthening Innovation in Europe’s Regions: Strategies for Resilient, Inclusive andSustainable Growth. COM(2017) 376 final. Brussels: European Commission, July 18.
Eurostat. 2015. Regions in the European Union. Nomenclature of Territorial Units for Statistics NUTS2013/EU-28.. Luxembourg: PublicationsOffice of the European Union.
Foray, Dominique, Paul David, and Bronwyn Hall. 2009. Smart Specialisation—The Concept. Knowledge Economists Policy Brief No.9. Available online: https://ec.europa.eu/invest-in-research/pdf/download_en/kfg_policy_brief_no9.pdf (accessed on 20February 2021).
Foray, Dominique, Paul David, and Bronwyn Hall. 2011. Smart specialisation. From academic ideas to political instruments. Thesurprising career of a concept and the difficulties involved in its implementation. In MTEI-Working Paper. Lausanne: EcolePolytechnique Fédérale de Lausanne.
Foray, Dominique. 2015. Smart Specialisation. Opportunities and Challenges for Regional Innovation Policy. London: Routledge.Foray, Dominique. 2019. In response to ‘Six critical questions about smart spezialisation’. European Planning Studies 27: 2066–78.
[CrossRef]Francois, Joseph, and Bernard Hoekman. 2010. Services Trade and Policy. Journal of Economic Literature 48: 642–92. [CrossRef]Friesenbichler, Klaus Sylvester, and Christian Glocker. 2019. Tradability and productivity growth differentials across EU Member
States. Structural Change and Economic Dynamics 50: 1–13. [CrossRef]Gervais, Antoine, and Bradford Jensen. 2019. The tradability of services: Geographic concentration and trade costs. Journal of
International Economics 118: 331–50. [CrossRef]
Economies 2021, 9, 76 14 of 15
Gianelle, Carlo, Fabrizio Guzzo, and Krzysztof Mieszkowski. 2019. Smart specialisation: What gets lost in translation from concept topractice? Regional Studies 54: 1377–88. [CrossRef]
Glaeser, Edward Ludwig, Hedi Kallal, José Scheinkman, and Andrei Shleifer. 1992. Growth in cities. Journal of Political Economy 100:1126–52. [CrossRef]
Grillitsch, Marcus, and Bjorn Asheim. 2018. Place-based innovation policy for industrial diversification in regions. European PlanningStudies 26: 1638–62. [CrossRef]
Hassink, Robert, and Huiwen Gong. 2019. Six critical questions about smart specialization. European Planning Studies 27: 2049–65.[CrossRef]
Hausmann, Ricardo, Jason Hwang, and Dani Rodrik. 2007. What You Export Matters. Journal of Economic Growth 12: 1–25. [CrossRef]Henderson, John Vernon. 2003. Marshall’s scale economies. Journal of Urban Economics 53: 1–28. [CrossRef]Iacobucci, Donato, and Guzzini Enrico. 2016. Relatedness and connectivity in technological domains: Missing links in S3 design and
implementation. European Planning Studies 24: 1511–26. [CrossRef]Izsak, Kincsö, Paresa Markianidou, Els van de Velde, Rainer Frietsch, Henning Kroll, Sven Wydra, Mike Glennon, and Juan Mateos
Garcia. 2020. Advanced Technologies for Industry—Methodological Report. Brussel: European Commission, European Union.Jacobs, Jane. 1969. The Economy of Cities. New York: Vintage.Jensen, J. Bradford, and Lori G. Kletzer. 2005. Tradable Services: Understanding the Scope and Impact of Services Outsourcing. Institute for
International Economics Working Paper No. 05-9. Washington, DC: Institute for International Economics. [CrossRef]Karo, Erkki, Rainer Kattel, and Aleksandr Cepilovs. 2017. Can smart specialization and entrepreneurial discovery be organized by the
government? Lessons from Central and Eastern Europe. In Advances in the Theory and Practice of Smart Specialization. Edited bySlavo Radosevic, Adrian Curaj, Radu Gheorgiu, Liviu Andreescu and Imogen Wage. Amsterdam: Elsevier, pp. 270–93.
Kaulich, Florian. 2012. Diversification vs. Specialization as Alternative Strategies for Economic Development: Can We Settle a Debate by Lookingat the Empirical Evidence? Vienna: United Nations Industrial Development Organization (UNIDO).
Kemeny, Thomas, and Michael Storper. 2014. Is Specialization Good for Regional Economic Development? Regional Studies 49: 1003–18.[CrossRef]
Kleibrink, Alexander, Philippe Larédo, and Stefan Philipp. 2017. Promoting Innovation in Transition Countries: A Trajectory for SmartSpecialization. EUR 28638 EN. Brussel: European Union. [CrossRef]
Kogler, Dieter Franz, Jürgen Essletzbichler, and David Rigby. 2017. The evolution of specialization in the EU15 knowledge space.Journal of Economic Geography 17: 345–73. [CrossRef]
Liu, Hao. 2019. The communication and European Regional economic growth: The interactive fixed effects approach. EconomicModelling 83: 299–311. [CrossRef]
Lu, Zheng, Tony Flegg, and Deng Xiang. 2011. Regional specialization: A measure method and trends in China. MPRA Paper 33867.pp. 1–14. Available online: https://mpra.ub.uni-muenchen.de/33867/1/MPRA_paper_33867.pdf (accessed on 20 February2021).
Mameli, Francesca, Simona Iammarino, and Ron Boschma. 2012. Regional variety and employment growth in Italian labour marketareas: Services versus manufacturing industries. Papers in Evolutionary Economic Geography 12: 1–23.
Marques, Pedro, Kevin Morgan, and Renald Richardson. 2018. Social innovation in question: The theoretical and practical implicationsof a contested concept. Environment and Planning C: Politics and Space 36: 496–512. [CrossRef]
Marshall, Alfred. 1920. Principles of Economics: An Introductory Volume. London: Macmillan.McCann, Phillip, and Raquel Ortega-Argilés. 2013. Transforming European regional policy: A results-driven agenda and smart
specialization. Oxford Review of Economic Policy 29: 405–31. [CrossRef]McCann, Phillip, and Raquel Ortega-Argilés. 2015. Smart specialization, regional growth and applications to European Union cohesion
policy. Regional Studies 49: 1291–302. [CrossRef]Misiak, Tomasz, and Paweł Dykas. 2021. Related and unrelated variety vs. basic labour market variables—Regional analysis for
Poland. European Planning Studies 29: 221–40. [CrossRef]Monfort, Philippe. 2008. Convergence of EU Region Measures and Evolution. A Series of Short Papers on Regional Research and Indicators
Produced by the Directorate-General for Regional Policy, No 01/2008. Brussels: European Commission, Regional Policy.Moretti, Enrico, and Per Thulin. 2012. Local multipliers and human capital in the United States and Sweden. Industrial and Corporate
Change 22: 339–62. [CrossRef]Paliokaite, Agne, Žilvinas Martinaitis, and Ramojus Reimeris. 2015. Foresight methods for smart specialisation strategy development
in Lithuania. Technological Forecasting and Social Change 101: 185–99. [CrossRef]Postoiu, Constantin, and Anca Dachin. 2014. The Employment Profile and Its Relevance for the Regional Smart Specialization Strategy
in Romania. Paper presented at 9th International Conference on Business Excellence, Bucharest, Romania, October 10; Availableonline: http://www.managementmarketing.ro/~store/suplimente/Volum_ICBE_2015_BT.pdf (accessed on 20 February 2021).
Romer, Paul. 1990. Endogenous technological change. Journal of Political Economy 98: 71–102. [CrossRef]Russu, Corneliu. 2015. Industrial Specialization of the European Union Member Countries. Economic Insights—Trends and Challenges 67:
63–65.Šidlauskaite-Riazanova, Brigita, and Algirdas Miškinis. 2019. Aspects of the Development of Lithuanian Economic Specialisation in
the Context of Globalization. Social Research 42: 59–73. [CrossRef]
Economies 2021, 9, 76 15 of 15
Šidlauskaite-Riazanova, Brigita. 2020. Assessment of the demand side pandemic impact on the EU economy in the context ofglobalization. Applied Economics: Systematic Research 14: 59–76. [CrossRef]
Skare, Marinko, Domingo Riberio Soriano, and Małgorzata Porada-Rochon. 2021. Impact of COVID-19 on the travel and tourismindustry. Technological Forecasting and Social Change 163. [CrossRef]
Solow, Robert Merton. 1952. On the Structure of Linear Models. Econometrica 20: 29–46. [CrossRef]Sotarauta, Markku, and Nina Suvinen. 2019. Place leadership and the challenge of transformation: Policy platforms and innovation
ecosystems in promotion of green growth. European Planning Studies 27: 1748–67. [CrossRef]Trippl, Michaela, Elena Žukauskaite, and Adrian Healy. 2020. Shaping smart specialisation: The role of place-specific factors in
advanced, intermediate and less-developed European regions. Regional Studies 54: 1328–40. [CrossRef]Van Oort, Frank, Stefan de Geus, and Teodora Dogaru. 2015. Related variety and regional economic growth in a cross-section of
European urban regions. European Planning Studies 23: 1110–27. [CrossRef]Witell, Lars, Hannah Snyder, Anders Gustafsson, Paul Fombelle, and Per Kristensson. 2016. Defining service innovation: A review and
synthesis. Journal of Business Research 69: 2863–72. [CrossRef]Zhang, Hanyuan, Haiyan Song, Long Wen, and Chang Liu. 2021. Forecasting tourism recovery amid COVID-19. Annals of Tourism
Research 87: 103–49. [CrossRef]