the impact of european settlement within french west africa: did pre-colonial...
TRANSCRIPT
The Impact of European Settlement within French West Africa: Did pre-colonial prosperous areas fall behind?1
Elise Huillery2
Abstract Did colonization change the distribution of prosperity within French-speaking West Africa? Using a new database on both pre-colonial and colonial contexts, this paper gives evidence that Europeans tended to settle in more prosperous pre-colonial areas and that the European settlement had a strong positive impact on current outcomes, even in an extractive colonial context, resulting in a positive relationship between pre and post-colonial performances. I argue that the African hostility towards colonial power to colonisation provides a random variation in European settlement since it damaged the profitability of colonial activities and dissuaded European from settling, but does not have a direct effect on current outcomes. Rich and hostile areas received less European settlers than they would have received had they not been so hostile, resulting in lower current performances partly due to lower colonial investments. Despite the absence of a “reversal of fortune” within former French West Africa, some of the most prosperous pre-colonial areas lost their advantage because of their hostility: other areas caught up and became the new leaders in the region.
Keywords: colonization, economic history, West Africa JEL classification: N37, O11, P16
Introduction
At the worldwide level, the former colonies that were relatively rich in the year 1500 are now
relatively poor. This evidence has been documented by Acemoglu, Johnson and Robinson
(2002) who point out what they call a “reversal of fortune”. They explain this reversal by two
1 I am grateful to Denis Cogneau and Thomas Piketty for their valuable guidance. Alexander Moradi, José de Sousa and seminar participants at DIAL, Paris School of Economics, Nuffield College and the CSAE conference provided very helpful comments. Historical data used in this paper has been collected by Elise Huillery (the author) within the research project "Long Term History and Resources Distribution in Africa" directed by Denis Cogneau (IRD, DIAL, Paris). Financial support from the French Ministery of Research is gratefully acknowledged. Martine Lorenzo, Angélique Roblin, Xavier Midon and Angelina De Baecque have provided excellent research assistance for archive extraction 2 Sciences-Po, Département d’Economie, 28, rue des Saints-Pères, 75007 Paris. Email: [email protected].

separate features: First, Europeans were more likely to settle in regions that were previously
poor because poor regions were sparsely populated, enabling Europeans to settle in large
numbers. Second, the impact of these European settlements on former colonies’ development
path has been positive through the introduction of institutions encouraging investments
(Acemoglu, Johnson and Robinson (2001)). In regions that were not suitable for heavy
settlement, Europeans set up “extractive states” with little protection of private property and
little checks and balances against government expropriation. At the other extreme, in regions
where many Europeans settled, the settlers replicated European institutions with a strong
emphasis on private property and checks against government power. The positive impact of
colonialism on current growth performance has also been recently documented by Feyrer and
Sacerdote (2009). Using a new database of islands throughout the Atlantic, Pacific and Indian
Oceans, this paper finds a causal positive relationship between the number of years spent as a
European colony and current GDP per capita among islands that were colonized during the
Age of Discovery. They argue that this positive relationship is due in part to the quality of
government and rise in human capital. Both of these papers therefore underline the positive
role of European settlement: the more settlers during colonial times, the better economic
performance today. Yet there is still a debate on where this result comes from. Acemoglu,
Johnson and Robinson (2001, 2002) focus on the positive impact of heavy settlement on
formal institutions whereas Feyrer and Sacerdote (2009) also recognize the potential
additional role of settlers on human capital through the introduction of formal schooling and
the direct importation of human capital in the form of the settlers themselves. Glaeser and al.
(2004) revisit the debate over whether political institutions cause economic growth and
document that human capital is a more basic source of growth than are the institutions.
The motivation of this paper is to examine whether European settlement exhibited a positive
impact and created a change in the distribution of wealth among ‘extractive colonies’ - where
colonizers pursued a strategy of resources extraction. I focus on former French West Africa, a
federation of “extractive” colonies dominated by France from 1895 to 1960. Following
Acemoglu, Johnson and Robinson (2001, 2002), Europeans should have settled in more
prosperous pre-colonial areas, consistently with the extractive policy and the search for large
natural resources and labor supply. Beside, under the institutional hypothesis, European
settlement should have had a negative impact on long term development, since colonizers set
up poorly functioning institutions in these colonies: relatively prosperous areas made
extractive institutions more profitable for the colonizers. For example, forcing the native
population to work in mines or plantations limited the benefit of the rent to a small portion of
the society. This led to a specific organization of society where there were poor incentives for
investment, insecure property rights, poor administration of justice, etc. Under the
institutional hypothesis, the global impact of European settlement on current prosperity
2

should therefore result in a reversal of fortune among extractive colonies. But if the effect of
European settlement runs through mechanisms such as human capital, one may expect the
regions where more Europeans settled within extractive colonies to outperform those where
few Europeans settled, resulting in a reinforcement of initial inequalities. This paper takes
advantage of empirical evidence on former French West Africa to test these converse, though
non exclusive, hypotheses.
The paper uses a first-hand district level dataset that matches direct and precise historical data
with current data. Colonial and pre-colonial data were collected from historical archives in
Paris and Dakar, whereas recent data come from national household surveys from the current
former colonies gathered in 1995 (approximately). My main empirical issue though is
selection: Why did Europeans settle intensely in certain areas? As Europeans were more
likely to settle in economically more developed districts, the naïve estimates of the effect of
European settlement on economic development might be upwardly biased. I pursue two
strategies to better document the causal relationship between European settlement and current
outcomes.
First, I focus on a limited geographical area. To date, the macroeconomic literature on
institutions and development has largely relied on cross-country regression evidence. Faced
with the statistical challenge of isolating causal pathways, the use of cross-country variables
tends to derive instruments from persistent features of a country environment and limits their
usefulness for studying institutional change (Pande and Udry, 2005). Following Banerjee &
Iyer (2005) and Iyer (2005), this paper uses variations between infra-national districts, which
is advantageous with regard to the identification of European settlement influence. Former
French West Africa is much more homogeneous with respect to its pre-colonial and colonial
context than all other former colonies, in particular with respect to geography, anthropology,
pre-colonial history, the coloniser identity and the period and length of colonial times. The
observed controls therefore capture a much larger part of the variation between districts than
they usually do between countries all over the world.
Second, I pursue an instrumentation strategy to better understand the causal relationship
between European settlement and current performance. The instrument is the hostility towards
colonial power expressed in the early colonial period after conquest (1906-1920) measured by
acts of protest like strikes, riots, or religious movements, refusal to apply colonial rules, to
pay taxes, to enrol in forced labour or military recruitment etc. These manifestations of
hostility were likely to mitigate most of the profitability of colonial activities and to dissuade
Europeans from settling. However, one issue is that hostility may reflect heterogeneity across
districts directly correlated with current outcomes. As evidence shows, hostility actually
3

tended to be higher in more prosperous and more socially and politically cohesive areas. But
the evidence on hostile areas strongly supports the fact that hostility was also largely
accidental. Conditional on the observable characteristics that capture most of the endogenous
part of hostility, I therefore argue that hostility is a good instrument for European settlement.
Furthermore, one may be reassured on the validity of my basic results by the fact that this
strategy is likely to produce downwardly biased estimates of the effect of European settlement
on current performance since there is clear evidence that the areas which tended to select into
hostility towards colonial power were the most able to advance economically to modern age.
My central findings are, first, that the general European preference was to settle in more
prosperous pre-colonial areas, though political factors disturbed this general pattern: the
preference towards prosperous areas was sometimes discouraged by the existing hostility
towards colonial power. Indeed, when hostility was severe in a prosperous area, Europeans
preferred to settle in a calmer neighboring area, even if it was less prosperous. Second,
European settlement had a positive influence on current performances even among extractive
colonies: Colonized areas that received more European settlers have performed better than
colonized areas that received less Europeans settlers. I strongly claim that these results do not
mean that colonization, per se, was a positive experience, since I do not compare colonized
versus non colonized areas3. Results only show that in the case of being colonized, the more
settlers the better, even among extractive colonies. Additionally, these findings do not refute
the “institutional hypothesis” per se but highlight the positive role of settlers on human and
physical capital: the negative impact of settlers on institutions was locally overwhelmed by
their positive impact on capital investment.
As a consequence, the distribution of prosperity within former French West Africa did not
reverse. Among politically friendly areas, European colonization indeed reinforced pre-
colonial inequalities by settling in more prosperous areas. However, among West African
areas that were relatively prosperous at the end of the nineteenth century, some are no longer
more developed than the rest of the region today because they expressed more hostility
towards colonial power in early colonial times and dissuaded Europeans from settling. As a
result, these areas lost their relative advantage in the long run while other areas, less hostile
towards colonial power, became the new leaders in the region.
With respect to the existing literature, this paper innovates in four ways. First, it highlights the
role of the African attitude towards colonialism in colonization features. Second, the paper
extends the positive role of European settlement within an “extractive strategy” area. Third, it
3 It is worth noting that the positive impact of European settlement on current performance holds within colonial areas only. It is highly plausible that no colonization whatsoever would have produced better current performance on the whole.
4

disentangles the two main channels of the positive effect of European settlement: institutions
and capital (human and physical). Fourth, the paper documents the evolution of prosperity
distribution within former French West Africa since 1900.
The paper is structured as follows. Section 1 provides a description of the pre-colonial
context. Sections 2 analyses the determinants of European settlement during colonial times.
Section 3 measures the impact of European settlement on current performance. Section 4
explores some explanations of the positive impact of European settlement on current
performance. Section 5 documents the change in prosperity distribution within former French
West Africa. Section 6 concludes.
5
I. The European Settlement in French West Africa
A. Historical Introduction
The decade of the 1880s was a major turning point in African history. It brought most of the
continent rapidly and brutally into the colonial period. But the colonial conquest was far more
slow-acting than often presented: The French military push began in 1854 from the Senegalese
coasts to upper Senegal, driven by the famous General Faidherbe. The first military expansion
went east from the Senegalese coast and arrived at the west side of current Mali (Kayes,
Satadougou) in the late 1850s. Until 1880, colonial military campaigns were limited to coastal
incursions in current Senegal, Mauritania, Guinea and South Benin. The process amplified in
the 1880s with a west-to-east progress from Senegal to the northern Gold Coast, joined by
south-to-north incursions from coastal posts in Ivory Coast. In the 1890s, a last military force
progressed west-to-east from the south-east side of current Mali as far as Lake Tchad, joined
by a column progressing south-to-north from current Benin.
Paper annexation, however, was only the framework for French colonial West Africa. The
reality drew far more heavily on the actual process of conquest. French West Africa was
officially created in 1895 and abolished in 1960. There were no drastic modifications for local
people before 1900-1910 except in few coastal localities. Local chiefs’ prerogatives in
particular were still intact in general; their military obedience was only embodied by friendship
treaties4. The physical occupation of the whole territory was thus not yet effective when
French West Africa, a federation of height colonies, was officially created in 1904. Colonial
administrative reports give evidence that the effective direct administration of the large and
populous territories began in the first decade of the twentieth century, as civil administrators
progressively replaced military forces. The colonial occupation was therefore effectively in
control of the major part of the territory from approximately 1910 to 1960.
B. The West African Context
West Africa is like a peninsula attached to the mass of sub-Saharan Africa at the Cameroon
mountains and stretching westward between the gulf of Guinea and the Sahara. It is
characterized by typical longitudinal layers of climate. Beginning with the Sahara, the
sequence is desert, savannah, forest. A physical explanation for differing natural vegetation is
the difference in annual rainfall.
4 Yet hostile chiefs suffered from French military repression: French military forces defeated and killed Lat Joor of Kajoor in 1886, pursued Mamadu Lamin to his death in 1887, exiled Samori Ture to Gabon in 1898 where he died two years later, among others (Ki-Zerbo, 1972).
6

At the beginning of the twentieth century, French West Africa was a vast territory of 4 800 000
km2, scarcely inhabited by a population of around 12 000 000 people5. Population density was
therefore very low (2.5 people per km2). West Africa was mostly rural and towns were scarce
and small. 1900s colonial censuses report that the five biggest towns were Saint-Louis (about
24 000 people), Dakar (18 400), Rufisque (12 500), Conakry (8 200) and Cotonou (4 400).
Most people in West Africa were farmers. As documented in Curtin (1978), fishing along the
coast and rivers was an intensive and specialized occupation. Dry-season hunting was a major
source of meat in the savannah and forest alike. People mined rock salt in the Sahara and
evaporated sea salt along the coast. Iron was found almost everywhere in West Africa, but
some regions with the best ore became iron centres and sold their iron to other regions that
were less well endowed. Other regions concentrated on cotton and cotton textiles or on sheep
breeding and woollen cloth.
As a result, regular patterns of internal north-south trade helped in the exchange of surplus
from one region to another. Trade, in turn, encouraged the growth of small towns, some near
the desert-edge, to profit from the trans-Saharan trade, like Timbuktu, Agadez, Gao and
Oualata. Others towns, located well away from the desert like Jenne, Bobo-Dioulasso,
Kankan and Borgou, profited from the transit along commercial routes between the savannah
and the forest. Curtin (1995, p.325) writes that in the nineteenth century “internal trade was
still far more important than trade with the world overseas, as it had been in the period of
slave trade”. Islam was the religion of commerce and was highly prevalent in ethnic groups
with strong commercial ties like the Juula. The West African political context changed before
the colonial period because of what Curtin calls a “religious revolution.” From 1780 to 1880,
preachers and moral leaders often called for jihad, resulting in a substitution of new rulers for
old and new large states for the former small states, and a substantial spread of Islam (Sellier
(2003)). Many West African states are therefore officially related to Islam.
How were politics organized? At one extreme, full-time rulers claimed authority over every
individual within a defined territory. These were clearly states, also called kingdoms or
empires. At the other, authority was so dispersed that no rulers could be identified. Stateless
societies could work in many different ways, but the key building block was usually the
lineage. That is why African anthropologists often call them “lineage-based societies”, or
“decentralized societies,” “segmentary societies” and “autonomous local systems” (Murdock
(1967), Barrett (1968), Mitchell and Paden (1989), Morrison (1989)). State and stateless
societies have existed side by side for over nearly two millennia “without stateless people
feeling a need to copy the institutions of their more organized neighbours” (Curtin (1995)).
5 I calculated the French West African population in 1910 using the censuses made by French districts’ administrators between 1906 and 1912. These censuses are available at the Archives Nationales, Paris, Fonds Afrique Occidentale Française, série G, sous-série 22.
7

Between these two extremes cases, these African anthropologists identify a third category
which corresponds to chiefdoms and city-states, which were smaller political units than
kingdoms. They also claim that political structure should not be associated with the size of
society: Some African states were very small and some stateless societies were very large.
C. The Allocation of European Settlers over French West Africa
Overall, European settlers were not numerous in French West Africa compared to other
settlement colonies like Algeria for France or Australia for the United Kingdom. Curtin
(1964) documents how early expectations for settlement in West Africa were dashed by very
high mortality among early settlers. Thereafter, colonial policy was driven in part by an
element of superpower rivalry and by economic motives. Lance E. Davis and Robert A.
Huttenback (1987, p. 307) write that “the colonial Empire provides strong evidence for the
belief that government was attuned to the interests of business and willing to divert resources
to ends that the business community would have found profitable.” Europeans settlers in
French West Africa can be categorized in two groups: the civil servants on the one hand, and
workers in the private sector on the second hand. The French colonial budgets show that few
settlers were involved in the public sector: first French colonial governors, administrators,
assistants and secretaries. In the education and health sectors appear French teachers, schools
inspectors, doctors and nurses. Finally, the public sector also counted French technical staff
helping in mise en valeur and state-led infrastructure development: agricultural engineers,
civil engineers and construction engineers. On the private sector side, Coquery-Vidrovitch
(1973) and Marseille (1973), who both study French private investments in colonial Africa,
report that most businesses in French West Africa were import-export companies. Most of the
European settlers working in the private sector were therefore traders and employees of trade
companies. According to the evidence brought by these two historians, there were also some
planters and men working in the construction industry, and, though only few, manufacturers.
What explains the differences in European settlement over French West Africa? This is a key
question since the paper aims to document the effect of European settlement on the
distribution of wealth within the region. We could expect Europeans to prefer pre-colonial
prosperous areas since the region was under an extractive colonial strategy. Export crops like
peanuts or cocoa developed rapidly since the end of the nineteenth century. Infrastructures
had to be built to move crops to the river ports or to the coast. Profitability of extraction was
likely to be higher in prosperous areas because dense populations provided a supply of labour
that could produce goods to trade with and also be forced to work in plantations and public
works. Curtin (1995, p. 447) writes that “European capital was invested where exploitable
resources promised the most extractive returns.” Planners were likely to pursue policies to
8
capture production that could be channelled into exports in exchange of metropolitan
products – system known as économie de traite and typical of French West Africa.
Europeans were therefore expected to settle in densely populated areas as well as in trading
posts for trade activities6.
But initial prosperity was not the only factor influencing European settlement: Politics were
also key in making extraction profitable. On the one hand, well-structured societies could have
attracted European settlers by providing them an existing system of taxation, an administration,
and also a tribute to rely on. Following the results of Nicola Gennaioli & Ilia Rainer (2007),
the profitability of European investments could be higher in states rather than in stateless
societies by increasing the accountability of local chiefs and accelerating the implementation of
colonial rule. Resistance could also be high in stateless societies: The French actually had to
force the surrender of each individual kinship segment. But on the other hand, existing African
authorities in politically well-organized societies were more likely to interfere with colonial
extraction. Despite European military superiority, Africans were however able to resist,
especially in socially coherent and well-organized societies. Curtin (1995, p. 514) says that
“(primary resistance) was usually organized by the pre-colonial states.” Acts of protest, like
strikes, riots or religious movements were likely to be stronger in societies that have good
characteristics for “collective action,” broadly political, cultural, ethnic or religious
homogeneity. Curtin (1995, p. 515) writes for instance that “a common religion was one source
of unity (…) colonial officials therefore paid careful attention to Islam as a potentially unifying
force.” Even after conquest and pacification were done, district administrators assigned an
important part of their annual reports to problems related to hostility since it had important
consequences for the everyday life and management of the districts: Popular discontent, riots
or opposition from the local chiefs prevented administrators to implement colonial authority
and projects. The participation of local people was necessary for many colonial public or
private activities like trade, agriculture or public works. Moreover, difficulties in collecting
taxes or in recruiting civil servants directly affected the material resources of the colonial
administration. Hostility was therefore a crucial issue for European settlers and for the colonial
administration.
As a result, because they pursued an extractive strategy in the region, Europeans were likely
to prefer prosperous areas unless hostility lessens the profitability of colonization. That is why
I expect hostility being especially important for settlement in prosperous areas – more than in
poor areas where Europeans would not have settled anyway.
6 The situation of Equatorial Africa was a bit different because Europeans developed mining activities in areas that could be sparsely developed, depending on mining resource discovery. But colonial extraction in West Africa focused on agriculture (there was very little mining extraction on the French part of West Africa) and was therefore likely to take place in pre-colonial and densely populated areas.
9
II. Data and Summary Statistics
Lack of data for early times is even more problematic at the district than at the national level.
Historical data used in the paper is original. The total number of districts is 1107.
A. Data on District Initial Prosperity and Political Development
The main variable that I use to capture initial economic prosperity is the density of population.
As documented by Malthus (1798) and Bairoch (1988), only prosperous areas could support
high population densities. From a Malthusian point of view, more natural resources and
agrarian prosperity is necessary to maintain a higher population density. This measure is
appropriate in the case of rural societies like late nineteenth century West Africa (not in the
case of modern industrialised societies). I collected data on local populations from colonial
censuses and land area from colonial maps at the district level, and calculated population
density by dividing total population by land area8. The earliest measure I can use is the
population density in 1910, at the beginning of the effective French colonial occupation. 1910
is early enough to ensure that no massive population movements caused by the colonial
experience took place yet. Map 1 reports the distribution of population density in 1910. The
most densely populated areas were the southern region of what is currently Benin, the Mossi
land in current Upper-Volta, the Wolof region in the western region of what is currently
Senegal and the Fuuta Jaalo in what is present-day, central-west Guinea. But unfortunately
population density imperfectly captures the level of prosperity of the southern Saharan belt
districts which are mainly composed of desert. Their area is therefore disproportionally huge
compared to population, resulting in an almost nil population density: average 1910 population
density is 0.55 in desert-edge districts and 9.75 in other districts (t-statistic of the hypothesis of
mean equality: 2.1). However, some desert-edge cities prospered in the 15-16th centuries from
the dynamic trans-Saharan trade9. Even if the Fulani jihads of the mid-19th century and the
civil wars that followed caused a serious decline of these desert-edge areas, the quasi-nil
population density is not a good proximate of prosperity in these areas due to their specific
geographical characteristics. I therefore include a dummy for desert-edge areas in my
7 I exclude Dakar and Saint-Louis from the sample since there is no data on political climate in these two particular districts. 8 It is more usual to divide total population by arable area but there are two reasons why I do not use arable area: i) a methodological reason which is that some districts are completely in the desert so their arable land is zero and ii) a pragmatic reason which is that except for the desert-edge districts, arable land and total land are equal: our measure of land area excludes inland water and FAO data shows that the remaining land is arable (the map is available on http://www.fao.org/farmingsystems/FarmingMaps/SSA/12/AL/map/m10000.html). Using total land or arable land therefore does not change anything except for the desert-edge areas. 9 For a comprehensive and detailed article on the trans-Saharan trade, refer to the historian Pekka Masonen at: http://www.hf-fak.uib.no/institutter/smi/paj/Masonen.html
10

econometric framework in order to take into account this specificity regarding population
density.
Another issue is to measure initial political development. In this paper, I follow African
anthropologists and economists who have previously worked on this topic (Morrison, Mitchell
and Paden (1989), Murdock (1967), Barrett (1968), Englebert (2000)) and distinguish 3 pre-
colonial political statuses: kingdoms or empires, chiefdoms and completely amorphous areas. I
do not use the index of state-like nature of pre-colonial systems used in Englebert (2000)
because this index is at the national level. As I need more precise information at the district
level, I use evidence from African historians (Boahen (1989), Bouche (1991), Coquery-
Vidrovitch & Moniot (1993), Ki-Zerbo (1978)). The time period in which political structure is
observed is 1850-1880. There is a strong consensus within these historical sources on the
location of pre-colonial kingdoms, chiefdoms and amorphous areas. Completely amorphous
areas10, characterized by a total absence of political authority, were located in the forest
regions of Guinea (Toma and Guerze), in the south-western Ivorian forest (Krou), in
Casamance in south-western Senegal and in Atakora in north-western Benin (Somba).
Kingdoms correspond to large areas with political control concentrated in the hands of a few
people, with an ability to collect revenue and tribute. Appendix 2 shows districts affected to the
kingdom category, the name of the kingdom and the historical sources that allowed me to
construct these data. A district was affected to the “kingdom” category as soon as a kingdom
existed on the main part of the area over 1850-1880, based on description and maps of pre-
colonial kingdoms (Sellier (2003)). Approximately half of the districts were part of kingdoms
from before colonial rule, and 13 districts were part of completely amorphous areas. Pre-
colonial, well-structured kingdoms had significantly higher population densities than the rest of
the region: average 1910 population density is 11.1 over kingdom districts and 6 over the other
districts (t-statistic of the hypothesis of mean equality: 1.8). In other words, political
development and economic prosperity were positively correlated, which is consistent with
Stevenson’s view of higher population densities in traditional states in sub-Saharan Africa and
lower ones in the non-states regions (Stevenson (1968))11.
Finally, initial differences in climate can be captured by differences in latitude, longitude and
rainfalls. In West Africa, it varies from 160 inches in a few places along the coast to less than
10 Amorphous areas are also called “lineage-based societies” in Englebert (2000) or “segmentary systems” in Murdock (1967). 11 This can be explained because stateless societies had several problems: warfare on a large scale called for strong military command and permanent officials, traders needed a way to protect goods for transit, there was a need for a system of law allowing aliens to come and go in peace, and there needed to be a system to facilitate borrowing and collection of debts. These needs could only be offered by permanent officials and central direction. A reverse causation is also plausible: Densely populated areas were likely to coincide with a higher division of labour which likely required a higher level of political organization than extensive labour organization.
11
fifteen inches at the edge of the desert. Another factor explaining differences in natural
circumstances is rivers. Certain north-flowing rivers like the Senegal and the Upper Niger
provide a kind of safety valve. These rivers overflow their banks and carry both silt and
moisture to the surrounding fields. Crops are planted on the wet fields as the water recedes and
grow during the early dry season. I therefore constructed a dummy for the presence of
navigable rivers. Since altitude is also an important determinant of disease environment, I
include for each district the altitude of its main town. Finally, access to the sea is a strong
determinant of economic opportunities (exports, salt production, fishing along the coast). I
therefore include a dummy for coastal districts. Please refer to Appendix 1 for more detail on
data sources.
B. Data on European Settlement
District-level data on European settlers comes from colonial censuses. The number of
European settlers was globally very low as in almost all extractive colonies in Africa, India
and Asia (Mc Evedy & Jones (1975), Curtin (1995, p. 435)). The African colonies where the
proportion of Europeans exceeded 1% are Southern and South-Central Africa, Angola and
the Maghreb (Acemoglu, Johnson and Robinson (2001)). In 1910, there were a total of 7,610
Europeans living in French West Africa, which progressively increased to 13,239 in 1925
and 53,087 in 195012, representing alternatively 0.6‰, 1‰ and 3‰ of French West African
population. At the district level, the average number of European settlers grew up from 68 in
1910 to 118 in 1925 and 525 in 1950. But these figures mask a huge heterogeneity across
districts which can be appreciated by the gap between the average number of European
settlers per district and the median one: Half of the districts had less than 16 settlers in 1910,
23 in 1925 and 86 in 1950.
C. Data on District Hostility Towards Colonial Power
I collected data on African attitudes towards French power and especially hostility at the
district level. Data come from the political annual reports13 written by the district
administrators of the governor. These reports aimed to inform the governor on the political
climate in each district of the colony. The district administrators therefore chronicled every
political event that occurred in their district during the year: good/ bad disposition of the
population, riots, opposition from the local chiefs, difficulty in collecting taxes or in recruiting
civil servants, refusal to do coerced labour etc. I14 read every report for years ending by “3”,
12 Actually this is not the exact number of Europeans in 1950 since I used censuses from 1947 to 1953 to calculate this total, depending on data availability at the colony level. 13 Paris, National Archives, Fonds Afrique Occidentale Française, série G, sous-série 2. 14 Angélique Roblin also provided excellent assistance for these data collection.
12
“6” and “9” from 1906 to 1956, and coded political events expressing hostility towards
colonial power. Among events expressing hostility, I distinguished expressions of severe
importance when 1) it clearly showed the determination to jeopardize the colonial power –
clashs with a significant group in the district, people running away to escape tax collection or
the activism of religious movements, AND 2) it necessitated a repressive intervention from the
French administration: military repression, the destitution of a local chief, the dispatching of
policemen to force people to pay taxes or enrol in coerced labor, or intervention to punish
some rebellious people.
To construct a relevant measure of hostility, I focus on the period 1906-1920. Historians
actually distinguish between three types of African resistance: 1) Resistance to military
conquest, before effective direct administration of the large and populous territories, which was
therefore unlikely to influence European settlement; 2) Resistance characterized by the refusal
to obey, pay taxes, do coerced labour and to enrol in police forces, which directly affected the
profitability of colonial activities and was therefore likely to influence European settlement; 3)
“Modern nationalism,” which was borrowed from the West by the local western-educated elite
with the goal of taking over the colonial state after WWII (Curtin (1995, p. 514), Rioux (2007,
p. 668)). What interests me is the hostility that might dissuade Europeans from settling
beginning in 1906 since the arrival of European settlers began at the end of the military
pacification, contemporaneously with the implantation of an administrative structure. After
1920, the expressions of this type of hostility declined until 1945 when French administrators
faced the third type of hostility (“modern nationalism), which does not have much relevance in
this paper because it mostly took place in capitals and favoured areas without any influence on
the location of European settlers.
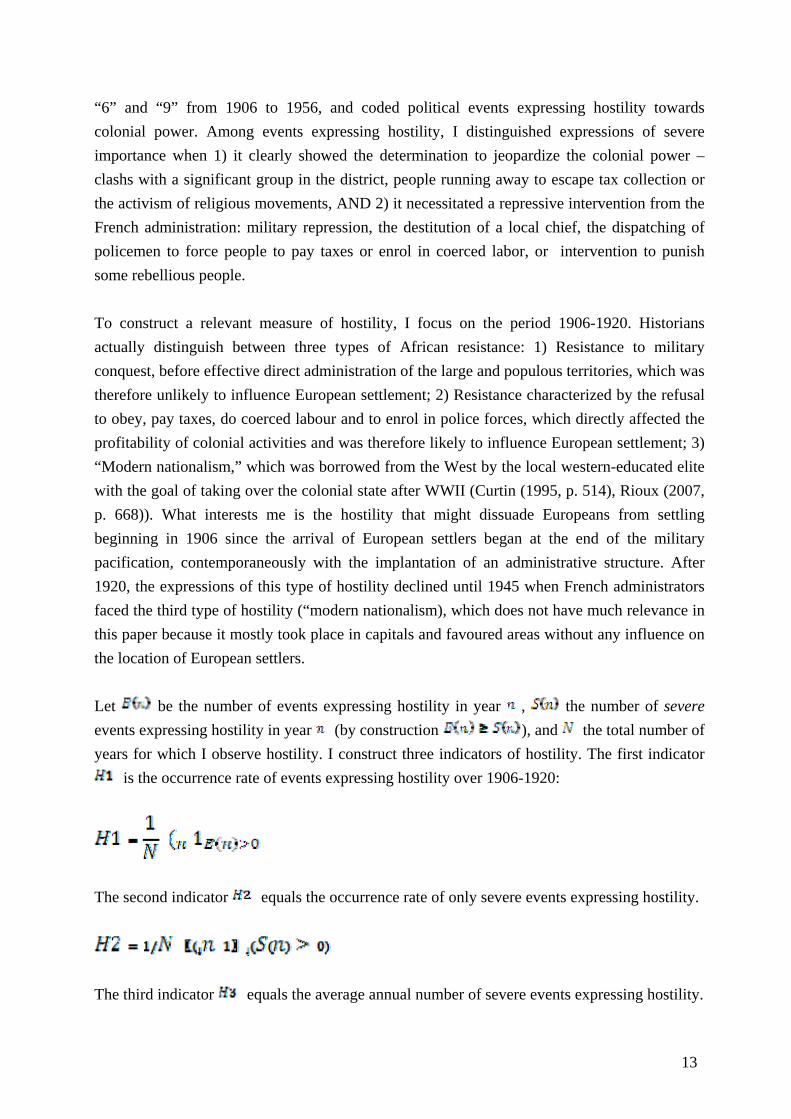
Let be the number of events expressing hostility in year , the number of severe
events expressing hostility in year (by construction ), and the total number of
years for which I observe hostility. I construct three indicators of hostility. The first indicator
is the occurrence rate of events expressing hostility over 1906-1920:
The second indicator equals the occurrence rate of only severe events expressing hostility.
The third indicator equals the average annual number of severe events expressing hostility.
13
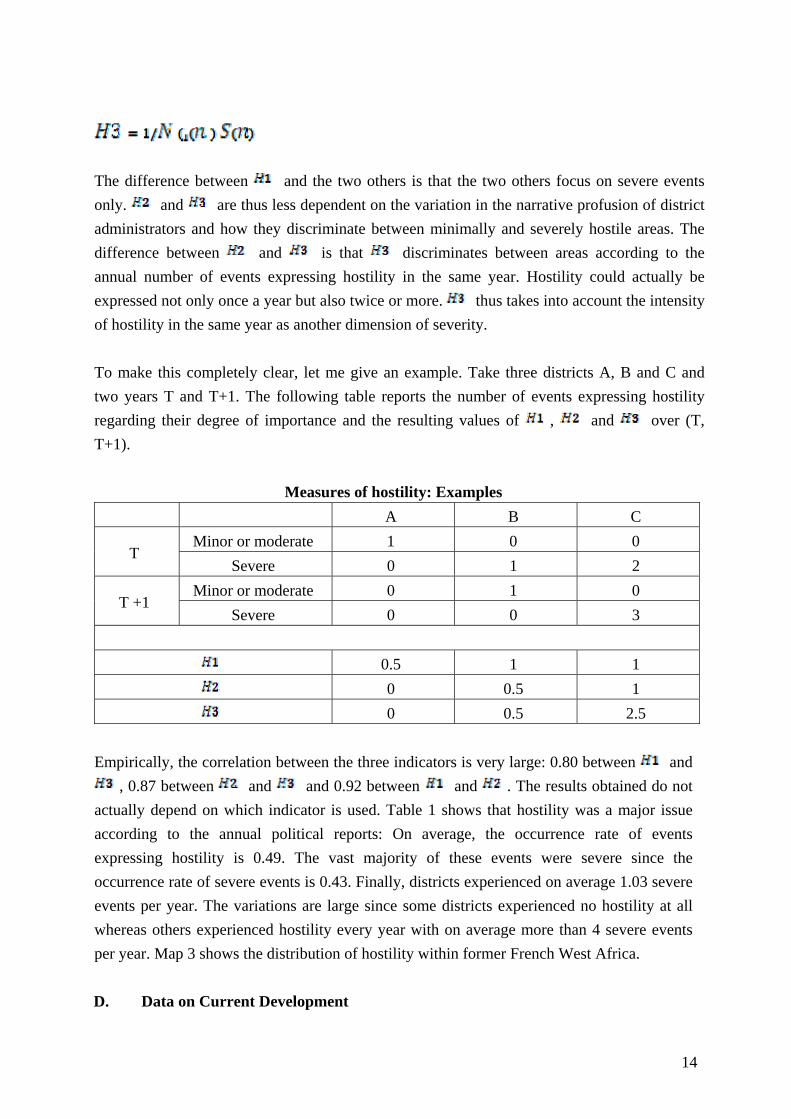
The difference between and the two others is that the two others focus on severe events
only. and are thus less dependent on the variation in the narrative profusion of district
administrators and how they discriminate between minimally and severely hostile areas. The
difference between and is that discriminates between areas according to the
annual number of events expressing hostility in the same year. Hostility could actually be
expressed not only once a year but also twice or more. thus takes into account the intensity
of hostility in the same year as another dimension of severity.
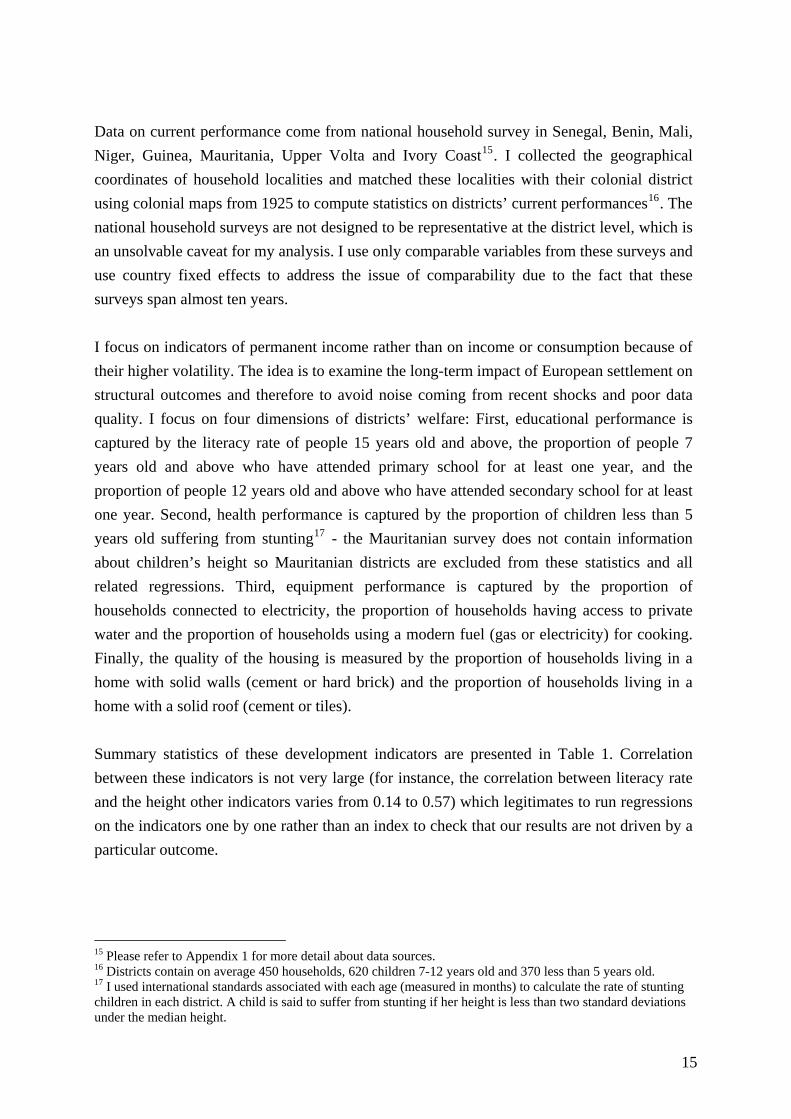
To make this completely clear, let me give an example. Take three districts A, B and C and
two years T and T+1. The following table reports the number of events expressing hostility
regarding their degree of importance and the resulting values of , and over (T,
T+1).
Measures of hostility: Examples
A B C
Minor or moderate 1 0 0 T
Severe 0 1 2
Minor or moderate 0 1 0 T +1
Severe 0 0 3
0.5 1 1
0 0.5 1
0 0.5 2.5
Empirically, the correlation between the three indicators is very large: 0.80 between and
, 0.87 between and and 0.92 between and . The results obtained do not
actually depend on which indicator is used. Table 1 shows that hostility was a major issue
according to the annual political reports: On average, the occurrence rate of events
expressing hostility is 0.49. The vast majority of these events were severe since the
occurrence rate of severe events is 0.43. Finally, districts experienced on average 1.03 severe
events per year. The variations are large since some districts experienced no hostility at all
whereas others experienced hostility every year with on average more than 4 severe events
per year. Map 3 shows the distribution of hostility within former French West Africa.
D. Data on Current Development
14
Data on current performance come from national household survey in Senegal, Benin, Mali,
Niger, Guinea, Mauritania, Upper Volta and Ivory Coast15. I collected the geographical
coordinates of household localities and matched these localities with their colonial district
using colonial maps from 1925 to compute statistics on districts’ current performances16. The
national household surveys are not designed to be representative at the district level, which is
an unsolvable caveat for my analysis. I use only comparable variables from these surveys and
use country fixed effects to address the issue of comparability due to the fact that these
surveys span almost ten years.
I focus on indicators of permanent income rather than on income or consumption because of
their higher volatility. The idea is to examine the long-term impact of European settlement on
structural outcomes and therefore to avoid noise coming from recent shocks and poor data
quality. I focus on four dimensions of districts’ welfare: First, educational performance is
captured by the literacy rate of people 15 years old and above, the proportion of people 7
years old and above who have attended primary school for at least one year, and the
proportion of people 12 years old and above who have attended secondary school for at least
one year. Second, health performance is captured by the proportion of children less than 5
years old suffering from stunting17 - the Mauritanian survey does not contain information
about children’s height so Mauritanian districts are excluded from these statistics and all
related regressions. Third, equipment performance is captured by the proportion of
households connected to electricity, the proportion of households having access to private
water and the proportion of households using a modern fuel (gas or electricity) for cooking.
Finally, the quality of the housing is measured by the proportion of households living in a
home with solid walls (cement or hard brick) and the proportion of households living in a
home with a solid roof (cement or tiles).
Summary statistics of these development indicators are presented in Table 1. Correlation
between these indicators is not very large (for instance, the correlation between literacy rate
and the height other indicators varies from 0.14 to 0.57) which legitimates to run regressions
on the indicators one by one rather than an index to check that our results are not driven by a
particular outcome.
15 Please refer to Appendix 1 for more detail about data sources. 16 Districts contain on average 450 households, 620 children 7-12 years old and 370 less than 5 years old. 17 I used international standards associated with each age (measured in months) to calculate the rate of stunting children in each district. A child is said to suffer from stunting if her height is less than two standard deviations under the median height.
15
III. The European Settlement and Long Run Development
A. Evidence on the Allocation of European Settlers over French West Africa
I test empirically the expected correlation between European settlement, economic prosperity
and political development from before colonial rule, and hostility by running ordinary least
squares regressions of the form:
(1) Ei = + Hi + Pi+ Hi*Pi+ Si+ Xi+ i
where Ei is the share of Europeans in district i population in 1925, Hi is the measure of
hostility in district i over 1906-1920, Pi a set of proxies for economic prosperity from before
colonial rule in district i, Hi*Pi is the product of hostility with proxies for initial economic
prosperity, Si a set of proxies for political status from before colonial rule in district i and Xi
a set of geographical control variables. My coefficients of interest are , and : represents
the effect of hostility on European settlement when pre-colonial prosperity is zero, represents the effect of initial economic prosperity when hostility is zero, and represents the
supplemental effect of hostility depending on economic prosperity, since hostility is likely to
be important especially in prosperous areas (cf. Section I). The number of observations is
110.18
Table 2 shows that Europeans were attracted by initially prosperous areas. The dissuasive
impact of hostility on European settlement was also large and significant, though mainly
driven by net effects controlling for initial prosperity. One additional severe event expressing
hostility per year reduced the number of European per 1 000 inhabitants in 1925 by one,
which is not a small effect since there were on average 2.7 settlers19. Table 2 also shows that
the dissuasive effect of hostility was larger for densely populated areas than for sparsely
populated areas. Graph 1 represents the differences in the dissuasive impact of hostility along
the distribution of the population density. It shows that most hostile areas at the 75th
percentile of population density lost 2 European settlers per 1,000 inhabitants, whereas most
hostile areas at the 25th percentile of population density lost only 0.5 European settlers per
1,000 inhabitants. These results thus confirm the previous predictions: (i) Europeans were
more attracted by prosperous areas but (ii) hostility disturbed this preference and created
large differences in settlement within prosperous areas.
18 Note that Dakar and Saint-Louis are excluded from the sample because of the lack of data on political climate in these two specific districts. Dakar was the capital of French West Africa and Saint-Louis the capital of Senegal and Mauritania. These two cities had a particular legal status. Consequently, no annual political reports were written on Dakar and Saint-Louis. The number of observations is thus 110. 19 Note that this statistic is calculated without Dakar and Saint-Louis.
16

One might be concerned that the negative relationship between European settlement and
hostility towards colonial power could reflect a reverse causation. Results in Table 3 could
actually be interpreted as the negative impact of European settlement on hostility: the more
Europeans in the districts, the less hostile. To address this reverse causation issue, I use a
Granger causality type argument thanks to the evolution patterns of European settlement and
hostility. I use European settlement in 1910 and 1925 (Et and Et+1 resp.) and hostility over
1906-1920 and 1920-1940 (Ht and Ht+1 resp.). The reverse causation issue can be tested by
running regressions of the form:
(2) Et+1,i = + Ht,i + Et,i + Xi+i
Ht+1,i = + Ht,i + Et,i + Xi+i
Where Et,i is the number of Europeans per 1,000 inhabitants in time t in district i, Ht,i is the
level of hostility in time t in district i and Xi a set of control variables in district i. With this
specification, coefficient represents the Granger causal impact of hostility on European
settlement since the potential effect of European settlement on hostility is captured by Et,i,
while coefficient represents the Granger causal impact of European settlement on hostility
since the potential effect of hostility on European settlement is captured by Ht,i.
Results are reported in Table 3. Hostility towards colonial power over 1920-1940 clearly had
a negative Granger causal impact on European settlement, while European settlement had no
Granger causal impact on hostility, which supports my interpretation that hostility disturbed
European settlement and created large differences in settlement within prosperous areas.
Omitted variables can still be an issue in this specification, so results can only be interpreted
as showing Granger causality and not causality in the usual (randomized experiment) sense
of the word.
B. OLS Estimates of the Impact of European Settlement on Current Performance
I compare the districts’ development performance according to European settlement in 1925 by
running ordinary least squares regressions of the form:
(3) Yi = + Ei + Pi+ Si+ Xi+ Ci + i
where Yi is an outcome variable in district i, Ei is the number of Europeans in district i per
1,000 population in 1925, Pi a set of proxies for initial economic prosperity in district i, Si a set
of proxies for initial political status of district I, Xi a set of geographical control variables and
17
Ci is a set of country fixed effects. My coefficient of interest is which represents the impact
of European settlement net of its correlation with pre-colonial economic, political and
geographical characteristics. I include country fixed effects to address cross-country
comparability issue.
Table 4 gives evidence that European settlement is strongly positively correlated with current
performance. Coefficients on Europeans per 1,000 inhabitants in 1925 in panel C show that for
one additional European per 1,000 inhabitants in 1925, the current performance rate go up by
0.50 to 1.6 percentage points in each dimension: education, equipment, quality of housing,
except health (the coefficient is not significant). A one standard deviation increase in the
number of Europeans per 1,000 inhabitants would approximately produce a one standard
deviation increase in current performance rate (from 0.5 to 1.20 depending on which
performance is considered). Panel A also shows that the variance in European settlement in
1925 explains a large part of the variance in current performances in most of cases. Note that
p-values of the test of joint significance on control variables are reported in Panel C so that one
can see whether the controls explain a significant share in the variation of the outcomes. No
regular pattern emerges from this, which leave unclear the explanatory strength of geography
versus initial economic and political development.
Yet this strategy produces biased estimates if there are unobserved district characteristics that
are correlated with current performances. It is not clear whether the bias would be upward or
downward since such unobserved characteristics that attracted settlers could have either a
positive or a negative influence on current performances.
C. IV Estimates of the Impact of European Settlement on Current Performance
A way of solving the problem of omitted variables is to instrument the number of European
settlers. Some solutions to this problem have been found in the literature, especially in
Acemoglu, Johnson and Robinson (2001, 2002) and Feyrer and Sacerdote (2009). Feyrer and
Sacerdote (2009) use wind speed as a random source of variation in the length of colonialism,
which is obviously unemployable outside the context of islands. Acemoglu, Johnson and
Robinson (2001, 2002) use European settler mortality as an exogenous source of variation of
European settlement but I cannot use this variable as an instrument for European settlement
since this variable is very imprecise and volatile due to very small numbers of Europeans per
district (I refer to Appendix 3 for further evidence and discussion on this point)20. In this paper,
20 Some scholars might want to use instruments like distance to the nearest seaports since it was negatively correlated with European settlement: All settlers arrived from Europe in West Africa by boat and were therefore more likely to settle near the port from which they entered. But this alternative instrument is far from convincing since distance to the nearest seaport is highly correlated to distance to the coast which, in turn, reflects an
18
I use hostility towards colonial power as an instrument for European settlement. The
underlying assumption is that hostility towards colonial power affected European settlement
(as shown in Section A) but did not directly affect the long-term development path. Since such
an assumption is hard to acknowledge (as discussed below), I will relax it and assume that
conditionally on some observable characteristics affecting both hostility and current
performances, hostility towards colonial power was something accidental that created
exogenous variation in European settlement.
Hostility could violate the exclusion relation in two ways: First, if hostility depended on pre-
colonial district characteristics which influenced the long-term development path (something
that preceded colonial experience, like initial prosperity and political development); second, if
hostility created particular conditions in the districts which influenced the long-term
development paths independently from European settlement (something that followed colonial
experience, positively like greater collective action and social cohesion (Banerjee, Iyer and
Somanathan, 2006), or negatively like anarchic indigenous politics and current conflicts). To
test the influence of initial economic prosperity and political status on hostility, I run
regressions of the form:
(4) Hi = + Pi + Si+ Xi+ i
where Hi is the measure of hostility in district i, Pi a set of proxies for initial economic
prosperity in district i, Si a set of proxies for initial political status of district i, and Xi a set of
geographical controls variables. Empirical results are reported in Table 5. They show that
early hostility was significantly higher in more densely populated areas and in desert-edge
areas, meaning that economic prosperity encouraged resistance and hostility – probably
because the prosperous areas had more to defend and fight for than poor areas. Initial
political development also influenced hostility towards colonial power in a non-linear way:
Kingdoms and amorphous areas were more hostile than the rest of the region – plenty and
lack of social authority was both hard to control by the colonial power. It is also worth noting
that the significantly positive coefficient on latitude probably reflects a correlation between
Islam and hostility, which is recurrently mentioned in administrators’ annual reports21.
Hostility was thus evidently correlated with intrinsic district characteristics that also
potentially influenced their development path.
Yet administrators’ annual reports also give evidence that district characteristics did not
completely explain the differences in levels of hostility. Hostility is often presented as a
intrinsic ability to advance economically in the modern age due to low transportation costs for trade and greater ability to adopt western technology, among others. 21 Islamic penetration came historically from North Africa and is therefore distributed north-to-south.
19

mismatch between a specific colonial administrator and the African population, except after
WWII when hostility was almost driven by elite groups in biggest cities to obtain
independence. A first accidental source of hostility, reported in Cohen (1974), is the
heterogeneity of French colonial administrators in regard to their educational background and
their vision of the role colonialism. Some colonial administrators were diplomatic and
succeeded in creating a favourable political climate with local people, whereas others were
brutal and provoked aggressive reactions. Another accidental source of hostility could be the
emergence of a specific leader personally inclined to resistance towards colonial authority,
like Samori in eastern Guinea. Administrators reported cases where chiefs accepted some
indemnities whereas others declined the same offer because of their “personality” and
inclination towards opposition. An example that illustrates such variations can be found in
the two neighbouring Bambara kingdoms, Kaarta and Segu: The Fama Mademba of Segu
accepted to collaborate and to receive an annual indemnity from the colonial power whereas
the king of Kaarta, Koulibaly, declined. Consequently, the level of hostility in the
corresponding districts is much higher in the former Kaarta than in the former Segu. Another
example is Sine Saloum and Baol in Senegal: they are neighbouring districts, both densely
populated, both under a pre-colonial kingdom, with very similar anthropological and
geographical characteristics. Baol was significantly more hostile than Sine Saloum: The
average annual number of severe events expressing hostility was 0.6 in Baol and 0.2 in Sine
Saloum. Such discontinuity between similar districts can be observed with Ouahigouya and
Dedougou in current Upper-Volta, among many others.
Moreover, Table 5 shows that early hostility was not correlated to later hostility: there is no
significant correlation between 1906-1920 hostility and 1920-1940 / 1940-1956 hostility
once Casamance is controlled for. Early hostility is therefore unlikely to impact current
outcomes (current conflicts, governance and indigenous politics) since it didn’t even impact
hostility in the consecutive periods. Graph 2 plots 1906-1920, 1920-1940 and 1940-1956
hostility to give evidence of the quasi-independence of hostility over time. Conditional to
observable characteristics that capture main pre-colonial differences, early hostility towards
colonial power seems somehow accidental and constitutes an exogenous source of variation
in European settlement.
First stage estimates are presented in Table 2 column (5). The partial R-squared associated
with this instrumentation strategy is 0.28 (the F-statistic on excluded instruments in the first
stage regression is 11.52), thus avoiding problems caused by the use of weakly correlated
instruments. Table 6 reports IV estimates of the impact of European settlement on current
performance. Table 6 also reports spatial autocorrelation index (Moran’s I) for predicted
20

residuals to check that the estimates obtained from IV estimator are not overly precise22. As a
matter of fact, residuals are not spatially correlated since Moran’s I are small and almost
insignificant. Instrumental variable point estimates are of the same size but less significant than
OLS point estimates: out of nine outcomes, three are no longer significantly correlated with
1925 European settlement. But the general picture that emerges from this analysis still holds:
colonized areas that received more European settlers have performed better historically than
colonized areas that received less Europeans settlers. For instance, for one additional European
per 1,000 inhabitants in 1925, the current proportion of households connected to electricity
(resp. having access to private water) goes up by 1.4 (resp. 1.6) percentage points. These
results do not mean that colonization, per se, was a positive experience since I do not compare
colonized versus non-colonized areas, but colonized areas with many Europeans performed
better in the long run than colonized areas with few Europeans.
D. An Overall Change in Distribution of Prosperity over the Twentieth Century?
The final question that I want to examine is whether the colonial experience created a reversal
of fortune within former French West Africa, as Acemoglu, Johnson and Robinson (2002)
observe at the world wide level: Most prosperous pre-colonial areas in 1500 became the least
prosperous in 2000. To test this reversal of fortune, I use the straightforward strategy used in
Acemoglu, Johnson and Robinson (2002): I compare district development performance
according to pre-colonial economic prosperity by running ordinary least squares regressions of
the form:
(5) Yi = + Pi+ Si+ Xi+ Ci + i
where Yi is an outcome variable in district i, Pi a set of proxies for initial economic prosperity
in district i, Si a set of proxies for initial political status of district i, Xi a set of geographical
control variables and Ci is a set of country fixed effects. My coefficient of interest is which
represents the correlation between from before colonial rule and current economic
performance. Table 7 reports the results. Coefficients on initial economic prosperity are all
positive or neutral. The relationship between pre-colonial and current economic performance is
therefore positive but not very strong. But the general pattern is not a reversal of fortune. The
colonial experience rather altered the distribution of prosperity within former French West
Africa than actually reverse it. This positive or neutral relationship between pre-colonial and
current economic performance indeed reflects the fact that some of the richest pre-colonial
areas are no longer richer than the others, but they are not less rich. Other less prosperous areas
22 Spatial autocorrelation would overestimate precision because, since events tend to be concentrated, there are actually fewer number of independent observations than are being assumed.
21

before colonial times may have been favoured by colonial power and therefore caught up with
the most prosperous. This result is also consistent with the mechanism driving European
settlement. As predicted by Acemoglu, Johnson & Robinson (2002), Europeans preferred
prosperous areas in West Africa because the profitability of extraction was higher in
prosperous areas than in poor ones. With respect to this factor, Europeans thus tended to
reinforce pre-colonial inequalities by settling in prosperous areas. Yet on the other hand,
hostility towards colonial power was more severe in prosperous areas which dissuaded
Europeans from settling. These two mechanisms tended to compensate for one another and
therefore did not completely reverse the distribution of prosperity. One might want to think of
pairs of districts that illustrate this specific long term impact of French colonization in West
Africa. The most spectacular example is Porto-Novo versus Cotonou. From before colonial
rule, Porto-Novo was a very prosperous area: one of the most densely populated area out of
West Africa. A powerful kingdom was controlling the southern part of current Benin (not a
very expanded kingdom though). Because King Behanzin was particularly hostile towards
French colonizers (even if his predecessor Glélé was much more docile and had signed
friendship treaty), the French administration and private investors preferred the nearby district
of Cotonou to settle. Cotonou grew rapidly and became the first economic place in Benin.
Many other pairs of districts had similar stories: Niamey overtook Dosso, Thies overtook
Tivaouane, Abidjan overtook Assinie, Bamako overtook Mopti, Ouagadougou overtook Bobo-
Dioulasso, etc.
22
IV. Why did European Settlement Play a Positive Role?
A. Potential Institutional Channels
The positive impact of European settlement in the former colonies has already been explored,
especially in Acemoglu, Johnson and Robinson (2001). In this paper, the authors show that the
relationship between European settlement and current performance works through the quality
of the institutions brought by Europeans. Europeans adopted different colonization policies in
different colonies with different associated institutions. At one extreme, in places where the
disease environment was not favourable to European settlement, Europeans set up extractive
institutions characterized by little protection of private property or checks against government
expropriation. At the other extreme, in places where the disease environment was favorable to
European settlement, Europeans migrated and created what the historian Alfred Crosby (1986)
calls “Neo-Europes”, primarily Australia, New Zealand, Canada and the United States. In these
colonies, the settlers tried to replicate European institutions with strong emphasises on private
property and checks against government expropriation. In regard to the way institutions
encourage productive activities, capital accumulation, skill acquisition and innovation, the
extractive strategy was associated with “bad” institutions whereas the settlement strategy was
associated with “good” institutions. They use the protection against risk of expropriation index
from Political Risk Services, the constraint on executive index and the democracy index from
the Polity III dataset as proxies for the quality of institutions.
There exists no measure of the quality of institutions at the infra-national district level. I
therefore cannot test directly the validity of this potential explanation within former French
West Africa. The question is de facto slightly different within former French West Africa
since the global colonization policy (“extraction” versus “migration”) was homogenous all
over the region. In former French West Africa, Europeans only pursued an extractive strategy.
Therefore, the potential variations in the quality of institutions, if any, could not come from
differences in colonial strategy. The question here is why European settlement had a positive
impact on current development conditional to their extractive strategy. One might be
surprised that the impact of European settlement was positive given the poor nature of the
institutions they implemented.
Within former French West Africa, the risk of expropriation, constraint on executives and
political participation of local populations were formally driven by the same set of rules since
23
the legal system was uniform all over the region23. Colonial regulations were defined by the
General Governor of the whole French West Africa, if not by the Minister of the Colonies for
the whole French empire. The administrative organization was remarkably homogenous, as
were the economic and social rules. If differences in European settlement created some
differences in institutions, it should therefore be related to the application of colonial rule, not
to the colonial rules themselves. I adopt the definition of institutions as “sets of rules,
compliance procedures and moral and ethical behavioural norms that constrain the behaviour
of individuals” (North (1981)). With respect to this definition, de jure institutions within
colonial French West Africa did not differ except for a few exceptional towns in Senegal. But
this does not prevent de facto variation. For instance, African people living close to many
European settlers could take a greater advantage of the new legal code than people living in
sparsely settled areas, where customary law was more likely to compete with colonial rule.
Aldashev, Chaara, Platteau and Wahhaj (2007) show examples of situations where formal and
informal laws are seen as conflicting with each other. The general picture that emerges from
the literature is that legal pluralism tends to produce neutral or negative effects. I consciously
leave aside this question because I cannot give any empirical evidence of such differences. I
can only argue that the positive impact of European settlement within former French West
Africa did not run through the quality of formal institutions, and that the bad nature of
institutions brought by colonizers gives little support to an institutional explanation of the
positive role of European settlers on current outcomes.
B. The Role of Private and Public Investments
Another potential explanation on why European settlement had a positive impact on current
performances is that Europeans increased investments in areas where they were lived, simply
because Europeans were themselves administrators, businessmen or missionaries and had the
capital for major investments that African people lacked. The mechanism running behind the
previous findings could therefore be far more direct than the one stressed by the broad literature
on institutions: The key determinant of the positive impact of European settlement could be the
investments themselves rather than the incentives to invest created by a more favourable
institutional environment. On the private side, Europeans invested in resource extraction
(peanuts, vegetable oils, wood, cotton, leather, cocoa, coffee, minerals). Private investors were
likely to introduce new crops and new techniques to increase total yields that could be
channelled into exports. On the public side, Europeans invested in public goods such as
education (building schools and paying teachers), health (building hospitals and dispensaries
and paying doctors and nurses) and infrastructure (roads, wells, bridges, harbours, railways, air
23 Except the four “communes” (Saint-Louis, Dakar, Rufisque and Goree), whose inhabitants were French citizens. Some fiscal rules were also different in these cities. Three of them are excluded from my empirical study (Goree, Dakar, Dakar and Saint-Louis).
24
transport). Note that all public expenses were financed by local tax revenue and not by
European taxpayers. These investments created new job opportunities for local people, some
improvements in agricultural productivity and a greater access to human capital formation,
which could be the key reason why regions with numerous Europeans settlers grew faster than
regions with few settlers.
Unfortunately I have no district level data on private investments, neither during the colonial
era, nor today. The only empirical evidence I can bring is on public investments: I collected
district level data on colonial public investments in education, health and infrastructures from
annual colonial budgets24 so I can test if differences in European presence within French West
Africa are correlated with differences in access to public goods. For further detail on data on
colonial public investments, I refer to Huillery (2009). The question is whether European
settlers tended to favour colonial public investments and whether this relationship explains the
positive impact of European settlers on current performance.
Graphs 3 and 4 show the correlation between the number of European settlers in 1925 per
1,000 inhabitants and colonial public investments in teachers and doctors25 over 1930-1939.
The correlation is significant and positive, which could be interpreted as the fact that European
settlers encouraged public investments. An alternative explanation that is just as plausible is
that Europeans had incentives to settle in areas with high colonial public investment. This
potential reverse causation is not a crucial issue for the purpose of this paper, which is to
explain why areas with a higher concentration of European settlers in 1925 are more developed
today, all other things being equal. Since European settlement and colonial public investments
largely worked together, I just point out that the positive influence of European settlers on
current performances may reflect the positive influence of colonial public investment. But since
my motivation is rather to flesh out the channels of the effect of Europeans on modern
development, I test whether the coefficient on 1925 (earlier) European settlers changes when
introducing 1930-1939 (later) investments in specification (3).
(6) Yi = + Ei + Ii + Pi+ Si+ Xi+ Ci + i
where Yi is an outcome variable in district i, Ei is the number of Europeans in district i per
1,000 population in 1925, Ii is the 1930-1939 colonial investment corresponding to Yi
(teachers for education, doctors for health and public works for access to infrastructures), Pi a
set of proxies for pre-colonial economic prosperity in district i, Si a set of proxies for pre-
colonial political status of district i, Xi a set of geographical control variables and Ci is a set of
24 The annual colonial budgets are in the Archives Nationales in Dakar, Senegal. 25 I do show the graph with investments in public works which is the exact same kind of graph.
25
country fixed effects. My coefficients of interest are which represents the impact of European
settlement and which represents the impact of colonial public investment, net of both their
mutual correlation and their correlation with pre-colonial economic prosperity, political status
and geography.
Table 8 shows that colonial public investments partly explain the positive relationship between
European settlement and current performance, but they do capture a maximum of half of the
whole effect of European settlement. The size of most coefficients on European settlement
decreases, showing that previous estimates of European settlement partly captured the effect of
colonial public investment, but most of the positive effect of European settlers on current
outcomes remains unexplained. A key hypothesis that remains the most plausible is the private
investment hypothesis, on which I cannot give any evidence at this stage.
26
V. Conclusion Many economists and social scientists believe that differences in colonial experiences are at the
root of large differences in current outcomes across countries. This paper explores the impact
of the colonial experience within a more homogenous area so as to bring a better understanding
of underlying mechanisms. The main results of this paper are: (1) European settlers preferred
prosperous areas within West Africa, which is consistent with the Acemoglu, Johnson and
Robinson (2002) premise since the general colonial policy was “extraction.” Europeans thus
tended to reinforce pre-colonial inequalities by settling in prosperous areas. (2) This preference
towards prosperous areas was discouraged by hostility towards colonial power. Hostility
actually dissuaded Europeans from settling and the consequence is that areas which were both
and hostile received less European settlers than rich and non-hostile areas. When hostility was
severe in a prosperous area, Europeans preferred to settle in a calm neighboring area even if it
was less prosperous. (3) Colonized and highly settled areas had faster development paths than
colonized and poorly settled areas. The impact of European settlement was thus positive even
in an “extractive” colonization context, working partly through colonial public investments: the
more Europeans settlers, the more colonial investments in education, health and infrastructure.
(4) The distribution of prosperity within former French West Africa did not reverse. Yet hostile
and initially rich areas lost a part of their pre-colonial advantage. Calmer areas caught up with
them and sometimes overtook them. Differences in hostility towards colonial power thus
explain why certain changes in the prosperity distribution occurred within former French West
Africa. It sheds light on the emergence of new dynamic areas like Cotonou, Niamey, Bassam,
Abidjan, Dakar, Conakry, Port-Etienne, Bamako, Thies or Kaolack, and the relative decline of
some of the most dynamic, pre-colonial areas like Porto-Novo, Abomey, Fuuta-Djalo, Kankan,
Agadez, Timbuktu, Casamance, Waalo, Fuuta Toro, Macina or Hausa land.
27
References
Acemoglu, Daron, Simon Johnson, James A. Robinson, The colonial origins of comparative
development: an empirical investigation, 2001, American Economic Review, 91(5), 1369-
1401
—, Reversal of fortune: Geography and Institutions in the Making of the Modern World
Income Distribution, 2002, Quaterly Journal of Economics, 117, 1231-1294
Acemoglu, Daron, Simon Johnson, Unbundling institutions, 2003, NBER Working Paper No.
9934
Aldashev, Gani, Imane Chaara, Jean-Philippe Platteau and Zaki Wahhaj, The Custom in the
Shadow of the Formal Law: An Economic Analysis, 2007, Working Paper, CRED, University
of Namur
Austin Gareth, Resources, Techniques and Strategies South of the Sahara, Revising the
Factor Endowments Perspective on African Economic Development, 1500-2000, 2008,
forthcoming in the Economic History Review
Bairoch, Paul, Economics and World History, Myths and Paradoxes, 1993, University of
Chicago Press
Banerjee, Abhijit, Lakshmi Iyer, History, Institutions and Economic Performance: the legacy
of colonial tenure systems in India, 2005, American Economic Review, 95(4), 1190-1213
Banerjee, Abhijit, Lakshmi Iyer and Rohini Somanathan, Public Action for Public Goods,
2006, forthcoming in Handbook of Development Economics, vol. 4
Barrett, G., Schism and Renewal in Africa, 1967, New York, Columbia University Press
Bertocchi, Graziella, Fabio Canova, Did colonization matter for growth? An empirical
exploration into the historical causes of Africa’s underdevelopment, 2001, European
Economic Review, 46, 1851-1871
Boahen, Adu A., L’Afrique sous la domination coloniale : 1885-1935, in Histoire générale de
l’Afrique, vol VII, 1990, UNESCO/NEA
28
Bouche, Denise, Histoire de la colonisation française, 1991, Fayard
Brown, David S., Democracy, colonization and human capital in sub-saharian Africa, 2000,
Studies in Comparative International Development, 35(1)
Cogneau, Denis, Colonization, school and development in Africa, an empirical analysis,
2003, DIAL, DT/2003/01
Cogneau, Denis, Charlotte Guénard, Colonization, institutions and inequality, a note on some
suggestive evidence, 2003, DIAL, DT/2003/05
Cohen, William B., Empereurs sans sceptre, histoire des administrateurs de la France
d’Outre-mer et de l’Ecole coloniale, 1974, Berger-Levrault, Paris
Coquery-Vidrovitch, Catherine, A propos des investissements français outre-mer : l’exemple
de l’Ouest Africain, 1910-1965, 1973, Actes du IIe Congrès des historiens économistes
français, La position internationale de la France, EHESS, p. 426
Coquery-Vidrovitch, Catherine & Henri Moniot, L’Afrique Noire de 1800 à nos jours, 1993,
PUF
Crowder, Michael, West Africa under colonial rule, 1968, Northern University Press
—, West African resistance, the military response to colonial occupation,
1971, Hutchinson of London, London
Crowder, Mickael, Obaro Ikime, West African chiefs: their changing status under colonial
rule and independence, 1970, Africana Publications, New York
Crosby Alfred, Ecological Imperialism; The Biological Expansion of Europe 900-1900, 1968,
New York: Cambridge University Press
Curtin, Philip, The image of Africa, 1964, Madison: University of Wisconsin Press
Curtin, Philip, Steven Feierman, Leonard Thompson, Jan Vansina, African history from
earliest times to independence, 1995, Longman Group Limited
29
Davis, Lance E. and Huttenback, Robert A., Mammon and the pursuit of empire: The political
economy of British imperialism, 1860–1912, 1987, Cambridge: Cambridge University Press
Diamond, Jared, Guns, Germs, and Steel, The Fate of Human Societies, 1997, W.W. Norton
& Company, March 1997
Engerman, Stanley L., Kenneth L. Sokoloff, Factor Endowments: Institutions, and
Differential Paths of Growth Among New World Economies: A View from Economic
Historians of the United States, 1997, in Stephen Haber, How Latin America Fell Behind,
Stanford: Stanford University Press
—, Factor Endowments, Inequality and Paths of Development Among New World Economies,
2002, NBER Working Paper No. 9259
—, Colonialism, inequality and long-run paths of development, 2005, NBER Working Paper
No 11057
Englebert, Pierre, Pre-colonial Institutions, Post-colonial States and Economic Development
in Tropical Africa, 2000, Political Research Quaterly, 53, 1-30.
Feyrer James, Bruce Sacerdote, Colonialism and Modern Income – Islands as Natural
Experiments, 2009, Review of Economics and Statistics, 91(2): 245-262
Frankema E.H.P., The colonial origins of inequality: exploring the causes and consequences
of land distribution, 2005, Ibero America Institute for Econ. Research (IAI) Discussion
Papers No. 119
Gennaioli, Nicola and Rainer, Ilia, The modern impact of precolonial centralization in Africa,
2007, Journal of Economic Growth.
Glaeser, Edward L., Rafael La Porta, Florencio Lopez-de-Silane and Andrei Shleifer, Do
Institutions Cause Growth?, 2004, NBER Working Paper No. 10568
Hall, Robert E., Charles I. Jones, Why do some countries produce so much more output per
worker than others?, 1999, Quarterly Journal of Economics, Vol. 114, No. 1, 83-116
Herbst, Jeffrey, States and power in africa, 2000, Princeton University Press, Princeton
30
Hilling, David, The Evolution of the Major Ports of West Africa, 1969, The geographical
Journal, Vol. 135, No. 3, pp. 365-378
Hoff, Karla, Paths of institutional development: a view from economic history, 2003, The
World Bank Research Observer, Oxford University Press
Huillery, Elise, History Matters: the Long Term Impact of Colonial Public Investments in
French West Africa, 2009, American Economic Journal - Applied Economics, 1(2): 176-215
Iyer Lakshmi, The long-term impact of colonial rule: evidence from India, 2005, Harvard
University, Harvard Business School Working Paper No. 05-041
Ki-Zerbo, Joseph, Histoire de l’Afrique Noire, d’Hier à Demain, 1978, Hatier, Paris
Malthus, Thomas, An Essay on the Principle of Population, as it Affects the Future
Improvement of Society with Remarks on the Speculations of Mr. Godwin, M. Condorcet, and
Other Writers London, 1798, printed for J. Johnson in St. Paul's Church-Yard
Jacques Marseille, La politique métropolitaine d’investissements coloniaux dans l’entre-deux
guerres, 1973, Actes du IIe Congrès des historiens économistes français, La position
internationale de la France, EHESS
McEvedy, Colin and Richard Jones, Atlas of World Population History, 1975, Facts on file,
New York
Morrison, Donald, R. Mitchell and J. Paden, Black Africa: A Comparative Handbook, 1989,
New York: Paragon House
Murdock, G., Ethnographic Atlas, 1967, Pittsburgh, University of Pittsburgh Press
North, Douglass C., Structure and Change in Economic History, 1981, NewYork, Norton &
Co
—, Institutions, Institutional change, and Economic Performance, 1990, NewYork,
Cambridge University Press
Nunn, Nathan, The Long Term Effects of Africa's Slave Trades, 2008, forthcoming in the
Quarterly Journal of Economics
31
32
Pande Rohini, Christopher Udry, Institutions and Development, A view from Below, 2005, to
appear in the Proceedings of the 9th World Congress of the Econometric Society, edited by R.
Blundell, W. Newey, and T. Persson, Cambridge University Press
Quy Toan Do, Lakshmi Iyer, Lands right and economic development: evidence from Viet
Nam, 2002, World Bank Policy Research Working Paper No. 3120
Rioux, Jean-Pierre (sous la direction de), Dictionnaire de la France Coloniale, 2007,
Flammarion
Rodrik, Dani, Arvind Subramanian, Francesco Trebbi, Institutions rule: the primacy of
institutions over geography and integration in economic development, 2002, Harvard
Sachs, Jeffrey and Andrew Warner, Natural Resource Abundance and Economic Growth,
1997, Development Discussion Papers, n° 517a, Harvard Institute for International
Development
Selllier Jean, Atlas des Peuples d’Afrique, 2003, Paris : La Découverte
Sokoloff, Kenneth L. & Stanley L. Engermann (2000), History Lessons: Institutions, Factor
Endowments, and Paths of Development in the New World, Journal of Economic
Perspectives, 14, 217-232
Stevenson, Robert F., Population and Political Systems in Tropical Africa, 1968, New York
and London: Columbia University Press

Map 1: 1925 Territorial Organization of the French West Africa: Colonies and Districts
Boffa Kindia
Forecariah Kissidougou
DabolaKouroussa
Gueckedou OuorodougouMacenta
Odienne
Guiglo
Gouros
Dori
SayKoudougou
Assinie
Indenie
LahouSassandra
Daloa
Baoule
Bondoukou
Satadougou
Tambacounda
Kolda
Kong
Matam
Kayes
Ziguinchor
Bignona
DakarThies
Koutiala
Sikasso
Segou
Gaoua
OuagadougouTenkodogo
DossoTessaoua
Zinder
Nema Goundam
Baiedulevrier
Trarza
Dagana
Bandiagara
Niafunke
Mopti
Nguigmi
Fada
Ouahigouya
Agneby
Man
Tabou
Boke
Koumbia
Pita
Siguiri
Adrar
Assaba
Brakna
Gorgol Nioro
Tagant
Bafoulabe
Bamako
GaoGourma
NaraNioro
San
Tombouctou
Agadez
Bilma
Goure
KonnyNiamey
Tahoua
Louga
Podor
Map 2: 1910 Population Density
Source: Author’s computations based on colonial censuses, Archives Nationales, Paris.

Map 3: Hostility Towards Colonial Power as Measured by H3*
Hostility Index
3 to 4.2 (9)1.8 to 3 (19)1 to 1.8 (23)0.6 to 1 (20)0.4 to 0.6 (16)0 to 0.4 (28)
Source: Author’s computations based on colonial annual political reports over 1906-1920 * Average annual number of severe events expressing hostility over 1906-1920
34
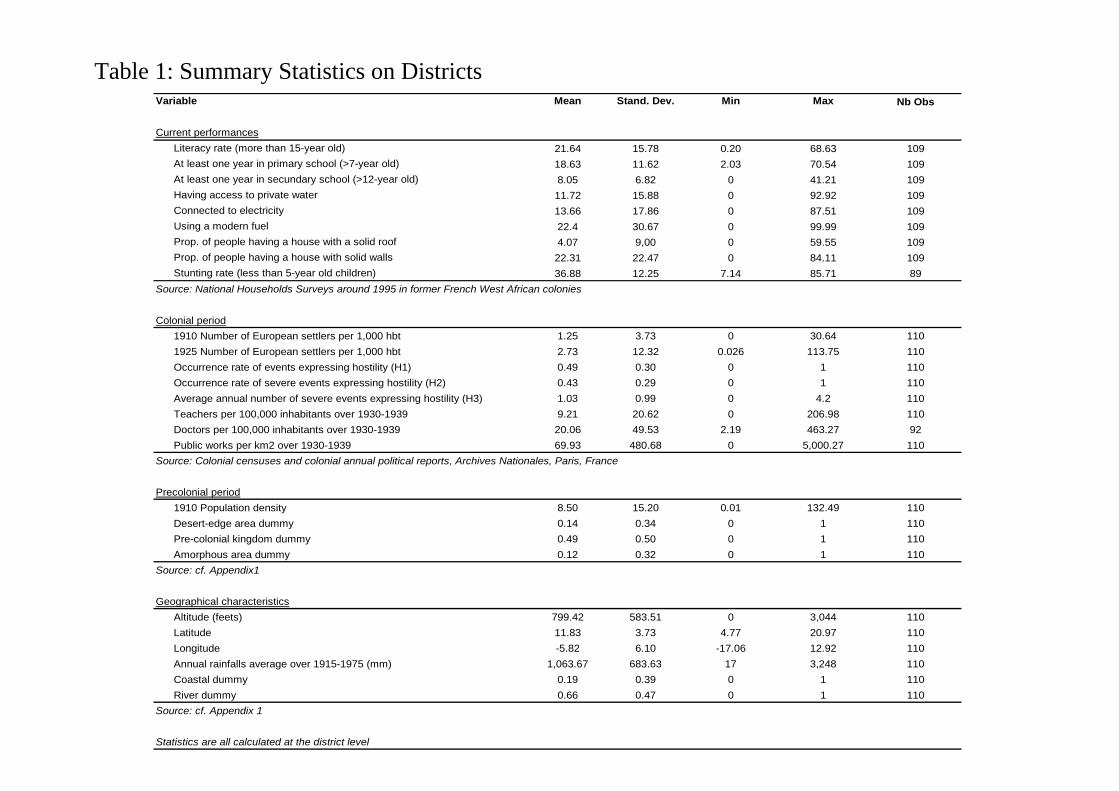
Table 1: Summary Statistics on Districts
Variable Mean Stand. Dev. Min Max Nb Obs
Current performances
Literacy rate (more than 15-year old) 21.64 15.78 0.20 68.63 109
At least one year in primary school (>7-year old) 18.63 11.62 2.03 70.54 109
At least one year in secundary school (>12-year old) 8.05 6.82 0 41.21 109
Having access to private water 11.72 15.88 0 92.92 109
Connected to electricity 13.66 17.86 0 87.51 109
Using a modern fuel 22.4 30.67 0 99.99 109
Prop. of people having a house with a solid roof 4.07 9,00 0 59.55 109
Prop. of people having a house with solid walls 22.31 22.47 0 84.11 109
Stunting rate (less than 5-year old children) 36.88 12.25 7.14 85.71 89
Source: National Households Surveys around 1995 in former French West African colonies
Colonial period
1910 Number of European settlers per 1,000 hbt 1.25 3.73 0 30.64 110
1925 Number of European settlers per 1,000 hbt 2.73 12.32 0.026 113.75 110
Occurrence rate of events expressing hostility (H1) 0.49 0.30 0 1 110
Occurrence rate of severe events expressing hostility (H2) 0.43 0.29 0 1 110
Average annual number of severe events expressing hostility (H3) 1.03 0.99 0 4.2 110
Teachers per 100,000 inhabitants over 1930-1939 9.21 20.62 0 206.98 110
Doctors per 100,000 inhabitants over 1930-1939 20.06 49.53 2.19 463.27 92
Public works per km2 over 1930-1939 69.93 480.68 0 5,000.27 110
Source: Colonial censuses and colonial annual political reports, Archives Nationales, Paris, France
Precolonial period
1910 Population density 8.50 15.20 0.01 132.49 110
Desert-edge area dummy 0.14 0.34 0 1 110
Pre-colonial kingdom dummy 0.49 0.50 0 1 110
Amorphous area dummy 0.12 0.32 0 1 110
Source: cf. Appendix1
Geographical characteristics
Altitude (feets) 799.42 583.51 0 3,044 110
Latitude 11.83 3.73 4.77 20.97 110
Longitude -5.82 6.10 -17.06 12.92 110
Annual rainfalls average over 1915-1975 (mm) 1,063.67 683.63 17 3,248 110
Coastal dummy 0.19 0.39 0 1 110
River dummy 0.66 0.47 0 1 110
Source: cf. Appendix 1
Statistics are all calculated at the district level

Table 2: The Determinants of 1925 European Settlement
Independant variables (1) (2) (3) (4) (5)
1910 Population density 0.10*** 0.12*** 0.07** 0.35***(0.037) (0.04) (0.037) (0.067)
Desert-edge area dummy 2.78* 4.81*** 3.13 13.33***(1.62) (1.76) (2.06) (3.30)
Hostility (H3) -0.74 -1.59*** 1.36** 1.00(0.57) (0.60) (0,68) (0.74)
1910 Population density*Hostility (H3) -0.14***(0.03)
Desert-edge area dummy*Hostility (H3) -5.41***(1.51)
Nb Obs 110 110 110 110 110R2 0.08 0.02 0.14 0.31 0.47
Control VariablesIntial political status No No No Yes YesGeographical characteristics No No No Yes Yes
Standard error in parentheses. *** significant at the 1% level, ** significant at the 5% level, * significant at the 10% level.Each cell represents the coefficient from an OLS regression of the dependent variable on the independent variable.Itinial political status variables are: Kingdom dummy and Acephalous area dummy.Geographical characteristics variables are: average annual precipitations over 1910-1970, altitude, longitude, latitude, navigable river dummy a
Dependent variable: Europeans per 1 000 hbts in 1925
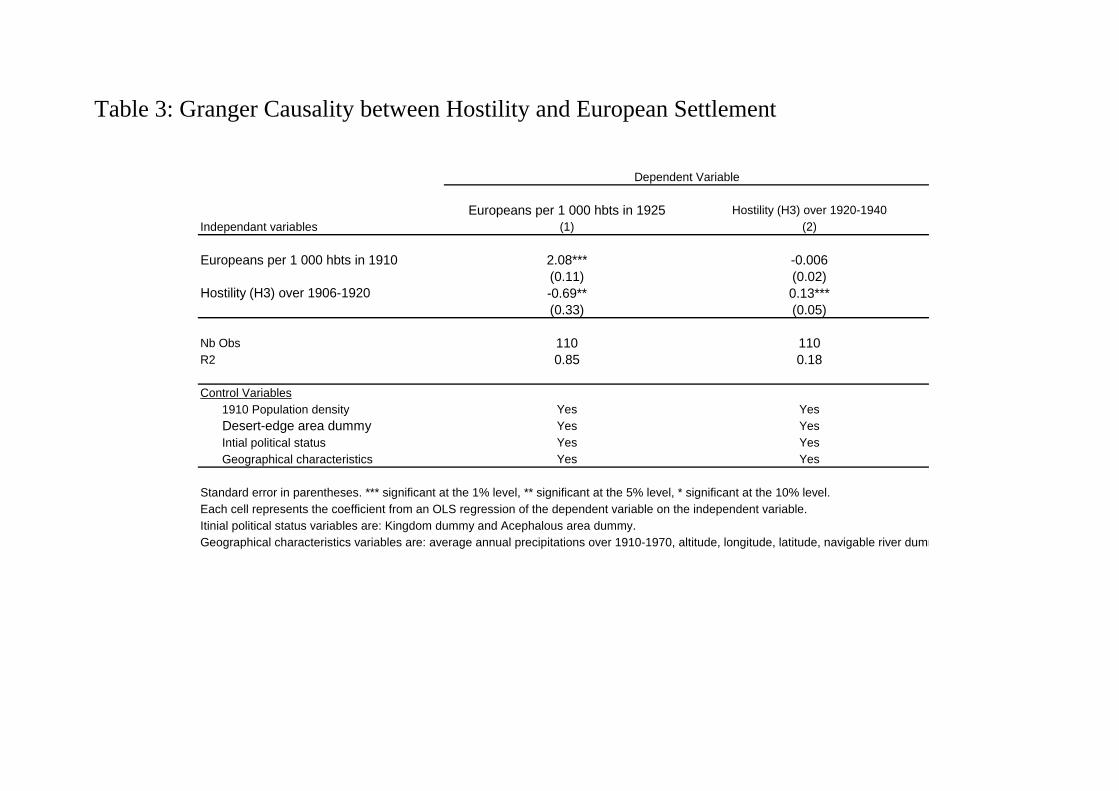
Table 3: Granger Causality between Hostility and European Settlement
Europeans per 1 000 hbts in 1925 Hostility (H3) over 1920-1940Independant variables (1) (2)
Europeans per 1 000 hbts in 1910 2.08*** -0.006(0.11) (0.02)
Hostility (H3) over 1906-1920 -0.69** 0.13***(0.33) (0.05)
Nb Obs 110 110R2 0.85 0.18
Control Variables1910 Population density Yes YesDesert-edge area dummy Yes YesIntial political status Yes YesGeographical characteristics Yes Yes
Standard error in parentheses. *** significant at the 1% level, ** significant at the 5% level, * significant at the 10% level.Each cell represents the coefficient from an OLS regression of the dependent variable on the independent variable.Itinial political status variables are: Kingdom dummy and Acephalous area dummy.Geographical characteristics variables are: average annual precipitations over 1910-1970, altitude, longitude, latitude, navigable river dumm
Dependent Variable
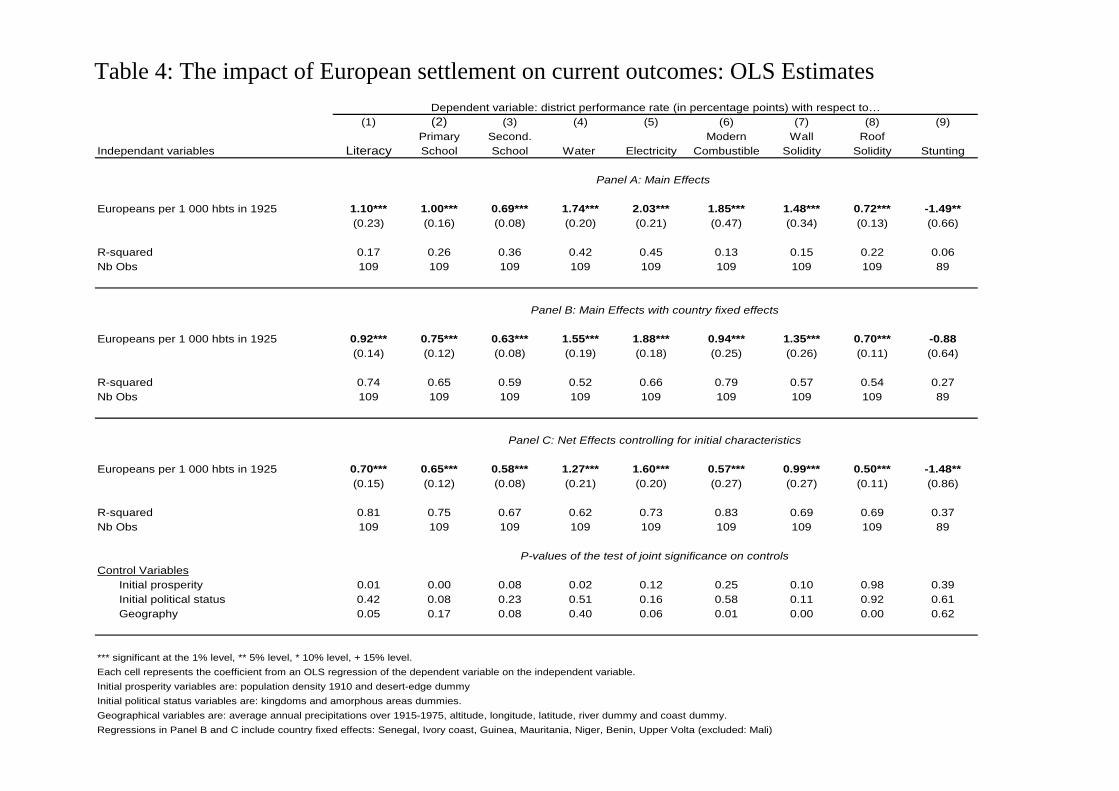
Table 4: The impact of European settlement on current outcomes: OLS Estimates
(1) (2) (3) (4) (5) (6) (7) (8) (9)Primary Second. Modern Wall Roof
Independant variables Literacy School School Water Electricity Combustible Solidity Solidity Stunting
Europeans per 1 000 hbts in 1925 1.10*** 1.00*** 0.69*** 1.74*** 2.03*** 1.85*** 1.48*** 0.72*** -1.49**(0.23) (0.16) (0.08) (0.20) (0.21) (0.47) (0.34) (0.13) (0.66)
R-squared 0.17 0.26 0.36 0.42 0.45 0.13 0.15 0.22 0.06Nb Obs 109 109 109 109 109 109 109 109 89
Europeans per 1 000 hbts in 1925 0.92*** 0.75*** 0.63*** 1.55*** 1.88*** 0.94*** 1.35*** 0.70*** -0.88(0.14) (0.12) (0.08) (0.19) (0.18) (0.25) (0.26) (0.11) (0.64)
R-squared 0.74 0.65 0.59 0.52 0.66 0.79 0.57 0.54 0.27Nb Obs 109 109 109 109 109 109 109 109 89
Europeans per 1 000 hbts in 1925 0.70*** 0.65*** 0.58*** 1.27*** 1.60*** 0.57*** 0.99*** 0.50*** -1.48**(0.15) (0.12) (0.08) (0.21) (0.20) (0.27) (0.27) (0.11) (0.86)
R-squared 0.81 0.75 0.67 0.62 0.73 0.83 0.69 0.69 0.37Nb Obs 109 109 109 109 109 109 109 109 89
Control VariablesInitial prosperity 0.01 0.00 0.08 0.02 0.12 0.25 0.10 0.98 0.39Initial political status 0.42 0.08 0.23 0.51 0.16 0.58 0.11 0.92 0.61Geography 0.05 0.17 0.08 0.40 0.06 0.01 0.00 0.00 0.62
*** significant at the 1% level, ** 5% level, * 10% level, + 15% level.
Each cell represents the coefficient from an OLS regression of the dependent variable on the independent variable.
Initial prosperity variables are: population density 1910 and desert-edge dummy
Initial political status variables are: kingdoms and amorphous areas dummies.
Geographical variables are: average annual precipitations over 1915-1975, altitude, longitude, latitude, river dummy and coast dummy.
Regressions in Panel B and C include country fixed effects: Senegal, Ivory coast, Guinea, Mauritania, Niger, Benin, Upper Volta (excluded: Mali)
Dependent variable: district performance rate (in percentage points) with respect to…
Panel C: Net Effects controlling for initial characteristics
Panel A: Main Effects
Panel B: Main Effects with country fixed effects
P-values of the test of joint significance on controls

Table 5: The Observable Determinants of Early Hostility and Correlation with Later Hostility
Hostility H3 Hostility H3 Hostility H3 Hostility H3 Hostility H3Independant variables over 1906-1920 over 1920-1940 over 1920-1940 over 1940-1956 over 1940-1956
Hostility (H3) over 1906-1920 0.13*** 0.08 0.10* 0.01(0.05) (0.05) (0.06) (0.06)
Population density in 1910 0.013** 0.002 0.001 -0.004 -0.003(0.006) (0.003) (0.003) (0.004) (0.003)
Desertic area dummy 0.84*** -0.036 0.08 0.12 0.31(0.29) (0.15) (0.15) (0.19) (0.18)
Precolonial kingdom dummy 0.46*** 0.03 0.05 -0.03 0.01(0.17) (0.09) (0.08) (0.11) (0.10)
Acephalous area dummy 1.58*** -0.31* -0.37** 0.34* 0.23(0.27) (0.16) (0.15) (0.20) (0.18)
Altitude 0.00 0.00 0.00 0.00 0.00(0.00) (0.00) (0.00) (0.00) (0.00)
Coastal dummy 0.22 0.19 0.10 0.10 -0.04(0.27) (0.14) (0.13) (0.17) (0.16)
River dummy 0.05 -0.10 -0.13 0.04 0.00(0.17) (0.09) (0.08) (0.11) (0.10)
Annual rainfalls 0.00036* 0.00 0.00 0.00 0.00(0.00021) (0.00) (0.00) (0.00) (0.00)
Latitude 0.14*** -0.03 -0.04* -0.01 -0.00(0.04) (0.02) (0.02) (0.03) (0.01)
longitude 0.06*** -0.02** -0.014* 0.005 0.01(0.02) (0.01) (0.008) (0.01) (0.01)
Casamance fixed effect 1.60** 2.64***(0.41) (0.50)
Nb Obs 110 110 110 110 110R2 0.45 0.18 0.29 0.17 0.35
*** significant at the 1% level, ** 5% level, * 10% level, + 15% level.Each cell represents the coefficient from an OLS regression of the dependent variable on the independent variable.Hostility (H3) is the average annual number of severe events expressing hostility
Dependent variable
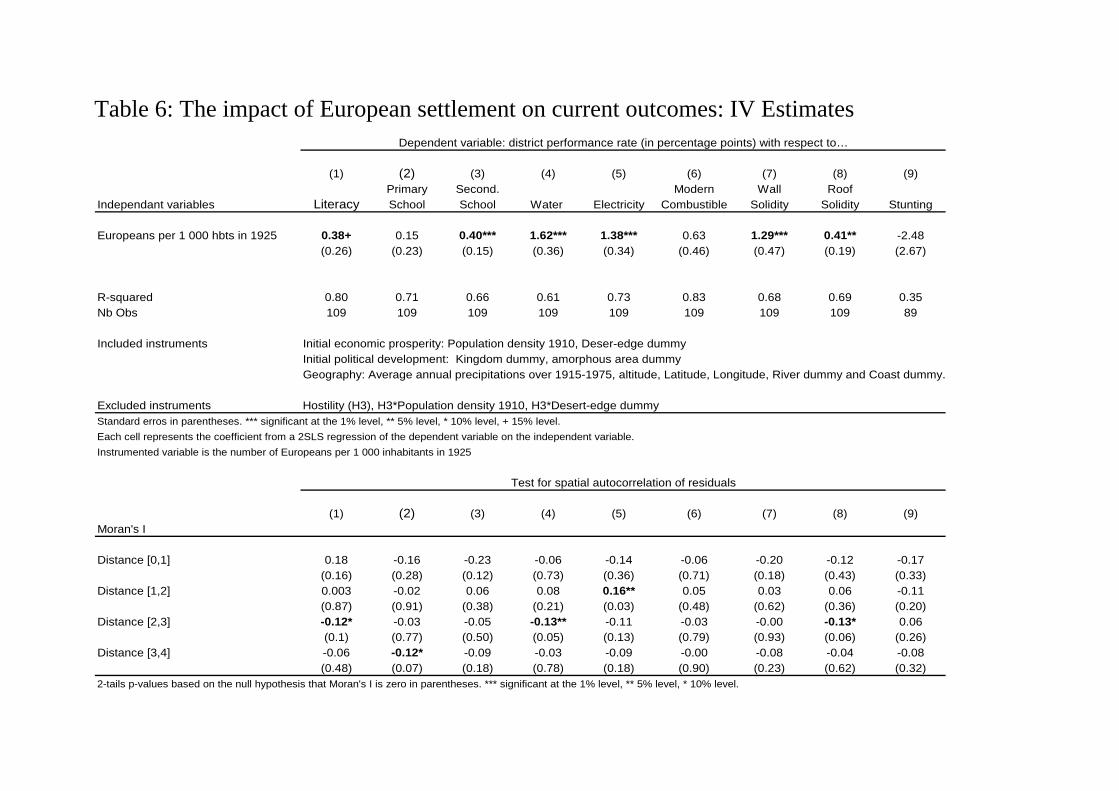
Table 6: The impact of European settlement on current outcomes: IV Estimates
(1) (2) (3) (4) (5) (6) (7) (8) (9)Primary Second. Modern Wall Roof
Independant variables Literacy School School Water Electricity Combustible Solidity Solidity Stunting
Europeans per 1 000 hbts in 1925 0.38+ 0.15 0.40*** 1.62*** 1.38*** 0.63 1.29*** 0.41** -2.48(0.26) (0.23) (0.15) (0.36) (0.34) (0.46) (0.47) (0.19) (2.67)
R-squared 0.80 0.71 0.66 0.61 0.73 0.83 0.68 0.69 0.35Nb Obs 109 109 109 109 109 109 109 109 89
Included instruments Initial economic prosperity: Population density 1910, Deser-edge dummyInitial political development: Kingdom dummy, amorphous area dummyGeography: Average annual precipitations over 1915-1975, altitude, Latitude, Longitude, River dummy and Coast dummy.
Excluded instruments Hostility (H3), H3*Population density 1910, H3*Desert-edge dummyStandard erros in parentheses. *** significant at the 1% level, ** 5% level, * 10% level, + 15% level.
Each cell represents the coefficient from a 2SLS regression of the dependent variable on the independent variable.
Instrumented variable is the number of Europeans per 1 000 inhabitants in 1925
(1) (2) (3) (4) (5) (6) (7) (8) (9)Moran's I
Distance [0,1] 0.18 -0.16 -0.23 -0.06 -0.14 -0.06 -0.20 -0.12 -0.17(0.16) (0.28) (0.12) (0.73) (0.36) (0.71) (0.18) (0.43) (0.33)
Distance [1,2] 0.003 -0.02 0.06 0.08 0.16** 0.05 0.03 0.06 -0.11(0.87) (0.91) (0.38) (0.21) (0.03) (0.48) (0.62) (0.36) (0.20)
Distance [2,3] -0.12* -0.03 -0.05 -0.13** -0.11 -0.03 -0.00 -0.13* 0.06(0.1) (0.77) (0.50) (0.05) (0.13) (0.79) (0.93) (0.06) (0.26)
Distance [3,4] -0.06 -0.12* -0.09 -0.03 -0.09 -0.00 -0.08 -0.04 -0.08(0.48) (0.07) (0.18) (0.78) (0.18) (0.90) (0.23) (0.62) (0.32)
2-tails p-values based on the null hypothesis that Moran's I is zero in parentheses. *** significant at the 1% level, ** 5% level, * 10% level.
Dependent variable: district performance rate (in percentage points) with respect to…
Test for spatial autocorrelation of residuals

Table 7: Did prosperous pre-colonial areas fall behind?
Literacy Attended Attended Water tap Electricity Modern Solid Wall Solid Roof StuntingIndependant variables Primary School Second. School Combustible
Population density in 1910 0.25*** 0.20*** 0.14*** 0.39*** 0.38*** 0.05 0.33*** 0.08 0.16(0.07) (0.5) (0,04) (0.1) (0.11) (0.11) (0.12) (0.05) (0.18)
Desertic area dummy 10.05*** 10.54*** 3.03 12.28** 8.69* 12.11** 6.88 5.34** -7.71(3.2) (2.67) (1.96) (4.74) (5.21) (5.50) (5.97) (2.62) (4.70)
Nb Obs 109 109 109 109 109 109 109 109 89R2 0.68 0.62 0.40 0.38 0.39 0.77 0.49 0.39 0.29Initial political controls NO NO NO NO NO NO NO NO NOGeographical controls NO NO NO NO NO NO NO NO NO
Population density in 1910 0.12* 0.12** 0.08* 0.26** 0.22** -0.11 0.12 0.03 0.14(0.07) (0.58) (0,04) (0.1) (0.11) (0.11) (0.12) (0.05) (0.19)
Desertic area dummy 9.96** 11.74*** 3.88 8.83 6.57 8.19 13.83 0.73 -6.42(3.93) (3.35) (2.45) (5.88) (6.16) (6.50) (6.85) (2.84) (6.54)
Nb Obs 109 109 109 109 109 109 109 109 89R2 0.76 0.68 0.50 0.47 0.39 0.83 0.64 0.61 0.34Initial political controls YES YES YES YES YES YES YES YES YESGeographical controls YES YES YES YES YES YES YES YES YES
Standards errors in parentheses. *** significant at the 1% level, ** 5% level, * 10% level, + 15% level.Each cell represents the coefficient from an OLS regression of the dependent variable on the independent variable.Initial political controls are: kingdom dummy and amorphous area dummy. Geographical controls are: average annual precipitations over 1910-1970, altitude, longitude, latitude, navigable river dummy and coast dummy.Each regressions include country fixed effects.
Panel B : Adding geographical and political controls
Dependent variable: district performance rate with respect to…
Panel A : Precolonial prosperity variables
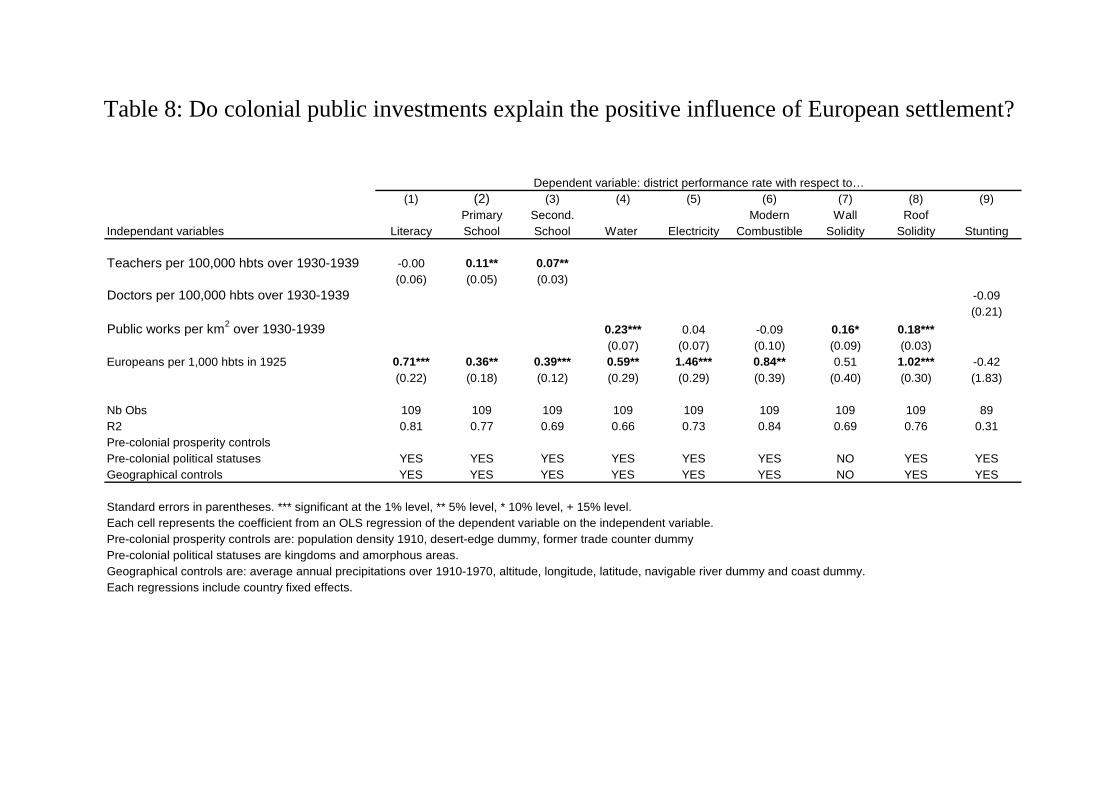
Table 8: Do colonial public investments explain the positive influence of European settlement?
(1) (2) (3) (4) (5) (6) (7) (8) (9)Primary Second. Modern Wall Roof
Independant variables Literacy School School Water Electricity Combustible Solidity Solidity Stunting
Teachers per 100,000 hbts over 1930-1939 -0.00 0.11** 0.07**(0.06) (0.05) (0.03)
Doctors per 100,000 hbts over 1930-1939 -0.09(0.21)
Public works per km2 over 1930-1939 0.23*** 0.04 -0.09 0.16* 0.18***(0.07) (0.07) (0.10) (0.09) (0.03)
Europeans per 1,000 hbts in 1925 0.71*** 0.36** 0.39*** 0.59** 1.46*** 0.84** 0.51 1.02*** -0.42(0.22) (0.18) (0.12) (0.29) (0.29) (0.39) (0.40) (0.30) (1.83)
Nb Obs 109 109 109 109 109 109 109 109 89R2 0.81 0.77 0.69 0.66 0.73 0.84 0.69 0.76 0.31Pre-colonial prosperity controlsPre-colonial political statuses YES YES YES YES YES YES NO YES YESGeographical controls YES YES YES YES YES YES NO YES YES
Standard errors in parentheses. *** significant at the 1% level, ** 5% level, * 10% level, + 15% level.Each cell represents the coefficient from an OLS regression of the dependent variable on the independent variable.Pre-colonial prosperity controls are: population density 1910, desert-edge dummy, former trade counter dummyPre-colonial political statuses are kingdoms and amorphous areas.Geographical controls are: average annual precipitations over 1910-1970, altitude, longitude, latitude, navigable river dummy and coast dummy.Each regressions include country fixed effects.
Dependent variable: district performance rate with respect to…
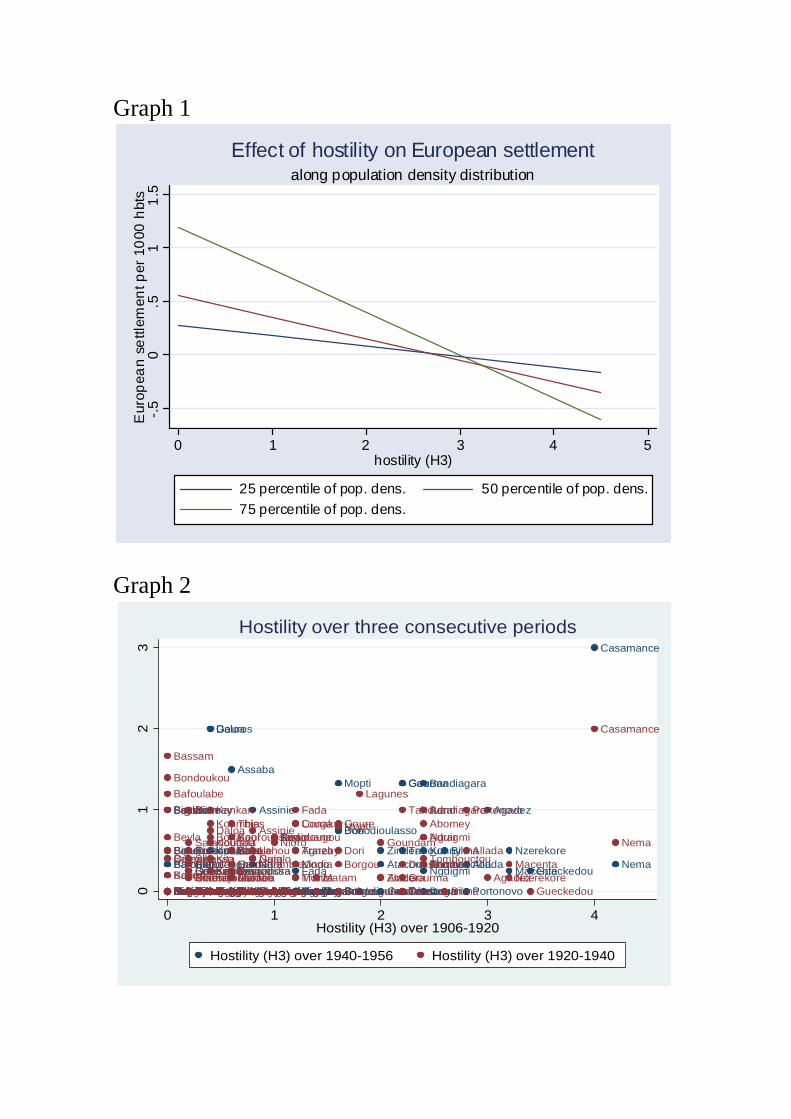
Graph 1
-.5
0.5
11
.5E
urop
ean
settl
emen
t per
10
00 h
bts
0 1 2 3 4 5hostility (H3)
25 percentile of pop. dens. 50 percentile of pop. dens.
75 percentile of pop. dens.
along population density distribution
Effect of hostility on European settlement
Graph 2
Kayes
SiguiriBondoukou
MacinaIndenieBougouniNiafunkeOdienne
Beyla
SeguelaBakel
Bamako
Bassam
Bafoulabe
BaiedulevrierSikassoSinesaloumGaoua
ForecariahSatadougou
DjougouDabola
Ouahigouya
GuidimakaCotonouPita
Niamey
Boke
Segou
Koumbia
SavalouTambacoundaNzicomoeKita
Kankan
Gouros
KoudougouKongTagouanasKoutialaGorgolTabou
Daloa
BoffaTenkodogo
KayaOuidah
SassandraLabe
Kouroussa
OuagadougouThiesBrakna
Assaba
HautegambieBaolBaouleMamouMoyenniger
Assinie
Lahou
Nara
GuigloSanDedougouPodorManTivaouane
Say
KissidougouNioroAgneby
Trarza
LougaKindia
Fada
Conakry
Mono
MatamTagant
Dori
Goure
Bobodioulasso
Borgou
Mopti
Lagunes
ZinderAtacora
Goundam
Gao
DossoTessaoua
Gourma
TahouaAbomey
Dagana
Nguigmi
Konny
Bandiagara
Tombouctou
Adrar
BilmaAllada
Portonovo
Agadez
Nzerekore
MacentaGueckedou
Casamance
Nema
Bafoulabe
Siguiri
Bondoukou
Kayes
Seguela
Beyla
Bamako
Bougouni
Bakel
Indenie
Bassam
MacinaNiafunke
OdienneGuidimaka
CotonouDabolaSikasso
Djougou
Pita
Satadougou
Forecariah
Boke
SinesaloumNiameyBaiedulevrier
Gaoua
OuahigouyaSegou
Koumbia
Gouros
Koutiala
Gorgol
Kankan
SavalouNzicomoeTambacoundaKongTabou
Daloa
Koudougou
Boffa
Kita
Tagouanas
Kaya
Baol
Hautegambie
Ouagadougou
Thies
AssabaMamouSassandraOuidahBraknaTenkodogo
LabeBaouleKouroussa
Assinie
Guiglo
San
LahouNara
MoyennigerSay
PodorNioro
Dedougou
Tivaouane
Man
Kissidougou
Trarza
Conakry
KindiaMono
LougaFada
Agneby
TagantMatam
DoriBorgou
Bobodioulasso
GoureMopti
Lagunes
Atacora
Goundam
ZinderGourmaDosso
Tahoua
GaoTessaoua
Dagana
BandiagaraAbomey
KonnyTombouctou
NguigmiAdrar
Bilma
Portonovo
Allada
AgadezNzerekoreMacenta
Gueckedou
Casamance
Nema
01
23
0 1 2 3 4Hostility (H3) over 1906-1920
Hostility (H3) over 1940-1956 Hostility (H3) over 1920-1940
Hostility over three consecutive periods
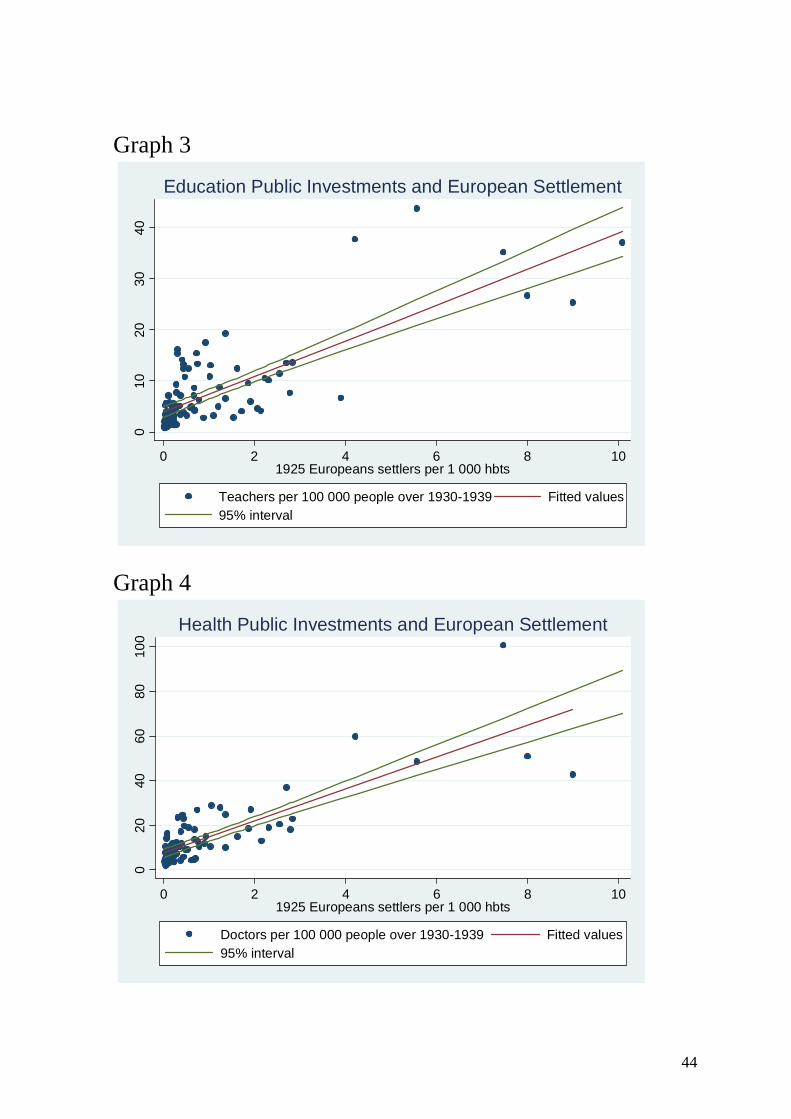
Graph 3 0
1020
3040
0 2 4 6 8 101925 Europeans settlers per 1 000 hbts
Teachers per 100 000 people over 1930-1939 Fitted values95% interval
Education Public Investments and European Settlement
Graph 4
020
4060
8010
0
0 2 4 6 8 101925 Europeans settlers per 1 000 hbts
Doctors per 100 000 people over 1930-1939 Fitted values95% interval
Health Public Investments and European Settlement
44

45
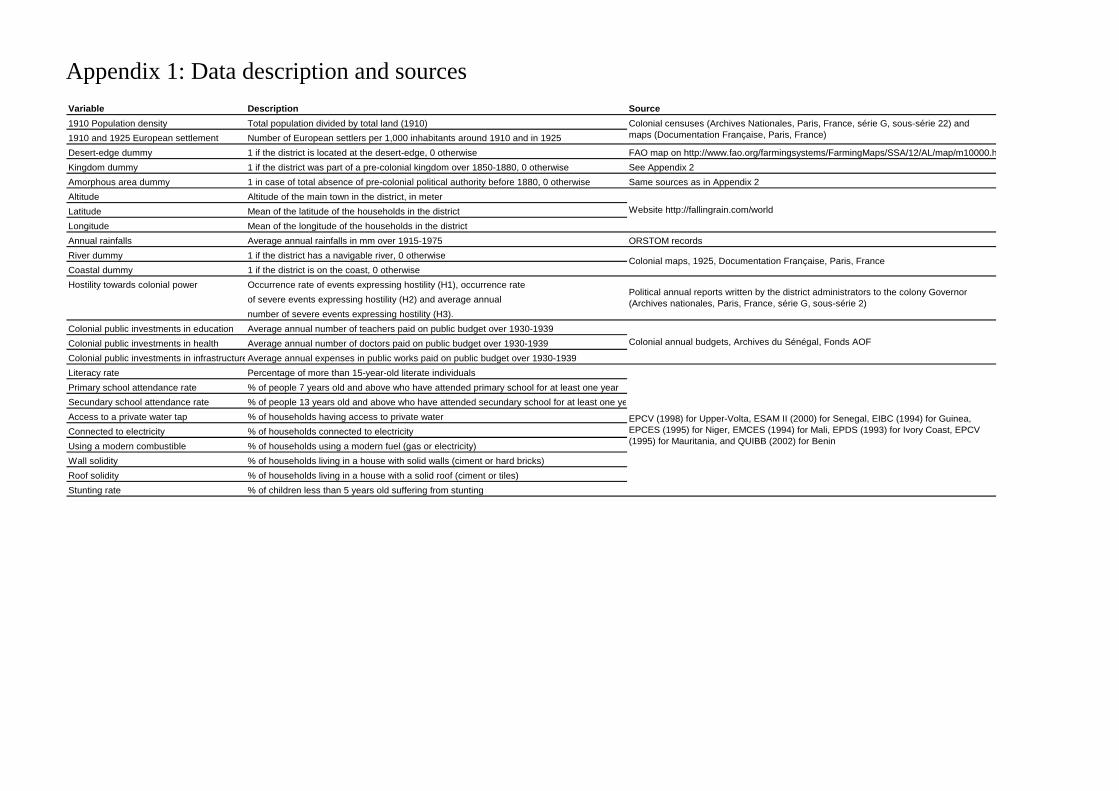
Appendix 1: Data description and sources Variable Description Source1910 Population density Total population divided by total land (1910)
1910 and 1925 European settlement Number of European settlers per 1,000 inhabitants around 1910 and in 1925
Desert-edge dummy 1 if the district is located at the desert-edge, 0 otherwise
Kingdom dummy 1 if the district was part of a pre-colonial kingdom over 1850-1880, 0 otherwise
Amorphous area dummy 1 in case of total absence of pre-colonial political authority before 1880, 0 otherwise
Altitude Altitude of the main town in the district, in meter
Latitude Mean of the latitude of the households in the district
Longitude Mean of the longitude of the households in the district
Annual rainfalls Average annual rainfalls in mm over 1915-1975
River dummy 1 if the district has a navigable river, 0 otherwise
Coastal dummy 1 if the district is on the coast, 0 otherwise
Hostility towards colonial power Occurrence rate of events expressing hostility (H1), occurrence rate
of severe events expressing hostility (H2) and average annual
number of severe events expressing hostility (H3).
Colonial public investments in education Average annual number of teachers paid on public budget over 1930-1939
Colonial public investments in health Average annual number of doctors paid on public budget over 1930-1939
Colonial public investments in infrastructureAverage annual expenses in public works paid on public budget over 1930-1939
Literacy rate Percentage of more than 15-year-old literate individuals
Primary school attendance rate % of people 7 years old and above who have attended primary school for at least one year
Secundary school attendance rate % of people 13 years old and above who have attended secundary school for at least one ye
Access to a private water tap % of households having access to private water
Connected to electricity % of households connected to electricity
Using a modern combustible % of households using a modern fuel (gas or electricity)
Wall solidity % of households living in a house with solid walls (ciment or hard bricks)
Roof solidity % of households living in a house with a solid roof (ciment or tiles)
Stunting rate % of children less than 5 years old suffering from stunting
Colonial censuses (Archives Nationales, Paris, France, série G, sous-série 22) and maps (Documentation Française, Paris, France)
FAO map on http://www.fao.org/farmingsystems/FarmingMaps/SSA/12/AL/map/m10000.h
See Appendix 2
Same sources as in Appendix 2
Colonial annual budgets, Archives du Sénégal, Fonds AOF
EPCV (1998) for Upper-Volta, ESAM II (2000) for Senegal, EIBC (1994) for Guinea, EPCES (1995) for Niger, EMCES (1994) for Mali, EPDS (1993) for Ivory Coast, EPCV (1995) for Mauritania, and QUIBB (2002) for Benin
ORSTOM records
Website http://fallingrain.com/world
Colonial maps, 1925, Documentation Française, Paris, France
Political annual reports written by the district administrators to the colony Governor (Archives nationales, Paris, France, série G, sous-série 2)
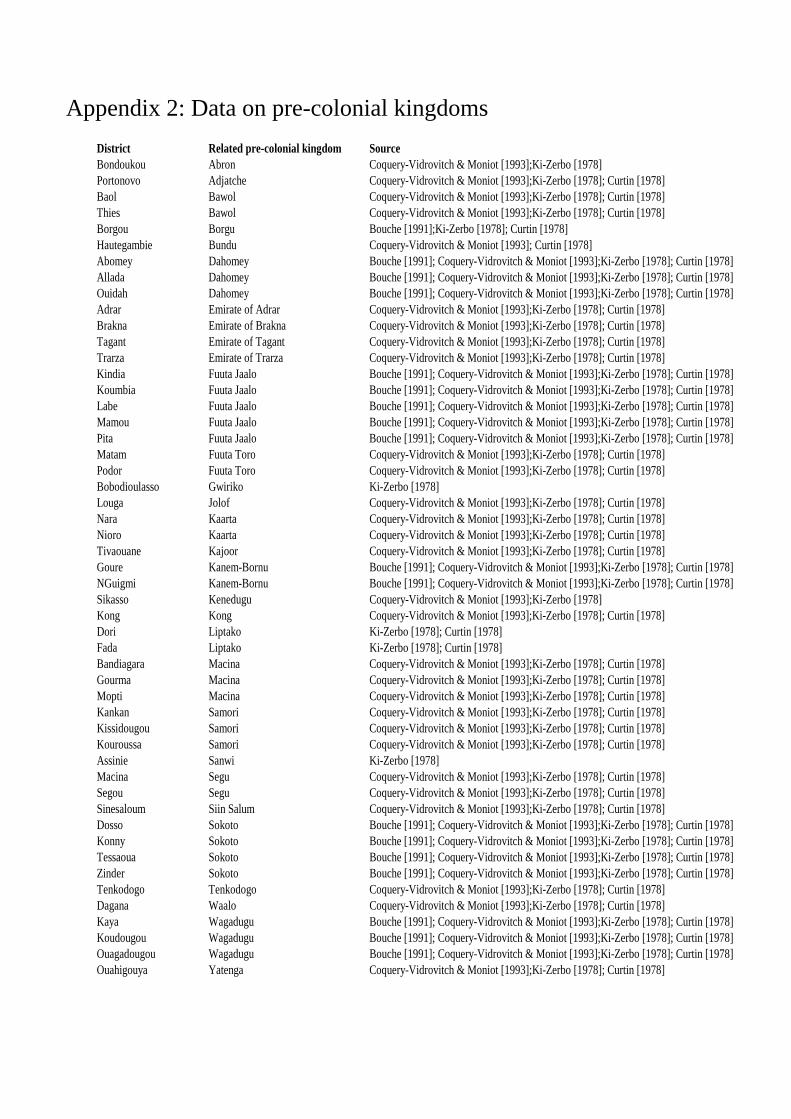
Appendix 2: Data on pre-colonial kingdoms District Related pre-colonial kingdom Source Bondoukou Abron Coquery-Vidrovitch & Moniot [1993];Ki-Zerbo [1978]Portonovo Adjatche Coquery-Vidrovitch & Moniot [1993];Ki-Zerbo [1978]; Curtin [1978]Baol Bawol Coquery-Vidrovitch & Moniot [1993];Ki-Zerbo [1978]; Curtin [1978]Thies Bawol Coquery-Vidrovitch & Moniot [1993];Ki-Zerbo [1978]; Curtin [1978]Borgou Borgu Bouche [1991];Ki-Zerbo [1978]; Curtin [1978]Hautegambie Bundu Coquery-Vidrovitch & Moniot [1993]; Curtin [1978]Abomey Dahomey Bouche [1991]; Coquery-Vidrovitch & Moniot [1993];Ki-Zerbo [1978]; Curtin [1978]Allada Dahomey Bouche [1991]; Coquery-Vidrovitch & Moniot [1993];Ki-Zerbo [1978]; Curtin [1978]Ouidah Dahomey Bouche [1991]; Coquery-Vidrovitch & Moniot [1993];Ki-Zerbo [1978]; Curtin [1978]Adrar Emirate of Adrar Coquery-Vidrovitch & Moniot [1993];Ki-Zerbo [1978]; Curtin [1978]Brakna Emirate of Brakna Coquery-Vidrovitch & Moniot [1993];Ki-Zerbo [1978]; Curtin [1978]Tagant Emirate of Tagant Coquery-Vidrovitch & Moniot [1993];Ki-Zerbo [1978]; Curtin [1978]Trarza Emirate of Trarza Coquery-Vidrovitch & Moniot [1993];Ki-Zerbo [1978]; Curtin [1978]Kindia Fuuta Jaalo Bouche [1991]; Coquery-Vidrovitch & Moniot [1993];Ki-Zerbo [1978]; Curtin [1978]Koumbia Fuuta Jaalo Bouche [1991]; Coquery-Vidrovitch & Moniot [1993];Ki-Zerbo [1978]; Curtin [1978]Labe Fuuta Jaalo Bouche [1991]; Coquery-Vidrovitch & Moniot [1993];Ki-Zerbo [1978]; Curtin [1978]Mamou Fuuta Jaalo Bouche [1991]; Coquery-Vidrovitch & Moniot [1993];Ki-Zerbo [1978]; Curtin [1978]Pita Fuuta Jaalo Bouche [1991]; Coquery-Vidrovitch & Moniot [1993];Ki-Zerbo [1978]; Curtin [1978]Matam Fuuta Toro Coquery-Vidrovitch & Moniot [1993];Ki-Zerbo [1978]; Curtin [1978]Podor Fuuta Toro Coquery-Vidrovitch & Moniot [1993];Ki-Zerbo [1978]; Curtin [1978]Bobodioulasso Gwiriko Ki-Zerbo [1978]Louga Jolof Coquery-Vidrovitch & Moniot [1993];Ki-Zerbo [1978]; Curtin [1978]Nara Kaarta Coquery-Vidrovitch & Moniot [1993];Ki-Zerbo [1978]; Curtin [1978]Nioro Kaarta Coquery-Vidrovitch & Moniot [1993];Ki-Zerbo [1978]; Curtin [1978]Tivaouane Kajoor Coquery-Vidrovitch & Moniot [1993];Ki-Zerbo [1978]; Curtin [1978]Goure Kanem-Bornu Bouche [1991]; Coquery-Vidrovitch & Moniot [1993];Ki-Zerbo [1978]; Curtin [1978]NGuigmi Kanem-Bornu Bouche [1991]; Coquery-Vidrovitch & Moniot [1993];Ki-Zerbo [1978]; Curtin [1978]Sikasso Kenedugu Coquery-Vidrovitch & Moniot [1993];Ki-Zerbo [1978]Kong Kong Coquery-Vidrovitch & Moniot [1993];Ki-Zerbo [1978]; Curtin [1978]Dori Liptako Ki-Zerbo [1978]; Curtin [1978]Fada Liptako Ki-Zerbo [1978]; Curtin [1978]Bandiagara Macina Coquery-Vidrovitch & Moniot [1993];Ki-Zerbo [1978]; Curtin [1978]Gourma Macina Coquery-Vidrovitch & Moniot [1993];Ki-Zerbo [1978]; Curtin [1978]Mopti Macina Coquery-Vidrovitch & Moniot [1993];Ki-Zerbo [1978]; Curtin [1978]Kankan Samori Coquery-Vidrovitch & Moniot [1993];Ki-Zerbo [1978]; Curtin [1978]Kissidougou Samori Coquery-Vidrovitch & Moniot [1993];Ki-Zerbo [1978]; Curtin [1978]Kouroussa Samori Coquery-Vidrovitch & Moniot [1993];Ki-Zerbo [1978]; Curtin [1978]Assinie Sanwi Ki-Zerbo [1978]Macina Segu Coquery-Vidrovitch & Moniot [1993];Ki-Zerbo [1978]; Curtin [1978]Segou Segu Coquery-Vidrovitch & Moniot [1993];Ki-Zerbo [1978]; Curtin [1978]Sinesaloum Siin Salum Coquery-Vidrovitch & Moniot [1993];Ki-Zerbo [1978]; Curtin [1978]Dosso Sokoto Bouche [1991]; Coquery-Vidrovitch & Moniot [1993];Ki-Zerbo [1978]; Curtin [1978]Konny Sokoto Bouche [1991]; Coquery-Vidrovitch & Moniot [1993];Ki-Zerbo [1978]; Curtin [1978]Tessaoua Sokoto Bouche [1991]; Coquery-Vidrovitch & Moniot [1993];Ki-Zerbo [1978]; Curtin [1978]Zinder Sokoto Bouche [1991]; Coquery-Vidrovitch & Moniot [1993];Ki-Zerbo [1978]; Curtin [1978]Tenkodogo Tenkodogo Coquery-Vidrovitch & Moniot [1993];Ki-Zerbo [1978]; Curtin [1978]Dagana Waalo Coquery-Vidrovitch & Moniot [1993];Ki-Zerbo [1978]; Curtin [1978]Kaya Wagadugu Bouche [1991]; Coquery-Vidrovitch & Moniot [1993];Ki-Zerbo [1978]; Curtin [1978]Koudougou Wagadugu Bouche [1991]; Coquery-Vidrovitch & Moniot [1993];Ki-Zerbo [1978]; Curtin [1978]Ouagadougou Wagadugu Bouche [1991]; Coquery-Vidrovitch & Moniot [1993];Ki-Zerbo [1978]; Curtin [1978]Ouahigouya Yatenga Coquery-Vidrovitch & Moniot [1993];Ki-Zerbo [1978]; Curtin [1978]
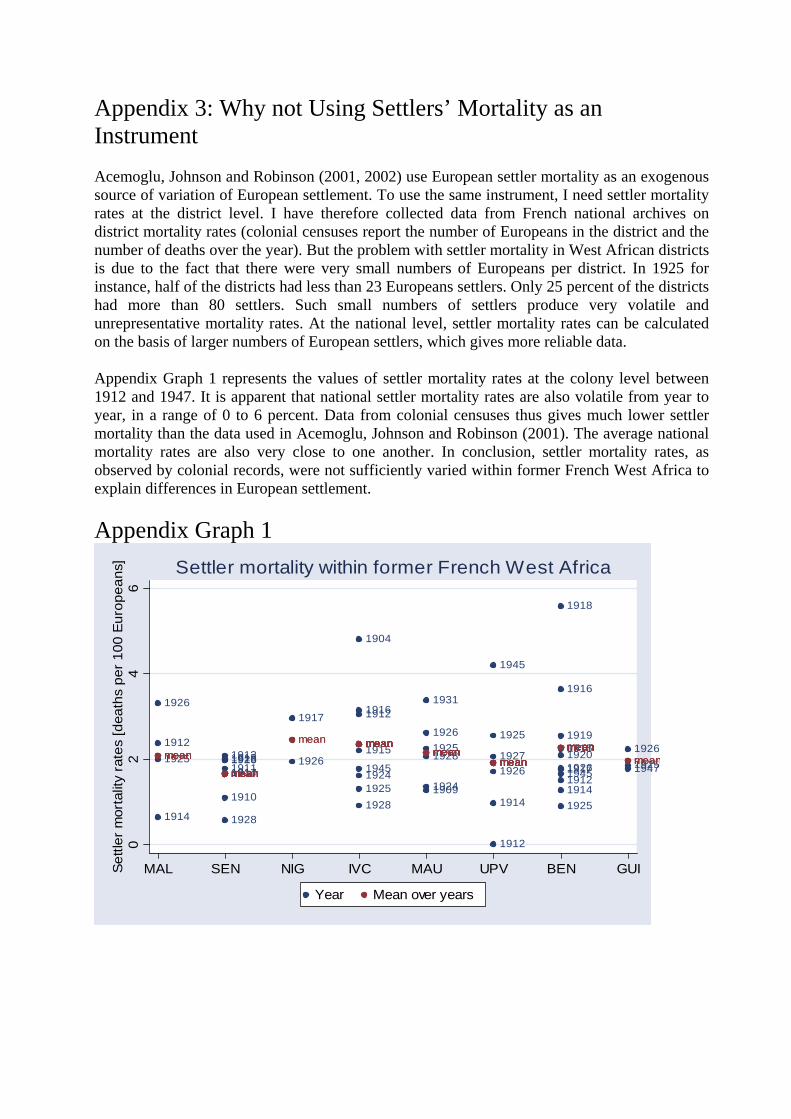
Appendix 3: Why not Using Settlers’ Mortality as an Instrument Acemoglu, Johnson and Robinson (2001, 2002) use European settler mortality as an exogenous source of variation of European settlement. To use the same instrument, I need settler mortality rates at the district level. I have therefore collected data from French national archives on district mortality rates (colonial censuses report the number of Europeans in the district and the number of deaths over the year). But the problem with settler mortality in West African districts is due to the fact that there were very small numbers of Europeans per district. In 1925 for instance, half of the districts had less than 23 Europeans settlers. Only 25 percent of the districts had more than 80 settlers. Such small numbers of settlers produce very volatile and unrepresentative mortality rates. At the national level, settler mortality rates can be calculated on the basis of larger numbers of European settlers, which gives more reliable data. Appendix Graph 1 represents the values of settler mortality rates at the colony level between 1912 and 1947. It is apparent that national settler mortality rates are also volatile from year to year, in a range of 0 to 6 percent. Data from colonial censuses thus gives much lower settler mortality than the data used in Acemoglu, Johnson and Robinson (2001). The average national mortality rates are also very close to one another. In conclusion, settler mortality rates, as observed by colonial records, were not sufficiently varied within former French West Africa to explain differences in European settlement.
Appendix Graph 1
1914
1925
1926
19121913
19171916
1910
19111914
1915
1928
1925
1917
1926
1904
19161912
1945
1915
19251924
1928
1926
1924
1925
1909
1931
1928 1927
1914
1912
1945
1926
1925
1916
1925
1920
1918
1919
1914
1915
1917191219261945
1926
19471925meanmeanmeanmean
meanmeanmeanmeanmeanmeanmeanmeanmean
meanmean meanmeanmeanmeanmeanmeanmeanmeanmeanmeanmeanmeanmeanmean
meanmeanmeanmeanmeanmean
meanmeanmeanmeanmeanmeanmeanmeanmeanmeanmeanmeanmeanmean
02
46
Se
ttle
r m
ort
alit
y ra
tes
[death
s p
er
100
Eu
rop
ea
ns]
MAL SEN NIG IVC MAU UPV BEN GUI
Year Mean over years
Settler mortality within former French West Africa