the impact of foreign direct investment and exports …
TRANSCRIPT

THE IMPACT OF FOREIGN DIRECT INVESTMENT AND EXPORTS ON
ECONOMIC GROWTH
CASE STUDY: COUNTRIES OF THE MENA REGION FROM 1980 TO 2011
by
Mohamed Abaid
B.A. in Economics, Tripoli University, 1996
M.S. in Economics, Tripoli University, 2005
A Research Paper
Submitted in Partial Fulfillment of the Requirements for the Master of Science Degree
Departments of Economics
in the Graduate School
Southern Illinois University at Carbondale
May, 2013
RESEARCH PAPER APPROVAL
THE IMPACT OF FOREIGN DIRECT INVESTMENT AND EXPORTS
ON ECONOMIC GROWTH
CASE STUDY: COUNTRIES OF THE MENA REGION FROM 1980 TO 2011
By
Mohamed Abaid
A Research Paper Submitted in Partial
Fulfillment of the Requirements
for the Degree of
Master of Science
in the field of Economics
Approved by:
Professor Kevin Sylwester
Graduate School
Southern Illinois University Carbondale
March 06, 2013
i
AN ABSTRACT OF THE RESEARCH PAPER OF
Mohamed Abaid, for the Master of Science in Economics at Southern Illinois University
Carbondale.
TITLE: The Impact of Foreign Direct Investment and Exports on Economic Growth
Case Study: Countries of the MENA Region from 1980 to 2011.
MAJOR PROFESSOR: Kevin Sylwester
This research investigates and empirically examines the effects of both Foreign Direct
Investment (FDI) and exports on the economic growth in fifteen MENA countries. The
methodology involves estimating an economic growth model using panel data of the period from
1980 to 2011. By applying the OLS and the fixed effects estimation methods, the results indicate
that exports have a significant positive effect on economic growth for MENA countries and the
oil-exporting MENA countries. On the other hand, FDI has a significant positive effect on
economic growth only in non-oil exporting MENA countries.
Keywords: Foreign Direct Investment (FDI), Exports, Economic Growth, Middle East and North
Africa (MENA), Panel Data, OLS, and Fixed effects.
ii
TABLE OF CONTENTS
ABSTRACT……………………………………………………………..……………………….i
LIST OF TABLES……………………………………….…….………….…………………….iii
LIST OF FIGURES…………………….…………….…………………………………………iv
1: INTRODUCTION…………………...………….…………………………….………..…….1
2: LITERATURE REVIEW…………………..………..………………………………..………3
3: TRENDS OF FDI INFLOW INTO THE WORLD..…………...……….………….….……...6
3.1: TOTAL FDI FLOWS INTO THE WORLD DURING THE PERIOD FROM
1980 TO 2011………………………………………………………..……………...…...6
3.2: TOTAL FDI FLOWS AND STOCK IN MENA REGION DURING THE PERIOD
FROM 1980 TO 2011..…………………………………………………………………. 8
4: DATA AND METHODOLOGY..….…………………………………………… …….…….11
4.1: THE MODEL...………....……..……………………………………………….…...11
4.2: DATA DESRIPTION………………..………………………………………….….13
5: EMPIRICAL RESULTS......……………………………………………………………….…15
6: CONCLUSIONS.……………………………….……………………………………………22
REFERENCES……………………………………………………………………….………….24
APPENDIX………………………...…………………………………….…………………...…26
VITA……………………………………………………………………..………………………27
iii
LIST OF TABLES
TABLE 1: FDI INFLOWS INTO THE WORLAD IN MILLIONS OF US$ AND IN
PERCENTAGE OF THE TOLAL ……………………………………………………..7
TABLE 2: SUMMARY STATISTICS………………………………………………………..…13
TABLE 3: CORRELATIONS MATRIX………………………………………………………..13
TABLE 4: THE REGRESSION RESULTS OF THE FIRST SPECIFICATION……………....16
TABLE 5: THE REGRESSION RESULTS OF THE SECOND SPECIFICATION…………...17
TABLE 6: THE REGRESSION RESULTS OF THE THIRD SPECIFICATION……………...19
TABLE 7: THE REGRESSION RESULTS OF THE THIRD SPECIFICATION FOR THE OIL
EXPORTING MENA COUNTRIES…………………………………………………...20
TABLE 8: THE REGRESSION RESULTS OF THE THIRD SPECIFICATION FOR THE
NON- OIL EXPORTING MENA COUNTRIES……………………………………...21
TABLE 9: LIST OF ANALYZED MENA REGION COUNTRIES………………….….……..26
TABLE 10: LIST OF ANALYZED THE OIL EXPORTING MENA COUNTRIES…..……....26
TABLE 11: LIST OF ANALYZED THE NON-OIL EXPORTING MENA COUNTRIES……26
iv
LIST OF FIGURES
FIGURE 1: TRENDS IN FDI INFLOW INTO THE WORLD FROM 1980 TO 2011…………..8
FIGURE 2: TRENDS IN FDI INFLOW INTO MENA COUNTRIES FROM 1980 TO 2011…..9
FIGURE 3: THE HIGHEST MENA COUNTRIES INWARD FDI STOCK DURING THE
PERIOD FROM 2002 TO 2011……………………………………………..……..10
FIGURE 4: THE LOWEST MENA COUNTRIES INWARD FDI STOCK DURING THE
PERIOD FROM 2002 TO 2011……………………………………………..……..10
FIGURE 5: TRENDS IN LOG OF GDP, FDI, EXPORTS, GROSS CAPITAL FORMATION,
AND LABOR FORCE INTO MENA FROM 1980TO 2011………………….…..14
1
1- INTRODUCTION
Foreign Direct Investment, or FDI, has become one of the most important economic
issues being studied today. Balasubramanyam (1996) and Atrayee & Hendrik (2006) suggest
that FDI has an important role in influencing the financing of the economy in particular and
on economic development in general. Since the eighties, developing countries have shown a
marked increase in their share of the total net flows of FDI under the changes associated with
the economic and international political environments. Khan (2007) found that FDI has
emerged as the most important source of external resource flows to developing countries, and
that it has a positive effect on the economy of the host country; Easterly and Levine (2001)
characterized FDI as consisting of the transfer of modern technology with its contribution to
the accumulation of capital, and as a way of raising the efficiency of human capital and
bringing about an increase in employment, productivity, trade, and economic growth.
The Middle East and North Africa, or MENA, is one of the world's most dynamic and
challenging areas. The MENA region is distinguished by its economic diversity which
includes both oil-rich economies such as those of Saudi Arabia and Libya, and countries with
abundant labor such as Algeria and Egypt. The fifteen MENA countries discussed in this
research are Algeria, Bahrain, Egypt, Iran, Israel, Jordan, Kuwait, Libya, Morocco, Qatar,
Saudi Arabia, Syria, Tunisia, Turkey, and the United Arab Emirates. MENA represents a
region with great economic potential in today's global marketplace. It was only in the late
1980s that serious efforts began to take shape in the MENA region to promote foreign trade
and attract FDI flows. Since the falling of oil prices in the late 1980s, it has become too risky
to rely on oil revenues to finance development programs. That risk has added momentum to
the creation of a more conducive environment for other development strategies including
export promotion and FDI inflows. Also, with the increasing global competition for FDI,
2
governments in the MENA region have focused their efforts on attracting further FDI inflows
and liberalizing their trade sectors. According to Darrat, Kherfi, and Soliman (2005), reforms
have generally included new FDI legislation as in Morocco in 1983 and in Egypt in 1989,
which were later subjected to major revisions in 1988 and 1995 in Morocco and in 1997 in
Egypt. Tunisia and Turkey also introduced new legislation to promote FDI in 1993 and in
1995, respectively, to eliminate restrictions facing FDI inflows.
The purpose of this research is to analyze the role of foreign direct investment and
exports in promoting economic growth in the MENA countries and the interactions of FDI
and exports with their economic growth. The research examines data from 15 developing
MENA countries over the last three decades. It is important to examine the linkages between
exports, FDI, and the economic growth of the MENA countries’ economies in order to
provide evidence as to whether rapid economic growth in this region is driven by exports and
FDI. The question to be addressed in this research is this: Have FDI and exports had any real
effect on economic growth in the MENA countries during the period 1980-2011?
The research is organized as follows: Section 2 provides a literature review, Section 3
presents the trends of FDI inflow into the world’s economies, Section 4 presents data and
methodology, Section 5 presents the estimation and the empirical results of the impact of FDI
and exports on economic growth, and Section 6 comprises the conclusion.
3
2- LITERATURE REVIEW
There are some studies that have explained and determined the relationship between the
inflows of foreign direct investment and economic growth. Most of them analyze the effect of
FDI inflows on the growth of national income along with other factors of production. On the
other hand, some of the new studies on economic growth conclude that FDI may affect not
only the level of output per capita but also the rate of growth. In general, they conclude that
FDI has many benefits to the host country, supporting economic growth by increasing
productivity and supplying capital, technology, and substitutes for imports and exports to
other countries.
A recent study by Tiwari and Mustacu (2011) examines the impact of FDI on economic
growth in Asian countries. The study investigates 23 countries during the period 1986-2008
using a panel data approach. The results of the paper show that both FDI and exports improve
the growth process, and that labor and capital play an important role in the growth of Asian
countries.
Nicet-Chenaf and Rougier (2011) measure both the effects of exports' diversification on
growth in MENA countries and the impact that new exports and FDI have on growth. The
differences between this study and the paper by Nicet and Rougier lie in the sample, the
period of the study, the methodology and the control variables used. They use a sample of
eight MENA countries over the period 1995-2004 (Algeria, Egypt, Israel, Jordan, Lebanon,
Morocco, Tunisia, and Turkey). Their model is estimated using the system-generalized
method of moments. Their study provides robust evidence that export discovery and FDI
stimulate GDP growth, and that FDI does not necessarily have a uniform effect on growth,
but that it varies according to the level of discovery of the country.
Ahmadi and Ghanbarzadey (2011) examine the Granger causality relations among the
GDP, FDI, and exports in MENA countries. The study constructs the empirical framework
4
using the three-variable panel VAR model for the period 1970-2008, using the Hausman test
and estimating the fixed effects panel data model to estimate the relations between the three
variables by making use of the panel VAR equations for Granger causality tests. The results
of their study reveal bidirectional causality relations among the three variables (the GDP,
FDI, and exports) for MENA countries.
Mehrara, Haghnejad, Dehnavi, and Meybodi (2010) investigate the causal relationships
among the GDP, exports and FDI inflows for 57 developing countries from 1981 to 2006. In
this study, Mehrara et al make use of panel unit roots tests, panel co-integration and the panel
generalized method of moments, or GMM. Their results show that exports and FDI inflows
Granger cause GDP, and also that exports and GDP Granger cause FDI inflows in the long
run. Also, the results provide evidence of short-run causality running from exports and FDI
inflows to GDP. Therefore, their study shows that GDP and FDI inflows do not cause exports
in both the short term and the long run.
Mohamed and Sidiropoulos’ (2010) paper investigates and analyzes the main
determinants of FDI in MENA countries. Their research covers the period 1975 -2006 for 36
countries that had been the major recipients of FDI among developing countries, 12 of which
were in the MENA region. Using a panel data methodology, the results show that the key
determinants of FDI inflows in MENA countries are the size of the economy of the host
country, the size of its government, its natural resources, and the institutional variable. The
paper concludes that countries that receive less FDI can make themselves more attractive to
FDI by removing all barriers to trade, developing their financial systems and building
appropriate and convenient institutions.
A study by Hussein (2009) examines and analyzes evidence pertaining to FDI in six
countries (Saudi Arabia, the United Arab Emirates, Oman, Qatar, Kuwait and Bahrain). The
paper goes on to identify the determinants of FDI in the Cooperation Council for the Arab
5
States of the Gulf, “GCC” countries, using recent growth theories and statistical techniques
to empirically test for the association between FDI and economic growth in the GCC
countries. Hussein’s results in this paper, obtained from data analysis, indicate a weak
relationship between FDI and GDP in the panel of the GCC.
Hsiao and Hsiao (2006) use time-series and panel data from 1986 to 2004 for eight
developing countries in Asia (China, Korea, Taiwan, Hong Kong, Singapore, Malaysia, The
Philippines, and Thailand) to examine the Granger causality relations between their GDPs,
exports, and FDIs. They estimate the VAR and VECM of the three variables using fixed
effects and random effects approaches. Their results show that FDI has unidirectional effects
on their GDPs directly and indirectly through exports.
Finally, a study by Darrat, Kherfi, and Soliman (2005) examines the possible impact of
FDI on economic growth in two contrasting regions, Central and Eastern Europe, or CEE,
and MENA. They examine the link between FDI and growth in 6 MENA and 17 CEE
countries, using data from the period 1979-2002. The evidence they obtained suggests that
FDI inflows stimulate economic growth only in the EU accession countries in the CEE
region, while the effect of FDI on economic growth in MENA and in non-EU accession
countries is either nonexistent or negative.
In general, the literature shows that causality relations vary depending on the period
studied, the econometric methods used, and the use of these linkages; one-way or two-way
linkages. The results may be bidirectional, unidirectional, or no causality relations may be
present. Moreover, some studies find that there is an insignificant relation between FDI and
economic growth, and a few studies find a negative relationship between FDI and economic
growth. The majority of studies, however, conclude that FDI and trade have a positive
significant relation with economic growth.
6
3- TRENDS OF FDI INFLOW INTO THE WORLD
3.1: TOTAL FDI FLOWS INTO THE WORLD DURING THE PERIOD FROM
1980 TO 2011:
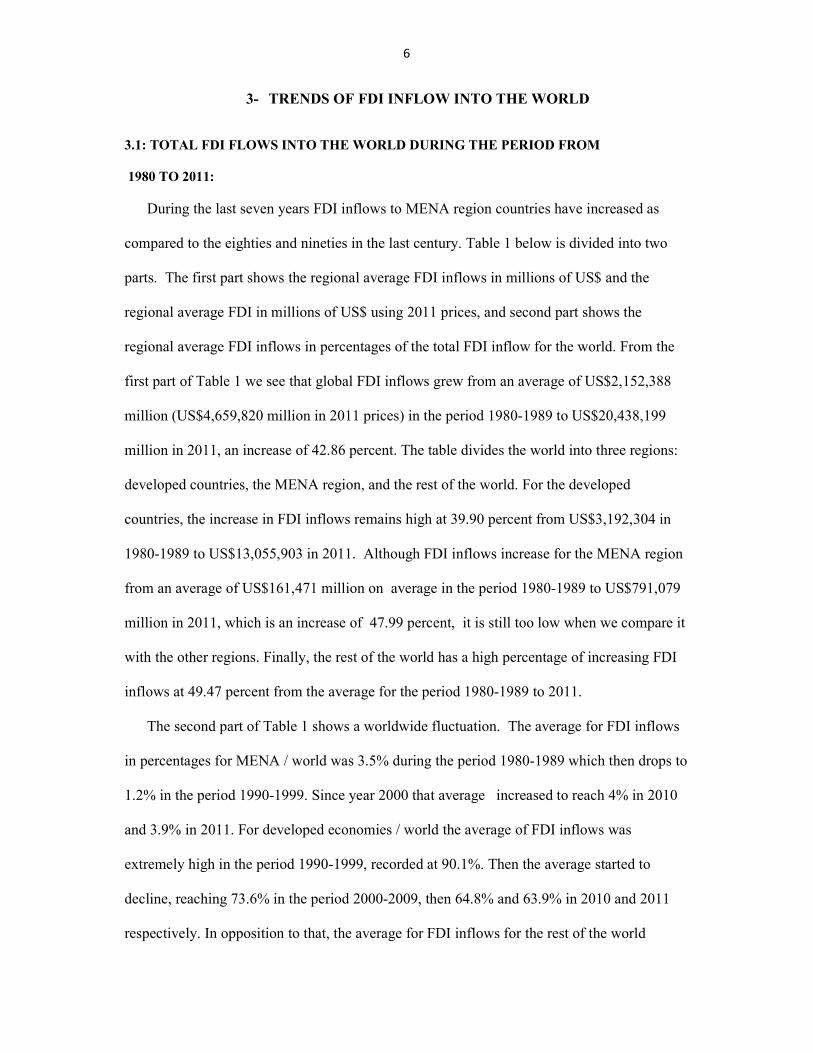
During the last seven years FDI inflows to MENA region countries have increased as
compared to the eighties and nineties in the last century. Table 1 below is divided into two
parts. The first part shows the regional average FDI inflows in millions of US$ and the
regional average FDI in millions of US$ using 2011 prices, and second part shows the
regional average FDI inflows in percentages of the total FDI inflow for the world. From the
first part of Table 1 we see that global FDI inflows grew from an average of US$2,152,388
million (US$4,659,820 million in 2011 prices) in the period 1980-1989 to US$20,438,199
million in 2011, an increase of 42.86 percent. The table divides the world into three regions:
developed countries, the MENA region, and the rest of the world. For the developed
countries, the increase in FDI inflows remains high at 39.90 percent from US$3,192,304 in
1980-1989 to US$13,055,903 in 2011. Although FDI inflows increase for the MENA region
from an average of US$161,471 million on average in the period 1980-1989 to US$791,079
million in 2011, which is an increase of 47.99 percent, it is still too low when we compare it
with the other regions. Finally, the rest of the world has a high percentage of increasing FDI
inflows at 49.47 percent from the average for the period 1980-1989 to 2011.
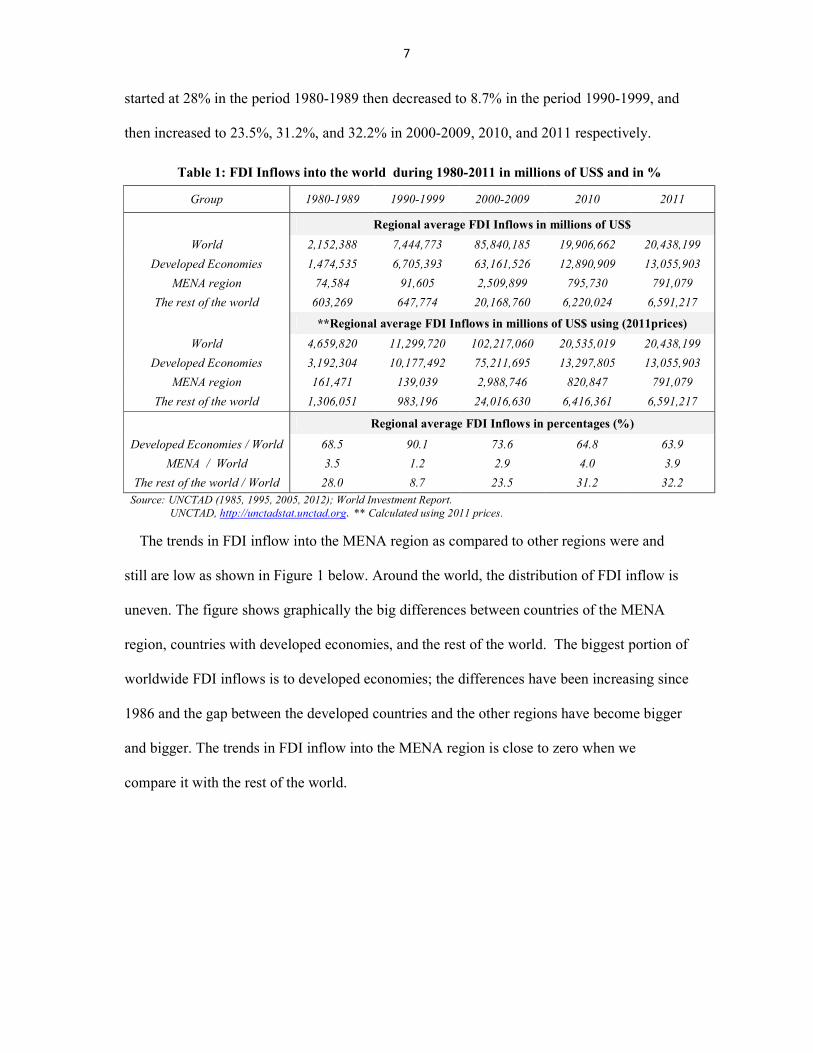
The second part of Table 1 shows a worldwide fluctuation. The average for FDI inflows
in percentages for MENA / world was 3.5% during the period 1980-1989 which then drops to
1.2% in the period 1990-1999. Since year 2000 that average increased to reach 4% in 2010
and 3.9% in 2011. For developed economies / world the average of FDI inflows was
extremely high in the period 1990-1999, recorded at 90.1%. Then the average started to
decline, reaching 73.6% in the period 2000-2009, then 64.8% and 63.9% in 2010 and 2011
respectively. In opposition to that, the average for FDI inflows for the rest of the world
7
started at 28% in the period 1980-1989 then decreased to 8.7% in the period 1990-1999, and
then increased to 23.5%, 31.2%, and 32.2% in 2000-2009, 2010, and 2011 respectively.
Table 1: FDI Inflows into the world during 1980-2011 in millions of US$ and in %
Group 1980-1989 1990-1999 2000-2009 2010 2011
Regional average FDI Inflows in millions of US$
World 2,152,388 7,444,773 85,840,185 19,906,662 20,438,199
Developed Economies 1,474,535 6,705,393 63,161,526 12,890,909 13,055,903
MENA region 74,584 91,605 2,509,899 795,730 791,079
The rest of the world 603,269 647,774 20,168,760 6,220,024 6,591,217
**Regional average FDI Inflows in millions of US$ using (2011prices)
World 4,659,820 11,299,720 102,217,060 20,535,019 20,438,199
Developed Economies 3,192,304 10,177,492 75,211,695 13,297,805 13,055,903
MENA region 161,471 139,039 2,988,746 820,847 791,079
The rest of the world 1,306,051 983,196 24,016,630 6,416,361 6,591,217
Regional average FDI Inflows in percentages (%)
Developed Economies / World 68.5 90.1 73.6 64.8 63.9
MENA / World 3.5 1.2 2.9 4.0 3.9
The rest of the world / World 28.0 8.7 23.5 31.2 32.2
Source: UNCTAD (1985, 1995, 2005, 2012); World Investment Report.
UNCTAD, http://unctadstat.unctad.org. ** Calculated using 2011 prices.
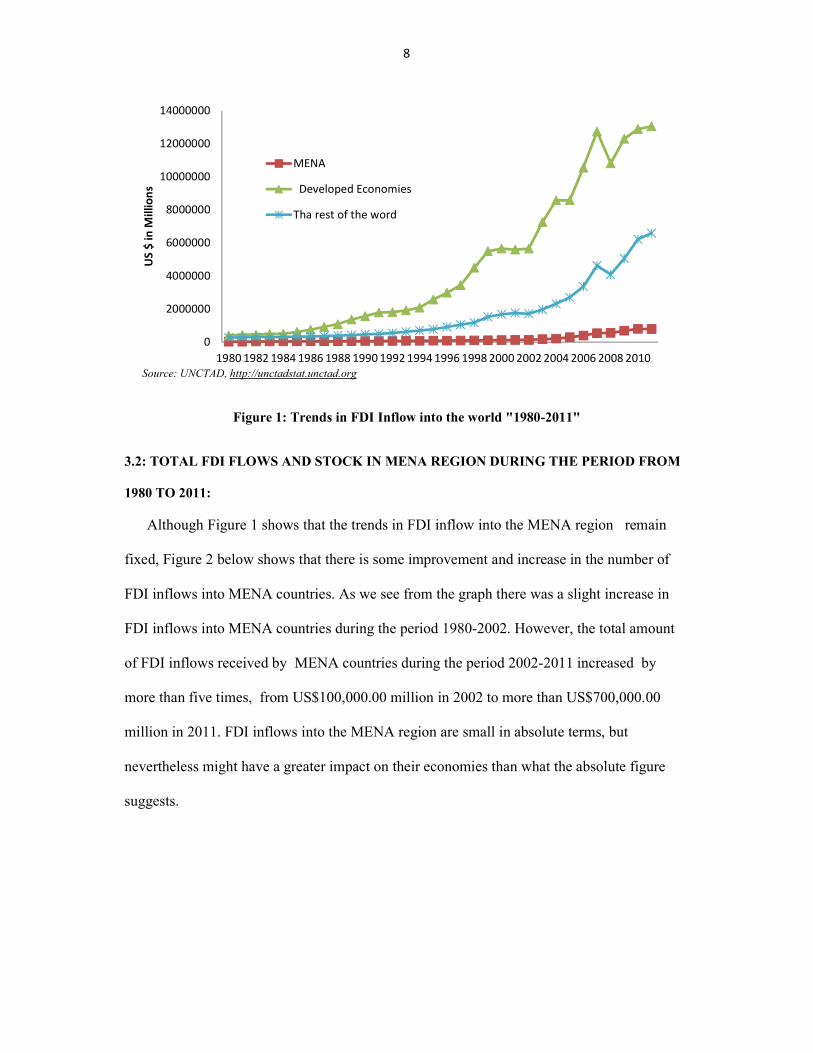
The trends in FDI inflow into the MENA region as compared to other regions were and
still are low as shown in Figure 1 below. Around the world, the distribution of FDI inflow is
uneven. The figure shows graphically the big differences between countries of the MENA
region, countries with developed economies, and the rest of the world. The biggest portion of
worldwide FDI inflows is to developed economies; the differences have been increasing since
1986 and the gap between the developed countries and the other regions have become bigger
and bigger. The trends in FDI inflow into the MENA region is close to zero when we
compare it with the rest of the world.
8
Figure 1: Trends in FDI Inflow into the world "1980-2011"
3.2: TOTAL FDI FLOWS AND STOCK IN MENA REGION DURING THE PERIOD FROM
1980 TO 2011:
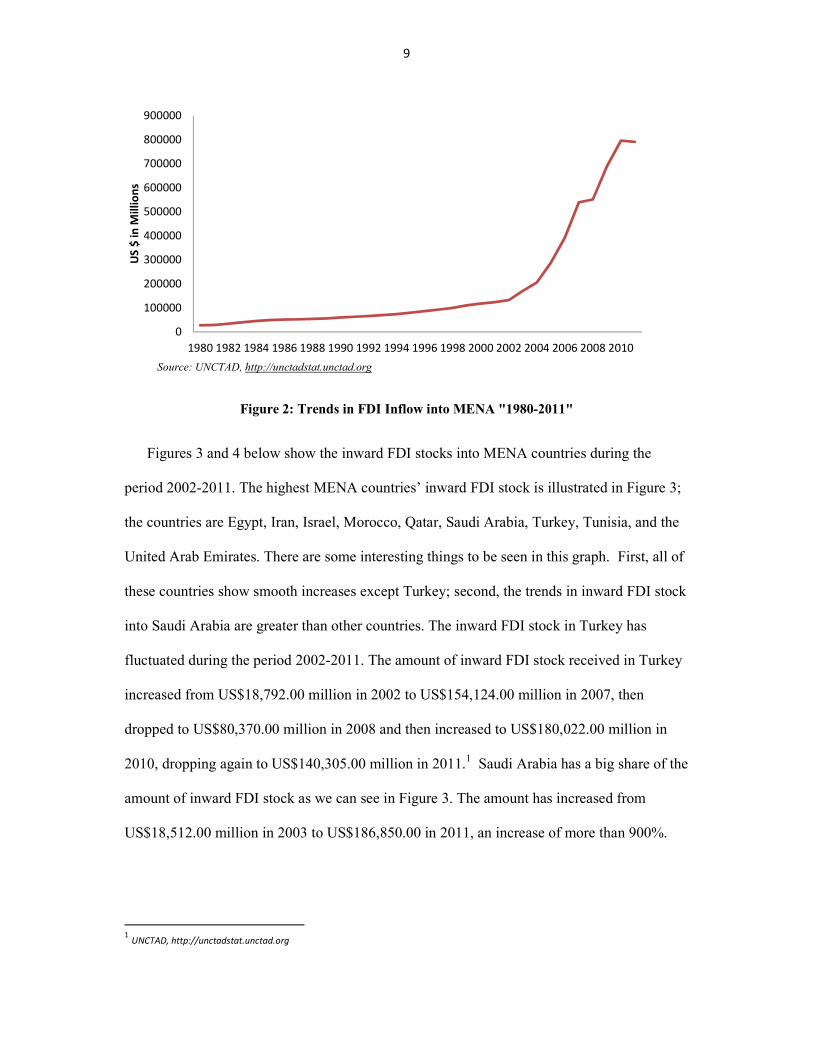
Although Figure 1 shows that the trends in FDI inflow into the MENA region remain
fixed, Figure 2 below shows that there is some improvement and increase in the number of
FDI inflows into MENA countries. As we see from the graph there was a slight increase in
FDI inflows into MENA countries during the period 1980-2002. However, the total amount
of FDI inflows received by MENA countries during the period 2002-2011 increased by
more than five times, from US$100,000.00 million in 2002 to more than US$700,000.00
million in 2011. FDI inflows into the MENA region are small in absolute terms, but
nevertheless might have a greater impact on their economies than what the absolute figure
suggests.
0
2000000
4000000
6000000
8000000
10000000
12000000
14000000
1980 1982 1984 1986 1988 1990 1992 1994 1996 1998 2000 2002 2004 2006 2008 2010
US
$ i
n M
illi
on
s
Source: UNCTAD, http://unctadstat.unctad.org
MENA
Developed Economies
Tha rest of the word
9
Figure 2: Trends in FDI Inflow into MENA "1980-2011"
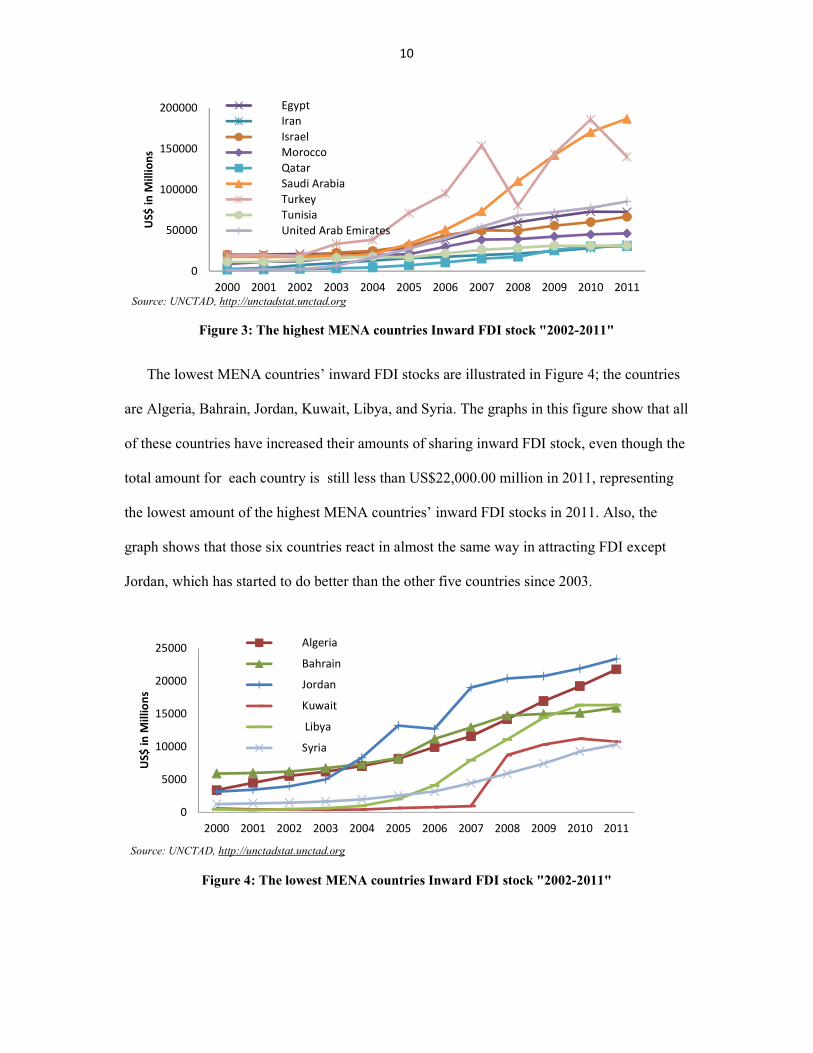
Figures 3 and 4 below show the inward FDI stocks into MENA countries during the
period 2002-2011. The highest MENA countries’ inward FDI stock is illustrated in Figure 3;
the countries are Egypt, Iran, Israel, Morocco, Qatar, Saudi Arabia, Turkey, Tunisia, and the
United Arab Emirates. There are some interesting things to be seen in this graph. First, all of
these countries show smooth increases except Turkey; second, the trends in inward FDI stock
into Saudi Arabia are greater than other countries. The inward FDI stock in Turkey has
fluctuated during the period 2002-2011. The amount of inward FDI stock received in Turkey
increased from US$18,792.00 million in 2002 to US$154,124.00 million in 2007, then
dropped to US$80,370.00 million in 2008 and then increased to US$180,022.00 million in
2010, dropping again to US$140,305.00 million in 2011.1 Saudi Arabia has a big share of the
amount of inward FDI stock as we can see in Figure 3. The amount has increased from
US$18,512.00 million in 2003 to US$186,850.00 in 2011, an increase of more than 900%.
1 UNCTAD, http://unctadstat.unctad.org
0
100000
200000
300000
400000
500000
600000
700000
800000
900000
1980 1982 1984 1986 1988 1990 1992 1994 1996 1998 2000 2002 2004 2006 2008 2010
US
$ i
n M
illi
on
s
Source: UNCTAD, http://unctadstat.unctad.org
10
Figure 3: The highest MENA countries Inward FDI stock "2002-2011"
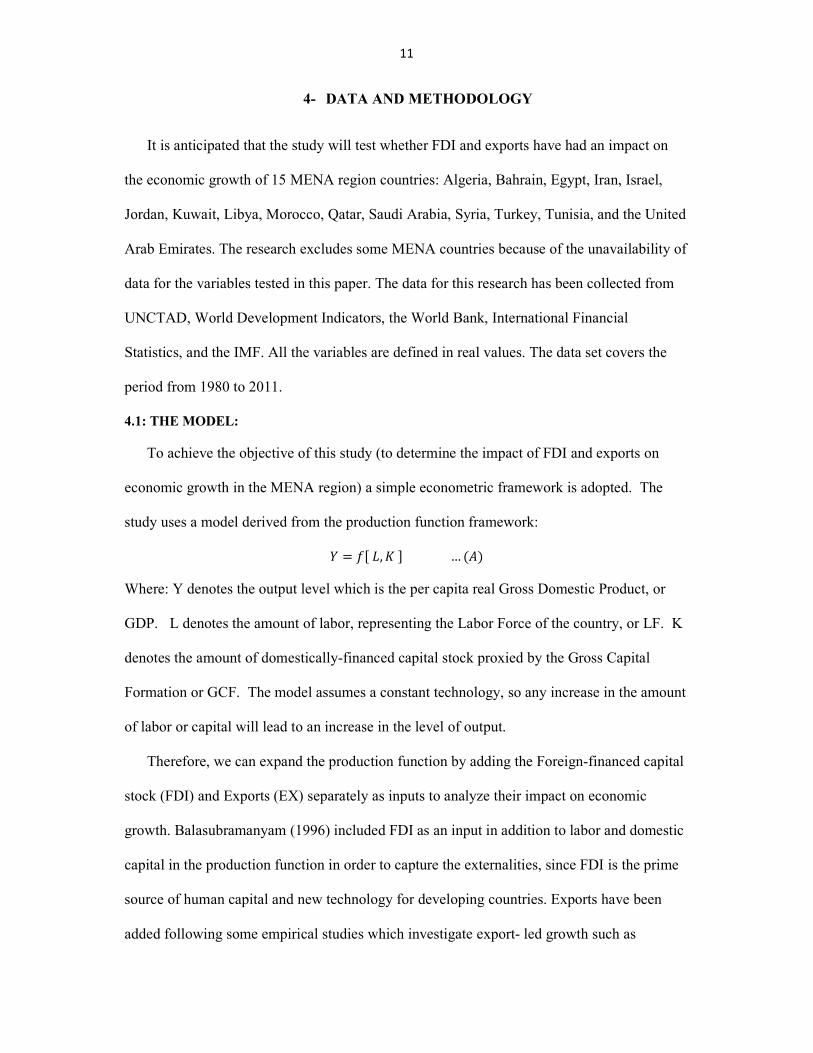
The lowest MENA countries’ inward FDI stocks are illustrated in Figure 4; the countries
are Algeria, Bahrain, Jordan, Kuwait, Libya, and Syria. The graphs in this figure show that all
of these countries have increased their amounts of sharing inward FDI stock, even though the
total amount for each country is still less than US$22,000.00 million in 2011, representing
the lowest amount of the highest MENA countries’ inward FDI stocks in 2011. Also, the
graph shows that those six countries react in almost the same way in attracting FDI except
Jordan, which has started to do better than the other five countries since 2003.
Figure 4: The lowest MENA countries Inward FDI stock "2002-2011"
0
50000
100000
150000
200000
2000 2001 2002 2003 2004 2005 2006 2007 2008 2009 2010 2011
US
$ i
n M
illi
on
s
Source: UNCTAD, http://unctadstat.unctad.org
Egypt
Iran
Israel
Morocco
Qatar
Saudi Arabia
Turkey
Tunisia
United Arab Emirates
0
5000
10000
15000
20000
25000
2000 2001 2002 2003 2004 2005 2006 2007 2008 2009 2010 2011
US
$ i
n M
illi
on
s
Source: UNCTAD, http://unctadstat.unctad.org
Algeria
Bahrain
Jordan
Kuwait
Libya
Syria
11
4- DATA AND METHODOLOGY
It is anticipated that the study will test whether FDI and exports have had an impact on
the economic growth of 15 MENA region countries: Algeria, Bahrain, Egypt, Iran, Israel,
Jordan, Kuwait, Libya, Morocco, Qatar, Saudi Arabia, Syria, Turkey, Tunisia, and the United
Arab Emirates. The research excludes some MENA countries because of the unavailability of
data for the variables tested in this paper. The data for this research has been collected from
UNCTAD, World Development Indicators, the World Bank, International Financial
Statistics, and the IMF. All the variables are defined in real values. The data set covers the
period from 1980 to 2011.
4.1: THE MODEL:
To achieve the objective of this study (to determine the impact of FDI and exports on
economic growth in the MENA region) a simple econometric framework is adopted. The
study uses a model derived from the production function framework:
� = ���, �… (�)
Where: Y denotes the output level which is the per capita real Gross Domestic Product, or
GDP. L denotes the amount of labor, representing the Labor Force of the country, or LF. K
denotes the amount of domestically-financed capital stock proxied by the Gross Capital
Formation or GCF. The model assumes a constant technology, so any increase in the amount
of labor or capital will lead to an increase in the level of output.
Therefore, we can expand the production function by adding the Foreign-financed capital
stock (FDI) and Exports (EX) separately as inputs to analyze their impact on economic
growth. Balasubramanyam (1996) included FDI as an input in addition to labor and domestic
capital in the production function in order to capture the externalities, since FDI is the prime
source of human capital and new technology for developing countries. Exports have been
added following some empirical studies which investigate export- led growth such as
12
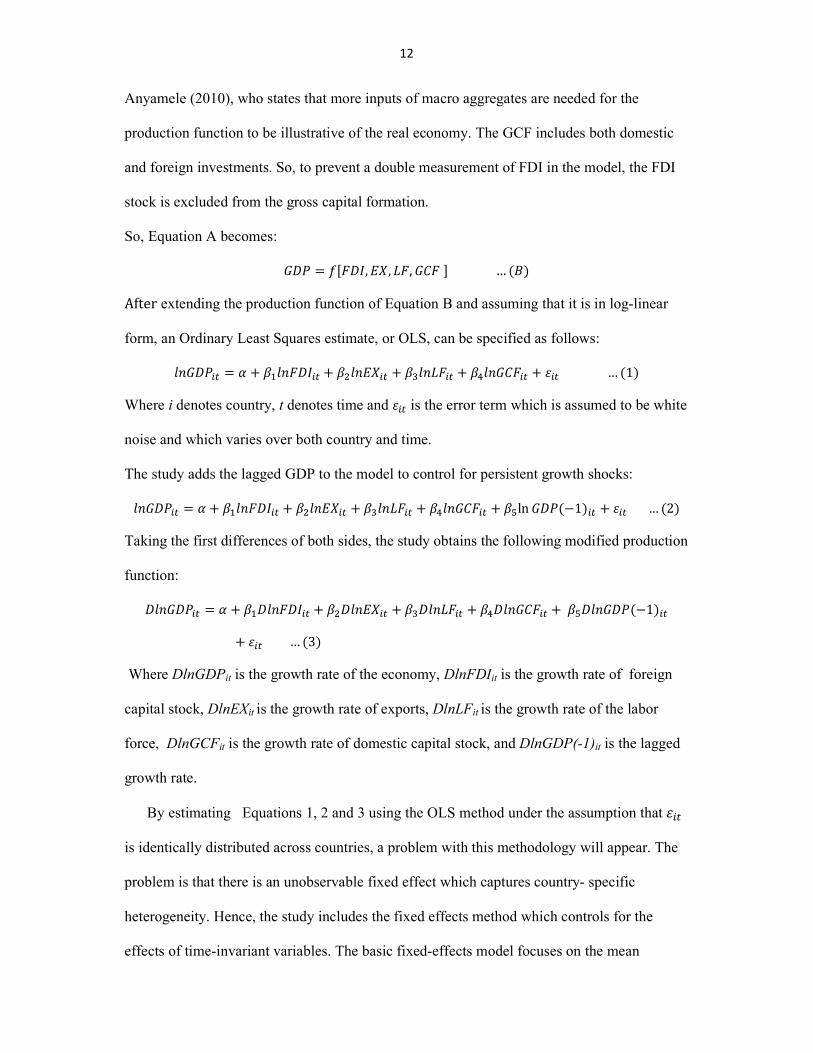
Anyamele (2010), who states that more inputs of macro aggregates are needed for the
production function to be illustrative of the real economy. The GCF includes both domestic
and foreign investments. So, to prevent a double measurement of FDI in the model, the FDI
stock is excluded from the gross capital formation.
So, Equation A becomes:
��� = �����, ��, ��, ���… (�)
After extending the production function of Equation B and assuming that it is in log-linear
form, an Ordinary Least Squares estimate, or OLS, can be specified as follows:
������� = � + ��������� + �������� + � ������ + �!������� + "�� … (1)
Where i denotes country, t denotes time and "�� is the error term which is assumed to be white
noise and which varies over both country and time.
The study adds the lagged GDP to the model to control for persistent growth shocks:
������� = � + ��������� + �������� + � ������ + �!������� + �$ln���(−1)�� + "�� … (2)
Taking the first differences of both sides, the study obtains the following modified production
function:
�������� = � + ���������� + ��������� + � ������� + �!�������� +�$������(−1)��
+ "�� … (3)
Where DlnGDPit is the growth rate of the economy, DlnFDIit is the growth rate of foreign
capital stock, DlnEXit is the growth rate of exports, DlnLFit is the growth rate of the labor
force, DlnGCFit is the growth rate of domestic capital stock, and DlnGDP(-1)it is the lagged
growth rate.
By estimating Equations 1, 2 and 3 using the OLS method under the assumption that "��
is identically distributed across countries, a problem with this methodology will appear. The
problem is that there is an unobservable fixed effect which captures country- specific
heterogeneity. Hence, the study includes the fixed effects method which controls for the
effects of time-invariant variables. The basic fixed-effects model focuses on the mean
13
response and assumes two things: first, that there is no serial correlation and second, that
there is no cross-sectional correlation.
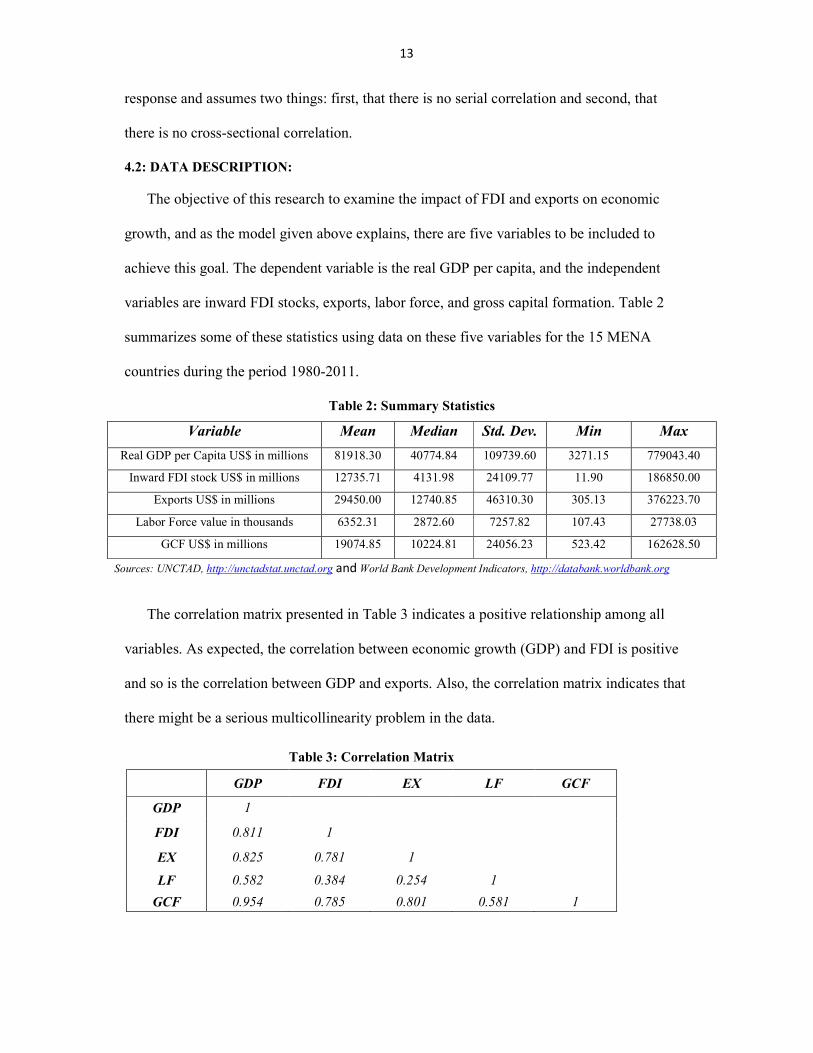
4.2: DATA DESCRIPTION:
The objective of this research to examine the impact of FDI and exports on economic
growth, and as the model given above explains, there are five variables to be included to
achieve this goal. The dependent variable is the real GDP per capita, and the independent
variables are inward FDI stocks, exports, labor force, and gross capital formation. Table 2
summarizes some of these statistics using data on these five variables for the 15 MENA
countries during the period 1980-2011.
Table 2: Summary Statistics
Variable Mean Median Std. Dev. Min Max
Real GDP per Capita US$ in millions 81918.30 40774.84 109739.60 3271.15 779043.40
Inward FDI stock US$ in millions 12735.71 4131.98 24109.77 11.90 186850.00
Exports US$ in millions 29450.00 12740.85 46310.30 305.13 376223.70
Labor Force value in thousands 6352.31 2872.60 7257.82 107.43 27738.03
GCF US$ in millions 19074.85 10224.81 24056.23 523.42 162628.50
Sources: UNCTAD, http://unctadstat.unctad.org and World Bank Development Indicators, http://databank.worldbank.org
The correlation matrix presented in Table 3 indicates a positive relationship among all
variables. As expected, the correlation between economic growth (GDP) and FDI is positive
and so is the correlation between GDP and exports. Also, the correlation matrix indicates that
there might be a serious multicollinearity problem in the data.
Table 3: Correlation Matrix
GDP FDI EX LF GCF
GDP 1
FDI 0.811 1
EX 0.825 0.781 1
LF 0.582 0.384 0.254 1
GCF 0.954 0.785 0.801 0.581 1

14
Figure 5 below shows the trends in the GDP, FDI, exports, labor force and gross capital
formation in MENA countries during the period 1980-2011 in logs in millions. From the
graph it’s clear that all the variables have increased and share nearly the same trend over time
except for the labor force which shows a slight change during the period 1980-2011. The
large changes were in the inward FDI stock which increased by 76.9% from 4.25 logs in
millions to 5.75 logs in millions. Although the other variables increased as well, the amount
of increase is less than that of the inward FDI stock. For instance, exports increased by 14%,
the GDP by 13%, and the GCF by 9.5%.
Figure 5: Trends in Log of GDP, FDI, Exports, Gross Capital formation, and Labor force into
MENA "1980-2011"
4
4.5
5
5.5
6
6.5
7
Log
in
Mil
lio
ns
logGDP
LogEX
LogFDI
LogGCF
LogLF
15
5- EMPIRICAL RESULTS
This section of the paper presents the results of testing the effects of FDI and exports on
gross domestic product using OLS estimates and fixed effects estimates for three particular
specifications. Table 4 presents the results of the panel regression of the first specification,
making use of the natural logarithm for the independent variables, FDI, exports, labor force,
gross capital formation, and the dependent variable gross domestic product, Equation 1. The
first column in the table presents the OLS estimation results which show that all of the
coefficients of the independent variables are statistically significant at a level of 1% and have
the expected sign except for the coefficient of the constant term which is insignificant, even
at 10%, and the coefficient of the main variable, FDI, which has an unexpected sign. Also,
the F-statistic is significant, and an R2 of around 0.94 means that the data seem to fit the
model well. However, the Durbin-Watson statistic which stands at 0.203 means that we have
an autocorrelation problem. So, by adding the residual (-1) to the OLS in the second column
we correct for the autocorrelation problem, and the results show that all of the coefficients of
the independent variables are statistically significant at a level of 1% and have the expected
sign except for the main variable, FDI, which has an unexpected sign. Also, the F-statistic is
significant, and an R2 of around 0.99 and a Durbin-Watson statistic of 1.978 means that the
autocorrelation problem has been solved.
By using the fixed effects model for Equation 1, the results from the third column in
Table 4 also show that all of the coefficients of the independent variables are statistically
significant at a level of 1%, and show that FDI, exports, labor force, and GCF have a positive
sign, which is expected, and a have a significant impact on the gross domestic product (GDP)
of the panel countries. However, from the Durbin-Watson statistic which stands at around
0.433, we can see there is an autocorrelation problem. The fourth column shows the results of
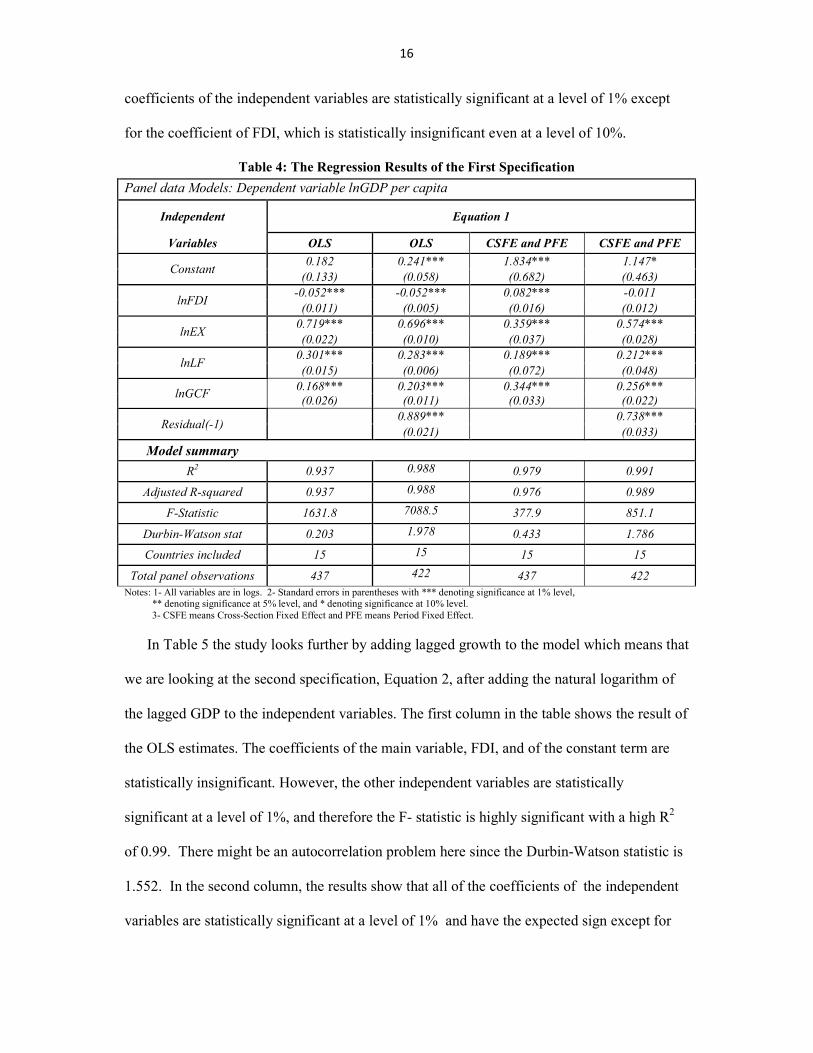
the fixed effects model for Equation 1 after solving for the autocorrelation problem. All of the
16
coefficients of the independent variables are statistically significant at a level of 1% except
for the coefficient of FDI, which is statistically insignificant even at a level of 10%.
Table 4: The Regression Results of the First Specification
Panel data Models: Dependent variable lnGDP per capita
Independent Equation 1
Variables OLS OLS CSFE and PFE CSFE and PFE
Constant 0.182 0.241*** 1.834*** 1.147*
(0.133) (0.058) (0.682) (0.463)
lnFDI -0.052*** -0.052*** 0.082*** -0.011
(0.011) (0.005) (0.016) (0.012)
lnEX 0.719*** 0.696*** 0.359*** 0.574***
(0.022) (0.010) (0.037) (0.028)
lnLF 0.301*** 0.283*** 0.189*** 0.212***
(0.015) (0.006) (0.072) (0.048)
lnGCF 0.168*** 0.203*** 0.344*** 0.256***
(0.026) (0.011) (0.033) (0.022)
Residual(-1) 0.889*** 0.738***
(0.021) (0.033)
Model summary
R2 0.937 0.988 0.979 0.991
Adjusted R-squared 0.937 0.988 0.976 0.989
F-Statistic 1631.8 7088.5 377.9 851.1
Durbin-Watson stat 0.203 1.978 0.433 1.786
Countries included 15 15 15 15
Total panel observations 437 422 437 422
Notes: 1- All variables are in logs. 2- Standard errors in parentheses with *** denoting significance at 1% level, ** denoting significance at 5% level, and * denoting significance at 10% level. 3- CSFE means Cross-Section Fixed Effect and PFE means Period Fixed Effect.
In Table 5 the study looks further by adding lagged growth to the model which means that
we are looking at the second specification, Equation 2, after adding the natural logarithm of
the lagged GDP to the independent variables. The first column in the table shows the result of
the OLS estimates. The coefficients of the main variable, FDI, and of the constant term are
statistically insignificant. However, the other independent variables are statistically
significant at a level of 1%, and therefore the F- statistic is highly significant with a high R2
of 0.99. There might be an autocorrelation problem here since the Durbin-Watson statistic is
1.552. In the second column, the results show that all of the coefficients of the independent
variables are statistically significant at a level of 1% and have the expected sign except for

17
the coefficient of the constant term, which is insignificant even at 10%, and for the
coefficient of the main variable, FDI, which has an unexpected sign. Also, the F-statistic is
significant with an R2 of around 0.99 while the Durbin-Watson statistic is around 1.83.
Table 5: The Regression Results of the Second Specification
Panel data Models: Dependent variable lnGDP per capita
Independent Equation 2
Variables OLS OLS CSFE and PFE CSFE and PFE
Constant -0.070 0.075 -0.374* 0.106
(0.057) (0.050) (0.648) (0.411)
lnFDI 0.001 -0.023*** 0.027** -0.001
(0.005) (0.004) (0.016) (0.010)
lnEX 0.146*** 0.381*** 0.165*** 0.327***
(0.016) (0.024) (0.041) (0.033)
lnLF 0.040*** 0.145*** 0.098** 0.140***
(0.009) (0.011) (0.048) (0.042)
lnGCF 0.031*** 0.111*** 0.047* 0.112***
(0.012) (0.012) (0.024) (0.023)
LnGDP(-1) 0.819*** 0.464*** 0.752*** 0.495***
(0.019) (0.033) (0.055) (0.044)
Residual(-1) 0.448*** 0.358***
(0.036) (0.045)
Model summary
R2 0.988 0.992 0.992 0.993
Adjusted R-squared 0.988 0.991 0.991 0.992
F-Statistic 7424.1 8668.3 958.5 1115.9
Durbin-Watson stat 1.552 1.829 1.535 1.800
Countries included 15 15 15 15
Total panel observations 426 422 426 422
Notes: 1- All variables are in logs. 2- Standard errors in parentheses with *** denoting significance at 1% level, ** denoting significance at 5% level, and * denoting significance at 10% level. 3- CSFE means Cross-Section Fixed Effect and PFE means Period Fixed Effect.
On the other hand, the results of the fixed effect estimates in the third column of the table
show that all of the independent variables are statistically significant at different levels. All of
the coefficients have the expected sign except for the constant term which has a negative sign
and is statistically significant at a level of 10%. The Durbin-Watson statistic is around 1.535,
and so the study tries to solve for the autocorrelation problem. In the fourth column, the OLS
estimation results are presented after adding a residual (-1) as an independent variable. The
results show that all of the coefficients of the independent variables are statistically
significant at a level of 1% except that the coefficients of the FDI and of the constant term are

18
statistically insignificant, even at a level of 10%. Therefore, the F- statistic is highly
significant while the R2 is very high at around 0.99 and the Durbin-Watson Statistic stands at
around 1.80.
Table 6 presents the results of the panel regression of the third specification which makes
use of the first difference of the natural logarithm for both sites as Equation 2 became
Equation 3. We test the growth rate of the variables by taking the first difference, and the
results in Table 6 show that the third specification is different from the two other
specifications. Although the results of the OLS estimate in the first column of the table show
that we have the expected sign for all variables, there are some variables that have
statistically insignificant coefficients. The main variable in the regression -the growth rate in
FDI, or DlnFDI- has no effect on the economic growth rate, the DlnGDP. Also, the
coefficients of the labor force and macroeconomic shocks are statistically insignificant even
at a level of 10%. On the other hand, the growth rates in exports and GCF have a positive
relationship with the economic growth rate and are statistically significant at a level of 1%,
while the F-statistic is also significant with an R2 of around 0.409 and a Durbin-Watson
statistic of around 1.943. This means that we do not have an autocorrelation problem.
By taking the first differences for all variables in both sites, the cross-section fixed effect
drops out. The second column of the table presents the results of the period fixed effect
estimates, which are almost the same as the results of the OLS estimate. The constant terms,
the growth rates of exports and the GCF have positive relationships with the economic
growth rate and their coefficients are statistically significant at a level of 1%. The results
show that a 1 percent increase the growth rate of exports will lead to a 0.313 percent increase
in the economic growth rate, and a 1 percent increase in the GCF growth rate will lead to a
0.122 percent increase in the economic growth rate. Also, the F-statistic is significant, and an
R2 of around 0.473 means that the data seem to fit the model well; therefore, we do not have

19
an autocorrelation problem since the Durbin-Watson statistic stands at around 1.89. To sum
up, Table 6 shows that there is no relationship between the economic growth rate and the FDI
and labor force growth rates, and that there is a strong relationship among the economic
growth rate, exports, the GCF (domestic investments), and growth rates in the MENA region.
Table 6: The Regression Results of the Third Specification
Panel data Models: Dependent variable DlnGDP per capita
Independent Equation 3
Variables OLS PFE
Constant 0.017** 0.027***
(0.008) (0.008)
DlnFDI 0.027 0.013
(0.020) (0.021)
DlnEX 0.339*** 0.313***
(0.026) (0.031)
DlnLF 0.238 0.146
(0.154) (0.159)
DlnGCF 0.167*** 0.122***
(0.025) (0.027)
DlnGDP(-1) 0.006 0.003
(0.039) (0.046)
Model summary
R2 0.409 0.473
Adjusted R-squared 0.402 0.425
F-Statistic 56.2 9.94
Durbin-Watson stat 1.943 1.888
Countries included 15 15
Total panel observations 411 411
Notes: 1- All variables are in logs. 2- Standard errors in parentheses with *** denoting significance at 1% level, ** denoting significance at 5% level, and * denoting significance at 10% level 3- PFE means Period Fixed Effect.
Finally, the study examines the impact of FDI and exports by dividing the MENA
countries into two categories: oil exporting and non-oil exporting countries. Table 7 below
presents the results of the regression for the oil exporting MENA countries: Algeria, Bahrain,
Iran, Kuwait, Libya, Qatar, Saudi Arabia, and the United Arab Emirates. The OLS estimation
results presented in the first column show that the growth rates in exports, labor force, and
GCF have positive relationships with the economic growth rate and that their coefficients are
statistically significant at a level of 1%. However, the growth rates of FDI and the lagged
GDP are insignificant even at a level of 10%. The R2 stands at around 0.465, the F- statistic

20
is statistically significant and the Durbin-Watson statistic stands at around 1.967, which
means that we do not have any autocorrelation problems. The second column provides the
results of the fixed effect estimation, showing that none of the independent variables have
any impact on the economic growth rate except for the growth rate in exports which has a
statistically significant coefficient at a level of 1% and a positive relation with the economic
growth rate. The R2 is around 0.572, the F- statistic is statistically significant and the Durbin-
Watson statistic stands at around 1.80, which means that we do not have any autocorrelation
problems.
Table 7: The Regression Results of the Third Specification for the Oil
Exporting MENA countries
Panel data Models: Dependent variable DlnGDP per capita
Independent Equation 3
Variables OLS PFE
Constant 0.004 0.025*
(0.013) (0.014)
DlnFDI 0.021 -0.0007
(0.026) (0.027)
DlnEX 0.390*** 0.308***
(0.033) (0.042)
DlnLF 0.499** 0.325
(0.204) (0.228)
DlnGCF 0.096*** 0.018
(0.036) (0.040)
DlnGDP(-1) -0.032 -0.029
(0.058) (0.078)
Model summary
R2 0.465 0.572
Adjusted R-squared 0.451 0.487
F-Statistic 34.8 6.72
Durbin-Watson stat 1.967 1.790
Countries included 8 8
Total panel observations 206 206
Notes: 1- All variables are in logs. 2- Standard errors in parentheses with *** denoting significance at 1% level, ** denoting significance at 5% level, and * denoting significance at 10% level. 3- PFE means Period Fixed Effect.
Table 8 below presents the results of the regression for the non-oil exporting MENA
countries: Egypt, Israel, Jordan, Morocco, Syria, Turkey, and Tunisia. The OLS estimation
results presented in the first column show that the growth rates of all independent variables

21
(exports, FDI, labor force, GCF and the lagged GDP) have statistically significant
coefficients at various levels. All of the variables have an expected sign except for the labor
force which has a negative sign. The R2 is around 0.463, the F- statistic is statistically
significant and the Durbin-Watson statistic stands at around 1.776, which means that we do
not have any autocorrelation problems. The second column provides the results of the fixed
effect estimation, showing that the growth rates of all the independent variables (FDI, labor
force, GCF and the lagged GDP) have statistically significant coefficients at various levels
except for the growth rate in exports, which is statistically insignificant even at a level of
10%. Also, all of the variables have an expected sign except for the labor force which has a
negative sign. The R2 is around 0.592, the F- statistic is statistically significant, and the
Durbin-Watson statistic stands at around 1.760, which means that we do not have any
autocorrelation problems.
Table 8: The Regression Results of the Third Specification for Non-oil
Exporting MENA countries
Panel data Models: Dependent variable DlnGDP per capita
Independent Equation 3
Variables OLS PFE
Constant 0.039*** 0.044***
(0.107) (0.011)
DlnFDI 0.075** 0.077**
(0.034) (0.036)
DlnEX 0.101** 0.092
(0.044) (0.058)
DlnLF -0.498* -0.617**
(0.276) (0.290)
DlnGCF 0.321*** 0.303***
(0.031) (0.032)
DlnGDP(-1) 0.096** 0.094*
(0.044) (0.051)
Model summary
R2 0.463 0.592
Adjusted R-squared 0.449 0.510
F-Statistic 34.4 7.25
Durbin-Watson stat 1.776 1.756
Countries included 7 7
Total panel observations 205 205 Notes: 1- All variables are in logs. 2- Standard errors in parentheses with *** denoting significance at 1% level, ** denoting significance at 5% level, and * denoting significance at 10% level. 3- PFE means Period Fixed Effect.
22
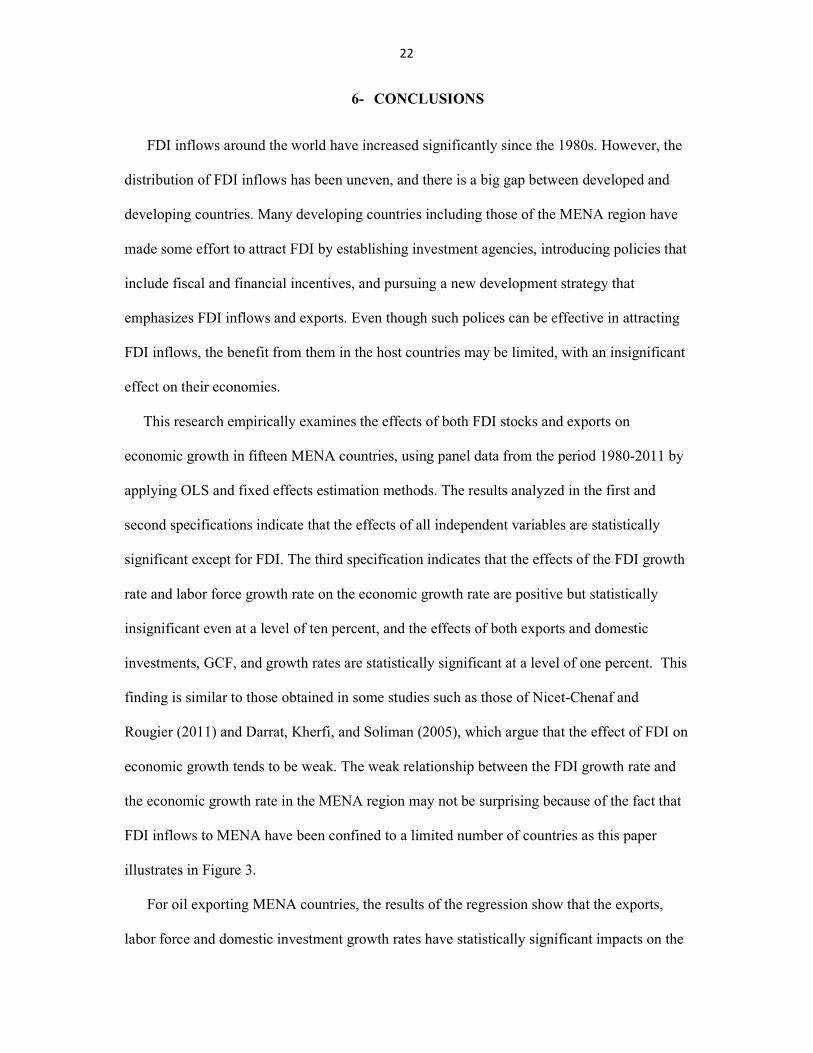
6- CONCLUSIONS
FDI inflows around the world have increased significantly since the 1980s. However, the
distribution of FDI inflows has been uneven, and there is a big gap between developed and
developing countries. Many developing countries including those of the MENA region have
made some effort to attract FDI by establishing investment agencies, introducing policies that
include fiscal and financial incentives, and pursuing a new development strategy that
emphasizes FDI inflows and exports. Even though such polices can be effective in attracting
FDI inflows, the benefit from them in the host countries may be limited, with an insignificant
effect on their economies.
This research empirically examines the effects of both FDI stocks and exports on
economic growth in fifteen MENA countries, using panel data from the period 1980-2011 by
applying OLS and fixed effects estimation methods. The results analyzed in the first and
second specifications indicate that the effects of all independent variables are statistically
significant except for FDI. The third specification indicates that the effects of the FDI growth
rate and labor force growth rate on the economic growth rate are positive but statistically
insignificant even at a level of ten percent, and the effects of both exports and domestic
investments, GCF, and growth rates are statistically significant at a level of one percent. This
finding is similar to those obtained in some studies such as those of Nicet-Chenaf and
Rougier (2011) and Darrat, Kherfi, and Soliman (2005), which argue that the effect of FDI on
economic growth tends to be weak. The weak relationship between the FDI growth rate and
the economic growth rate in the MENA region may not be surprising because of the fact that
FDI inflows to MENA have been confined to a limited number of countries as this paper
illustrates in Figure 3.
For oil exporting MENA countries, the results of the regression show that the exports,
labor force and domestic investment growth rates have statistically significant impacts on the

23
economic growth rate as calculated by the OLS estimation method. On the other hand, only
the exports growth rate has a statistically significant impact on the economic growth rate as
calculated by the period fixed effect estimation method. For non-oil exporting MENA
countries, the results of the regression show that the exports and FDI growth rates have
statistically significant impacts on the economic growth rate as calculated by the OLS
estimation method. However, only the FDI growth rate has a statistically significant impact
on the economic growth rate as calculated by the period fixed effect estimation method.
To sum up, we may conclude that there is a significant and positive impact of exports
only on the economic growth of panel MENA countries and oil- exporting MENA countries.
The FDI growth rate has a significant and positive impact on the economic growth of panel
non-oil exporting MENA countries.
24
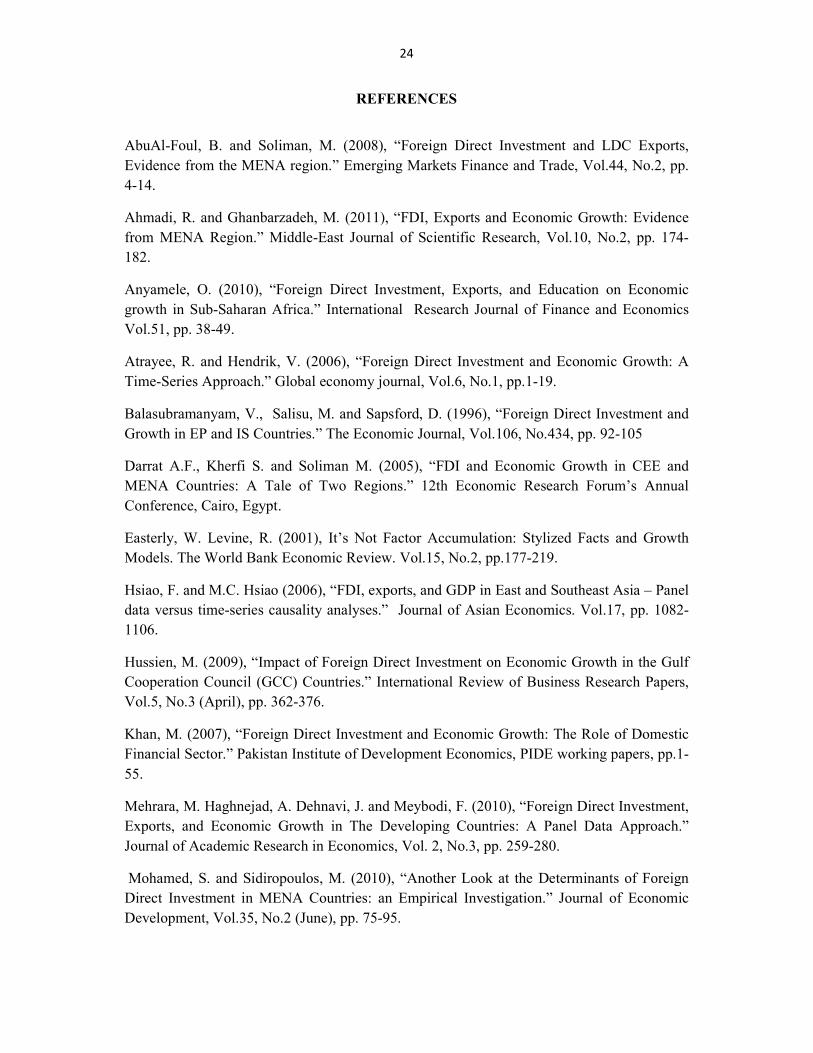
REFERENCES
AbuAl-Foul, B. and Soliman, M. (2008), “Foreign Direct Investment and LDC Exports,
Evidence from the MENA region.” Emerging Markets Finance and Trade, Vol.44, No.2, pp.
4-14.
Ahmadi, R. and Ghanbarzadeh, M. (2011), “FDI, Exports and Economic Growth: Evidence
from MENA Region.” Middle-East Journal of Scientific Research, Vol.10, No.2, pp. 174-
182.
Anyamele, O. (2010), “Foreign Direct Investment, Exports, and Education on Economic
growth in Sub-Saharan Africa.” International Research Journal of Finance and Economics
Vol.51, pp. 38-49.
Atrayee, R. and Hendrik, V. (2006), “Foreign Direct Investment and Economic Growth: A
Time-Series Approach.” Global economy journal, Vol.6, No.1, pp.1-19.
Balasubramanyam, V., Salisu, M. and Sapsford, D. (1996), “Foreign Direct Investment and
Growth in EP and IS Countries.” The Economic Journal, Vol.106, No.434, pp. 92-105
Darrat A.F., Kherfi S. and Soliman M. (2005), “FDI and Economic Growth in CEE and
MENA Countries: A Tale of Two Regions.” 12th Economic Research Forum’s Annual
Conference, Cairo, Egypt.
Easterly, W. Levine, R. (2001), It’s Not Factor Accumulation: Stylized Facts and Growth
Models. The World Bank Economic Review. Vol.15, No.2, pp.177-219.
Hsiao, F. and M.C. Hsiao (2006), “FDI, exports, and GDP in East and Southeast Asia – Panel
data versus time-series causality analyses.” Journal of Asian Economics. Vol.17, pp. 1082-
1106.
Hussien, M. (2009), “Impact of Foreign Direct Investment on Economic Growth in the Gulf
Cooperation Council (GCC) Countries.” International Review of Business Research Papers,
Vol.5, No.3 (April), pp. 362-376.
Khan, M. (2007), “Foreign Direct Investment and Economic Growth: The Role of Domestic
Financial Sector.” Pakistan Institute of Development Economics, PIDE working papers, pp.1-
55.
Mehrara, M. Haghnejad, A. Dehnavi, J. and Meybodi, F. (2010), “Foreign Direct Investment,
Exports, and Economic Growth in The Developing Countries: A Panel Data Approach.”
Journal of Academic Research in Economics, Vol. 2, No.3, pp. 259-280.
Mohamed, S. and Sidiropoulos, M. (2010), “Another Look at the Determinants of Foreign
Direct Investment in MENA Countries: an Empirical Investigation.” Journal of Economic
Development, Vol.35, No.2 (June), pp. 75-95.
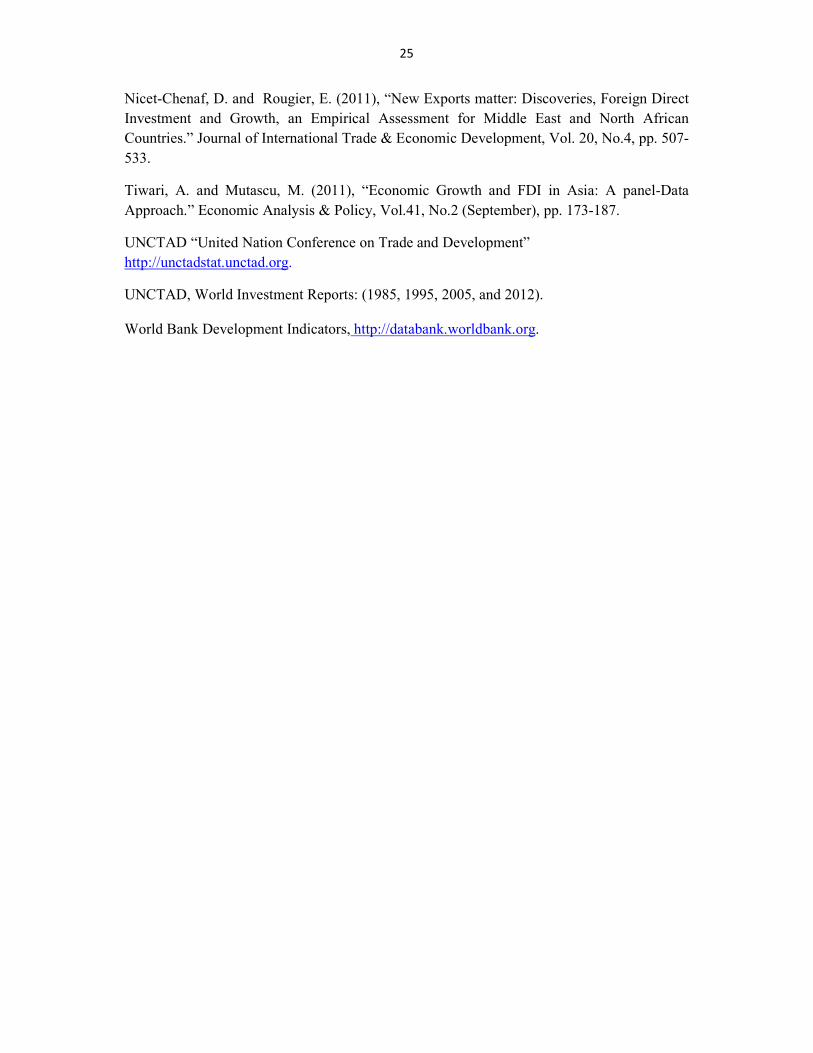
25
Nicet-Chenaf, D. and Rougier, E. (2011), “New Exports matter: Discoveries, Foreign Direct
Investment and Growth, an Empirical Assessment for Middle East and North African
Countries.” Journal of International Trade & Economic Development, Vol. 20, No.4, pp. 507-
533.
Tiwari, A. and Mutascu, M. (2011), “Economic Growth and FDI in Asia: A panel-Data
Approach.” Economic Analysis & Policy, Vol.41, No.2 (September), pp. 173-187.
UNCTAD “United Nation Conference on Trade and Development”
http://unctadstat.unctad.org.
UNCTAD, World Investment Reports: (1985, 1995, 2005, and 2012).
World Bank Development Indicators, http://databank.worldbank.org.

APPENDICIES

26
APPENDIX
Table 9: List of analyzed MENA region countries
Algeria Jordan Saudi Arabia
Bahrain Kuwait Syria
Egypt Libya Turkey
Iran Morocco Tunisia
Israel Qatar United Arab Emirates
Table 10: List of analyzed Oil exporting MENA countries
Algeria Kuwait Saudi Arabia
Bahrain Libya United Arab Emirates
Iran Qatar
Table 11: List of analyzed Non-oil exporting MENA countries
Egypt Morocco Tunisia
Israel Syria
Jordan Turkey
27
VITA
Graduate School
Southern Illinois University
Mohamed S Abaid
Tripoli University
Bachelor of Science in Economics, January 1996
Tripoli University
Master of Science in Economics, September 2005
Research Paper Title:
The Impact of Foreign Direct Investment and Exports on Economic Growth
Case Study: Countries of the MENA Region from 1980 to 2011
Major Professor: Sylwester, Kevin