the impact of green marketing practices on competitive
TRANSCRIPT

The Impact of Green Marketing Practices on Competitive Advantage and Business
Performance among Manufacturing Small and Medium Enterprises (SMEs) in South
Africa
By
Eugine Tafadzwa Maziriri
A THESIS
Submitted in fulfilment of the requirements for the degree of
DOCTOR OF PHILOSOPHY
Business Sciences (Marketing)
Under the Supervision of:
Professor Richard Chinomona and Dr Norman Chiliya
in
The School of Economic and Business Sciences,
at the
UNIVERSITY OF THE WITWATERSRAND
2018

i
DECLARATION
This doctoral thesis is my own original effort.
All the sources which were utilised or referred to have been provided in the doctoral
thesis in the appropriate format.
This doctoral thesis has not been previously submitted in full or partial fulfilment as
deemed mandatory for the attainment of a higher education qualification or equivalent
at an educational institution.
APA was used as the referencing style.
Eugine Tafadzwa Maziriri
2018

ii
ACKNOWLEGDMENTS I praise God, the Almighty, for giving me the energy, discipline and strength to complete this
thesis. It is only due to His blessings that I could finish my thesis. I would like to express my
heartfelt indebtedness and deep appreciation to several people who played a major role in
completion of this thesis:
Firstly, I would like to thank Professor Richard Chinomona for the exceptional
learning experience provided by his guidance and supervision. Thank you for having
confidence in my potential and your valuable advice and intellectual support throughout the
journey will never be underestimated. I would never have made this far without your
guidance.
To Dr Norman Chiliya. Thank you, co-supervisor, for your invaluable advice and
guidance.
I would like to acknowledge both of my parents, Mr Herbert Maziriri and Mrs Tariro
Maziriri, whose love, unwavering support and words of wisdom I will never forget.
I am indebted to all the respondents who freely gave their valuable time to share their
experiences with me and for returning the questionnaires. Their contributions are
much appreciated
To Jennifer Croll for her expertise the language editing of this thesis.
Finally, to the staff members of the Commerce library (University of the
Witwatersrand) for their painstaking effort in obtaining the requested information in
the form of specific journal articles and textbooks.

iii
DEDICATION It is with most profound love, respect and admiration that I devote this thesis to my mom,
Tariro Maziriri. My mother, inspired and supported me throughout my scholarship. I am
hubled by her consolation and tremendous help in every one of the challenges I experienced.
My mom's unprecedented confidence in me and our confidence in God have guided me to the
fulfillment of this undertaking.
iv
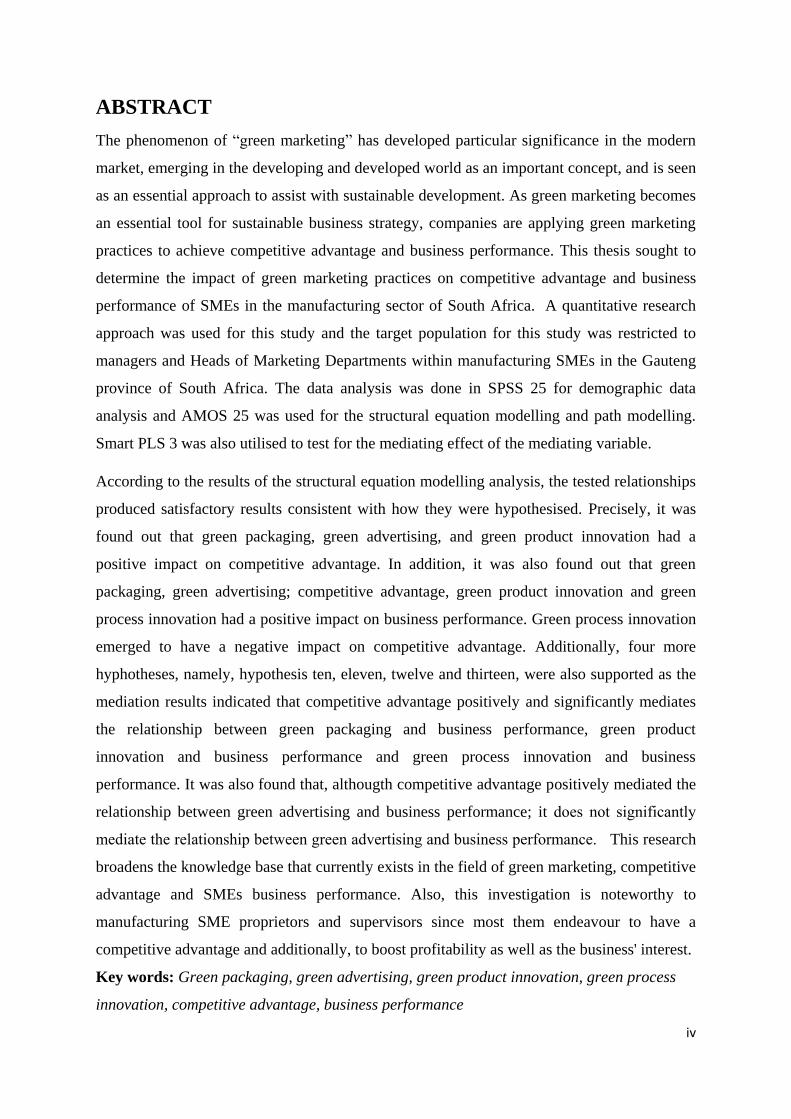
ABSTRACT
The phenomenon of “green marketing” has developed particular significance in the modern
market, emerging in the developing and developed world as an important concept, and is seen
as an essential approach to assist with sustainable development. As green marketing becomes
an essential tool for sustainable business strategy, companies are applying green marketing
practices to achieve competitive advantage and business performance. This thesis sought to
determine the impact of green marketing practices on competitive advantage and business
performance of SMEs in the manufacturing sector of South Africa. A quantitative research
approach was used for this study and the target population for this study was restricted to
managers and Heads of Marketing Departments within manufacturing SMEs in the Gauteng
province of South Africa. The data analysis was done in SPSS 25 for demographic data
analysis and AMOS 25 was used for the structural equation modelling and path modelling.
Smart PLS 3 was also utilised to test for the mediating effect of the mediating variable.
According to the results of the structural equation modelling analysis, the tested relationships
produced satisfactory results consistent with how they were hypothesised. Precisely, it was
found out that green packaging, green advertising, and green product innovation had a
positive impact on competitive advantage. In addition, it was also found out that green
packaging, green advertising; competitive advantage, green product innovation and green
process innovation had a positive impact on business performance. Green process innovation
emerged to have a negative impact on competitive advantage. Additionally, four more
hyphotheses, namely, hypothesis ten, eleven, twelve and thirteen, were also supported as the
mediation results indicated that competitive advantage positively and significantly mediates
the relationship between green packaging and business performance, green product
innovation and business performance and green process innovation and business
performance. It was also found that, althougth competitive advantage positively mediated the
relationship between green advertising and business performance; it does not significantly
mediate the relationship between green advertising and business performance. This research
broadens the knowledge base that currently exists in the field of green marketing, competitive
advantage and SMEs business performance. Also, this investigation is noteworthy to
manufacturing SME proprietors and supervisors since most them endeavour to have a
competitive advantage and additionally, to boost profitability as well as the business' interest.
Key words: Green packaging, green advertising, green product innovation, green process
innovation, competitive advantage, business performance

v
GLOSSARY OF TERMS
GDP: Gross domestic product
SEM: Structural equation modelling
AVE: Average Value Extracted
CR: Composite Reliability
HSV: Highest Shared Variance
CFI: Comparative fit index
CFA: Comfirmatory factor analysis
GFI: Goodness-of-fit Index
IFI: Increment fit Index
AMOS: Analysis of moment structure
AVE: Average variance extracted
TLI: Tucker-Lewis index
NFI: Normed fit index
RMSEA: Root mean square error of approximation (RMSEA)

vi
TABLE OF CONTENTS
ACKNOWLEGDMENTS ....................................................................................................... ii
DEDICATION........................................................................................................................ iii
ABSTRACT ............................................................................................................................. iv
LIST OF TABLES ................................................................................................................. xv
LIST OF FIGURES ............................................................................................................. xvii
1 CHAPTER ONE: INTRODUCTION AND BACKGROUND TO THE STUDY ...... 1
1.1 Introduction ............................................................................................................................. 1
1.2 Background to the study ......................................................................................................... 1
1.3 Problem statement and research gap ....................................................................................... 2
1.4 OBJECTIVES OF THE STUDY ............................................................................................ 5
1.4.1 Primary objective ............................................................................................................ 5
1.4.2 Theoretical objectives ..................................................................................................... 5
1.4.3 Empirical objectives ........................................................................................................ 5
1.4.4 Research Questions ......................................................................................................... 6
1.5 Significance of the Study ........................................................................................................ 6
1.5.1 Proposed theoretical value .............................................................................................. 6
1.5.2 Proposed practical value ................................................................................................. 7
1.5.3 Proposed policy value ..................................................................................................... 7
1.6 Preliminary literature review .................................................................................................. 7
1.7 Conceptual model and hypothesis development ..................................................................... 8
1.7.1 Hypotheses of the study .................................................................................................. 9
1.8 Research methodology .......................................................................................................... 10
1.8.1 Research Philosophy ..................................................................................................... 11
1.8.2 Quantitative research approaches .................................................................................. 11
1.9 Sampling design .................................................................................................................... 12
1.9.1 Target population .......................................................................................................... 12
1.9.2 Sample frame ................................................................................................................ 12
1.9.3 Sampling method .......................................................................................................... 13
1.9.4 Sample size ................................................................................................................... 13
1.10 Data collection ...................................................................................................................... 14
1.10.1 The data preparation ...................................................................................................... 14

vii
1.10.2 Data editing ................................................................................................................... 14
1.10.3 Data coding ................................................................................................................... 15
1.10.4 Data capturing ............................................................................................................... 15
1.10.5 Data cleaning ................................................................................................................ 15
1.11 Questionnaire design and measurement instrument .............................................................. 15
1.12 Statistical analysis ................................................................................................................. 16
1.12.1 Descriptive statistics ..................................................................................................... 16
1.12.2 Reliability and validity analysis .................................................................................... 16
1.12.3 Data analysis procedure and statistical approach .......................................................... 17
1.13 Ethical Consideration ............................................................................................................ 18
1.13.1 Informed consent........................................................................................................... 18
1.13.2 Maintenance of confidentiality and anonymity ............................................................. 18
1.14 The Structure of the Thesis ................................................................................................... 19
1.15 Chapter summary .................................................................................................................. 20
2 CHAPTER TWO: RESEARCH CONTEXT............................................................... 21
2.1 Introduction ........................................................................................................................... 21
2.2 South Africa as the study area ............................................................................................... 21
2.3 The Concept of Manufacturing ............................................................................................. 22
2.4 An overview of South Africa’s manufacturing sector .......................................................... 23
2.4.1 Agro-Processing ............................................................................................................ 25
2.4.2 Automotive ................................................................................................................... 26
2.4.3 Chemicals ...................................................................................................................... 26
2.4.4 Information Technology and Communications ............................................................ 26
2.4.5 Clothing and textile ....................................................................................................... 27
2.4.6 Metalworks ................................................................................................................... 27
2.4.7 Wood-working .............................................................................................................. 27
2.4.8 Paper and pulp ............................................................................................................... 27
2.5 Describing small and medium enterprises (SMES): a worldwide perspective ..................... 28
2.6 Description and classification of small and medium enterprises in south africa .................. 29
2.7 Different categories of SMEs in South Africa ...................................................................... 30
2.7.1 Microenterprises............................................................................................................ 30
2.7.2 Very small enterprises ................................................................................................... 31
2.7.3 Small enterprises ........................................................................................................... 31

viii
2.7.4 Medium businesses. ...................................................................................................... 31
2.8 Classification of manufacturing small and medium enterprises: a worldwide perspective .. 31
2.9 Description and classification of manufacturing small and medium enterprises in South
Africa 32
2.10 The role of manufacturing SMEs in South African economy ............................................... 34
2.11 Challenges faced by manufacturing small and medium enterprises ..................................... 38
2.11.1 Lack of product proliferation in manufacturing SMEs ................................................. 39
2.11.2 Competition ................................................................................................................... 39
2.11.3 Lack of innovation ........................................................................................................ 40
2.11.4 Lack of access to finance .............................................................................................. 40
2.11.5 Lack of Skills and Training ........................................................................................... 40
2.12 SMEs going green ................................................................................................................. 41
2.13 Chapter summary .................................................................................................................. 42
3 CHAPTER THREE: LITERATURE REVIEW: THEORETICAL FRAMEWORK
43
3.1 Introduction ........................................................................................................................... 43
3.2 The resource advantage theory of competition (RA) ............................................................ 44
3.3 Natural resource-based view theory (NRBV) ....................................................................... 45
3.4 The resource-based view model ............................................................................................ 47
3.5 The stakeholder theory .......................................................................................................... 50
3.5.1 Critiques on the stakeholder theory............................................................................... 52
3.6 The balanced scorecard theory .............................................................................................. 53
3.6.1 Financial Perspective .................................................................................................... 55
3.6.2 Customer Perspective .................................................................................................... 55
3.6.3 Internal Business Process Perspective .......................................................................... 56
3.6.4 Innovation/ Learning and Growth Perspective ............................................................. 56
3.7 Porter’s theory of competitive advantage ............................................................................. 56
3.7.1 Threat of new entrants ................................................................................................... 58
3.7.2 Bargaining power of suppliers ...................................................................................... 58
3.7.3 Competitive rivalry within the industry ........................................................................ 58
3.7.4 Bargaining power of customers .................................................................................... 59
3.7.5 Threat of substitutes ...................................................................................................... 59
3.8 Chapter summery .................................................................................................................. 59
ix
4 CHAPTER FOUR: LITERATURE REVIEW: EMPIRICAL LITERATURE ....... 60
4.1 Introduction ........................................................................................................................... 60
4.2 Historical overview of green marketing ................................................................................ 60
4.3 Green marketing defined ....................................................................................................... 62
4.4 Green marketing practices .................................................................................................... 63
4.5 Green packaging ................................................................................................................... 65
4.5.1 Reuse ............................................................................................................................. 67
4.5.2 Reduce ........................................................................................................................... 67
4.5.3 Recycle .......................................................................................................................... 68
4.5.4 Refill ............................................................................................................................. 68
4.6 Green advertising .................................................................................................................. 68
4.6.1 Intention of green advertisements ................................................................................. 70
4.7 Green innovation ................................................................................................................... 71
4.7.1 Green product innovation .............................................................................................. 72
4.7.2 Green process innovation .............................................................................................. 74
4.8 Competitive advantage .......................................................................................................... 76
4.8.1 The concept of competitive advantage .......................................................................... 76
4.8.2 Perspectives of competitive advantage ......................................................................... 78
4.8.3 A short examination of the three views ......................................................................... 80
4.9 Business performance ........................................................................................................... 81
4.9.1 Why business performance is measured ....................................................................... 82
4.9.2 Measures of Business Performance: An Overview ....................................................... 83
4.9.3 The use of subjective business performance measures in the present study ................. 91
4.10 Chapter summary .................................................................................................................. 91
5 CHAPTER 5: CONCEPTUAL MODEL AND HYPOTHESIS DEVELOPMENT 93
5.1 Introduction ........................................................................................................................... 93
5.2 Conceptual model ................................................................................................................. 93
5.3 Hypothesis development ....................................................................................................... 95
5.3.1 Green packaging and competitive advantage ................................................................ 96
5.3.2 Green advertising and competitive advantage .............................................................. 98
5.3.3 Green product innovation and competitive advantage ................................................ 100
5.3.4 Green process innovation and competitive advantage ................................................ 102

x
5.3.5 Green packaging and business performance ............................................................... 105
5.3.6 Green advertising and business performance .............................................................. 107
5.3.7 Competitive advantage and business performance ..................................................... 108
5.3.8 Green product innovation and business performance ................................................. 111
5.3.9 Green process innovation and business performance ................................................. 113
5.3.10 Competitive advantage as a variable mediating the relationship between green
packaging, green advertising, green product innovation, green process innovation, and business
performance ................................................................................................................................ 114
5.4 Chapter summary ................................................................................................................ 116
6 CHAPTER 6: RESEARCH METHODOLOGY AND DESIGN ............................. 118
6.1 Introduction ......................................................................................................................... 118
6.2 Philosophical foundations and research paradigms ............................................................ 118
6.2.1 Positivism .................................................................................................................... 120
6.2.2 Post-positivism ............................................................................................................ 121
6.2.3 Interpretivism .............................................................................................................. 122
6.2.4 Pragmatism ................................................................................................................. 122
6.3 Research logic ..................................................................................................................... 124
6.3.1 Research logic adopted for this Study ......................................................................... 126
6.4 Research strategy ................................................................................................................ 127
6.4.1 Research strategy adopted for this study ..................................................................... 129
6.5 Research design .................................................................................................................. 129
6.5.1 Types of research designs ........................................................................................... 130
6.5.2 Exploratory research ................................................................................................... 131
6.5.3 Descriptive research .................................................................................................... 132
6.5.4 Causal research ........................................................................................................... 132
6.6 Qualitative and quantitative research approaches ............................................................... 132
6.7 Sampling design procedure ................................................................................................. 135
6.7.1 Target population ........................................................................................................ 135
6.7.2 The sample frame ........................................................................................................ 136
6.7.3 Sampling method ........................................................................................................ 136
6.7.4 Sample size ................................................................................................................. 138
6.8 Data collection .................................................................................................................... 139
6.8.1 Questionnaire design ................................................................................................... 140
6.8.2 The questionnaire layout and questions format .......................................................... 141
xi
6.9 Pre-testing the questionnaire ............................................................................................... 146
6.10 Pilot study ........................................................................................................................... 146
6.11 DATA PREPARATION ..................................................................................................... 147
6.11.1 Data editing ................................................................................................................. 147
6.11.2 Data coding ................................................................................................................. 147
6.11.3 Data capturing ............................................................................................................. 148
6.11.4 Data cleaning .............................................................................................................. 149
6.12 Data analysis ....................................................................................................................... 149
6.12.1 Descriptive statistics ................................................................................................... 149
6.13 Reliability ............................................................................................................................ 152
6.13.1 Cronbach’s alpha reliability test.................................................................................. 153
6.13.2 Composite reliability (CR) test ................................................................................... 154
6.13.3 Average value extracted (AVE) test ........................................................................... 154
6.14 Validity ............................................................................................................................... 155
6.14.1 Convergent validity ..................................................................................................... 155
6.14.2 Discriminant validity ................................................................................................... 156
6.15 Structural equation modelling (SEM) ................................................................................. 156
6.15.1 Measurement model .................................................................................................... 158
6.15.2 Confirmatory factor analysis ....................................................................................... 158
6.15.3 Chi-square (x2/df) ........................................................................................................ 159
6.15.4 Goodness-of-fit Index (GFI) ....................................................................................... 159
6.15.5 The Normed Fit Index (NFI) ....................................................................................... 160
6.15.6 Tucker Lewis index (TLI) ........................................................................................... 161
6.15.7 The Comparative fit index (CFI) ................................................................................ 162
6.15.8 The incremental fit index (IFI) .................................................................................... 162
6.15.9 Root mean square of approximation (RMSEA) .......................................................... 162
6.16 Structural model .................................................................................................................. 164
6.16.1 Path analysis ................................................................................................................ 165
6.17 Testing for mediation .......................................................................................................... 166
6.18 Ethical consideration ........................................................................................................... 168
6.19 Chapter Summary ............................................................................................................... 169
7 CHAPTER 7: DATA ANALSIS AND PRESENTATION OF RESULTS .............. 170
7.1 Introduction ......................................................................................................................... 170

xii
7.2 Results of the pilot test ........................................................................................................ 170
7.3 Main survey results ............................................................................................................. 171
7.3.1 Biographical information of the sample ...................................................................... 171
7.3.2 Age distribution of the respondents ............................................................................ 174
7.3.3 Level of education ....................................................................................................... 175
7.3.4 Family business ........................................................................................................... 176
7.3.5 Number of employees (full-time)................................................................................ 177
7.3.6 Age of business (years) ............................................................................................... 178
7.3.7 The location of the business ........................................................................................ 179
7.4 Descriptive statistics ........................................................................................................... 180
7.5 Research Study Measure of Reliability and Validity .......................................................... 184
7.5.1 Internal consistency of reliability analysis: Green packaging ..................................... 184
7.5.2 Internal consistency of reliability analysis: Green advertising ................................... 186
7.5.3 Internal consistency of reliability analysis: Green Product innovation ....................... 187
7.5.4 Internal consistency of reliability analysis: Green process innovation ....................... 188
7.5.5 Internal consistency of reliability analysis: Competitive advantage ........................... 189
7.5.6 Internal consistency of reliability analysis: Business performance ............................ 191
7.6 Summary accuracy statistics for the model ......................................................................... 192
7.6.1 Cronbach’s coefficient alpha test ................................................................................ 193
7.6.2 Composite reliability (CR) .......................................................................................... 193
7.6.3 Average variance extracted (AVE) ............................................................................. 194
7.7 Validity analysis .................................................................................................................. 194
7.7.1 Convergent validity ..................................................................................................... 194
7.7.2 Discriminant validity: Correlation between constructs ............................................... 194
7.7.3 Average Variance Extracted (AVE) and Shared Variance (SV) ................................. 195
7.8 STRUCTURAL EQUATION MODELLING .................................................................... 196
7.8.1 Conceptual model fit assessment ................................................................................ 196
7.8.2 Structural Equation Modelling Analysis (SEM) ......................................................... 198
7.9 Hypotheses testing .............................................................................................................. 202
7.9.1 Green packaging and competitive advantage .............................................................. 202
7.9.2 Green advertising and competitive advantage ............................................................ 202
7.9.3 Green product innovation and competitive advantage ................................................ 202
7.9.4 Green process innovation and competitive advantage ................................................ 202
7.9.5 Green packaing and business performance ................................................................. 203

xiii
7.9.6 Green advertising and business performance .............................................................. 203
7.9.7 Competitive advantage and business performance ..................................................... 203
7.9.8 Green product innovation and business performance ................................................. 203
7.9.9 Green process innovation and business performance ................................................. 204
7.10 Testing for Mediation Effect among Variables Using Smart Pls 3 ..................................... 204
7.10.1 Significance of the mediation effect ........................................................................... 205
7.11 Summary of the chapter ...................................................................................................... 208
8 CHAPTER 8: DISCUSSION OF EMPIRICAL FINDINGS ................................... 209
8.1 Introduction ......................................................................................................................... 209
8.2 Discussion of findings from the conceptual model ............................................................. 209
8.2.1 Green packaging and competitive advantage .............................................................. 210
8.2.2 Green advertising and competitive advantage ............................................................ 210
8.2.3 Green product innovation and competitive advantage ................................................ 210
8.2.4 Green process innovation and competitive advantage ................................................ 211
8.2.5 Green packaging and business performance ............................................................... 211
8.2.6 Green advertising and business performance .............................................................. 212
8.2.7 Competitive advantage and business performance ..................................................... 212
8.2.8 Green product innovation and business performance ................................................. 212
8.2.9 Green process innovation and business performance ................................................. 213
8.2.10 Green packaging, competitive advantage and business performance ......................... 214
8.2.11 Green advertising, competitive advantage and business performance ........................ 214
8.2.12 Green product innovation, competitive advantage and business performance ........... 215
8.2.13 Green process innovation, competitive advantage and business performance ........... 215
8.3 Chapter summary ................................................................................................................ 215
9 CHAPTER 9: CONCLUSION, RECOMMENDATIONS AND FUTURE
RESEARCH SUGGESTIONS ............................................................................................ 217
9.1 Introduction ......................................................................................................................... 217
9.2 Overview of the Study ........................................................................................................ 217
9.3 THE EVALUATION OF THE OBJECTIVES OF THE STUDY ..................................... 217
9.3.1 Primary objective ........................................................................................................ 218
9.3.2 Theoretical objectives ................................................................................................. 218
9.3.3 Empirical objectives .................................................................................................... 220
9.4 Implications of the study ..................................................................................................... 224
9.4.1 Implications based on green packaging and competitive advantage ........................... 224

xiv
9.4.2 Implications based on green advertising and competitive advantage ......................... 225
9.4.3 Implications based on green product innovation and competitive advantage ............. 225
9.4.4 Implications based on green process innovation and competitive advantage ............. 225
9.4.5 Implications based on green packaging and business performance ............................ 226
9.4.6 Implications based on green advertising and business performance ........................... 226
9.4.7 Implications based on competitive advantage and business performance .................. 226
9.4.8 Implications based on green product innovation and business performance .............. 227
9.4.9 Implications based on green process innovation and business performance .............. 227
9.4.10 Implications based on green packaging, competitive advantage and business
performance ................................................................................................................................ 228
9.4.11 Implications based on green advertising, competitive advantage and business
performance ................................................................................................................................ 228
9.4.12 Implications based on green product innovation, competitive advantage and business
performance ................................................................................................................................ 228
9.4.13 Implications based on green process innovation, competitive advantage and business
performance ................................................................................................................................ 229
9.5 RECOMMENDATIONS .................................................................................................... 229
9.6 CONTRIBUTIONS OF THE STUDY ............................................................................... 230
9.6.1 The societal contribution ............................................................................................. 231
9.6.2 The Theoretical Contribution ...................................................................................... 231
9.6.3 Practical or managerial contribution ........................................................................... 231
9.6.4 The contribution to policy ........................................................................................... 232
9.7 LIMITATIONS AND SUGGESTIONS FOR FUTURE RESEARCH .............................. 232
APPENDIX C: PARTICIPANT INFORMATION SHEET ............................................ 303
APPENDIX D: QUESTIONNAIRE ................................................................................... 305
APPENDIX E: DATA ANALSYS RESULTS ................................................................... 312
APPENDIX C: LANGUAGE EDITING LETTER .......................................................... 336

xv
LIST OF TABLES Table 1.1: Definitions of Research Constructs .......................................................................... 8
Table 2.1: Classification of SMEs according to the National Small Business Act 102 of 1996
.................................................................................................................................................. 32
Table 4.1: The most important activities in green marketing history ...................................... 62
Table 4.2: Differences between Subjective and Objective Measures of Business Performance
.................................................................................................................................................. 84
Table 6.1: Fundamental Beliefs of Research Paradigms ....................................................... 120
Table 6.2: Summary of Classification Research Paradigm of the study – Positivism ........... 124
Table 6.3: Features of the different research strategies ......................................................... 128
Table 6.4: Difference between qualitative and quantitative research approaches ................. 134
Table 6.5: Green packaging measurement items (Adapted) .................................................. 142
Table 6.6: Green advertising measurement items (Adapted) ................................................. 142
Table 6.7: Green product innovation measurement items (Adapted) .................................... 143
Table 6.8: Green process innovation items (Adapted) ........................................................... 143
Table 6.9: Competitive advantage items (Adapted) .............................................................. 144
Table 6.10: Business performance measurement items (Adapted) ........................................ 145
Table 6.11: Example of a code book ..................................................................................... 148
Table 6.12: Forms of reliability and how they are administered ........................................... 153
Table 6.13: Model of fit an acceptable fit level ..................................................................... 163
Table 6.14: Theorised Variable Paths .................................................................................... 165
Table 6.15: Mediation theorised variable paths ..................................................................... 168
Table 7.1: Results of the pilot study ...................................................................................... 171
Table 7.2: Sample demographic Characteristics .................................................................... 172
Table 7.3: Gender ................................................................................................................... 174
Table 7.4: Age distribution of the respondents ...................................................................... 175
Table 7.5: Level of education ................................................................................................ 176
Table 7.6: family business ..................................................................................................... 176
Table 7.7: Number of employees (full-time) ......................................................................... 177
Table 7.8: Age of business (years) ......................................................................................... 178
Table 7.9: The location of the business ................................................................................. 179
Table 7.10: Descriptive statistical analysis (Section B –Green packaging) .......................... 180
Table 7.11: Descriptive statistical analysis (Section C –Green advertising) ......................... 181
Table 7.12: Descriptive statistical analysis (Section D – Green product innovation) ........... 181
Table 7.13: Descriptive statistical analysis (Section E –Green process innovation) ............. 182
Table 7.14: Descriptive statistical analysis (Section F-Competitive advantage) ................... 183
Table 7.15: Descriptive statistical analysis (Section G –Business performance) .................. 183
Table 7.16: Accuracy statistics analysis: Green packaging ................................................... 186
Table 7.17: Accuracy statistics analysis: Green advertising .................................................. 187
Table 7.18: Accuracy statistics analysis: Green product innovation ..................................... 188
Table 7.19: Accuracy statistics analysis: Green process innovation ..................................... 189
Table 7.20: Accuracy statistic analysis: Competitive advantage ........................................... 191
Table 7.21: Accuracy statistic analysis: busineness performance ......................................... 192

xvi
Table 7.22: Accuracy statistics analysis for the model .......................................................... 192
Table 7.23: Inter-construct correlation matrix ....................................................................... 195
Table 7.24: Construct AVE and HSV .................................................................................... 195
Table 7.25: Model fit results (CFA) ...................................................................................... 198
Table 7.26: SEM model fit indexes ....................................................................................... 199
Table 7.27: Hypothesised Relationships and Resulting Outcomes ....................................... 201
Table 7.28: Path coefficient values of mediation effect ........................................................ 204
Table 7.29: T-statistics and P values of mediator relationships ............................................. 206
Table 7.30: Hypothesised Relationships and Resulting Outcomes of the mediation effect .. 207
Table 8.1: Results of the hypothesised relationships ............................................................. 209

xvii
LIST OF FIGURES Figure 1.1: Conceptual model .................................................................................................... 9
Figure 1.2: Thesis Structure ..................................................................................................... 20
Figure 2.1: South Africa on the geographical map of Africa .................................................. 22
Figure 2.2: Provincial manufacturing activity ......................................................................... 25
Figure 2.3: Classification of SMEs in South Africa ................................................................ 30
Figure 2.4: Diagrammatic Representation of SMEs’ Contribution in South Africa................ 38
Figure 3.1: The resource-based view model ............................................................................ 48
Figure 3.2: The balance scorecard framework ......................................................................... 55
Figure 3.3: Porter’s Five Competitive Forces Model .............................................................. 57
Figure 4.1: Green packaging consciousness ............................................................................ 67
Figure 4.2: Sources of competitive advantage ......................................................................... 80
Figure 5.1: Conceptual model .................................................................................................. 95
Figure 5.2: Green packaging positively impacts competitive advantage ................................ 98
Figure 5.3: Green advertising positively impacts competitive advantage ............................. 100
Figure 5.4: Green product innovation positively impacts competitive advantage ................. 102
Figure 5.5: Green process innovation positively impacts competitive advantage ................. 105
Figure 5.6: Green packaging positively impacts business performance ................................ 107
Figure 5.7: Green advertising positively impacts business performance .............................. 108
Figure 5.8: Competitive advantage positively impacts business performance ...................... 110
Figure 5.9: Green product innovation positively impacts business performance .................. 112
Figure 5.10: Green prcess innovation positively impacts business performance .................. 114
Figure 5.11: Diagrammatic Illustration of Chapter 4 ............................................................. 117
Figure 6.1: Deductive research logic ..................................................................................... 125
Figure 6.2: Inductive research logic ....................................................................................... 126
Figure 6.3: Different research designs ................................................................................... 131
Figure 6.4: The steps in the sampling process ....................................................................... 135
Figure 6.5: Types of probability and non-probability sampling techniques .......................... 137
Figure 6.6: Step 1 in Baron and Kenny approach .................................................................. 166
Figure 6.7: Figure 6.6: Step 2 in Baron and Kenny approach ............................................... 166
Figure 6.8: Step 3 in Baron and Kenny approach .................................................................. 167
Figure 6.9: Step 4 in Baron and Kenny approach .................................................................. 167
Figure 7.1: Gender ................................................................................................................. 173
Figure 7.2: Age distribution of the respondents ................................................................ 174
Figure 7.3: Level of education ............................................................................................. 175
Figure 7.4: Family business ................................................................................................... 176
Figure 7.5: Number of employees (full-time) ........................................................................ 177
Figure 7.6: Age of business (years) ....................................................................................... 178
Figure 7.7: The location of the business ................................................................................ 179
Figure 7.8: CFA Model/Overall Measurement Model .......................................................... 197
Figure 7.9: SEM path model structure ................................................................................... 200
Figure 7.10: Structural model diagram used to test for mediation ........................................ 207

1
1 CHAPTER ONE: INTRODUCTION AND BACKGROUND
TO THE STUDY
1.1 Introduction
The chapter presents a background to the study, identification of research gaps and problem
statement, purpose of the study, research questions, conceptual model of the study,
hypothesis statements, an overview of the study's methodology, as well as the various
contributions of the study.
1.2 Background to the study
Small and Medium Enterprises (SMEs) have become a topical subject among management as
well as research practitioners all over the world and, this has led to a proliferation of research
interests centred on SMEs (Mafini & Omuruyi 2013). According to Van-Scheers and
Makhitha (2016), the total number of SMEs in South Africa is just over 2 million and they
contribute between 52 and 57% to the nation’s GDP and provide about 61% of the people
employed. A previous study conducted by Fourie (2015) indicated that the South African
SME industry accounts for 91% of formal businesses and that these SMEs contribute up to
57% to the South African GDP. Nyman, Kennon, Schutte and Von Leipzig (2014) also
mentioned that SMEs contribute considerably to the national GDP and to private sector
employment. Love and Roper (2013) stated that SMEs play a vital role in economic
development as they have been the main source of employment generation and output
growth, both in developing as well as in developed countries. SMEs are also the fastest
growing segment of most economies and are perceived to be more flexible and adaptable in
terms of structure and speed of response than larger organisations (Kumar 2012).
Terziovski (2010) explains that SMEs in the manufacturing sector make a significant
contribution to economic growth. According to the Small Enterprise Development Agency
(SEDA) (2012), SMEs have been identified as key drivers in the quest to create more
employment in all economic sectors and specifically, the manufacturing sector. The Gauteng
provincial government intends to support and grow SMEs in the manufacturing sector by
developing partnerships with successful SME initiatives through agencies (governmental and

2
nongovernmental) and local municipalities within the province (Small Enterprise
Development Agency, 2012).
Ebitu (2016) explains that SMEs find themselves in a competitive environment both locally
and globally, hence effective marketing practices are required to have a competitive edge
over competitors, as well as to improve the business performances of the SMEs. Carneiro,
Cunha, Fereira and Shamsuzzoha (2013) point out that in order to survive in today’s
competitive business environment, manufacturing firms, especially SMEs, are required to
join efforts and to collaborate and share the needed knowledge, capabilities, capital and vital
mass to grow innovative businesses and deliver higher quality and multifaceted products.
In addition, to compete and survive in a highly competitive global marketplace, it is
important for manufacturing SME managers to resort to the utilisation of green marketing
practices in order to have a competitive edge over their rivals, as well as to improve business
performance (Osuga, 2016). Also, Kimani (2015) contends that green marketing practices in
general, influence performance and that in relation to individual measures of performance,
green marketing practices have a statistically significant effect on innovativeness,
effectiveness, as well as competitive advantage.
In light of the above, this study examines the impact of four green marketing practices,
namely, green product innovation, green process innovation, green packaging and green
advertising on the competitive advantage and their impact on competitive advantage, as well
as business performance among manufacturing SMEs in South Africa.
1.3 Problem statement and research gap
Despite the apparent significance of SMEs, and the numerous policy initiatives introduced by
respective governments in the developing economies during the past decade to accelerate the
growth and survival of SMEs, the performance of SMEs has been disappointing (Njoroge
2015). Ebitu, Ufot and Olom (2015) are of the view that small businesses face many
problems. Mazanai (2012) points out that, in South Africa, SMEs in the manufacturing sector
are faced with a great challenge of fighting competition with large established businesses.
Omar and Anas (2014) concur that extensive competition among SMEs, large firms’
competition, and seasonal demand are also among the serious problems that are often
experienced by SMEs. Cant and Wiid (2013) are also of the view that competition is a
marketing factor which has a negative impact on SMEs.

3
In addition, Mthabela (2015) emphasises that despite the attempts made by the South African
government to assist in developing the SME sector, most manufacturing SMEs in
Johannesburg are failing to develop into successful and sustainable businesses. Lekhanya
(2010) investigated the use of marketing strategies by SMEs, and the results revealed that
there was a lack of marketing knowledge and expertise and limited use of marketing strategies
by the owners/managers of rural SMEs.
Available literature related to green marketing practices, competitive advantage and business
performance of SMEs has many deficiencies. Notably, most international studies conducted
in inter alia, Peru, Mexico and the US, have examined SMEs by mainly focusing on crisis
management and strategic orientation (Parnell, 2015). Other studies included entrepreneurial
orientation and SME performance in China’s changing environment (Tang & Tang 2012);
entrepreneurial orientation and business performance of small and medium scale enterprises
in Sri Lanka (Faizol; Haribuni& Tanaka 2010); innovation and competitive advantage with
the moderating effects of firm age in foods’ manufacturing SMEs in Malaysia (Aziz &
Samad 2016); SME performance in Nigeria (Aminu & Shariff 2015); intellectual capital as
competitive advantage in Latin America (Jardon, & Martos, 2012); E-business, organisational
innovation and firm performance in manufacturing SMEs in Spain (Soto-Acosta, Popa &
Palacios-Marqués 2016), as well as the effects of intangible resources and competitive
strategies on the export performance of metal, textile, chemical and furniture industry in
Turkey (Kumlu 2014). Inferring from the aforementioned studies, it is essential to note that
most of the studies were carried out in European, Asian and West African countries, but
literature does not provide any evidence of southern African countres, particularly, South
Africa, a country on the southernmost tip of the African continent.
It is also imperative to note that, despite the theoretical contributions made by many
international scholars on green marketing practices, competitive advantage and business
performance, it appears that within the South African context, there is a dearth of research
studies that have shed light on the impact of green marketing practices on competitive
advantage as well as how competitive advantage has an impact on the business performance
of manufacturing SMEs in South Africa. Previous researchers in South Africa have examined
SMEs in various contexts by focusing on why SMEs go green (Hamann, Smith, Tashman &
Marshall 2017); the effectiveness of E-commerce among SMEs in Polokwane, South Africa
(Molapo 2014); barriers to effective supply chain management and implementation, and the
impact on business performance of SMEs in South Africa (Dubihlela & Omoruyi 2014); the

4
impact of entrepreneurial orientation on access to debt finance and performance of SMEs in
South Africa (Fatoki 2012); a literature review of small and medium enterprises (SME) risk
management practices in South Africa (Smit & Watkins 2012); enterprise resource planning
in manufacturing SMEs in the Vaal Triangle (Dlodlo, 2011).
Considering the above gap, the researcher is convinced that there is a scarcity of research in
the reported literature that has investigated the impact of green marketing practices on
competitive advantage and how competitive advantage has an impact on the business
performance of manufacturing SMEs in the context of developing countries in Africa.
Therefore, this thesis seeks to expose the theoretical deficiencies of the literature and to make
an addition to it with empirical results. Furthermore, it is also essential to mention that there
is limited literature that focuses on green marketing practices as the predictor variables of
competitive advantage among SMEs. In addition, little is known about competitive advantage
as a mediator variable of the relationship between green marketing practices and business
performance. Gupta (2015) points out that in business schools and business circles; much
emphasis is placed on the role of competitive advantage as a predictor of the economic
fortunes of a nation. Moreover, the literature on competitive advantage and business
performance concentrated mainly on larger firms, while little evidence is available for SMEs.
This is confirmed by Chong (2008) as well as Harif, Hoe and Ahmad (2013), who pointed out
that a large proportion of the existing literature is devoted to studies on how large
organisations measure their performance. In addition, Chong (2008) and Harif, Hoe and
Ahmad (2013) argued that there is an apparent gap in understanding how SMEs measured
their performance. Additionally, Kumar (2015:1) points out that “though a sufficient
number of studies have focused upon green marketing practices and innovations in
companies, and their strategic importance, our knowledge of factors shaping green
marketing decisions and practices of small firms is relatively underdeveloped”.
On the basis of the research problem outlined above, and the research lacuna alluded, this
study aimed at determining the impact of green marketing practices on competitive advantage
as well as to determine if competitive advantage has an impact on business performance of
SMEs in the manufacturing sector of South Africa.

5
1.4 OBJECTIVES OF THE STUDY
1.4.1 Primary objective
The primary objective of this study was to determine the impact of green marketing practices
on competitive advantage, as well as to determine how competitive advantage has an impact
on business performance of SMEs in the manufacturing sector of South Africa.
1.4.2 Theoretical objectives
To address the primary objective of the study, the theoretical objectives were to review the
literature on:
resource advantage theory of competition
natural resource-based view theory
resource-based view model
the balanced scorecard theory
the stakeholder theory
Porter's five forces model
green packaging
green advertising
green product innovation
green process innovation
competitive advantage
business performance
1.4.3 Empirical objectives
In line with the theoretical and primary objectives of this study, the following empirical
objectives were formulated:
To determine the impact of green packaging, green advertising, green product
innovation and green process innovation on competitive advantage
To examine the impact of green packaging, green advertising, green product
innovation and green process innovation on business performance

6
To determine the impact of competitive advantage on business performance
To examine the mediating impact of competitive advantage on the relationship
between green packaging and business performance; green advertising and business
performance; green product innovation and business performance as well as green
process innovation and business performance
1.4.4 Research Questions
To accomplish the purpose of this study, an effort was made to answer the following research
questions:
RQ1: Does green packaging, green advertising, green product innovation and green process
innovation have a positive impact on competitive advantage?
RQ2: Is there any positive impact of green packaging, green advertising, green product
innovation and green process innovation on business performance?
RQ3: Does competitive advantage have a positive impact on business performance?
RQ4: Does competitive advantage positively mediate the relationship between green
packaging and business performance; green advertising and business performance; green
product innovation and business performance as well as green process innovation and
business performance?
1.5 Significance of the Study
Significance of this study was projected to be drawn from both theoretical and practical
values.
1.5.1 Proposed theoretical value
This research extends the knowledge base that currently exists in the field of green
marketing, competitive advantage, as well as SMEs business performance. The researchers
and academic community could use this study as a yardstick for further studies. The
students and academicians could use this study as a reference point and try to improve
on the areas that are not covered by the researcher in the future within this field of
green marketing, competitive advantage and SMEs business performance. Moreover, it is
anticipated that the findings will be of value to future researchers and scholars who may use
this study to conduct further studies. This study aims to provide practical implications.

7
1.5.2 Proposed practical value
This study will be of significance to manufacturing SME owners and managers since most of
them aim to maximise profitability and the business’ interest. This study will also help SMEs
owners and marketing managers of SMEs operating within the manufacturing sector to
identify the necessary green marketing practices that will give them a competitive advantage,
as well as enhance their business performance. Explicitly, manufacturing SMEs that develop
new and improved products and services with environment inputs in mind give themselves
access to new markets, increase their profit sustainability, and enjoy a competitive advantage
over the companies which are not concerned for the environment. Maiywa (2013) asserts that
there are basically five reasons for which a marketer should go for the adoption of green
marketing. They include opportunities or competitive advantage, corporate social
responsibilities (CSR), government pressure, competitive pressure and cost or profit issues
(Maiywa, 2013). Moreover, it can also be pointed out that competitors will use the study as a
tool to analyse weakness and strength of their opponents to enable them to make decisions to
outperform them.
1.5.3 Proposed policy value
The results of this study may be used to generate new policies and revise existing ones.
Preceisely, the study will be beneficial for effective policy formulation by various entities
such as the Government of South Africa which is charged with the responsibility of ensuring
organisations like manufacturing SMEs follow the set regulations in carrying out their
businesses to ensure environmental sustainability. Bodies like the National Business Initiative
(NBI); Environmental Evaluation Unit (EEU); Wildlife and Environment Society of South
Africa (WESSA) and Earthlife Africa, will also use this research for effective policy
formulation on environmental management issues.
1.6 Preliminary literature review
This section provides a preliminary review of the research constructs used in the study. The
constructs of interest include green packaging; green advertising, green product innovation,
green process innovation, competitive advantage and business performance. Subsequently,
the main review of this study is covered in chapter 4.

8
Table 1.1: Definitions of Research Constructs
Variable Definition and Source
Green packaging Green advertising is related to communicating organisational
commitment towards sustainability, environmental initiatives of
companies and green product attributes in the market place
(Ghodeswa & Kumar, 2014).
Green advertising Green advertising is defined as “any ad that explicitly or implicitly
addresses the relationship between a product/service and the
biophysical environment, promotes a green lifestyle with or without
highlighting a product/service and presents a corporate image of
environmental responsibility” (Alniacik & Yilmaz, 2012, p. 209)
Green product
innovation
Green product innovation refers to the application of innovative
ideas leading to the design, manufacturing and marketing of new
products whose newness and greenness significantly outperform
conventional or competing products (Wong 2012).
Green process
innovation
Green process innovation refers to the modification of the current
operating processes and systems, aiming to produce new or
significantly improved green products which can reduce
environmental impact (Meeus & Edquist, 2006).
Competitive advantage Competitive advantage of a small enterprise is defined as the
combination of factors that distinguish a small enterprise from its
competitors, thus ensuring its unique position on the market
(Renko, Sustic & Butigan, 2011).
Business performance Davood and Morteza (2012) view business performance as the
ability of a firm to generate acceptable results and actions.
Source: Compiled by the researcher
1.7 Conceptual model and hypothesis development
A conceptual model was proposed to guide the empirical study, as shown in figure 1. The
conceptual model suggested that green packaging, green advertising, green product
innovation, and green process innovation were the predictor variables, while competitive
advantage was the mediator variable and business performance was the outcome variable.
The hypothesised relationships between the research constructs are stated hereafter.

9
Figure 1.1: Conceptual model
1.7.1 Hypotheses of the study
The following hypotheses were formulated from the conceptual model and they are presented
as follows:
H1: Green packaging has a positive impact on competitive advantage
H2: Green advertising has a positive impact on competitive advantage
H3: Green product innovation has a positive impact on competitive advantage
Green
Advertising
Green
Product
Innovation
Competitive
Advantage
Business
Performance
H3
Green
Packaging
Green
Process
innovation
H5
H6
H8
H9
H1
H2
H4
H7
Predictor variables Mediator variable
Outcome variables

10
H4: Green process innovation has a positive impact on competitive advantage
H5: Green packaging has a positive impact on business performance
H6: Green advertising has a positive impact on business performance
H7: Competitive advantage has a positive impact on business performance
H8: Green product innovation has a positive impact on business performance
H9: Green process innovation has a positive impact on business performance
H10: Competitive advantage positively mediates the relationship between green packaging
and business performance
H11: Competitive advantage positively mediates the relationship green advertising and
business performance
H12: Competitive advantage positively mediates the relationship green product innovation
and business performance
H13: Competitive advantage positively mediates the relationship green process innovation
and business performance
1.8 Research methodology
Research methodology represents the procedures of research methods followed by the
researcher (Krippendorf 2004). Traditionally, research has been the creation of true, objective
knowledge, following a scientific method. In turn, this is presented as data and facts of
reality; it is possible to acquire a reasonably adequate basis for empirically grounded
conclusions in a specific discipline when using the right methodology (Alvesson & Sköldberg
2009). Research methodologies directly impact the validity and generalisation of a study
(McGrath & Brinberg, 1983), and in turn, play a vital role in knowledge development of
international business (Yang, Wang & Su, 2006). Comprehending and using a relevant
methodology in the present study is essential to identify the proper unit of analysis and
employ compatible methods that will provide the intended results. A research design
typically includes:
How data is to be acquired (sampling design)
What instruments will be employed (measurement items, source and measurement
scale)

11
How the instruments will be utilised (data collection method), and
The intended means for analysing the data collected (data analysis procedure and
statistical approach)
1.8.1 Research Philosophy
Every research process should involve a degree of philosophical introspection and this
process involves, at every step, making choices, which require philosophical underpinnings
(Cohen 2006). All research has a philosophical foundation and assumptions that shape the
processes of research and conduct of enquiry within a paradigm. Kuhn (1996) defines a
paradigm or worldview as a set of generalisations, beliefs, and values of a community of
specialists. Barker (1992) asserts that it establishes or defines boundaries and gives direction
for a research study. The paradigm is therefore a way to model possible patterns and
relationships and give coherence to research studies (Trafford & Leshem, 2012). The main
research paradigms that dominate the contemporary literature include post-positivism,
constructivism, participatory and pragmatism (McMillian & Schumacher, 2010).
For this study, a positivism paradigm was adopted to guide the researcher in philosophical
assumptions about the research and in the selection of tools, instruments, participants, and
methods used in the study. Positivism relies on the hypothetico-deductive method (McGrath
& Johnson 2003), and this enabled the researcher to verify a priori hypotheses which was be
converted into mathematical formulae to express causal relationships of the variables.
According to Ponterotto (2005), the primary goal of positivism inquiry is an explanation,
which results in the projection and control of phenomena. Positivism is related more closely
to the logic of, and ways for, conducting quantitative research (Erisson & Kovalainen 2008).
1.8.2 Quantitative research approaches
Sheldon (2015) is of the view that the quantitative research approach pays attention to the
objective measurement and the statistical, mathematical, or numerical analysis of the
collected data by making use of polls, questionnaires, and surveys, or by controlling pre-
existing statistical data using computational techniques. In quantitative research, data are
quantified to apply statistical techniques to gain meaningful insights into relationships
(Dhurup, Mafini & Dumasi 2014). From a broader perspective, it can be defined as a type of
empirical research into a social phenomenon or human problem, testing a theory consisting of
variables, which are measured with numbers and analysed with statistics in order to
determine if the theory explains or predicts phenomena of interest (Yilmaz 2013).

12
The researcher opted for a quantitative research approach for this study, because it enhances
the accuracy of results through statistical analysis (Berndt & Petzer 2011) and avoids the
elements of subjectivity associated with the qualitative approach (Du Plessis & Rosseau
2007). Moreover, the researcher followed a quantitative approach, since quantitative research
is used to answer questions about relationships among measured variables with the purpose
of explaining, predicting and controlling phenomena (Lotz & Van der Merwe 2013).
1.9 Sampling design
Tustin et al. (2005) observed that a sampling design was an outline that is employed in
determining who takes part in a study, which specific respondents to consider, the number to
choose and the strategy to select. Respondents were outlined in the current study based on:
the target population, the sampling frame, sampling method, and sample size.
1.9.1 Target population
Malhotra (2010) defines a target population as a collection of homogeneous elements or
objects that possess the information sought by the researcher and about which inferences are
to be made. The population comprised all small and medium business organisations classified
as SMEs operating within the manufacturing sector and who are located within the Gauteng
region of South Africa. Precisely, this study was restricted to managers of SMEs and Heads of
Marketing Departments within manufacturing SMEs operating in the Gauteng region of South
Africa.
1.9.2 Sample frame
The sampling frame can be thought of as the realistic version of the study population, which
the researcher can identify and access (Davis, Gallardo & Lachlan 2012). A sample frame
constitutes a list of all eligible sampling units or a database for obtaining a representation of
the elements of the target population (Maholtra 2010). Some common sources of sample
frames are lists of registered ratepayers, customer lists or voters’ lists. For this study, the
sampling frame for the study consisted of manufacturing SMEs operating within the Gauteng
region. A list of 1945 manufacturing small and medium enterprises in Gauteng was obtained
from the Small Enterprise Development Agency (SEDA), a centre of excellence for small
enterprise development in South Africa. Respondents who were included in the survey were
provided with questionnaires which they had to complete. The next section discusses the
sampling method used in this study.

13
1.9.3 Sampling method
The choice of the sample method depends on factors such as the nature of the research
problem, the research objectives, cost and time limitations (McDaniel & Gates 2008). Tustin,
Ligthelm, Martins and Van Wyk (2010) explain that non-probability sampling involves
sampling techniques that rely on the personal judgement of researchers instead of the use of
chance selection procedures. Additionally, non-probability samples may yield good estimates
of the population characteristics (Sudman & Blair 2002). Malhotra (2010) states that
probability samples are selected in such a way that every element of the population has a
known likelihood of being included in the sample, with probability sampling techniques
including random, systematic, stratified, cluster and multistage sampling. This study
employed a probability sample, mainly because of its representativeness of the target
population, which enhances the generalisability of the results to a larger population (Berndt &
Petzer, 2011). Precisely, simple random sampling technique was used in the study, since each
element of the population has an equal and known chance of being selected as part of the
sample (Weideman, 2014).
1.9.4 Sample size
A sample can be defined as a portion of a larger population (Dube, Roberts-Lombard & Van
Tonder, 2015). Roets (2013) defines sample size as the count of factors involved in the study.
Kumar (2014), as well as Gupta (2011), posits that the number of subjects in a study is called
the sample size and refers to the elements to be included in a research study. The
determination of a sample size is influenced by many factors, including the research design;
the average sample size used in similar studies, the number of variables and proposed
methods of data analysis (Malhotra 2010). In determining the sample size for the study, the
list of the SMEs was obtained from the Small Enterprise Development Agency (SEDA). The
sample size was calculated using the Raosoft sample size calculator, which takes into
consideration four factors in determining sample size, namely, the margin of error, the
confidence level, the population and the response distribution.
The margin of error: The margin of error (also known as the confidence interval) measures
the precision with which an estimate from a single sample approximates the population value.
The margin of error ranges from 3% to 7% in business research, with 5% being the most
commonly accepted.
Confidence level: The confidence level is the estimated probability that a population estimate
lies within a given margin of error. It is the amount of uncertainty that the researcher can

14
tolerate. The confidence interval in business research varies from 90% to 100% with 95%
being the most commonly accepted.
The population: This population to be used for the study.
Response distribution: This answers the question, “for each question in the questionnaire,
what does the researcher expects the answer to be”. If the answer is skewed highly one way
or the other, the population is probably skewed too. 50% is usually used as the response
distribution as it gives the largest sample size (Raosoft, 2009).
The researcher chose the default settings on Raosoft© which had a margin of error at 5%,
confidence level at 95%, population size at 1945, and a response distribution of 50%.
Raosoft© then calculated that the sample size needed for the survey would be 321
respondents.
1.10 Data collection
The data was collected in Gauteng Province, South Africa. According to Berndt and Petzer
(2011), data collection comprises the actual collection of responses from the identified
sample. A self-administered, structured questionnaire was used for collecting the necessary
data. McDaniel and Gates (2007) highlight that survey methods involve the use of structured
questionnaires, with the objective being to extract specific data from participants. The survey
method was chosen due to its low cost and ease of administration (Malhotra 2010).
1.10.1 The data preparation
The data preparation process is the first step when analysing data in completed questionnaires
(Cooper & Schindler 2011). According to Hair, Lukas, Miller and Ortinau (2008), data
preparation is regarded as a process of converting data from a questionnaire into a format that
can be analysed. The process of data preparation involved checking the data for accuracy
before entering it into the computer (Cooper & Schindler 2006). There were four phases of
data preparation, which the researcher employed in this study, namely data editing, coding,
capturing and cleaning. These phases were employed to ensure that the data collected was
complete and ready for analysing (Kumar, Aaker & Day 2004).
1.10.2 Data editing
According to Malhotra (2010), editing is the review of the questionnaires with the objectives
of increasing accuracy and precision. Zikmund and Babin (2013) maintain that editing
consists of checking completed questionnaires for omissions, incomplete or otherwise
unusable responses, illegibility and obvious inconsistencies. McDaniel and Gates (2005)

15
describe editing as going through each questionnaire to make certain that the skip pattern is
followed and the required questions are completed. In this study, the minimum quality
standards imposed included discarding questionnaires where more than 10 percent of the
responses were missing, as well as those with ambiguous responses.
1.10.3 Data coding
According to Zikmund and Babin (2010), coding is regarded as the technical procedure by
which raw data are transformed into symbols and it involves specifying the alternative
categories or classes into which the responses are to be placed and assigning code numbers to
the class. Data coding describes the process of grouping and assigning numeric codes to
responses of a question or statement (McDaniel & Gates 2013). For this study, a code book
was prepared in order to successfully enter the information from the research questionnaire
into the format that SPSS can understand.
1.10.4 Data capturing
Data capturing is a method of transferring coded information from the questionnaires or
coding sheet directly into the computer by keypunching (Malhotra 2010). In this study, the
researcher, using the Microsoft Excel program, performed data capturing whereby data was
entered directly from the questionnaires with the use of a personal computer and then fed into
a Microsoft Excel spread sheet.
1.10.5 Data cleaning
The cleaning process consisted of dealing with values that fall outside of a scale code and
data that was left out (Fourie 2015). Data cleaning was done by making use of wild code
checks to detect codes that are not defined for a variable, including extreme cases for
responses to a variable that is far from ordinary (Malhotra 2010).
1.11 Questionnaire design and measurement instrument
A self-administered, structured questionnaire was used as the research instrument. Leedy and
Ormrod (2010) posit that a questionnaire is research in which the researcher poses a series of
questions to willing participants, summarises their responses with percentages, frequency
counts, or more sophisticated statistical indices, from which references are drawn about a
population. The questionnaire was divided into nine (9) sections, Section A measured the
demographic profile; Sections B, C, D and E were questions on the independent variables,
Section F provided questions on the mediating variable, while the Section G was questions on
the outcome variable.

16
The research scales were operationalised on the basis on previous work. Proper modifications
were made, to fit the current research constructs and purpose. For the measurement of green
packaging, a five-item scale was adapted from Sambu (2016) and Kong, Harun, Sulong and
Lily (2014). “Green advertising” was measured using a six-item scale adapted from
Ghodeswa and Kumar (2014). “Green product innovation” was measured on a seven-item
scale which was adapted from Cheng, Yang, and Sheu (2014). Additionally, “green process
innovation” was measured on a four-item scale which was adapted from Kawai, Strange and
Zucchella (2016). Futhermore, “competitive advantage” was measured using an eleven-item
scale adapted from Almahamid (2008). Moreover, business performance was measured using
sixteen item-scales adapted from Zulkiffli and Perera (2011).
Respondents were requested to indicate the extent of their agreement with each statement by
means of a five-point Likert scale, where 1= strongly disagree, 2 = disagree, 3 = neither
disagree nor agree/neutral, 4 = agree and 5 = strongly agree.
1.12 Statistical analysis
Once the data was collected, the researcher made sense of them. To achieve this, the
researcher organised and coded the data so that it could be analysed. Descriptive statistics
were used to describe and present the data gathered for the research study. To make
inferences of the data obtained, the Statistical Packages for Social Sciences (SPSS) and the
Analysis of Movement Structures (AMOS) packages were used for testing and confirming
relationships among hypothesised variables.
1.12.1 Descriptive statistics
Liphadzi (2015) explains that descriptive statistics are used to present quantitative
descriptions in a manageable form. It analyses the responses either as percentages, if the
sample is large, or as actual numbers, if the sample is small (Yokwana 2015). Descriptive
statistics describe what the data is showing, as well as providing the researcher with a
snapshot of what the data looks like (Liphadzi 2015). The main goal of using descriptive
statistics is to describe and summarise the characteristics of a sample (O’Leary 2010).
Therefore, this study made use of descriptive statistics to analyse the composition and
normality of the data.
1.12.2 Reliability and validity analysis
In this study, both reliability and validity tests were conducted to ensure that the appropriate
research instrument was utilised. Tichaawa and Mhlanga (2015) define reliability as the extent
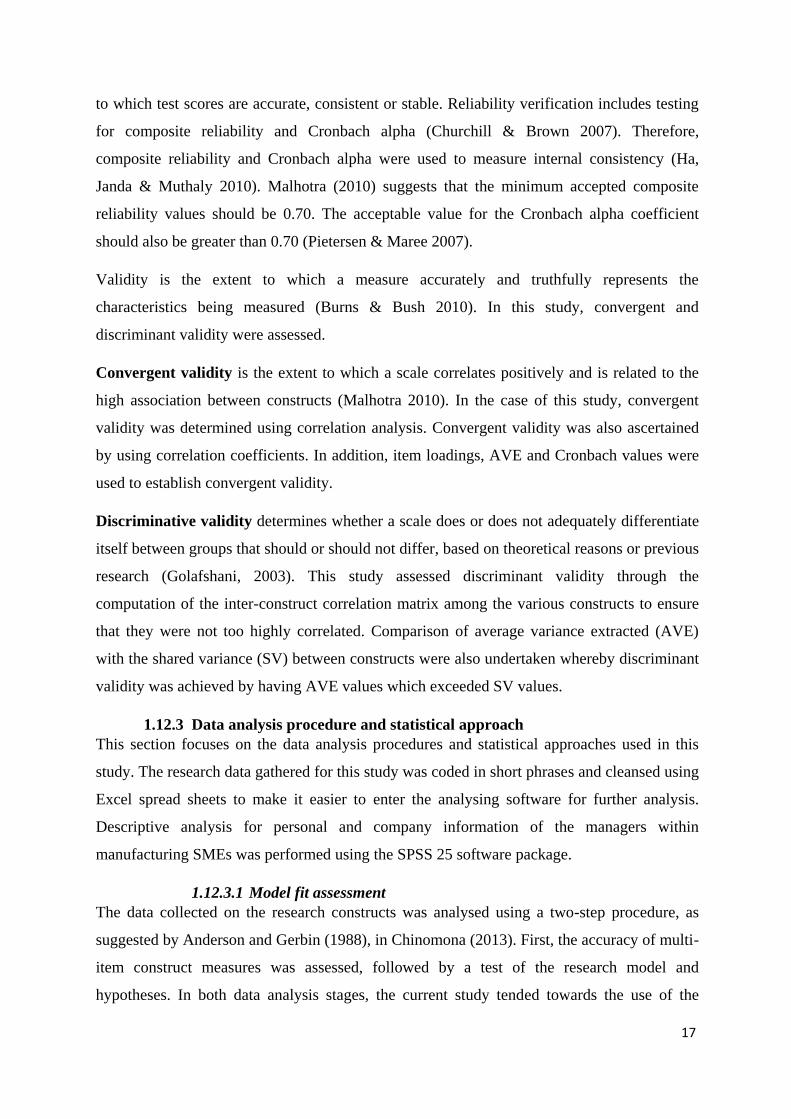
17
to which test scores are accurate, consistent or stable. Reliability verification includes testing
for composite reliability and Cronbach alpha (Churchill & Brown 2007). Therefore,
composite reliability and Cronbach alpha were used to measure internal consistency (Ha,
Janda & Muthaly 2010). Malhotra (2010) suggests that the minimum accepted composite
reliability values should be 0.70. The acceptable value for the Cronbach alpha coefficient
should also be greater than 0.70 (Pietersen & Maree 2007).
Validity is the extent to which a measure accurately and truthfully represents the
characteristics being measured (Burns & Bush 2010). In this study, convergent and
discriminant validity were assessed.
Convergent validity is the extent to which a scale correlates positively and is related to the
high association between constructs (Malhotra 2010). In the case of this study, convergent
validity was determined using correlation analysis. Convergent validity was also ascertained
by using correlation coefficients. In addition, item loadings, AVE and Cronbach values were
used to establish convergent validity.
Discriminative validity determines whether a scale does or does not adequately differentiate
itself between groups that should or should not differ, based on theoretical reasons or previous
research (Golafshani, 2003). This study assessed discriminant validity through the
computation of the inter-construct correlation matrix among the various constructs to ensure
that they were not too highly correlated. Comparison of average variance extracted (AVE)
with the shared variance (SV) between constructs were also undertaken whereby discriminant
validity was achieved by having AVE values which exceeded SV values.
1.12.3 Data analysis procedure and statistical approach
This section focuses on the data analysis procedures and statistical approaches used in this
study. The research data gathered for this study was coded in short phrases and cleansed using
Excel spread sheets to make it easier to enter the analysing software for further analysis.
Descriptive analysis for personal and company information of the managers within
manufacturing SMEs was performed using the SPSS 25 software package.
1.12.3.1 Model fit assessment
The data collected on the research constructs was analysed using a two-step procedure, as
suggested by Anderson and Gerbin (1988), in Chinomona (2013). First, the accuracy of multi-
item construct measures was assessed, followed by a test of the research model and
hypotheses. In both data analysis stages, the current study tended towards the use of the

18
structural equation modelling technique (SEM). A confirmatory factor analysis (CFA) was
performed using Amos 25 to access the measurement model. In addition, Amos 25 was
employed as the computation SEM software. The following model fit indicators were used to
assess the fitness of the model to the sample data: chi-square value over degree of freedom
(χ2/df), the values of Goodness-of-Fit Index (GFI/AGFI), Comparative Fit Index (CFI),
Incremental Fit Index (IFI), and Tucker-Lewis Index (TLI) and the Root Mean Square Error
of Approximation (RMSEA).
1.12.3.2 Hypotheses testing
To test the research hypotheses, a path analysis was performed to indicate the path coefficient
and significance levels of the posited nine linear relationships between the six research
constructs.
1.13 Ethical Consideration
The current study was governed by the University of the Witwatersrand’s condition that
necessitates studies concerning human participation to apply for human research ethics
committee’s approval before a study could be carried out. The researcher acquired the Ethics
Clearance certificate from the designated Ethics Committee at the University before
questionnaires were given out to respondents. The Protocol Number was H17/06/26 and a
copy of the certificate is attached in the Appendix section.
1.13.1 Informed consent
A consent form was given to each of the participants prior to their participating in the study.
Participants then became aware of what the researcher wanted them to do regarding the
probable risk prior to approving to take part in the actual data collection. Participants could
withdraw from the study if they felt uncomfortable in answering the questions as honestly as
they could.
1.13.2 Maintenance of confidentiality and anonymity
Confidentiality and anonymity was ensured in the entire research process. The researcher
assured participants that any information they provided, as far as the study was concerned
was safe and sound and no unauthorised individuals would have access to it. Participants
were also assured that copies of the findings could be made available to them upon request.
The data was collected and analysed as summative entities without given specifics on
respondents’ feedbacks or the demographic information.

19
1.14 The Structure of the Thesis
This thesis is structured in the following way: Chapter 2 provides an overview of the
context of the study, chapter 3 discusses the theoretical groundings of the study; chapter
4 discusses empirical literature relating to the construct in the study; this is followed by
chapter 5 which is centred on the discussion of the conceptual model and hypotheses
development; the research methodology is covered in chapter 6, while the statistical
analysis is discussed in chapter 7. The last two chapters discuss the findings of the study
(chapter 8) and the concluding remarks are provided in chapter 9. Figure 2 shows the
diagrammatic structure of the entire thesis.

20
PART A
Introduction and
Background of
the study
-----------------------
--------------------------------------------------------------------------------------
PART B
Literature review
& conceptual
Framework
--------------------------------------------------------------------------------------------------------------
PART C
Research design
Data analysis,
Findings and
Conclusion
Figure 1.2: Thesis Structure
Source: Compiled by the researcher
1.15 Chapter summary
This chapter gave an overview of the current study. Initially, the problem statement, purpose
of the research, research objectives and justification of the study were presented. In addition,
the research methodology and design are presented. Subsequently, ethical considerations of
research were discussed. The chapter ended with an outline of the research and the structure
of the thesis. The following chapter elaborates on the context of the present study.
Chapter2-
Research
context
Chapter 6-
Research
methodology
Chapter 4-
empirical
Literature
Chapter 7 –
Data Analysis
Chapter 3-
Theoretical
grounding
Chapter 1: Introduction and background of the study
Chapter 5-
Conceptual
framework and
hypothesis
development
Chapter 8-
Discussion of
findings
Chapter 9- Conclusion, Recommendations and Future Research
Suggestions

21
2 CHAPTER TWO: RESEARCH CONTEXT
2.1 Introduction
Chapter 1 outlined the purpose of the thesis and this current chapter (Chapter 2) delineates
the research context. This chapter discusses the research context by providing background
into South African Manufacturing SMEs and an overview of the South African
Manufacturing sector. Precisely, this chapter presents the research context based on the items
that have been arranged under the following headings: South Africa as the Study Area, the
concept of manufacturing, an overview of South Africa's manufacturing sector, describing
Small and Medium Enterprises (SMEs): A Worldwide Perspective, description and
classification of manufacturing Small And Medium Enterprises in South Africa, the role of
manufacturing SMEs in the South African economy and challenges faced by manufacturing
small and medium enterprises.
2.2 South Africa as the study area
South Africa is a young democracy and a middle-income developing country (Butler,
2017). Situated latitudinally between 22 per cent south to 3 per cent south, and longitudinally
between 17 per cent east and 33 per cent east, South Africa covers a total area of 470, 689
square miles, 1 219 080 square kilometres (Afọlayan, 2004). Bounded on the southwest by
the Atlantic Ocean and in the southeast by the Indian Ocean, South Africa shares boundaries
with Namibia in the northwest, with Botswana and Zimbabwe in the north, and with
Swaziland, Lesotho and Mozambique in the northeast (Afọlayan, 2004). In addition, South
Africa occupies a dominant economic position within Africa, which far exceeds its position
in terms of both physical and population size (Leste, Binns & Nel, 2014).
Beck (2013, p.101) claims that "South Africa, which occupies only 4 percent of the African
land mass, has the largest gross national product (GNP) of any country on the continent –
larger than that of Egypt, Kenya and Nigeria combined. More than one-third of the nation's
GNP is produced in the smallest province, Gauteng which includes Johannesburg and
Pretoria”. Conversely, Herbst and Mills (2015) stress that the overwhelming challenge that
South Africa faces, and has to date failed to address, is unemployment, which falls especially
on African youths who were promised a better future after 1994. In addition, Sam (2002)
highlighted that South Africa, as a developing country, faces many problems such as high

22
unemployment, low levels of working skills, poverty and rampant crime. The encouragement
of the development of SMEs might help to alleviate these problems and improve the levels of
skills in the country (Sam, 2002). Patterson and Winston (2016) also explain that SMEs
make a significant contribution to socio-political stability in developing economies such as
South Africa. Successful SMEs absorb not only a significant part of unemployment, but also
reduce crime and government expenditure on security and legal services (Patterson &
Winston, 2016). The study area is shown in figure 2.3:
Figure 2.1: South Africa on the geographical map of Africa
2.3 The Concept of Manufacturing
Manufacturing is a segment of the market accountable for generating a broad variety of
merchandise varying from food and beverages to chemicals, textiles and diverse metal
products (Nze, 2016). In addition, Bashar (2012, p. 328) asserts that “manufacturing is
significant for the transformation of any country”. According to Sunjka and Emwanu (2015),
manufacturing may be described as a process involving tools and labour to produce goods for
use or sale as intermediaries, or as final products, either domestically or internationally. Van
der Walt (2010:1) elucidates that “manufacturing comprises units engaged in the physical or
chemical transformation of materials, substances, or components into new products”. Momba

23
(2016) suggests that manufacturing is the process of transforming raw materials or semi-
finished products into finished products that have value in the market place, in order to use or
sell in the market. Additionally, the materials, substances, or components transformed are raw
materials that are products of agriculture, forestry, fishing, mining or quarrying as well as
products of other manufacturing activities (Van der Walt, 2010). In addition, Nzawou (2013)
views that manufacturing is not just about producing better goods than competitors, rather it
is about delivering an appropriate package of product and services as a solution to customer
problems.
2.4 An overview of South Africa’s manufacturing sector
According to Kambule (2014), the manufacturing sector is an essential sub-sector of the
industrial sector and this is because of its economic value and contribution to the economy at
large. Shafi (2016) is also of the view that the manufacturing sector is often seen as a vehicle
for diversifying the economy and attaining sustainable economic growth in both developed
and developing economies. However, Ho, Ahmad and Ramayah (2016) have shown that the
manufacturing sector is still highly relevant to a nation’s economy: (1) the manufacturing and
services sector are inseparable, (2) the manufacturing sector serves as an important source of
jobs for individuals at many skill levels, and (3) the manufacturing sector is important to
improve the trade account balance of a country.
Nzawou (2013) states that the South African manufacturing sector is well developed
compared to most developing countries and the sector is dominated by industries such as
agri-processing, automotive, chemicals, ICT and electronics, metals and textiles, clothing and
footwear. In addition, the manufacturing sector in South Africa (SA) is one of the largest
contributors to the country's gross domestic product (GDP) and has the greatest potential
to generate employment opportunities and enhance national economic growth (Urban &
Naidoo, 2012). In addition, the large and diverse manufacturing sector of South Africa is a
major contributor to the achievement of its macroeconomic objectives (SEDA, 2012).
According to Caga (2012), the manufacturing sector is a large contributor towards foreign
direct investment, job creation and retention and it also improves the balance of trade in
South Africa. In foreign trade, the manufacturing sector in South Africa accounts for 20 per
cent of export goods (Caga 2012).
Over the past decade, the manufacturing sector has been among the largest consumers of
energy, accounting for more than 50% of the total energy used in South Africa (USAID,

24
2012). The nature of work carried out in the manufacturing sector explains and arguably
justifies its energy intensity and emissions level (Kambule 2014). Furthermore,
manufacturing is an important sector of the South African economy, contributing 18% to the
Gross Domestic Product and employing more than one million people (Nzawou, 2013). In
addition, throughout history, the manufacturing sector has been considered as being at the
forefront of an economy that is advancing to higher levels of innovation and efficiency
(Wentzel & De Hart, 2015). The South African manufacturing sector is well developed
compared to most developing countries (Fedderke & Simbanegavi, 2005). Boris and Reggie
(2012) point out that the manufacturing sector in South Africa (SA) is one of the most
important contributors to the country’s Gross Domestic Product (GDP) and has the greatest
potential to create jobs and boost national growth. The South African manufacturing sector
contributes approximately 35% towards the country’s GDP and employs approximately 18%
of SA’s workforce (Naidoo & Urban 2010). Nzawou (2013) points out that within the
manufacturing sector, there are industries such as agri-processing, automotive, chemicals,
ICT and electronics, metals and textiles, clothing and footwear. Mpatane (2015) also concurs
that the manufacturing sector is dominated by industries such as these.
According to Mpatane (2015, p. 5) “manufacturing appears as an important sector of the
South African economy as it continues to appear among the top-three sectors with the highest
multiplier effects in terms of output, employment, export earnings and fiscal revenue".
According to Stats SA (2017), the manufacturing sector in South Africa forms part of the
three major sectors that build up the country's economy. The sector also forms part of the
largest power consuming sectors in the economy and manufacturing has a substantial direct
employment creation potential and is central to the country's export strategy (Department of
Trade and Industry (DTI). Figure 2.1 shows the percentage of manufacturing activity for each
province in South Africa.

25
Figure 2.2: Provincial manufacturing activity
Source: adapted from Kambule (2014).
Gauteng is the leading province in the formal and informal sectors in terms of the number of
SMEs (Sitharam, 2014). Deducing from figure 2.1, it can be pointed out that 41% of
manufacturing activity in South Africa comes from the Gauteng province of South Africa.
Mbatha (2014) concurs that the Gauteng Province contributes 40.8% to the country’s total
manufacturing output. Kambule (2014) points out that this is the reason why Gauteng is
regarded as the economic hub of the nation. Furthermore, Kambule (2014) states that some of
Gauteng's manufacturing firms are located in people's homes, backyards, and formal rental
spaces, and this is mostly applicable in the light manufacturing clusters. Brief discussions of
the dominating manufacturing clusters within the Gauteng province are elucidated as follows:
2.4.1 Agro-Processing
The agro-processing sector is defined in statistical terms by the food processing and beverage
manufacturing sub-sectors (Mpatane, 2015:5). These subsectors deal with the processing of
fresh water, aquaculture and mariculture, exotic and indigenous meat, nuts, herbs and fruits
(Mpatane, 2015:5). In addition, Dube (2014) points out that agriculture contributes 4 per cent
to South Africa's gross domestic product (GDP) and consists largely of cattle and sheep
farming, with only 13 per cent of the land used for growing crops.
41%
15% 8%
0%
4%
21%
3% 7%
1%
Manufacturing activity across provinces
Gauteng
Western Cape
Eastern Cape
Northern Cape
Free State
KwaZulu-Natal
North West
Mpumalanga
Limpopo

26
2.4.2 Automotive
According to Naude (2013), the automotive industry has grown to become the leading
manufacturing sector in South Africa's economy, and as a result of its growth, is recognised
as a mature industry. In addition, Naude (2013) points out that the South African automotive
industry compares favourably with similar industries in developing countries with regard to
infrastructure, raw material availability, emerging market cost advantages, flexible
production capability and government support. However, Barnes, (2009) points out that
despite these positive aspects, the South African automotive industry’s competitiveness is
under severe pressure as it experiences challenges such as high labour costs, poor
infrastructure and dated technology. Furthermore, the automotive component sector at a
recent conference focused its aim of the global green economy on automotive component
manufacturing (Christelis, 2013). Manufacturers were encouraged to diversity as components
manufactured for vehicles can also be used in the renewable energy sector, as they were
informed they needed to prepare themselves for change (Christelis, 2013). In addition, South
Africa's automotive industry accounts for about 10 per cent of South Africa's manufacturing
exports, making it a crucial cog in the economy (Dube, 2014). Moreover, the South African
government has identified the automotive industry as a key growth sector, with the aim of
increasing vehicle production to 1.2 million units by 2020, while significantly increasing
local content at the same time (Dube, 2014).
2.4.3 Chemicals
This sector is made up of several sectors, such as the basic chemicals, which include liquid
fuels, organic solvents and industrial mineral derivatives, plastic products, pharmaceuticals,
inorganic chemicals, primary polymers and rubbers, organic chemicals, rubber products, bulk
formulated, consumer formulated chemicals; pure functional, chemicals (Kambule, 2014). It
is evident that SMEs have a strong presence in the chemical industry and play an important
role in its overall growth and performance (Lampadarios, 2014).
2.4.4 Information Technology and Communications
Information and Communication Technology (ICT) plays a very important role in helping
SMEs to have an edge over competitors in terms of accessibility to global markets (Olatunji,
2015). Within the information technology and communications sector in South Africa,
becoming green is inevitable as energy demands increase and overall plans of energy
conservation, efficiency, and renewable generation necessitate that technology adapts and
solves environmental resource use and waste generation accordingly (Christelis, 2013). The
Information Technology Association of South Africa (ITA), along with industry partners and
27
organisations endeavour to guide the industry to address environmental and electronic waste
(e-waste) problems in South Africa (ITA, 2011).
2.4.5 Clothing and textile
The clothing and textile cluster includes the production of traditional African clothing, shirts,
hats, overalls, curtains, pillows, duvets, bedspreads, wedding gowns and dresses (Kambule,
2014; Maphala 2011). Netshandama (2001) emphasises that the contribution of the two sub-
sectors (clothing and textile), not only to the manufacturing industry, but also to the
economy, has been enormous. Furthermore, the two sectors are also important employers for
Black women who make approximately 76% of clothing workers and 34% of textile workers
as compared with an average of 31% for the entire manufacturing sector (Netshandama
2001).
2.4.6 Metalworks
The cluster is established in several formal industrial areas across the Witwatersrand
metropolitan area, which operates as backyard metal working (Kambule, 2014; Maphala
2011).
2.4.7 Wood-working
According to Ncube (2016), this cluster is characterised by the production of office furniture,
household furniture, bedding; hospitality furniture, outdoor furniture and case goods.
Furthermore, the wood-working cluster includes activities such as cabinet makers and
furniture producers and operates from industrial township mini factories (Maphala 2011).
2.4.8 Paper and pulp
According to Doorasamy (2015), the pulp and paper industry is an over-capacitated
commodities industry that is highly sensitive to global market influences on price and cost.
Bras, Realff and Carmichael (2004:5-7) “describe the industry as one with excessive
production capacity, high fixed costs, cutthroat pricing schemes, increasing competition from
foreign impacts, yet still producing more paper even though this meant higher marginal cost
implications of the law of diminishing returns”. In addition, Doorasamy (2015) elucidates
that paper and pulp manufacturing operates in a cyclical industry with global economic
conditions causing volatility in paper and pulp prices. Maphala (2011) points out that the
activities include the manufacturing of products sourced from wood and forestry sectors.
Examples include paper products such as boxes, tissues, posters, newspapers, books and
magazines. The final products made from these raw materials might seem obvious, but there

28
are also the less obvious final products made from these raw materials such as viscose,
cigarette filters and detergents (Kambule, 2014).
2.5 Describing small and medium enterprises (SMES): a worldwide
perspective
There is no universal definition for Small and Medium Enterprises (SMEs) and it varies from
size, type, assets, revenue, employees, as well as industry to industry from one country to
another (Ilori 2014). According to Ajmal (2017), the definition should involve both the
quantitative dimension, for instance, the number of employees, measures of transactions,
financial, non-financial resources and liquidity, and the qualitative dimension, including the
method of organising and function performance. Internationally, an SME is defined by the
annual turnover and the number of full-time employees in the firm (Wolmarans & Meintjes
2015). The United Nations Industrial Development Organisation (UNIDO) posits that SMEs
are small and medium entities that represent over 90% of private businesses and contribute
more than 50% to employment and to the Gross Domestic Product (UNIDO 1999).
In Zimbabwe, according to the Small and Medium Enterprises Institute, SMEs are defined as
registered enterprises with employment levels ranging from 30 to 70 depending on the types
of industry (Mbizi, Hove, Thondhlana, & Kakava 2013). In Indonesia, SMEs are defined as
small enterprises with assets less than RP 200 million, excluding land and buildings and
annual sales volume not more than RP 1 billion and medium enterprises with assets more
than RP 200 million but less than RP 10 billion, excluding land and buildings and annual
sales volume more than RP 1 billion (Azmi, 2017). In Pakistan, SME is defined as an
employment size up to 250 people, assets up to Rs. 100 million and annual sales turnover up
to Rs 300 million for the manufacturing sector while for trading and services sectors,
employment size is up to 50 employees, assets up to Rs 50 million and annual sales turnover
up to Rs 100 million (Azmi, 2017).
According to Elshamly (2013), SMEs within the European Union are defined by their size,
according to three measures. The first is that an SME employs not more than 250 members of
staff. The second is that the maximum annual turnover of an SME is fifty million Euro and its
balance sheet amounts to less than forty-three million Euros. The third criterion is that not
more than twenty-five percent of its shares can be owned by another enterprise. In addition,
Moloi (2013) points out that the United States of America's (USA) classification of SMEs
differ slightly to that of the European Union; based on USA business criteria, for a company

29
to be classified as an SME it should be based on the industry within which the company
operates, the form of ownership, revenue and number of employees which, in some cases,
may be as high as 1500. Yeboah-Boateng (2013) points out that the Federal Government in
Canada, under the auspices of the Small Business and Special Surveys Division, defines
SMEs as any business establishment with 0 to 499 employees and less than $50 million in
gross revenues. However, the British Columbia Statistics (a province in Canada) defines
SMEs as companies with less than 50 employees, without reference to revenues (Yeboah-
Boateng, 2013)
2.6 Description and classification of small and medium enterprises in
south africa
In South Africa, the Department of Labour (DoL) uses the acronyms SMME for Small, Micro
and Medium Enterprises and SME for Small and Medium Enterprises (Maladzhi, 2012).
Aminu and Shariff (2015) also point out that, in South Africa, SMEs are defined as distinct
and separate business entities; including co-operative enterprises and non-governmental
organisations that are self-managed by a single owner or more which includes its branches or
subsidiaries, if any. The most widely used definition of SMEs in South Africa is the one
given by the National Small Business Act (102 of 1996) and the National Small Business
Amendment Bill (2003), where SMEs are defined as businesses with fewer than 250 full-
time, paid employees (Department of Trade and Industry 2005; Abor & Quartey, 2010;
Fatoki & Garwe, 2010; Ferreira & Loggerenberg 2012; Okusolubo 2013). In addition, Desta
(2015:25) also elucidates that the National Small Business Act defines SMEs as “a separate
and distinct entity including cooperative enterprises and non-governmental organizations
managed by one owner or more, including its branches or subsidiaries if any is predominantly
carried out in any sector or sub-sector of the economy mentioned in the schedule of size
standards and can be classified as an SME by satisfying the criteria mentioned in the schedule
of size standards”.
In South Africa, numerous authors have defined and classified SMEs differently, for instance,
Maphiri (2015) characterised SMEs as one-person businesses, in which the working staff can
be family members who are often unpaid, but are active in the enterprise. This is in line with
Falkena (2000), who points out that an SME is defined as any enterprise, whether or not
incorporated or registered under the law, which consists mainly of persons carrying on small
business concerns in any economic sector, or which has been established for promoting the
interests of small business concerns. Furthermore, in a study entitled “Using ICTs to become

30
a competitive SME in South Africa”, Modimogale and Kroeze (2009) defined small to
medium enterprises (SMEs) as businesses that employ 150 people or fewer and are not a
subsidiary of a public limited company. Moonsamy (2016) also conducted a study that
focused on open innovation in South African SMEs, and classified SMEs as formal
businesses (business’s registered with CIPRO) with fewer than 200 employees. In observing
the classification of the SMEs’ characteristics in South Africa, the figure 2.3 shows the
classes of SMEs in South Africa.
Figure 2.3: Classification of SMEs in South Africa
Source: adapted from Lose (2016)
2.7 Different categories of SMEs in South Africa
The following sub-headings outline the different categories of SMEs in South Africa. These
include micro-enterprises; very small businesses, small businesses and medium businesses.
2.7.1 Microenterprises
According to Cant (2017, p. 78) “micro-enterprises are enterprises that do not register their
business formally (no license) as their turnover is less than the amount stipulated by the
South African value-added tax registration limit (R300 000)”. These businesses do not
employ more than five people, usually family members. Owners usually have the basic
training and business skills and have the potential to transform their business to the formal
Medium enterprises
Small enterprises
Very small enterprises
Micro enterprises

31
sector (Cant, 2017). They include, for example, spaza shops, minibus taxis and household
industries (Sitharam, 2014).
2.7.2 Very small enterprises
These are ventures that recruit fewer than 10 paid people, apart from mining, electricity,
manufacturing and construction sectors, in which the number is 20 employees (Nze, 2016). In
the same vein, Cant (2017, p. 78) elucidates that “a very small enterprise can be seen to
operate in the formal sector and do not hire more than ten employees, unless, in construction,
mining, electricity or manufacturing sector, in which they do not employ more than 20
employees; these enterprises have access to ICT/ technology”.
2.7.3 Small enterprises
A small enterprise can be seen to operate in the formal sector and employ not more than 50
employees and such businesses can be seen to operate with a more complex business
structure (Cant, 2017). Small enterprises are generally more established than very small
enterprises and exhibit more complex business practices (Sitharam, 2014).
2.7.4 Medium businesses.
Cant, (2017) views that a medium enterprise can be seen to include additional management
structures within their business, they employ a maximum of 100 employees, however, if they
fall within the construction, mining, electricity or manufacturing sector, the enterprise could
employee up to 200 employees. The highest number of workers is 100 or 200 for the mining,
electricity, manufacturing and construction sectors. These enterprises are repeatedly
characterised by the devolution of authority to a further administrative level (Nze, 2016).
2.8 Classification of manufacturing small and medium enterprises: a
worldwide perspective
Manufacturing small and medium enterprises (MSMEs) are described differently from
country to country. Obokoh and Goldman (2016) conducted a study on infrastructure
deficiency and the performance of small- and medium-sized enterprises in Nigeria's
liberalised economy and defined manufacturing small and medium enterprises as those
businesses operating in the formal manufacturing sector with the number of employees, not
above 300 or their capital base not above N200 million. In their study entitled “Innovation
and performance in Spanish manufacturing SMEs”, Van Auken, Madrid-Guijarro and
García-Pérez-de-Lema (2008) categorised manufacturing small and medium enterprises
(MSMEs) as those firms that employed fewer than 250 employees and had annual sales less
than 50 million euros or total assets less than 43 million euros. Aziz and Samad (2016)

32
conducted a study which focused on examining the influence of innovation on competitive
advantage in foods’ manufacturing SMEs in Malaysia and they described manufacturing
small and medium enterprises as those manufacturing enterprises or companies providing
services related to manufacturing with sales turnover not exceeding RM50 million and
employs full-time workers not exceeding 200 people.
2.9 Description and classification of manufacturing small and medium
enterprises in South Africa
In this study, the delineation of manufacturing Small and Medium Enterprises emanates from
Table 2.1 which shows the classification of SMEs according to the National Small Business
Act 102 of 1996.
Table 2.1: Classification of SMEs according to the National Small Business Act 102 of 1996
Sector Category Number of
employees
Annual turnover in
Rands (R)
Total gross asset
value
Agriculture
Medium 100 R4,000,000 R4, 000, 000
Small 50 R2, 000,000 R2,000, 000
Very small 10 R400, 000 R400,000
Micro 5 R150, 000 R100,000
Mining and Quarrying
Medium 200 R30, 000,000 R18, 000,000
Small 50 R7, 500,000 R4, 500,000
Very small 20 R3, 000,000 R1, 800,000
Micro 5 R150, 000 R100, 000
Manufacturing
Medium 200 R40.00 m R15.00 m
Small 50 R10.00 m R 3.75 m
Very
small 20 R 4.00 m R 1.50 m
Micro 5 R 0.15 m R 0.10 m
Electricity, Gas and
Water
Medium 200 R40, 000,000 R15, 000,000
Small 50 R10, 000,000 R3, 750,000
Very small 20 R4, 000,000 R150, 000
Micro 20 R4, 000,000 R150, 000

33
Sector Category Number of
employees
Annual turnover in
Rands (R)
Total gross asset
value
Construction
Medium 200 R20, 000,000 R4, 000,000
Small 50 R5, 000,000 R1, 000,000
Very small 20 R2, 000,000 R400, 000
Micro 5 R150, 000 R100, 000
Retail and Motor
Trade and Repair
Services
Medium 100 R30, 000, 000 R5, 000, 000
Small 50 R15, 000, 000 R2, 500, 000
Very small 10 R3, 000, 000 R500, 000
Micro 10 R3, 000, 000 R500, 000
Wholesale Trade,
Commercial Agents
and Allied Services
Medium 100 R50, 000, 000 R8, 000, 000
Small 50 R25, 000, 000 R4, 000, 000
Very small 10 R5, 000, 000 R500, 000
Micro 10 R5, 000, 000 R500, 000
Catering,
Accommodation and
other Trade
Medium 100 R10, 000, 000 R2, 000, 000
Small 50 R5, 000, 000 R1, 000, 000
Very small 10 R1, 000, 000 R200, 000
Micro 10 R1, 000, 000 R200, 000
Transport, Storage
and Communications
Medium Medium 100 R20, 000, 000
Small Small 50 R10, 000, 000
Very small Very Small 10 R2, 000, 000
Micro Micro 5 R150, 000
Finance and Business
Services
Medium Medium 100 R20, 000, 000
Small Small 50 R10, 000, 000
Very small Very Small 10 R2, 000, 000
Micro Micro 5 R150, 000
Community, Social
and Personal Services
Medium Medium 100 R10, 000, 000
Small Small 50 R5, 000, 000
Very small Very Small 10 R1, 000, 000
Micro Micro 5 R150, 000
Source: Adapted from Nze (2016).
The definition of manufacturing small and medium enterprises is depicted in table 2.1,
whereby (MSMEs) can be defined using the categories which are small and medium, a
number of employees ranging from 50 to 200, annual turnover from R10.00m to R40.00m
and total gross asset values which are from R3.75m to R15.00m respectively.

34
2.10 The role of manufacturing SMEs in South African economy
Within the manufacturing sector of South Africa, 92 % of all business units are SMEs and
provide 37 % of the total employment within the sector (Moritz 1994). In the same vein, Van
der Walt (2007), as well as Caga (2012), points out that in South Africa, at least 90% of the
manufacturing sector is made up of SMEs. In addition, Urban and Naidoo (2012) argue that
the manufacturing sector contributes approximately 35 per cent to the GDP and employs
approximately 18 per cent of South Africa's workforce. According to Nematatane (2017),
these manufacturing SMEs operate in almost every part of the economy in South Africa, by
engaging in food processing, toiletry making, garments, leather, rubber, metal fabrication,
furniture manufacturing, construction, art, and so on. Mupemhi, Duve and Mupemhi (2013)
mention that manufacturing small and medium enterprises employ varied means of
production ranging from quasi-cottage systems to automated assembly line systems, and their
activities are in leather and textile, paper and paper products, wood and wood products,
electrical and electronics, chemical and pharmaceuticals, metal and fabrication food and
beverages, and glass and ceramics.
In their study entitled “Issues in SME development in Ghana and South Africa”, Abor and
Quartey (2010) pointed out that SMEs contribute to a country’s national product by either
manufacturing goods of value, or through the provision of services to both consumers and/or
other enterprises. Furthermore, according to the International Monetary Fund African
Department (2014), in South Africa, more than 85 % of the goods exported by SMEs are
manufactured goods. Thus, this gives an indication that SMEs are highly active in the
manufacturing of their own products. In addition, the importance of the manufacturing sector
is seen in its housing of small, micro medium firms (Serebro & Creamer’s Media Research
Council, 2010). Estimations show that 90% of the manufacturing sector is comprised of
SMMEs and approximately 10% (580,000) of SMMEs make up the manufacturing sector and
generate an annual turnover of about R214 million (USAID, 2012a).
Small businesses contribute significantly to a country’s national product, either by the
production of valuable goods or through the rendering of services to consumers and/or other
enterprises (Abor et al., 2010:223). They enhance the proficiency of domestic markets, have
the ability to make productive use of scarce resources thereby aiding the effort towards long-
term economic growth through ingenuity (Kayanula et al., 2000:6) and they supply products
and services to foreign buyers and in so doing, contribute significantly to export performance
(Abor et al., 2010).
35
Small firms thus play a vital role in the development of the country (Feeney & Riding 1997).
It is conceivable, for this reason, that Kongolo (2010) urges the government to recognise and
acknowledge SMEs as a significant part of South Africa’s development process. The
contribution of SMEs differs considerably across countries. In South Africa, the economy is
dominated by small medium and micro firms (Sawers, et al., 2008).
Since South Africa is in the process of engaging more in the world economy and in a
transition to globalisation while battling against challenges such as poverty, unemployment
(Sawers et al., 2008), income inequality (Maas & Herrington 2006), low economic growth,
high inflation (Fatoki 2011) and uncertain market conditions (Urban & Naidoo 2012), the
government has come to view SME development as a matter that is of utmost importance
(Sawers et al., 2008). The belief is that not only can the SMEs alleviate difficulties, but they
can also enhance the competitiveness of the country (Kesper 2001; Swanepoel, Strydom &
Nieuwenhuizen 2010; Sawers et al., 2008; Maas et al., 2006).
According to Kongolo (2010), small businesses in comparison to large-scale businesses, have
more advantages in that they have the ability to adjust to market conditions with ease and can
withstand unpleasant economic conditions given their supple character. Since they are more
labour-intensive than larger firms and therefore have lower capital costs (Kongolo 2010),
they possess the ability to address the high levels of unemployment in South Africa more
effectively (RSA, 1995). In fact, the 1995 White Paper on National Strategy for Development
and Promotion of Small Business in South Africa (RSA, 1995), identified SMEs not only as
the key to unemployment alleviation but also as drivers for:
Stimulating local competition through the creation of market niches and unlocking
opportunities by tapping into international markets;
Redressing the disparities that exist as a result of the Apartheid period; and
Buffering the endorsement of Black Economic Empowerment and playing a vital role
in the process of supporting people with basic needs in the absence of social support
systems.
In addition to the aforementioned contributions, literature further highlights that SMEs
contribute to:

36
Employment: According to Oualalou (2012, p. 57), “SMEs play a very important economic
and social role, both through their prominence in the economy and in job creation, a role
which is greatly appreciated in these times of crisis and rising unemployment”. Additionally,
Sibanda (2013) concurs with the assertion that the SMEs sector plays a critical role in the
South African economy by creating employment opportunities for communities within the
second economy, as well as providing livelihoods to the dependents. Ayandibu and Houghton
(2017) stated that the contribution of SMEs towards employment generation is significant
because they support the building up of systemic productive capacities. In addition, Ayandibu
and Houghton (2017) note that SMEs account for over 76% of the total employment within
the South Africa economy. Furthermore, small firms are accountable for a large percentage of
the employment in South Africa since they represent the majority of SMEs (nearly 70%) in
comparison to medium-sized and micro firms that constitute about 15%, collectively
(Jeppesen 2005). Nonetheless, SMEs are not only perceived as the creators of employment,
but are also adopters of retrenched people coming from the private and public sector (Ntsika
2001). Such actions by Small and Medium Enterprises have elicited praise which is evident
from the 2003 Human Development Report (UNDP 2003) for South Africa. Since these
SMEs hold a key role in the development of South Africa, the country has even come to be
viewed as an “engine of growth” for the African continent, generating 45% of the continent’s
GDP (van Wyk, Dahmer & Custy 2004:259).
Cultivating wealth: SMEs create wealth by enticing demand for investment, for capital
commodities and trading (Dana 2001; Lange, Ottens & Taylor 2000; Bosma & Harding
2006; Robertson, Collins, Medeira & Slater 2003).
Economic growth: The contribution of small and medium enterprises (SMEs) to a healthy
economy has long been recognised and capability development of small firms remains
critical to economic prosperity (Lekhanya 2010). SMEs support economic growth by
establishing new markets, reviving stagnant industries and play a key role in economic
expansion and enforcing a lively business culture (Santarelli & Vivarelli 2007; Pretorius &
van Vuuren 2003; Thomas & Mueller 2000; Henning 2003; Miller, Besser, Gaskill & Sapp
2003). In addition, Van Vuuren and Groenewald (2007, p. 274) indicate that “SMEs form
97.5% of all business in South Africa”. They generate 34.8% of the gross domestic product
(GDP), contribute to 42,7% of the total value of salaries and wages paid in South Africa, and
employ 54,5% of all formal private sector employees (Lekhanya 2010).
37
Innovation and technology promotion: SMEs are known for introducing new products and
services, discovering and serving new markets, as well as endorsing technological change
and entrepreneurship (Rwigema & Venter 2004; OECD 2002). According to Omoruyi
(2015), the classification and characteristics of SMEs such as economies of scale, risk takers,
owners and managers of their businesses, indicates that SMEs have a determined
entrepreneurial drive and motivation to be more innovative to improve on business
efficiency, productivity and performance. This is because SMEs personality and
characteristics are coupled with being innovative. Therefore, there is a high uniqueness
between SMEs and product innovation, which can affect product and business performance
positively (Omoruyi 2015).
Capacity to improvise: According to McKnight and Bontis (2002, p. 1), improvisation is the
“ability to spontaneously recombine knowledge processes and structure in real time, resulting
in creative problem solving that is grounded in the realities of the moment”. SMEs are
resourceful in that they can make the best use of local technologies, local raw material and
the local knowledge base (Rwigema & Karungu 1999; Luiz 2002; Romijn 2001). They also
can overcome crises in relation to a recession, natural disasters and conflicts (Gurol & Atsan
2006; USAID 2003; Nichter & Goldmark 2009).
Socio-economic transformation: Momba (2016) elucidates that SMEs are essential to the
economy of any country, whether developed or developing, and play an important role in
social and economic growth in their role in a number of industries in terms of gross domestic
product (GDP) contribution and total employment. SMEs are believed to be key in
empowering their local communities with a particular focus on the marginalised segments
and reducing poverty through support for entrepreneurship and providing income through
employment (Ladzani & van Vuuren 2002; Mogale 2005; Tustin 2001; Abor et al., 2010).
Small and Medium enterprises are a sector that is perceived to serve as an entrepreneurial
‘seedbed' where some SMEs may graduate to run larger industries (Mcpherson 1996).
Although the business environment greatly impacts on the development of Small and
Medium Enterprises (Delmar & Wiklund 2008) in South Africa, the environment is
somewhat accommodative of SMEs growth as it is composed of a refined infrastructure, legal
system, natural and human resources, telecommunication network and financial services (van

38
Wyk et al., 2004). Perhaps, this is the case owing to government efforts to support the SME
sector ever since the country became democratic (Berry, Von Blottnitz, Cassim, Kesper,
Rajaratnam & van Seventer 2002; Laforet & Tann 2006). Figure 2.2 illustrates the
contribution made by South African Small and Medium Enterprises in diagrammatic form.
Each contribution is indicated as discussed above.
Figure 2.4: Diagrammatic Representation of SMEs’ Contribution in South Africa
Source: Compiled by the researcher
2.11 Challenges faced by manufacturing small and medium enterprises
Manufacturing SMEs within the South African economy are confronted with numerous
challenges. The operational challenges bedevilling manufacturing SMEs are acknowledged
by the Global Competitiveness Index that ranked South Africa as one of the lowest emerging
economies in terms of manufacturing competitiveness (Mafini & Muposhi 2017; World
Economic Forum 2016). Mthabel (2015) assessed the causal failures that are confronted by
manufacturing SMEs in South Africa and found out that the high failure rate of
manufacturing SMEs can be, to some extent, ascribed to the following factors: the lack of
SMEs' Contribution
Gross domestic product
Employment
Economic growth
Economic empowerment

39
support that the small, medium and micro-enterprises receive from Government and its
policies; lack of sponsorship from well-established organisations that could provide SMEs
with commercial advantages such as legitimacy of the brand; and also their own internal
processes that are weak in organisational design and execution of strategies.
2.11.1 Lack of product proliferation in manufacturing SMEs
According to Barroso and Giarratana (2013), product proliferation enables firms to generate
demand synergies, because they offer ‘one-stop shopping' and thus capture more customers
with greater willingness to pay for customised versions. However, Maupin and Stauffer
(2012) highlight the problem of product proliferation, by emphasising that manufacturing
SMEs are often less profitable when compared to large manufacturers. Therefore, there is a
need for a common practice of instant production of new products, which is done with little
regard for compatibility with other products and production (Singh, Matthews, Mullineux, &
Medland, 2009). Furthermore, the problem of product proliferation in SMEs is also illustrated
by. According to them, these enterprises are more customer focused (concentrating on getting
a product to the customer) than market focused. In addition, Singh, Matthews, Mullineux and
Medland (2009) point out that there is little attention given to product development or long-
term planning to bring products to the market and this results in a large product portfolio
without any real rationalisation. The improvement of product development practice can be
reached only with less complex modification of processes suitable for small manufacturers
who are usually short for financial resources and lack a broad range of technical skills (Singh,
Matthews, Mullineux & Medland, 2009).
2.11.2 Competition
Small businesses are unable to deal with natural market competition, and therefore, according
to Sitharam (2014), competition is ranked as the third greatest obstacle to growth for
businesses. According to Khan and Khalique (2014, p. 41), “due to lack of competencies,
SMEs are not able to compete at national as well as international level”. Therefore, SMEs
have fierce challenges for their survival in a competitive environment (Khalique, Shaari, Isa,
Md & Ageel, 2011). Local SMEs find it increasingly difficult to survive or even maintain
their current business position in their respective markets (Singh, Garg & Deshmukh, 2010).
With the opening of free trade agreements, SME products are being challenged by the foreign
imported products which have flooded the market (Sitharam, 2014). The operational
challenges bedevilling manufacturing SMEs are acknowledged by the Global
Competitiveness Index that ranked South Africa as one of the lowest emerging economies in

40
terms of manufacturing competitiveness (Mafini & Muposhi, 2017). This increases the need
for both researchers and practitioners to continue to seek ways of mitigating these challenges
in order to boost the survival rate of SMEs in South Africa (Mafini & Muposhi, 2017).
2.11.3 Lack of innovation
One may consider manufacturing firms to be the heart of innovation; however, SMEs are
lagging behind in innovativeness, regarded as key for these entities to sustain themselves in a
competitive environment (Matsoso, 2014). Innovations may come in various forms, such as
the capability to produce and introduce new products that suit the market and attain the
customer satisfaction level (Matsoso 2014; Margues & Ferreira, 2009). Therefore, much
attention is required to ensure that the manufacturing sector is well-developed and
performance measurement systems are in place.
2.11.4 Lack of access to finance
One of the major factors impeding the success of SMEs, especially in the manufacturing
environment, is the lack of access to finance (Matsoso, 2014; Beck & Demirguc-Kunt, 2006).
This prohibits these firms from expanding their businesses, which may enable greater
employment opportunities, thus alleviating poverty, and as Beck and Demirguc-Kunt (2006.
P. 2932) assert, efforts targeted at the SME sector are usually focused on the basis that SMEs
are the “engine for growth”, although market imperfections and institutional weaknesses
prohibit them from growth. Musara’s (2012, p.5786) study found that “lack of funds and a
lack of information of instantaneous financial gains are challenges militating against
manufacturing SMMEs in South Africa”.
2.11.5 Lack of Skills and Training
Nze (2016) argued that many entrepreneurs have inadequate business administrative skills
necessary to run a business, which makes them prone to failure. Olawale and Garwe (2010)
point out that lack of education and training has reduced management capacity within the
SMEs in South Africa. Lose (2016, p. 26) points out that “at times entrepreneurial ventures
lack entrepreneurial skills and have limited technical skills, are inflexible and have
insufficient experience as well as poor quality management; these are among the factors that
could lead to business failure”.
Deducing from the aforesaid discussions, it is imperative to note that the ever-growing
concern on environmental sustainability, the challenges confronting SMEs in the

41
manufacturing sector is becoming amplified (Urban & Naidoo 2012). As noted by Mafini and
Muposhi (2017), environmentalism continues to influence corporate strategy in the 21st
century. Furthermore, Chiloane-Tsoka, Mabiza-ma-Mabiza and Mbohwa (2014) point out
those actors who can play a central role in making the green economy a reality are small and
medium-sized enterprises (SMEs) because they are the engine of the global economy.
Therefore, the next section focuses on the importance of green marketing for South African
manufacturing SMEs.
2.12 SMEs going green
In today’s post-modern era, South African consumers, like their international counterparts,
are becoming increasingly responsible and informed when it comes to environmental matters
(Le-Riche, 2008). According to Viviers, (2009, p. 32), “today’s consumers want to know
about where, how, when and what in even the most mundane products and are concerned
about the impact their purchases will have on the environment and their health.” Hence, that
is why in South Africa there are now numerous businesses that have actively embraced the
notion of “going green” as well as incorporating green marketing in their businesses. Yee
(2016) points out that due to environmental sustainability problems, green marketing is not
only applicable to large companies, but also for small and medium companies. In addition,
green marketing has become a significant approach for the firms to survive in the market
and to sustain the market competitive advantage (Chahal, Dangwal, & Raina 2014).
Baumann-Pauly et al. (2013) and Berrone et al. (2010) argue that SMEs and family-owned
firms, respectively, are more environmentally responsive. Mukonza (2016) posits that Small
and Medium-sized (SMEs) enterprises are essential for green growth as key drivers of
entrepreneurship and key players in emerging green industries. In addition, Hamann, Smith,
Tashman, and Marshall, (2017) wrote an article that set out to investigate why SMEs go
green and, using survey data as well as comparative case studies of wine firms in South
Africa, the authors found out that managers’ environmental responsibility is the most
important driver of environmental behaviour. Furthermore, Hamann, Smith, Tashman, and
Marshall (2017) suggest that environmental responsibility plays a crucial role in motivating
SMEs' pro-environmental behaviour, but that this role is positively enhanced by expectations
of competitiveness gains, especially cost savings. Moreover, in her study entitled “Going
green: a SMME perspective” Viviers (2009) investigated the level of environmental
awareness and engagement among local SMME owners/managers in South Africa. The

42
findings indicate that SMMEs are becoming more aware of the impact of their actions on the
natural environment and engage in actions to reduce electricity use, recycle paper and replace
hazardous materials. Moreover, Lekhanya (2014) conducted an exploratory study which
focused on the level of awareness regarding green marketing and its managerial implications,
among selected South African manufacturing Small, Medium and Micro Enterprises
(SMMEs), in the province of KwaZulu–Natal (KZN). Findings of the research indicate that
SMMEs in the study are aware of green marketing and its managerial implications
(Lekhanya, 2014). It further reveals that SMMEs’ owners/managers indicate that the South
African Environmental Act and Consumer Protection Act are additional factors that influence
their businesses operations (Lekhanya, 2014).
2.13 Chapter summary
This chapter discussed the research context, where it examined the literature related to South
African manufacturing SMEs and an overview of the South African manufacturing sector.
From the chapter, it can be observed that the SME sector holds a particular relevance in the
business environment as well as in academia. This implies that literature is rife with studies in
relation to the SME sector generally, but this chapter only concerns the body of literature
relative to the issues that are applicable to the current study.
The chapter was structured with five main headings:
South Africa as the Study Area
The Concept of Manufacturing
An overview of South Africa’s manufacturing sector
Describing Small and Medium Enterprises (SMEs): A Worldwide Perspective
Description and Classification of Manufacturing Small and Medium Enterprises In
South Africa
The Role of Manufacturing SMEs In South African Economy
Challenges Faced by Manufacturing Small and Medium Enterprises
SMEs going green.
The study’s theoretical framework is described in the next chapter. This subsequent chapter
(Chapter 3) elaborates on theories that capture the intricacies surrounding green marketing
practices, competitive advantage, as well as business performance.

43
3 CHAPTER THREE: LITERATURE REVIEW:
THEORETICAL FRAMEWORK
3.1 Introduction
The preceding chapter (Chapter 2) was focused on the research context of the study and this
current chapter presents a detailed theoretical framework. It is imperative to note that the
study of a phenomenon becomes easy to grasp if it has a defined framework (Nwaizugbo &
Anukam, 2014). To create an academic context for the study, it is imperative for the
researcher to identify a theoretical framework for guidance (Kolanchu, 2011). Therefore, a
theoretical framework is a well-developed explanation of events that help the researchers to
locate their studies and to signal the origin of their proposed research (Vithal & Jansen 2010).
Furthermore, Creswell (1994) and Burns and Bush (2006) point out that the theoretical
framework comprises literature that helps to understand the concepts surrounding the
research more broadly. Therefore, this chapter presents theories that serve as the theoretical
literature of the study.
A theory is thus an essential tool of research for stimulating the advancement of knowledge
(Inglis & Maclean, 2005; Kawulich, 2009). Vosloo (2014) concurs that a theory is primarily
concerned with providing an explanation; and that it, therefore, focuses on determining
cause-and-effect relationships. Overall, a theoretical framework, consequently, helps the
researcher summarise any previous information and guides the future course of action
(Vosloo, 2014). Simultaneously, the formulation of a theory may indicate missing ideas or
links and the additional data required to fully understand how things are connected, and to
establish sets of propositions or generalisations (Henning et al., 2004).
The theoretical literature of this study is anchored in the framework of the resource advantage
theory of competition, natural resource-based view theory, resource-based view model, the
balance scorecard theory, the stakeholder theory as well as Porter's five forces model. These
theories and models were used to serve as underpinnings to ground the study. They are the
pivotal theories in this research because they explain fundamental concepts used by the
research and provide a central point of reference for arguments generated in the research
(Easterby-Smith, et al., 1991; Johnson & Christensen, 2008).

44
3.2 The resource advantage theory of competition (RA)
Since its original conceptualisation in Hunt and Morgan (1995), the theory of
competition known as resource-advantage (RA) theory has been developed in numerous
articles, books, and book chapters in the marketing, management/general business, and
economics literatures (Hunt & Morgan, 2005). Schlegelmilch (2002) argues that R-A theory
is a treasure chest for promising research avenues and it rejects the silo approach of many
theories. It is interdisciplinary in the sense that it has been developed in a number of different
disciplines, research traditions and theories (Doherty, 2010). Resource-advantage theory
suggests that firms can achieve superior performance through occupying marketplace
positions of competitive advantage (Green, Toms & Clark, 2015). The resource-advantage
theory argues that the value of a resource to a firm is seen in terms of its potential to yield
competitive differentiation and/or customer value delivery that enhances performance
outcomes (Hunt, 2000). According to Goh (2003, p. 98) “the resource-advantage theory
proposes that organizations learn through competition because of the feedback loops from
relative performance ‘signalling’ relative market position which in turn signals relative
resources”. Thus, the resource-advantage theory posits that a resource assortment can be a
comparative advantage (Green, Toms & Clark, 2015). In addition, Peranginangin (2015)
points out that resource advantage theory emphasises the importance of building values
through resources, which organisations internally possess. Yen and Chen (2010, p. 616)
referred that “the central premise of this theory is that firms seek resources to gain
comparative advantages in an effort to develop superior marketplace”. Due to the resource
immobility, resource heterogeneity can persist through time, despite attempts by firms to
acquire similar resources of particularly successful firms (Yen & Chen 2010).
According to Adiprabowo (2014, p. 9) “the RA theory, competition is actually favoured as it
will create economic growth and also, the RA theory explains that resources are
heterogeneous as well as imperfectly mobile amongst firms, the differences in resources
owned by each firm will create a comparative advantage”. Thus, firms will each have
different strategies on how to allocate their resources and will then compete on maximising
their comparative advantage to achieve superior financial performance, which also explains
the namesake of the Resource Advantage theory (Adiprabowo, 2014). Seggie and Griffith
(2008) are of the view that the R-A theory traces its pedigree to the following 11 different
research traditions: evolutionary economics, Austrian economics, heterogeneous demand
theory, differential advantage theory, historical tradition, industrial-organisation economics,
45
resource-based tradition, competence-based tradition, institutional economics, transaction
cost economics, and economic sociology (Seggie & Griffith 2008). Drawing on different
aspects of these theories, R-A theory provides a strong theoretical framework to explore the
firm’s resources and the competencies necessary for serving a diverse customer clientele.
Specific to R-A theory are the tenets that:
demand is heterogeneous across industries, heterogeneous within industries and is
dynamic;
consumer information is imperfect and costly;
human motivation is constrained self-interest seeking;
the firm’s objective is superior financial performance;
the firm’s information is imperfect and costly;
the firm’s resources are financial, physical, legal, human, organisational,
informational and relational;
the firm’s resources are heterogeneous and imperfectly mobile;
the role of management is to recognise, understand, create, select, implement and
modify strategies (which consists of allocations among resources);
And competitive dynamics are disequilibrium-provoking, with innovation endogenous
(Hunt & Morgan, 1995, 1996, 1997; Hunt, 1999, 2000, 2001).
To sum up, Doherty (2010, p. 79) emphasises that “the R-A theory stresses the importance of
market segments; heterogeneous firm resources; a comparative advantage/disadvantage in
resources; and market place positions of competitive advantage/disadvantage”.
3.3 Natural resource-based view theory (NRBV)
The natural resource-based view theory (NRBV) aids this research by providing a theoretical
mechanism through which the link between green marketing practices, competitive advantage
and business performance can be established. Natural resource-based view (NRBV) theory is
known to be the theoretical foundation of green marketing (Kumar, 2015). The NRBV
emerged from an earlier theoretical contribution of the resource-based view (RBV) (Hart,
1995). By and large, researchers have relied on the NRBV to connect environmental strategy
to firm performance, using environmental performance measures as a proxy for
environmental strategy (e.g. Hart & Ahuja, 1996; King & Lenox, 2002; Russo & Fouts,
1997).

46
Russo and Fouts (1997) elucidate that the natural resource-based view (NRBV) provides a
conceptual basis for this integrative approach. According to the NRBV, “constrained by and
dependent upon ecosystems,” a firm’s “strategy and competitive advantage will be rooted in
capabilities that facilitate environmentally sustainable economic activities” (Russo & Fouts,
(1997, p. ). In particular, the NRBV proposes that firms with a demonstrated capability will
be able to accumulate the resources necessary for pollution prevention, which eventually
contributes to reductions in emissions (Lee & Kim, 2017). Furthermore, Akkucuk (2015)
explains that the the natural resource-based view theory (NRBV) is characterised by the
association between organisational resources, capabilities and competitive advantages, while
encouraging the internal discovery of sources of organisational competitive advantage than
external, by finding the most competitive environment for it.
Canepari (2017) points out that the Natural Resource-Based View (NRBV) adds that those
resources, upon which internal capabilities are developed, should be intended as linked with
the environmental performance of the company. Like the Porter hypothesis, NRBV suggests
that as many firms repeatedly invest too little in environmental strategies, at the current state
of the art, companies integrating environmental issues and concerns in their strategic
decision-making as well as focusing on pro-environment resources are more likely to develop
valuable and rarer organisational capabilities, allowing them to pursuit a competitive
advantage (Canepari, 2017).
According to Hart (1995), historically, various marketing theories have ignored the
constraints imposed by the biophysical (natural) environment. The three capabilities
mentioned in NRBV theory are, namely: pollution prevention, product stewardship and
sustainability (Rahim & Rahman, 2013). Pollution prevention refers to efforts to reduce,
change, or prevent emissions and effluent discharges through better housekeeping, materials
substitution, recycling, or changes in the production process (Willig, 1994). Secondly, Hart
and Dowell (2010) explain that product stewardship includes the entire value chain or “life
cycle” of the firm’s product systems. Through stakeholder engagement, the “voice of the
environment” can be effectively integrated into the product design and development process
(Hart & Dowell 2010). It is conceptualised as the product-oriented environmental practices of
firms where environmental issues are taken into account in such product-related aspects as
product design, materials used, and product packing (Hart, 1995).

47
Product stewardship should thus afford a firm the opportunity for sustained competitive
advantage through accumulation of socially complex resources, involving fluid
communication across functions, departments, and organisational boundaries (Christina,
2011). Thirdly, there is an issue of sustainable development having two notable differences
from pollution prevention or product stewardship strategies (Hart & Dowell, 2010).
Sustainable development, also referred to as sustainability, is defined as the development that
meets the needs of the present without compromising the ability of future generations to meet
their own needs, and it implies economic growth that integrates protection of the environment
as well as meeting human social needs (Choongo, Van Burg, Paas, & Masurel, 2016).
Therefore, it is imperative for SMEs operating within the manufacturing sector to function as
sustainable businesses. Landrum and Edwards (2009) define a sustainable business as one
that operates in the interest of all current and future stakeholders in a manner that ensures the
long-term health, as well as survival of the business, and it is associated with economic,
social, and environmental systems. Moreover, it is likely that corporate strategy and
competitive advantage in the coming years will be rooted in capabilities that facilitate
environmentally sustainable economic activity as a natural resource-based view of the firm
(Hart, 1995). Therefore, in order for manufacturing SMEs to succeed (improving the business
performance), the concept of natural resource-based view strategy should be included in the
business's environmental corporate strategy to enable it to achieve and sustain competitive
advantage. This is in line with Esu (2015, p. 576) who assumes that “it is an imperative that
businesses should increase and make effective use of their competitive advantage in the
environment”. Moreover, Wang (2014), and Adeniran and Johnston (2012) state that the
resource-based view perceives the business as a combination of strategic resources which are
diversely distributed across organisations to achieve a sustained competitive advantage.
3.4 The resource-based view model
Akio (2005) defines resources as stocks of available factors that are owned or controlled by
the firm, which is converted into final products or services. Rothaermel (2012) enlightens that
the resource-based view (RBV) is a model that sees resources as key to superior firm
performance. If a resource exhibits VRIO attributes, the resource enables the firm to gain and
sustain competitive advantage (Rothaermel, 2012). Figure 3.1 provides a representation of the
resource-based view model.

48
Figure 3.1: The resource-based view model
Source: Abiodun and Harry (2013)
In the RBV model, resources are given the major role in helping companies to achieve higher
organisational performance (Jurevicius 2013). Resources refer to tangible and intangible
assets that firms use to conceive of and implement their strategies (Kozlenkova, Samaha &
Palmatier 2014). Kostopoulos, Spanos, and Prastacos (2002), as well as Jurevicius (2013),
agree that resources are either tangible (financial or physical) or intangible (i.e., employee’s
knowledge, experiences and skills, firm’s reputation, brand name, organisational procedures).
Schriber and Löwstedt (2015:54) inductively identified resources as “tangible to the extent
that they had physical, manifest properties, such as the “plant and equipment which can be
purchased off-the-shelf”. In addition, Enz (2009, p. 125) states that “tangible resources can be
seen, touched, and/or quantified and these resources tend to be easy to imitate”. Conversely,
Enz (2009) is also of the view that some of the most important resources are intangible, and
these resources are more difficult to quantify and the most difficult resources to imitate. For
example, knowledge about how to innovate is much more difficult to imitate than any
particular architectural design or building material innovation (Enz, 2009). Van Auken,
Madrid-Guijarro and García-Pérez-de-Lema (2008) emphasised that firms can gain a
competitive advantage through intangible resources that competitors do not possess.
In addition, as reflected by the RBV model, the two critical assumptions are that resources
must also be heterogeneous or immobile. Madhani (2009) points out that competitive
RESOURCE BASED VIEW THEORY
Tangible Resources Intangible Resources
Heterogeneous Immobile
VRIO Resources
Competitive Advantage
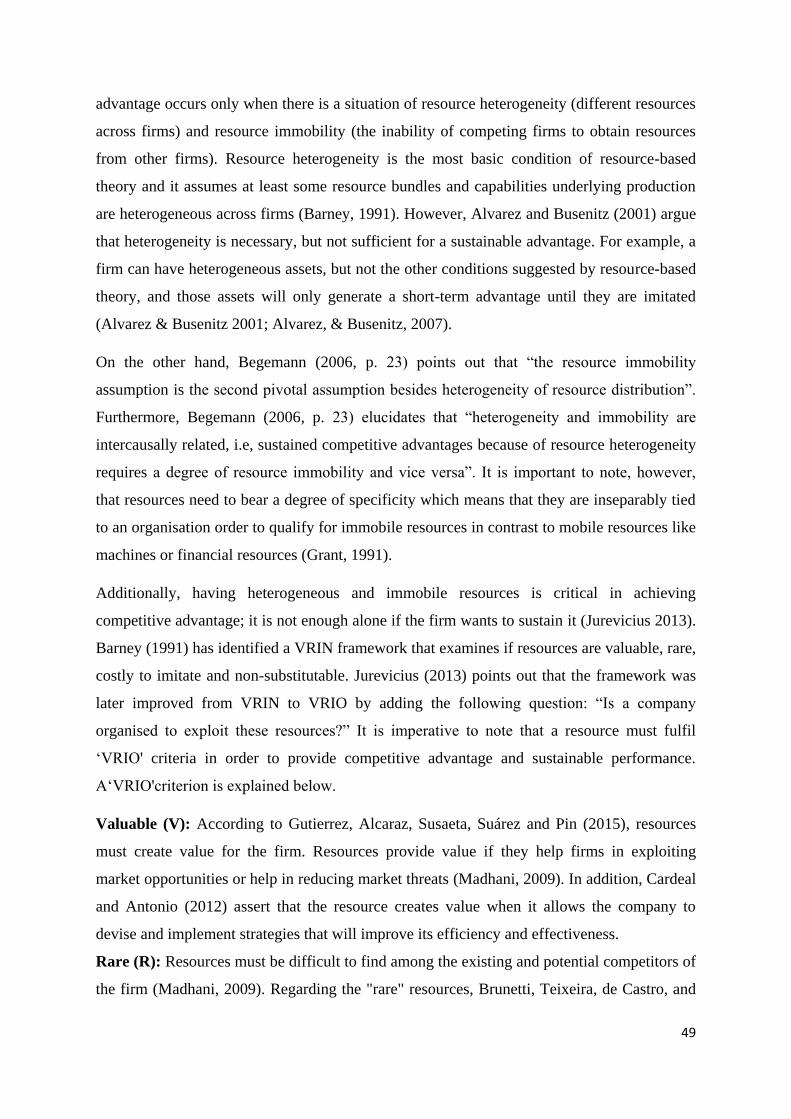
49
advantage occurs only when there is a situation of resource heterogeneity (different resources
across firms) and resource immobility (the inability of competing firms to obtain resources
from other firms). Resource heterogeneity is the most basic condition of resource-based
theory and it assumes at least some resource bundles and capabilities underlying production
are heterogeneous across firms (Barney, 1991). However, Alvarez and Busenitz (2001) argue
that heterogeneity is necessary, but not sufficient for a sustainable advantage. For example, a
firm can have heterogeneous assets, but not the other conditions suggested by resource-based
theory, and those assets will only generate a short-term advantage until they are imitated
(Alvarez & Busenitz 2001; Alvarez, & Busenitz, 2007).
On the other hand, Begemann (2006, p. 23) points out that “the resource immobility
assumption is the second pivotal assumption besides heterogeneity of resource distribution”.
Furthermore, Begemann (2006, p. 23) elucidates that “heterogeneity and immobility are
intercausally related, i.e, sustained competitive advantages because of resource heterogeneity
requires a degree of resource immobility and vice versa”. It is important to note, however,
that resources need to bear a degree of specificity which means that they are inseparably tied
to an organisation order to qualify for immobile resources in contrast to mobile resources like
machines or financial resources (Grant, 1991).
Additionally, having heterogeneous and immobile resources is critical in achieving
competitive advantage; it is not enough alone if the firm wants to sustain it (Jurevicius 2013).
Barney (1991) has identified a VRIN framework that examines if resources are valuable, rare,
costly to imitate and non-substitutable. Jurevicius (2013) points out that the framework was
later improved from VRIN to VRIO by adding the following question: “Is a company
organised to exploit these resources?” It is imperative to note that a resource must fulfil
‘VRIO' criteria in order to provide competitive advantage and sustainable performance.
A‘VRIO'criterion is explained below.
Valuable (V): According to Gutierrez, Alcaraz, Susaeta, Suárez and Pin (2015), resources
must create value for the firm. Resources provide value if they help firms in exploiting
market opportunities or help in reducing market threats (Madhani, 2009). In addition, Cardeal
and Antonio (2012) assert that the resource creates value when it allows the company to
devise and implement strategies that will improve its efficiency and effectiveness.
Rare (R): Resources must be difficult to find among the existing and potential competitors of
the firm (Madhani, 2009). Regarding the "rare" resources, Brunetti, Teixeira, de Castro, and

50
Lara, (2015) state that a valuable resource of company cannot be a competitive advantage if
many competitors or potential competitors own it. If a resource or ability, considered
valuable, is present in a large number of competitors, each of them has the ability to adopt a
strategy that exploits the value of the resource or capability, thus the resource not being rare
will be unable to generate competitive advantage (Brunetti, Teixeira, de Castro, & Lara,
2015).
Inimitability (I): If valuable and rare resources are easily imitable, competitors would
quickly copy them and the potential for competitive advantage would disappear (Cardeal &
Antonio, 2012). Regarding imitability, Barney and Hesterly (2010, p. 76) ask: “Do firms
without a resource or capability face a cost disadvantage in obtaining or developing it
compared to the firms that already possess it?” Imitability lies at the boundary between
temporary and sustainable competitive advantage (Anderson & Birrer, 2011). If a valuable
and rare resource cannot be obtained or developed or substituted for by competitors, then the
focal organisation should enjoy a sustainable competitive advantage (Anderson & Birrer,
2011).
Organization (O): To obtain a competitive advantage, a firm must be organised with
policies and procedures directed at exploiting resources (Gutierrez, Alcaraz, Susaeta, Suárez
& Pin, 2015). Barney (1991) explains that firm resources that are rare, valuable, difficult to
imitate and organised can provide a sustained competitive advantage. Peng (2013) is of the
view that appropriate formal structures, control systems, and HR policies and practices are
some examples of a firm’s organisation.
From the authors’ elucidations, it can be noted that only the firm that can exploit the valuable,
rare, imitable resources and is organised to capture the value of resources can achieve
sustained competitive advantage.
3.5 The stakeholder theory
Green marketing is a broad phenomenon whose practice requires a meticulous
counterbalancing of vested interests of various stakeholders (Peattie 2001). Stakeholders are
defined as the groups or individuals, inside or outside the enterprise that have a stake or can
influence the organisation's performance (Kaplan 2010). The stakeholder theory, made
popular during the 1980s, suggested that corporations should look beyond the shareholder
theory of profit maximisation, and take into consideration other stakeholder groups that the
51
corporation is associated with, and who contribute to the company’s achievements (Nwanji &
Howell 2008). Kaplan (2010) points out that stakeholder theory offers another multi-
dimensional approach for enterprise performance measurement. According to Miles (2011),
the stakeholder theory first developed and used in business ethics and organisational
management, stipulates that a firm has stakeholders over and above shareholders or owners to
whom management needs to be accountable.
Stakeholder theory pertaining to managing organisations has become one of the “major
paradigm shifts of the last century” (Amaeshi & Crane, 2006, p. 247) and is concerned with
the nature of the relationship between the firm and its stakeholders (Ayuso, Rodrıguez, &
Ricart, 2006). According to the stakeholder theory, as brought forward by Freeman and
colleagues (e.g., Freeman, 1984; Freeman et al., 2010), the key objective of business is to
create value for all stakeholders involved, that is, “those groups and individuals who can
affect or be affected” by the business (Freeman, 1984, p. 25).
Stakeholder theory postulates that organisations must engage with stakeholders for normative
and instrumental reasons (Pillay, 2010). In the normative explanation, relationships between
the organisation and stakeholders takes place on an ethical basis, suggesting that managers
must consider the interests of those stakeholders who have a legitimate stake in the
organisation (Preble, 2005). In normative theory, there is a moral obligation for the
organisation to engage with stakeholders (Greenwood, 2007) and people have a democratic
right to participate in the decision-making process (Reed, 2008). By contrast, instrumental
theory sees stakeholders as being valuable in helping the organisations achieve objectives
since participation is seen as a means to an end (Donaldson & Preston, 1995; Preble, 2005).
Accordingly, the organisation achieves its objectives by managing this relationship with
stakeholders (Ayuso, Rodrıguez, & Ricart, 2006; Donaldson & Preston, 1995; Preble, 2005;
Reed, 2008). Via this approach, organisations address the interests of those who have
influence, recognising that managing these interests will ultimately lead to superior
performance and superior decisions (Ayuso, Rodrıguez, & Ricart, 2006; Reed, 2008).
The stakeholder theory defines a stakeholder as a group or individuals with the capacity to
influence or be affected by the operations of the organisation (Freeman 1984). It is important
to note that the identification of green marketing stakeholders is central to the practice of
green marketing as effective implementation requires the building of transformative
relationships with all parties involved in green marketing initiatives (Kirchoff et al., 2011).
52
The key stakeholders in green marketing practice are identified as governments, consumers,
employees, retailers, marketers, suppliers and environmentalists (Kinoti 2011:271; Mishra &
Sharma 2010). The identified stakeholders influence all aspects involved in the practice of
green marketing strategy, such as green product development, marketing, consumption and
green marketing programmes (Rasha & Igbaza 2011).
3.5.1 Critiques on the stakeholder theory
It is evidently clear that the stakeholder theory helps to clarify the importance of stakeholders
in organisations having resultant competitive advantages. However, there is other reflective
evidence that puts the stakeholder theory into criticism. Criticisms of stakeholder theory from
philosophical and theoretical standpoints have been thoroughly analysed and widely
commented upon in the scientific literature (Donaldson & Dunfee, 1994; Donaldson &
Preston, 1995; Gibson, 2000; Gond & Mercier, 2004; Kaler, 2003; Key, 1999; Moore, 1999;
Sternberg, 1996; Weiss, 1995). There have also been serious attempts to integrate theory with
research from disparate areas to further develop the stakeholder theory (Andriof et al. 2002;
Jawahar & McLaughlin, 2001; Venkataraman, 2002). Jensen (2001), as well as Lindsey,
Mauck and Olsen (2017:1), offers the following with respect to stakeholder theory:
"What is commonly known as stakeholder theory, while not totally without content, is
fundamentally flawed because it violates the proposition that a single-valued objective is a
prerequisite for purposeful or rational behaviour by any organization. In particular, a firm
that adopts stakeholder theory will be handicapped in the competition for survival because,
as a basis for action, stakeholder theory politicizes the corporation and leaves its managers
empowered to exercise their own preferences in spending the firm’s resources”
According to Phillips, Freeman and Wicks (2003), another common critique concerns the
"radical under-determinism" of stakeholder theory. That is, "In rejecting the maximisation of
long-term owner value as the purpose of business, and requiring business instead simply to
'balance' the interests of all stakeholders, stakeholder theory discards the objective basis for
evaluating business action" (Sternberg 2000, p. 51) and the theory fails to be "illuminatingly
action-guiding" (Marcoux 2000). In one sense, this critique is accurate, since the stakeholder
theory does fail to provide an algorithm for day-to-day managerial decision-making (Phillips,
Freeman & Wicks 2003).
Sternberg (1997) elucidates that the stakeholder theory equally precludes organisations from
having as their goals, housing the homeless and conducting scientific research, since all

53
organisations with substantive ends aim at something other than ‘balanced stakeholder
benefits’, they are all ruled out by stakeholder theory. Moreover, although stakeholder theory
is sometimes positively associated with the notion of trusteeship, it makes trusteeship equally
impossible: the obligation to balance stakeholder benefits overrides the specific obligations
that trustees have to their designated beneficiaries (Sternberg, 1997; Peston, 1996).
Additionally, the stakeholder theory does not allow for the variety of organisations and
organisational purposes; according to stake-holder theory, there is only one type of
legitimate organisation, the one that balances stakeholder benefits (Sternberg, 1997).
Lau (2014, p. 763) asserts that “the most serious problem with the theory roots in the identity
of stakeholders”. That is, the theory, on one hand, talks about the fact that a firm contains all
these normative or derivative constituency groups, on the other hand, the theory does not
have an inclination to address who these groups actually are and the entailed relationships a
firm should be having with them (Lau 2014). In addition, Fassin (2008) elucidates that the
theory tends to be over-simplified where more complex dynamics of relationships are
observed in a firm. Furthermore, Fassin (2008) further argues that the most obvious
“shortcomings” emerge from the identity problem of stakeholders which comprises at least
two issues: Firstly, stakeholders can have heterogeneous roles, i.e., the roles of stakeholders
could be debatable, based on how their identities are defined. Secondly, stakeholders’ inter-
dependence and reciprocity may not be as equal and direct as the theory suggests; it is not
uncommon to see changes in relationship when factors determining such relationship change.
3.6 The balanced scorecard theory
According to Njoroge (2015), the balanced scorecard theory emanated from the works of
Kaplan and Norton (1990) as an innovative business performance measurement system. In
1990, Kaplan and Norton led a research study of many companies with the purpose of
exploring new methods of performance measurement and the importance of the study was a
growing belief that financial measures of performance were ineffective for the modern
business enterprise (Akbarzadeh 2012). Representatives of the study companies, along with
Kaplan and Norton, were convinced that reliance on financial measures of performance had
an effect on their ability to create value and the group discussed a number of possible
alternatives, but settled on the idea of a scorecard, featuring performance measures capturing
activities throughout the organisation—customer issues, internal business processes,
employee activities, and of course, shareholder concerns (Akbarzadeh 2012).

54
Wu (2009) elucidates that the balanced scorecard is perhaps the most well-known
performance measurement framework and many people even believe it is the most important
as well as a widely used management theory. The balanced scorecard theory emphasises the
need to provide management with a set of information that covers all relevant areas of
performance in an objective way (Njoroge 2015). In addition, many scholars such as Kaplan
and Norton (1996); Grigoroudisn et al. (2012); Wu and Chang (2012); Amado et al. (2012);
Fu and Yang (2012) as well as Tan, Zhang and Khodaverdi (2017) point out that the
balanced scorecard is a theoretical framework to convert an organisation’s strategic
objectives into a set of performance measures within the consideration of four perspectives ,
namely, financial, customer, internal business processes, and learning and growth.
Thus, an important issue in regard to strategic performance measurement and SMEs is the
enabling role that can be played by the balanced scorecard (BSC) to align performance
measures and strategy based on the four perspectives of the BSC namely; financial
perspectives, customer perspectives, internal process perspectives and innovation and
learning/growth perspectives (Chimwani, Nyamwange, & Otuyo, 2013). Gumbus and Lussier
(2006) state that if an SME does not measure its financial, customer, process and learning and
growth aspects, the SME's manager and other stakeholders cannot know how well the SME is
performing. In addition, Gumbus and Lussier (2006) argue that if the SME wants to manage
these aspects of the business, they have to be measured. The balanced scorecard can help
SMEs by tracking performance and the balanced scorecard will also help by providing a clear
focus on the firm’s goals and promoting growth (Kirsten, Vermaak and Wolmarans, 2015).
Figure 3.2 shows the diagram of the balance scorecard framework and subsequently, four
perspectives of the BSC are elucidated.

55
Figure 3.2: The balance scorecard framework
3.6.1 Financial Perspective
Bhagwat and Sharma (2007) explain that financial perspective links the company to its
shareholders and those with a goal of achieving profitability and financial interest,
development in sales revenue and exploiting the wealth of shareholders. According to
Chimwani, Nyamwange and Otuyo (2013), financial measures remain an important
dimension within the BSC and financial performance measures indicate whether a company's
strategy, implementation, and execution are contributing to bottom-line improvement.
3.6.2 Customer Perspective
The source of existence of any organisation, whether it is private or public, is the need to
serve a certain group of consumers, also referred to as customers (Khomba 2011). In
addition, Drucker (2007) suggests that a company’s first task is to create and keep a
customer. Therefore, corporate executives are always reminded that in any organisational
setting, the customer is the king or queen and thus decides any future business (Dixit &
Friedmann, 2010). In the Balanced Scorecard model, Kaplan and Norton (1996) acknowledge
the above scenario by including the customer perspective as one of the key perspectives. In
Vision and
Strategy
Financial
Perspective
Customer
Perspective
Internal Business Process
Perspective
Innovation/ Learning and
Growth Perspective

56
their study, Appia-Adu and Singh (1998) concluded that SME practitioners who were able to
inject customer-oriented measures into their business had a distinct possibility of achieving a
competitive edge.
3.6.3 Internal Business Process Perspective
Tan, Zhang and Khodaverdi (2017) state that the internal business process perspective
identifies the critical internal processes which the organisation must achieve. This
assessment emphasises internal processes that will have high influence on the customer
value proposition, fulfilment and accomplishing an organisation's financial goals (Asosheh
et al. 2010; Grigoroudisn et al. 2012). Internal business process measures indicate the level
of a company's performance with respect to activities that are critical to meet customer and
financial objectives (Decoene & Bruggeman, 2006).
3.6.4 Innovation/ Learning and Growth Perspective
According to Sengfeng (2012, p.14) “this perspective touches on the people side of the
organisation and the prevailing organisational culture and climate”. It also focuses on
leadership issues and how the organisation paces itself to deliver value to customers
(Sengfeng, 2012). Van Staden (2009) points out that the enablers for learning and growth
come primarily from three sources: employees, systems and organisational alignment.
Furthermore, Van Staden (2009, p. 18) states that “strategies to ensure superior performance
will generally require significant investment in people, systems and processes that build
organisational capabilities”.
3.7 Porter’s theory of competitive advantage
According to Kharub, Kharub, Sharma and Sharma (2017), Michael E. Porter has been
regarded as a leading authority on competitive strategy in a nation and, more recently, the
application of competitive analysis on social and environment aspect of business activities. In
addition, Porter (1990) provided a model which was widely accepted and is used to measure
the competitive advantage of a nation (Kanakulya & Jinzhao 2017). In addition, Porter
suggested that there are five forces in the industry that determine the scale and extent of
competition, which together affects the attractiveness of the industry as well as the
competitive strategy of existing enterprises (Kanakulya & Jinzhao, 2017). The "five forces"
Porter's model has been regarded as the major analytical framework of the competitive
positioning paradigm and this framework allows a firm to assess its competitive positioning
through an evaluation of the strength of the threat of new entrants and substitute products; the
power of buyers and suppliers; as well as the degree and nature of rivalry among businesses

57
(Kharub, Kharub, Sharma, & Sharma, 2017). Thus, these five competitive forces are those
forces close to a firm and that affect a firm’s ability to serve its customers and make a profit.
Dhlomo (2017) also quoted Porter’s Five Forces theory, stating that these forces govern the
nature and intensity of competition within an industry and are the background against which
the choice of generic strategy should be made. A change in any of the forces normally
requires an SME to reassess the marketplace (Adeyemi, 2009). Mita (2017) observed that a
correct analysis of the five forces will assist a firm to choose one of the generic strategies that
will successfully enable the organisation to compete profitably in an industry. Therefore, it is
important for the owners/managers to understand the competitive forces and their underlying
causes. This reveals the roots of an industry’s current profitability while providing a
framework for anticipating and influencing competition (and profitability over time) (Porter,
2008). The five competitive forces are diagrammatically illustrated in Figure 3.3, below.
Figure 3.3: Porter’s Five Competitive Forces Model
Source: Adapted from Porter (2008)
Bargaining
power of
suppliers
Threat of new
entrants
Bargaining
power of
customers
Competitive
rivalry within
the industry
Threat of
substitute
products
58
3.7.1 Threat of new entrants
The threat of new entrants refers to new entrants to an industry that can raise the level of
competition, thereby reducing the attractiveness of the market (Grahn, 2013). Additionally,
Dess, Lumpkin and Eisner (2010, p. 56) are of the view that “threat of new entrants refers to
the possibility that the profits of established firms in the industry may be eroded by new
competitors”. This threat is high when the industry is attractive (when existing participants
are making good profits) and when there are low barriers to entry (Macmillan & Tampoe,
2000). For instance, when the incumbents (existing participants) do not continuously provide
the market with new forms of value, they open opportunities for new entrants who are able to
provide them. New entrants to an industry bring new capacity and a desire to gain market
share; they sometimes bring substantial resources to the industry which exert pressure on
prices, costs and the required rate of investment (Rossouw et al., 2003; Porter, 2008). In
addition, existing firms within an industry often try to reduce the threat of new entrants to the
marketplace by erecting barriers to entry (Amrollahi & Akhgar, 2013).
3.7.2 Bargaining power of suppliers
The bargaining power of suppliers refers to the ability of suppliers to force up the prices of
the inputs of firms in the industry (Hellriegel, Jackson, Slocum, Staude, Amos, Klopper,
Louw & Oosthuizen 2004). Lee, Kim and Park (2011) point out that the bargaining power of
suppliers refers to the ability of suppliers to raise prices or decrease the quality of inputs. The
bargaining power of suppliers tends to be higher when the suppliers are concentrated or when
they contribute to the larger component of the products that are bought by customers. Thus,
suppliers can bargain for higher prices and thus reduce the profitability of the SMEs (Jain,
1977).
3.7.3 Competitive rivalry within the industry
Dhlomo (2017) elucidates that the degree of rivalry measures the degree of competition
between existing firms and the higher the degree of rivalry, the more difficult it is for existing
firms to generate profits. The last of Porter’s competitive forces is the extent of rivalry among
established companies within an industry (Amrollahi & Akhgar, 2013). Competitive rivals
are firms with similar products and services which are aimed at the same customer group
(Louw & Venter, 2010). If this rivalry is weak, companies have an opportunity to raise prices
and earn greater profits (Godfrey & Qiang, 2000).

59
3.7.4 Bargaining power of customers
According to Hove and Masocha (2014), the bargaining power of buyers refers to the ability
of buyers/customers to force down the prices of the firms’ products and services. Malcolm
and Martin (2003, p. 98) point out that "when the SME market is dominated by a small
number of customers or where the customers constitute a large proportion of the SMEs’
services, competition intensifies due to the high bargaining power of customers”. In addition,
Pamulu (2010) points out that this power of buyers or customers depends on a number of
characteristics of the market situation and on the relative importance of purchases to the
industry compared with its overall business.
3.7.5 Threat of substitutes
The fifth force is the “Threats of Substitution”, where substitutes of products and services can
limit the potential returns of an industry by placing a ceiling on the prices firms in the
industry can profitably charge (Pamulu, 2010). A substitute is, according to the Oxford
Dictionary (2015a), “A person or thing acting or serving in place of another”. For example,
for the manufacturing firm producing manual screwdrivers, the advent of electrical,
automated screwdrivers is a serious direct substitute (Axelsson, Kron, Larsson, Nydén,
Näkne & Sörenson, 2015). In addition, Porter (2011) points out that substitute products also
pose a threat to the sustainability and profitability of a business. This type of threat occurs
when customers have a range of alternatives that may be like a product, or an opposite
substitute that may offer similar benefits (Hlatshwayo, 2015). Therefore, it is imperative for
businesses to develop products that are distinctively positioned and have favourable
perceptions by the target market to increase the level of loyalty that customers possess
towards a particular product (Hlatshwayo, 2015; Porter, 2011).
3.8 Chapter summery
This chapter covered a literature review on the underlying theories and models, which are the
resource advantage theory of competition, natural resource-based view theory, resource-
based view model, the balanced scorecard theory, the stakeholder theory, as well as Porter's
five forces model. It is imperative to note that the theoretical literature assisted in elucidating
the theories that were used in grounding the study. The next chapter is centred on the
empirical literature which explains the variables and their wide-ranging relations towards the
study.

60
4 CHAPTER FOUR: LITERATURE REVIEW: EMPIRICAL
LITERATURE
4.1 Introduction
The preceding chapter provided the theoretical framework of the study. This current research
chapter presents the empirical literature of the study and it observes all the pertinent collected
works found on the topic of the research. A literature review is a text of a scholarly paper,
which includes the current knowledge, including substantive findings, as well as theoretical
and methodological contributions to a particular topic (Lamb, 2014). In addition, a literature
review is not an annotated bibliography in which a brief summary of numerous articles is
reviewed, but a summary of what has been read well beyond a mere summarised professional
literature; it focuses on a specific topic of interest and contains a critical analysis of the
relationship among different works, relating the research to the study at hand (Mongan-Rallis,
2014). Therefore, deducing from the aforementioned elucidation, it can be noted that a
literature review outlines what has been found and not found on the subject matter, aims to
discourse gaps in the prevailing work and presents a review of the literature related to the
purpose of the study. The following section discusses the empirical literature of the research
constructs under study. Divided into sections, this chapter covers a literature review on the
historical overview of green marketing, green marketing, green marketing practices, green
packaging, green advertising, green product innovation and green process innovation,
competitive advantage and business performance.
4.2 Historical overview of green marketing
Green marketing has had a rather varied history, fluctuating between sanguinity and
disillusionment (Synodinos, 2014; Leonidou & Leonidou, 2011; Peattie & Crane, 2005). In
addition, Leonidou and Leonidou (2011, p. 69) point out that “although there is some
evidence of environmental concern pre-twentieth-century, the first real wave of consumer
environmental concern and resultant marketing interest in environmentalism only occurred in
the late 1960s”. The seminal works of Kotler and Levy (1969) introduced the idea of
marketing extending its scope beyond being merely a business activity to taking a more
active role in pursuing activities that will be advantageous to society as a whole. Furthermore,
“green marketing term was first discussed in a seminar on Ecological Marketing, organized

61
by American Marketing Association (AMA) in 1975 and took its place in the literature”
(Tiwari 2012, p.33).
Kataja (2014, p. 2) contends that “one of the first books published was “Ecological
Marketing” by Hennidon and Kinnear in 1976”. The decade of the late 1980s marked the first
stage of green marketing, when the concept of “green marketing” was newly introduced and
discussed in the industry (Solvalier, 2010). The term green marketing came into prominence
in the late 1980s, as well as early 1990s, and the first wave of green marketing occurred in the
1980s (Tiwari, 2012). The tangible milestone for the first wave of green marketing came in
the form of published books, both of which were called Green Marketing (Tiwari, 2012).
They were by Ken Pattie (1992) in the United Kingdom and by Jacquelyn Ottman (1993) in
the United States of America. According to Peattie (2001), the evolution of green marketing
has three phases and these phases are explained as follows:
First phase was termed as "Ecological" green marketing, and during this period, all marketing
activities were concerned to help environmental problems and provide remedies for
environmental problems.
Second phase was "Environmental" green marketing, and the focus shifted to clean
technology that involved designing of innovative new products, which take care of pollution
and waste issues.
Third phase was "Sustainable" green marketing. It came into prominence in the late 1990s
and early 2000, and was concerned with developing good quality products which can meet
consumers’ needs by focusing on the quality, performance, pricing and convenience in an
environment-friendly way.
Table 4.1 represents the most vital characteristics within each decade of green marketing
evolution during the past thirty years.

62
Table 4.1: The most important activities in green marketing history
Stage Decade The most important activities in green marketing history
1st stage 1980s Introduction of ecological products; ecological was equivalent to
green products; green consumption was very low
2nd stage Early 1990s High concern about green issues; still low consumption of green
products; companies involve themselves in using less raw material,
wasting less; corporate efforts in recycling, energy efficiency,
corporate responsibility
3rd Stage Late 1990s Changes in production processes, technology and resourcing;
sustainability marketing; Total quality management involves
environmental issues
4th Stage 2000s Green products and services making a comeback; Eco-friendliness
/going-green become more and more popular between companies and
consumers; the term of ‘sustainable green marketing’ is introduced
Source: Adopted from Solvalier (2010, p. 9).
4.3 Green marketing defined
The progressive development of marketing has seen various definitions of green marketing
arise (Dahlstrom, 2011). According to Saini (2014), green marketing is a business practice
that considers the consumer concerns about promoting preservation and conservation of
natural resources. Green marketing is the way firms can advertise their products and at the
same time, inform the consumers that they are working in an environmentally friendly way
(Chen & Chang, 2012). Green marketing encompasses all marketing activities, such as
research and development, product design, packaging and advertising, that are necessary to
develop and sustain consumers’ eco-friendly attitudes and behaviours, in a way that sustains
the natural environment (Sarumathi 2014; Selvakumar & Pandi 2011). Green marketing also
represents a set of strategies associated with the production, pricing, promotion and
distribution of offerings that are designed to satisfy the demand of consumers and societal
well-being (Kung et al., 2012). According to Polonsky (2011, p. 1311), “the ultimate
objective of green marketing is to promote integrated exchange processes that strike a
balance between business, society and the natural environment”. Green marketing is also
considered as a tool for monitoring, seeking and fulfilling consumer needs and desires in the
context of environmental responsibility (Akehurst et al., 2012). Marketing products which are
environmentally safe; developing and marketing products to minimise environmental
hazards; produce, promote, and package products in a manner befitting so as to protect the

63
environment are some characteristics of green marketing, as the term is understood in the
present business world context (Arseculeratne & Yazdanifard, 2013).
Dangelico and Vocalelli (2017, p. 1267) defined green marketing as “the process of planning,
implementing and controlling the development, pricing, promotion, and distribution of
products in a manner that satisfies the following three criteria: (1) customer needs are met, (2)
organizational goals are attained, and (3) the process is compatible with eco-systems”. Troup
(2010, p. 1) views green marketing as “the use of various marketing activities that encourage
the purchase of environmentally preferable products, as well as encourage a change in
lifestyles”. Furthermore, Synodinos, (2013) uses the term green marketing in reference to
marketing activities that attempt to impede the negative social environmental effects of
existing products and production systems, and promote less harmful products or services.
It can be reasoned from the foregoing discussion that green marketing mirrors the goals of
conventional marketing, which are to facilitate exchanges with the intention of satisfying
consumer needs profitably. The point of difference is that green marketing attempts to satisfy
consumer needs with minimum detrimental impact on the natural environment (Singh &
Pandey 2012). Precisely, green marketing needs to be understood as a comprehensive
phenomenon aimed at balancing consumption, production and environmental sustainability
(Chen & Chai 2010). Moreover, “as increasing competition drives companies to become a
greener company, and green marketing concept based on green environmental responsibility
has become a strategy for companies” (Aytekin & Çelik, 2017, p. 1099).
4.4 Green marketing practices
Miryala and Mennakanti (2016) explain that in the present scenario, there is an immense need
to develop the products and services that not only satisfy customer needs or wants, but also
contributes in safeguarding the environment. The solution for this is to follow green
marketing practices (Miryala & Mennakanti, 2016). Environmental or green marketing
practices as a result of compulsion due to legislative pressures and pressures of
environmental groups have changed to genuine efforts to behave in an eco-responsible
manner and improve sustainable marketing plans (Sen, 2014). In addition, Nadaf and Nadaf
(2014) are of the view that many global players in diverse businesses are successfully
implementing green marketing practices. Oburu (2010) elucidates that green marketing
64
practices focus on environmental sustainability, where sustainability involves using resources
at a rate that allows them to be replenished to ensure their long-term survival. Sing and
Pandey (2012) elucidate that the concept of green marketing practices involves several
features as this term is understood nowadays, including marketing eco-friendly and safe
products; manufacture, product promotion, and goods packaging harmonious with the
environment and minimising the hazard to the environment. Kimani (2015, p. 2) argues that
“green marketing practices implies cooperation between suppliers and sellers, partners as
well as rivals, in order to achieve environmentally sustainable development throughout the
entire value chain, while at the same time, it internally calls for the cooperation of all
business functions in finding the best possible solutions for two major guiding principles:
profit and long-term, positive contributions to the environment society and the natural
surroundings”.
Green Marketing practices entail a serial of organisation functions, including environmentally
friendly products and logistics, sustainable promotion and pricing and green consumption
(Zhanglan, 2016). In addition, green marketing practices include eco-labelling, product
returns programmes, reverse logistics, pollution control, sponsorship of environmental
ventures, environmental management systems, reduction of raw materials used in product
design, and adherence to green procurement policies (Oburu, 2010). Green marketing
practices also entail construction of a bridge to link the business and customer (Ko, Hwang,
& Kim, 2013). In addition, Siddique, Hayat, Akbar and Cheema (2013, p. 23) posit that
“green marketing practices are shaped by the involvement of the marketers as well as the
customer”. However, Mishra and Sharma (2010) argue that both the green marketer and
green consumer are responsible to eliminate harmful practices to develop successful green
marketing strategy.
In addition, Eltebrandt (2010, p. 2) mentions that “green marketing practices offers
opportunity to engage people and promote green life styles”. Fuentes (2015) clarifies that
green marketing practices are green only in the sense that they include different green
products and messages. Sahay, Stough, Sohal and Goyal (2006) assert that green marketing
practices must direct customer needs towards ecologically safe products and practices
through technological innovations. Miryala and Mennakanti (2016) stress that the green
marketing practices prove to be healthy, save time, money, and also reduce waste. Amegbe,
Owino, and Nuwasiima, (2017) suggest that organisations that engage in green marketing

65
practices may be able to benefit the firm in multiple ways. For instance, firms that have a
green orientation are likely to achieve greater financial gains and market share, high levels of
employee commitment, increased firm performance and increased capabilities (Amegbe,
Owino & Nuwasiima, 2017). This was also supported previously by scholars such as Luo and
Bhattacharya (2006), who stated that green marketing leads to increased customer
satisfaction, greater firm value and can reduce the undesirable risk, and Lash and Wellington
(2007) who affirmed that organisations attain benefit from green practices through cost
savings.
Moreover, in a study conducted by Ogunmokun, Tripolitano, and Rose (2012) revealed that
those organisations with high levels of green marketing practices outperformed organisations
with low levels of green marketing practices in terms of after tax return on sales; business’s
total sales growth, overall business’s performance, competitive position or advantage and
market shares. Furthermore, Eneizan, Wahab and Bustaman (2015) indicate the advantages of
pursuing green initiatives, such as larger financial gains and market share, high levels of
employee commitment, and competitive advantage.
4.5 Green packaging
According to Isa and Yao (2013), packaging plays an important role in preserving, protecting
and marketing products during their storage, transport and use. The packaging of a product
can serve as the first step in minimising the environmental impact of the product, an
additional means of making the product more environmentally friendly and as an important
branding tool to help consumers differentiate the product as being an eco-brand (Synodinos
2014). According to Adebanjo (2000), powerful marketers seek greater demand on packaging
in order to satisfy consumers’ needs. Quoquab, Thurasamy and Mohammad (2017) point out
that packing is costing, thus the producers, the consumers and the activists search for cost-
efficiently, environmentally friendly and sustainable packaging focus on functionality, cost-
effectiveness and support of long term human and ecological health. Therefore, the
combination of green and packaging would be an interesting topic for marketers who are
targeting a green segment of the market (Isa & Yao, 2013). In addition, Rao and Bhargav
(2016) say that consumers are increasingly demanding green packaging. Green packaging
which is the explicit phenomenon in most instances, has to do with suitable packaging that
reduces environmental damage (Sambu, 2014). Green packaging is also known as
sustainable packaging (Kumar, Agarwal & Singh, 2017). It is the development and use of
packaging which results in improved sustainability of products (Kumar, Agarwal & Singh,

66
2017). Green packaging means that the containers are not affecting future generations and
must not go to waste and reduce the use of underground resources, respect human needs in
terms of pay, and working conditions (Quoquab, Thurasamy & Mohammad, 2017).
According to Mohamed (2016), green packaging is the use of manufacturing methods and
materials for packaging of goods that has a low impact on the environment and energy
consumption. Green packaging is not only related to the reduction of packaging; it also
involves the use of sustainable, biodegradable packaging and recycled materials to reduce
environmental impact and ecological footprint (Mohamed, 2016). According to Khan,
Hussain and Ajmal (2016, p. 94) “green packing involves reducing the size, shape and weight
of packaging and the use of environmentally friendly materials”. It can be defined as a way to
package products that minimises impacts to the environment (Kassaye, 2001). Carlson (2015)
points out that sustainable or green packaging is packaging that is benign; it does not pollute,
use up resources or harm the environment.
According to Chiellini (2008), green packaging causes less damage to the environment than
other forms of packaging, it is ‘environmentally friendly’. Emmett and Sood (2010) agree
that green packaging results in less damage to the environment than the traditional forms of
packaging as packaging waste is one of the highest sources of environmental degradation;
there are therefore big opportunities for improvement. Therefore, by switching to green
packaging, organisations will allow their products to gain a public image (Khan, Hussain &
Ajmal, 2016). Ho, Shalishali, Tseng and Ang (2009) identified that green packaging can
reduce material useage, improve space utilisation and reduce the handling time. Likewise,
Emmett and Sood (2010) offer three key benefits of green packaging which are as follows:
More public demand for the use of safe and appropriate packaging materials will benefit the
environment; Increase in customer satisfaction through having clean neighbourhoods as green
packaging results in less waste accumulation and easier recollection; Enhanced goodwill and
perception as a socially and environmentally responsible organisation to end users.
Chiellini (2008) clarifies that there are three types of green packaging which are reusable,
recyclable and biodegradable packaging. However, Hartmann and Ibáñez (2006) claim that
green packaging can be in term of reuse, reduce and recycle. The other additional one R is
considered as replace. So, these 4Rs are the good examples for the packaging. Figure 4.1
shows a diagrammatic illustration of green packaging process with special emphasis on the 4
Rs.

67
Figure 4.1: Green packaging consciousness
4.5.1 Reuse
The first R which is reused packaging is the situation where an organisation is able to cut the
cost whereby they are just used the existing packaging, such as a bottle. Prendergast, et al.
(2001) mentions that this action (reused) is gaining positive feedback from the interviewees
where they like to use and reuse packaging. In fact, it is also good for the environment
because there is no pollution and the business is able to avoid insufficient raw material.
Chiellini (2008) points out that reusable packaging, such as glass bottles, can be cleaned and
reused. The reuse of packaging can be found in reusable, collapsible shipping containers
(Kroon & Vrigens, 1995).
4.5.2 Reduce
According to Rao and Bhargav (2016), reduce means decreasing the use of packaging with
less material, but stronger and thinner material. It also means bringing down the packages to
their optimal sizes and weight (Rao & Bhargav, 2016). A reduction of packaging material is
positive for the environment, as well as the supply chain due to the reduction in transportation
and storage cost (Schvaneveldt, 2003). Moreover, Sambu (2016) points out that there are a
number of ways in which packaging can be reduced without compromising the primary
performance of the packaging as well as reducing the total cost i.e. sell in larger unit sizes,
sell refills, reduce the thickness of the packaging material, switch the packaging to a material
of which less is needed, and/or use efficient design formats.
Green
Packaging
Consciouness
Reuse
Recycle
Refill
Reduce
68
4.5.3 Recycle
Recycling is defined as the reuse of materials from returned products without affecting the
product identity (Kapetanopoulou & Tagaras, 2011). Recycling practices result in improving
their environmental performance by complying with environmental standards and conserving
resources, and thus building their environmentally-friendly image in the market (Eltayeb,
Zailani, & Ramayah 2011). Recycling of packaging is increasing day by day and according to
an estimate, around 75 percent of used packaging that is made out of plastic, wood, glass or
steel is used for recycling packaging (Saad & Abdullah, 2013). Where the packaging cannot
be collected and reused by the company due to the nature of the transaction or of the
packaging, then it should be easily recycled through the most efficient and environmentally
friendly method of putting it back in use for either the same or similar products (Emmett &
Sood 2010). Chiellini (2008) points out that recyclable packaging is made of materials that
can be used again, usually after processing, such as glass, metal, card and paper. In addition,
recycling of green packaging has become important for us and our environment both, and we
should apply it to our everyday lives as we are wasting packaging at a much higher rate than
ever before (Saad, & Abdullah, 2013). Rasi, Abdekhodaee and Nagarajah (2010) conducted
an empirical study of environmental initiatives implementation in the Malaysian Small and
Medium Enterprises’ (SMEs). Rasi, Abdekhodaee and Nagarajah (2010) specified that
recycling activities give SMEs additional income and most SMEs often take this opportunity
to achieve both environmental performance, as well as cost saving.
4.5.4 Refill
The refillable packaging is one of environmental friendly packaging (Saad, & Abdullah,
2013). According to Darlow (2003), this type of environmental friendly packaging has been
suggested for a long time as a potential way for solving wasting packaging problem.
Lofthouse and Bhamra (2006) found that most of the customers prefer to use the refill
packaging on convenience products because these packaging systems are cost effective and
the packaging is quick and easy to use it. However, some refill packaging can make the
customer feel unsatisfied with some of factors that can influence them, for example, bad
quality of product in a poor quality of packaging (Lofthouse & Bhamra, 2006).
4.6 Green advertising
Companies can show environmental sensitivity by using several strategies; one of these
marketing tools can be environmental or green advertising (Sheehan & Atkinson,

69
2016). Green advertising is related to communicating organisational commitment towards
sustainability, environmental initiatives of companies and green product attributes in the
market (Ghodeswa & Kumar, 2014). In addition, Green advertising is advertising which aims
to convince consumers that they should purchase a particular product because it is good for
the environment (Kumar, Agarwal & Singh 2017). In addition, Schmuck, Matthes, Naderer
and Beaufort (2017) point out those green advertisements address the relationship between
products or service and the natural environment, advocate an environmentally responsible
lifestyle, and highlight a corporate environmental image or responsibility. According to
Kumar and Kumar (2017, p. 71) “green advertising is an important facet of green
marketing that communicates greenness in products, services, practices and processes of
organisations”. It refers to the appeal that includes ecological, environmental
sustainability, or nature-friendly messages targeting the needs of environmentally
friendly consumers (Kumar & Kumar, 2017).
Makhutla (2014, p. 16) defines green advertising as “a social marketing effort by companies
to promote a product or service from a green lifestyle perspective and to improve the image
of the company using environmental activities”. He further explains that green advertising is
a plain link between a product and an organisation’s service to the environment. Jaju (2016)
suggested that green advertisements contribute in translating the consumer’s perceived value
of green products into purchases. According to Cho (2012), green advertising is defined as
any advertisement that meets one or more of the following criteria: (a) explicitly or implicitly
addresses the relationship between a product or service and the ecological environment, (b)
promotes an environmental lifestyle with or without highlighting a product or service, or (c)
presents a corporate image of environmental responsibility. Green Advertising is advertising
created to influence the homemakers to buy and use environmentally friendly products in
their daily activities (Tehrani 2011). Alniacik and Yilmaz (2012) maintain that green
advertising is different to advertising, generally, the most pointed difference is:
Advertising is often abstract and gives consumers understanding about the basis of
green advertising.
Message in advertising more clearly then advertising generally to make the consumer
understand about environment concerns and also give information about product life
cycle, production made from environmentally friendly materials and environmental
friendly logo contained in green advertising

70
Messages in green advertisements intend to describe product features, prices and
value for money, product availability and accessibility, and availability and
accessibility of product-related information (Leonidou, Katsikeas, & Morgan,
2013). Ahuja (2015) elucidates that green advertising is considered to be a tool for
sustainable and continuous economic development of a nation.
4.6.1 Intention of green advertisements
The intention of green advertisements varies from communicating simple, crisp and
general environmental information about products to engaging consumers with company
representatives and products (Kumar, 2017; Benoit-Moreau & Parguel, 2011). Therefore,
the next sections are centred on the four categories of green advertisement intention.
4.6.1.1 Intention to communicate corporate environmental approaches
Nyilasy, Gangadharbatla, and Paladino (2014, p. 694) explained that corporations engage in
green advertising for any of the following reasons: ‘‘(a) the emergence of a green consumer
segment, (e.g., (b) the greening of other stakeholder groups, notably owners [and/or
stockholders], and (c) the increase in responsible business development’’. Deducing from the
the reasons why corporations engage in green advertising, it is clear that such strategies can
be part of a firm’s much broader corporate social responsibility initiatives (Nyilasy,
Gangadharbatla, & Paladino 2014). According to Wahba (2012) as well as Cox (2008), green
advertising intends to present a corporate image of environmental responsibility. Ahonen,
Hansen, Heikki and Karna (2001, p. 57) explicate that “some companies recognise that green
marketing is an essential tool to communicate environmental advantages linked to their
products and processes and are therefore attempting to ‘portray’ a green identity and/or brand
image”. Consequently, green advertising is becoming common practice in today’s society,
across many product categories and sectors (Grillo, Tokarczyk & Hansen, 2008). Moreover,
Kumar (2017) elucidates that “advertisements with the intent to communicate corporate
environmental approaches incorporate information related to environmental vision, mission,
values, objectives, goals, strategic actions and policies, sustainability strategy, principles of
doing business, compliance to national and international environmental guidelines, and
efforts of developing sustainable culture”.
4.6.1.2 Intention to develop believability towards environmental claim
Since green advertising makes use of the environment claims, it is necessary to understand
what its meaning is. Scammon and Mayer (1995, p. 33) point out that “an environmental
claim is a statement by a seller regarding the impact of one or more of its brand attributes on

71
the natural environment”. Examples of general environmental claims would include terms
such as “environmentally friendly” “safe for the environment,” and “environmentally
responsible” (Sheehan & Atkinson, 2016). Deducing from the aforementioned explanations,
Kumar (2017) points out that advertisements with this intention, aim at developing a reliance
on environmental information they provide. This can be explained with broadly two
approaches. One is, advertisements distinctly emphasise environmental recognition and
certifications awarded to companies’ products and processes. The other is, advertisements
mention about other sources of information that validate environmental claims. For example,
advertisements tend to advise consumers to access specific web links that provide
environmental information related to companies’ product, processes and performance.
4.6.1.3 Intention to inform consumers
Pranee (2010) simply states that green advertising’s aim is to inform clients about the
environment aspects of companies’ products and services. Green advertising has a positive
impact on consumers’ purchase intentions and builds strong trust between the two (Ahuja
2015). According to Jarin, Rahat and Kashem (2014), a firm must use green advertisement by
creating green billboards, green buntings, and posters, etc. This type of advertisement creates
consumer consciousness among consumers toward green products if this is developed by
using some emotional appeal on environment scenarios, green colour, and green concepts in
their advertisement (Jarin, Rahat & Kashem 2014).
4.6.1.4 Intention to engage consumers
“Green advertising helps to attract consumers by highlighting green features and eco- friendly
products that are safe for environment as well as consumers” (Ahuja, 2015, p. 42). In
addition, green advertising has a positive impact on consumers’ purchase intentions and
builds strong trust between the two (Ahuja, 2015). In addition, Kumar, (2017) suggests that
advertisements with the intention of engaging consumers refer to building and managing
company-consumer relationships. Such advertisements invite consumers for company-
consumer and product-consumer interactions in many ways, such as inviting consumers to
participate in company-sponsored public events (Kumar, 2017).
4.7 Green innovation
The classic definition of green innovation offered by Dangelico and Pujari (2010) is a multi-
faceted process wherein three key types of environmental focus – material, energy, and
pollution – are highlighted, based on their major impact on the environment at different
stages of the product’s physical life cycle. For Small and Medium Enterprises (SMEs), green

72
innovation includes the development of new, more environmentally-friendly products and
changing process or production method (Oxborrow & Brindle 2013). Green innovations can
be categorised into green product innovation and green process innovation (Chan 2011;
Rennings & Rammer, 2009). A study by Kurapatskie and Darnall (2013) revealed that
companies who develop new green products and processes enjoy more benefits than
companies who just modify existing products and processes. The subsequent sections are
focused on comprehensive elucidations and deliberations of green product innovation and
green process innovation.
4.7.1 Green product innovation
Dangelico and Pujari (2010) elucidate that green product innovation has been recognized as
one of the key factors to achieve growth, environmental sustainability, and a better quality of
life. Understanding green product innovation as a result of interaction between innovation
and sustainability has become a strategic priority for theory and practice (Dangelico & Pujari,
2010). According to Zhu, Sarkis, and Lai (2013), in 1994, customers were willing to pay
approximately 13% more for green products. Green product innovation pertains to the
evaluation of a product’s economic, technical and commercial feasibility (Van den Berg,
Labuschagne, & Van den Berg, 2013). Green product innovation often incorporates the
modification, redesign, and creation of new products that aim at green innovation, which are
primarily related to technological changes in production processes (Kong, Feng, & Ye, 2016).
In addition, Lin, Tan and Geng (2013, p. 103) define green product innovation as “products
that reduce the negative impacts and risks to the environment, utilize less resources and
prevent waste generation in the product’s disposal phase”. In other words, green product
innovation not only protects the natural environment, but also provides environmental
benefits higher than conventional products (Lin, Tan & Geng, 2013). Futhermore, green
product innovation refers to the application of innovative ideas, leading to the design,
manufacturing, and marketing of new products whose newness and greenness
significantly outperform conventional or competing products (Alsughayir, 2017).
Huang and Wu (2010, p. 1540) as well as Santamaria, Nieto, and Miles (2012, p.145)
explains that green product innovation has to do with a “product that is related to
environmental innovation, including the innovation in product that are new or that offer a
significant improvement on the basic characteristic, technical specification, incorporated
software or any components or materials and the product that introduced are involved in
energy-saving, pollution-prevention, waste recycling, no toxicity, or green product design,

73
using less or non-polluting/ toxic materials, improving and designing environmentally
friendly packaging for existing and new products, recovery of company’s end-of-life products
and recycling”. Claudy (2011, p. 20) also mentions that “green product innovation is an
iterative process, initiated by the opportunity for environmental improvement of the product’s
physical lifecycle via a technology-based invention, which leads to the development,
production and marketing tasks striving for the commercial success of the invention”. Thota
and Munir (2011, p. 130) argue that “green product innovation begins during product or
design development and a green company chooses materials that cause the least amount of
pollution and consume the least amount of energy as well as resources”. Additionally, Wahid
and Lee (2011) point out that conventional product innovation does not truly focus on
environmental improvement, while green product innovation’s purpose is to reduce and avoid
environmental burdens. Consequently, green product innovation can be conceptualised as any
innovations in products which strive to protect or enhance the natural environment by
conserving energy, resources and reducing or eliminating the use of toxic agents, pollution
and waste (Zahari & Thurasamy, 2012; Ottman, Stafford & Hartman, 2006).
According to Shapfi (2015, p. 9) “green product innovation is a multi-faceted process
wherein three key types of environmental focus materials, energy, and pollution are
highlighted based on their major impact on the environment at different stages of the products
physical life cycle manufacturing process, product use, and disposal”. The green product
innovation measurement consists of three main elements related to new product development.
First, the company must choose the materials that produce the least amount of pollution,
second, the company has to use the least amount of materials to manufacture products, and
third, the company has to circumspectly deliberate whether the product is easy to recycle,
reuse, and decompose (Guoyou, 2013). The development of green product innovation is
becoming a need and an opportunity for firms to reduce the negative influences of production
on the environment and to gain competitive advantage with competitors (Dangelico &
Pontrandolfo, 2010). In other words, green product innovation has become the critical basic
for improving large productivity by maintaining their competitive advantage and achieving
larger market share (Shapfi, 2015).
According to Adialita (2014), the current trend of green product development, however, is
not without obstacles and pitfalls. First, many environmental attributes, such as fuel economy
and recyclability, have effects that conflict with traditional product attributes or
performances, such as safety, material consistency, and convenience. Second, despite the

74
introduction of green products as alternatives to already existing ordinary products, many
customers still stay with ordinary products with low environmental quality because of cost
and performance considerations or ignorance and disbelief (Adialita, 2014). Third, like most
innovation activities, green product development is a task characterised by high levels of risk
and uncertainty. Often the R&D investment is costly and its return is highly uncertain (Chen,
2001). However, through the efficient use of resources, low impact and risks to the
environment, and waste generation prevention since their conception stage, green products
offer high quality and low overall costs to the consumer and society (Albino, Balice, &
Dangelico, 2009).
Besides the obstacles that are associated with green product innovation, Chiou et al. (2011)
elucidate that innovative products which are green enhance firm profitability as products
marketed under the green and innovative concept may bring in new customers and fresh
revenue. Moreover, firms that engage in green product innovation are in fact environmental
leaders because they can introduce environmental advances in their products and processes
and be environmentally proactive (Gallagher, 2012). Deducing from the authors’
explanations, it can be noted that green product innovation has to do with the introduction of
a product that is new or has significantly improved characteristics that do not harm the green
natural environment.
4.7.2 Green process innovation
Green process innovation is the process that is assumed to happen when it has implemented
new or significantly improved production processes, new distribution methods or support
activities for its goods and services and the process is related to energy-saving, pollution-
prevention, waste recycling, or no toxicity, low energy consumption, recycle, reuse and
remanufactured material and use of cleaner technology to make savings as well as prevent
pollution (Conding, Zubir, Hashim, Lanang, & Habidin 2013). In a similar vein, green
process innovation is defined as the application of innovative ideas leading to the adoption of
production processes and/or management practices that create less or no negative ecological,
human health, social, cultural and economic impacts (Alhadid & As’ad, 2014; Chen 2011).
According to Conding, Habidin, Zubir, Hashim, and Jaya (2012), green process innovation is
defined as improvements in the production process, resulting in reduced environmental
impacts. According to Huang and Wu (2010) as well as Santamaria, Nieto, and Miles (2012),
green process innovation refers to “the process that assumed to happen when it has
implemented new or significantly improved production processes, distribution new methods
75
or support activities for its good and services and the process is related to energy- saving,
pollution- prevention, waste recycling, or no toxicity, low energy consumption, recycle, reuse
and remanufacture material and use of cleaner technology to make savings and prevent
pollution”.
Green process innovation refers to the modification of the current operating processes and
systems, aiming to produce new or significantly improved green products which can reduce
environmental impact (Meeus & Edquist, 2006). According to Xie, Huo, Qi and Zhu (2016),
green process innovation refers to the improvement of existing production processes or the
addition of new processes to reduce environmental impact. “Green process innovation is
defined as the performance of process innovation that is related to energy saving, pollution
prevention, waste recycling, or reduced toxicity” (Nanath, & Pillai, 2017, p. 6). Additionally,
Ziegler and Nogareda (2009), as well as Rennings and Ziegler (2004), believe the green
process innovation is a special process innovation which could avoid or reduce the
environmental burden. In general, the basic principles of green process innovation definition
are as follows: less resources depletion; less waste; and less environmental pollution (Bi,
Bao, & Feng, 2013).
Furthermore, Diwekar and Shastri (2010) contend that green process innovation does not
only include traditional process engineering related issues such as process design, but also the
associated ecological and social aspect of processes. According to Wahid and Lee (2011), the
key characteristics for green process are that the end manufactured product contains non-
hazardous substances and was processed without hazardous chemicals. Besides that, green
process also uses the energy and resources during production efficiently and sensibly (Wahid
& Lee, 2011). This will reduce the chances of environmental incidents and result in quality
improvement and more profitable business (Kuo, 2007). Green processes innovations are also
known as environmental process innovation which is an introduction of a more
environmentally friendly composition of one or more firm internal processes (e.g., water
recycling or fuel gas desulphurisation) in this period, irrespective of the realisation of
environmental product innovations (Wahid & Lee, 2011; Zieglera & Nogaredac, 2009).
The green process innovation measurements consist of three elements. First, the
manufacturing process effectively reduces the emission of hazardous substances or waste,
second, the manufacturing process reduces the consumption of water, electricity, coal, and
oil, and third, the manufacturing process reduces the use of raw materials (Alhadid & As’ad,

76
2014; Guoyou, Saixing, Chiming, Haitao, & Hailiang, 2013). Green process innovation
includes measures to reduce air and water emissions, improve resource and energy efficiency,
reduce water consumption, and switch from fossil fuels to clean energies (Chiou, Chan,
Lettice & Chung, 2011). Green process innovation can help manufacturing industries by not
only improving their environmental compliance, but also providing differentiation advantages
and even improving their financial performance (Cheng, Yang, & Sheu, 2014). Ma, Hou and
Xin (2017) note that green process innovation helps to solve environmental problems in the
manufacturing process. It can increase resource productivity as well as energy usage
efficiency and decrease pollution during production (Ma, Hou, & Xin, 2017).
4.8 Competitive advantage
Competitive advantage is a common theme in the social sciences and business literature.
However, despite its prominence in both academic and practitioner fields for the past few
years, the concept of competitive advantage continues to be vague (Klein 2002). The issue of
ambiguity in the notion of competitive advantage can be attributed to three major factors.
Firstly, competitive advantage has its orgin in unclear definitions or different meanings
(Rumelt, 2003). Secondly, different research streams on competitive advantage (e.g., the
activity-position view, the resource based view, the relational view) exhibit differences in
their assumptions, units of analysis and strategic implications (Dyer & Singh, 1998). Thirdly,
even scholars of the same research stream, -i.e. The resource based view –have changed their
explanatory logics over time (Stoelhorst & Bridoux, 2007). This section first discusses the
concept of competitive advantage. Then, an overview of the three major research streams of
competitive advantage is presented. Lastlty, the common issues related to competitive
advantage are discussed.
4.8.1 The concept of competitive advantage
According to Rahim, Fernando, and Saad (2016), the capacity of an industrial undertaking to
generate a distinguishable unassailable position over its competitors through management
decisions is termed as “competitive advantage”. In addition, competitive advantage of a
business refers to a firm’s ability to earn consistent profits over rival firms in the industry by
delivering a service which cannot be matched easily (Arseculeratne & Yazdanifard, 2013).
Gaining competitive advantage in terms of marketing is one of the objectives, on which
companies are focusing, in an attempt to change psychological and social perceptions of
society (Shakeel & Khan 2011). Bulankulama, Khatibi and Herath (2014) define competitive
advantage as an organisational capability to perform in one or many ways that competitors
77
find difficult to reproduce now and in the future. Competitive advantages are company assets,
attributes, or abilities that are difficult to duplicate or exceed, and provide a superior or
favourable long-term position over competitors (Faulkenberry, 2012).
Competitive advantage is something to do with more competitive markets; lower barriers to
entry or simply a larger number of firms may give an industry an advantage in competing
with foreign rivals (Gupta, 2015). Lazenby (2015) is of the view that competitive advantage
is to have something that your competitors do not have; it is the edge that an organisation has
over others. In addition, Daft (2012) states that competitive advantage is what sets the
organisation apart from others and provides it with a distinctive edge in the market place.
Kraja and Osmani (2015) argue that a firm’s competitive advantage is a function not only of
the value, inimitability, and non-substitutability, of its resources and capabilities, but also of
their durability and superiority. Competitive advantage is defined as “a company occupies
some position where the competitors cannot copy its successful strategy and the company can
gain sustainable benefits from this successful strategy” (Nanath, & Pillai, 2017:4).
Arseculeratne and Yazdanifard (2014, p.130) point out that “competitive advantage of a
business refers to a firm’s ability to earn consistent profits over rival firms in the industry by
delivering a service which cannot be matched easily”. In order to gain competitive advantage,
a green marketing strategy has to address some fundamental areas of importance such as
market segmentation, developing a green product, green positioning, setting green prices,
application of green logistics, proper waste management, launch of green promotion, forging
green partnerships and in essence, having the right green marketing mix (Arseculeratne &
Yazdanifard, 2014).
Murimbika and Urban (2013) stipulate that competitive advantage can be achieved through
scanning or environmental scanning. Therefore, it is vital for businesses to be capable to
change a mix of company resources into capabilities that will enable the business to compete
effectively and efficiently (Mat & Razak, 2013). Competitive advantage is strengthened by
innovation (Mat & Razak, 2013; Adeniran & Johnston, 2012). Moreover, competitive
advantage depends on identifying new and emerging opportunities in the marketplace where
conventional strategic thinking based on predictable environments is no longer effective
(Murimbika & Urban, 2013). In this view, business owners and managers should be super
innovative and proactive in determining apt mechanisms to be used in order to remain
competitive.

78
A high degree of planning flexibility allows an organisation to respond proactively to
environmental changes, thereby allowing opportunity and exploitation in search for a
sustainable competitive advantage (Murimbika & Urban, 2013). A competitive strategy
provides a starting point for further improvement owing to volatilities in the marketplace
(Ganapavarapu & Prathigadapa, 2015). Additionally, from a dynamic capabilities outlook,
competitive advantage is attained through continuous development and reconfiguration of
valuable resources (Adeniran & Johnston, 2012). Similarly, resources that are important,
unique and non-substitutable make it probable for businesses to create and maintain
competitive advantages (Horng & Huang, 2012; Liu et al., 2014). Given that, the
environment within which the business is operating and its resources should be considered
when mapping out a robust competitive strategy that will yield positive results.
4.8.2 Perspectives of competitive advantage
Similar to a variety of notions of competitive advantage, researchers examine competitive
advantage from different perspectives. In this subsection, three major research streams of
competitive advantage, which cover both internal and external attributes of a firm, are
discussed. They are the activity-position view, the resource-based view and the relational
view.
4.8.2.1 Activity-position view
According to Sheehan and Foss (2009), the activity-position view of the firm is a
comprehensive strategic framework which analyses firm-level competitive advantage
using activities as the unit of analysis. Yang, Nagar and Joshi (2017) argue that the firm’s
superior performance mostly results from its strategic choice that provides the firm a better
positioning in the industry structure. In particular, Yang, Nagar and Joshi (2017) emphasise
that competitive advantage resides in business activities and activity systems, rather than
firm’s resources. Furthermore, Sheehan and Foss (2009) advocate that it is only by
breaking the firm into activities – such as receiving, manufacturing, storing, transporting,
hiring, training, purchasing, and marketing – that it is possible to identify the potential
sources of competitive advantage. Moreover, Yang, et al. (2017) explicate that the activity-
position view is the classic view of competitive advantage and the researchers who brought
forward this view are known to be the pioneers of the theory of competitive advantage.

79
4.8.2.2 Resource-based view
Kraaijenbrink, Spender and Groen (2010) are of the view that resource-based view (RBV)
aspires to explain the internal sources of a firm’s sustained competitive advantage (SCA).
Tehseen and Ramayah (2015) advocate that the firm’s Resource Based View (RBV) suggests
that a firm can distinguish itself from its competitors and can create sustainable competitive
advantage only if it possess valuable, rare, and inimitable resources. Its central proposition is
that if a firm is to achieve a state of SCA, it must acquire and control valuable, rare,
inimitable, and nonsubstitutable (VRIN) resources and capabilities, plus have the
organisation (O) in place that can absorb and apply them (Barney, 2002). “The resource-
based view argues that a firm’s competitive advantage comes from firm-specific resources
that are valuable, rare, imperfectly imitable, and non-substitutable” (Wu, 2013, p.22).
Furthermore, the RBV suggests that the resources possessed by a firm are the primary
determinants of its performance, and these may contribute to a sustainable competitive
advantage of the firm (Akio, 2005).
4.8.2.3 Relational view
Wu, (2013, p.22) states that “the relational view addresses the importance of strategic
relational resources generated from collaboration between firms, which can be the source of
competitive advantage”. Turkmen (2013) explains that the relational view implies that
relational rents can be generated from the joint efforts of alliance partners that invest in
relation-specific assets, share knowledge, combine complementary resources and use
effective governance mechanisms. These activities forge an idiosyncratic relationship that is
difficult to imitate for competitors, thus giving a competitive advantage (Turkmen, 2013).
Furthermore, Wong, (2011) notes that the relational view of resources-based theory argues
that the resources generating competitive advantage can span firm boundaries and be
embedded in inter-firm relations. Hence, the sources of competitive advantages are not only
from the internal resources owned by a firm itself, but also from the external resources in the
relational networks (Arya & Lin, 2007).
4.8.2.4 Sources of competitive advantage
Focusing from the relational view, a few sources of competitive advantage are discussed.
Hitt, Keats and Demaiie (1998) gave six ways to achieve competitive advantage. They said a
firm can gain competitive advantage either by exercising strategic leadership (it is a leader by
the management personnel of the firms), or by building the dynamic core competences of the
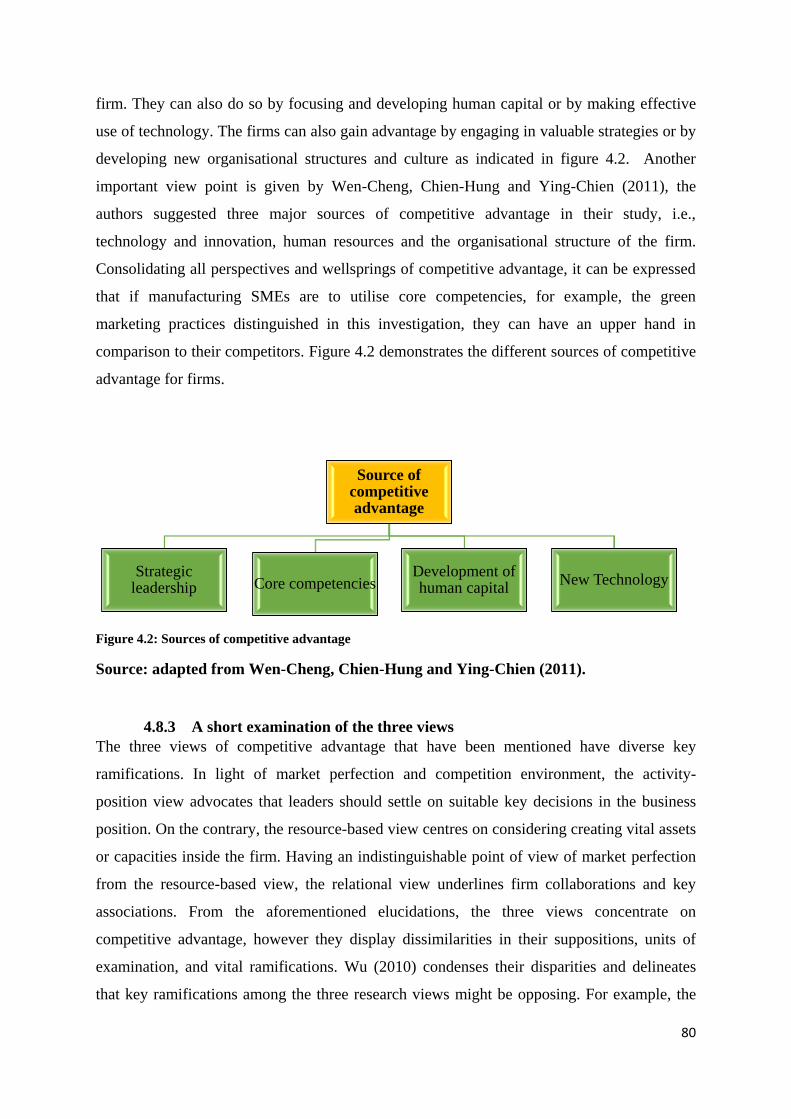
80
firm. They can also do so by focusing and developing human capital or by making effective
use of technology. The firms can also gain advantage by engaging in valuable strategies or by
developing new organisational structures and culture as indicated in figure 4.2. Another
important view point is given by Wen-Cheng, Chien-Hung and Ying-Chien (2011), the
authors suggested three major sources of competitive advantage in their study, i.e.,
technology and innovation, human resources and the organisational structure of the firm.
Consolidating all perspectives and wellsprings of competitive advantage, it can be expressed
that if manufacturing SMEs are to utilise core competencies, for example, the green
marketing practices distinguished in this investigation, they can have an upper hand in
comparison to their competitors. Figure 4.2 demonstrates the different sources of competitive
advantage for firms.
Figure 4.2: Sources of competitive advantage
Source: adapted from Wen-Cheng, Chien-Hung and Ying-Chien (2011).
4.8.3 A short examination of the three views
The three views of competitive advantage that have been mentioned have diverse key
ramifications. In light of market perfection and competition environment, the activity-
position view advocates that leaders should settle on suitable key decisions in the business
position. On the contrary, the resource-based view centres on considering creating vital assets
or capacities inside the firm. Having an indistinguishable point of view of market perfection
from the resource-based view, the relational view underlines firm collaborations and key
associations. From the aforementioned elucidations, the three views concentrate on
competitive advantage, however they display dissimilarities in their suppositions, units of
examination, and vital ramifications. Wu (2010) condenses their disparities and delineates
that key ramifications among the three research views might be opposing. For example, the
Source of competitive advantage
Strategic leadership Core competencies
Development of human capital
New Technology

81
relational view energises imparting profitable information to key accomplices, though the
asset based view has a tendency to secure significant learning inside the firm and sees
implicit learning as a type of key asset. Additionally, the relational view underpins close joint
efforts between the firm and its suppliers to create social points of interest or to generate
relational advantages. However, according to the activity-position view, this behaviour may
impede the focal firm’s bargaining power.
4.9 Business performance
It is imperative to have an understanding of the meaning of business performance. Business
performance is an important component in investigating organisational phenomena (Ho,
Ahmad & Ramayah 2016). Uddin et al. (2015) indicate that business performance is
important to any business firm. Liu, Ge and Wang (2014) state that business performance is
the basic embodiment of enterprise management, effectiveness, and efficiency. Further, to
attract satisfactory business performance is the basis for the enterprise’s survival and the
principal reason for the existence of the firm (Liu et al., 2014). Davood and Morteza (2012)
view business performance as the ability of a firm to generate acceptable results and actions.
Shehu and Mahmood (2014) define business performance in terms of the market growth,
increase of market share and the industry’s relative growth. Mark and Nwaiwu (2015) explain
that business performance is the effort expended by a business firm in achieving its objectives
of customer satisfaction, employee satisfaction, societal satisfaction, and ultimately,
profitability. In addition, business performance is a measure of how a manager efficiently and
effectively utilises the resources of the firm to accomplish its goals as well as satisfying all
the stakeholders (Jones & George, 2009). Furthermore, O’Regan, Sims and Gallear (2008)
point out that business performance can also be analysed by a business’ ability to produce
results in relation to set targets. Wongrassamee, Gardiner and Simmons (2003, p. 17) show
that “business performance refers to how well the business satisfies the needs of employees,
customers and other stakeholders, as well as its ability to achieve its planned business goals”.
Gibson and Cassar (2005, p. 208) put forward a comparable position by expressing that
"business performance is performance about how much the set targets are accomplished".
Inferring from the above descriptions, business performance incorporates the sufficiency and
capability of a business in achieving the set targets. By mulling over this, business
associations need to screen their execution persistently. The need for measuring business
performance is discussed in the following section.

82
4.9.1 Why business performance is measured
Performance measurement plays a vital role in translating an organisation’s strategy into
desired behaviours and results (Bourne, Neely, Mills & Platts 2003; Silvestro, 2014; Vij
& Bedi, 2016). As indicated by Sandada (2012, p. 132) “performance measurement is
basically a relative procedure whereby diverse parts of performance are looked at”. This
comparison, as indicated by Sandada (2012), offers three advantages. In the first place, it
empowers an association to look at the execution of one day and age with another. Also, the
business can think about the execution of one business, division or industry with another, and
finally, it deliberately helps the business to analyse every single elective game-plan and their
normal advantages, and after that, pick the best one.
Furthermore, Ogiogio (2005) explicates that performance quantification is paramount to
discovering the degree to which targets have been accomplished at various times. In outline,
as per Ogiogio (2005), performance measurement allows establishments to quantify, screen
and assess performance, to characterise and set benchmarks that assistance to actualise
performance change designs, to orchestrate execution following a framework, manage
authoritative development and advancement, and to make accountability for results easy.
Bititci, Turner, and Begemann (2000, p. 696) point out that "the component of dynamic
execution estimation frameworks incorporate, ceaselessly observing the advancements and
transmutes in both the inside and outer situations, going about as a survey framework to
check whether the goals and needs are met and as an inner arrangement framework that
conveys the overhauled targets and needs to demonstrate business performance”.
Robinson, Anumba, Carrillo and Al-Ghassani (2005) see business performance measurement
as critical for the survival and development of business sodalities. The authors express that
performance quantification guarantees ceaseless change as the advance in objective
accomplishment is always performed. The authors maintain that if there are issues, these
performance measurement frameworks give systems to actualising change endeavours. From
the perspectives communicated by Robinson, Anumba, Carrillo and Al-Ghassani (2005)
about the performance measurement frameworks, it seems that they agree that organisations
need them because this will allow them to understand and improve systems. It also
distinguishes the reasons ensures that the correct cuts are made, key designs are executed and
that the arrangement between the business and the needs of the market is accomplished.
Cocca and Alberti (2010) considered the performance measurement practices of SMEs in
Italy. The reason for the examination was to establish a structure that SMEs can utilise to

83
evaluate their performance measurement framework with the goal that they can enhance their
execution. The examination contends that the essential condition for a business sodality to
perform well is having the capacity to quantify its execution viably. The premise placed by
Cocca and Alberti (2010) is that a business can just oversee what it can gauge or a business
gets what it measures. What it infers is that the business can take remedial action on problems
by watching for advance warning of impending concerns. (Cocca & Alberti 2010:186).
Halíř (2012) elucidates that the performance of the company has been increasingly perceived
as a potential for future prosperity and growth, rather than as a simple glance in the past.
Wagner (2005) points out that the main task of quantifying performance is to find answers to
questions how our present and future decisions and actions contribute to the future benefit.
The results in Hass, Burnaby and Bierstaker’s (2005) study show a variety of ways in which
business performance quantification can avail the business. These benefits are that
quantifying business performance allows the business to develop a strategic plan, to assess
the extent to which the goals of the business are achieved, to monitor daily business
operations in order to rectify any deviations from set standards, and to evaluate employee
performance.
A study of the performance in Amalgamated Kingdom (UK) hospitals by Basu, Howell and
Gopinath (2010) presents the results showing that performance quantification can help
hospital administrators evaluate their practices, values, notions so that they can identify
shortfalls and take remedial action. The study further reveals that performance quantification
ascertains opportune allocation and utilisation of resources. Moreover, Tangen (2003, p.347)
further states that “measuring business performance ascertains that the business adopts a
long-term focus and increases efficiency in its resource allocation as well as its operations”.
4.9.2 Measures of Business Performance: An Overview
Business performance (BP) is viewed as both an objective measure and a subjective measure.
“Objective measures of performance are mainly economic, while a subjective measure relates
to non-economic aspects of performance” (Dubihlela 2012, p.98). As indicated by Matsuno
and Mentzer (2000, p. 8), “business performance should be viewed not only as economic
performance (concrete absolute figures representing organisational performance) but also as
non-economic performance” (customer satisfaction, customer retention, social acceptance,
corporate image, and employee satisfaction). Zulkiffli (2014) distinguished the use of
subjective and objective measures according to three aspects: indicators, measurement
standard and scale anchors as shown in Table 4.2.

84
Table 4.2: Differences between Subjective and Objective Measures of Business Performance
Differentiation Aspect Subjective Measures Objective Measures
1. Indicators • Focus on overall performance • Focus on actual financial
indicators
2. Measurement standard • Key informants are asked to rate
performance relative to their
competitors (and/or industry)
• Key informants report absolute
financial data (for example, AUD
profit per employee)
3. Scale anchors • Scales range from “very poor” to
“very good”, or “much lower” to
“much higher”, or “worst in
industry” to “best in industry” etc
• Scales are not used
Source: Adapted from Zulkiffli (2014, p. 375).
The following sections focus on the objective and subjective business performance
measures.
4.9.2.1 Objective business performance measures
According to Merchant and Stede (2007), objective performance assessment is based on
numerical calculation of measures, which form the basis for rewarding employees using a
salary system that rewards performance. In addition, Dawes, (1999) points out that an
“objective” measure would be an actual percentage figure for sales growth or profitability.
Objective measure will require businesses to disclose part of their financial information of
which most of these organisations are not willing to provide since it is private and
confidential (Gomera, 2016). This next section discusses some of the major variables that are
used as part of financial or objective measures of business performance.
Revenue: In order for small businesses to grow and prosper, there is generally a search for
revenue and profits (Thibault, 2002). Revenues are referred to as the amount of cash received
or claims established against customers, stemming from the provision of goods or services by
the firm (Thibault, 2002). The income that is generated when an organisation sells a
commodity or provides a service to its consumers is known as revenue (Nelson, 2015;
Gomera, 2016). Others go further to mention that revenue is the total sum of money a firm
receives within a given period made up of sales, discounts and deductions of returned
commodities (Gomera, 2016; Longenecker, Petty, Palich & Loy, 2013; Sinha, 2012).
Businesses strive to generate an excess of revenues over expenses in order to operate at a
surplus. Therefore, if a business is capable of increasing its revenues while maintaining its
current levels of expenses then it will accrue a greater surplus. Thus, as illustrated by the
following equation:

85
Revenue (R) = Price (P) X number of units sold (N)
Net income: Alvi and Ikram (2015) assert that net income or total income are
obtained after deducting all the costs incurred during the performance of the business
which includes amortisation, depreciation, salaries, wages, rents, taxes, interest, and
other expenses. Furthermore, net income is used to measure the earning per share of
the company with the help of the number of the shares issues by the company (Alvi &
Ikram, 2015). The amount of net income is obtained when the organisation has
adjusted the revenue amount for costs or expenses (Rich, Jones, Heitger, Mowen &
Hansen, 2011). The cost of operations, the wear and tear of equipment (depreciation),
taxes and interests are among some of the expenses that are adjusted for (Gibson,
2010). The amount of net income is also found in the income profit and loss statement
of the organisation (Damodaran, 2012). The figure is very important since it is a
measure of how profitable an organisation has been over a given period of time
(Longenecker et al., 2013). The equation bellow illustrates how net income is
calculated:
Net Income (NI) = Revenue (R) – Combined cost of operating an organisation (CCOO)
Where CCOO = {cost of operation (CO) + depreciation (D) + taxes (T) +interests (I)}
Cash flow: According to Ajupov, Kurilova and Kovalenko (2015, p. 711) cash flow
can be treated as a "distribution in time sequence of income (inflow) and expenditures
(outflow) generated during the time horizon of the operations or other object in a
certain scale," and the anti-crisis financial management can be considered a
management strategy aimed at preventing or overcoming the adverse financial and
economic activity of the enterprise through the use of the complex phenomena of
administrative decisions, the development and implementation of a special program,e
that has tactical and strategic plans, allowing to eliminate the time and trouble to
maintain their position in the market. Cash flow is said to be positive when the
amount available at the close of the trading period is higher than that was available at
the opening (Sinha, 2012). The opposite of this would mean that the cash flow is
negative, thus an organisation using more cash than it would have received. The rate
of cash flow is increased by many business activities which include; increasing the
rate of sales, reduction in cost and expenses, price increments of organisation’s good
or services, borrowing (acquiring a loan) and sale of asset (Rich et al., 2011).

86
However, the level of an organisation’s cash flow is not a good measure of
performance and more so having high levels of cash flow do not mean high profits
(Sinha, 2012).
Return on equity: Return on equity (ROE) has been defined and conceptualised
differently by various authors and researchers. Nyirenda, Ngwakwe and Ambe
(2013:243) define return on equity as “the amount of net income returned as a
percentage of shareholders’ equity.” Alvi and Ikram (2015) are of the view that
return of equity measures the profitability of a company with respect to the amount or
number of shares invested in a company by a shareholder. It is further stated that
ROE‘measures a firm’s profitability by revealing how much profit a firm generates
with the money invested by shareholders (Nyirenda, Ngwakwe & Ambe, 2013).
Additionally, Teitelbaum, McDonald, and Brown (1996) defined return on equity as
profits divided by the shareholders’ equity and stated that it is a useful tool for
investors to measure managerial performance in the firms. Vigario (2005, p. 237)
stated that “the return on equity shows how much of the profit generated by the
company belongs to the shareholders”. He further alluded to the fact that shareholders
are always expectant of increases in this measure as it has a direct impact on their
investments. In addition, Alvi and Ikram (2015) point out that return on equity can be
used by the investors internally to evaluate the performance of the management or to
investigate the return on shareholders’ investment. It does not only measure the
profitability on one share but it also measures the efficiency and effectiveness of the
management (Alvi & Ikram, 2015). Return on equity is calculated using the formula:
Return on equity (ROE) = Net Income / owners or shareholders’ equity
Return on assets: According to Mukwarami, Nyirenda and Fakoya (2017, p. 141),
return on assets (ROA) “represents the profitability of the firm with respect to the
total set of resources, or assets, under its control”. Additionally, Ongore and Kusa
(2013) explicate that return on assets expresses the company’s ability to generate
profit as a consequence of the productive use of resources and effective management.
Furthermore, ROA (as an accounting ratio) has been used as a proxy to firm
performance in many studies, such as Waddock and Graves (1997); Hull and
Rothenberg (2008:785); Mishra and Suar (2010); Ahamed, Almsafir and Al-Smadi
(2014); Dewi, Sudarma, Djumahir and Ganis (2014); Ofori, Nyuur and S-Darko
(2014); and Mukwarami, Nyirenda and Fakoya (2017). Another significant aspect
87
about ROA is its link with the firm’s historical performance (Orlitzky, Schmidt &
Rynes. 2003). The justification for using ROA in many studies is that it is not affected
by the differential degree of leverage present in firms and it is positively correlated to
market price (Mukwarami, Nyirenda & Fakoya, 2017). The formula to calculate
return on assets is:
Return on assets (ROA) = Net Income (NI) / Total assets (TA)
Return on invested capital (ROIC): The return on capital or invested capital in a
business attempts to measure the return earned on capital invested in an investment
(Damodaran, 2007). According to Baldwin (2017), return on invested capital (ROIC)
is a financial measure of the profitability of a firm or business unit and if it is greater
than the business's cost of capital, then reinvestment of earnings increases shareholder
value. The ROIC also determines a maximum self-sustaining growth rate for the
business in the absence of outside funding (Baldwin, 2017). Furthermore, Bragg
(2012) also points out that return on invested capital is a calculation used to examine
the efficiency of organisations in distributing the capital it has to profit generating
investments. The ratio shows how well the money in an organisation is being used to
generate more income (Sinha, 2012). There are various ways for calculating the return
on invested capital; one of this way is as follows:
Return on invested capital (ROIC) = [Net Income (NI) – dividends (D)] / Total capital
(TC)
Note: dividends are the total amount of income that is set to be paid to shareholders as
returns on their investment. Hence, dividends are, in most cases, excluded in the
calculation of the ROIC in SMEs.
Debt to equity ratio: Ross, Westerfield and Randolph (2003, p. 80) noted that “debt
to equity ratio is a proxy for estimating the level of leverage of a company”.
According to Sari and Hutagaol (2009), a company with a high debt to equity ratio
may provide higher returns to its shareholders, in line with the risk that is faced by the
company compared to other companies with lower debt to equity ratio. According to
Werner and Jones (2004, p. 480) “debt to equity ratio shows a proportional
relationship between debt and equity”. A lower debt to equity ratio means that total
debt is relatively lower compared to total equity (Sari & Hutagaol, 2009). Dividing

88
the total liabilities by the total equity would give the debt to equity ratio. All the
components of the debt to equity ratio are found in the balance sheet, hence the ratio
is considered to be the balance sheet ratio (Ledgerwood, 2014). The formula shows
the calculation:
Debt to equity ratio (DER) = Total Liabilities (TL) / Total Equity (TE)
Long–Term Debt to equity ratio
Damodaran (2012) is of the view that the LongTerm Debt to equity ratio (LTDER) is similar
to the debt to equity ratio, the difference only comes in that in the LTDER, the calculations of
debt are centralised on long term debt. Rich et al. (2011) points out that long term debt is
made up of loans and other financial commitments that last for more than one year.
Furthermore, Gibson (2010) points out that the long-term debt for a business establishment is
comprised of an obtained funding or leasing commitments that are expected to be paid off in
a greater than single year’s period.
Additionally, long term debt consists of things such as mortgages on corporate buildings and
/ or land, bank loans, and the biggest item of them all, bonds issued to fixed income investors
from whom the corporation raises money in exchange for the promise to return those funds in
the future, while paying interest in the meantime (Bragg, 2012; Nelson, 2015). The LTDER is
found by dividing the total long-term debt of an organisation by net book value of the
organisation’s equity (Sinha, 2012). Ledgerwood (2014) also points out that when the ratio is
very high that mean that the organisation has high leverage and is thought to be riskier as
well. Financing organisations are hesitant to provide financing to organisations with high
debt (Longenecker et al., 2013). The formula shows the calculation:
Long-Term Debt to Equity Ratio (LTDER) = Long-Term Debt (LTD) / Total Equity
(TE).
4.9.2.2 Subjective business performance measures
The term “subjective” is used to mean that the company’s performance score is derived using
a scale with anchors such as “very poor” to “very good,” or “much lower” to “much higher”
compared to competitors (Dawes, 1999). Additionally, Luotonen and Hasselström (2009)
assert that subjective performance measurements are based on judgment. Instead of relying
on numerical calculations, one evaluates if the results reflect good or bad performance
(Luotonen & Hasselström, 2009). The subjective measures are based on the managers’ and/or

89
owner’s understanding or judgement of organisational performance (Aracioglu, Zalluhoglu,
& Candemir 2013; Sandada; Pooe & Manilall 2014; Gomera, 2016). Appendix D shows the
instrument which was used for this research and the non-financial or subjective measure is
found on section G. The next section discusses some of the major variables that are used as
part of subjective measures of business performance.
Market performance: Kariuki (2011, p. 11) points out that “market performance
refers to economic results, for example, product suitability in relation to consumer
preferences”. According to Jayapal and Omar (2017), market performance can be
defined as the performance of a firm which can be measured through sales
revenue, market share, profitability, competitive advantage, customer satisfaction and
loyalty. In addition, Kasemsap (2015:102) argues that “market performance is the
behavior of a valuable asset in the marketplace”. In addition, Jayapal and Omar
(2017) assert that the major focus of SMEs is to improve their market performance
which depends on the capability and ability of the SMEs’ market orientation. Thus,
firms have come up with various strategies in order to improve their market
performance. For instance, Robinson (2014, p. 342) notes that “a business that
increases its market orientation will increase its performance”.
Supplier performance: Wu, Choi and Rungtusanatham (2010, p. 115) define
supplier performance as “how well a supplier supplies the required products to the
buyer as reflected through operational outcomes such as quality, delivery,
responsiveness, cost and technical support”. Furthermore, Huang, Yen and Liu (2014,
p. 64) posit that “a firm’s effort to adequately integrate its supply chain activities has a
massive impact on their supplier performance”. In addition, supplier performance has
been described as a major predictor of reseller satisfaction (Pooe, Mafini, & Loury-
Okoumba, 2015; Yilmaz, Sezen & Kabadayi 2004). Thus, well-performing suppliers
represent a key factor that businesses should strive to develop and maintain in their
long-term sustainability and profit goals (Pooe, Mafini, & Loury-Okoumba, 2015;
Sanchez-Rodriguez, Hemsworth & Martinez-Lorente 2005:289). Krause, Handfield
and Tyler (2007, p. 528) further suggest that “a supplier performing at optimal level is
crucial in enabling the buying firm to reach its performance outcomes in terms of
serving its customers more efficiently”. A well-performing supplier is likely to remain

90
in the supply chain and grow its relationship with the buying firms – something to
which all SMEs should aspire (Pooe et al., 2015).
Process performance: According to Kasse (2008, p. 353) “process performance is a
measure of the actual process results achieved when a project follows its defined
processes drived from the organisation’s set standard processes”. Castañeda-Méndez
(2012, p. 68) affirms that “process performance is the percent good for a specified
period”. “It tells you how often you meet customer requirements because a process is
supposed to repetitively do the same thing and get the same results” (Castañeda-
Méndez 2012, p. 68). In addition, Brocke and Rosemann (2014) argue that process
performance refers to classical measures such as time, budget and process efficiency.
To achieve these, organisations apply managerial practices that are known from
process management, such as process automation and process optimisation (Brocke &
Rosemann, 2014).
People performance: Toppo and Prusty (2012) take note that associations are run
and directed by people. "It is through people that objectives are set and additionally
goals are acknowledged and the execution of an association is in this manner
subordinate upon the whole of execution of its people (Toppo & Prusty, 2012, p. 1).
Also, Biswajeet (2009) clarifies that the achievement of an association will thus rely
upon its capacity to gauge precisely the execution of its people and utilise it equitably
to improve them as an essential asset. In the present focused condition, associations
need to guarantee performance of their representatives constantly (Prasad 2005). The
performance of an individual can be characterised as the record of results created as
determined employment capacities or exercises amid a predefined era (Bernardin
2007). The term performance alludes to an arrangement of result created during a
specific time and does not allude to the qualities, individual attributes, or abilities of
the employee. The assessment of the employee’s performance reveals the
commitment of a person to the association's goals. "People do not learn unless they
are given criticism on the consequences of their activities altogether for remedial
moves to make put" (Toppo & Prusty, 2012, p. 1).
Customer-relationship performance: According to Chang, Fang and Cho (2013),
the measurement of customer-relationship performance stresses the evaluation of the
relationship between firms and customers, which presents customer attitudes toward a
given firm. Ramani and Kumar (2008) identified the measure of customer-

91
relationship performance in terms of three indicators: customer satisfaction, customer
ownership, and positive word of mouth. In their study entitled “The impact of
customer relationship marketing on the firm performance: a Spanish case”
Camarero, Gutiérrez and San (2005) point out that the process of developing
customer-firm relationships starts when the firm invests in activities directed
towards attracting customers and positioning on the market. However, a greater
effort is needed in order to turn these customers into loyal ones. Hence, both
attraction and loyalty programmes are necessary in the process of creating
customers-firm relationships that are valuable both to customers and the firm.
(Camarero, Gutiérrez & San, 2005). Ocloo and Tsetse (2013) also advocated that a
retained customer will show resistance to the lure of competitors.
4.9.3 The use of subjective business performance measures in the present
study
For the purpose of this study, subjective measures of business performance were used in
measuring SMEs’ business performance, owing to the fact that most SMEs owners are not
willing to disclose their financial information (Brownhilder, 2016). In addition to that,
another issue in researching small firms is the difficulty in interpreting some objective
performance data (Zulkiffli & Perera, 2011).
For example, performance may be considered as “poor” if the data shows losses or low profit.
Such misinterpretation can occur if, for example, firms have many commitments to research
and development (R&D), including product and market development for future growth
(Zulkiffli & Perera, 2011). These misinterpretations may be due to variations in profitability
data and may lead to the comparison of objective measures among small firms in different
industries (Zulkiffli & Perera, 2011). To avoid these issues, the researcher utilised subjective
measures and focused on firms within the same sector (manufacturing). The reason to utilise
subjective measures was also since “non-financial elements, presents a clearer and wider
perception and dimension of performance” (Ismail, Rose, Abdullah & Uli, 2010:157).
4.10 Chapter summary
This chapter started with an introduction; it provided an historical overview of green
marketing, defining green makerting and unfolding green marketing practices. This was

92
followed by a discussion of the empirical literature underlying the theoretical constructs of
the study, such as green packaging, green advertising, green product innovation, green
process innovation, competitive advantage and business performance. In the next chapter, the
conceptual model and hypotheses development is presented.
93
5 CHAPTER 5: CONCEPTUAL MODEL AND HYPOTHESIS
DEVELOPMENT
5.1 Introduction
Before this chapter proceeds to a discussion of the conceptual framework, a brief
recapitulation of the previous chapter helps to identify the theoratical issues covered so far.
The empirical literature presented in chapter four, was centred on a discussion of the
variables under investigation, such as green packaging, green advertising, green product
innovation, green process innovation, competitive advantage and business performance. The
fifth chapter of this thesis focuses on the study’s empirical objectives, which are the
relationships between the variables within the conceptual research model.
In other words, this chapter synthesises all the constructs reviewed so far into a broad
conceptual model and develops hypotheses to be tested later during the data analysis. Each
hypothesis within the conceptual model is reflected in the following paragraphs, in the same
order as the hypotheses. The goal of this chapter is to study the proposed relationships in the
conceptual model in depth. It asks the following questions: Why is the relationship important
for this study? What information has other research found on the relationship, and in what
context (i.e. what previous work is done on the relationship between the variables)? And
finally, what does the proposed relationship imply for this study?
5.2 Conceptual model
Burns and Grove (2010) note that a conceptual model broadly explains phenomena of
interest, expresses assumptions and reflects a philosophical stance. Nevertheless, a
conceptual model describes the relationship between variables investigated in the study
(Gunzler & Morris, 2015; Sekaran & Bougie 2011). In addition, Sumaedi, Bakti, Astrini,
Rakhmawati, Widianti and Yarmen (2014) concur that the conceptual model is a model that
describes the cause-effect relationship (causal orientation) between variables to explain a
problem. Sekaran and Bougie (2016) add that a schematic diagram of the conceptual
model helps the reader to visualise the theorized relationships between the variables in the
model and thus to obtain a quick idea about how one thinks that the management problem
cart be solved.

94
In this study, the conceptual model suggests that green packaging, green advertising, green
product innovation and green process innovation are the independent or predictor variables.
According to Flannelly, Flannelly and Jankowski (2014), the term predictor refers to a
variable that can predict another variable i.e., the magnitude of the predictor (independent
variable) can predict the magnitude of another variable (dependent variable). Kleinbaum,
Kupper, Nizam and Rosenberg, (2014) agree that an independent or predictor variable refers
to a variable that determines the values of dependent variables. In addition, the conceptual
model reveals that competitive advantage is the mediating variable.
Flannelly, Flannelly, and Jankowski (2014) used the term mediating variable to refer to a
variable or set of variables in a chain of causation in which the mediating variable is the
causal link between the independent and dependent variable of interest. The aim of mediating
variables is to uncover causal pathways between variables that are often overlooked in the
assessments of non-linear models (Pearl, 2011).
Moreover, the dependent or outcome variable for the current study model is business
performance. A dependent or outcome variable is the variable under investigation and is
depicted by the letter γ. It is always the predicted or the estimated variable (Russell & Purcell
2009; Lind et al., 2008; Sapford & Jupp, 2006). Based on a synthesis of the converging
literature related to the research variables, a conceptual model was proposed to guide the
empirical study. The conceptual model for this study can be illustrated with a diagrammatic
representation of the relationships between all the constructs and their order of influence as
shown in figure 5.1.

95
Figure 5.1: Conceptual model
5.3 Hypothesis development
According to Smith, Densmore and Lener (2016), a hypothesis is an imaginative
preconception of a factual relationship. In similar vein, Murthy and Bhojanna (2009) note
that the hypothesis is a statement that specifies, “How two or more variables are related?” In
addition, Pomerantz, (2016, p. 116) asserts that “hypothesis development involves a
clarification of how depend variables “depend” on the independent variables”. Furthermore,
Matthews and Kostelis (2011) explain that based on past research, a researcher will be able to
develop a research hypothesis as to what will happen. Lammers and Badia (2004) stress the
Green
Packaging
Green
Advertising
Green
Product
Innovation
Green
Process
innovation
Competitive
Advantage
Business
Performance
H1
H2
H3
H4
H5
H6
H7
H8
H9
96
fact that a hypothesis should derive logically from previous findings or the predictions of a
theory. The hypothesised relationships between the research variables are discussed hereafter.
5.3.1 Green packaging and competitive advantage
5.3.1.1 Importance of the hypothesised relationship
The first hypothesis, which tested the relationship between green packaging and competitive
advantage is an important determinant in manufacturing and research relating to SMEs.
Therefore, It is essential to clarify the relationship between green packaging and competitive
advantage. Nevertheless, there is a deficiency with regard to literature about these two
constructs. Closely related studies, for instance, those conducted by Mariadoss, Tansuhaj and
Mouri (2011), as well as Synodinos (2014), revealed that packaging is the starting point for
any organisation attempting to increase its sustainable marketing effort. Therefore, marketers
have begun incorporating recycled packaging materials into the product production process in
a way that reduces production costs without hampering the core product attributes or product
performance (Mariadoss, Tansuhaj & Mouri 2011; Peattie, 2001). Thus, such actions help
appease environmentally concerned consumers and may contribute towards creating a
competitive advantage, which, in turn, makes organisations more willing to change their
packaging inputs and processes (Synodinos, 2014). Packaging is one of the key components
that can provide a competitive advantage in the marketplace for many consumer products
(Barber 2010). In addition, Rundh (2009) confirms that packaging and packaging design can
contribute to competitive advantage for marketing a consumer product. Drawing from the
aforementioned explanations, it can be noted that SMEs that invest in green packaing will
have a competitive advantage. The next section is focused on providing the empirical
evidence that supports the hypothesised statement.
5.3.1.2 Empirical evidence supporting the hypothesised statement
Green packaging is considered as one of the contributing factors of competitive advantage.
According to van den Elzen (2016, p. 5) “using green or sustainable packaging is more and
more becoming a requirement for companies to compete and the companies that do so report
a more positive brand image and reputation, cost savings and better environmental footprints
amongst other benefits”. Recyclable and biodegradable packaging, ecologically safe products
are all part of green marketing which also leads to sustainable competitive advantage (Bhatti
2016). In his study entitled, “Could green-marketing be a sustainable competitive advantage
for retailers within South Africa?” Allen (2008:1) stressed that “for products that require
large amounts of packaging, green-packaging is a source of competitive advantage”. Sambu
(2016:174) also notes that “green-packaging is a source of competitive advantage”. A study

97
conducted by Gajanan (2015) which focused on sustainable marketing practices for gaining
competitive advantage, revealed that ecological packaging assists a business in achieving
competitive advantage. Mwaura, Letting, Ithinji and Orwa (2016) conducted a study which
aimed at determining the effect of green distribution practices on the competitiveness of food
manufacturing firms in Kenya. Their findings revealed thar green packaging as one of the
green distribution practices that positively and significantly influences the competitiveness of
Kenya’s food manufacturing firms. Nikitaeva (2012) conducted a study which focused on
gaining a competitive advantage through green packaging. In the literature review, Nikitaeva
(2012) argued that green packaging should not be considered only as a tool of gaining a
competitive advantage and satisfying the needs of customers, but also as a tool to help to
reduce production expenses. For example, recycling may lead to outstanding savings of raw
materials and energy, while successful packaging reduction can significantly reduce total
costs (Nikitaeva 2012). Additionally, Jarin (2014) also discovered ecological or green
packaging as one of the practices of ecological marketing which creates scope for attaining
competitive advantage over other competitors. Anderson and Rowley (2017) conducted a
study entitled “The mediating role of competitive advantage between green packaging and
the retention of consumers: empirical evidence from SMEs in Port of Spain, Trinidad and
Tobago”. The empirical results of their study reviewed that green packaging has a positive
and a significant impact on competitive advantage. In addition of the empirical results,
Anderson and Rowley (2017) emphasised that small business enterprises that are embracing
sustainability fully and promoting their capability to produce green packages for their
products will gain competitive advantage since green packaging will create even further
differentiation from larger or more traditional competitors. Deducing from the foregoing
discussion, this study therefore, proposes the following hypothesis:
H1: Green packaging has a positive impact on competitive advantage

98
Figure 5.2: Green packaging positively impacts competitive advantage
5.3.2 Green advertising and competitive advantage
5.3.2.1 Importance of the hypothesised relationship
Secondly, the relationship between green advertising and competitive advantage outlines the
significance of investigating in green communication in an attempt to create a competitive
advantage. Therefore, the importance of the connection between green advertising and
competitive advantage is worth investigating. Haytko and Matulich (2008) have suggested
that green advertising started during the 1970s as a result of the recession, caused by high oil
prices and the need to deal with environmental problems. Companies trying to follow this
green trend began to design and develop environmentally friendly products to achieve
competitive advantage based on this differentiating factor and started seeking new ways to
reach the public (Sheehan & Atkinson, 2016; Phau & Ong 2007). Moreover, Yan and
Yazdanifard (2014) assert that green advertising is a useful technique of green marketing that
is used by firms to increase competitive advantage and stand a chance of gaining the
satisfaction. Therefore, deducing from the aforementioned explications, it is imperative to
incorporate the relationship between green advertising and competitive advantage in the
present study.

99
5.3.2.2 Empirical evidence supporting the hypothesised statement
It is essential to clarify the nexus between green advertising and competitive advantage.
Acoording to De Vlieger, Hudders and Verleye (2013), companies are constantly trying to
distinguish from competitors and hope to attract environmentally involved consumers by
promoting green products and integrating environmental claims into their advertising
campaigns. In addition, Sheehan and Atkinson (2016, p. 124) agree that “companies can
show environmental sensitivity by using several strategies; one of these marketing tools can
be environmental or green advertising”. Haytko and Matulich (2008) have suggested that
green advertising started during the 1970s as a result of the recession, caused by high oil
prices and the need to deal with environmental problems. Companies trying to follow this
trend began to design and develop environmentally friendly products to achieve a competitive
advantage based on this differentiating factor and started seeking new ways to reach the
public (Sheehan & Atkinson, 2016; Phau & Ong 2007).
In today’s post-modern era, apart from adopting and adapting the “green strategies”, firms
rationally inculcate sound and credible environmental claims into advertising messages and
communication, in order to differentiate from competitors and to possibly gain a competitive
advantage (Sabir, Safdar, Khurshid & Hafeez, 2014). Synodinos (2013, p. 30) as well as
Synodinos, Bevan-Dye and De Klerk (2013, p. 19) elucidate that “green advertising can be
used as an effective tool in an organization’s overall environmental marketing strategy and
this, ultimately, translates into a competitive advantage”. However, to achieve green
advertising benefits, organisations must win over the trust of both consumers and
stakeholders (Synodinos, 2013).
In addition, Jarin (2014) conducted a study which aimed at investigating ecological
marketing practices for creating competitive advantage. Jarin (2014) revealed that eco-
advertising or green advertising as an ecological marketing practice creates scope for
attaining competitive advantage within an organisation. Furthermore, Leonidou, Leonidou,
Palihawadana and Hultman (2011, p. 25) point out that “green advertising should be
regarded as an indispensable part of the firm's overall environmental marketing strategy
that can help it gain sustainable competitive advantage”.
H2: Green advertising has a positive impact on competitive advantage
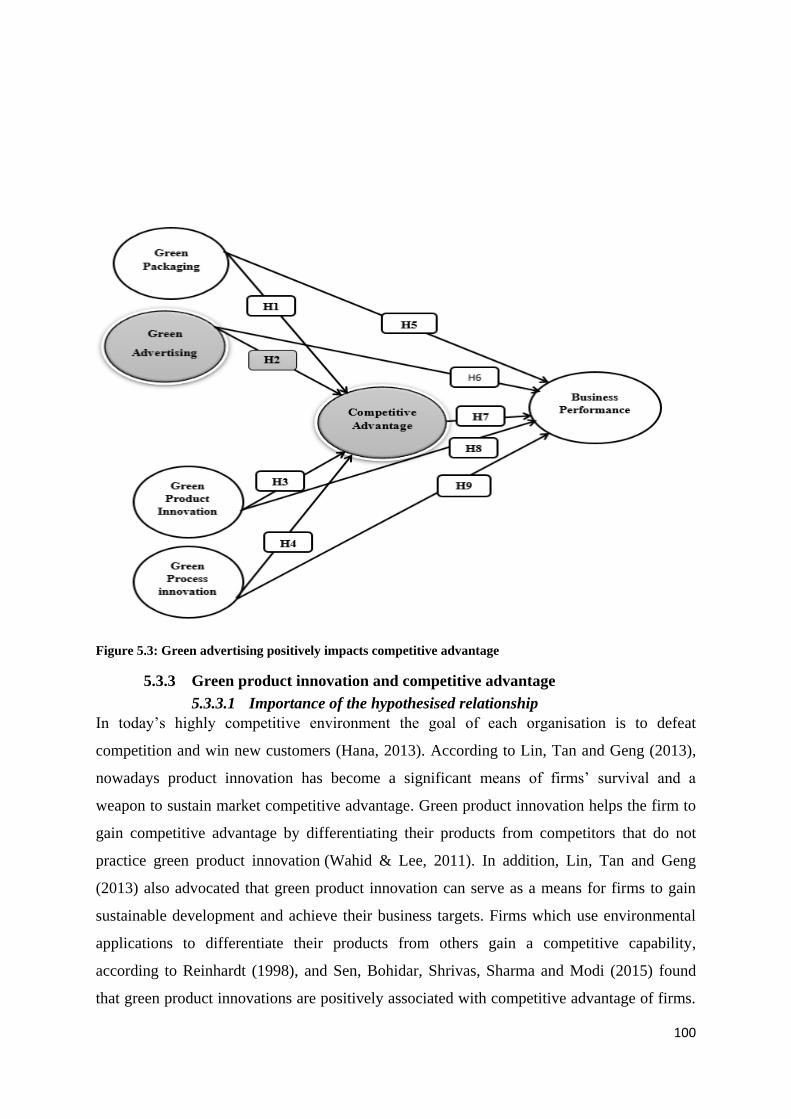
100
Figure 5.3: Green advertising positively impacts competitive advantage
5.3.3 Green product innovation and competitive advantage
5.3.3.1 Importance of the hypothesised relationship
In today’s highly competitive environment the goal of each organisation is to defeat
competition and win new customers (Hana, 2013). According to Lin, Tan and Geng (2013),
nowadays product innovation has become a significant means of firms’ survival and a
weapon to sustain market competitive advantage. Green product innovation helps the firm to
gain competitive advantage by differentiating their products from competitors that do not
practice green product innovation (Wahid & Lee, 2011). In addition, Lin, Tan and Geng
(2013) also advocated that green product innovation can serve as a means for firms to gain
sustainable development and achieve their business targets. Firms which use environmental
applications to differentiate their products from others gain a competitive capability,
according to Reinhardt (1998), and Sen, Bohidar, Shrivas, Sharma and Modi (2015) found
that green product innovations are positively associated with competitive advantage of firms.

101
The more common findings of the relationship between green product innovation and
competitive advantage are discussed first.
5.3.3.2 Empirical evidence supporting the hypothesised statement
It is essential to note the important impact that green product innovation has on competitive
advantage. Chen (2011) investigated the influence of corporate environmental ethics on
competitive advantage with the mediation role of green innovation. The results from Chen’s
(2011) study revealed that green product innovation is positively associated with competitive
advantage and Taiwanese manufacturing companies should increase their green product
innovation to enhance their competitive advantage. Furthermore, Ar (2012) argued that firms
that focus on product innovation as a priority can achieve competitive advantage over
competitors and firms that use environmental applications to differentiate their products from
others to gain a competitive capability. Guziana’s (2011) study suggested environmental
aspects of products as bases for corporate greening and identified three main motivations for
the companies within the environmental technology sector. According to its empirical results,
competitive advantage is one of these motivations.
Moreover, Chen, Lai and Wen (2006) conducted a study which focused on the positive effect
of green intellectual capital on competitive advantages of firms. The results of their study
revealed that green product innovations are positively associated with competitive advantage
of firms. Van den Berg, Labuschagne, and Van den Berg (2013) investigated the effect of
greening the supplier and innovation on environmental performance and competitive
advantage. The research found that green product innovation had a significant relation to
environmental performance and competitive advantage. Thus, green product innovation
creates a competitive advantage for a company and simultaneously addresses environmental
aspects. Sen, Bohidar, Shrivas, Sharma and Modi (2015) elucidates that engaging in green
product innovation actively has positive influence upon corporate competitive capability.
Firms which use environmental applications to differentiate their products from others gain a
competitive capability, according to Reinhardt (1998) and Chen et al. (2006) found that green
product innovations are positively associated with competitive advantage of firms.
Therefore, inferring from the literature and the empirical evidence above, it is hypothesised
that:

102
H3: Green product innovation has a positive impact on competitive advantage
Figure 5.4: Green product innovation positively impacts competitive advantage
5.3.4 Green process innovation and competitive advantage
5.3.4.1 Importance of the hypothesised relationship
It is vital to explicate the importance of the relationship between green process innovation
and competitive advantage. According to Küçükoğlu and Pınar (2015), green process
innovation explains changes in environmental performance and competitive advantage.
Any green difference of a company's basic processes not only reduces the company's
environmental effects, but also moves the company to a better position among its competitors
(Küçükoğlu & Pınar, 2015). In addition, Chen, Lai and Wen (2006) found that the

103
performances of green process innovation were positively correlated to the corporate
competitive advantage. Therefore, the result meant that the investment in green process
innovation was helpful to the businesses (Chen, Lai & Wen 2006). Moreover, firms’ quest to
develop innovative green products and to seek revenues from them motivates the firms to
develop specific competencies (Nidumolu, Nidumolu, Prahalad & Rangaswami, 2009).
Inferring from the aforementioned clarifications, it can be noted that an SME that invests in
green process innovation will ultimately give the firm a competitive edge. Hence the
subsequent section concentrates on the empirical evidence supporting the hypothesised
statement.
5.3.4.2 Empirical evidence supporting the hypothesised statement
Prior studies have found that process innovations contribute to a firm's competitive
advantages (Chiou et al., 2011). Innovative processes which are green confer cost advantage
on a firm over its competitors (Wong 2012). Arenhardt, Battistella, and Grohmann (2016)
investigated the influence of the green innovation in the search for competitive advantage of
enterprises of the electrical and electronic sectors within Brazil. Their results showed that the
level of adoption of innovative green practices among the participating companies is high and
that the relationship between green processes and the achievement of competitive advantage
is significant. Wahid and Lee (2011) found that green process innovation has a positive
impact on corporate competitive advantages. The main reason for this is that with greener
process, waste could be reduced and recycled as well as energy is used in a more efficient
way (Wahid & Lee, 2011). Chen (2008) conducted a study which focused on the driver of
green innovation and green image - green core competence. From the literature review, Chen
(2008) elucidated that green process innovation can enhance the performance of
environmental management and help businesses develop new market opportunities to
increase competitive advantage. Xie, Huo, Qi and Zhu (2016) point out that those
manufacturing industries that adopt green process innovation can gain early mover
advantages, develop a green image, and acquire more currency votes. In their study entitled
“The influence of the green innovation in the search of competitive advantage of enterprises
of the electrical and electronic Brazilian sectors”, Arenhardt, Battistella, and Grohmann
(2016) found that green process innovation positively affects the search for competitive
advantage of companies in the electrical and electronic sectors in Brazil, in a moderate way.
It was also found that green process innovations are more significant to achieve competitive
advantage than the innovations of green products (Arenhardt, Battistella, & Grohmann,
2016). Küçükoğlu and Pınar (2015) also conducted a study that aimed at determining the

104
positive influences of green innovation on company performance. Results of this study state
that green process innovation had a significant effect on a company's environmental
performance and competitive advantage.
In addition, Chen (2008) elucidates that companies can adopt green process innovation to
enhance resource productivity by means of material saving, energy decreasing, waste
recycling, and resource reducing. However, Orsato (2006) and Berrone (2009) argue that
green process innovation can not only prevent costly pollution, but also reduce resource
expense and overall cost. Companies can continue to undertake green process innovation to
raise their manufacturing efficiency and productivity such that they can obtain low cost
advantage (Chang, 2011; Chen 2008). A company can adopt green process innovation to
satisfy its stakeholders (Chang, 2011; Chen 2008). Thus, companies can enhance its
competitive advantage through green process innovation (Chen, Lai & Wen, 2006). Thus,
drawing from the above-mentioned discussion, it is therefore hypothesised that:
H4: Green process innovation has a positive impact on competitive advantage

105
Figure 5.5: Green process innovation positively impacts competitive advantage
5.3.5 Green packaging and business performance
5.3.5.1 Importance of the hypothesised relationship
It is essential to elucidate the significance of the association between green packaging and
business performance. Mwaura, Letting, Ithinji and Orwa (2016) emphasised that green
packaging, such as the use of green packaging materials and bio-degradable packaging
materials leads to an increase in sales, quality and delivery of goods as well as reducing the
transport costs which increase the profit margins. In similar vien, Gajanan (2015) also points
out that eco-packaging aid in the environmental challenges faced by businesses in optimising
the use of energy, resources, cost reduction and waste minimisation. Surmising from the
aforementioned explanations, it can be stated that an SME that invests in green packaging
will eventually improve the business performance. Hence, the following section concentrates
on the empirical evidence supporting the hypothesised statement.
5.3.5.2 Empirical evidence supporting the hypothesised statement
Sambu (2016) conducted a study which aimed to determine the effect of green packaging on
firm performance in manufacturing in Nairobi County, Kenya. The results indicated that
green packaging is a key determinant of business performance in the manufacturing firms of
Kenya (Sambu, 2016). In similar vein, Mogeni and Kiarie (2016) conducted a study which
aimed to explore the effect of green logistics practices on performance of supply chains in
multinational organisations. Responsive packaging, which is similar to green packaging, was
found to be strongly and positively correlated with the performance of supply chains of
multinational organisations in Kenya. Diab, AL-Bourini and Abu-Rumman (2015) conducted
a study which supports the positive relationship between green packaging and business
performance. The study confirmed that there is a positive impact of eco-packaging on
organisational performance.
Zailani, Shaharudin, Govindasamy, Ismail and Mahdzar (2015) examined the nexus between
sustainable packaging and the performance of manufacturing firms in the state of Penang,
Malaysia. The study provides extra evidence to previous literature that sustainable packaging
or green packaging has a positive effect on business performance. Zailani, Shaharudin,
Govindasamy, Ismail and Mahdzar (2015) concluded that green or sustainable packaging can
bring benefits to the firm’s operational, as well as economic, social and environmental
advantages. Green packaging can assist firms in the optimisation of the resources, material

106
and waste to achieve the triple bottom line (economic, social and environmental) of the firm’s
sustainability objectives. Thus, manufacturing firms need to consider giving due diligence to
the eco-efficiency practices as a means to increase the adoption of sustainable packaging in
order to achieve higher performance (Zailani, et. al. 2015). Rao and Bhargav (2016)
conducted a study on green packaging with special reference to Dell Inc. The authors found
out that companies that have adopted green packaging saw a drop in their shipment damage
from 12% to 1% which increases customer satisfaction and shipping savings (Rao & Bhargav
2016). In the same accord, Baack, Harris and Baack (2013, p. 237) point out that “focusing
on sustainable packaging not only helps the environment but also can improve consumer
perceptions and lead to increased sales”. This clearly shows an improvement in business
performance for those firms which incorporate the use of green packaging.
In addition, among the studies which support the positive relationship between green
packaging and business performance is the one conducted by Kumar, Kumar and Sandip
(2017) which focused on “green initiatives for business sustainability and value creation”.
The study provides extra evidence to previous literature that green packaging can help
companies to improve their performance (Kumar, Kumar, & Sandip, 2017; Green, Zelbst,
Meacham & Bhadauria, 2012). The study provides extra evidence to previous literature
that innovative marketing has a positive effect on business performance
H5: Green packaging has a positive impact on business performance

107
Figure 5.6: Green packaging positively impacts business performance
5.3.6 Green advertising and business performance
5.3.6.1 Importance of the hypothesised relationship
It is vital to elucidate the importance of the association between green advertising and
business performance. Joshi and Hanssens (2010) point out that broadly speaking, advertising
influences business performance by virtue of its ability to influence sales and profitability of
the business. Siong (2010) conducted a study to investigate advertising effects on firm
performance in Malaysian consumer products sector and the results of the linear regression
showed that there was a positive relationship between the advertising variable and it is
statistically significant with firm performance. According to De Vlieger, Hudders and
Verleye (2013), claiming environmental soundness in advertising is a logical step in the light
of corporate social performance, or the extent to which a company takes multiple
stakeholders (instead of only the company’s interests) into account. Surmising from the
aforementioned descriptions, it can be pointed out that an SME that invests in green
advertising will eventually improve the business performance. Hence, the following section
concentrates on the empirical evidence supporting the hypothesised statement.
5.3.6.2 Empirical evidence supporting the hypothesised statement
Nyilasy, Gangadharbatla and Paladino (2014) are of the view that green advertising is not the
only factor that influences consumer attitudes when it comes to the environment: firm
performance (or perceptions of performance) itself is reasonably expected to play at least
an equal role. Bhat, Darzi and Parrey (2014) conducted a study that gives a basic conceptual
framework of green marketing as a driver to sustainable development. Bhat, Darzi and Parrey
(2014) suggested that companies need to identify a unique segment of the market (niche
market) which is enriched by green consumerism and then should target this segment, using
the green marketing tools, such as green or eco-advertisements in order to achieve sustainable
business performance. In their study entitled, “Evaluating the green advertising practices of
international firms”, Leonidou, Leonidou, Palihawadana and Hultman (2011, p. 25) revealed
that “green advertising should be regarded as an indispensable part of the firm's overall
environmental marketing strategy that can help the firm to achieve superior performance”.
Therefore, in order for manufacturing SMEs to improve their business performance, it is
imperative for them to resort to green advertising. Ghodeswa and Kumar (2014) explain that
green advertising is aimed at conveying direct usefulness and advantage provided to the
consumers by green products compared to the conventional ones. Nyilasy, Gangadharbatla
and Paladino (2013) suggest that green advertising is conducive to good business results. It

108
exhibits environmental commitment of companies which enables them to compete in the
market (Rolland & Bazzoni, 2009; D’Souza, 2005).
H6: Green advertising has a positive impact on business performance
Figure 5.7: Green advertising positively impacts business performance
5.3.7 Competitive advantage and business performance
5.3.7.1 Importance of the hypothesised relationship
Majeed (2011) is of the view that competitive advantage and business performance are two
special terms with an actually complex association. However, Porter (1985) argues that
competitive advantage and performance constructs are often used interchangeably and a
causal relationship leads the former to the latter (Newbert, 2008; Powell, 2001). Furthermore,
Tuan and Yoshi (2010) contend that the assumption that competitive advantage improves
performance should not imply that the latter will be totally determined by the former because
many other factors also influence performance. This being said, competitive advantage is
obviously a significant element for performance (Tuan & Yoshi 2010). In addition, in almost
all organisations there is a good association between the company’s competitive advantage
and its performance (Majeed, 2011). Competitive advantage is one of the sources to the
corporate sustainability performance of the company (Sihite, 2018). In addition, Neely (2005)
illustrated a significant relationship between competitive advantage and the organisational-
based performance of organisations, when organisational-based performance was measured

109
by the emphasis on efficient organisational internal processes, customer satisfaction,
employee development and job satisfaction. Wijetunge (2016) determined the relationship
between competitive advantage and the business performance in service providing SMEs in
Sri Lanka, and found out that the higher the competitive advantage, the better the business
performance of service providing SMEs. The next section is centred on the empirical
evidence supporting the hypothesised statement.
5.3.7.2 Empirical evidence supporting the hypothesised statement
In almost all organisations, there is a good association between the company’s competitive
advantage and its performance (Majeed 2011). In addition, Mohebi and Farzollahzade (2014)
conducted a study which focused on improving competitive advantage and business
performance of SMEs by creating entrepreneurial social competence. The results of the study
revealed that competitive advantage has a positive effect on the SME’s business performance.
Ismail, Rose, Abdullah and Uli (2010) investigated the relationship between organisational
competitive advantage and performance. The results of their study showed a significant
relationship between competitive advantage and performance. In addition, Ismail, Rose,
Abdullah and Uli (2010) emphasised that competitive advantage is regarded as part of the
foundation for high level performance. Agha, Alrubaiee and Jamhour (2012) investigated the
effect of core competence on competitive advantage and organisational performance. The
findings indicated that competitive advantage has a strong and positive impact on
organisational performance.
Gaya et al. (2013, p. 2051) state that “the resource-based view links superior business
performance to the ownership and control of unique competitive resources that create a
source of sustainable competitive advantage for businesses”. Nonetheless, Neto et al. (2015.
p. 2203) mention that “to obtain enhanced competitive advantage and remain in business, a
set of actions are needed to explore opportunities, adjust and adapt production processes and
products to customers’ needs resulting in a better business performance”. Likewise,
Amankwaa and Anku-Tsede (2015) highlight that businesses treating employees as core
assets and productive resources, and not as an expense, tend to gain a competitive advantage
in their operating industry. Thus, competitive advantage can be realised through the effective
use of human capital which, as a result of higher productivity, might yield higher business
performance. Further, resources that are valuable, uncommon, incomparable and non-
substitutable enable businesses to develop and maintain competitive advantages and increase
business performance (Horng & Huang, 2012). In the same way, a business enjoying

110
sustainable competitive advantage records a consistent superior business performance (Gaya
et al., 2013). Therefore, resources can be tailored and fashioned in ways that will promote
competitiveness and finally result in better business performance. Mirzahassan and Imani
(2013) posit that already developed literature has established the positive effect of
competitive advantage on business performance due to the fact that a business can
outperform its rivals through competitive advantage. Further, Ribeiro et al. (2014) describe
competitive advantage as the case in which a business has a profit rate higher than its sector
or industry average. Over and above that, competitive advantage is the business’ capability to
create more economic value and return than the marginal competitor in a market (Ribeiro et
al., 2014). In this regard, businesses should utilise their resources in a manner that will
generate profitable returns, both for the company and other stakeholders. Deducing from the
aforementioned discussion and the empirical evidence, it could be posited that:
H7: Competitive advantage has a positive impact on business performance
Figure 5.8: Competitive advantage positively impacts business performance

111
5.3.8 Green product innovation and business performance
5.3.8.1 Importance of the hypothesised relationship
The reasoning behind the proposed relationship between green product innovation and firm
performance is based on several factors. Porter and Van der Linde (1995) elucidate that green
product innovation encourages the efficient use of raw materials, resulting in lower costs for
raw materials and may lead firms to find new ways of converting waste into saleable products
that provide additional revenues. Furthermore, it should result in enhanced cash flow and
consequently, enhanced business performance because reputation is in itself a source of
market advantage (Eiadat, Kelly, Roche, & Eyadat, 2008). Businesses can increase resource
productivity through green product innovation to make up the environmental costs (Chen et
al., 2006). Concluding from the aforementioned descriptions, it can be mentioned that an
SME that invests in green product innovation will eventually improve the business
performance. Hence the following section concentrates on the empirical evidence supporting
the hypothesised statement.
5.3.8.2 Empirical evidence supporting the hypothesised statement
In a study conducted by Shapfi (2015) to assess the influence of green product innovation
toward business performance on any selected industry, the results indicated that green
product innovation had influence the business performance. Alhadid and As’ad (2014)
conducted a study which aimed at determining the impact of green innovation on
organisational performance and based on the findings of statistical analysis, green product
innovation had a positive impact on organisational performance. In addition, Lin, Tan and
Geng (2013) conducted a study which examined how market demand affects green product
innovation, and firm performance in the context of the Vietnamese motorcycle industry. The
empirical findings showed that green product innovation is also positively correlated to firm
performance.
Ar (2012) investigated the impact of green product innovation on firm performance among
Turkish manufacturer firms and found that green product innovation significantly positively
affects firm performance. Alsughayir (2017) conducted a study aimed at investigating the
impact of green product innovation on firms’ performance of Saudi Chemical Industrial
Firms and the results showed that green product innovation has a statistically significant
impact on firms’ performance. Meanwhile, Ilker (2012) studied the gap between green
product innovations and firm performance and firms’ ability to enhance their competitive
capability under the moderating effect of managerial environmental concern in this
relationship. Ilker (2012) constructed a model to link the aforementioned constructs, and data

112
was collected through a questionnaire-based survey across 140 Turkish manufacturing firms
from various sectors, which were then analysed using structural equation modelling. That
study showed that green product innovation generally has a positive effect on firm
performance. This result demonstrated the strongest and most significant influence of green
product innovation on firm performance and competitive capability, with a strong effect of
moderates (Ilker 2012). Drawing from the foregoing discussion, this study therefore,
proposes the following hypothesis:
H8: Green product innovation has a positive impact on business performance
Figure 5.9: Green product innovation positively impacts business performance

113
5.3.9 Green process innovation and business performance
5.3.9.1 Importance of the hypothesised relationship
It is essential to elucidate the importance of the association between green process innovation
and business performance. Firms can reduce their costs through green process innovation
(Ma, Hou, & Xin, 2017). Porter and Van der Linde (1995, p. 132) emphasise that
“pioneering green process innovations enables firms to mobilize their strategic and
organizational resources more efficiently”. Horbach and Rennings (2013) show that green
process innovation leads to job creation, particularly for green process innovations that lead
to material and energy saving. Therefore, since green process innovation involves
considerable investment and commitment, it is important to examine the subsequent
implications on business performance (Nishitani et al., 2012). Hence, the following section
concentrates on the empirical evidence supporting the hypothesised statement.
5.3.9.2 Empirical evidence supporting the hypothesised statement
In their study entitled, “the link among innovation drivers, green innovation and business
performance: empirical evidence from a developing economy”, Singh, Chakraborty and
Roy’s (2016) research findings strongly validated that green process innovation has a
significant impact on business performance of manufacturing micro, small and medium
enterprises (MSME). Among the studies which support the positive relationship between
green process innovation and business performance is the one conducted by Quoquab,
Thurasamy and Mohammad (2017). The study provides extra evidence to support previous
literature that green process innovation of businesses has a positive impact on performance
(Quoquab, Thurasamy & Mohammad 2017).
Cheng, Yang and Sheu (2014) conducted a study which focused on the link between eco-
innovation and business performance within Taiwanese industry and found that business
performance (measured by ROI, market share, profitability, and sales) can be enhanced by
eco-process innovation. Thus, the greater the firm’s eco-process innovation, the greater its
business performance (Cheng, Yang & Sheu 2014). In addition, Alhadid and As’ad (2014)
investigated the impact of green innovation on organisational performance and found that
green process innovation has a significant and a positive impact on organisational
performance. de Oliveira Brasil, de Abreu, da Silva Filho and Leocádio (2016) investigated
the relationship between process eco-innovation (green process innovation) and business
performance and found that there is a positive relationship between process eco-innovation
and business performance. Zahari and Ramaya (2017) examined the nexus between green

114
innovation and firm performance in view of the ecological modernisation perspective and
found that the adoption of green process innovation positively affects the firm economic
performance.
H9: Green process Innovation has a positive impact on business performance
Figure 5.10: Green prcess innovation positively impacts business performance
5.3.10 Competitive advantage as a variable mediating the relationship between
green packaging, green advertising, green product innovation, green
process innovation, and business performance
5.3.10.1 Importance of the hypothesised relationship
It is important to clarify the importance of the competitive advantage as a variable mediating
the relationship between green packaging, green advertising, green product innovation, green
process innovation, and business performance. As noted by Jahanshahi et al. (2015), small
businesses, in order to survive the ever-changing and dynamic market place of today, have to
create and sustain. According to Liao et al. (2015, p. 469), “competitive advantage could be
temporarily constrained, reflecting a firm’s short-term market performance from time to
time”. Further, in order to measure competitive advantage effectively, research generally
focused on short-term outcome measures and was usually based upon examination of cross-
sectional data showing a single point in time; this could result in both a firm growth and
market relative strength featured at least in part in the measurement of business performance,

115
including measures of competitive advantage that generally included growth in sales and firm
productivity (Liao et al., 2015). Inferring from the aforemention discriptions, it is clear that
competive advantage is a variable which is of great importance to a business, such as an
SME. Hence, the following section concentrates on the empirical evidence supporting the
hypothesised statement.
5.3.10.2 Empirical evidence supporting the hypothesised statements
It is imperative to provide empirical evidence that shows competitive advantage as a
mediating variable between green packaing, green advertising, green product innovation,
green process innovation and business performance. It is important to note that there are
deficiencies in empirical studies that are centred on competitive advantage as a mediating
variable. However, there are closely related studies such as the one conducted by Luo and
Zhao (2004) which emphasises that competitive advantage can mediate the corporate link to
improve business performance. In a different research, Camison and Villar-Lopez (2010)
place competitive advantage as a mediating role in explaining the international experience of
small and medium sized enterprises (SME) towards performance improvement. In the same
year, Vazquez, et al. (2010) explains market orientation and innovation as a variable
mediated by competitive strategy to improve company performance. Then, Santos-Vijande, et
al. (2012) mention that organisational learning and strategic flexibility can improve business
performance being mediated by competitive advantage. The latest research that explains the
mediation role done by competitive advantage is also researched by Pratistha (2016). He
describes that the competitive advantage variable can play the role as mediation variable from
strategic control, business environment, and orientation strategy to improve business
performance in companies that are users of Indonesian space technology. Based on the above
explanation, it can be concluded that competitive advantage can play the role of mediating
variable towards business performance.
According to Newbert (2008), whose argument used Barney (1991), and Castanias and Helfat
(2001), as its foundation, a firm must identify and implement resource-based strategies to
create economic value. Newbert (2008) also suggested that to produce a product or service
with more benefits (for example, in the form of unique features and/or lower cost than are
associated with the products or services of its competitors), a firm must exploit a combination
of valuable resource and capabilities greater than that of its competitors. It is hypothesised
that no matter what processes of resources and capabilities are, they only indirectly affect

116
performance. In other words, to generate benefits from its resource-capability combination, a
firm must first obtain a competitive advantage deriving from its exploitation (Newbert, 2008).
Anwar (2018) examined the importance of business model innovation in SME performance
and the mediating role of competitive advantage. The results indicate that BMI has a
significant positive impact on competitive advantage and SME performance. Competitive
advantage partially mediated the relationship between BMI and SME performance.
Based on this premise, the mediating impact of competitive advantage still needs further
clarification as there is still limited empirical research in the literature. It is expected that
competitive advantage can be a mechanism through which green packaging, green
advertisings, green product innovation and green process innovation can positively impact
business performance. This is one of the important empirical contributions of this study
because it offers a more nuanced explanation on how these green marketing practices would
impact business performance. Due to limited availability of clear empirically demonstrated
findings, it is considered appropriate to propose the following hypotheses:
H10: Competitive advantage positively mediates the relationship between green
packaging and business performance
H11: Competitive advantage positively mediates the relationship green advertising and
business performance
H12: Competitive advantage positively mediates the relationship green product
innovation and business performance
H13: Competitive advantage positively mediates the relationship green process
innovation and business performance
5.4 Chapter summary
Chapter 5 provided the conceptualised model for the research study that constituted this
thesis. Furthermore, the research hypotheses for the research study were developed. The aim
of this chapter was to present the framework forming the basis of this study, as well as to
formulate and develop the proposed hypotheses, while supporting them with existing
literature. Firstly, the importance of the proposed relationships was highlighted, this was then
followed by the hypothesised relationships which were developed and further substantiated
by providing literature that highlighted the existence. Moreover, the research model was
depicted and the hypothesised relationships indicated. The following chapter elaborates on

117
the research design and methodology, and on the study’s data analysis method. In the section
that follows a diagrammatic representation of the present chapter is provided.
Figure 5.11: Diagrammatic Illustration of Chapter 4
INTRODUCTION CONCEPTUAL
MODEL HYPOTHESES
DEVELOPMENT CHAPTER SUMMARY

118
6 CHAPTER 6: RESEARCH METHODOLOGY AND DESIGN
6.1 Introduction
The preceding chapter presented the conceptual framework of the research, and identified
theoretical relationships between the constructs that helped to formulate the hypotheses for
the study. The central focus of this chapter is to outline the research’s philosophical
foundation and to discuss the methodology used to collect the data and test the relationships
proposed in the conceptual model. The chapter ends with a description and discussion of the
techniques and procedures used for the purpose of the present study. Research methodology
represents the procedures of research methods followed by the researcher (Krippendorf
2004). Traditionally, research has been seen as the creation of true, objective knowledge,
following a scientific method. In turn, this is presented as data and facts; it is possible to
acquire a reasonably adequate basis for empirically grounded conclusions in a specific
discipline when using the right methodology (Alvesson & Sköldberg 2009). Research
methodologies directly impact the validity and generalisation of a study (McGrath &
Brinberg, 1983), and in turn, play a vital role in the knowledge development of international
business (Yang, Wang & Su, 2006:601).
Comprehending and using a relevant methodology in the present study is essential in order to
identify the proper unit of analysis and employ compatible methods that will provide the
intended results. A research design typically includes:
How data is to be acquired (sampling design)
What instruments are employed (measurement items, source and measurement scale)
How the instruments are utilised (data collection method) and
The intended means for analysing data collected (data analysis procedure and
statistical approach).
6.2 Philosophical foundations and research paradigms
The notion of a philosophy pertains to the value judgment, norms, standards, frames of
reference, perspectives, ideologies, myths, theories and approved procedures that govern the
thinking and actions of individuals (McMillan & Schumacher, 2006). Somekh and Lewin
(2005) explain that the concept of philosophies may describe the thinking patterns of people

119
regarding specific situations. According to Newby (2014, p. 35) “every research development
commences with a selection of a suitable research philosophy for a research activity”. Mora,
Gelman, Steenkamp and Raisinghani (2012) opined that a research philosophy offers an
overarching standard within which researchers operationalise their research study. ‘Research
philosophy’ is an overarching term that relates to the development of knowledge and the
nature of knowledge (Saunders, Saunders, Lewis & Thornhill 2011, p. 107). According to
Myers et al. (2009, p. 36) “a researcher’s philosophical stance encompasses the underlying
assumptions about reality and knowledge, which influence beliefs about what is considered
valid and legitimate or justifiable research”. The research philosophy adopted by the
researcher comprehends important assumptions about the way in which the researcher
frequently views the world and practical deliberations. These philosophical worldviews are
addressed through research paradigms.
According to Stoppani (2011), a paradigm is a singular case that is secluded from its context
only insofar as, by demonstrating its own singularity, it makes understandable a new
ensemble, whose similarity it on its own, constitutes. Conceptually, a research paradigm
refers to a set of philosophical assumptions and beliefs that directs the research (Jonker &
Pennink 2010). A research paradigm is a viewpoint about research held by a community of
researchers that is founded on a set of shared assumptions, concepts, values, and practices
(Saurombe 2014). In addition, a research paradigm is defined by Guba and Lincoln (1998. p.
200) as a “set of beliefs that define the nature of the world, the individual’s place in it and the
possible relationships to that world and its parts”. Collis and Hussey (2013, p. 10) concur that
“a research paradigm is a framework that guides how research should be conducted, based on
people’s philosophies and their assumptions about the world and nature of knowledge”. In
empirical studies, research paradigms are instrumental in guiding the researcher in the
selection of the research design, research methodology and research instruments (Easterly-
Smith et al., 2002; Ponterotto, 2005). The essential beliefs of research paradigms are outlined
in Table 6.1.

120
Table 6.1: Fundamental Beliefs of Research Paradigms
Research Paradigms
Fundamental
Beliefs
Positivism
(Naïve realism)
Post-positivism
(Critical Realism)
Interpretivism
(Constructivism)
Pragmatism
Ontology:
the
researcher’s view of
the nature of reality
or being
External,
objective and
independent of
social actors
Objective. Exists
independently of
human thoughts and
beliefs or knowledge
of their existence
Socially constructed,
subjective, may
change, multiple
External, multiple,
view chosen to
best achieve an
answer to the
research question
Axiology:
the
researcher’s view of
the role of values in
research
Research is
undertaken in a
value-free way,
the researcher is
independent of
the data and
maintains an
objective stance
Research is value
laden; the researcher is
biased by world views,
cultural experiences
and upbringing
Research is value
bound, the researcher
is part of what is
being researched
Values play a
large role in
interpreting the
results, the
researcher
adopting both
objective and
subjective points
of view
Research
Methodology:
Quantitative Quantitative or
qualitative
Qualitative Quantitative and
Qualitative (mixed
or multi-method
design)
Data collection
techniques most
often used
Highly
structured,
large samples,
measurement,
quantitative, but
can use
qualitative
Methods chosen
must fit the subject
matter, quantitative
or qualitative
Small samples,
in-depth
investigations,
qualitative
Mixed or multiple
method designs,
quantitative and
qualitative
Source: (Wahyuni, 2012; Saunders et al., 2009).
As presented in Table 6.1, the research philosophy is commonly divided into four paradigms:
positivism, post-positivism, interpretivism, and pragmatism (Wahyuni, 2012).
6.2.1 Positivism
Positivism has been generally regarded as a dominant paradigm (Sefotho 2015). In addition,
the positivist paradigm is a concept that calls for the use or application of scientific
methodologies to investigate social problems, issues or phenomena (Zou, Sunindijo &

121
Dainty, 2014). Creswell (2013) defines positivism as a scientific method of conducting
research which mainly requires factual scientific elements to determine the causal effect of
specific problems. According to Grochal-Brejdak (2015, p. 52), “knowledge of positivism is
a statistically generalised conclusion referring to the population”, based on the outcomes of
the statistical evaluation of the data. In addition, Steinert (2014) elucidates that in the
positivist paradigm, research questions are usually framed in quantifiable and measurable
terms. In addition, positivist research studies are contingent on the assumption that there are a
priori casual relationships between variables, and that these can be used to explain
phenomena (Swanson & Chermack 2013). Furthermore, unlike the interpretivist philosophy,
which aims to discover theories, the positivist approach strives to confirm theories (Swanson
& Chermack 2013).
6.2.2 Post-positivism
During the 20th century, post-positivism emerged from positivism; it has similar ontological
and epistemological beliefs as positivism; however, it differs in several ways (Scotland
2012). The aim of the post-positivist paradigm is to generate objective knowledge through the
use of a credible research process that enhances the accuracy, validity, reliability and
generalisability of research findings (Schulze & Kamper, 2014). Post-positivism claims that
post-positivistic knowledge is more certain and objective than knowledge which originated
from other paradigms (Scotland 2012). Post-positivism upholds the tenets of phenomenalism
and perceives knowledge as objective and accurate only if it is subjected to objective scrutiny
(Bryman & Bell 2011). The post-positivist is supported by the quantitative research
methodology that is premised on the view that knowledge is constructed through objective
measurement of relationships among variables in a given study (Glesne & Peshkin 1992).
Thus, under the post-positivist paradigm, knowledge is constructed based on quantified
numeric data that are subjected to detailed statistical analysis (McMillan & Schumacher
2012). According to Harrison, Birks, Franklin and Mills (2017), the goal of a post-positivist
researcher is to use science as a way to apprehend the nature of reality while understanding
that all measurement is imperfect. Therefore, emphasis is placed on using multiple methods
with triangulation to circumvent errors and understand what is happening in reality as close
as possible to the "truth" (Lincoln et al., 2011).

122
6.2.3 Interpretivism
According to Miller and Salkind (2002), the interpretivist research philosophy is taken from
the perspective of human behaviour and from the researcher's own standpoint that focuses on
the significance of individuals who are connected to concrete understanding of phenomena.
Williamson, Bursteinm and McKemmish (2002) are of the view that interpretivist researchers
do not test hypotheses though they might create working proposals that are positioned from
the standpoint of the contributors or participants in the study. Cooper and Schindler (2006)
posited that researchers who apply a qualitative research paradigm or interpretivist
philosophy frequently use small sample sizes and succumb to subjective data as part of their
research development. In an interpretivist approach, Grochal-Brejdak (2015) posits that
knowledge is an outcome of subjective understanding of the reality whilst the reality is
complicated and relative. Furthermore, a scientist has no easy access to the reality, thus the
procurement of knowledge of that reality emanates from accurate application of interpretive
research procedures (Grochal-Brejdak, 2015). Data is collected through the utilisation of
qualitative, non-structured methods and not to foretell, but rather to explain (Grochal-
Brejdak, 2015). Aditionally, Malsch and Salterio (2016, p. 3) indicate that the “interpretivist
researcher believes that social reality is constantly emergent and subjectively created”. On the
other hand, Hepworth, Grunewald, and Walton (2014) suggest that interpretivist explanations
normally follow a continuum in terms of access to and belief in an objective, knowable
reality and entail epistemologies such as critical realism, cognitive constructionism and social
constructionism. Creswell (2009) clarifies that interpretive methodology is directed at
understanding phenomena from an individual’s perspective, investigating interaction among
individuals as well as the historical and cultural contexts which people inhabit. Examples of
methodology include: case studies (in-depth study of events or processes over a prolonged
period), phenomenology (the study of direct experience without allowing the interference of
existing preconceptions), hermeneutics (deriving hidden meaning from language), and
ethnography (the study of cultural groups over a prolonged period) (Scotland, 2012).
6.2.4 Pragmatism
According to Feilzer (2010), pragmatism as a research paradigm emerges as accepting both
singular and multiple realities in the world, setting itself towards solving practical problems
in the real world. Wahyni (2012, p. 70) is of the view that “the pragmatic paradigm is
grounded on the notion that the nature of reality is multi-faceted and externally generated and
that the best research approach is the one that answers the research questions of the study”.
Pragmatism is outcome-oriented and interested in determining the meaning of things

123
(Johnson & Onwuegbuzie, 2006) or focusing on the product of the research (Biesta, 2010).
The pragmatic paradigm views knowledge as socially constructed, based on the lived realities
of research objects (Schulze & Kamper 2014). The logic behind this paradigm is that it
employs both the inductive and deductive approaches to find explanations for a phenomenon
under study (Creswell 2009). Shannon-Baker (2016, p.322) explains that “pragmatism is
based on the belief that theories can be both contextual and generalisable by analysing them
for ‘‘transferability’’ to another situation”. Therefore, the pragmatic researcher is similarly
able to maintain both subjectivity in their own reflections on research and objectivity in data
collection and analysis (Shannon-Baker, 2016). Ormrod (2006, p. 892) identified that “the
core idea of pragmatism is that beliefs are guides to actions emphasising the practical,
common-sense, scientific approach embedded in pragmatism”. Moreover, Sefotho (2015, p.
28) succinctly explains that “central to pragmatism is the practical nature of being, reality or
phenomenon and through pragmatism; researchers become aware and are receptive of the
ideas of others”.
6.2.4.1 Justification for this Study: Positivism
The present study follows a positivist paradigm, as it seeks to find a relationship between
constructs stated for this study and also makes use of objective measurement instruments for
the data collection and analysis procedures. The fundamental idea of positivism is to classify
problems, state a hypothesis, verify the hypothesis, and summarise the data in order to
provide generalisable, law-like conclusions (Sunyansanoa, 2013). This study used a
positivist research paradigm because it is the leading methodology used for investigative
studies in social sciences and management (Mukhopadhyay & Gupta, 2014; Reksoatmodjo,
Utomo, Hartono & Djunaedi, 2012; Davoudi, 2012). Moreover, “evidence is understood as
synonymous with facts, and credible evidence is interpreted as quantitative, measurable and
capable of establishing clear cause-and-effect relations through scientific methods” (e.g.
Davoudi, 2012, p. 36). In this light, it was more appropriate and meaningful to use the
positivist paradigm than the other research paradigms (post-positivism, interpretivism, and
pragmatism). Furthermore, the objectives of the research made it appropriate to use this
method. It should also be noted that the current study derives from the positivist philosophy,
which, as stressed by Mouton (2011), places prominence on testing for causality and the
scientific formulation of hypotheses. This is also in line with Scotland (2012) who agrees that
positivist methodology is directed at explaining relationships and positivists attempt to
identify causes which influence outcomes. Therefore, this study is aimed at testing the

124
relationships between the dependent and independent variables, with the aim to determine
causal relationships among the variables. These aspects make positivism applicable.
Table 6.2: Summary of Classification Research Paradigm of the study – Positivism
Positivist component Definition Relative to this Study
Ontology Nature of reality, people
Objectivism
Target population/respondents
Epistemology Natural science model, social
reality
Finding truth
Axiology Fundamental values,
consciousness
Value-free
Research approach Principal orientation to the role
of theory in relation to
research.
Deductive approach and testing
of theory
Research strategy Type of involvement with
respondents
Quantitative research
Methodology Verification of hypotheses Questionnaire survey
Methods Individual techniques for data
collection
A structured interview, face-to-
face
Source: Adapted from Sunyansanoa (2013)
6.3 Research logic
It is important to adopt the right research logic since it influences the research design as well
as the research strategy (Easterby-Smith, Thorpe & Jackson, 2008). After choosing a
suitable research philosophy, it is important that the researcher decides how theory will be
involved in the research project. Dlodlo (2017, p. 122) elucidates that “research logic
pertains to the formal processes, which guide the reasoning behind the choice of methods to
follow when conducting research”. The researcher then either follows a deductive approach
which entails theory testing or an inductive approach where theory is developed; this depends
on the logic of the research (Creswell, 2014). Figure 6.1 depicts the deductive logic.

125
Figure 6.1: Deductive research logic
Source: Adapted from Babbie (2011, p.43)
Deductive research refers to the testing of concepts and patterns known from theory using
new empirical data, while possibly refining, improving or extending it (Collis & Hussey,
2013; Bhattacherjee, 2012). Thus, deductive logic requires the formulation of theory and
specification of hypotheses (Dlodlo, 2017). According to Hall, Griffiths and McKenna
(2013), positivist researchers use deductive reasoning to generate hypotheses that emphasise
rational, objective and logical thinking. The deduction logic emphasises scientific principles,
involving moving from theory to data, to explaining causal relationships between variables
and is highly structured (Saunders et al., 2009). Furthermore, Babbie (2011) points out that
deductive research logic involves deriving expectations and statements for possible empirical
testing. Thereafter, a period of data collection follows, after which the empirical data is used
to either confirm or refute the hypotheses (Dlodlo, 2017). According to Babbie (2011, p. 46)
“research that applies inductive reasoning spans from constructing knowledge by making
specific observations of reality, thereby developing consistent patterns”. The inductive
research logic is depicted in Figure 6.2
Theory
Hyphothesis
Observation
Confirmation

126
Figure 6.2: Inductive research logic
Source: Adapted from Babbie (2011, p. 43)
The induction approach emphasises gaining an understanding of the meanings humans attach
to events, it offers the possibility to examine a link between specific variables without prior
knowledge about the way individuals interpret their social surroundings (Saunders et al.,
2009). Zikmund et al. (2013) attest that inductive reasoning involves the stipulation of
theoretical propositions based on observation of particular facts. Gray (2013) is of the view
that inductive research begins with empirical observations of reality and then builds more
abstract concepts and propositions by way of explaining existing thematic relationships
among the observed objects. In addition, Gray, (2013, p. 17) points out that “although the
inductive logic is germane to exploratory research approaches, which often attempt to
establish new knowledge and develop formal theories, deductive reasoning is analogous to
descriptive studies that are constructed from well-established theory and move towards
hypothesis testing”.
6.3.1 Research logic adopted for this Study
In this study, the deductive reasoning approach is thus used in this study since the purpose is
to use existing theories and investigate a research gap. The study began with a literature
review, the theoretical framework and hypotheses based on the extant research and available
theory. A deductive approach is thus used in this study. The deductive approach is related to
positivism and can be adjusted to the natural sciences (Saunders et al., 2009). The researcher
intends to move from theory to quantitative analysis and needs to explain causal relationships
between variables; deductive reasoning approach is therefore applicable for this study.
Theory
Tentative Hyphothesis
Patern/Theme
Observation

127
6.4 Research strategy
There are five different kinds of research strategies. When considering these different
strategies, the researcher must use the one which fits the purpose of the research. The
research strategy needs to enable the researcher to meet the research objectives as well as
answer the research question; besides the research questions and objectives, the choice of the
research strategy depends on factors like existing knowledge, the amount of time and other
resources available, as well as the researcher’s own philosophical underpinnings (Saunders et
al., 2009). Research strategy provides overall direction of the research including the process
by which the research is conducted (Wedawatta, Ingirige & Amaratunga, 2011). According
to Bryman (2016), research strategy refers to a general orientation to the conduct of social
research. Common research strategies include experiment, survey, case study, action
research, grounded theory, ethnography and archival research (Saunders et al., 2009). The
selection of a particular strategy heavily relies on the objectives of study, research questions
employed, the degree of accessible information, available resources, as well as the
philosophical foundation. Table 6.3 presents features of different research strategy.

128
Table 6.3: Features of the different research strategies
Strategy Characteristics
Survey A popular and common strategy; mainly in deductive approach; suitable for research
questions of whom, what, where, how much, how many; research purpose:
exploratory, descriptive tools; questionnaire, quantitative data or structured interview,
structured observation; time-consuming work and narrow scope of data - limited
questions.
Case study An empirical investigation of a particular contemporary phenomenon with multiple
sources of evidence; boundaries between phenomenon and its context are not clearly
evident; for research questions of: why, what, how; research purpose: exploratory and
explanatory and triangulation of data: qualitative and quantitative.
Grounded theory A typical inductive approach; theory developing and building process. To predict and
explain behaviour; research purpose: exploratory; data collection: without a theoretical
framework; theory is developed from data and data analysis: constant reference to data
to develop and test theory.
Experiment Define a theoretical hypothesis; Selection of samples of individuals from the
population; random allocation of samples to different experimental conditions: the
experimental vs. control group; introduction of intervention to one more of the
variables; measurement on a small number of dependent variables and control of all
other variables.
Action research Concerned with the resolution of organisational issues; with involvement of
practitioners in the research; researcher is part of the organisation and interactive
nature of the process
Ethnography A typical inductive approach: describe and explain the social world; researcher needs
to immerse himself/herself in the social world as completely as possible and research
process needs to be flexible and responsive to changes
Source: Saunders et al. (2007, p. 136-143)
In the framework of a deductive approach, the survey strategy is often used among scholars
and in business as it allows researchers to collect quantitative data (Saunders et al., 2009;
Lamb, Hair, McDaniel, Boshoff & Terblanche, 2008). Survey research strategy is the most
suitable data collection method for consumer opinions and behaviours of a large number of
people (Easterby-Smith et al., 2008). Furthermore, it offers the possibility for data to be
standardised, allowing for easy comparison. This method allows for the collection of
quantitative data that can then be analysed using descriptive and inferential statistics. Survey
strategy allows the generation of findings that are representative of the whole population at a
lower cost than collecting data for the whole population. When conducting a survey, it is
important to ensure that the sample is representative and to conduct a pilot test to make sure

129
the respondents understand the questions as intended. Despite the time spent to analyse the
results, once the data is collected, the researcher becomes independent, which is critical in
order to stay within the anticipated time frame (Saunders et al., 2009). Surveys are mostly
used when using a quantitative research approach with a descriptive research and with a
cross-sectional design. Previous researchers extensively used the survey approach to explore
branding in different contexts (Alnawas & Altarifi, 2016; Tsai, 2014). It also has the ability
to measure latent constructs, that is, variables that cannot be directly observed or quantified.
Finally, it allows for investigation of problems in realistic settings and allows access to a
wide range of participants, thus increasing the likelihood of generalising the results.
6.4.1 Research strategy adopted for this study
In this study, the researcher decided to adopt the survey strategy due to the large population
of the research study, as the survey strategy offers a basis to collect data from a sizable
population using minimal staff and limited financial resources. According to Check and
Schutt (2012, p. 160) survey research is defined as "the collection of information from a
sample of individuals through their responses to questions." The survey research is able to
gain a large number of respondents by interviewing them with the same questions (Neuman,
2006). Another advantage of the survey research for this study is that the collection of the
data is structured, as it uses either structured observation or structured interview techniques
(Ponto, 2015). Due to the fact that data collected using a survey strategy can be used to
suggest possible reasons for particular relationships between variables and to produce models
of these relationships, the survey method was the most suitable for this study, as the study
relies on hypotheses testing. The next sections describe the design of the research, which was
used to ensure that the study made use of sound procedures and methods of enquiry.
6.5 Research design
Sekaran and Bougie (2013, p. 95) define a research design “as the blueprint for the collection,
measurement and analysis of data, based on the research question of the study”. A research
design can be defined as “a blue print, strategy, plan and structure of how the researcher
intends to conduct his study” (Mounton 2011, p. 55). In addition, research design refers “to
the overall strategy that one chooses to integrate the different components of the study in a
coherent and logical way, thereby, ensuring one will effectively address the research
problem; it constitutes the blueprint for the collection, measurement and analysis of data”
(Ernest, Matthew & Samuel, 2015, p. 22). On the contrary, Malhotra (2010. p. 102) points
out that “a research design is a master plan for directing a research study and may be

130
categorised as being exploratory or conclusive, which is sub-divided further into descriptive
or causal research”. Therefore, it can be pointed out that a research design is an initial plan
for conducting a research as well as a structure that can assist the researcher to obtain the
intended results.
6.5.1 Types of research designs
A study’s research design offers the structure for undertaking a research project. Malhotra
(2010, p. 103) succinctly explicated that “there are three major research designs, namely
exploratory research, which primarily involves qualitative data, and causal research and
descriptive research, both of which primarily involve quantitative data”. These designs are
illustrated in Figure 6.3.

131
Uses Types Instrument
Figure 6.3: Different research designs
Source: Churchill and Iacobucci (2005, p. 76)
6.5.2 Exploratory research
Welman, Kruger and Mitchell (2005, p. 23) explain that “the primary purpose of exploratory
research designs is to establish whether a phenomenon exists and to identify important
information about that phenomenon”. In addition, Churchill and Iacobucci (2010, p. 61) point
out that “exploratory research designs are useful for breaking down broad and vague research
questions into more precise sub-questions with a view to increase familiarity and
understanding of a problem”. Exploratory research is conducted for a problem that has not
Formulate problem more
precisely.
Develop hypothesis
Establish priorities for
research
Eliminate impractical
ideas
Clarify concepts
Literature search
Experience survey
Analysis of select cases
Focus groups
Interviews
Project tests
Ethnographies
Descriptive
research
Describe segment
characteristics.
Estimate proportion of
people who behave in a
certain way.
Make specific predictions.
Longitudinal studies
True panel
Omnibus panel
Sample survey
Provide evidence
regarding causal
relationships by means of
time order in which
variables occur.
Elimination of other
explanations.
Concomitant variations
Field experiment
Laboratory experiment
Causal
research
Exploratory
research

132
been clearly defined. It often occurs before we know enough to make conceptual distinctions
or posit an explanatory relationship (Ndovela, 2016).
6.5.3 Descriptive research
Descriptive research is meant to make available explanations of occurrences or characteristics
regarding a subject of a population and estimates of the proportions of a population that have
characteristics and discovery of associations among different variables (Babbie, Mouton,
Vorster & Prozesky, 2010). Descriptive research designs are concerned with describing the
characteristics of certain groups as well as making specific predictions about relationships
between variables (Zikmund, Babin, & Griffin., 2013; Churchill & Brown, 2007; Cooper &
Schindler, 2006).
6.5.4 Causal research
The purpose of causal research is to explain the cause and effect of given stimuli or factors on
another variable (Malhotra, 2010). Churchill and Iacobucci (2010), as well as Zikmund et al.
(2013), further point out that causal or explanatory research designs provide evidence of
concomitant variation, which relates to the extent to which two or more variables occur
together or vary together, systematically as predicted by the hypotheses. According to
Ndovela (2016, p. 54) “causal research is conducted in order to identify the extent and nature
of cause-and-effect relationships”. Causal research can be conducted in order to assess
impacts of specific changes on existing norms, various processes (Ndovela, 2016). Moreover,
Bem, Utts and Johnson (2011) elucidate that experiments are the most popular primary data
collection methods in studies with causal research design. For the purpose of this study,
descriptive and causal research designs were utilised to determine the impact of green
marketing practices on competitive advantage and business performance among
manufacturing small and medium enterprises in South Africa.
6.6 Qualitative and quantitative research approaches
Vijayalakshmi and Sivapragasam (2008) are of the view that two approaches can be followed
when conducting research, namely qualitative and quantitative research. Walia (2015)
explains that qualitative research is any kind of research that produces findings not arrived at
by means of statistical procedures or other means of quantification. Moreover, Johnson
(2015) states that qualitative methods are usually applied to generate insight and theory in an
inductive way through different non-statistical approaches. Likewise, Guercini (2014) posits

133
that qualitative research uses an inductive approach and an essentially different role of the
researcher and interpretation of findings. In similar vein, the basis of qualitative research is
inductive reasoning wherein a researcher moves from specific to general to end up with
general conclusions or theories (Jirojwong, Johnson & Welch, 2011; Burns & Grove, 2009).
Furthermore, Hoffman and Bennett (2013) describe it as being based on people’s experiences
and it is not oversimplified and subsumed into a number or statistic. Also, a qualitative study
provides a “thick” description of the phenomenon under study (Borrego, Douglas & Amelink,
2009) by providing a detailed understanding of the relationships between research objects and
their natural settings (Mello & Flint 2009).
On the other hand, Hamer and Collinson (2014) are of the view that the quantitative research
attempts to establish statistically significant relationships, addresses questions by measuring
and describing, is based on objective measurements and observation, is concerned with
correlations and causations. Itanyi, Ewurun and Ukpere (2012) defined quantitative research
as a system of analysing data that are in a form of numbers and the testing of hypotheses a
researcher is determined to investigate. In addition, Polit and Hungler (2013) point out that
this approach is based on the use of numbers and uses surveys and other numeric data and is a
means for testing objective theories by examining the relationships among variables.
Furthermore, Sedmak and Longhurst (2010, p.81) point out that “quantitative research
utilizes statistical methods to analyse data and interpret data from the positivist research
standpoint”. It enables the researcher to understand the data and take a broad view of the
findings from the sample to the entire population (Dlodlo & Dhurup, 2010). Data analysis in
quantitative research is deductive, meaning that it entails testing hypotheses using numerical
data and statistical tests (Ary, Jacobs, Sorensen, & Walker, 2013). Moreover, the major
advantage of quantitative methods emanates from the objectivity of research findings and the
ability to generalise research findings to the entire population (Wiid & Diggines 2011). Table
6.4 shows the differences between these two research approaches.

134
Table 6.4: Difference between qualitative and quantitative research approaches
QUALITATIVE VS QUANTITATIVE
FACTORS/CHARACTERISTICS QUALITATIVE RESEARCH QUANTITATIVE RESEARCH
Types of questions
Probing Limited probing
Sample size
Small Large
Amount of information from each
respondent
Substantial Varies
Requirements for administration Interviewer with special skills Interviewer with fewer skills
Type of analysis
Subjective, interpretive Statistical summation
Hardware Tape recorders, projection
devices, video recorders, pictures,
discussion guides.
Questionnaires, computers,
printouts
Degree of replicability Low High
Researcher training Psychology, sociology, social
psychology, consumer behaviour,
marketing research
Statistics, decision models,
decision support system,
Computer programming,
marketing research
Type of research Exploratory Descriptive or Causal
Source: McDaniel and Gates (2004, p. 67).
The researcher opted for a quantitative research approach because it enhances the accuracy of
results through statistics analysis (Berndt & Petzer 2011) and avoids the elements of
subjectivity associated with the qualitative approach (Du Plessis & Rosseau 2007). In
addition, this research adopted the quantitative research approach since it is “objective, the
researcher is independent of research, value free and unbiased, structured and accurate and
reliable through reliability and validity testing, and also used to recommend a final course of
action” (Park & Park, 2016, p. 3-4). Additionally, Marzooqi (2015), as well as Barnham
(2015), explain that quantitative research is often easier to investigate compared to qualitative
analysis because it uncovers correlations and regressions between two variables and it
provides concrete, factual data. Moreover, the approach permits one to survey the causal
relationships with the variables used in the study. The following section outlines the sampling
strategy followed for collecting the required data.

135
6.7 Sampling design procedure
According to Salkind (2012, p. 95) “the sampling process includes a description of the target
population, the sample frame, the sample method and the sample size”. However, Tustin,
Ligthelm, Martins and van Wyk (2005, p. 337) describes that “even though sampling forms
an integral part of the research design, it is treated as a separate multi-step stage in the
research process”. The selection of the sample is guided by the sample design procedure
(Wegner, 2000), and the sampling process or procedure draws conclusions about a population
based on the observation of a portion of that population (Zikmund & Babin, 2013). Specific
steps, as recommended by Malhotra (2010) were followed in developing the sampling
procedure for the empirical study as indicated in Figure 6.4.
Figure 6.4: The steps in the sampling process
Source: Malhotra (2010, p. 372)
6.7.1 Target population
According to Sekeran and Bougie (2013, p. 245) “sampling begins by defining the target
population precisely”. Researchers often collect information from a portion of the population
and then make inferences about the universe, based on the information that has been provided
by sample elements (Malhotra, 2010). A target population may be perceived as a well-
defined group of elements that have certain characteristics which are of relevance to the study
(Charmaz, 2006). Similarly, Neuman (2006) points out that a target population is defined as
those elements of the population considered for actual inclusion in a particular study or it
may be viewed as a subset of the population, in which a researcher is interested. The target
population for this study comprised small and medium business organisations classified as
SMEs operating within the manufacturing sector. Precisely, the target population was defined
Step 1: Define the target population
Step 2: Identify the sampling frame
Step 3: Select the sampling technique(s)
Step 4: Determine the sample size
Step 5: Execute the sampling process

136
as managers of SMEs and heads of marketing departments within manufacturing SMEs
located in the Gauteng Region of South Africa during 2017, when the data was collected.
6.7.2 The sample frame
Malhotra (2010) elucidates that a sampling frame constitutes a database for obtaining
elements of the target population. However, Bryman et al. (2014, p. 170) contends that
“sampling frame consists of all units in the population from which a sample is chosen”. A
good sample frame is one that accurately represents the views of the target population on the
subject under study (Muposhi, 2015). Some common sources of sample frames are lists of
registered voters, customer lists and maps (Churchill & Iacobucci, 2010). The sampling
frame for the study consisted of manufacturing SMEs operating within the Gauteng region. A
list of 1945 manufacturing small and medium enterprises in Gauteng was obtained from the
Small Enterprise Development Agency (SEDA), a centre of excellence for small enterprise
development in South Africa. Respondents that were included in the survey were provided
with questionnaires which they had to complete. The next section discusses the sampling
technique used in this study.
6.7.3 Sampling method
According to Welman, Kruger and Mitchell (2005) in quantitative research, it is usually
impractical and uneconomical to involve all the members of the population due to large
population size; hence, sampling is effected. Thus, sampling is the process of selecting units
of analysis from the population with the aim to make fair generalisation of the results back to
the population from which they were chosen (McDaniel & Gates 2004). Thus, a sample is a
sub-set that is representative of the population (Welman, Kruger & Mitchell, 2005). The
choice of sampling method is determined by factors such as the nature of the research
problem, research objective, budget constraints, time, and so forth (McDaniel & Gates 2008).
Zeeman (2013, p. 48) “defines the sampling method or the selection thereof as the way the
sample units are selected”. Sekaran and Bougie (2009) elucidate that sampling methods are
divided into two broad categories, which are probability and non-probability sampling.
Probability and non-probability sampling methods are classified into sub-groups, as presented
in Table 6.5.

137
Figure 6.5: Types of probability and non-probability sampling techniques
PROBABILITY SAMPLING
TECHNIQUES DESCRIPTION
Simple random sampling Each element of the population has an equal and known chance
of being selected as part of the sample
Stratified random sampling The population is divided into subgroups of mutual
characteristics and a simple random sample is chosen from
each sub-group
Cluster sampling The population is divided into subgroups of mutual
characteristics and a simple random sample is chosen from
subgroups. Often associated with area sampling
Systematic sampling Random selection of a digit (n) and then selection of sample
element at every n the interval depending on population size
and the required sample size
NON-PROBABILITY SAMPLING
TECHNIQUES DESCRIPTION
Convenience sampling Any process when researcher selects sample elements quick
and easy
Judgement sampling The sample depends on the experience, skill, knowledge and
insight from one choosing the sample to provide accurate
information
Quota sampling The population is divided and assigned appropriate quotas
based on prior knowledge and understanding of characteristics.
Quota categories usually involve age, gender and occupation.
Source: Weideman (2014, p. 84)
Sampling methods can be divided into two broad categories: non-probability and probability
sampling. Saunders, Lewis and Thornhill (2009) define non-probability sampling as the
process where the likelihood of selection of each sampling unit is unknown while probability
sampling is a technique of drawing a sample in which each sampling unit has a well-known,
non-zero probability of being incorporated in the sample. According to Babbie (2012), a non-
probability sampling technique refers to a collection of sampling approaches which have
distinguishing characteristics that subjective judgement can play a role in selecting the
sample. Non-probability sampling technique is described as elements that are within the
population and do not have a guaranteed chance or probability of being included or selected
138
for the research (Engel & Schutt 2010). Non-probability sampling relies on the discretion of
the researcher and furthermore, the degree of sampling error cannot be determined (Tustin,
Ligthelm, Martins, & Van Wyk 2010).
On the other hand, “in probability sampling, each constituent of the population has an equal
and independent chance of being selected for the sample, and is not influenced by any
personal preferences or considerations” (Mohabier, 2016, p. 45). According to Wilson (2010,
p. 194), “probability sampling is a sampling technique in which every item in the population
has an equal and known chance of being selected and included in the sample”. Statistically,
probability sampling allows the researcher to exhibit the sample’s representativeness, an
explicit statement as to how much variation is introduced, and identification of possible bias
(Rea & Parker, 2014). In addition, Kumar, Aaker and Day (2002, p. 306) point out that
“probability sampling allows the researcher to statistically demonstrate the representativeness
of a sample, an explicit statement as to how much variation is introduced, and identification
of possible biases”. Thus, based on this reason, probability sampling is considered
appropriate for this survey-based study. This study, however, only employed the simple
random probability sampling technique. Alvi (2016) points out that in this type of sampling
each and every element of the population has an equal chance of being selected in the sample.
In addition, simple random sampling lists all members of the population and subjects are
selected from that list in a random manner (Cohen, Manion, & Morrison, 2007). A simple
random sample of size n is the most well-known and widely applied probability sampling
method in which every set of n elements has the same probability of being selected as the
sample (Lohr, 2010). This sampling technique provides the following benefits: there is no
possibility of sampling bias and the sample is a good representative of the population (Alvi,
2016).
6.7.4 Sample size
Kumar (2014) and Gupta (2011, p. 116) posit that “the number of subjects in a study is called
the sample size, and refers to the elements to be included in a research study”. Sample size
determination is a sophisticated matter because it is highly dependent on many factors such
as, inter alia, the type of sample, the homogeneity of the population, the time, the money and
the personnel available for the study (Surujlal, 2004). Generally, larger samples result in
more precise and robust statistical findings, while smaller samples result in less precise and
unreliable findings (Sikhwari, 2015). The determination of the final sample size involves

139
judgment, especially where probability sampling is employed, and calculation where random
sampling is used by the researcher findings (Sikhwari, 2015). Therefore, since the simple
random sampling technique was used in this study, the sample size was then calculated using
the Raosoft sample size calculator. The estimated population of 1945 was used, with the
margin error of 5%, confidence interval of 95% and response distribution of 50 %, whereby a
sample size was 321 manufacturing SMEs was determined.
This Raosoft calculation was based on this formula:
x = Z(c/100)
2r(100-r)
n = N x
/((N-1)E2
+ x)
E = Sqrt[(N - n)x
/n(N-1)]
Source: Zulwayo (2013, p. 21)
Where N was the population size, r was the fraction of respondents, Z(c/l00) the critical value
for the confidence level c, response distribution of 50% which was the conservative
assumption in the general population to obtain larger sample size. According to Sekaran and
Bougie (2009), researchers universally agree that larger samples provide much more stable
parameter estimates. Nevertheless, there is no agreement as to what constitutes an adequately
large sample size. According to Choto, Tengeh and Iwu (2014), a sample size larger than 30
and less than 500 is appropriate for most research studies. Hair et al. (1995) suggested that
sample sizes should be 100 or greater. However, in their guide to sample sizes, Comrey and
Lee (2013) categorised 100 as poor, 200 as fair, 300 as good, 500 as very good, and 1000 or
more as excellent. The final sample size of 321 was used in this study as it is classified as
good sample size by Comrey and Lee (2013). More prominently, the sample size of 321
respondents improved all the goodness of fit indices as advocated for by Hair et al. (2006).
The next section focuses on the data collection procedures.
6.8 Data collection
“Data collection refers to the precise and systematic gathering of opinions and views that
have the potential of addressing the research problem” (Murthy & Bhojanna 2010, p. 241).
Data collection comprises utilising field workers or interviewers to gather the data although

140
market research firms can also be used to conduct the fieldwork (Lamb et al., 2013). A
survey method of collecting data was ideal for this study since a quantitative approach is
utilised. McDaniel and Gates (2007, p. 73) explain that “survey methods are used when the
researcher wants to acquire information about the participants, including their opinions,
attitudes and behavior”. Likewise, Blumberg et al. (2008, p. 278) brings up that the survey
method is the most favoured technique for essential information gathering because of this
technique being easy to oversee, analyse, code and interpret. The survey method is intended
to extract responses from a large pre-selected group of respondents (Baines & Page 2011, p.
134) and can be administered through different methods such as personal interviews, mail
surveys, telephone surveys and online interviews (Malhotra & Birks 2007). For information
accumulation, the investigation utilised a structured questionnaire comprising a list of
questions to which respondents replied. The utilisation of the questionnaire during the survey
aimed at producing essential data valuable for enhancing response rate during the survey. The
questionnaire and its components are discussed in the sections that follow.
6.8.1 Questionnaire design
Webb (2000, p. 197) explicated that “the initial consideration when designing the
questionnaire are the type of information required, the nature of respondents who are to be
surveyed, the type of method by which the survey is to be administered and the questionnaire
must fully answer all the data requirements that has been stipulated in the research
objectives”. Questionnaire design induces the process of translating the broad objectives of
the survey into questions that can obtain the required information (Morisky, Ang & Krousel-
wood, 2008). Furthermore, Miller and Read (1998) clarify that a good questionnaire should
meet research objectives, obtain valid and reliable data from the respondents, facilitate the
interviewing task and subsequent data processing and achieve and maintain the involvement
of respondents (Webb, 2000). A questionnaire was chosen as a measuring instrument as it is
simple to administer and reduces the variability in the results that may be caused by
differences in other types of interviews (Malhotra & Birks 2010). Moreover, as suggested by
Burns and Bush (2006), the questionnaire enabled the researcher to achieve the following
functions:
It helped to translate the research objectives into specific questions
It enabled standardised questions and response categories so that every participant
responded to identical stimuli
141
By its wording, questions, flow and appearance, it fostered co-operation and kept
respondents motivated throughout the interviews
Questionnaires served as a permanent record of the research
The questionnaire helped speed up the process of data analysis
The questionnaire contained the information on which reliability assessments were
made, and they could be used in follow-up validation of respondents’ participation in
the survey.
6.8.2 The questionnaire layout and questions format
According to Wilson and MacLean (2011, p. 264) “a questionnaire layout should be logical,
well organised, user-friendly, consistent, without spelling mistakes and appealing to the target
sample”. Matthews and Ross (2010, p. 212) clarified that “the order in which questions are
presented in a questionnaire must be logical to the participants whereby the initial question
asked should lead to the next line of questions, serving to introduce the next set of questions
on a different subject”. A well-planned questionnaire layout is more likely to increase the
response rate (Bryman & Bell, 2011). Hence, the active participation of participants in a
study, suggests an effective questionnaire (Zikmund et al., 2012).
Therefore, when deciding on the development of a questionnaire, a researcher can choose one
of three options; either to formulate a completely new set of questionnaire scale items or to
adopt an existing scale (Saunders et al., 2009). The third option was selected in this work,
and pertains to adapting and modifying variables that were used in previous studies based on
their sound psychometric properties. According to Saunders et al. (2009), the adaptation of
scale items enables researchers to save time and further make reliability comparisons by
operationalising variables that have been tested in previous research, empirically. Hence, the
subsequent sections entail the study’s phenomena of interest, that is, the variables under
scrutiny. All questions in the questionnaire were answered on a 5-point Likert scale. The
demographic items can be found in Appendix 1A, and the questions including their scales in
Appendix 1B.
6.8.2.1 Green packaging
For the measurement of green packaging, a five-item scale was adapted from Sambu (2016)
and Kong, Harun, Sulong and Lily (2014). The measurement was modified to fit the setting of
the current study. A five-point Likert scale was employed on statements that related to green

142
packaging. It was anchored from 1=strongly disagree, 2= disagree, 3= moderately agree, 4=
agree and 5= strongly agree. The following items were used to measure green packaging.
Table 6.5: Green packaging measurement items (Adapted)
Green packaging-Statements
The packaging of our products is non-biodegradable
The packaging of our products is reusable
We package most of our products in recycle materials
We substitute our unfriendly packaging materials with friendly materials
Our products have no excessive packaging
6.8.2.2 Green advertising
For the measurement of green advertising, a six-item scale was adapted from Ghodeswa and
Kumar (2014). The measurement was modified to fit the setting of the current study. A five-
point Likert scale was employed on statements that related to green advertising. It was
anchored from 1=strongly disagree, 2= disagree, 3= moderately agree, 4= agree and 5=
strongly agree. The following items were used to measure green advertising.
Table 6.6: Green advertising measurement items (Adapted)
Green advertising-Statements
Our messages on sustainability focus on environmental impact of the products
Our messages on sustainability focus on environmental benefits of the products
Our messages on sustainability intend to encourage environmentally responsible
behaviour among consumers
Our messages on sustainability focus on company’s values regarding impact on
environment
Our messages on sustainability focus on company’s mission regarding impact on
environment
We make environmental claims based on life expectancy of products (e.g. raw material
production, manufacturing,)
6.8.2.3 Green product innovation
Green product innovation instrument consisted of seven question items that elicited the
information on green product innovation. The questions were adapted and modified from
Cheng, Yang, and Sheu (2014). A five-point Likert scale was employed on statements that
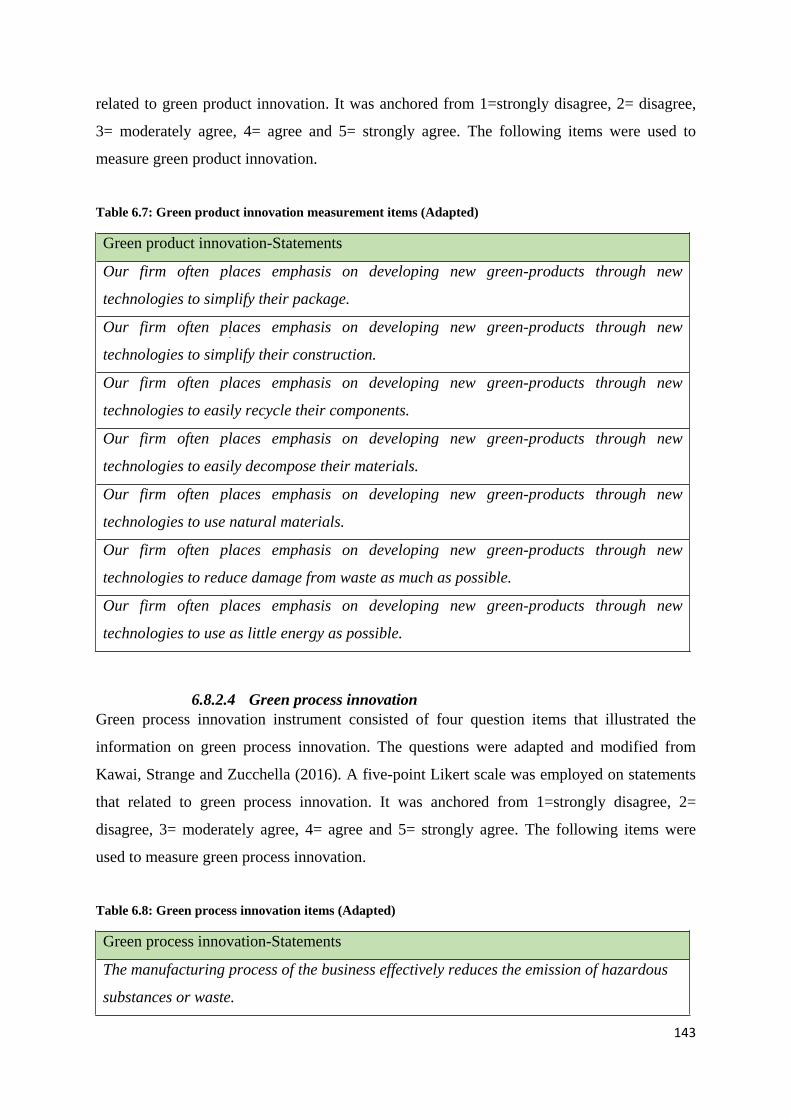
143
related to green product innovation. It was anchored from 1=strongly disagree, 2= disagree,
3= moderately agree, 4= agree and 5= strongly agree. The following items were used to
measure green product innovation.
Table 6.7: Green product innovation measurement items (Adapted)
Green product innovation-Statements
Our firm often places emphasis on developing new green-products through new
technologies to simplify their package.
Our firm often places emphasis on developing new green-products through new
technologies to simplify their construction.
Our firm often places emphasis on developing new green-products through new
technologies to easily recycle their components.
Our firm often places emphasis on developing new green-products through new
technologies to easily decompose their materials.
Our firm often places emphasis on developing new green-products through new
technologies to use natural materials.
Our firm often places emphasis on developing new green-products through new
technologies to reduce damage from waste as much as possible.
Our firm often places emphasis on developing new green-products through new
technologies to use as little energy as possible.
6.8.2.4 Green process innovation
Green process innovation instrument consisted of four question items that illustrated the
information on green process innovation. The questions were adapted and modified from
Kawai, Strange and Zucchella (2016). A five-point Likert scale was employed on statements
that related to green process innovation. It was anchored from 1=strongly disagree, 2=
disagree, 3= moderately agree, 4= agree and 5= strongly agree. The following items were
used to measure green process innovation.
Table 6.8: Green process innovation items (Adapted)
Green process innovation-Statements
The manufacturing process of the business effectively reduces the emission of hazardous
substances or waste.

144
The manufacturing process of the business recycles waste and emission that allow them to
be treated and re-used.
The manufacturing process of the business reduces the consumption of water, electricity,
coal, or oil.
The manufacturing process of the business reduces the use of raw materials.
6.8.2.5 Competitive advantage
For the measurement of competitive advantage, an eleven-item scale was adapted from
Mtshali’s (2017) scale. The measurement was modified to fit the setting of the current study.
A five-point Likert scale was employed on statements that related to competitive advantage.
It was anchored from 1=strongly disagree, 2= disagree, 3= moderately agree, 4= agree and 5=
strongly agree. The following items were used to measure competitive advantage.
Table 6.9: Competitive advantage items (Adapted)
Competitive advantage -Statements
Our products are difficult for competitors to copy
Our response to competitive moves in the market place is good
Our ability to track changes in customer needs and wants is good
We are quick to respond to customer complaints
Our collection of strategic information about customers and competitors for use with
strategic planning is good
Our speed of disseminating information in-house about competitors is good
Our analysis of customer satisfactions with the products is good
We make effort for products changes to overcome customer dissatisfaction with existing
products
Our products have a significant advantage over those of our competitors.
Our product designs are unique
We are quick to respond in meeting changes to customer needs and wants
6.8.2.6 Business Performance
Business Performance was measured using 16 item-scale adapted from Zulkiffli and Perera
(2011). The measurement was modified to fit the setting of the current study. A five-point
Likert scale was employed on statements that related to business performance. It was
anchored from 1=strongly disagree, 2= disagree, 3= moderately agree, 4= agree and 5=

145
strongly agree. Listed below are statements describing the business performance of a firm.
These statements are divided into five sections: Market, Suppliers, Process, People and
Customer Relationships measures. Respondents were expected to indicate their level of
agreement with regard to their firm’s actual current conditions of business performance
relative to their major industry competitors.
Table 6.10: Business performance measurement items (Adapted)
Business performance -Statements
Market Performance
0ur market-share growth is the best in the industry
Our sales turnover is the best in the industry
Supplier Performance
We provide the best supplier product quality in the industry
We provide the best Suppler communication in the industry
We provide the best Supplier delivery performance in the industry
Process Performance
We provide the best work in process (WIP)* inventory in the industry
We have the best order-fulfilment lead time** in the industry
We have the best product-quality development in the industry
People performance
We have the best performance-appraisal results in the industry
We have the best skill level of employees in the industry
We have the best departmental communication in the industry
Customer-Relationship Performance
Our resolution of customer complaints is the best in the industry
Our customer loyalty/retention is the best in the industry
Our quality reputation and award achievement is the best in the industry
Our product returns rate is the best in the industry
Our speed of order handling and processing is the best in the industry
*Work-in-Process (WIP) relates to the products or components that are no longer raw
material, but have yet to become finished products.
**Lead time is the time between placement and receipt of an order.

146
6.9 Pre-testing the questionnaire
According to Hilton (2017), pretesting is a method of checking that questions work as
intended and are understood by those individuals who are likely to respond to them.
Matsheke (2015, p. 56) advocates that “pretesting comprises a series of activities designed to
evaluate a survey instrument’s capacity to collect the desired data, the capabilities of the
selected method of data collection, and the overall adequacy of the field procedures before
data collection starts”. Moreover, Masitenyane (2010, p. 74) asserts that “pre-testing is a
systematic checking of a questionnaire which is central to planning a good survey”. Kumar,
Talib and Ramayah (2013) asserted that the purpose of pre-testing a questionnaire is to ensure
whether a) the wording of the questions is correct, b) the sequence of questions is correct, c)
the respondents have clearly understood all the questions, d) additional questions are needed
or some questions should be eliminated, and, e) the instructions are clear and adequate.
Mafini (2014, p. 155) is of the view that “a chance exists that some of the questions in the
questionnaire may cause problems”. Therefore, “there is a need for pretesting in order to
eliminate these problems” (Jasper, 2010, p. 104). The researcher conducted a pre-test of the
questionnaire to identify and correct deficiencies and to ensure that the questionnaire
communicated the information correctly and clearly to the respondents. Furthermore,
respondents were requested to comment on or indicate any difficulty or any ambiguity that
they encountered in reviewing the questionnaire. During this stage, feedback was obtained
and some items were modified and refined, based on the feedback received before
commencement of the final study.
6.10 Pilot study
Memon, Ting, Ramayah, Chuah and Cheah (2017) explained that a pilot study is a small-
scaled version or trial run—a key step to ensuring a full-fledged study will be carried out
successfully. Arain, Campbell, Cooper and Lancaster (2010) refer to a pilot study as a version
of the main study that is run in miniature to test whether the components of the main study
can all work together. Calitz (2009, p. 256) asserts that “a pilot study is a mini-version of a
full-scale study or a trial run done in preparation of the complete study”. In addition, Arnold,
Burns, Adhikari, Kho, Meade and Cook (2009) note that a concise definition is that a pilot
study is a “small study for helping to design a further confirmatory study”. Moreover, an
exceptionally helpful discourse of exactly what is a pilot study has been given by Arain,
Campbell, Cooper and Lancaster (2010). Such sorts of study may have different purposes, for
example, testing study methodology, the validity of tools, estimation of the recruitment rate,

147
and estimation of parameters such as the variance of the outcome variable to calculate sample
size, etc. (Arain, Campbell, Cooper & Lancaster, 2010). The objective of the pilot study was
to assess the feasibility of conducting the study, the appropriateness of the questionnaire and
the adequacy of the research methodology (Babbie & Mouton 2010; Delport & Roestenburg
2011). Following the example of Synodinos, Bevan-Dye, and De-Klerk (2013), the pilot
study was conducted by administering the questionnaire to 50 respondents from the target
population.
6.11 DATA PREPARATION
According to Cooper and Schindler (2011, p. 490) “the data preparation process is the first
step when analysing data in completed questionnaires”. Malhotra (2010, p. 452) points out
that “the data preparation stage of the research process entails the editing, coding, capturing
and cleaning of the gathered data”. A discussion of these aspects is explained briefly
hereafter.
6.11.1 Data editing
Zikmund and Babin (2013, p. 369) maintain that “editing consists of checking completed
questionnaires for omissions, incomplete or otherwise unusable responses, illegibility and
obvious inconsistencies”. The purpose of the editing process is to increase the accuracy and
precision of the collected data by identifying unclear, incomplete, inconsistent or ambiguous
responses (Malhotra, 2010); that is, to enforce some minimum quality standards on the raw
data (Churchill, Brown, & Suter, 2010). In this study, the minimum quality standards
imposed included discarding questionnaires where more than 10 percent of the responses
were missing, as well as those with ambiguous responses (for example, two or more
responses to questions that required a single response).
6.11.2 Data coding
Coding is the process of grouping and assigning numeric codes to the various responses to a
question (McDaniel & Gates, 2005). According to Churchill and Brown (2007), coding is
regarded as the technical procedure by which raw data are transformed in symbols and it
involves specifying the alternative categories or classes into which the responses are to be
placed and assigning code numbers to the class. Furthermore, Cooper and Schindler (2006)
pointed out that coding encompasses assigning numbers or other symbols to answers so that
the responses can be grouped into a limited number of classifications. Moreover, Zikmund

148
and Babin (2010, p. 353) are of the view that “the coding process facilitates computer or hand
tabulation and if computer analysis is to be used, the data are entered into the computer
(using their codes) and verified”. For this study, a code book was prepared in order to
successfully enter the information from the research questionnaire into the format that SPSS
could understand. In this process, the researcher defined and labelled each of the research
variables such as SMEs demographic profile, green packaging, green advertising, green
product innovation, green process innovation, competitive advantage, business performance
and assigned identification numbers to each of the possible responses. Table 6.11 shows the
example of a code book for this study.
Table 6.11: Example of a code book
Variable
SPSS variable name
Coding instructions
Identification number
ID
Number assigned to each survey
1. Please indicate your gender A1 1= Male
2=Female
3= Prefer not to say
2. Is this a family business? A4 1 = Yes
2 = No
Green packaging
Green advertising
Green product innovation
Green process innovation
Competitive advantage
Business Performance
GP
GA
GPDI
GPRI
CA
BP
1= strongly disagree
2 = disagree
3 = moderately agree
4 = agree
5 = strongly agree.
6.11.3 Data capturing
Malhotra (2010, p. 459) is of the view that “data capturing is a method of transferring coded
information from the questionnaires or coding sheet directly into the computer by
keypunching”. In this study, the researcher, using the Microsoft Excel program, performed
data capturing whereby data was entered directly from the questionnaires with the use of a
personal computer and then fed the results into a Microsoft Excel spread sheet. The captured
data was then imported into SPSS and AMOS for data analysis purposes.
149
6.11.4 Data cleaning
Fourie (2015, p.85) states that “the cleaning process consists of dealing with values that fall
outside of a scale code and data that was left out”. Data cleaning was done by making use of
wild code checks to detect codes that are not defined for a particular variable, including
extreme cases for responses to a variable that is far from ordinary. For example, a six used
instead of a five on the Likert scale, may have been entered on MS Excel.
6.12 Data analysis
Vosloo (2014, p. 355) describe data analysis as “the process of bringing order, structure and
meaning to the mass of collected data”. “It is described as messy, ambiguous and time-
consuming, but also as a creative and fascinating process” (Vosloo, 2014, p. 355). Broadly
speaking - while it does not proceed in linear fashion -it is the activity of making sense of,
interpreting and theorising data that signifies a search for general statements among
categories of data (Schwandt, 2007). Therefore, one could infer that data analysis requires
some sort or form of logic applied to research. In this study, a Microsoft Excel spread sheet
was used to enter all the data and to make inferences of the data obtained, the Statistical
Packages for Social Sciences (SPSS) version 25 and the Analysis of Movement Structures
(AMOS) statistical package version 25 was used to run the statistical analyses. Additionally,
these statistical packages were used for testing and confirming relationships among
hypothesised variables. It is important to mention that the selection of data analysis
techniques in this study was guided by the data analysis techniques used in the past
researches in the area of green marketing and small business management.
6.12.1 Descriptive statistics
According to Wilson (2010, p. 213) “descriptive statistics describe and summarise data, while
inferential statistics are used to make inferences in relation to a wider population”.
Descriptive statistics are techniques that help to state the characteristics or appearance of
sample data (Zikmund, Babin, Carr & Griffin, 2013). In addition, O’Leary (2010, p. 237) also
agrees that “the main goal of using descriptive statistics is to describe and summarise the
characteristics of a sample”. Therefore, this study makes use of descriptive statistics to
analyse the composition and normality of the data. Dubihlela (2012) enumerates such
statistics as measures of location (mean, median and mode) and dispersion of variability
(variance, standard deviation, range and quartile deviation). Some of these measures were
used to gain an overall understanding of the raw data and to enable the data to be presented
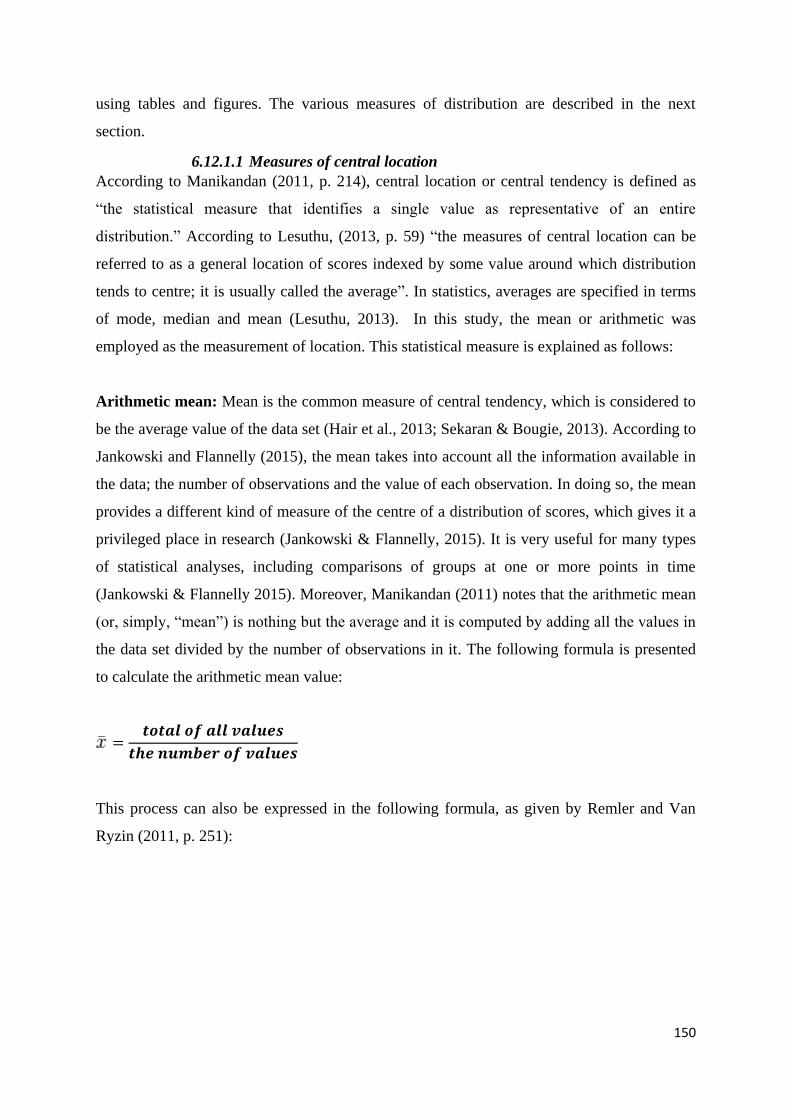
150
using tables and figures. The various measures of distribution are described in the next
section.
6.12.1.1 Measures of central location
According to Manikandan (2011, p. 214), central location or central tendency is defined as
“the statistical measure that identifies a single value as representative of an entire
distribution.” According to Lesuthu, (2013, p. 59) “the measures of central location can be
referred to as a general location of scores indexed by some value around which distribution
tends to centre; it is usually called the average”. In statistics, averages are specified in terms
of mode, median and mean (Lesuthu, 2013). In this study, the mean or arithmetic was
employed as the measurement of location. This statistical measure is explained as follows:
Arithmetic mean: Mean is the common measure of central tendency, which is considered to
be the average value of the data set (Hair et al., 2013; Sekaran & Bougie, 2013). According to
Jankowski and Flannelly (2015), the mean takes into account all the information available in
the data; the number of observations and the value of each observation. In doing so, the mean
provides a different kind of measure of the centre of a distribution of scores, which gives it a
privileged place in research (Jankowski & Flannelly, 2015). It is very useful for many types
of statistical analyses, including comparisons of groups at one or more points in time
(Jankowski & Flannelly 2015). Moreover, Manikandan (2011) notes that the arithmetic mean
(or, simply, “mean”) is nothing but the average and it is computed by adding all the values in
the data set divided by the number of observations in it. The following formula is presented
to calculate the arithmetic mean value:
=𝒕𝒐𝒕𝒂𝒍 𝒐𝒇 𝒂𝒍𝒍 𝒗𝒂𝒍𝒖𝒆𝒔
𝒕𝒉𝒆 𝒏𝒖𝒎𝒃𝒆𝒓 𝒐𝒇 𝒗𝒂𝒍𝒖𝒆𝒔
This process can also be expressed in the following formula, as given by Remler and Van
Ryzin (2011, p. 251):

151
=𝟏
𝒏∑ 𝒙𝐢
𝒏
𝒊=𝟏
Where:
6.12.1.2 Dispersion of variability
Burns and Bush (2010, p. 466) state that “measures of variability or dispersion are used to
determine the extent to which the data are widely distributed or the differences between the
variables in a data set”. In this study, the standard deviation was used as the measure of
dispersion.
Standard deviation: The standard deviation, denoted as SD, is the most widely used
measure. Standard deviation is a measure of variability, or spread, which provides an index of
dispersion in the data set and is the square root of variance (Hair et al., 2013; Sekaran &
Bougie, 2013). Rodrigues, de-Lima and Barbosa (2017) clarify that standard deviation is one
of the most commonly used statistical measures to demonstrate data variability. The standard
deviation is the square root of the calculated variance on a variable (Churchill, Brown, &
Suter 2010). In addition, Zikmund and Babin (2013, p. 343) present a basic definition by
stating that “the standard deviation is the square root of the variance for a distribution”. The
standard deviation tells us the dispersion of individual observations about the mean (Barde &
Barde, 2012). In other words, it characterises typical distance of an observation from
distribution centre or middle value and if observations are more dispersed, then there will be
more variability (Barde & Barde, 2012). Thus, a low SD signifies less variability while high
SD indicates more spread out data (Barde & Barde, 2012). McDaniel and Gates (2007, p.
464) present the following formula to determine the standard deviation:
S = √𝑠2
Where:
6.12.1.3 Frequency distribution
According to McMillan (2000), frequency distribution is the most fundamental approach to
organising a set of data. In similar vein, Manikandan (2011) asserts that frequency
𝑥i = Individual observations
𝑛 = Sample size
= Sample mean
∑ = summation symbol meaning add up
𝒔𝟐 = Variance

152
distribution presents a picture of how the individual observations are distributed in the
measurement scale. Furthermore, a frequency distribution takes a disorganised set of scores
and places them in order from highest to lowest, grouping together all individuals who have
the same score (Gravetter & Wallnau, 2007). In addition, Gravetter and Wallnau (2007) point
out that if the highest score is X=10, for example, the frequency distribution groups together
all the 10s, then all the 9s, then the 8s, and so on. Thus, a frequency distribution allows the
researcher to see “at a glance” the entire set of scores. It shows whether the scores are
generally high or low, whether they are concentrated in one area or spread out across the
entire scale, and generally provides an organised picture of the data (Gravetter & Wallnau,
2007). These were useful in characterising the sample and understanding the data
composition, as presented in Chapter 7.
6.12.1.4 Use of graphs and charts
Shao (2002, p. 566) explains that “charts can take several graphic forms such as line charts,
pie charts, bar charts and histograms, which are utilised to display research findings”. The
researcher employed some graphs and charts, rather than relying solely on frequency
distribution to display the research findings, such as line charts, pie charts, histograms and
bar charts. These charts are best suited when dealing with normal or ordinal variables (Tustin
Ligthelm, Martins & Van Wyk, 2005). According to Bavdekar (2015), graphs help readers
see, understand and remember the data better. While on the other hand, Hair, Bush and
Ortinau (2003, p. 530) point out that “charts are an effective visual aid to enhance the
communication process and add clarity”.
6.13 Reliability
Reliability refers to the extent to which the data collection techniques or analysis procedures
yields consistent findings (Dusick, 2011; Saunders, Lewis & Thornhill, 2009). Reliability of a
measuring instrument is the extent to which the instrument yields consistent results when the
construct being measured has not changed (Leedy & Ormrod 2014). “Reliability indicates the
internal consistency of a measuring instrument” (Babin & Zikmund, 2016, p. 280).
Furthermore, Rubin and Babbie (2011) point out that reliability is a matter of whether a
particular technique, applied repeatedly to the same object, would yield the same result each
time. (Hammond & Wellington, 2013). Moreover, Hammond and Wellington (2013)
elucidate that the main purpose of reliability is to provide consistent results and minimise

153
errors and bias. There are various general forms or classes of reliability estimates and these
are summarised in Table 6.12.
Table 6.12: Forms of reliability and how they are administered
Test-retest
reliability
An approach of assessing reliability in which respondents are administered identical sets
of scale items at two different times under as nearly equivalent conditions as possible
Alternatives
forms
reliability
An approach for assessing reliability that requires two equivalent forms of the scale to be
constructed and then the same respondents are measured at two different times
Internal
consistency
reliability
An approach for assessing the internal consistency of the set of items when several
items are summated in order to form a total score of the scale:
Split-half reliability: a form of internal consistency reliability in which the items
constituting the scale are divided into two halves and the resulting half scores are
correlated.
Cronbach’s alpha: a measure of internal consistency reliability that is the average of all
possible split-half coefficients resulting from different splitting of the scale items.
Inter-rater reliability: measures homogeneity, which involves administering the same
form to the same people by two or more interviewers so as to establish the extent of
consensus on use of the instrument
Source: Garson (2007)
Reliability measures employed in the study were examined by computation of three different
methods, namely Cronbach’s alpha reliability test, the composite reliability (CR) test and the
average value extracted (AVE) tests. These research measures are discussed and described
hereafter:
6.13.1 Cronbach’s alpha reliability test
According to Memon, Ting, Ramayah, Chuah and Cheah (2017), Cronbach alpha () is
calculated to check the internal consistency reliability of the measures. According to Dunn,
Baguley and Brunsden (2014), the coefficient alpha is the most commonly used measure of
reliability, and certainly of internal consistency reliability reported in psychological research.
The Cronbach’s alpha was developed by Lee Cronbach in 1951 to offer a measure of the
internal consistency of a test or scale, and is expressed as a number between 0 and 1 (Tavakol

154
& Dennick, 2011). In this study, Cronbach alpha testing was adopted as the measure of
internal consistency for the measurement scale and was used with a co-efficient value of 0.7
as a cut-off point (Nunnally 1978). An important property of the co-efficient alpha is that its
value tends to increase with an increase in the number of scale items (Bryman & Bell 2011).
A large alpha value indicates a high reliability. Scores close to zero indicate that the
reliability of the instrument is low (Malhotra 2010). The Cronbach alpha values are reported
in Table 7.1 of Chapter 7.
6.13.2 Composite reliability (CR) test
CR coefficient is another measure of internal reliability and is reported in Section 7.5 to 7.6
of Chapter 7. According to Mkhatshwa (2015, p. 33) “CR provides a robust measure of
reliability by taking into account the contribution of each latent factor to each item and each
item’s error”. In addition, Starkweather (2012, p. 4) points out that “CR provides a robust
measure of reliability by taking into account the contribution of each latent factor to each
item and each item’s error”. Interpreted the same as Cronbrah alpha, Malhotra (2010, p. 733)
suggests that “the minimum accepted CR values should be 0.70”. The CR estimates reported
in Table X of Chapter 7 were calculated using the formula, whereby CR is calculated as the
square of the summation of the factor loadings divided by the sum of the square of the
summation of the factor loadings and the summation of error variances (Bewick, Cheek &
Ball 200). The formula is illustrated in the following manner:
CRη = (Σλyi) ² / [(Σλyi) ² + (Σεi)]
Where:
CRη = Composite reliability
(Σλyi) ² = Square the sum of the factor loadings (Σεi) = Sum of error variances.
6.13.3 Average value extracted (AVE) test
Average variance extracted (AVE) is the third reliability test which was reported in Section X
of Chapter 7. Malhotra (2010) defines AVE as the variance in the indicators or observed
variables that are explained by the latent construct. A value of 0.40 or higher indicates a
satisfactory measure (Anderson & Gerbing 1988). It is calculated as the summation of the
squared factor loadings divided by the sum of the summation of the squared factor loadings

155
and summation of error variances (Bewick, Cheek & Ball 2004). The formula below was
applied when examining AVE.
Vη = Σλyi2 / (Σλyi2+Σεi)
AVE = summation of the squared of factor loadings / {(summation of the squared of factor
loadings) + (summation of error variances)}
Validity and reliability are suitable measures for assessing the appropriateness of any
measuring instrument (Malhotra 2010). Therefore, for this study to be beneficial, it was also
necessary to prove the validity of the measuring instrument.
6.14 Validity
Cooper and Schindler (2014) define validity as the central measure of quality of the
measuring instruments in research, which determines the degree to which a questionnaire was
able to measure what it was intended to measure. In addition, Kapondoro, Iwu and Twum-
Darko (2015, p. 7) argue that validity has to do with “how well a measurement instrument
measures what it is intended to measure”. Uysal and Madenoğlu (2015, p. 39) define validity
as “the quality of research results that leads one to expect them as true”. In this study, the
scale was tested for convergent and discriminant validity as follows:
6.14.1 Convergent validity
“Convergent validity is the extent to which items that are indicators of a specific construct
converge or share a high proportion of variance in common” (Hair et al., 2010, p. 710).
Convergent validity is used as an indication that the instruments used for a particular
construct are “at least moderately correlated among themselves” whereby poor convergent
validity may imply that there is a need for the model to utilise more constructs (Dean,
Fahsing, Gottschalk & Solli-Saether, 2008, p.170). According to Sarstedt, Ringle, Smith,
Reams and Hair (2014), convergent validity measures the degree to which a construct comes
together in its indicators by explaining the items’ variance. In addition, Campell and Fiske
(1959) say that convergent validity describes the extent to which each item in a construct
variable correlates to the construct variable to affirm that it is measuring the same variable as
other items in that variable. “This can be established by generating itemto-total correlations in

156
SPSS to measure how each item is attributable to the construct variable, as well as by
examining the factor loadings generated by the CFA model” (Pamacheche, 2015, p. 60).
6.14.2 Discriminant validity
According to Hair et al. (2017), discriminant validity refers to items measuring different
concepts. In addition, Golafshani (2003, p. 598) explained that “discriminant validity
determines whether a scale does or does not adequately differentiate itself between groups
that should or should not differ based on theoretical reasons or previous research”. In
addition, Cooper and Schindler (2008, p. 289) point out that “discriminant validity is also a
subcategory of construct validity and it tests whether concepts or measurements that are
supposed to be unrelated are in fact unrelated”. Discriminative is important for determining
the degree to which the constructs are discriminant or distinguishable from one another and
are not measuring the same variable (Lucas, et al., 1996; Zait & Bertea, 2011). This is done
by generating an inter-construct correlation matrix in SPSS and computing average variance
extracted (AVE) estimates for each construct (Pamacheche, 2015).
6.15 Structural equation modelling (SEM)
According to Levi-Jakšić (2012), structural equation modelling (SEM) involves causal
analysis whereby a model is evaluated against patterns of relationships among the collected
data. In addition, Wothke (2010, p. 6) notes that “structural equation modeling (SEM) is a
statistical technique that combines elements of traditional multivariate models, such as
regression analysis, factor analysis and simultaneous equation modeling”. Byme (2013, p. 3)
defines SEM as “a statistical methodology that takes a confirmatory (i.e. hypothesis – testing)
approach to the analysis of structural theory (causal processes that generate observations on
multiple variables) bearing on some phenomenon”. In addition, Structural Equation
Modelling (SEM) is a statistical methodology that takes a confirmatory approach to analysis
of structural theory (Byrne 2001:28; Hair et al. 2010:18; Nusair & Hua 2010).
Qureshi and Kang (2014, p.1) describe SEM as “a multivariate, statistical technique largely
employed for studying relationships between latent variables (or constructs) and observed
variables that constitute a model”. It is recognised as being similar to regression analysis but
more predominant in that it assesses the causal relationships among constructs while
concurrently accounting for measurement error (He, Gai, Wu & Wan 2012; Sarstedt, Ringle,
Smith, Reams & Hair 2014). SEM is fundamentally a framework that involves concurrently
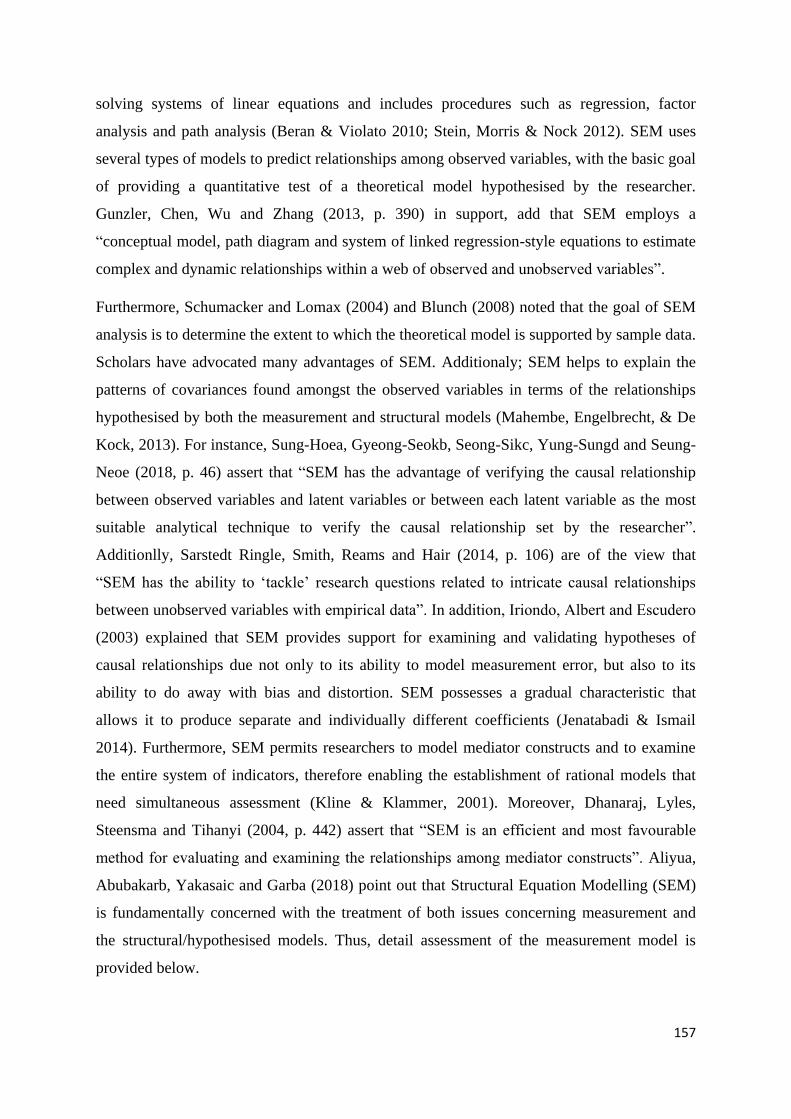
157
solving systems of linear equations and includes procedures such as regression, factor
analysis and path analysis (Beran & Violato 2010; Stein, Morris & Nock 2012). SEM uses
several types of models to predict relationships among observed variables, with the basic goal
of providing a quantitative test of a theoretical model hypothesised by the researcher.
Gunzler, Chen, Wu and Zhang (2013, p. 390) in support, add that SEM employs a
“conceptual model, path diagram and system of linked regression-style equations to estimate
complex and dynamic relationships within a web of observed and unobserved variables”.
Furthermore, Schumacker and Lomax (2004) and Blunch (2008) noted that the goal of SEM
analysis is to determine the extent to which the theoretical model is supported by sample data.
Scholars have advocated many advantages of SEM. Additionaly; SEM helps to explain the
patterns of covariances found amongst the observed variables in terms of the relationships
hypothesised by both the measurement and structural models (Mahembe, Engelbrecht, & De
Kock, 2013). For instance, Sung-Hoea, Gyeong-Seokb, Seong-Sikc, Yung-Sungd and Seung-
Neoe (2018, p. 46) assert that “SEM has the advantage of verifying the causal relationship
between observed variables and latent variables or between each latent variable as the most
suitable analytical technique to verify the causal relationship set by the researcher”.
Additionlly, Sarstedt Ringle, Smith, Reams and Hair (2014, p. 106) are of the view that
“SEM has the ability to ‘tackle’ research questions related to intricate causal relationships
between unobserved variables with empirical data”. In addition, Iriondo, Albert and Escudero
(2003) explained that SEM provides support for examining and validating hypotheses of
causal relationships due not only to its ability to model measurement error, but also to its
ability to do away with bias and distortion. SEM possesses a gradual characteristic that
allows it to produce separate and individually different coefficients (Jenatabadi & Ismail
2014). Furthermore, SEM permits researchers to model mediator constructs and to examine
the entire system of indicators, therefore enabling the establishment of rational models that
need simultaneous assessment (Kline & Klammer, 2001). Moreover, Dhanaraj, Lyles,
Steensma and Tihanyi (2004, p. 442) assert that “SEM is an efficient and most favourable
method for evaluating and examining the relationships among mediator constructs”. Aliyua,
Abubakarb, Yakasaic and Garba (2018) point out that Structural Equation Modelling (SEM)
is fundamentally concerned with the treatment of both issues concerning measurement and
the structural/hypothesised models. Thus, detail assessment of the measurement model is
provided below.

158
6.15.1 Measurement model
Reisinger and Mavondo (2007, p. 43) describe the measurement model as a “theoretical
model that reveals the structural relationships among latent variables (in essence the
independent and dependent) and their observed variables; along with the arcs that directly
link them as well as the error terms for their observed variables.” Its main purpose is to
provide the overall fit of the factor model, which shows the undimensionality of the
measurement items (Reisinger & Mavondo 2007). However, Maria and Yusniza (2016)
mentioned that the purpose of the measurement model is to evaluate the reliability and
validity of variables. According to Mhlophe (2015), a measurement model is viewed as a sub-
model in SEM that: (i) states the indicators for every single variable, and (ii) determines the
reliability of each variable for approximating the causal relationships. However, Aliyua,
Abubakarb, Yakasaic and Garba (2018) argue that the measurement model ensures that the
model specification is valid and reliable. The measurement model can be performed either as
an exploratory factor analysis or confirmatory factor analysis. “Exploratory factor analysis
seeks to determine and develop the likely factor structure (new measures) for studies where
there is a dearth of literature and previous measures for the latent variables investigated”
(Cramer 2006, p. 28). On the other hand, confirmatory factor analysis is a technique that
confirms that the existent measurement items load themselves into latent variables, which
depends on how the researcher links the measurement items to the latent variables (Lei & Wu
2007). This study applies the confirmatory factor analysis as the measurement model since
previous measures of the latent variables (green packaging, green advertising, green product
innovation, green process innovation, competitive advantage and business performance). The
next section focuses on confirmatory factor analysis.
6.15.2 Confirmatory factor analysis
As part of SEM, CFA was used to objectively evaluate and develop estimable variables that
specified a series of associations, suggesting how “measured variables” epitomised the latent
construct. CFA is a measurement model used for assessing the relationships between a set of
manifest and latent variables (Teo & Khine, 2009). In addition, Suhr (2006) defines
confirmatory factor analysis (CFA) as a statistical technique used to verify the factor
structure of a set of observed variables. Confirmatory factor analysis is theory driven and thus
the planning of the analysis is determined by the theoretical relationships between both the
observed and unobserved variables (Schreiber, Stage, King, Nora & Barlow, 2006). CFA
allows the researcher to place useful constraints on the CFA model along with assisting in
testing hypotheses related to a specific factor structure (Albright & Park, 2009). Additionally,

159
CFA is known as the ‘covariance structure’ and provides various goodness-of-fit or model fit
measures that are utilised to evaluate the model (Albright & Park, 2009). In CFA, the full
measurement model is specified a priori as an effort to achieve a much stronger test of the
measurement theory underlying a measure (Williams, Vandenberg & Edwards, 2009). As
such, CFA is generally considered more appropriate for theory testing than EFA (Hair et al.,
2010).
This study performed a confirmatory factor analysis to establish the factor model fit; in other
words, to test if the sample data fits or supports the hypothesised research factor model. It is
recommended that various model fit criteria be used in combination to assess model fit as
global fit measures (Kline, 2005). Following, Schumacker and Lomax (2010), Kline (2005),
Cheung and Rensvold (2002), this study performed a confirmatory factor analysis to establish
the factor model fit; in other words, to test if the sample data fits or supports the hypothesised
research factor model. Using Amos 25, the model fit indices tested in CFA to assess the
factor model fit include: the Chi-square/degrees of freedom, Goodness of Fit Index (GFI),
Augmented Goodness of Fit Index (AGFI), Normed Fit Index (NFI), Incremental Fit Index
(IFI), Tucker-Lewis Index (TLI), Composite Fit Index (CFI), and Root mean square error of
approximation (RMSEA). All these model fit indices are discussed as follows:
6.15.3 Chi-square (x2/df)
In AMOS, statistical value of CMIN/df is shown. The chi-square “assesses the magnitude of
discrepancy between the sample and fitted covariance matrices” (Hu & Bentler 1998, p. 426).
The chi-square assesses model fit by comparing the difference between the model’s inferred
covariances and the observed sample covariances (Bagozzi & Yi 1998). According to Kline
(2005), to reduce the sensitivity of chi-square to sample size, the chisquare value is divided
by the degrees of freedom (CMIN/df), which generally results in a lower value called the
normed chi-square. However, the criteria for CMIN/DF acceptance still varies across
researchers ranging from 2.0 to 3.0 which have been recommended correct for the influence
of sample size (Schumacker & Lomax 2010; Hooper et al. 2008; Byren 2013). For this study,
the (CMIN/df) was used as one of the indices, as shown in Table 7.25 of Chapter 7.
6.15.4 Goodness-of-fit Index (GFI)
According to Cheung and Rensvold (2002), a model is considered suitable if the covariance
structure implied by the model is similar to the covariance structure of the sample data, as
indicated by an acceptable value of goodness-of-fit index (GFI). The Goodness-of-Fit

160
statistic (GFI) was created by Jöreskog and Sorbom as an alternative to the Chi-Square test
and calculates the proportion of variance that is accounted for by the estimated population
covariance (Hooper, Coughlan & Mullen, 2008; Tabachnick & Fidell, 2007). In addition, the
GFI measures the difference between the covariance matrix of the sample and that of the
measurement model (McQuitty 2004). GFI measures the proportion of variance that is
accounted for by the estimated population covariance (Hu & Bentler 1999).
GFI shows how the model closely replicates the observed covariance matrix (Hooper,
Coughlan, & Mullen 2008). In addition, Schumacker and Lomax (2012) explain that the
goodness-of-fit index (GFI) is based on the ratio of the sum of the squared differences
between the observed and reproduced matrices to the observed variances, thus allowing for
scale. Furtheremore, Schumacker and Lomax (2012) explained that the GFI measures the
amount of variance and covariance in S that is predicted by the reproduced matrix, ∑. For
instance, if the GFI = 0.97, the 97% of the S matrix (sample covariance matrix) is predicted
by the reproduced matrix ∑. The GFI index can be computed for maximum likelihood (ML),
generalised least squares (GLS), and unweighted least squares (ULS). According to
Schumacker and Lomax (2012), the basic formula of calculating the GFI is as follows:
GFI = 1 – [X2 model √X
2 null]
(Note: X2
null is the Chi-Square for Indedence Model value on the computer out put)
The GFI statistics range from zero to one, but theoretically can yield meaningless negative
values. A large sample size increases the GFI value. However, GFI cut-off point for an
acceptable model should be equal to or greater than 0.90 (Tabachnick & Fidell 2007; Miles &
Shevlin 1998).
6.15.5 The Normed Fit Index (NFI)
The incremental fit indices are employed to complement the chi-square test (Bentler 1990).
One of the incremental fit indices is the Normed Fit Index (NFI). The Normed-fit index (NFI)
was developed by Bentler and Bonnett (1980) to assess the model by comparing the 𝑥2 value
of the model to the 𝑥2 of the null model. The null or independent model is the worst-case
scenario as it specifies that all measured variables are uncorrelated (Hooper, Coughlan &
Mullen, (2008). Values for this statistic range between 0 and 1 with Bentler and Bonnet
(1980) recommending values greater than 0.90 indicating a good fit. Hu and Bentler (1998)

161
also agree that although values for NFI range between 0 and 1, the cut-off point of NFI
should be ≥ .90. The formula for the normed fit index, NFI, is as follows (Bentler & Bonett,
1980):
Where is the estimated minimum value of the fit function for the independence model.
Yuan (2005) also points out that the fomula for NFI can be written as follows:
where Ti is the T-statistics for the independence model.
6.15.6 Tucker Lewis index (TLI)
According to Cangur and Ercan (2015), the Tucker-Lewis Index (TLI) is an incremental fit
index. Non-Normed Fit Index (NNFI) which is also known as TLI, was developed against the
disadvantage of Normed Fit Index regarding being affected by sample size (Cangur & Ercan,
2015). TLI is calculated as given below (Cangur & Ercan 2015; Schermelleh-Engel &
Moosbrugger, 2003; Ding, Velicer, & Harlow, 1995; Gerbing & Anderson, 1992).
Here 2 i belongs to the independence model whereas 2 t belongs to the target model
(Cangur & Ercan, 2015). In addition, vi and vt are the number of degrees of freedom for the
independence and target models respectively, in relation to the chi-square test statistics
(Cangur & Ercan, 2015). F is the value of appropriate minimum fit function, and n indicates
sample size. The bigger TLI value indicated better fit for the model (Cangur & Ercan, 2015).
The recommended value that must be met, must be above 0.9 (Hooper, Coughlan & Mullen,
2008; Chinomona, 2011). The key advantage of this fit index is the fact that it is not affected
significantly from sample size (Schermelleh-Engel & Moosbrugger, 2003; Ding et al., 1995;
Gerbing & Anderson, 1992).
162
6.15.7 The Comparative fit index (CFI)
The CFI assumes that all latent variables are uncorrelated and compares the sample
covariance matrix of the measurement model to that of a null model by taking into account
the non-centrality and distribution values of model parameters (Schumacker & Lomax 2004).
Cangur and Ercan (2015) revealed that CFI is calculated by the following equation.
Here max indicates the maximum value of the values given in brackets. 2 i and 2 t are test
statistics of the independence model and the target model respectively (Cangur & Ercan,
2015). vi and vt are the degrees of freedom of the independence model and the target model in
relation to chi-square test statistics respectively (Schermelleh-Engel & Moosbrugger, 2003;
Ding et al., 1995; Gerbing & Anderson, 1992). According to Cangur and Ercan (2015), the
CFI produces values between 01 and high values are the indicators of good fit. The CFI
values between 0.0 and 1.0 with a value of CFI ≥ 0.90 is generally accepted as an indication
of good model fit (Bagozzi 2010; Hu & Bentler 1998). The main advantage of CFI is that it is
the index least affected by sample size (Bentler 1990).
6.15.8 The incremental fit index (IFI)
The incremental fit index (IFI) was developed by Bollen (1989) to address the issue of
parsimony and sample size, which were known to be associated with the NFI. As such, its
computation is basically the same as the NFI, except that degrees of freedom are taken into
account. By convention, IFI should be equal to or greater than 0.90 to accept the model. IFI
can also be greater than 1 under certain circumstances (Ian & Lowther 2010). The results of
IFI are reported in Chapter 7 (Table 7.25).
6.15.9 Root mean square of approximation (RMSEA)
Root mean square error of approximation (RMSEA) fit index is used for evaluating
covariance structure models (Steiger & Lind 1980). RMSEA is regarded as "one of the most
informative fit indices” (Diamantopoulos & Siguaw 2000, p. 85). The RMSEA provides
information about ‘badness of fit’, with lower RMSEA values indicating good model fit
(Taasoobshirazi, & Wang, 2016; Kline, 2010). The RMSEA describes the extent to which the
model fits with the covariance matrix of the sample data (Hooper et al., 2008). In contrast

163
with other fit indices, RMSEA is based on the analysis of residuals, with lower values
implying the fit between the model and the data (Fadlelmula 2011). One of the greatest
advantages of the RMSEA is that it is not substantially affected by the variation in sample
size (Sharma, Mukherjee, Kumar & Dillion 2005). In addition, McQuitty (2004, p. 176) notes
that “the RMSEA allows for a broader interpretation of the degree of model fit than the chi-
square test, because it recognises the influence of sample size when estimating model fit”.
Cangur and Ercan, (2015) elucidates that this absolute fit index is estimated as follows:
Here F(S,∑(ϴ)) indicates the fit function is minimised whereas max points to the
maximum value of the values given in brackets (Cangur & Ercan, 2015). While l is the
number of known parameters and t is the number of independent parameters, v = l - t
indicates the value of the degrees of freedom and n indicates the sample size
(Schermelleh-Engel & Moosbrugger, 2003). Observe in the equation that RMSEA
produces a better quality of estimation when the sample size is large compared to smaller
sample sizes. When the sample size is large, the term [1/(n – 1)] gets closer to zero
asymptotically (Rigdon, 1996). The RMSEA also takes the model complexity into
account as it reflects the degree of freedom as well. A RMSEA value smaller than 0.05
can be said to indicate a convergence fit to the analysed data of the model while it
indicates a fit close to good when it produces a value between 0.05 and 0.08. The
minimum threshold of 0.06 is acceptable (Hu & Bentler 1999) while 0.08 is the
recommended upper limit (Steiger 2007). In similar vein, Nusair and Hua (2010, p. 316)
established that “by convention, there is a good model fit if RMSEA is less than or equal to
0.05 and an adequate fit if RMSEA is less than or equal to 0.08”. Table 6.13 summarises the
model of fit and acceptable fit level.
Table 6.13: Model of fit an acceptable fit level
Fit indices Acceptable threshold
Chi-square (CMIN/DF) Tabled chi-square smaller or equal to 3
Normed fit index (NFI) Value equal to or greater than 0.90
Increment fit index (IFI) Values greater than 0.09

164
Normal-fit-index (NFI) Values greater than 0.09
Tucker-Lewis index (TLI) Values greater than 0.09
Comparative fit index (CFI) Values greater than 0.09
Goodness-of-fit index (GFI) Values greater than 0.09
Root mean square error of
approximation (RMSEA)
Less than 0.08 with confidence interval
<0.05
Source: Baggozi and Yi (2012:15)
Deducing from all the aforementioned model fit indices, it is imperative to note that model fit
indices are discussed in detail in Chapter 7 (under Confirmatory Factor Analysis Model
Fit/Acceptability section). The Confirmatory factor analysis leads to the performance of a
path analysis which is discussed in the next section.
6.16 Structural model
In this study, after a careful assessment of the measurement model, the next step was to
examine the structural model for this study. Aliyua, Abubakarb, Yakasaic and Garba (2018)
viewed the structural model as a model that expresses the associations in the hypothesised
model. A structural model is a theoretical model that indicates structural relationships among
the latent or unobserved variables (both dependent and independent) and their observed
variables (measurement items); along with the direct arcs linking them as well as the error
terms for the observed variables (Reisinger & Mavondo 2007, p. 43). According to Hair et al.
(2017), the structural model is used to explain the relationship between the constructs. Maria
and Yusniza (2016) mentioned that the purpose of the structural model is to test the
hypotheses. According to Wentzel (2012), the structural model in SEM is essentially a path
analysis, which is a statistical technique used to examine causal relationships between two or
more variables. It is based upon a linear equation system and was first developed by Sewall
Wright in the 1930s for use in phylogenetic studies (Wentzel, 2012). The linear connections
between the unobserved variables reflect the proposed research hypotheses. In this study,
there are nine linear connections between the six variables and these are shown in Table 6.14.
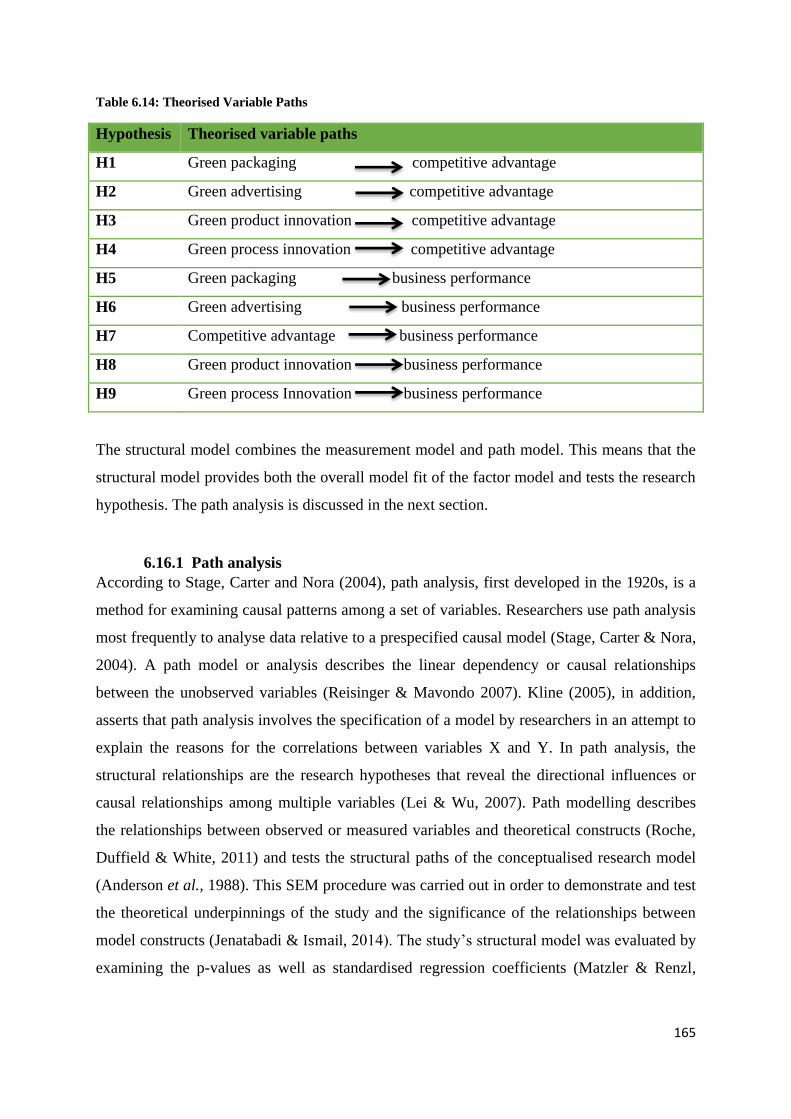
165
Table 6.14: Theorised Variable Paths
Hypothesis Theorised variable paths
H1 Green packaging competitive advantage
H2 Green advertising competitive advantage
H3 Green product innovation competitive advantage
H4 Green process innovation competitive advantage
H5 Green packaging business performance
H6 Green advertising business performance
H7 Competitive advantage business performance
H8 Green product innovation business performance
H9 Green process Innovation business performance
The structural model combines the measurement model and path model. This means that the
structural model provides both the overall model fit of the factor model and tests the research
hypothesis. The path analysis is discussed in the next section.
6.16.1 Path analysis
According to Stage, Carter and Nora (2004), path analysis, first developed in the 1920s, is a
method for examining causal patterns among a set of variables. Researchers use path analysis
most frequently to analyse data relative to a prespecified causal model (Stage, Carter & Nora,
2004). A path model or analysis describes the linear dependency or causal relationships
between the unobserved variables (Reisinger & Mavondo 2007). Kline (2005), in addition,
asserts that path analysis involves the specification of a model by researchers in an attempt to
explain the reasons for the correlations between variables X and Y. In path analysis, the
structural relationships are the research hypotheses that reveal the directional influences or
causal relationships among multiple variables (Lei & Wu, 2007). Path modelling describes
the relationships between observed or measured variables and theoretical constructs (Roche,
Duffield & White, 2011) and tests the structural paths of the conceptualised research model
(Anderson et al., 1988). This SEM procedure was carried out in order to demonstrate and test
the theoretical underpinnings of the study and the significance of the relationships between
model constructs (Jenatabadi & Ismail, 2014). The study’s structural model was evaluated by
examining the p-values as well as standardised regression coefficients (Matzler & Renzl,

166
2006). Wu (2010) mentions that in conducting path modelling, a particular responsibility is to
explain standardised regression coefficients, as well as predictive ability.
6.17 Testing for mediation
Ramayah, Lee and In (2011) are of the view that a mediation test is conducted to discover if a
mediator construct can significantly carry the ability of an independent variable to a
dependent variable. Similarly, a mediation test determines the indirect effect of the
independent variable on the dependent variable through a mediator variable (Gorondutse &
Hilman, 2016). According to Preacher and Hayes (2004), researchers often conduct
mediation analysis to indirectly assess the effect of a proposed cause on some outcome
through a proposed mediator. The utility of mediation analysis stems from its ability to go
beyond the merely descriptive to a more functional understanding of the relationships
among variables (Preacher & Hayes, 2004).
The conceptual model of this study comprises four independent variables, green packaging,
green advertising, green product innovation and green process innovation; one mediating
variable, competitive advantage (CA), and one dependent variable, business performance
(BP). Bao, Bao and Sheng (2011) adopted Baron and Kenny’s (1986) suggested procedure,
which consists of four main steps. The first step is to determine the significance of the
relationship between the independent and the dependent variables, without the mediator.
Figure 6.5 reveals step 1 in Baron and Kenny’s approach for testing mediation.
Figure 6.6: Step 1 in Baron and Kenny approach
Source: Baron and Kenny (1986)
The second step comprises determining the relationship between the independent variable
and the mediator. Figure 6.6 shows step 2 in Baron and Kenny’s approach for testing
mediation.
Figure 6.7: Figure 6.6: Step 2 in Baron and Kenny approach
X
X
Y
Med

167
Source: Baron and Kenny (1986)
The third step is centred on testing if the mediator has a significant unique effect on the
dependent variable. Figure 6.7 displays step 3 in Baron and Kenny’s approach for testing
mediation.
Figure 6.8: Step 3 in Baron and Kenny approach
Source: Baron and Kenny (1986)
The final step is to calculate the full model and identify if the previous significant
relationship between the independent and dependent variable is zero (i.e. full mediation) or
reduced (i.e. partial mediation) (Bao, Bao & Sheng, 2011). Figure 6.8 presents step 4 in
Baron and Kenny’s approach for testing mediation.
Figure 6.9: Step 4 in Baron and Kenny approach
Source: Baron and Kenny (1986)
Although Baron and Kenny’s approach shows the traditional testing steps for mediation,
Preacher and Hayes (2004, p. 2008) have criticised the "causal procedure" of Baron and
Kenny (1986) by introducing a new method called "bootstrapping the indirect effect". This
current testing procedure for mediation is said to be perfectly suited for PLS-SEM which is a
common technique to test structural models using the component-based approach (Albers,
2010; Henseler et al., 2009). Furthermore, this study utilised Partial Least Squares (PLS-
SEM) technique, to test the mediating effect of the mediator of this study, namely
competitive advantage. PLS path analysis allows evaluating mediation models and tests
Med Y
X Y
Med
H1

168
mediation hypotheses, using the bootstrapping method (Hernández-Perlines, Moreno-García
& Yáñez-Araque, 2016; Hayes, Preacher & Myers 2011).
Bootstrapping, a nonparametric resampling procedure, has been recognised as one of the
more rigorous and powerful methods for testing the mediating effect (Hayes, 2009; Shrout &
Bolger, 2002; Zhao et al., 2010). The application of bootstrapping for mediation analysis has
recently been advocated by Hair, Hult, Tomas, Ringle and Sarstedt (2013) who noted that
when testing mediating effects, researchers should rather follow Preacher and Hayes
(2004:223; 2008) and bootstrap the sampling distribution of the indirect effect, which works
for simple and multiple mediator models". It is important to note that the bootstrapping
procedure was used when conducting an estimation of indirect effect ab, standard error and
both indirect effects interval at 95% confidence interval.
Moreover, it should be noted that in this study, there are four specific indirect effects between
the six variables and these are shown in Table 6.16. More of the results of the mediation
effect of competitive advantage are shown in chapter 7 in section 7.11.
Table 6.15: Mediation theorised variable paths
Hypothesis Theorised variable paths
H10 Green packaging -> Competitive advantage -> Business performance
H11 Green advertising -> Competitive advantage -> Business performance
H12 Green product innovation -> Competitive advantage -> Business performance
H13 Green process innovation -> Competitive advantage -> Business performance
6.18 Ethical consideration
According to Mason (2007), research desires to be carried out with honesty to safeguard the
researcher and the participants. Ansah (2016) is of the view that ethical consideration was the
protection of the respondents' rights, getting informed consent and the institutional
assessment procedure of the ethical authorisation. The current study was governed by the
University of the Witwatersrand's condition that necessitates studies concerning human
participation to apply for human research ethics committee's approval before a study could be
carried out. The study was approved by the University of the Witwatersrand, Johannesburg
human subjects (non-medical) ethics committee and ethics permission was obtained -
clearance number is: H17/06/26 (see Appendix A).

169
6.19 Chapter Summary
The chapter has presented a broad description of the research design and methodology
employed in the study. It started with research philosophies or the research paradigm; after
which the discussion of the methodology was placed into headings, such as the sampling
design which consists of: the target population, sampling frame, sample size and sampling
method which were all discussed. The statistical technique used was structural equation
modelling (SEM) - where partial least squares software was used to assess both validity and
reliability while the confirmatory factor analysis (CFA) and the path modelling were also
done with Amos. The account on how thresholds were met, coupled with their ultimate
interpretations of the data was all systematically explained. The description of how the
university's ethics was adhered to was also presented. In the next chapter, the results of the
study are presented.

170
7 CHAPTER 7: DATA ANALSIS AND PRESENTATION OF
RESULTS
7.1 Introduction
The preceding chapter covered the research design and methodology of the study. A detailed
description of the sample selection and composition, questionnaire development, as well as
data collection and statistical analysis was provided. The current chapter reports on the
analysis and presentation of the empirical findings of the study’s pilot and main survey. This
chapter provides the statistical analysis and results obtained from the data collected on how
green packaging, green advertising, green product innovation, green process innovation
impacts competitive advantage and business performance. An overview is given of the
descriptive statistics, an analysis of the reliability and validity of the measurement
instruments is made, an overview of the model fit is provided, and a path modeling analysis is
conducted and presented. Moreover, mediation analysis was conducted, to determine the
mediation impact of competitive advantage.
7.2 Results of the pilot test
The questionnaire was piloted on a sample of 50 manufacturing SME managers. In assessing
the reliability of the measuring instrument, coefficient alpha was first computed for the
annotated key scales of the questionnaires. The results obtained gave a satisfactory indication
of reliability. The Cronbach alpha reliability for Section B was 0.913, 0.921for Section C,
0.955 for Section D, 0.906 for Section E, 0.800 for Section F, and 0.897 for Section G
respectively, therefore, reflecting reliability values above the accepted benchmark of 0.70,
which, according to Pallant (2010), is regarded as satisfactory. The results are reported in
Table 7.1.
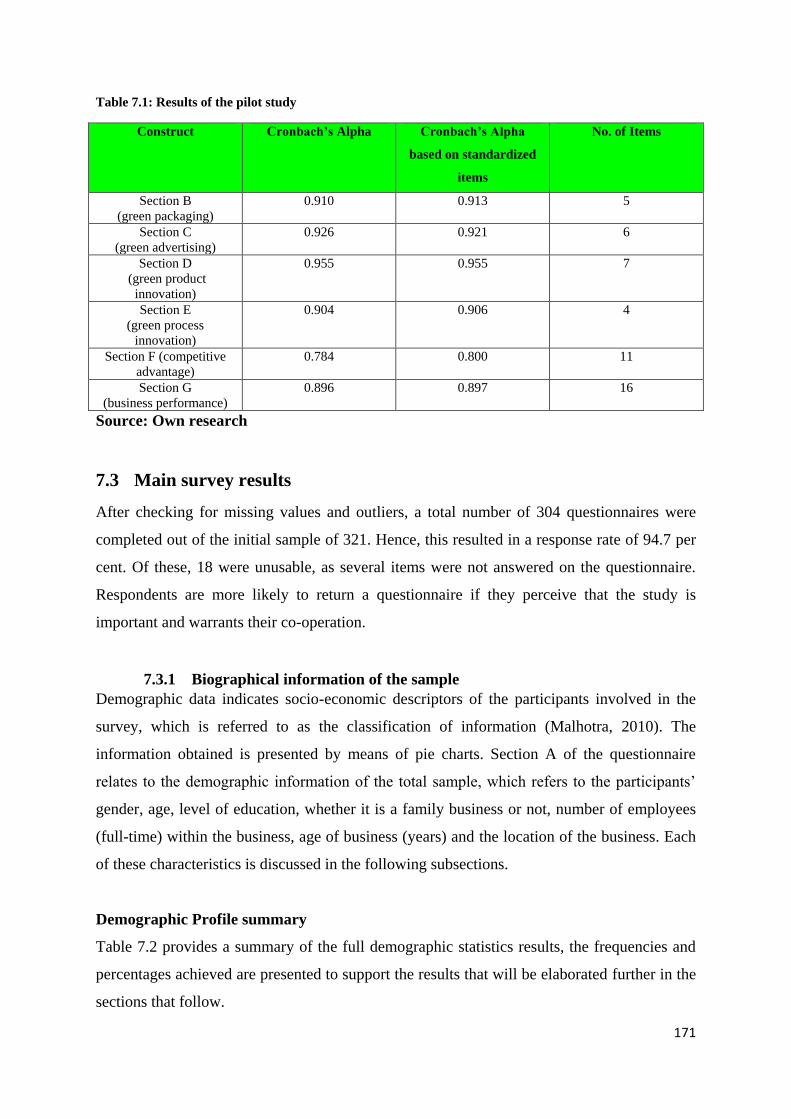
171
Table 7.1: Results of the pilot study
Construct Cronbach’s Alpha Cronbach’s Alpha
based on standardized
items
No. of Items
Section B
(green packaging)
0.910 0.913 5
Section C
(green advertising)
0.926 0.921 6
Section D
(green product
innovation)
0.955 0.955 7
Section E
(green process
innovation)
0.904 0.906 4
Section F (competitive
advantage) 0.784 0.800 11
Section G
(business performance) 0.896 0.897 16
Source: Own research
7.3 Main survey results
After checking for missing values and outliers, a total number of 304 questionnaires were
completed out of the initial sample of 321. Hence, this resulted in a response rate of 94.7 per
cent. Of these, 18 were unusable, as several items were not answered on the questionnaire.
Respondents are more likely to return a questionnaire if they perceive that the study is
important and warrants their co-operation.
7.3.1 Biographical information of the sample
Demographic data indicates socio-economic descriptors of the participants involved in the
survey, which is referred to as the classification of information (Malhotra, 2010). The
information obtained is presented by means of pie charts. Section A of the questionnaire
relates to the demographic information of the total sample, which refers to the participants’
gender, age, level of education, whether it is a family business or not, number of employees
(full-time) within the business, age of business (years) and the location of the business. Each
of these characteristics is discussed in the following subsections.
Demographic Profile summary
Table 7.2 provides a summary of the full demographic statistics results, the frequencies and
percentages achieved are presented to support the results that will be elaborated further in the
sections that follow.

172
Table 7.2: Sample demographic Characteristics
Source: Summarised SPSS output
Gender Frequency Percentage
Male 187 61.5%
Female 99 32.6%
Prefer not to say 18 5.9%
Total 304 100%
Age distribution of the
respondents
Frequency Percentage
18 to 30 years 37 12.2%
31 to 39 years 97 31.9%
40 to 49 years 56 18.4%
50 to 59 years 96 31.6%
60 years and above 18 5.9%
Total 304 100%
Level of Education Frequency Percentage
No formal education 57 18.8%
Basic Education 36 11.8%
Diploma 119 39.1%
Degree 92 30.3%
Total 304 100%
Family business Frequency Percentage
Yes 109 35.9%
No 195 64.1%
Total 304 100%
Number of employees
(full-time)
Frequency Percentage
Less than 10 employees 7 2.3%
Between 10 and 50
employees
131 43.1%
Between 50 and 100
employees
76 25.0%
Between 100 and 200
employees
90 29.6%
Total 304 100%
Age of business (years) Frequency Percentage
1 to 3 years 9 3.0%
4 to 6 years 120 39.5%
7 to 10 years 16 5.3%
11-20years 159 52.3%
Total 304 100%
The location of the
business
Frequency Percentage
CBD 79 26.0%
Industrial 225 74.0%
Total 304 100%

173
The descriptive analysis in Table 7.2 presents the demographic information regarding the
enterprises that were surveyed in this study. These demographic results apply to and support
all the variables surveyed in this study. Note that the frequency represents the number of
participants (enterprises) who took part in the study; each section shows the numbers that add
up to the required total sample of 304 and the percentage numbers that add up to a total of
100 per cent.
In the section that follows, the seven aspects of the demographic section that were included in
the questionnaire are dealt with separately and the achieved results are discussed. The
information collected begins with gender, age distribution of the respondents, level of
education, family business, the number of employees, the age of the business and the location
of the business. The individual categories of the demographic profile of respondents are
interrogated separately and in detail in sections 7.4.1 to section 7.4.7.
7.4.1 Gender
Figure 7.1 presented the classification of information related to the participants’ gender. The
largest portion of the sample indicated that there were male 61.5 percent (n=187); followed
by those who revealed that there were female 32.6 percent (n=99). Moreover, the remainder
of the respondents 3.2 percent (n=12) preferred not to mention their gender.
Figure 7.1: Gender
61.51%
32.57%
5.92%
Male Female Prefer not to say

174
Table 7.3: Gender
7.3.2 Age distribution of the respondents
The majority of the participants indicated that 31.9 percent (n=97) of the respondents were
between 31 to 39 years of age, closely followed by 31.6 percent (n=96) who indicated being
50 to 59 years of age, then followed by 18.4 percent (n=56) who were between 40 to 49 years
of age. For the remaining respondents 12.2 percent (n=37) indicated that they were between
18 to 30 years of age. Lastly, the remainder of the respondents 5.9 percent (n=18) revealed
that they were 60 years and above. The age distribution of the sample is illustrated in Figure
7.2.
Figure 7.2: Age distribution of the respondents
Gender
Frequency Perce
nt
Valid
Percen
t
Cumulativ
e Percent
Valid Male 187 61.5 61.5 61.5
Female 99 32.6 32.6 94.1
Prefer not to say 18 5.9 5.9 100.0
Total 304 100.0 100.0
12%
31.91%
18.42%
31.58%
5.92%
18 to 30 years 31 to 39 years 40 to 49 years
50 to 59 years 60 years and above

175
Table 7.4: Age distribution of the respondents
7.3.3 Level of education
In terms of the level of education of the respondents, the majority of the respondents, 39.1 per
cent (n=119), indicated that they were holders of a diploma qualification. This was then
followed by 30.3 per cent (n=92) of the respondents who indicated that they have degrees. In
addition, 18.8 per cent (n=57) of the respondents revealed that they have got no formal
education. This was then followed by 11.8 per cent (n=36) who indicated that they have only
obtained some basic education. The level of education of the respondents is graphically
depicted in Figure 7.3.
Figure 7.3: Level of education
Age distribution of the respondents
Frequency Percent Valid
Percent
Cumulative
Percent
Valid 18 to 30 years 37 12.2 12.2 12.2
31 to 39 years 97 31.9 31.9 44.1
40 to 49 years 56 18.4 18.4 62.5
50 to 59 years 96 31.6 31.6 94.1
60 years and above 18 5.9 5.9 100.0
Total 304 100.0 100.0
19%
11.84%
39.14%
30.26%
No formal education Basic eduation Diploma Degree

176
Table 7.5: Level of education
7.3.4 Family business
The respondents had an opportunituy to point out whether their manufacturing SME business
is a family business or not (see Figure 7.2). The majority of the respondents, 64 percent
(n=195), indicated that their business was not a family business. However, the remainder of
the respondents, 36 percent (n=109), revealed that their business was a family business.
Figure 7.4: Family business
Table 7.6: family business
36%
64%
Yes No
Level of education
Frequency Percent Valid
Percent
Cumulative
Percent
Valid No formal education 57 18.8 18.8 18.8
Basic Education 36 11.8 11.8 30.6
Diploma 119 39.1 39.1 69.7
Degree 92 30.3 30.3 100.0
Total 304 100.0 100.0
Family business
Frequency Percent Valid Percent Cumulativ
e Percent
Valid Yes 109 35.9 35.9 35.9
No 195 64.1 64.1 100.0
Total 304 100.0 100.0

177
7.3.5 Number of employees (full-time)
The employment figures for this specific sample profile (Figure 7.5) indicate that the majority
of the SME businesses employ fewer than 50 employees per business entity, with 43.1 per
cent (n=131) of the surveyed employees in the category of 10 to 50 employees and 29.6 per
cent in the category of 100 to 200 employess. In addition, 25 per cent (n=76) of the
respondents were in the category of 50 to 100 employees. The remainder of the respondents,
2.3 per cent (n=7), revealed that there were in the category of fewer than 10 employees.
These findings coincide with with the works of Moodley (2002, p. 37) who asserts that
“SMEs are important, because, although recruiting less per entity, their potentialfor job
creation is in numbers”.
Figure 7.5: Number of employees (full-time)
Table 7.7: Number of employees (full-time)
Less than 10
employees
Between 10 and
50 employees
Between 50 and
100 employees
Between 100
and 200
employees
2.30%
43.09%
25.00%
29.61%
Number of employees (full-time)
Frequenc
y
Percent Valid Percent Cumulative
Percent
Vali
d
Less than 10
employees
7 2.3 2.3 2.3
Between 10 and 50
employees
131 43.1 43.1 45.4
Between 50 and 100
employees
76 25.0 25.0 70.4
Between 100 and 200
employees
90 29.6 29.6 100.0
Total 304 100.0 100.0

178
7.3.6 Age of business (years)
Figure 7.6 reveals the age of the manufacturing SME businesses in terms of years. Of these
business operations, 52.3 per cent (n=159) had been in existence for 11-20 years, 39.5 per
cent (n=120) had been in operation for 4–6 years, 5.3 per cent (n=16) had been in operation
for 7–10 years, while the remainder, 3 percent (n=9), were emerging enterprises that had
operated for less than three years.
Figure 7.6: Age of business (years)
Table 7.8: Age of business (years)
2.96%
39.47%
5.26%
52.30%
1 to 3 years
4 to 6 years
7 to 10 years
11 to 20 years
Age of business (years)
Frequency Percent Valid
Percent
Cumulative
Percent
Valid 1 to 3 years 9 3.0 3.0 3.0
4 to 6 years 120 39.5 39.5 42.4
7 to 10 years 16 5.3 5.3 47.7
11-20years 159 52.3 52.3 100.0
Total 304 100.0 100.0

179
7.3.7 The location of the business
Figure 7.7 provides the profile of the surveyed SMEs in terms of their location. The majority
of the respondents, 26 per cent (n=79), expressed that their business is local which are the
industrial areas of the Gauteng Province of South Africa. The remainer of the respondents, 74
per cent (n=225), indicated that there are located within the various CBD areas of the
Gauteng province of South Africa.
Figure 7.7: The location of the business
Table 7.9: The location of the business
25.99%
74.01%
CBD Industrial
The location of the business
Frequen
cy
Percent Valid
Percent
Cumulative
Percent
Vali
d
CBD 79 26.0 26.0 26.0
Industrial 225 74.0 74.0 100.0
Total 304 100.0 100.0

180
7.4 Descriptive statistics
The analysis proceeded to determine the level of respondents’ agreement or disagreement for
each construct. Tables 7.3, 7.4, 7.5; 7.6, and 7.7 report on the basic descriptive statistics
comprising the means and standard deviations of the predetermined constructs. Mean values
were computed as the measures of central tendency for this study. All the tables presented
below, reveal that the mean value for all the items ranges between three and four, indicating
that the majority of the respondents had either a neutral standpoint (‘3’ on the Likert scale) or
they agreed (‘4’ on the Likert scale) with the statements provided. Standard deviation values
were computed to measure the variance of responses on each variable. As posited by Hair et
al. (2007), the relationship between the mean and the standard deviation is that a small
estimated standard deviation (SD) denotes that respondents’ responses were consistent and
that the response distributions lay close to the mean. Conversely, a large standard deviation
indicates that the responses are varying, making the response distribution values fall away
from the mean of the distribution (Slove, 2001). Moreover, the standard deviation value
“should be less than 1 but it is recommended to at least include a value of less than 2 to
ensure that there is no issue of outliers” (Drost; 2011, p. 87).
Table 7.10: Descriptive statistical analysis (Section B –Green packaging)
Item Valid N Mean Minimum Maximum Std. Deviation
GP1 304 3.56 1 5 1.010
GP2 304 3.65 1 5 1.086
GP3 304 4.09 1 5 1.024
GP4 304 3.75 1 5 0.986
GP5 304 3.92 1 5 1.039
Green packaging, which constituted Section B of the questionnaire, had the highest mean
score of 4.09 (Item GP3) and the lowest mean score was 3.56 (Item GP1) giving a range of
0.53. Precisely, the lowest mean 3.56 (Item GP1) indicated that the packaging of their
products is non-biodegradable, while results from Section B of the questionnaire highlighted
the fact that the highest mean score was 4.09 (Item GP3). Most of the respondents admitted
that their products are in recyclable materials. Table 7.10 reveals that the green packaging
scale had the highest standard deviation value reported at 1.086 (Item GP2) and the lowest
standard deviation value was 0.986 (Item GP4). This information indicates that the data

181
points are clustered around the mean. The SD values are below two (2), hence an indication
that there is no presence of outliers.
Table 7.11: Descriptive statistical analysis (Section C –Green advertising)
Item Valid N Mean Minimum Maximum Std. Deviation
GA1 304 3.52 1 5 1.152
GA2 304 3.77 1 5 1.002
GA3 304 3.72 1 5 1.042
GA4 304 3.73 1 5 1.044
GA5 304 3.80 1 5 1.033
GA6 304 3.84 1 5 1.054
Green advertising, which constituted Section C of the questionnaire, had the highest mean
score of 3.84 (Item GA6) and the lowest mean score was 3.52 (Item GA1) giving a range of
0.32. Precisely, the lowest mean 3.52 (Item GA1) indicated that the respondents agreed that
they provide messages on sustainability which focus on the environmental impact of the
products, while results from Section C of the questionnaire highlighted the fact that the
highest mean score was 3.84 (Item GA6). Most of the respondents admitted that they make
environmental claims based on the life expectancy of the products (e.g. raw material
production, manufacturing). Table 7.11 reveals that the green advertising scale had the
highest standard deviation value reported at 1.152 (Item GA1) and the lowest standard
deviation value was 1.002 (Item GA2). This information indicates that the data points are
clustered around the mean. The SD values are below two (2), hence an indication that there
are no issues of outliers.
Table 7.12: Descriptive statistical analysis (Section D – Green product innovation)
Item Valid N Mean Minimum Maximum Std. Deviation
GPI1 304 3.56 1 5 1.088
GPI2 304 3.55 1 5 1.089
GPI3 304 3.64 1 5 1.017
GPI4 304 3.49 1 5 0.985
GPI5 304 3.35 1 5 1.035
GPI6 304 3.41 1 5 1.148
GPI7 304 3.93 1 5 1.002

182
Green product innovation, which constituted Section D of the questionnaire, had the highest
mean score of 3.93 (Item GPI7) and the lowest mean score was 3.35 (Item GPI5) giving a
range of 0.58. Precisely, the lowest mean 3.35 (Item GPI5) showed that the respondents
agreed that their firms often place emphasis on developing new green-products through new
technologies to use natural materials, while results from Section D of the questionnaire
highlighted the fact that the highest mean score was 3.93 (Item GPI7). Most of the
respondents admitted that their firms often place emphasis on developing new green-products
through new technologies to use as little energy as possible. Table 7.12 reveals that the green
product innovation scale had the highest standard deviation value reported at 1.148 (Item
GPI6) and the lowest standard deviation value was 0.985 (Item GPI4). This information
indicates that the data points are clustered around the mean. The SD values are below two (2),
hence an indication that there is no presence of outliers.
Table 7.13: Descriptive statistical analysis (Section E –Green process innovation)
Item Valid N Mean Minimum Maximum Std. Deviation
GPRI1 304 3.63 1 5 1.136
GPRI2 304 3.69 1 5 1.097
GPRI3 304 3.70 1 5 1.075
GPRI4 304 3.67 1 5 1.119
Green process innovation, which constituted Section E of the questionnaire, had the highest
mean score of 3.70 (Item GPRI3) and the lowest mean score was 3.63 (Item GPRI1) giving a
range of 0.07. Precisely, the lowest mean 3.63 (Item GPRI1) showed that the respondents
agreed that the manufacturing process of their businesses effectively reduces the emission of
hazardous substances or waste; while results from Section E of the questionnaire highlighted
the fact that the highest mean score was 3.70 (Item GPRI3). Most of the respondents admitted
that the manufacturing process of their businesses reduces the consumption of water,
electricity, coal, or oil. Table 7.13 reveals that the green process innovation scale had the
highest standard deviation value reported at 1.136 (Item GPRI1) and the lowest standard
deviation value was 1.075 (Item GPRI3). This information indicates that the data points are
clustered around the mean. The SD values are below two (2), hence an indication that there is
no presence of outliers.

183
Table 7.14: Descriptive statistical analysis (Section F-Competitive advantage)
Item Valid N Mean Minimum Maximum Std. Deviation
CA1 304 3.76 1 5 1.040
CA2 304 3.62 1 5 1.065
CA3 304 3.78 1 5 1.102
CA4 304 4.02 1 5 .953
CA5 304 4.10 1 5 .884
CA6 304 3.84 1 5 1.038
CA7 304 4.07 1 5 .884
CA8 304 4.29 1 5 .850
CA9 304 4.33 1 5 .798
CA10 304 4.05 1 5 .819
CA11 304 3.93 1 5 .909
Competitive advantage, which constituted Section F of the questionnaire, had the highest
mean score of 4.33 (Item CA9) and the lowest mean score was 3.62 (Item CA2) giving a
range of 0.71. Precisely, the lowest mean 3.62 (Item CA2) showed that the respondents
agreed that their response to competitive moves in the market place is good, while results
from Section F of the questionnaire highlighted the fact that the highest mean score was 4.33
(Item CA9). Most of the respondents admitted that their products have a significant
advantage over those of their competitors. Table 7.14 reveals that the competitive advantage
scale had the highest standard deviation value reported at 1.102 (Item CA3) and the lowest
standard deviation value was 0.798 (Item CA9). This information indicates that the data
points are clustered around the mean. The SD values are below two (2), hence an indication
that there are no issues of outliers.
Table 7.15: Descriptive statistical analysis (Section G –Business performance)
Item Valid N Mean Minimum Maximum Std. Deviation
BP1 304 3.65 1 5 1.006
BP2 304 3.93 1 5 .959
BP3 304 4.09 1 5 .915
BP4 304 4.01 1 5 .921
BP5 304 4.19 1 5 .820
BP6 304 4.02 1 5 .966

184
BP7 304 4.23 1 5 .915
BP8 304 3.96 1 5 1.006
BP9 304 3.90 1 5 .995
BP10 304 3.86 1 5 .973
BP11 304 3.92 1 5 1.042
BP12 304 4.10 1 5 .956
BP13 304 3.79 1 5 1.170
BP14 304 3.60 1 5 1.268
BP15 304 3.72 1 5 1.148
BP16 304 3.86 1 5 1.041
Moreover, business performance, which constituted Section G of the questionnaire, had the
highest mean score of 4.23 (Item BP7) and the lowest mean score was 3.60 (Item BP14)
giving a range of 0.63. Precisely, the lowest mean 3.60 (Item BP14) showed that the
respondents agreed that they have the best order-fulfilment lead time in the industry, while
results from Section G of the questionnaire highlighted the fact that the highest mean score
was 4.23 (Item BP7). Most of the respondents admitted that their quality reputation and
award achievement is the best in the industry. Table 7.15 reveals that the business
performanc scale had the highest standard deviation value reported at 1.268 (Item BP14) and
the lowest standard deviation value was 0.820 (Item BP5). This information indicates that the
data points are clustered around the mean. The SD values are below two (2), hence an
indication that there is no presence of outliers.
7.5 Research Study Measure of Reliability and Validity
The measurement model is instrumental in measuring reliability, validity and model of fit.
Subsequent to demographic analysis of the collected data, it is essential to appraise the
reliability and validity of the measuring scales to ensure valid data analyses. The following
section presents internal reliability assessment for the six constructs that constitute this
research, green packaging, green advertising, green product innovation, green process
innovation, competitive advantage, and business performance.
7.5.1 Internal consistency of reliability analysis: Green packaging
The results of the scale reliability test for the construct green packaing is shown in table 7.8.
Item GP5 was deleted due to the fact that the item to total correlation value was 0.5. The
Item-total statistics analysed through SPSS are required to be above 0.5 to assess convergent

185
validity (Morar, Venter & Chuchu, 2015). As shown in table 7.8, item to total values ranged
from 0.536 to 0.690 and therefore, were above the threshold of 0.5. Furthermore, in terms of
the Cronbach’s Alpha coefficient, Hair et al. (2009) and Kipkebut (2010) mentioned that
values in the range 0.6 and 0.7 are considered reliable. It is evident that the Cronbach’s alpha
value for the construct GP which is 0.806 is above the recommended threshold of 0.7,
confirming reliability of the measurements of items used in the study. According to literature,
composite reliabilty values that are acceptable are normally between zero and one (<-1)
(Ramayah et al., 2011). An index that is greater than 0.7 represents sufficient internal
consistency of the construct (Nunnaly, 1978; Hair et al., 2009). Composite reliability (CR)
and average variance extracted (AVE) for each construct were computed using the formula
proposed by Fornell and Lacker (1981).
Formulae:
CRη = (Σλyi) ² / [(Σλyi) ² + (Σεi)]
Where:
CRη = Composite reliability
(Σλyi) ² = Square the sum of the factor loadings (Σεi) = Sum of error variances.
Vη = Σλyi2 / (Σλyi2+Σεi)
Where:
AVE = summation of the squared of factor loadings / {(summation of the squared of factor
loadings) + (summation of error variances)}
The results of composite reliability for GP are shown in Table 7.8. The result yielded a CR
index of 0.83. The exhibited CR level exceeded the estimated criteria of greater than 0.70,
which is recommended as adequate for internal consistency of the constructs (Nunnally 1978;
Holland, 1999). The results of the average variance extracted for GP are also shown in Table
7.8. The AVE for GP is 0.56, which is above 0.4, thus acceptable (Fraering & Minor 2006).
As seen in Table 7.16, the extrapolated shared correlation values were converted to highest
shared variance by squaring the shared correlation and the highest shared values were then
compared with AVE to see which one was the greatest. Table 7.16 shows that all the AVE
value is 0.56 which is above the HSV value of 0.32 for the research construct, thereby
confirming the existence of discriminant validity. Factor loadings (standardised regression
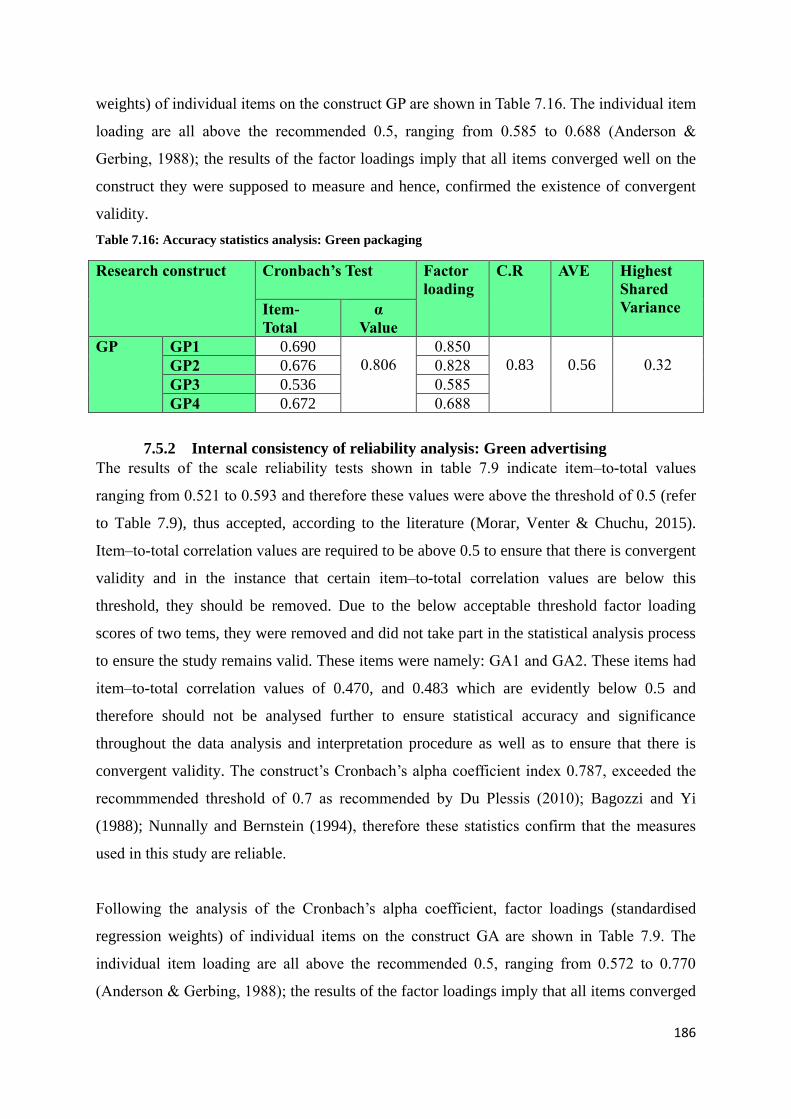
186
weights) of individual items on the construct GP are shown in Table 7.16. The individual item
loading are all above the recommended 0.5, ranging from 0.585 to 0.688 (Anderson &
Gerbing, 1988); the results of the factor loadings imply that all items converged well on the
construct they were supposed to measure and hence, confirmed the existence of convergent
validity.
Table 7.16: Accuracy statistics analysis: Green packaging
Research construct Cronbach’s Test Factor
loading
C.R AVE Highest
Shared
Variance Item-
Total
α
Value
GP GP1 0.690
0.806
0.850
0.83
0.56
0.32 GP2 0.676 0.828
GP3 0.536 0.585
GP4 0.672 0.688
7.5.2 Internal consistency of reliability analysis: Green advertising
The results of the scale reliability tests shown in table 7.9 indicate item–to-total values
ranging from 0.521 to 0.593 and therefore these values were above the threshold of 0.5 (refer
to Table 7.9), thus accepted, according to the literature (Morar, Venter & Chuchu, 2015).
Item–to-total correlation values are required to be above 0.5 to ensure that there is convergent
validity and in the instance that certain item–to-total correlation values are below this
threshold, they should be removed. Due to the below acceptable threshold factor loading
scores of two tems, they were removed and did not take part in the statistical analysis process
to ensure the study remains valid. These items were namely: GA1 and GA2. These items had
item–to-total correlation values of 0.470, and 0.483 which are evidently below 0.5 and
therefore should not be analysed further to ensure statistical accuracy and significance
throughout the data analysis and interpretation procedure as well as to ensure that there is
convergent validity. The construct’s Cronbach’s alpha coefficient index 0.787, exceeded the
recommmended threshold of 0.7 as recommended by Du Plessis (2010); Bagozzi and Yi
(1988); Nunnally and Bernstein (1994), therefore these statistics confirm that the measures
used in this study are reliable.
Following the analysis of the Cronbach’s alpha coefficient, factor loadings (standardised
regression weights) of individual items on the construct GA are shown in Table 7.9. The
individual item loading are all above the recommended 0.5, ranging from 0.572 to 0.770
(Anderson & Gerbing, 1988); the results of the factor loadings imply that all items converged

187
well on the construct they were supposed to measure and hence, confirmed the existence of
convergent validity. Internal consistency was also used to evaluate the composite reliability
(CR) index of the construct. Using the formulae presented in the previous section, the
composite reliability was calculated and tabulated in Table 7.17. The results in Table 7.17
indicate the CR index for GA is 0.76, thereby exceeding the estimate criteria used in
literature. The construct GA had an Average Extracted Variance of 0.44 which is above the
threshold recommended in literature and therefore provides evidence for an acceptable level
of research scale reliability (Fraering & Minor, 2006; Hair et al., 2009). Additionally, Table
7.17 shows that all the AVE values are 0.44 which is above the HSV value of 0.30 for the
entire research construct, thereby confirming the existence of discriminant validity.
Table 7.17: Accuracy statistics analysis: Green advertising
Research construct Cronbach’s Test Factor
Loadings
C.R AVE Highest
Shared
Variance Item-
Total
α
Value
GA GA3 0.580
0.787
0.572
0.76
0.44
0.30 GA4 0.593 0.676
GA5 0.573 0.770
GA6 0.521 0.614
7.5.3 Internal consistency of reliability analysis: Green Product innovation
The results of the scale reliability tests shown in table 7.18 indicate item–to-total values
ranging from 0.556 to 0.578 and therefore these values were above the threshold of 0.5 (refer
to Table 7.10), thus accepted, according to the literature (Morar, Venter & Chuchu, 2015).
Item–to-total correlation values are required to be above 0.5 to ensure that there is convergent
validity and in the instance that certain item–to-total correlation values are below this
threshold, they should be removed. Due to the below acceptable threshold factor loading
scores of two items, they were removed and did not take part in the statistical analysis
process to ensure the study remains valid. These items were explicitly: GPI1 and GPI2. These
items had item–to-total correlation values of 0.462, and 0.467 which are evidently below 0.5
and therefore should not be analysed further to ensure statistical accuracy and significance
throughout the data analysis and interpretation procedure as well as to ensure that there is
convergent validity. The construct’s Cronbach’s alpha coefficient index 0.798 exceeded the
recommmended threshold of 0.7, as recommended by Du Plessis (2010); Bagozzi and Yi

188
(1988); Nunnally and Bernstein (1994), therefore these statistics confirm that the measures
used in this study are reliable.
Following the analysis of the Cronbach’s alpha coefficient, factor loadings (standardised
regression weights) of individual items on the construct GPI are shown in Table 7.17. The
individual item loading are all above the recommended 0.5, ranging from 0.588 to 0.731
(Anderson & Gerbing, 1988); the results of the factor loadings imply that all items converged
well on the construct they were supposed to measure and hence, confirmed the existence of
convergent validity. It should be notes that item GPI4 was deleted as it had a factor load of
0.498, meaning the item did not measure at least 50% of what it is supposed to measure, in
this case green product innovation. Internal consistency was also used to evaluate the
composite reliability (CR) index of the green product innovation construct. Using the
formulae presented in the previous section, the composite reliability was calculated and
tabulated in Table 7.18. The results in Table 7.18 indicate the CR index for GPI is 0.74,
thereby exceeding the estimate criteria used in literature. The construct GPI had an Average
Extracted Variance of 0.42 which is above the threshold recommended in literature and
therefore provides evidence for an acceptable level of research scale reliability (Fraering &
Minor, 2006; Hair et al., 2009). Additionally, Table 7.18 also shows that all the AVE value is
0.42 which is above the HSV value of 0.10 for the entire green product innovation construct,
thereby confirming the existence of discriminant validity. The results of scale reliability test
for the construct GPI is shown in Table 7.18.
Table 7.18: Accuracy statistics analysis: Green product innovation
Research
construct
Cronbach’s Test Factor
loadings
C.R AVE Highest
Shared
Variance Item-
Total
α
Value
GPI GPI3 0.557
0.798
0.588
0.74
0.42
0.10 GPI5 0.556 0.616
GPI6 0.578 0.651
GPI7 0.557 0.731
7.5.4 Internal consistency of reliability analysis: Green process innovation
The results of the scale reliability tests shown in table 7.11 indicate item–to-total values
ranging from 0.565 to 0.630 and therefore these values were above the threshold of 0.5 (refer
to Table 7.19), thus accepted, according to the literature (Morar, Venter & Chuchu, 2015).
Item–to-total correlation values are required to be above 0.5 to ensure that there is convergent

189
validity and in the instance that certain item–to-total correlation values are below this
threshold, they should be removed. Due to the below acceptable threshold factor loading
scores of one item, the item was removed and did not take part in the statistical analysis
process to ensure the study remains valid. This item is: GPRI4. The item had item–to-total
correlation values of 0.466 which are evidently below 0.5 and therefore should not be
analysed further to ensure statistical accuracy and significance throughout the data analysis
and interpretation procedure as well as to ensure that there is convergent validity. The
construct’s Cronbach’s alpha value of 0.763 exceeded the recommmended threshold of 0.7 as
recommended by Du Plessis (2010); Bagozzi and Yi (1988); Nunnally and Bernstein (1994),
therefore these statistics confirm that the measures used in this study are reliable.
Following the analysis of the Cronbach’s alpha coefficient, the individual loadings are all
above the recommended 0.5 (Anderson & Gerbin, 1988) indicating acceptable individual
item reliabilities as more than 50% of each item’s variance is shared with the construct. The
composite reliability for the construct GPRI was 0.76 which is above the recommended value
of 0.7 suggested by Holland (1999), thus indicating acceptable internal consistency and
reliability of the respective measures. The average variance extracted AVE was 0.52,
exceeding the recommended threshold of 0.4, hence providing evidence of acceptable levels
of research scale reliability (Fraering & Minor, 2006). Additionally, Table 7.19 also shows
that all the AVE values are 0.42 which is above the HSV value of 0.10 for the entire green
process innovation construct, thereby confirming the existence of discriminant validity. The
results of scale reliability test for the construct GPRI is shown in Table 7.19.
Table 7.19: Accuracy statistics analysis: Green process innovation
Research
construct
Cronbach’s Test Factor
Loading
C.R AVE Highest Shared
Variance
Item-
Total
α
Value
GPRI GPRI1 0.565
0.763
0.696
0.76
0.52
0.11 GPRI2 0.585 0.727
GPRI3 0.630 0.739
7.5.5 Internal consistency of reliability analysis: Competitive advantage
The results of the scale reliability tests shown in table 7.12 indicate item–to-total values
ranging from 0.523 to 0.693 and therefore these values were above the threshold of 0.5 (refer
to Table 7.12), thus accepted, according to the literature (Morar, Venter & Chuchu, 2015).
Item–to-total correlation values are required to be above 0.5 to ensure that there is convergent

190
validity and in the instance that certain item–to-total correlation values are below this
threshold, they should be removed. Due to the below acceptable threshold factor loading
scores of four items, they were removed and did not take part in the statistical analysis
process to ensure the study remains valid. These items were: CA1, CA2, CA3 and CA11.
These items had item–to-total correlation values of 0.377, 0.390, 0.380 and 0.427 which are
evidently below 0.5 and therefore should not be analysed further to ensure statistical accuracy
and significance throughout the data analysis and interpretation procedure as well as to
ensure that there is convergent validity. The construct’s Cronbach’s alpha value of 0.846
exceeded the recommmended threshold of 0.7 as recommended by Du Plessis (2010);
Bagozzi and Yi (1988); Nunnally and Bernstein (1994), therefore these statistics confirm that
the measures used in this study are reliable.
Following the analysis of the Cronbach’s alpha coefficient, factor loadings (standardised
regression weights) of individual items on the construct CA are shown in Table 7.12. The
individual item loading are all above the recommended 0.5, ranging from 0.603 to 0.711
(Anderson & Gerbing, 1988); the results of the factor loadings imply that all items converged
well on the construct they were supposed to measure and hence, confirmed the existence of
convergent validity. It is noted that item CA4 was deleted as it had a factor load of 0.482
meaning the item did not measure at least 50% of what it is supposed to measure, in this case
competitive advantage. Internal consistency was also used to evaluate the composite
reliability (CR) index of the competitive advantage construct. Using the formulae presented
in the previous section, the composite reliability was calculated and tabulated in Table 7.20.
The results in Table 7.20 indicate the CR index for CA is 0.86, thereby exceeding the estimate
criteria used in literature. The construct CA had an Average Extracted Variance of 0.52 which
is above the threshold recommended in literature and therefore provides evidence for an
acceptable level of research scale reliability (Fraering & Minor, 2006; Hair et al., 2009).
Additionally, Table 7.20 also shows that all the AVE value is 0.52 which is above the HSV
value of 0.02 for the competitive advantage construct, thereby confirming the existence of
discriminant validity. The results of scale reliability test for the construct CA is shown in
Table 7.20.

191
Table 7.20: Accuracy statistic analysis: Competitive advantage
Research
construct
Cronbach’s Test Factor
Loadings
C.R AVE Highest Shared
Variance
Item-
Total
α
Value
CA CA5 0.523
0.846
0.619
0.86
0.52
0.02 CA6 0.627 0.693
CA7 0.571 0.886
CA8 0.693 0.711
CA9 0.590 0.763
CA10 0.646 0.603
7.5.6 Internal consistency of reliability analysis: Business performance
Corrected item-total correlation for each item varied between 0.560 and 0.776 which means
each item is internally consistent with all other items. However, Item–to-total correlation
values are required to be above 0.5 to ensure that there is convergent validity and in the
instance that certain item–to-total correlation values are below this threshold, they should be
removed. Due to the below acceptable threshold factor loading scores of seven items, they
were removed and did not take part in the statistical analysis process to ensure the study
remains valid. These items were: BP1, BP2, BP3, BP4, BP5, BP6, and BP16. These items
had item–to-total correlation values of 0.199, 0.293, 0.487, 0.345, 0.435 0.357 and 0.359
which are evidently below 0.5 and therefore should not be analysed further to ensure
statistical accuracy and significance throughout the data analysis and interpretation procedure
as well as to ensure that there is convergent validity. Cronbach’s coefficient alpha and
composite reliability (C.R.) indexes were 0.856 and 0.88 respectively, therefore have good
internal consistency. A higher level of Cronbach’s coefficient alpha demonstrated a higher
reliability of the scale.
The Cronbach’s alpha coefficients and composite reliability (C.R.) values exceeded the
estimate criteria used by prior literature. Factor loadings (standardised regression weights) of
individual items on the construct BP are shown in Table 7.21. The individual item loading are
all above the recommended 0.5, ranging from 0.572 to 0.770 (Anderson & Gerbing, 1988);
the results of the factor loadings imply that all items converged well on the construct they
were supposed to measure and hence, confirmed the existence of convergent validity.
Additionally, the average variance extracted (AVE) value was 0.44, thus providing evidence
for acceptable levels of research scale reliability. Moreover, Table 7.21 also shows that all the

192
AVE value is 0.44 which is above the HSV value of 0.11 for the competitive advantage
construct, thereby confirming the existence of discriminant validity. The results of scale
reliability test for the construct BP is shown in Table 7.21.
Table 7.21: Accuracy statistic analysis: busineness performance
Research
construct
Cronbach’s Test Factor
Loadings
C.R AVE Highest Shared
Variance
Item-
Total
α
Value
BP BP7 0.540
0.856
0.560
0.88
0.44
0.11
BP8 0.571 0.647
BP9 0.581 0.627
BP10 0.530 0.523
BP11 0.546 0.634
BP12 0.623 0.720
BP13 0.662 0.776
BP14 0.589 0.719
BP15 0.598 0.748
7.6 Summary accuracy statistics for the model
The statistical measures of accuracy tests shown in Table 7.22 specify the different measures
that were used to assess the reliability and validity of the constructs for the study.
Table 7.22: Accuracy statistics analysis for the model
Research Construct Cronbach’s Test Factor
Loading
CR AVE Highest
shared
variance Item-Total α Value
GP GP1 0.690 0.806 0.850 0.83 0.56 0.32
GP2 0.676 0.828
GP3 0.536 0.585
GP4 0.672 0.688
GA GA3 0.580 0.787 0.572 0.76 0.44 0.30
GA4 0.593 0.676
GA5 0.573 0.770
GA6 0.521 0.614
GPI GPI3 0.557 0.798 0.588 0.74 0.42 0.10
GPI5 0.556 0.616
GPI6 0.578 0.651
GPI7 0.557 0.731
GPRI GPRI1 0.565 0.763 0.696 0.76 0.52 0.11
GPRI2 0.585 0.727
GPRI3 0.630 0.739
CA CA5 0.523 0.846 0.619 0.86 0.52 0.02
CA6 0.627 0.693
CA7 0.571 0.886

193
CA8 0.693 0.711
CA9 0.590 0.763
CA10 0.646 0.603
BP BP7 0.540 0.856 0.560 0.88 0.44 0.11
BP8 0.571 0.647
BP9 0.581 0.627
BP10 0.530 0.523
BP11 0.546 0.634
BP12 0.623 0.720
BP13 0.662 0.776
BP14 0.589 0.719
BP15 0.598 0.748 Note: GP=green packaging; GA=Green advertising; GPI=Green product innovation; GPRI= Green process innovation;
CA=Competitive advantage; BP=Business performance.
C.R= Composite Reliablity
A.V.E= Average Variance Extracted
* Scores: 1= Srongly Disagree; 2= Disagree; 3=Neutral; 4=Agree; 5 Strongly Agree
Significance level <0.05; ** significance level <0.01; *** significance level <0.001
Construct reliability of the research measures was examined by the computation of three
different methods, namely Cronbach’s alpha reliability test (Cronbach α), the composite
reliability test (CR) and the average value extracted (AVE) tests.
7.6.1 Cronbach’s coefficient alpha test
The Cronbach’s coefficient alpha was used to assess the internal consistency of each
construct employed in the study. The closer the co-efficient is to 1.00, the greater is the
internal consistency of the items in the scale (Malhotra 2010). All alpha values ranged from
0.763 to 0.856; they exceeded the recommended threshold of 7.0 suggesting that all the items
in the scale tap into the same underlying constructs (Hair et al., 2010). In addition, the item-
total correlation value lies between 0.521 and 0.693, which is above the cut-off point of 0.5 as
recommended by Anderson and Gerbing (1988). The higher inter-item correlations reveal
convergence among the measured items.
7.6.2 Composite reliability (CR)
The results of composite reliability are shown in Table 7.22. The results yielded CR indexes
between 0.74 and 0.88. The exhibited CR level exceeded the estimated criteria of greater than
0.70, which is recommended as adequate for internal consistency of the constructs (Nunnally
1978; Chin 1988), thus finding satisfactory support for the scales composite reliability.

194
7.6.3 Average variance extracted (AVE)
The AVE estimates in Table 7.22 reflected that the overall amount of variance in the
indicators was accounted for by the latent construct (Neuman, 2006). All AVE values were
above 0.4, thus acceptable (Fraering & Minor 2006). AVE values indicated indexes between
0.42 and 0.56. These results provided evidence for acceptable levels of research scale
reliability.
7.7 Validity analysis
To examine the validity of the latent constructs and corresponding measurements, convergent
validity and discriminant validity were used in this section.
7.7.1 Convergent validity
Item loadings for each corresponding research construct were above the recommended value
of 0.5 (Aldalaigan & Buttle 2002). As shown in Table 7.22, the item loadings ranged between
0.523 and 0.886, this means that the instruments loaded well on their respective constructs.
The results also indicate an acceptable individual item convergent validity as more than 50
percent of each item’s variance was shared with a respective construct. The results imply that
all items converged well on the construct they were supposed to measure and hence,
confirmed the existence of convergent validity
7.7.2 Discriminant validity: Correlation between constructs
One of the methods used to check the discriminant validity of the research constructs is the
evaluation of whether the correlations among latent constructs were less than 1.0. As
indicated in Table 7.23, the inter-correlation values for all paired latent variables are less than
1.0, therefore indicating the existence of discriminant validity. Respectively, the variables did
not present any problems of multicollinearity, such as a high correlation value greater than
0.89 (Brown & Cudeck, 1993). All correlations were below 0.8 and were therefore in
conformity with the recommended threshold, hence indicating discriminant validity (Fraering
& Minor, 2006). The study also used AVE as an alternative method to check discriminant
validity related to the correlation matrix (Nunnally & Bernstein, 1994).

195
Table 7.23: Inter-construct correlation matrix
Correlations
Research
Construct GP GA GPI GPRI CA BP
GP 1.000
GA .568**
1.000
GPI .435**
.547**
1.000
GPRI .320**
.346**
.317**
1.000
CA .180**
.085 -.022 .010 1.000
BP .324**
.260**
.300**
.328**
.128* 1.000
**. Correlation is significant at the 0.01 level (2-tailed).
*. Correlation is significant at the 0.05 level (2-tailed). Note: GP=green packaging; GA=Green advertising; GPI=Green product innovation; GPRI= Green process innovation;
CA=Competitive advantage; BP=Business performance.
The inter-construct correlations ranged between -0.022 (showing signs of discriminant
validity) and 568**
(indicating a fair level of convergent validity). Based on the inter-
construct correlation matrix, discriminant validity existed as a result of highly dissimilar
constructs.
7.7.3 Average Variance Extracted (AVE) and Shared Variance (SV)
Discriminant validity was also established by checking if the AVE was greater than the
highest shared variance value (SV) (Nusair & Hua, 2010). It is ideal if the Average Variance
Extracted (AVE) is greater than 0.4 for the construct to be considered reliable (Fraering &
Minor, 2006). Table 7.24 shows the AVE as well as the highest shared variance for all the
constructs.
Table 7.24: Construct AVE and HSV
Construct AVE Highest shared variance
GP 0.56 0.32
GA 0.44 0.30
GPI 0.42 0.10
GPRI 0.52 0.11
CA 0.52 0.02
BP 0.44 0.11

196
Table 7.24 shows that all the AVE values (0.56, 0.44, 0.42, 0.52, 0.52 and 0.44) are above the
SV values (0.32, 0.30, 0.10, 0.11, 0.02, and 0.11) respectively for all the research constructs,
thereby confirming the existence of discriminant validity.
7.8 STRUCTURAL EQUATION MODELLING
The current study employed structural equation modelling (SEM) for the purpose of
analysing data. Structural Equation modelling is a multivariate statistical framework that is
used for modelling complex relationships between directly and indirectly observed variables
(Stein, Morris & Nock, 2012). SEM is regarded as a comprehensive technique and has
become a favoured technique for researchers across disciplines (Byrne, 2012; Ngo & O’Cass,
2012). As observed by Marsh et al. (2012), the traditional multivariate study methods are not
capable of evaluating or correcting measurement error while SEM is capable of correcting
these errors prior to analysing data integrating endogenous and exogenous variables. SEM
employs a two-step process for its analysis - the confirmatory factor analysis and the path
modelling or the structural modelling (Yuan et al., 2010).
7.8.1 Conceptual model fit assessment
According to the two-step procedure (Anderson & Gerbing, 1998), prior to testing
hypotheses, confirmatory factor analysis (CFA) was performed essentially to develop and
specify the measurement model (Hair et al., 2010) and examine scale accuracy (including
reliability, convergent validity and discriminant validity) of the multiple item construct
measures using AMOS 25. Initial specification search led to the deletion of some of the items
in the construct scales in order to provide acceptable fit and consequential scale accuracy.
Testing for model fit is conducted to determine whether the conceptual model fits the
collected data.
Figure 7.8, is a diagrammatic representation of the CFA model. Latent variables are signified
by the circular or oval shape while observed variables are represented by the rectangular
shapes. Adjacent to the observed variables are measurement errors, which are represented by
circular shapes as well. The bi-directional arrows connote the relationship between latent
variables. Once the measurement model has been specified, its validity needs to be
determined, which depends on establishing acceptable levels of goodness-of-fit. Goodness-
of-fit specifies how well the particular model replicates the observed covariance matrix amid
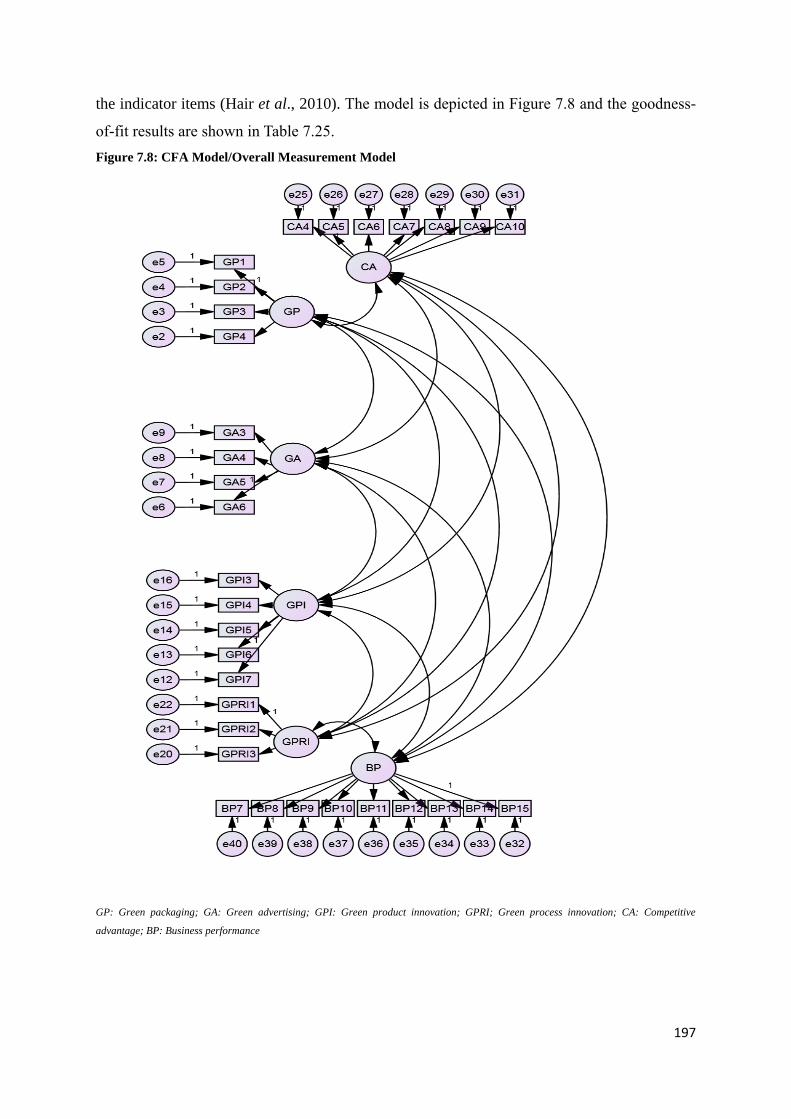
197
the indicator items (Hair et al., 2010). The model is depicted in Figure 7.8 and the goodness-
of-fit results are shown in Table 7.25.
Figure 7.8: CFA Model/Overall Measurement Model
GP: Green packaging; GA: Green advertising; GPI: Green product innovation; GPRI; Green process innovation; CA: Competitive
advantage; BP: Business performance

198
Conceptual model fit assessments
CFA was implemented to determine measures of accuracy of the measurement instruments
for the respective construct using AMOS Version 25.0. Table 7.25 indicates the results
pertaining to the conceptual model fit assessment which are discussed hereafter.
Table 7.25: Model fit results (CFA)
Model
Fit
criteria
CMIN (DF) Chisquare
(χ2 /DF)
(GFI) (IFI) (TLI) (CFI) RMSEA
Indicator
value
548.674 385 1.425 0.902 0.963 0.951 0.962 0.037
The results in Table 7.25 show the acceptable goodness-of-fit of the model as mentioned in
Section 6.14.2 of Chapter 6. In light of the aforementioned results, it could be suggested that
all the indicators are meeting the acceptable thresholds of equal or greater than 0.9 for GFI,
IFI, TLI, CFI and equal or less than 0.08 for RMSEA. All these measures confirm a robust
and acceptable model fit (Schreiber, Stage, King, Nora & Barlow 2006).
7.8.2 Structural Equation Modelling Analysis (SEM)
Since the acceptable confirmatory factor analysis measurement model fit was secured, the
study proceeded to the next stages of the analysis of the SEM model fit and the structural
model path analysis.
7.8.2.1 SEM model fit analysis
The measurement of model fit of this study was done using the following indices: chi-square
value over degree of freedom, NFI, IFI, TLI, CFI, and RMSEA as specified in Table 6.14 of
chapter 6. Table 7.26 reports the structural equation model fit results

199
Table 7.26: SEM model fit indexes
Fit Indices Acceptable threshold Study test results Decision
Chi-square
(CMIN/DF)
Tabled chi-square
smaller or equal to 3
1.688 Accepted
Increment fit index
(IFI)
Values greater than
0.90
0.946 Accepted
Tucker-Lewis index
(TLI)
Values greater than
0.90
0.925 Accepted
Comparative fit
index (CFI)
Values greater than
0.90
0.944 Accepted
Root mean square
error of
approximation
(RMSEA)
Less than 0.08 0.048 Accepted
In light of the results shown in Table 4.12, it could be suggested that all the indicators are
meeting the acceptable thresholds of equal to or greater than 0.9 for NFI, IFI, TLI, CFI and
equal to or less than 0.08 for RMSEA (Benteler, 1990; Browne & Cudeck, 1993; Marsh, Hau
& Wen, 2004). Therefore, it could be concluded that the data confirms and fits acceptability
of the model.
7.8.2.2 The structural model path analysis
The structural model path analysis involves the estimation of presumed causal relations
among observed variables (Garson 2008). In SEM, relationships between variables are
referred to as path coefficients and are depicted by single-headed arrows. The path diagram
for the model structure is reflected in Figure 7.9. Much like the CFA model, the circle or oval
shapes represent the latent variables while measurement items are represented by rectangles.
Adjacent to measurement items in circular shapes are measurement errors and the uni-
directional arrows between latent variables are used to convey the causal relations.

200
Figure 7.9: SEM path model structure
Note: Research structure model fit
χ 2 /df =1.688; IFI=0.946; TLI=0.925; CFI=0.944; RMSEA=0.048
Source: Calculated from research results (2018).
H1 (+)
β =-0.009
e42
e3
e9
e16
e5
e12
e4
e2
e6
e39
e38
e36
e32
BP
BP8
BP7
BP9
BP10
BP11
BP15
BP14
BP13
BP12
CA
GP
GPRI
GPI
GA
CA5
GP1
7
GP2
7
GP3
7
GP4
7
CA7
CA6
GA3
GA4
GA5
GA6
GPI3
GPI5
GPI6
GPI7
GPRI1
17
GPRI2
17
GPRI3
17
CA5
CA5
CA5
H1 (+)
β=0.231
H1 (+)
β =0.228
H1 (+)
β =0.274
H1 (+)
β
=0.232
e41
e8
e14
5
e15
e20
e21
e13
e7
e22
e40
e37
e35
e34
e33
H1 (+)
β =0.065
H1 (+)
β =0.188
H1 (+)
β =0.072
H1 (+)
β =0.103

201
Table 7.27: Hypothesised Relationships and Resulting Outcomes
Path / proposed hypothesis
relationship
Hypothesis Estimate P -
Value
Decision
rejected/supported
Green packaging (GA)
Competitive advantage (CA)
H1(+)
0.103
0.113
Supported, however, not
significant
Green advertising (GA)
Competitive advantage (CA)
H2(+)
0.072
0.270
Supported, however, not
significant
Green product innovation
(GPI)
Competitive advantage (CA)
H3(+)
0.188
0.010
Supported, however, not
significant
Green process innovation
(GPRI)
Competitive advantage (CA)
H4(+)
-0.009
0.895
Not supported and
Insignificant
Green packaing (GP)
Business performance (BP)
H5(+)
0.228
***
Supported and Significant
Green advertising (GA)
Business performance (BP)
H6(+)
0.065
0.298
Supported, however, not
significant
Competitive advantage (CA)
Business performance (BP)
H7(+)
0.231
***
Supported and Significant
Green product innovation
(GPI)
Business performance (BP)
H8(+)
0.232
***
Supported and Significant
Green process innovation
(GPRI)
Business performance (BP)
H9(+)
0.274
***
Supported and Significant
* Significance level <0.05; ** significance level <0.01; *** significance level <0.001

202
7.9 Hypotheses testing
These results affirmed the adequacy of the model and the model fit statistics show that the
proposed conceptual model converged well. This section provides results of the preliminary
formulated hypotheses developed out of the research hypotheses and objectives as specified
in Chapter 1. The study’s hypotheses were tested to evaluate the relationships between latent
variables. Table 7.27 represents the results elicited following the hypotheses test. They are
presented hereafter.
7.9.1 Green packaging and competitive advantage
The first hypothesis (H1) stated that green packaging has a positive impact on competitive
advantage. As a result of the survey, it emerged that green packaging positively impacts
competitive advantage, but has an insignificant influence on competitive advantage as
indicated by the path coefficient value of 0.103 and the p-value of 0.113. Therefore, the result
signals that the hypothesis is supported; however, the significance level is weak.
7.9.2 Green advertising and competitive advantage
With reference to the second hypothesis (H2), the study hypothesised that green advertising
has a positive impact on competitive advantage. As a result of the survey, it emerged that
green advertising positively impacts competitive advantage, but has an insignificant influence
on competitive advantage as indicated by the path coefficient value of 0.072 and the p-value
of 0.270. On the basis of the findings, H2 is supported, but is not significant.
7.9.3 Green product innovation and competitive advantage
The third hypothesis (H3) in the study stated that green product innovation has a positive
impact on competitive advantage. As a result of the survey, it emerged that green product
innovation positively impacts competitive advantage, but has an insignificant influence on
competitive advantage as indicated by the path coefficient value of 0.188 and the p-value of
0.010. Therefore, the result signals that the hypothesis is supported; however, the significance
level is weak.
7.9.4 Green process innovation and competitive advantage
The third hypothesis (H4) in the study stated that green process innovation has a positive
impact on competitive advantage. The results indicate that there was rather a negative impact
as indicated by the path coefficient value of -0.009 and the hypothesis was also statistically

203
insignificant as indicated by the p-value of 0.895. H4 is therefore not supported and
insignificant.
7.9.5 Green packaing and business performance
The fifth hypothesis (H5) stated that green packaging has a positive impact on business
performance. The relationship between green packing and business performance was
assessed and the finding revealed that there was a positive relationship between them, which
then supported the stated hypothesis. It means that the green packaing has a positive and
stronger impact on business performance. The strength of the relationship is reflected by the
path coefficient value of 0.228 at <0.001 showing a strong relationship. Based on the results,
it is clear that H5 is supported and is significant.
7.9.6 Green advertising and business performance
With reference to the sixth hypothesis (H6), the study hypothesised that green advertising has
a positive impact on business performance. As a result of the survey, it emerged that green
advertising positively impacts business performance, but has an insignificant influence on
business performance as indicated by the path coefficient value of 0.065 and the p-value of
0.298. On the basis of the findings, H2 is supported, but is not significant.
7.9.7 Competitive advantage and business performance
The seventh hypothesis (H7) in the study stated competitive advantage has a positive impact
on business performance. The relationship between competitive advantage and business
performance was assessed and the finding revealed that there was a positive relationship
between them, which then supported the stated hypothesis. It means that the competitive
advantage has a positive and stronger impact on business performance. The strength of the
relationship is reflected by the path coefficient value of 0.231 at <0.001 showing a strong
relationship. Based on the results, it is clear that H5 is supported and is significant.
7.9.8 Green product innovation and business performance
The eighth hypothesis (H8) in the study stated green product innovation has a positive impact
on business performance. The relationship between green product innovation and business
performance was assessed and the finding revealed that there was a positive relationship
between them, which then supported the stated hypothesis. It means that the green product
innovation has a positive and stronger impact on business performance. The strength of the

204
relationship is reflected by the path coefficient value of 0.232 at <0.001 showing a strong
relationship. Based on the results, this then provides support for H8.
7.9.9 Green process innovation and business performance
With reference to the ninth hypothesis (H9), the study hypothesised that green process
innovation has a positive impact on business performance. The relationship between green
process innovation and business performance was assessed and the finding revealed that there
was a positive relationship between them, which then supported the stated hypothesis. It
means that the green process innovation has a positive and stronger impact on business
performance. The strength of the relationship is reflected by the path coefficient value of
0.274 at <0.001 showing a strong relationship. Based on the results, it is clear that H9 is
supported and is significant.
7.10 Testing for Mediation Effect among Variables Using Smart Pls 3
The research conceptual framework utilised as part of this study made use of one mediating
variable that mediated the relationship between four predictor variables and one outcome
variable. This mediator variable is referred to as “competitive advatange”. The following
section presents the results for the mediation effect to determine whether the mediating
variable positively or negatively mediates the relationship between the independent variables
and dependent variables. Thus, was generated throught the ‘consistent PLS algorithm’ using
Smart PLS3.
Table 7.28: Path coefficient values of mediation effect
Specific Indirect
Effects
Green packaging -> Competitive advantage -> Business performance 0.132
Green advertising -> Competitive advantage -> Business
performance
0.026
Green product innovation -> Competitive advantage -> Business
performance
0.295
Green process innovation -> Competitive advantage -> Business
performance
0.182
Table 7.28 above highlights that the relationship between the independent variable ‘green
packaging’ and dependent variable ‘business performance’, mediated by ‘competitive
advantage’ produced a positive path coefficient value of 0.132. Therefore, the mediating
variable ‘competitive advantage’ in this instance positively mediates the relationship between

205
green packaging and business performance. As a result, it can be confirmed tha competitive
advantage mediates the relationship between green packaging and business performance.
Deducing from the above, H10 is supported.
Furtheremore, table 7.28 indicates the relationship between the ‘green advertising’ and
‘business performance’, mediated by ‘competitive advantage’ produced a positive path
coefficient value of 0.026. Therefore, the mediating variable ‘competitive advantage’ in this
instance positively mediates the connection between green advertising and business
performance. As a result, it can be confirmed tha competitive advantage mediates the
connection between green advertising and business performance. Drawing from the above,
H11 is supported.
In addition, table 7.28 indicates the relationship between the ‘green product innovation’ and
‘business performance’, mediated by ‘competitive advantage’ also produced a positive path
coefficient value of 0.295. Therefore, the mediating variable ‘competitive advantage’ in this
case positively mediates the association between green product innovation and business
performance. As a result, it can be confirmed that competitive advantage mediates the
association between green product innovation and business performance. Inferring from the
above, H11 is supported.
Lastly, table 7.28 above specifies that ‘green process innovation’ and ‘business performance’,
mediated by ‘competitive advantage’ has a path coefficient value of 0.182. This value is
positive and hence, it may be confirmed that competitive advantage does mediate the
relationship between green process innovation (predictor) and business performance
(outcome). Thus, H13 is supported.
7.10.1 Significance of the mediation effect
By means of the ‘consistent PLS bootstrapping’ the T-statistics and P-values were generated
to determine whether the mediating variable significantly mediates the relationship between
the independent predictor variables (green packaging, green advertising green product
innovation and green process innovation) and the dependent outcome variable (business
performance). The required thresholds, for both T-statistics and P-values, to indicate a
significant relationship are: T-value must be equal to or greater than 1.96 and P-value less
than 0.05 (Gye-Soo, 2016). Both T-value and P-value thresholds are required to meet
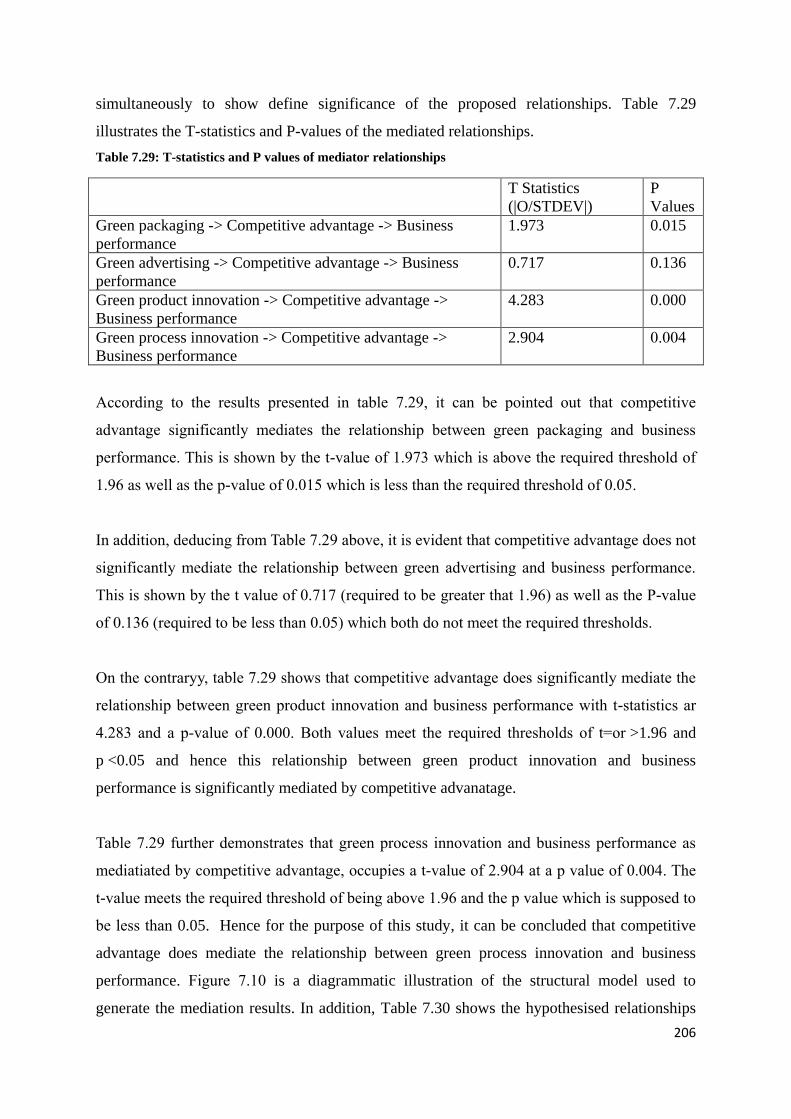
206
simultaneously to show define significance of the proposed relationships. Table 7.29
illustrates the T-statistics and P-values of the mediated relationships.
Table 7.29: T-statistics and P values of mediator relationships
T Statistics
(|O/STDEV|)
P
Values
Green packaging -> Competitive advantage -> Business
performance
1.973 0.015
Green advertising -> Competitive advantage -> Business
performance
0.717 0.136
Green product innovation -> Competitive advantage ->
Business performance
4.283 0.000
Green process innovation -> Competitive advantage ->
Business performance
2.904 0.004
According to the results presented in table 7.29, it can be pointed out that competitive
advantage significantly mediates the relationship between green packaging and business
performance. This is shown by the t-value of 1.973 which is above the required threshold of
1.96 as well as the p-value of 0.015 which is less than the required threshold of 0.05.
In addition, deducing from Table 7.29 above, it is evident that competitive advantage does not
significantly mediate the relationship between green advertising and business performance.
This is shown by the t value of 0.717 (required to be greater that 1.96) as well as the P-value
of 0.136 (required to be less than 0.05) which both do not meet the required thresholds.
On the contraryy, table 7.29 shows that competitive advantage does significantly mediate the
relationship between green product innovation and business performance with t-statistics ar
4.283 and a p-value of 0.000. Both values meet the required thresholds of t=or >1.96 and
p <0.05 and hence this relationship between green product innovation and business
performance is significantly mediated by competitive advanatage.
Table 7.29 further demonstrates that green process innovation and business performance as
mediatiated by competitive advantage, occupies a t-value of 2.904 at a p value of 0.004. The
t-value meets the required threshold of being above 1.96 and the p value which is supposed to
be less than 0.05. Hence for the purpose of this study, it can be concluded that competitive
advantage does mediate the relationship between green process innovation and business
performance. Figure 7.10 is a diagrammatic illustration of the structural model used to
generate the mediation results. In addition, Table 7.30 shows the hypothesised relationships

207
and resulting outcomes of the mediation effect.
Figure 7.10: Structural model diagram used to test for mediation
Table 7.30: Hypothesised Relationships and Resulting Outcomes of the mediation effect
Hypothesised relationship Hypothesis Path Coefficient
(specific indirect
effects)
T-
Statistic
Outcome
Green packaging -> Competitive
advantage -> Business performance
H10(+) 0.132 1.973 Supported and
Significant
Green advertising -> Competitive
advantage -> Business performance
H11(+) 0.026 0.717 Supported,
however, not
significant
Green process innovation ->
Competitive advantage -> Business
performance
H12(+) 0.295 4.283 Supported and
Significant
Green product innovation ->
Competitive advantage -> Business
performance
H13(+) 0.182 2.904 Supported and
Significant

208
7.11 Summary of the chapter
The chapter started with the description of the demographic profile of the respondents,
descriptive statistics of the individual variables was discussed with their respective mean and
standard deviation values. The measurement instrument of the confirmatory factor analysis
(CFA) through reliability and validity of the study was presented. The test for the reliability
comprised the Cronbach alpha, the composite reliability, as well as the average variance
extracted. The validity was assessed through the convergent and discriminant validity. The
determination of the model fit was then evaluated for confirmation through the application of
thresholds and indices to conclude that the collected data fit the model. It was then followed
with the structural model fit testing, using the various indices to determine the model fit for
the structural analysis. The determination of the structural model fit was followed with a
summary of the first nine hypothesised relationships − subject to how they were stated or
how they were represented in the study's conceptual model. Specifically, eight out of the nine
hypotheses stated supported the study while one rejected the stated hypotheses. At their
respective significant levels, four of the relationships were significant while five were not.
Furtheremore, hypothesis ten, eleven, twelve and thirteen were also supported as the
mediation results indicated that competitive advantage positively and significantly mediates
the relationship between green packaging and business performance, green product
innovation and business performance and green process innovation and business
performance. It was also found out that, althougth competitive advantage positively mediated
the relationship between competitive advantage and business performance, it does not
significantly mediate the relationship between green advertising and business performance.
The next chapter discusses the findings of the results obtained in this chapter.

209
8 CHAPTER 8: DISCUSSION OF EMPIRICAL FINDINGS
8.1 Introduction
The previous chapter presented the empiral results that were gathered from the analysis of the
data collected from selected SMEs in the Gauteng Province of South Africa. This chapter
synthesises the findings from the field research and data analysis to engage in a critical
discussion of the results of the study. The chapter discusses the findings of each hypothesised
relationship. All the proposed hypotheses are discussed, based on the findings obtained from
the hypothesis testing. The results obtained in this study are compared with other findings
from empirical prior research and they are also discussed in line with existing literature.
8.2 Discussion of findings from the conceptual model
In the following section is the discussion of results that arose from testing the research’s
formulated hypotheses. The main findings are presented in Table 8.1, as shown by the
hypotheses.
Table 8.1: Results of the hypothesised relationships
Hypothesis Results
H1 Green packaging has a positive impact on competitive advantage Supported
H2 Green advertising has a positive impact on competitive advantage Supported
H3 Green product innovation has a positive impact on competitive advantage Supported
H4 Green process innovation has a positive impact on competitive advantage Not supported
H5 Green packaging has a positive impact on business performance Supported
H6 Green advertising has a positive impact on business performance Supported
H7 Competitive advantage has a positive impact on business performance Supported
H8 Green product innovation has a positive impact on business performance Supported
H9 Green process innovation has a positive impact on business performance Supported
H10 Competitive advantage positively mediates the relationship between green
packaging and business performance
Supported
H11 Competitive advantage positively mediates the relationship green advertising and
business performance
Supported
H12 Competitive advantage positively mediates the relationship green product
innovation and business performance
Supported
H13 Competitive advantage positively mediates the relationship green process
innovation and business performance
Supported

210
Basing on the results in Table 8.1, the findings for each of the tested hypotheses are
discussed.
8.2.1 Green packaging and competitive advantage
The association between green packaging and competitive advantage was found to be
positive. The results of this study are also consistent with the empirical evidence from
Mwaura, Letting, Ithinji and Orwa (2016), who determined the effect of green distribution
practices on the competitiveness of food manufacturing firms in Kenya. Their findings
revealed thar green packaging as one of the green distribution practices positively and
significantly influences the competitiveness of Kenya’s food manufacturing firms. The
findings obtained in this study are in line with literature, where Nikitaeva (2012) contended
that green packaging should not be considered only as a tool of gaining a competitive
advantage and satisfying the needs of customers, but also as a tool to help reduce production
expenses.
8.2.2 Green advertising and competitive advantage
The testing of the relationship between green advertising and competitive advantage revealed
a positive relationship. These findings are in line with studies by Jarin (2014) who conducted
a study which aimed at investigating ecological marketing practices for creating competitive
advantage. Jarin (2014) revealed that eco-advertising or green advertising as an ecological
marketing practice creates scope for attaining competitive advantage within an organisation.
The findings obtained in this study are in line with literature, where Synodinos (2013) as well
as Synodinos, Bevan-Dye and De Klerk (2013:19) clarify that “green advertising can be used
as an effective tool in an organizations overall environmental marketing strategy and this,
ultimately, translates into a competitive advantage”.
8.2.3 Green product innovation and competitive advantage
The statistical analysis exposed that green product innovation has a positive impact on
competitive advantage. This finding has ample support from previous empirical research
studies such as that conducted by Chen, Lai and Wen (2006) who conducted a study which
focused on the positive effect of green intellectual capital on competitive advantages of firms.
The results of their study revealed that green product innovations are positively associated
with the competitive advantage of firms. The result obtained from testing this hypothesis is
also in agreement with a survey conducted by Van den Berg, Labuschagne, and Van den Berg
(2013) who investigated the effect of greening the supplier and innovation on environmental
performance and competitive advantage. The research found out that green product

211
innovation had a significant relation to environmental performance and competitive
advantage.
8.2.4 Green process innovation and competitive advantage
The association between green process innovation and competitive advantage was found to
be negative, meaning that the outcome of this study reinforces a negative association between
green process innovation and competitive advantage. Alsughayir (2017) postulates that this
could be due to the fact that the utilisation of green process innovation is still relatively new
for chemical industrial firms and green innovation investments in general are long term
investments which in time, will have more effect on firms’ competitive advantage. Also,
firms dealing with green process innovation normally start taking baby steps, easing their
way to green process innovation gradually to avoid any shocks and major changes to their
operation (Alsughayir, 2017). It is also imperative to note that the results of this study
contradict the findings of Küçükoğlu and Pınar (2015) who found that green process
innovation had a positive and a significant effect on a company's competitive
advantage. Moreover, the results obtained in this study are in line with literature, for instance,
Wahid and Lee (2011) assert that a firm’s implementation of green process innovation is
positively related to its corporate competitive advantage.
8.2.5 Green packaging and business performance
Empirical evidence was also found in this research which confirmed that there is a positive
association between green packaging and business performance. This finding substantiates
the fact that green packaging does impact the business performance of a manufacting SME.
This further extends the findings of previous studies conducted by Sambu (2016) whose
results indicated that green packaging is a key determinant of business performance in the
manufacturing firms of Kenya. Furthermore, the result obtained from testing this hypothesis
is also coherent with a survey conducted by Diab, AL-Bourini and Abu-Rumman (2015)
which supports a positive relationship between green packaging and business performance.
The study confirmed that there is a positive impact of eco-packaging on organisational
performance. Moreover, findings obtained from this study are in line with literature where
Zailani, et al. (2015) emphasise that manufacturing firms need to consider giving due
diligence on the eco-efficiency practices as a means of increasing the adoption of sustainable
packaging in order to achieve higher performance.

212
8.2.6 Green advertising and business performance
The findings of this study authenticate the existence of a positive connection between green
advertising and performance. The results obtained in the current study are not without
empirical support. Bhat, Darzi and Parrey (2014) conducted a study that gives a basic
conceptual framework of green marketing as a driver to sustainable development. Bhat, Darzi
and Parrey (2014) suggested that companies need to identify a unique segment of the market
(niche market) which is enriched by green consumerism and then should target this segment
using green marketing tools, such as green or eco-advertisements in order to achieve
sustainable business performance. The results obtained in this study are in accord with
literature; Nyilasy, Gangadharbatla and Paladino (2013) suggest that green advertising is
conducive to good business results. In addition, Rolland and Bazzoni (2009), as well as
D’Souza, (2005) point out that green advertising exhibits environmental commitment of
companies which enables them to compete in the market.
8.2.7 Competitive advantage and business performance
Deducing from the presentation of the results, it was found out that competitive advantage
provides a positive impact on business performance. The results of this study are consistent
with the empirical evidence from Mohebi and Farzollahzade (2014) who conducted a study
which focused on improving competitive advantage and business performance of SMEs by
creating entrepreneurial social competence. The results of the study revealed that competitive
advantage has a positive effect on the SME’s business performance. Furtheremore, the results
obtained in this study are in line with literature, where Gaya et al. (2013:2051) state that “the
resource-based view links superior business performance to the ownership and control of
unique competitive resources that create a source of sustainable competitive advantage for
businesses”. Moreover, the results of this study are also consistent with the empirical
evidence from Ismail, Rose, Abdullah and Uli (2010), which found a positive, as well as a
significant relationship, between competitive advantage and performance.
8.2.8 Green product innovation and business performance
Deducing from the findings presented in chapter 7, it was found that green product
innovation has a positive impact on business performance. The results coincide with the
works of Shapfi (2015) who assessed the influence of green product innovation toward
business performance in any selected industry; Shapfi’s study results indicated that green
product innovation had influence on the business performance. In addition, these are in line
with Alhadid and As’ad (2014) who conducted a study which aimed at determining the

213
impact of green innovation on organisational performance and based on the findings of
statistical analysis, green product innovation had a positive impact on organisational
performance. Furthermore, the results are also in accord with the works of Alsighayir (2017)
who investigated the impact of green product innovation on firms’ performance. Alsighayir’s
results showed that that green product innovation has a statistically significant impact on
firms’ performance. Furthermore, the findings obtained in this study coincide with the works
of Ilker (2012) who studied the gap between green product innovation and firm performance.
Ilker constructed a model to link the aforementioned constructs, and data collected through a
questionnaire-based survey across 140 Turkish manufacturing firms from various sectors,
which were then analysed using structural equation modelling. That study showed that green
product innovation generally has a positive effect on firm performance. The result obtained
from testing this hypothesis is also coherent with a survey conducted by Cainelli et al. (2015)
which claims that green product innovation activities have a positive impact on performance.
Furthermore, a study done by Chuang and Yang (2014) concluded that green product
innovation is considered as one of the key factors for improving firms’ environmental, social
and financial outcomes. Moreover, when firms have commitments to environmental
management with active green innovation, it can enhance the overall productivity and
performance (Chen et al., 2011).
8.2.9 Green process innovation and business performance
Drawing from the presentation of the results, it was found that green process innovation
produces a positive impact on business performance. The results obtained in this study are in
accord with a study conducted by Alhadid and As’ad (2014) who investigated the impact of
green innovation on organisational performance and found that green process innovation has
a significant and positive impact on the organisational performance. In a similar vein,
Oliveira Brasil, de Abreu, da Silva Filho and Leocádio (2016) investigated the relationship
between process eco-innovation (green process innovation) and business performance and
found that there is a positive relationship between process eco-innovation and business
performance. Moreover, the results obtained are also consistant with the works of Zahari and
Ramaya (2017) who examined the nexus between green innovation and firm performance in
view of an ecological modernisation perspective and found that the adoption of green process
innovation positively affects the firm’s economic performance.
214
8.2.10 Green packaging, competitive advantage and business performance
In this study, competitive advantage was incorporated as a possible mediating variable
between green packaging and business performance. A positive and a significant mediation
effect of competitive advantage were also found on the relationship between green packaging
and business performance. The findings illustrate the importance of competitive advantage as
a conduit in enhancing the relationship between green packaging and the business
performance of manufacturing SMEs. This links well with the resource based view (RBT) of
the firm which postulates that resources within the firm are associated with the firm’s
competitive advantage (Barney, 1991). Competitive advantage is not dependent on natural
resources, technology or economies of scale, but on the valuable, rare and hard to imitate
resources that reside within the firm. The ability of the firm to develop and utilize these
resources can equip it with the needed tools to most effectively direct the firm. In conclusion,
this study has suggested that green packaing and competitive advantage play a fundamental
role in enhancing business performance. As noted by Jahanshahi et al. (2015) that in order for
small business to survive the ever-changing and dynamic market place of today, they must
create and sustain competitive advantage, as by doing so, they can dramatically improve their
economic value. The results of this study do not reject the assumption that competitive
advantage does mediate the link between green packaging and business performance. In fact,
all the tests indicate that some mediation does actually exist. The results are in agreement
with literature, for instance, a study conducted by Gajanan (2015) which focused on
sustainable marketing practices for gaining competitive advantage, revealed that ecological
packaging assists a business in achieving competitive advantage.
8.2.11 Green advertising, competitive advantage and business performance
Deducing from the findings presented in chapter 7, it was found that competitive advantage
positively mediates the relationship between green advertising and business performance.
One should mention though that empirical evidence as well as literature supporting this
mediation effect is still in its infancy hence this study fills the gap and adds to the existing
body of knowledge about this mediating relationship. As advertising is part of a firms’
market orientation, a closely related study is the one conducted by Vazquez, et al. (2010)
which points out market orientation as a variable mediated by competitive advantage to
improve company performance.
215
8.2.12 Green product innovation, competitive advantage and business
performance
The inspection of the relationship between green product innovation and business
performance being mediated by competitive advantage exposed a positive relationship.
Interestingly, the result shows that green product innovation affects business performance
through competitive advantage. In other words, the relationship has good magnitude and is
significant due to the mediation role of competitive advantage. In summary, based on the
present study’s results, the influence of green product innovation on business performance is
better understood through the mediational role of competitive advantage. Hence, that is why
H12 was supported. In this case, the result demonstrates that SMEs’ ability to attract, retain
more customers and deal with competition, lead to improvements in product innovations, and
consequently to achieving higher business performance. This seems to indicate that business
performance depends on green product innovation when firms have a competitive edge. It is
however vital to indicate that there are paucities in literature supporting this mediation effect,
hence this was worth the interrogation, as this study fills this lacuna and adds to the existing
body of knowledge about this mediating relationship. A close related study is the one
conducted by Anwar (2018) which examined the importance of business innovation in SME
performance and the mediating role of competitive advantage. Competitive advantage
partially mediated the relationship between business innovation and SME performance.
8.2.13 Green process innovation, competitive advantage and business
performance
The inspection of the relationship between green process innovation and business
performance being mediated by competitive advantage exposed a positive relationship. It is
however, vital to indicate that there are gaps in literature supporting this mediation effect,
hence this was worth the interrogation as this study fills this lacuna and adds to the existing
body of knowledge about this mediating relationship. A closely related study is the one
conducted by Rodriquez-Gutierrez et al. (2015) which found that innovativeness became a
subject of great interest within small business academic literature and was often associated
with achieving and maintaining competitive advantage and business performance.
8.3 Chapter summary
The current chapter discussed analyses and interpretation of the data, giving empirically
derived observations in each case. Nevertheless, it is necessary to give a more detailed
discussion of what can be concluded from the findings of the study as well as any

216
implications and connotations associated with the findings discussed in the current chapter.
This is discussed in the following chapter (chapter 9), which presents the conclusions;
recommendations; limitations and implications for further research and suggestions for future
research direction.

217
9 CHAPTER 9: CONCLUSION, RECOMMENDATIONS AND
FUTURE RESEARCH SUGGESTIONS
9.1 Introduction
The previous chapter provided the analysis, discussions and interpretations of the empirical
findings. This chapter reviews the research undertaken in this thesis and attempts to tie the
threads together to present a conclusion to the thesis. It revisits all key stages in this study to
present a summery of the overall research and the chapter provides a general overview of the
study by placing the theoretical and empirical objectives into context. The purpose of the
study was to determine the impact of green marketing practices on competitive advantage and
business performance among manufacturing small and medium enterprises (SMEs) in South
Africa. Arising from the theory and the empirical study, recommendations are made for SME
managers. It concludes with the benefits, limitations and implications for future research.
9.2 Overview of the Study
In order to draw the relevant recommendations and conclusion on this study, it is important to
have an overview of the nine chapters that were covered in the study Chapter one introduced
the study and provided a brief overview of the study background. Chapter two covered the
context, while chapter three covered theoretical grounding for the study. Chapter four focused
on empirical literature related to the study. In chapter five, the conceptual model and a set of
critical hypotheses for the study were formulated for further emipirical examination. In
Chapter six, the research methodology employed in the study was discussed. In Chapter
seven, the statistical analysis and survey results obtained from the data collected were
presented. Chapter eight discussed research findings in view of the extant literature. Chapter
nine concludes the study.
9.3 THE EVALUATION OF THE OBJECTIVES OF THE STUDY
All research objectives had to be addressed based on the generated data from the study to
ensure that the intended purposes of the study were achieved. The theoretical and empirical
objectives are revisited in the next section in order to demonstrate the attainment of the
objectives within the framework of the study.

218
9.3.1 Primary objective
The purpose of this study was to determine the impact of green marketing practices on
competitive advantage and business performance among manufacturing small and medium
enterprises (SMEs) in South Africa. Each of the objectives as identified in Chapter 1 is stated,
after which the research results are summarised.
9.3.2 Theoretical objectives
The theoretical objectives as set out in Chapter 1 under Section 1.3.1, are outlined and
reviewed. For SME managers and researchers to make informed decisions and derive value
from this study, all research objectives were addressed based on the data generated from the
survey in order to ensure that the initial purposes of the study were achieved.
9.3.2.1 To review the literature on resource advantage theory of
competition
To achieve the first objective, the resource advantage theory of competitionwas reviewed in
Section 3.1 of chapter 3. This theory argued that the value of a resource to a firm is seen in
terms of its potential to yield competitive advantage. A combination of academic journal
articles, textbooks and other literature sources were useful to the researcher when merging
information on this theory.
9.3.2.2 To review the literature on natural resource-based view theory
This objective was achieved under Section 3.2 of Chapter 3, where the natural resource-based
view theory was reviewed. It was proposed that the natural resource-based view of the firm is
a new theory, based upon the firm's relationship to the natural environment. It is composed of
three interrelated strategies -- pollution prevention, product stewardship, and sustainable
development.
9.3.2.3 To review the literature on resource-based view model
In the accomplishment of theoretical objective 3, an extensive literature review was
undertaken to comprehensively understand a managerial framework used to determine the
strategic resources with the potential to deliver comparative advantage to a firm. This was
achieved by reviewing the resource-based view model. A combination of academic journal
articles, textbooks and other literature sources were useful to the researcher when merging
information on the resource-based view model in Section 3.3 of chapter 3.

219
9.3.2.4 To review the literature on the balanced scorecard theory
This objective was achieved under Section 3.4 of Chapter 3 where the balanced scorecard
theory was reviewed. It was found that a balanced scorecard theory is a performance theory
used in management to identify and improve various internal functions of a business and their
resulting external outcomes.
9.3.2.5 To review the literature on the stakeholder theory
In the achievement of theoretical objective 5, an extensive literature review was undertaken
to comprehensively understand the stakeholder theory. It was found that the Stakeholder
theory states that the purpose of a business is to create value for stakeholders, not just
shareholders. The stakeholder theory has a very tight connection with social responsibilities,
which means that the corporations’ social value is concerned and it focuses on promoting the
potential of all participants. A combination of academic journal articles, textbooks and other
literature sources were useful to the researcher when merging information on the resource-
based view model in Section 3.5 of chapter 3.
9.3.2.6 To review the literature on Porter's five forces model
In the achievement of theoretical objective 6, an extensive literature review was undertaken
to comprehensively understand the framework that is a tool for analysing competition of a
business. This was achieved by reviewing Porter's five forces model. A combination of
academic journal articles, textbooks and other literature sources were useful to the researcher
when merging information on the resource-based view model in Section 3.6 of chapter 3.
9.3.2.7 To review the literature on green packaging
This objective was covered under Section 4.4 of Chapter 4. The section explained the concept
of green packing and it also focused on the green packaging process with special emphasis to
the 4 Rs (reuse, reduce, recycle and refill).
9.3.2.8 To review the literature on green advertising
This theoretical objective was dealt with under Section 4.5 of Chapter 4. The section
explained what is meant by green advertising and it also focused on the intention of green
advertising.
220
9.3.2.9 To review the literature green product innovation
This theoretical objective was dealt with under Section 4.6.1 of Chapter 4. The section
explained what is meant by green product innovation.
9.3.2.10 To review the literature on green process innovation
This theoretical objective was dealt with under Section 4.6.2 of Chapter 4. The section
explained what is meant by green process innovation.
9.3.2.11 To review the literature on competitive advantage
This theoretical objective was dealt with under Section 4.7 of Chapter 4. The section
explained what is meant by competitive advantage and it also focused on the concept of
competitive advantage, perspectives of competitive advantage and sources of competitive
advantage.
9.3.2.12 To review the literature on business performance
This theoretical objective was dealt with under Section 4.8 of Chapter 4. The section
explained what is meant by business performance and it also focused on why business
performance is measured and the objective as well as the subjective measures of business
performance.
9.3.3 Empirical objectives
The empirical objectives, as set out in Chapter 1 Section 1.3.2 of this study, are revisited in
the next section.
9.3.3.1 To determine the impact of green packaging on competitive
advantage
The first empirical objective set out in Chapter 1 was to determine whether green packaging
positively impacts competitive advantage. SEM was used to determine whether green
packaging positively impacts competitive advanatage (refer to Table 7.19). The results of the
structural equation model analysis revealed that green packaging positively impacts
competitive advantage, but has an insignificant impact on competive advantage as indicated
by a P-Value of 0.113.

221
9.3.3.2 To ascertain impact of green advertising on competitive advantage
The second empirical objective set out in Chapter 1 was to determine whether green
advertising positively impacts competitive advantage. SEM was used to determine whether
green advertising positively impacts competitive advanatage (refer to Table 7.19). The results
of rge structural equation model analysis revealed that green advertising positively impacts
competitive advantage but has an insignificant impact on competitive advantage as indicated
by a path coefficient value of 0.072 and a P-Value of 0.270.
9.3.3.3 To assess the impact of green product innovation on competitive
advantage
The second empirical objective set out in Chapter 1 was to determine whether green product
innovation positively impacts competitive advantage. SEM was used to determine whether
green product innovation positively impacts competitive advanatage (refer to Table 7.19).
The results of the structural equation model analysis revealed that green product innovation
positively impacts competitive advantage but has an insignificant impact on competitive
advantage as indicated by a path coefficient value of 0.188 and a P-Value of 0.010.
9.3.3.4 To determine the impact of green process innovation on competitive
advantage
The fourth empirical objective formulated in Chapter 1 was to ascertain whether the green
process innovation positively impacts competitive advantage. As with the fourth empirical
objective, the relationship was also confirmed using SEM (refer to Table 7.19). Results of the
structural equation model analysis revealed that green process innovation has a negative and
insignificant impact on competitive advantage. The empirical findings confirmed the
existence of an insignificant P value of (-0.009) and a negative (path coefficient of 0.895)
linear relationship between green process innovation and and competitive advanatge. This
therefore means that the hypothesis is insignificant and not supported.
9.3.3.5 To examine the impact of green packaging on business
performance
The fifth empirical objective formulated in Chapter 1 was to ascertain whether the green
packaging positively impacts business performance. As with the fifth empirical objective, the
relationship was also confirmed using SEM (refer to Table 7.19). Results of the structural
equation model analysis revealed that green packaging has a significant positive influence on
business performance. The empirical findings confirmed the existence of a significant (*** -

222
p-value less than 0.001) and positive (path coefficient of 0.228) linear relationship between
green packing and business performance. This therefore means that the hypothesis is
significant and supported.
9.3.3.6 To assess the impact of green advertising on business performance
The second empirical objective set out in Chapter 1 was to determine whether green
advertising positively impacts business performance. SEM was used to determine whether
green advertising positively impacts business performance (refer to Table 7.19). The results
of the structural equation model analysis revealed that green advertising positively impacts
business performance but has an insignificant impact on business performance as indicated
by a path coefficient value of 0.065 and a P-Value of 0.298.
9.3.3.7 To determine the impact of competitive advantage on business
performance
The seventh empirical objective formulated in Chapter 1 was to ascertain whether the
competitive advantage positively impacts business performance. As with the seventh
empirical objective, the relationship was also confirmed using SEM (refer to Table 7.19). The
results of the structural equation model analysis revealed that competitive advantage has a
significant positive influence on business performance. The empirical findings confirmed the
existence of a significant (*** - p-value less than 0.001) and positive (path coefficient of
0.231) linear elationship between competitive advantage and business performance. This
therefore means that the hypothesis is significant and supported.
9.3.3.8 To examine the impact of green product innovation on business
performance
The eighth empirical objective formulated in Chapter 1 was to ascertain whether green
product innovation positively impacts business performance. As with the eighth empirical
objective, the relationship was also confirmed using SEM (refer to Table 7.19). The results of
the structural equation model analysis revealed that green product innovation has a significant
positive impact business performance. The empirical findings confirmed the existence of a
significant (*** - p-value less than 0.001) and positive (path coefficient of 0.32) linear
relationship between green product innovation and business performance. This therefore
means that the hypothesis is significant and supported.

223
9.3.3.9 To ascertain impact of green process innovation on business
performance
The ninth empirical objective formulated in Chapter 1 was to ascertain whether green process
innovation positively impacts business performance. As with the eighth empirical objective,
the relationship was also confirmed using SEM (refer to Table 7.19). The results of the
structural equation model analysis revealed that green process innovation has a significant
positive impact business performance. The empirical findings confirmed the existence of a
significant (*** - p-value less than 0.001) and positive (path coefficient of 0.274) linear
relationship between green process innovation and business performance. This therefore
means that the hypothesis is significant and supported.
9.3.3.10 To examine the mediating impact of competitive advantage on the
relationship between green packaging and business performance
The tenth empirical objective formulated in Chapter 1 was to ascertain whether competitive
advantage positively mediates the the relationship between green packaging and business
performance. As with the nineth empirical objective, the relationship was confirmed using the
consistant PLS bootrapping technique of the partial least squares structural equation
modelling (PLS-SEM) (refer to table 7.22). The mediation analysis results revealed that
competitive advantage positively and significantly mediates the relationship between green
packaging and business performance. The empirical findings confirmed the existence of
positive (path coefficient of 0.132) and a significant t-statistic value of 1.973. This therefore
means that the hypothesis is significant and supported.
9.3.3.11 To assess the mediating impact of competitive advantage on the
relationship between green advertising and business performance
The eleventh empirical objective formulated in Chapter 1 was to ascertain whether
competitive advantage positively mediates the the relationship between green advertising and
business performance. As with the thirteenth empirical objective, the relationship was
confirmed using the consistant PLS bootrapping technique of the partial least squares
structural equation modelling (PLS-SEM) (refer to table 7.22). The mediation analysis
results revealed that competitive advantage positively and significantly mediates the
relationship between green advertising and business performance. The empirical findings
confirmed the existence of positive (path coefficient of 0.026) and an insignificant t-statistic
value of 0.717. This therefore means that the hypothesis is supported, however its
significance level is week.
224
9.3.3.12 To determine the mediating impact of competitive advantage on the
relationship between green product innovation and business
performance
The twelfth empirical objective formulated in Chapter 1 was to ascertain whether competitive
advantage positively mediates the relationship between green product innovation and
business performance. As with the thirteenth empirical objective, the relationship was
confirmed using of the consistant PLS bootrapping technique of the partial least squares
structural equation modelling (PLS-SEM) (refer to table 7.22). The mediation analysis
results revealed that competitive advantage positively and significantly mediates the
relationship between green product innovation and business performance. The empirical
findings confirmed the existence of positive (path coefficient of 0.295) and a significant t-
statistic value of 4.283. This therefore means that the hypothesis is significant and supported.
9.3.3.13 To ascertain the mediating impact of competitive advantage on the
relationship between green process innovation and business
performance
The thirteenth empirical objective formulated in Chapter 1 was to ascertain whether
competitive advantage positively mediates the relationship between green process innovation
and business performance. As with the twelfth empirical objective, the relationship was
confirmed using the consistant PLS bootrapping technique of the partial least squares
structural equation modelling (PLS-SEM) (refer to table 7.22). The mediation analysis
results revealed that competitive advantage positively and significantly mediates the
relationship between green process innovation and business performance. The empirical
findings confirmed the existence of positive (path coefficient of 0.182) and a significant t-
statistic value of 2.904. This therefore means that the hypothesis is significant and supported.
9.4 Implications of the study
The following section discusses the implications of the study, based on the results which
which were obtained in chapter 7.
9.4.1 Implications based on green packaging and competitive advantage
It was found in this study that green packaging positively influenced competitive advantage.
The implication of the results to the practice is that green packaging is a worthwhile strategy
to which the management should be committed in order to gain competitive advantage in a

225
competitive industry with a changing dynamic marketing environment. The findings will
therefore assist the marketing managers to convince the senior management and business
owners on green marketing issues to be implemented, specifically, green packaging.
9.4.2 Implications based on green advertising and competitive advantage
It was also discovered in this study that green packaging positively impacts competitive
advantage. The implication of the results to the practice is that they suggest the existence of
beneficial as well as detrimental effects of green advertising in publicising information
related to organisational efforts on environmental protection. Specifically, this study shows
the substantive value of green advertising when manufacturing SMEs implement green
marketing practices. Marketing managers may therefore consider the pursuit of green
advertising to publicise their environmental commitment and efforts. Ultimately, this will
give an SME a competitive advantage in comparison to those that do not practice green
advertising.
9.4.3 Implications based on green product innovation and competitive
advantage
The research results confirmed that the relationship between green product innovation and
competitive advantage was positive. The results implied that in a highly competitive market,
obviously implementing green product innovation is necessary in order to differentiate a
firm’s product and to achieve competitive advantage. However, the findings of this study
suggest that firms should first understand consumers’ requirements, and then align green
product innovation initiatives with consumers’ values. In today’s green conscious market,
consumers will consider purchasing products that are les harmful to the environment.
Consumers also want products to be produced in the most environmentally friendly ways.
Thus, the success of a manufacturing SME’s green product innovation is dependent on its
appreciation of market demand as well as sustainable business operations.
9.4.4 Implications based on green process innovation and competitive
advantage
The research results confirmed that the relationship between green process innovation and
competitive advantage was negative and not significant. This implies that green process
innovation has no impact on the competitive advantage. This might be due to the fact that it
takes a lot of time amd money to invest in green process innovation, especially taking into

226
account that small and medium enterprises function at a small scale with insufficient financial
resources able to take on a pioneer role in the practice of green process innovation.
9.4.5 Implications based on green packaging and business performance
The empirical study revealed that green packing has a positive and a significant impact on
business performance. The implication of the results to the practice is that manufacturing
SMEs need to be encouraged to practice green packaging since it has a positive significant
impact on business performance. The results imply that manufurering SMEs need to invest in
the development of green packaging which will enable packaging of lightweight, recyclable,
re-usable, biodegradable materials, and to prevent the use of non-ecological materials. Policy
implications also exist when taking into consideration the nexus that exists between green
packaging and business performance. To develop the green packaging, the government can
adopt legislation prohibiting certain packaging materials’ use, establishing a storage refund
system, drawing up the recycling or reuse laws, giving a discount or punishment in tax,
limiting over-packaging, founding sundry research institutions to evaluate packing materials,
as well as legislation to promote the development of new packaging materials.
9.4.6 Implications based on green advertising and business performance
The research findings confirmed that the relationship between green advertising and business
performance was positive. This implied that SMEs need to invest more in green advertising.
Doing so will be beneficial for SME manufacturers to acquire environmental reputation and
subsequently, to improve business performance. However, green advertising is detrimental to
the business performance of SME manufacturers that are already renowned for their
environmental protection. Managers need to be mindful of the counterproductive effect of
green advertising on business performance when their firms are considered environmentally
reputable.
9.4.7 Implications based on competitive advantage and business performance
The results showed that competitive advantage had a positive and significant impact on
business performance, as previously suggested in the proposed hypothesis linking these two
variables. This, implies that the higher competitiveness, the higher the business performance.
In addition, the obtained results implied that SMEs managers need to look ahead to the
competencies that will enhance the business performance. Such competencies can be making
use of practices such as green packaging, green advertising, green product innovation and
227
green process innovation. Hence, SME managers should invest in green marketing practices
to attain competitive avantage. Having a competitive advantage would mean that an
enterpreise is recognised as a company that either delivers better quality products than the
competition, or offers support and services at a greater value than the competition. The
enterprise will become recognised in the marketplace as being the best and consumers will be
interested in hearing about the enterprise’s new products because they recognise the
entrerprise as an industry leader.
9.4.8 Implications based on green product innovation and business
performance
The findings proved that green product innovation had a positive and a significant impact on
business performance, as previously suggested in the proposed hypothesis linking these two
variables. These findings may have important implications for managers and policy makers to
promote firm performance activities by means of environmental innovation measures. For
instance, the evidence shows that it is important to recognise that a change in a regulatory
policy may affect green product innovation, which in turn, may result in business
performance. Similarly, any regulatory policy change intended to promote green product
innovation should be evaluated to competition. So, many programmes should be
implemented for integrating environment and innovation policies as part of strategic
decisions and also green innovation policy should be aligned with other innovation-related
policies. Besides, managers should have more focus on environmental issues which provide
incentives for innovation.
9.4.9 Implications based on green process innovation and business
performance
It was also discovered that green process innovation had a positive and significant impact on
business performance, as previously suggested in the proposed hypothesis linking these two
variables. With respect to the public policy, there are many important implications in these
findings. Regulation plays a key role in green process innovation. Although South Africa has
established relatively perfect environmental policies, green process innovators cannot be
compensated in a short time due to the lack of strict policy enforcement and the lack of
incentives of other market tools. Strict pollution control standards are necessary, and strict
enforcement measures are also needed. Besides pollution charges, other flexible

228
environmental policy instruments, such as tradable permits, government procurement, and
other market-based instruments, are necessary.
9.4.10 Implications based on green packaging, competitive advantage and
business performance
It was also discovered that competitive advantage positively mediates the relationship
between green packaging and business performance. So, it is expected that competitive
advantage will act as a catalyst in the relationship between green packaging and business
performance. From a managerial standpoint, these findings imply that marketing managers
within manufacturing SMEs, if they are aiming to utilise green packaging to impove business
performance, may now realise the importance of competitive advantage as an influencial
factor that they can consider first to ultimately enhance the business performance of a
manucturing SME.
9.4.11 Implications based on green advertising, competitive advantage and
business performance
The results showed that competitive advantage positively and significantly mediates the
relationship between green advertising and business performance. From a managerial
standpoint, these findings imply that marketing managers within manufacturing SMEs if they
are aiming to utilise green advertising to improve the business performance, may now realise
the importance of competitive advantage as an influencial factor that they can consider first to
ultimately enhance the business performance of a manucturing SME.
9.4.12 Implications based on green product innovation, competitive advantage
and business performance
The research findings confirmed that competitive advantage positively and significantly
mediates the relationship between green product innovation and business performance. From
a managerial standpoint, these findings imply that marketing managers within manufacturing
SMEs if they are aiming to utilise green product innovation to improve the business
performance, may now realise the importance of competitive advantage as an influencial
factor that they can consider first to ultimately enhance the business performance of a
manucturing SME.
229
9.4.13 Implications based on green process innovation, competitive advantage
and business performance
Moreover, the empirical study revealed that competitive advantage positively and
significantly mediates the relationship between green process innovation and business
performance. In other words, green process innovation has a significant effect on Business
Performance through competitive advantage From a managerial standpoint, these findings
imply that marketing managers within manufacturing SMEs, if they are aiming to utilise
green process innovation to improve the business performance, may now realise the
importance of competitive advantage as an influencial factor that they can consider first to
ultimately enhance the business performance of a manucturing SME.
9.5 RECOMMENDATIONS
The alarming results of this study cannot be overlooked and may be availed as opportunities
for manufacturing SMEs. Therefore, based on the analysis of the literature, and more
specifically, in the light of the findings of the empirical research, the following
recommendations are offered:
From the management perspective, SME owners and managers need to look into
green innovation opportunities in their product development and process
improvement phases. SME managers should also be aware of investment in green
product and process innovations in order to promote sustainability and resulting in
environmental gains, such as pollution reduction, cleaner production, energy
conservation, leading to benefits for mankind.
As the study results show that competitive advantage does mediate the green
packaging and business performance relation, SMEs need to devise strategies and
approaches that will incorporate competitive factors, business performance goals and
action plans as well as a green packaging feature since green packaging can give
businesses a competitive advantage on the market. Green packaging as a green
marking practice, demonstrates compassion and awareness, which can be a persuasive
factor in helping customers choose between the enterprise and the competititor of the
enterprise. In addition, SMEs who invest in green packaging also stand to save money
in the form of shipping costs, material costs, and reduced waste. Hence, the enterprise
may reap better profits with the offering green packaged products.
New or improved products and services help businesses gain a competitive advantage
over others. Customers are always looking for better products and services to satisfy
230
their ever-changing needs and preferences. Hence, small businesses should have a
thorough understanding of their market and competition in order to develop true value
for their customers.
Deduction from the theoretical framework of this study, it is prescribed that keeping
in mind the end goal to for the manufacturing SMEs to develop in scale and
productivity and furthermore to contend positively, they have to grasp Michael
Porter's generic strategies of competitive advantage. Nevertheless, they need to be
selecting and mix those that can work hand in hand. The focus strategy should be
applied by most SMEs but also diversification of products, market and customers is
key in marketing given the ever-changing market niche and trend. The SMEs further
need adopt with the changes in government policy, technology, customer needs and
requirements, market trends and forces to amicably apply the green marketing
practices and compete fairly.
SME owners and managers should try to be more innovative when running and
managing their businesses. It is generally known that if a business is not performing
well, there are more chances that it will fail. This belief is a reality as many studies,
including those reviewed in this study, confirm it. It is therefore, recommended that
for small businesses to realise improved business performance, they need to be
engaged in green packaging, green advertising, green product innovation and green
process innovation.
Manufacturing SMEs in the nation ought to be urged to have clear ecological or green
marketing practices and grasp environmental reporting to the buyers. This will
empower the different SMEs to be more engaged in sustainability.
With expanding rivalry in the present worldwide market, the different manufacturing
SMEs inside South Africa need to look to the cutting-edge key approaches to pick up
an upper hand. Green marketing rehearses are new inventive administrative strategies
that can be utilized as a key weapon to pick up competitiveness and to promote a
firm’s s environmental and business performance at the same time.
9.6 CONTRIBUTIONS OF THE STUDY
The study's contribution was structured into four categories: the societal contribution, the
theoretical contribution, the the practical or managerial contribution, as well as the
contribution to policy.

231
9.6.1 The societal contribution
Since the present study is centred on green marketing it makes a significant contribution to
the societal needs of South Africa. As society becomes more concerned with the natural
environment, businesses have begun to modify their behavior to address society's “new"
concerns. Hence, the concept of green marketing can address the environmental degradation
issues and society's concerns for sustainable development. In addition, marketing green
products can have a constructive influence on society since it promotes and considers the
reduction of pollution in business trades.
9.6.2 The Theoretical Contribution
The study’s results have significant theoretical contribution towards the knowledge base that
currently exists in the field of green marketing, competitive advantage as well as SMEs
business performance. The researchers and academic community would use this study as a
yardstick for further studies. The students and academicians will use this study as a reference
point and try to improve on the areas that are not covered by the researcher in the future
within this field of green marketing, competitive advantage and SMEs business performance.
Moreover, it is anticipated that the findings will be of value to future researchers and scholars
who may use this study to conduct further studies. This study aims to provide practical
implications thereof.
9.6.3 Practical or managerial contribution
The findings of this study have significant practical contributions for managers. Precisely, the
contribution of the results to the practice is that green marketing is a worthwhile strategy to
which the management should be committed to gain competitive advantage, as well as to
improve business performance in a competitive industry with a changing dynamic marketing
environment. In addition, this study will also help SMEs owners and marketing managers of
SMEs operating within the manufacturing sector to identify the necessary green marketing
practices that will give them a competitive advantage, as well as enhance their business
performance. Explicitly, manufacturing SMEs that develop new and improved products and
services with environment inputs in mind, give themselves access to new markets, increase
their profit sustainability, and enjoy a competitive advantage over the companies that are not
concerned about the environment.

232
9.6.4 The contribution to policy
The results of this study also have major policy contributions for the government. First, the
study recommends that the government of South Africa should set aside funds to enhance
green marketing practices’ regulations and implementations in both private and public
sectors. A green marketing approach could be used to help the country address environmental
problems. Mainstreaming green marketing in private and public SME operations has the
potential to add value in the pursuit of sustainable development in the area of clean and
sustainable environment, a goal that is also captured within the social pillar of South Africa’s
Vision. The government should encourage the companies to implement green marketing
practices effectively and efficiently.
9.7 LIMITATIONS AND SUGGESTIONS FOR FUTURE RESEARCH
The study was subjected to several limitations, despite producing meaningful results. Some of
these limitations were used to discover opportunities for research in future. The most obvious
one is that the study population was restricted to SME managers within the Gauteng Province
of South Africa, one region in South Africa. This limits the possibility to generalise the
results to include SME managers in South Africa. In addition, extending the research to other
regions in South Africa would be a valuable future research direction. Precisely, if data
collection is expanded to include other SME managers in other provinces of South Africa, for
insance Eastern Cape or Limpopo, the research findings might be more insightful.
This study could be used by other business management and marketing scholars as a point of
departure for future research on green marketing practices in South Africa. Furthermore, the
findings of this study are restricted to the manufacturing sector, which is only one sector.
Therefore, this presents an impetus for researchers to extend their future studies into other
sectors of the economy. It is suggested for better future research on the impact of green
marketing practices and competitive advantage on the business performance of
manufacturing SMEs, to measure business performance by using objective measures. In
addition, future studies can introduce appropriate moderation or mediation variables between
green marketing practices and business performance relationships.
Additionally, it would be necessary for future researchers to have a comparative analysis in
this regard among other SMEs from different sectors, for instance, comparing the
manufacturing sector to the retail sector. This may help to understand further the differences
233
in how SMEs handle the green marketing practices in their respective sectors. Another
limitation concerns the use of a single method of data collection. This study employed a
quantitative research approach. Future researchers may benefit from exploratory qualitative
approaches as well, especially is the area of SMEs in the South African context , which
remain under researched and not well understood. Such explorations may yield interesting
insights that may eventually also lead to a better understanding of additional specific
mediators and moderators. Future research my also triangulate and enrich this work via
ethnographies and case studies within organisations and experiments where customer
reactions to green practices could be assessed in the face of competing brand alternatives.
Concepts such as perceived ethnically or concern for the future maybe conjectured as
potential mediators, and variations in norms sorrounding practices in different industries
might save is potential moderators. Lastly, it should be noted that the aforementioned
limitations do not necessarily negate the contributions of this study, but open up avenues for
future research.
234
REFERENCES
Abor, J. & Quartey, P. (2010). Issues in SME development in Ghana and South Africa.
International Research Journal of Finance and Economics. 39(6),215-228.
Adebanjo, D. (2000). Identifying problems in forecasting consumer demand in the
fastmoving consumer goods sector. Benchmarking: An International Journal, 7(3), 223-230.
Adeyemi, O. (2009). A Modern Approach to Marketing Management. The International
Journal of Marketing Studies, 2(2), 2-14.
Adialita, (2014). The Influence of Green Innovation of Japanese Electronic Industries on
Competitive Advantage with Particular Reference to Japanese Home Appliance Industry.
Master of Business and Administration research report. Ritsumeikan Asia Pacific University.
Adiprabowo, A. (2014). The Comparative Advantage Theory of Competition - Journal
Critique. Final Paper. Faculty of Economics International Undergraduate Program
Management. Universitas Indonesia.
Afọlayan, F.S (2004). Culture and Customs of South Africa, Johannesburg: Greenwood
Publishing Group.
Ahamed, W.S.W., Almsafir, M.K. & Al-Smadi, A.W. (2014). Does corporate social
responsibility lead to improvement in firm financial performance? Evidence from Malaysia.
International Journal of Economics and Finance, 6(3), 126-138
Ahonen, V., Hansen, E., Heikki, J. & Karna, J. (2001). Green advertising: greenwash or a
true reflection of marketing strategies? Greener Management International, 33(1), 59–70.
Ahuja, K. (2015). A study of green advertising and its impact on consumer purchase
intention, International Journal of Applied Research, 1(7), 39-43.
235
Ajmal, F. (2017). Factors Influencing Electronic Commerce Adoption In Malaysian Small
And Medium Sized Enterprises (SMES). The degree of Doctorate of Philosophy Thesis,
University Of Malaya, Kuala Lumpur.
Ajupov, A. A., Kurilova, A. A., & Kovalenko, O. G. (2015). Financial Recovery
Organization on the Basis of Cash Flow Management. Mediterranean Journal of Social
Sciences, 6(3), 710-713.
Akio, T. (2005). The Critical Assessment of the Resource-Based View of Strategic
Management. Ritsumeikan international affairs, 3, 125-150.
Akkucuk, U. (2015). Handbook of research on waste management techniques for
sustainability. Hershey, PA: IGI Global.
Akram, A., Merunka, D., & Shakaib Akram, M. (2011). Perceived brand globalness in
emerging markets and the moderating role of consumer ethnocentrism. International Journal
of Emerging Markets, 6(4), 291-303.
Albers, S. (2010). PLS and success factor studies in marketing. In Handbook of Partial least
squares (pp. 409-425). Berlin: Springer.
Albino, V., Balice, A., & Dangelico, R. M. (2009). Environmental strategies and green
product development: an overview on sustainability-driven companies. Business Strategy and
the Environment, 18, 83-96.
Alhadid, A. Y., & As’ad, H. (2014). The Impact of green innovation on organizational
performance, environmental management behavior as a moderate variable: An analytical
study on Nuqul group in Jordan. International Journal of Business and Management, 9(7),
51-58.
Aliyua, M.S., Abubakarb, M.S., Yakasaic, A.M & Garba, A. (2018). Modelling Nigerian
Public Universities Performance through Total Quality Management. Journal of Applied
Structural Equation Modeling, 2(1), 59-73.

236
Alniacik & Yilmaz, (2012). The effectiveness of green advertising: influences of claim
specificity, product’s environmental relevance and consumers’ pro-environmental
orientation, Economic Interferences, 16(31), 207-222.
Alsughayir, A. (2017). Does Green Product Innovation Affect Performance of Saudi
Chemical Industrial Firms? American Journal of Business and Management, 6(1), 16-25.
Alvi M.H. (2016). A Manual for Selecting Sampling Techniques in Research. University of
Karachi, Iqra University.
Alvi, M., & Ikram, M. (2015). Impact of Total Assets and Net Income on Return on Equity of
Small Medium Enterprises of Pakistan. Pakistan Institute of Learning and Living, Iqra
University, Institute of Clinical Psychology, 1-7.
Amado, C.A.F., Santos, S.P., & Marques, P.M. (2012). Integrating the data envelopment
analysis and the balanced scorecard approaches for enhanced performance
assessment. Omega, 40, 390–403.
Amaechi, K. M., & Crane, A. (2006). Stakeholder engagement: A mechanism for sustainable
aviation. Corporate Social Responsibility and Environmental Management, 13, 245-260.
Amankwaa, A. & Anku-Tsede, O. (2015). The moderating effect of alternative job
opportunity on the transactional leadership-turnover intention nexus: Evidence from the
Ghanaian banking industry. African Journal of Business Management, 9(4), 553-561.
Amegbe, H., Owino, J. O., & Nuwasiima, A. (2017). Green Marketing Orientation (GMO)
and Performance of SMEs in Ghana. Journal of Marketing Development and
Competitiveness, 11(1), 99-109.
Amrollahi, A., & Akhgar, B. (2013). Analyzing Open Source Business with Porter's Five
Forces. International Journal of Computer Theory and Engineering, 5(1), 162-165.
Anderson, J.C. & Gerbing, D.W. (1988). Structural equation modelling in practice: A review
and recommended two-step approach. Psychological Bulletin, 103, 411-423.

237
Anderson, K. S., & Birrer, G. E. (2011). Creating a sustainable competitive advantage: a
resource-based analysis of the Gonzaga University men’s basketball program. Journal of
Sports Administration and Supervision, 3(1). 1-14.
Android, J. S. Waddock, B. Husted & Sutherland, S R. (2002). Unfolding Stakeholder
Thinking. Sheffield: Greenleaf Publishing.
Ansah, M.O. (2016). The Influence of Culture, Market Environment and e-Marketing
adoption on Business Performance of Multinational Companies in Ghana: Marketing
Managers’ Perspective, Doctor of Philosophy thesis in Marketing, University of the
Witwatersrand, Johannesburg.
Ar, I. M. (2012). The impact of green product innovation on firm performance and
competitive capability: the moderating role of managerial environmental concern. Procedia-
Social and Behavioral Sciences, 62, 854-864.
Anwar, M. (2018). Business Model Innovation And Smes Performance—Does Competitive
Advantage Mediate? International Journal of Innovation Managemen, 22(4), 45-59.
Aracioglu, B, Zalluhoglu, A.E, & Candemir, C. (2013). Measuring and Evaluating
Performance within the Strategic Management Perspective: A Study on Performance
Measurement of Seafood Company. Procedia - Social and Behavioural Sciences, 99, 1026 –
1034.
Arain, M., Campbell, M. J., Cooper, C. L., & Lancaster, G. A. (2010). What is a pilot or
feasibility study? A review of current practice and editorial policy. BMC medical research
methodology, 10(1), 67-87.
Arbor, J. & Quartey, P. (2010). Issues in SME Development in Ghana and South Africa.
International Research Journal of Finance and Economics, (39), 218.
Arenhardt, D.L., Battistella, L.F & Grohmann, M.Z (2016). The influence of the green
innovation in the search of competitive advantage of enterprises of the electrical and
electronic Brazilian sectors”, International Journal of Innovation Management, 20(1), 1-20.

238
Arnold, D. M., Burns, K. E., Adhikari, N. K., Kho, M. E., Meade, M. O., & Cook, D. J.
(2009). The design and interpretation of pilot trials in clinical research in critical
care. Critical care medicine, 37(1), S69-S74.
Arseculeratne, D., & Yazdanifard, R. (2013). How green marketing can create a sustainable
competitive advantage for a business. International business research, 7(1), 130 -137.
Ary, D., Jacobs, L. C., Sorensen, C., & Walker, D. A. (2013). Introduction to Research in
Education (9th ed.). Belmont, CA: Cengage Learning.
Arya, B. & Lin, Z. (2007). Understanding collaboration outcomes from an extended resource-
based view perspective: the roles of organizational characteristics, partner attributes, and
network structures. Journal of Management, 33(5), 697-732.
Asosheh, A., Nalchigar, S., & Jamporazmey, M. (2010). Information technology project
evaluation: An integrated data envelopment analysis and balanced scorecard
approach. Expert Systems with Applications, 37, 5931–5938.
Auka, D.O. (2014). Porter’s generic competitive strategies and customer satisfaction in
commercial banks in Kenya. Eurasian Business & Marketing Research Journal, 1(1), 1- 31.
Axelsson, M., Kron, D., Larsson, W., Nydén, V., Näkne, N & Sörenson, H. (2015). The
equity-based Crowdfunding Platforms Competitive situation in an emerging industry and
impact on the Swedish capital market. Bachelor's Programme in Industrial Engineering and
Management, Chalmers University of Technology, Gothenburg.
Ayandibu, A.O. & Houghton, J., (2017). The role of Small and Medium Scale Enterprise in
local economic development (LED), Journal of Business and Retail Management Research
(JBRMR), 11(2), 133-139.
Aytekin, P & Çelik, B (2017). Envıronmentalıst approach and attıtudes towards green
advertısıng. International Journal of Business Management and Economic Research, 8(6),
1099-1108.

239
Ayuso, S., Rodrıguez, M. A., & Ricart, J. E. (2006). Responsible competitiveness at the
micro level of the firm: Using stakeholder dialogue as a source for new ideas: a dynamic
capability underlying sustainable innovation. Corporate Governance, 6 (4), 475-490
Aziz, N. N. A., & Samad, S. (2016). Innovation and Competitive Advantage: Moderating
Affects of Firm Age in Foods Manufacturing SMEs in Malaysia. Procedia Economics and
Finance, 35, 256-266.
Azmi, I. A.G. (2017). Muslim Women Entrepreneurs Motivation in SMEs: A Quantitative
Study in Asia Pacific Countries. Asian Economic and Financial Review, 7(1), 27-42.
Baack, D.W., Harris, E.G & Baack, D. (2013). International Marketing. Volume 3 of
Legends in marketing: V. Kumar, V. Kumar series editor, Jagdish N. She. Thousand Oaks,
CA:SAGE.
Babbie, E. & Mouton, J. (2010). The Practice of Social Research. 10th ed. Cape Town:
Oxford University Southern Africa.
Babbie, E. (2012). The Practice of Social Research, 13th ed. Belmont, CA: Cengage
Learning.
Babbie, E., Mouton, J., Vorster, P & Prozesky, B. (2010). The practice of social research.
Cape Town: Oxford University Press Southern Africa.
Babin, B.J. & Zikmund, W. (2016). Exploring marketing research, 11th ed.. Boston, MA.:
Cengage, Boston.
Bagozzi, R.P. & Yi, Y. (1988). On the evaluation of structural equation models. Journal of
Academy of Marketing Sciences, 16(1):74-94.
Bagozzi, R.P. (2010). Structural equation models are modelling tools with many ambiguities:
Comments acknowledging the need for caution and humility in their use. Journal of
Consumer Psychology, 20(2), 208–214.

240
Baldwin, C.Y. (2017). Return on Invested Capital (ROIC)." In The Palgrave Encyclopedia
of Strategic Management. Continuously updated edition, edited by Mie Augier and David J.
Teece. Palgrave Macmillan, 2017. Electronic. (Pre-published, October 2013.)
Bao, Y., Bao, Y., & Sheng, S. (2011). Motivating purchase of private brands: Effects of store
image, product signatureness, and quality variation. Journal of Business Research, 64(2),
220226.
Barde, M. P., & Barde, P. J. (2012). What to use to express the variability of data: Standard
deviation or standard error of mean? Perspectives in clinical research, 3(3), 113-116.
Barnes, J. (2009). On the brink? Skills demand and supply issues in the South African
automotive components industry. Human Sciences Research Council, 24-45. Available at:
http://www.hsrcpress.ac.za [accessed 2017-3-25].
Barney, J. (1991). Firm resources and sustained competitive advantage. Journal of
Management, 17(1): 99-120.
Barney, J. B. & Hesterly, W. S. (2010). Strategic Management and Competitive Advantage
Concepts. Upper Saddle River, NJ: Pearson Prentice Hall.
Barney, J. B. (2002). Gaining and sustaining competitive advantage. Upper Saddle River, NJ:
Prentice Hall.
Barroso, A., & Giarratana, M. S. (2013). Product proliferation strategies and firm
performance: The moderating role of product space complexity. Strategic Management
Journal, 34(12), 1435-1452.
Bashar, S.E. (2012). Challenges and remedies of manufacturing enterprises in developing
countries: Jordan as a case study. Journal of Manufacturing Technology Management, 23(3),
328-350.
Basu, A., Howell, R. & Gopinath, D. (2010). Clinical performance indicators: intolerance for
variety. International Journal of Health Care Quality Assurance, 23(4): 436-449.

241
Batool, S & Iqbal, R (2016). Impact of Green Advertising on Consumer Purchase Behavior,
International Interdisciplinary Journal of Scholarly Research (IIJSR), 2(1), 16-22.
Baumann-Pauly, D., Wickert, C., Spence, L. J., & Scherer, A. G. (2013). Organizing
corporate social responsibility in small and large firms: Size matters. Journal of Business
Ethics, 115, 693-705.
Bavdekar, S. B. (2015). Using Tables and Graphs for Reporting Data. Journal of the
Association of Physicians of India, 63, 59.
Beck, R. B. (2013). The History of South Africa. Johannesburg: ABC-CLIO.
Begemann, F. (2006). Co-Branding as a brand strategy. An analysis from the resource-based
view. Munich, GRIN Verlag
Bem, D.J., Utts, J. & Johnson, W.O. (2011). Must psychologists change the way they analyze
their data? Journal of Personality and Social Psychology, 101(4), 716–719.
Benoit-Moreau, F. & Parguel, B. (2011). Building brand equity with environmental
communication: an empirical investigation in France, Euro-Med Journal of Business,
6(1), 100-116.
Bentler, P. M. & Bonnet, D. C. (1980). Significance tests and goodness of fit in the analysis
of covariance structures. Psychological Bulletin, 88(3):588-606.
Bentler, P. M. (1990). Comparative fit indexes in structural models. Psychological Bulletin,
107(2):238-246.
Bentler, P.M., & Bonnett, D.G. (1980). Significance tests and goodness of fit in the analysis
of covariance structures. Psychological Bulletin, 88(3):588-606.
Beran, T.N. & Violato, C. (2010). Structural equation modelling in medical research: A
primer. BMC Research Notes, 3:267-280.

242
Bernardin, J. (2007). Human Resource Management New Delhi: Tata McGraw-Hill.
Berrone, P. (2009). Green keys to unlock competitive advantage. ISIE Insight, 2, 50–57.
Berrone, P., Cruz, C., Gomez-Mejia, L. R., & Larraza-Kintana, M. (2010). Socioemotional
wealth and corporate responses to institutional pressures: Do family-controlled firms pollute
less? Administrative Science Quarterly, 55, 82-113.
Berti, S., Germani, M., Mandorli, F., & Otto, H. E. (2001). Design of product families: An
example within a small and medium-sized enterprise. WDK Publications, 507-514.
Bhat, S.A., Darzi, M.A & Parrey, S.H. (2014). Green Marketing: A Driver for Green Brand
Equity and Sustainable Development, International Journal of Humanities & Social Studies,
2(12), 131-133.
Bhatti, K.K (2016). Green Marketing: Savior for the Consumers, Businesses and the World,
International Journal of Emerging Research in Management & Technology, 5(6), 70-76.
BI, K., Bao, Q., & Feng, D. (2013). Effect analysis of informatization level to green process
innovation in manufacturing enterprises. Journal of Theoretical & Applied Information
Technology, 47(2), 774-779.
Biesta, G. (2010). Pragmatism and the philosophical foundations of mixed methods research.
In A. Tashakkori & C. Teddlie (Eds.), Sage handbook of mixed methods in social &
behavioral research (2nd ed., pp. 95-118). Thousand Oaks, CA: Sage.
Bititci, U.S., Turner, T. & Begemann, C. (2000). Dynamics of performance measurement
systems. International Journal of Operations and Production Management, 20(6), 692-704.
Blunch, N.J. (2008). Introduction to Structural Equation Modeling using SPSS and AMOS.
Singapore: McGraw-Hill.
Bollen, K.A. (1989). Structural Equations with Latent Variables. New York: John Wiley.
243
Bontis, N., Booker, L. D., & Serenko, A. (2007). The mediating effect of organizational
reputation on customer loyalty and service recommendation in the banking
industry. Management decision, 45(9), 1426-1445.
Borrego, M., Douglas, E.P. & Amelink, C.T. (2009). Quantitative, qualitative and mixed
research methods in engineering education. Journal of Engineering Education, 98(1):53-66.
Bourne, M., Neely, A., Mills, J. & Platts, K. (2003). Implementing performance
measurement systems: a literature review, International Journal of Business
Performance Management, 5(1), 1-24.
Bragg, S, M. (2012) Business Ratios and Formulas: A Comprehensive Guide. 3rd
ed.
Hoboken, New Jersey: John Wiley and Sons, Inc.
Bras, B., Realff, M., & Carmichael, C. (2004). Integrated Environment and Economic
Performance Assessment for Strategic Planning and Policy Analysis in Paper
Manufacturing. CPBIS project – B-4: 5-7, final project report to CPBIS.
Brocke, J. V., & Rosemann, M. (2014). Handbook on Business Process Management 2:
Strategic Alignment, Governance, People and Culture. Berlin: Springer.
Bryman, A. & Bell, E. (2011). Business Research Methods. 3rd ed. New York: Oxford
University Press.
Burns, N & Grove, SK. (2009). The practice of nursing research: appraisal, synthesis, and
generation of evidence. 6th edition. United States of America: Elsevier/Saunders.
Burns, N., & Grove, S. K. (2010). Understanding Nursing Research-eBook: Building an
Evidence-Based Practice. Lisse: Elsevier Health Sciences.
Butler, A. (2017). Contemporary South Africa. Berlin: Springer.
Byrne, B.M. (2001). Structural Equation Modeling with AMOS. Basic concepts, Applications
and Programming. Multivariate applications series. New Jersey: University Press.

244
Byrne, B.M. (2013). Structural equation modelling with AMOS: basic concepts, application
and programming. 2nd ed. New York: Routledge: Taylor and Francis Group.
Caga, S.M. (2012). Barriers faced by SMMEs in accessing finance. Master’s in Business
Administration, Nelson Mandela Metropolitan University. Port Elizabeth.
Cainelli, G., De Marchi, V., & Grandinetti, R. (2015). Does the development of
environmental innovation require different resources? Evidence from Spanish manufacturing
firms. Journal of Cleaner Production, 94, 211-220
Calitz, M.G. (2009). A cultural sensitive therapeutic approach to enhance emotional
intelligence in primary school children (Doctoral dissertation). University of South Africa,
Pretoria.
Camarero I.C., Gutiérrez C.J., & San M.G.S., (2005). The impact of customer relationship
marketing on the firm performance: a Spanish case. Journal of Services Marketing, 19(4),
234-244.
Camison, Cesar, & Villar-Lopez, Ana. (2010). Effect of SMEs’ international experience on
foreign intensity and economic performance: The mediating role of internationally
exploitable assets and competitive strategy. Journal of Small Business Management, pp 116-
151.
Campell, D. T. & Fiske, D. W., (1959). Convergent and discriminant validation by the
multitraitmultimethod matrix. Psychological Bulletin, 56, 81-105.
Canepari, B. (2017). Environmental performance management in multinational corporations.
Masters dissertation, Department of Business and Management, Libera Università
Internazionale degli Studi Sociali, Rome, Italy.
Cangur, S., & Ercan, I. (2015). Comparison of model fit indices used in structural equation
modeling under multivariate normality. Journal of Modern Applied Statistical
Methods, 14(1), 152-167.
Cant, M.C. (2017). Arranging events for entrepreneurs: waste of money or value of money,
Journal of Business and Retail Management Research, 11(4), 76-89.

245
Cardeal, N., & Antonio, N.S. (2012). Valuable, rare, inimitable resources and organization
(VRIO) resources or valuable, rare, inimitable resources (VRI) capabilities: What leads to
competitive advantage? African Journal of Business Management, 6(37), 10159-10170.
Carlson, K. (2008). Green Your Work: Boost Your Bottom Line While Reducing Your Carbon
Footprint. New York: Simon and Schuster.
Chahal, H., Dangwal, R., & Raina, S. (2014). Conceptualisation, development and validation
of green marketing orientation (GMO) of SMEs in India: a case of electric sector. Journal of
Global Responsibility, 5(2), 312-337.
Chang, C. H. (2011). The influence of corporate environmental ethics on competitive
advantage: the mediation role of green innovation. Journal of Business Ethics, 104(3), 361-
370.
Chang, H., Fang, P., & Cho, F. (2013). Customer-Based Performance on Customer
Relationship Management: The Role of Customer Relational Information Process.
In Diversity, Technology, and Innovation for Operational Competitiveness: Proceedings of
the 2013 International Conference on Technology Innovation and Industrial
Management (pp. 4-98). ToKnowPress.
Charmaz, K.C. (2006). Constructing grounded theory: a practical guide through qualitative
analysis. Los Angeles: Sage Publications.
Check, J., & Schutt, R. K. (2012). Research methods in education. Thousand Oaks, CA.:
Sage Publications.
Chen Y-S, Lai S-B & Wen, C. T. (2006). The Influence of Green Innovation Performance on
Corporate Advantage in Taiwan, Journal of Business Ethics, 67(4), 331-339
Chen, Y. S. (2008). The driver of green innovation and green image—Green core
competence. Journal of Business Ethics, 81(3), 531–543.
Chen, Y. S., Lai, S. B., & Wen, C. T. (2006). The influence of green innovation performance
on corporate advantage in Taiwan. Journal of Business Ethics, 81(3), 531–543.

246
Cheng, C. C., Yang, C. L., & Sheu, C. (2014). The link between eco-innovation and business
performance: a Taiwanese industry context. Journal of Cleaner Production, 64, 81-90.
Cheung, G. W., & Rensvold, R. B. (2002). Evaluating goodness-of-fit indexes for testing
measurement invariance. Structural equation modeling, 9(2), 233-255.
Chiellini, E. (Ed.). (2008). Environmentally compatible food packaging. Amsterdam:
Elsevier.
Chiloane-Tsoka, E., Mabiza-ma-Mabiza, J., & Mbohwa, C. (2014). Green Economy and
SMEs in South Africa: How Green are South African SMEs?. Academic Journal of
Interdisciplinary Studies, 3(6), 181-186.
Chimwani, P.M., Nyamwange, O., & Otuyo, R. (2013). Application of Strategic Performance
Measures in Small and Medium-Sized Manufacturing Enterprises in Kenya: The Use of the
Balanced Scorecard Perspectives. International Journal of Management Sciences and
Business Research, 2(6), 45-60.
Chinomona, R. (2011). Non-mediated channel powers and relationship quality: A case of
SMES in Zimbabwe channels of distribution, Unpublished PhD. National Central University,
Taiwan.
Chiou, T. Y., Chan, H. K., Lettice, F., & Chung, S. H. (2011). The influence of greening the
suppliers and green innovation on environmental performance and competitive advantage in
Taiwan. Transportation Research Part E: Logistics and Transportation Review, 47(6), 822-
836.
Cho, Y.Y. (2012). Consumers' value orientations and green advertising effectiveness: The
moderating role of public self-awareness, Doctoral dissertation, School of Journalism and
Communication and the Graduate School of the University of Oregon.
Choto, P., Tengeh, R.K. & Iwu, C.G. (2014). Daring to survive or to grow? The growth
aspirations and challenges of survivalist entrepreneurs in South Africa, Environmental
Economics, 5 (4), 93-101.
247
Christelis, T. A. (2013). An analysis of the state of green business in the South African retail
sector (Master of Environmental Science dissertation, University of Cape Town).
Chuang, S. P., & Yang, C. L. (2014). Key success factors when implementing a green-
manufacturing system. Production Planning & Control, 25(11), 923-937.
Churchill Jr, G.A., Brown, T.J. & Suter, T.A. (2010). Basic marketing research. 7th ed.
Australia: South-Western, Cengage Learning.
Churchill, G.A. & Iacobucci, D. (2010). Marketing research: methodological foundations.
10th ed. Canada: South-Western, Cengage Learning.
Churchill, G.A., Brown, T.J. & Suter, T.A. (2010). Basic marketing research. 7th
ed. Canada:
South Western, Cengage Learning.
Claudy, M. (2011) An Empirical Investigation of Consumer Resistance to Green Product
Innovation. Doctoral Thesis. Dublin Institute of Technology.
Cocca, P. & Alberti, M. (2010). A framework to assess performance measurement systems in
SMEs. International Journal of Productivity and Performance, 59(2), 186-200.
Cohen, L., Manion, L., & Morrison, K. (2007). Research methods in education.
London/NewYork: Routledge.
Comrey, A.L., & Lee, H.B. (2013). A first course in factor analysis. New York: Psychology
Press.
Cooper, D. R. & Schindler, P.S. (2006). Business research methods. (9th ed). New York:
McGraw-Hill.
Cooper, D.R. & Schindler, P. (2014). Business research methods, 14th edn., New York:
McGraw-Hill.

248
Cooper, D.R. & Schindler, P.S. (2014). Business research methods, 12th edn. Ne wYork:
McGraw-Hill.
Cramer, D. (2006). Advanced quantitative data analysis. New York: Open University Press.
Creswell, J. W. (2009). Research Design, Qualitative, Quantitative and Mixed Methods
Approaches. 3rd ed. Thousand Oaks: Sage Publications.
Crowther, D.E.A. (1996). Corporate performance operates in three dimensions. Managerial
Auditing Journal, 11(8), 4-13.
Damodaran, A. (2007). Return on capital (ROC), return on invested capital (ROIC) and
return on equity (ROE): Measurement and implications. Stern School of Business.
Damodaran, A. (2012). Investment valuation: Tools and Techniques for Determining the
Value of Any Asset. Hoboken, New Jersey: John Wiley and Sons, Inc.
Dangelico, R. M., & Vocalelli, D. (2017). “Green Marketing”: An analysis of definitions,
strategy steps, and tools through a systematic review of the literature. Journal of Cleaner
Production, 165, 1263-1279.
Darlow, T. (2003). Waste Plans: Report on Categorisation and Pilot Studies. Edinburgh,
Scottish Institute of Sustainable Technology, 1-65.
Dawes, J. (1999). The relationship between subjective and objective company performance
measures in market orientation research: further empirical evidence. Marketing Bulletin-
Department of Marketing Massey University, 10, 65-75.
de Oliveira Brasil, M.V., de Abreu, M.C.S., da Silva Filho, J. C. L., & Leocádio, A. L.
(2016). Relationship between eco-innovations and the impact on business performance: an
empirical survey research on the Brazilian textile industry. Revista de Administração, 51(3),
276-287.

249
De Vlieger, L., Hudders, L., & Verleye, G. (2013). The Effectiveness of Green
Advertisements: Combining Ad-based and Consumer-based Research. In Advances in
Advertising Research (Vol. IV) (pp. 213-222). Wiesbaden: Springer.
Dean, G., Fahsing, I.A., Gottschalk, P., & Solli-Saether, H (2008). Investigative thinking and
creativity: an empirical study of police detectives in Norway. International Journal of
Innovation and learning, 5(2), 170-185.
Decoene V., Bruggeman W., (2006). Strategic alignment and middle-level managers'
motivation in a balanced scorecard setting, International Journal of Operations & Production
Management, 26(4), 429-448.
Delport, C. S. L. & Roestenburg, W. J. H. (2011). Quantitative data collection methods
research. In De Vos, A.S., Strydom, H., Fouche, C.B. & Delport, C.S.L. Research at Grass
Roots for the Social Sciences and Human Service Professions (pp. 195-196). 4th ed. Pretoria:
Van Schaik Publishers.
Department Of Trade and Industry. (2005). Integrated Strategy on the promotion of
Entrepreneurship and Small Enterprises: Unlocking the Potential of South Africa
Entrepreneurs (summarised version). Pretoria: Government Printer.
Dess, G.G., Lumpkin, T. and Eisner, A.B. (2010). Strategic Management: Texts & Cases. 5th
Ed. New York: McGraw-Hill.
Desta, N.T (2015). Networking As A Growth Initiative for Small and Medium Enterprises in
South Africa. Masters in Development Studies dissertation. University of the Free State,
Bloemfontein.
Dewi, D.M., Sudarma, M., Djumahir & Ganis, S.K. (2014). CSR effect on market and
financial performance. International Journal of Business and Management Invention, 3(1),
56–66.
250
Dhanaraj, C., Lyles, M.A., Steensma, H.K. & Tihanyi, L. (2004). Managing tacit and explicit
knowledge transfer in IJVs: The role of relational embeddedness and the impact on
performance. Journal of International Business Studies, 35:428-442.
Dhlomo, P. E. (2017). A framework for small and medium tourism enterprises in Tshwane
townships, South Africa, Masters Dissertation in Tourism Management. University Of South
Africa, Pretoria.
Diab, S. M., AL-Bourini, F. A., & Abu-Rumman, A. H. (2015). The impact of green supply
chain management practices on organizational performance: a study of Jordanian food
industries. Journal of Management and Sustainability, 5(1), 149-198.
Ding, L., Velicer, W. F., & Harlow, L. L. (1995). Effects of estimation methods, number of
indicators per factor, and improper solutions on structural equation modeling fit indices.
Structural Equation Modeling: A Multidisciplinary Journal, 2(2), 119-143.
Diwekar, U. M., & Shastri, Y. N. (2010). Green process design, green energy, and
sustainability: A systems analysis perspective. Computers & chemical engineering, 34(9),
1348-1355.
Dlodlo, N. & Dhurup, M. (2010). Barriers to e-marketing adoption among small and medium
enterprises (SMEs) in the Vaal Triangle. Acta Commercii, 10:164 - 180.
Doherty, B. (2011). Resource advantage theory and fair trade social enterprises. Doctor of
Philosophy thesis. Liverpool John Moores University. City campus.
Donaldson, T. & Dunfee, T. (1994). Toward a Unified Conception of Business Ethics:
Integrative Social Contract Theory, Academy of Management Review, 19(2), 252–284.
Donaldson, T., & Preston, L. (1995). The stakeholder theory of the corporation: Concepts,
evidence and implications. Academy of Management Review, 20 (1), 65-91.
Doorasamy, M. (2015). Using environmental management accounting to investigate benefits
of cleaner production at a paper manufacturing company in Kwadakuza, KwaZulu-Natal: a

251
case study. Master of Technology degree in Cost and Management Accounting dissertation.
Durban University of Technology, Durban, South Africa.
Drucker, P.F. (2007). The practice of management (2nd ed). Burlington, MA: Butterworth-
Heineman.
Dube, S. (2014). The impact of exchange rate volatility on international trade between South
Africa, China and USA: The case of the manufacturing sector. Masters of Commerce in
Financial Economics, University of Johannesburg, Johannesburg.
Dubihlela, J. (2012). Barriers to and Determinants and Enablers of Market Orientation:
Impact on Business Performance for Small and Medium Enterprises in South Africa.
Philosophiae Doctor in Business Management Thesis. North-West University. Vaal Triangle
Campus.
Dunn, T. J., Baguley, T., & Brunsden, V. (2014). From alpha to omega: A practical solution
to the pervasive problem of internal consistency estimation. British Journal of Psychology,
105(3), 399-412.
Dusick, D., (2011). Writing the methodology section. Retrieved from:
http://www.bolded.com/ch3.htm. Accessed [23/01/2018].
Drost, E.A., 2011. Validity and reliability in social science research. Education Research and
perspectives, 38(1), 86-105.
Dyer, J. H., & Singh, H. (1998). The relational view: Cooperative strategy and sources of
interorganizational competitive advantage. Academy of management review, 23(4), 660-679.
Eiadat, Y., Kelly, A., Roche, F., & Eyadat, H. (2008). Green and competitive? An empirical
test of the mediating role of environmental innovation strategy. Journal of World Business,
43, 131-145.
Elshamly, A. (2013). Developing a strategic framework for small and medium-sized
enterprises (SMEs) (Doctoral dissertation, University of Gloucestershire).

252
Eltayeb, K., Zailani, S., & Ramayah, T. (2011). Green supply chain initiatives among
certified companiesn in Malaysia and environmental sustainability: Investigating the
outcomes. Resources, Conservation and Recycling, 55(5), 495–506.
Eltebrandt (2010). The role of green marketing in development of consumer behavior towards
green energy. MIMA – International Marketing Master Thesis, School of Sustainable
Development of Society and Technology (HST)
Emmett, S., & Sood, V. (2010). Green supply chains: an action manifesto. New York: John
Wiley & Sons.
Enz, C. A. (2009). Hospitality strategic management: Concepts and cases. New York: John
Wiley and Sons.
Epetimehin, F.M. (2011). Achieving competitive advantage in insurance industry: the impact
of marketing innovation and creativity. Journal of Emerging Trends in Economics and
Management Sciences (JETEMS), 2(1), 18-21.
Esu, B. B. (2015). Transforming the Nigeria tourism industry through tourism entrepreneurial
development. African Journal of Business Management, 9(15): 569-580
European Commission. (2011). Facts and Figures about EU’s small and medium-
enterprises(SME).http://ec.europa.eu/enterprise/policies/some/facts‐figures‐
analysis/index_en.html [Retrieved March 8, 2017].
Falkena, H. (2000). SMEs access to finance in South Africa: A supply-side Regulatory
Review. Report by the Task group of the Policy Board of Financial Services and Regulations.
Cape Town: Kluwer Publishers.
Fassin, Y. (2008) Imperfections and Shortcomings of the Stakeholder Model’s Graphical
Representation. Journal of Business Ethics, 80, 879-888
Fatoki, O. & Garwe, D. (2010). Obstacles to the growth of new SMEs in South Africa: A
principal component analysis approach. African Journal of Business Management. 4(5):729-
738.

253
Feilzer, M.Y. (2010). Doing mixed methods research pragmatically: Implications for the
rediscovery of pragmatism as a research paradigm. Journal of Mixed Methods Research, 4(1):
6-16.
Ferreira, E.J. & Loggerenberg, N.V. (2012). Incident rates of Small and Medium Enterprises
in South Africa. Journal of Contemporary Management, (9) 212 – 233.
Flannelly, L. T., Flannelly, K. J., & Jankowski, K. R. (2014). Independent, dependent, and
other variables in healthcare and chaplaincy research. Journal of health care
chaplaincy, 20(4), 161-170.
Freeman, R. E. (1984). Strategic management: A stakeholder approach. Boston, MA:
Pitman.
Freeman, R.E., Harrison, J. S., Wicks, A. C., Parmar, B. L., & de Colle, S. (2010).
Stakeholder theory: The state of the art. Cambridge, England: Cambridge University Press.
Freeman, R. E., Wicks.
Freeman, R. E., Wicks, A. C., & Parmar, B. (2004). Stakeholder theory and “the corporate
objective revisited”. Organization science, 15(3), 364-369.
Fu, C., & Yang, S. (2012). The combination of dependence-based interval-valued evidential
reasoning approach with balanced scorecard for performance assessment. Expert Systems
with Applications, 39, 3717–3730.
Fuentes, C. (2015). How green marketing works: Practices, Materialities, and
images. Scandinavian Journal of Management, 31(2), 192-205.
Gajanan, R. (2015), A Study on Sustainable Marketing Practices for Gaining Competitive
Advantage, Elk Asia Pacific Journal Of Marketing And Retail Management, 6(4), 2346-2317.
Gallagher, D.R. (2012). Environmental Leadership: Volume 1 of the environmental
leadership: A reference handbook, edited by Deborah Riglling Gallagher. The SAGE
reference series of leadership. Thousand Oaks, CA: SAGE Publications.

254
Gaya, H. J., Struwig, M. & Smith, E. E. (2013). Creating a sustainable competitive advantage
at a high performing firm in Kenya. African Journal of Business Management, 7(21), 2049-
2058.
Gerbing, D. W., & Anderson, J. C. (1992). Monte Carlo evaluations of goodness of fit indices
for structural equation models. Sociological Methods and Research, 21(2), 132-160.
Ghodeswar, B., & Kumar, P. (2014). A Study of Green Marketing Practices in Indian
Companies. International Journal of Applied Management Sciences and Engineering
(IJAMSE), 1(2), 46-64.
Gibson, B. & Cassar, G. 2005. Longitudinal analysis of relationships between planning and
performance in small firms. Small Business Economics, 25, 207-222.
Gibson, K.: (2000). The Moral Basis of Stakeholder Theory, Journal of Business Ethics,
26(3), 245–257.
Gibson. C, H. (2010). Financial Reporting and Analysis: Using Financial Accounting
Information. Stanford, USA. Cengage Learning
Glesne, C. & Peshkin, P. (1992). Becoming Qualitative Researchers: An Introduction. New
York: Longman.
Godfrey, M & Qiang, T. (2000). Evolution in Open Source Software: A Case Study, in Proc.
IEEE, International Conference on Software Maintenance (ICSM'00), Washington, 131-136.
Goh, J.W. (2003). The resource advantage theory of competition: Implications for higher
educational institutions in Singapore. Educational Research for Policy and Practice, 2(2), 93-
106.
Gomera, S. W. (2016). An investigation into the relationship between strategic planning and
business performance in Small, Micro and Medium Scale Enterprises (SMMEs) (Doctoral
dissertation, University of Fort Hare).

255
Gond, J.P., & Mercier, S (2004). Les the´ories des parties prenantes: une synthe`se critique
de la litte´rature. Actes du Congre`s de l’Association francophone des ressources humaines,
Montre´al. http://www.agrh(2004)-esg.uqam.ca/pdf/Tome1/Gond_Mercier.pdf
Gorondutse, A. H., & Hilman, H. (2016). Mediation effect of organizational culture on the
relationship between perceived ethics and SMEs performance. Journal of Industrial
Engineering and Management, 9(2), 505-529.
Grahn, G. A. (2013). Mobile Customer Relationship Marketing: a tool to create competitive
advantage within the licensed liquor industry (Masters dissertation, Cape Peninsula
University of Technology).
Grant, R.M. (1991). The resource-based theory of competitive advantage: implications for
strategy formulation. California management review, 33(3), 114-119.
Gravetter, F.J. & Wallnau, L.B. (2000). Statistics for the behavioral sciences. 5th ed.
Belmont: Wadsworth – Thomson Learning..
Gravetter, F.J., & Wallnau, L.B. (2007). Essentials of Statistics for the Behavioral Sciences,
Boston: Cengage Learning.
Green, K. W., Zelbst, P. J., Meacham, J., & Bhadauria, V. S. (2012). Green supply chain
management practices: impact on performance. Supply Chain Management: An International
Journal, 17(3), 290-305.
Green, K. W., Toms, L. C., & Clark, J. (2015). Impact of market orientation on
environmental sustainability strategy. Management Research Review, 38(2), 217-238.
Greenwood, M. (2007). Stakeholder engagement: Beyond the myth of corporate
responsibility. Journal of Business Ethics, 74, 315-327.
Grigoroudisn, E., Orfanoudaki, E., & Zopounidis, C. (2012). Strategic performance
measurement in a healthcare organization: A multiple criteria approach based on balanced
scorecard. Omega, 40(2012), 104–119.

256
Grillo, N., Tokarczyk, J. & Hansen, E. (2008). Green advertising developments in the US
forest sector: a follow up, Forest Products Journal, 58(5), 40–46.
Grobler, M.P.J. (2012). Green Business and Environmental Issues: Family versus Non-
Family Business. Magister in Business Administration Dissertation. Nelson Mandela
Metropolitan University. Port Elizabeth.
Guercini, S. (2014). Guest Editorial: New qualitative research methodologies
inmanagement. Management Decision, 52(4): 662-674.
Gumbus, A. & Lussier, R.N. (2006). Entrepreneurs use a Balanced Scorecard to translate
strategy into performance measures. Journal of Small Business Management, 44(3), 407-425.
Gunzler, D. D., & Morris, N. (2015). A tutorial on structural equation modeling for analysis
of overlapping symptoms in co‐occurring conditions using MPlus. Statistics in
medicine, 34(24), 3246-3280
Guoyou, Q., Saixing, Z., Chiming, T., Haitao, Y., & Hailiang, Z. (2013). Stakeholders
Influences on Corporate Green Innovation Strategy: Case Study of Manufacturing Firms in
China. Journal of Corporate Social Responsibility & Environmental Management, 20, 1–14.
Gutierrez, I., Alcaraz, J. M., Susaeta, L., Suárez, E., & Pin, J. R. (2015). Managing
Sustainability for Competitive Advantage: Evidence from the Hospitality Industry. Working
Paper WP-1115-E January, IESE Business School – University of Navarra.
Hair, J, Anderson, R.E, Tatham, R.L & Black, W.C. (1995). Multivariate data analysis. 4th
ed. New Jersey: Prentice-Hall Inc.
Hair, J. F., Hult, G., Tomas, M., Ringle, C. M., & Sarstedt, M. (2013). A primer on partial
least squares structural equation modeling (PLS-SEM) Thousand Oaks, CA: SAGE
Publications, Incorporated.
Hair, J.F., Babin, B.J., Anderson, R.E. & Tatham, R.L. (2010). Multivariate Data Analysis. A
Global Perspective. 7th ed. London: Prentice-Hall.

257
Hair, J.F., Hult, G.T.M, Ringle, C.M. and Sarstedt, M., (2017). A Primer on Partial Least
Squares Structural Equation Modeling (PLS-SEM) (2nd Ed). Thousand Oaks, CA. Sage
Publication, Inc.
Hair, J.F, Bush, R.P. & Ortinau, D.J. (2003). Marketing research: Within a changing
information environment, 2nd edn. New York: McGraw-Hill.
Halíř, Z. (2012). Different Perspectives on Business Performance and Impact on Performance
System Design. European Financial and Accounting Journal, 7(2), 56-81.
Hamann, R., Smith, J., Tashman, P., & Marshall, R. S. (2017). Why do SMEs go green? An
analysis of wine firms in South Africa. Business & Society, 56(1), 23-56.
Hamer, S & Collinson, G. (2014). Achieving Evidence-Based Practice - A Handbook for
Practice. Retrieved from: bookdirectory. net/? p=312122 (Date accessed 24.04.17).
Hana, U. (2013). Competitive Advantage Achievement through Innovation and Knowledge.
Journal of Competitiveness, 5(1), 82-96.
Harrison, H., Birks, M., Franklin, R & Mills, J. (2017). Case Study Research: Foundations
and Methodological Orientations. Forum Qualitative Sozialforschung / Forum: Qualitative
Social Research, 18(1), Art. 19,
Hass, S., Burnaby, P. & Biertaker, J.L. 2005. The use of performance measures as an integral
part of an entity’s strategic plan. Managerial Auditing Journal, 20(2), 179-186.
Hayes, A. F. (2009). Beyond Baron and Kenny: Statistical mediation analysis in the new
millennium. Communication Monographs, 76(4), 408-420.
Hayes, A. F. (2013). Introduction to mediation, moderation, and conditional process
analysis: A regression-based approach. New York: Guilford Press
Hayes, A. F., Preacher, K. J., & Myers, T. A. (2011). Mediation and the estimation of indirect
effects in political communication research. Sourcebook for political communication
research: Methods, measures, and analytical techniques, 23, 434-465.

258
Haytko, D. L., & Matulich, E. (2008). Green advertising and environmentally responsible
consumer behaviors: Linkages examined. Journal of Management and Marketing
Research, 1, 2.
He, Y., Gai, Y., Wu, X. & Wan, H. (2012). Quantitatively analyze composition principle of
Ma Huang Tang by structural equation modelling. Journal of Ethnopharmacology, 143:851-
858.
Hellriegel, D., Jackson, S.E., Slocum, J., Staude, G., Amos, T., Klopper, K.B., Louw, L. And
Oosthuizen, T. (2004). Management. South African Ed. Cape Town: Oxford University
Press.
Herbst, J. I., & Mills, G. (2015). How South Africa Works: And Must Do Better. Cape Town:
MacMillan
Hernández-Perlines, F., Moreno-García, J., & Yáñez-Araque, B. (2016). Training and
business performance: the mediating role of absorptive capacities. SpringerPlus, 5(1), 207.
Hilton C.E (2017). The importance of pretesting questionnaires: a field research example of
cognitive pretesting the Exercise Referral Quality of Life Scale (ER-QLS), International
Journal of Social Research Methodology, 20:1, 21-34.
Hitt, M.A., Keats, B.W., & DeMarie, S.M. (1998). Navigating in the new competitive
landscape: Building strategic flexibility and competitive advantage in the 21st century. The
academy of management executive, 12(4), 22-42.
Hlatshwayo, Z.A. (2015). Brand positioning strategy in growing and sustaining South
African B2C SMES, Master of Management in Strategic Marketing dissertation.
Johannesburg.
Ho, J.C., Shalishali, M.K., Tseng, T.L & Ang, D.S (2009). Opportunities in green supply
chain management, The coastal business journal, 8(1), 18-31.

259
Ho, T. C., Ahmad, N. H., & Ramayah, T. (2016). Competitive capabilities and business
performance among manufacturing SMEs: Evidence from an emerging economy,
Malaysia. Journal of Asia-Pacific Business, 17(1), 37-58.
Ho, T. C., Ahmad, N. H., & Ramayah, T. (2016). Competitive capabilities and business
performance among manufacturing SMEs: Evidence from an emerging economy,
Malaysia. Journal of Asia-Pacific Business, 17(1), 37-58.
Hoffman, T & Bennett, S. (2013). Evidence based practice across the health professions.
Chatswood, Sydney: Churchill Livingstone, Elsevier.
Hooper, D., Coughlan, J. & Mullen, M.R. (2008). Structural equation modelling: guidelines
for determining model fit. The Electronic Journal of Business Research Methods, 6:53-60.
Horbach, J., & Rennings, K. (2013). Environmental innovation and employment dynamics in
different technology fields – an analysis based on the German Community Innovation Survey
2009. Journal of Cleaner Production, 57: 158-165.
Horng, D. & Huang, K. (2012). The process to affect entrepreneurship: The example of
tourism in Taiwan. African Journal of Business Management, 6(25), 7583-7592.
Hove, P., & Masocha, R. (2014). Interaction of technological marketing and Porter’s five
competitive forces on SME competitiveness in South Africa. Mediterranean Journal of
Social Sciences, 5(4), 254-262.
Hu, L. T. & Bentler, P.M. 1998. Fit indices in covariance structure modeling: Sensitivity to
under parameterized model misspecification. Psychological Methods, 3(4):424-453.
Hu, L.T. & Bentler, P.M. (1999). Cutoff criteria for fit indexes in covariance structure
analysis: conventional criteria versus new alternatives. Structural Equation Modeling, 6:1-55.
Huang, M.H., Yen, G.F. & Liu, T.C., (2014), ‘Re-examining supply chain integration and the
supplier’s performance relationships under uncertainty’, International Journal of Supply
Chain Management, 19(1), 64–78.

260
Huang, Y. C., & Wu, Y. C. J. (2010). The effects of organizational factors on green new
product success: Evidence from high-tech industries in Taiwan. Management Decision,
48(10), 1539- 1567.
Hull, C.E. & Rothenberg, S. 2008. Firm performance: the interactions of corporate social
performance with innovation and industry differentiation. Strategic Management Journal,
29(7), 781–789.
Hunt, S. D., & Morgan, R. M. (2005). The resource-advantage theory of competition.
In Review of marketing research (pp. 153-206). Boston Spa: Emerald Group Publishing
Limited.
Hunt, S.D. & Morgan, R.M. (1995). The comparative advantage theory of competition,
Journal of Marketing, 59(2) 1-15.
Hunt, S.D. & Morgan, R.M. (1996). The resource-advantage theory of competition:
dynamics, dependencies, and evolutionary dimensions, Journal of Marketing, 60(4), 107-14.
Hunt, S.D. & Morgan, R.M. (1997). Resource-advantage theory: a snake swallowing its tail
or a general theory of competition, Journal of Marketing, 6 (4) 74-82.
Hunt, S.D. (1999). The strategic imperative and sustainable competitive advantage: public
policy implications of resource-advantage theory, Journal of the Academy of Marketing
Science, 27(2), 144-159.
Hunt, S.D. (2000). A general theory of competition: too eclectic or not eclectic enough? Too
incremental or not incremental enough? Too neoclassical or not neoclassical enough? Journal
of Micromarketing, 20(1), 77-8.
Hunt, S.D. (2000). A General Theory of Competition. Thousand Oaks, CA.: Sage.
Hunt, S.D. (2001). Commentary: a general theory of competition: issues, answers and an
invitation, European Journal of Marketing, 35 Nos 5/6, 524-50.

261
Ian, F.A & Lowther, D.L. 2010. Factors affecting technology integration in K-12 classroms:
A path model. Educational Technology Research and Development, 58 (2): 137-154.
Ilker, I. M. (2012). The impact of green product innovation on firm performance and
competitive capability: the moderating role of managerial environmental concern. Procedia-
Social and Behavioral Sciences, 62, 854-864.
Inglis, S. & Maclean, J. (2005). Research and Inquiry. (In Parkhouse, B.L., Ed. The
Management of Sport: It’s foundation and application Boston: McGraw-Hill. p. 15-30
Iriondo, J.M., Albert, M.J. & Escudero, A. (2003). Structural equation modeling: An
alternative for assessing causal relationships in threatened plant populations. Biological
Conservation, 113:367-377.
Isa & Yao (2013). Investigating the preference for green packaging in consumer product
choices: A choice-based conjoint approach. Business Management Dynamics, 3(2),84-96
Ismaila, B. (2011). Financial performance measurement of manufacturing small and medium
enterprises in Pretoria: a multiple exploratory case study, Magister of Technologiae,
dissertation. University of South Africa. Pretoria.
Itanyi, O., Ewurun, U. J.F.E. & Ukpere, W. I. (2012). Evaluation of decision making criteria
with special reference to quantitative and qualitative paradigms. African Journal of Business
Management. 6 (44): 11110-11117.
Jaju, A. (2016). A study of the Impact of Green Marketing on Consumer Purchasing Patterns
and Decision Making in Telangana, India. MSc in Management National College of Ireland.
Jankowski, K. R., & Flannelly, K. J. (2015). Measures of central tendency in chaplaincy,
health care, and related research. Journal of health care chaplaincy, 21(1), 39-49.
Jarin, A. (2014). Ecological Marketing Practices for Creating Competitive Advantage.
European Journal of Business and Management, 6(24), 138-143.

262
Jarin, A., Rahat, M & Kashem, M.A (2014). Eco-Banking Strategies for Competitive
Advantages, European Journal of Business and Management, 6(3), 84-91
.
Jasper, F. (2010). Applied dimensionality and test structure assessment with the START-M
mathematics test. The International Journal of Educational and Psychological Assessment, 6,
104-25.
Jawahar, I. & McLaughlin, G. (2001) Toward a Descriptive Stakeholder Theory: An
Organizational Life Cycle Approach, Academy of Management Review 26(3), 397–414.
Jeevan, P., & Bhargav, V. R. (2016). A Study on Green Packaging-A Case Study Approach
with Reference to Dell Inc. International Educational Scientific Research Journal, 2(7), 83-
84.
Jenatabadi, H.S. & Ismail, N.A. (2014). Application of structural equation modelling for
estimating airline performance. Journal of Air Transport Management, 40:25-33.
Jensen, M.C., (2001). Value Maximization, Stakeholder Theory, and the Corporate Objective
Function, Journal of Applied Corporate Finance, 14(3), 8-21.
Jirojwong, S, Johnson, M & Welch, A. (2014). Research Methods in Nursing and Midwifery.
2nd Edition. Sydney: Oxford University Press.
Johnson, J.S. (2015). Broadening the application of mixed methods in sales research. Journal
of Personal Selling & Sales Management, 35(4), 334-345.
Johnson, R. B., & Onwuegbuzie, A. (2006). Mixed methods research: A research paradigm
whose time has come. Educational Researcher, 33(7), 14-26.
Jones, G. R. & George, J. M. (2009). Contemporary management. 6th International British
Journal of Arts and Social Sciences, New York, USA: McGraw-Hill.
Kaler, J. (2003). Differentiating Stakeholder Theory, Journal of Business Ethics, 46, 71–83.

263
Kambule, N (2014). A survey on the state of energy efficiency adoption and related
challenges amongst selected manufacturing SMMEs in the Booysens area of Johannesburg.
Magister atrium in Environment management. The University of Johannesburg.
Johannesburg.
Kanakulya, E. K., & Jinzhao, W.A.N.G. (2017). The Status of Africa’s Construction Industry
and its Porter’s Five Forces Analysis. International Business and Management, 14(2), 50-53.
Kapetanopoulou, P. & Tagaras, G., (2011). Drivers and obstacles of product recovery
activities in the Greek industry. International Journal of Operations & Production
Management, 31(2), 148-166.
Kapetanopoulou, P. & Tagaras, G., (2011). Drivers and obstacles of product recovery
activities in the Greek industry. International Journal of Operations & Production
Management, 31(2), 148-166.
Kaplan, R. S., & Norton, D. P. (1996a). Using the balanced scorecard as a strategic
management system. January–February. Harvard Business Review. Product, 4126, p. 2-13
Kaplan, R. S., & Norton, D. P. (1996b). The balanced scorecard—Translating strategy into
action. Boston, MA: Harvard Business School Press.
Kariuki, M. B. J. (2011). Analysis of Market Performance: A Case of ‘OMENA’ Fish in
selected outlets in Kenya. Sc Thesis in Agricultural and Applied Economics of Egerton
University.
Kassaye, W. (2001). Green dilemma. Marketing Intelligence and Planning, 19(6), 444–455
Kasse, T. (2008). Practical insight into CMMI. New York: Artech House.
Kataja, R. (2014). Green Marketing and its Role in Firm’s Strategy. Bachelor’s Thesis,
Department of Management and International Business, Lappeenranta University of
Technology.
264
Kawulich, B. (2009). The role of theory in research. Teaching research methods in the social
sciences, 37-48.
Key, S., (1999). Toward a New Theory of the Firm: A Critique of Stakeholder ‘‘Theory’’,
Management Decision 37(4), 317–328.
Khalique, M., Shaari, J. A. N., Isa, A. H. Md., & Ageel, A. (2011). The challenges faced by
the small and medium enterprises (SMEs) in Malaysia: in intellectual capital perspective.
International Journal of current research, 3(6), 398-401.
Khan, M. W. J., & Khalique, M. (2014). An overview of small and medium enterprises in
Malaysia and Pakistan: Past, present and future scenario. Business and Management
Horizons, 2(2), 38.
Khan, M., Hussain, M & Ajmal, M.M., (2016). Green Supply Chain Management for
Sustainable Business Practice: Advances in Logistics, Operations, and Management Science,
New York: IGI Global.
Kharub, M., Kharub, M., Sharma, R., & Sharma, R. (2017). Comparative analyses of
competitive advantage using Porter diamond model (the case of MSMEs in Himachal
Pradesh). Competitiveness Review: An International Business Journal, 27(2), 132-160.
Khomba, J. K. (2011). Redesigning the Balanced Scorecard model: an African
perspective (Doctoral dissertation). The University of Pretoria.
Kimani, J.W (2015). Green marketing practices and Performance of Eco-Tourism in Kenya.
Master of Business Administration (MBA) dissertation, School Of Business, University Of
Nairobi.
Kirsten, E., Vermaak, F., & Wolmarans, H. (2015). Performance measurement in small and
medium enterprises: South African accountants' view. Journal of Economic and Financial
Sciences, 8(1), 13-34.
Klein, J. (2002). Beyond competitive advantage. Strategic Change, 11(6), 317-327.

265
Kleinbaum, D., Kupper, L., Nizam, A. & Rosenberg, E. (2013). Applied regression analysis
and other multivariable methods. London: Nelson Education.
Kline, R.B. (2010). Principles and Practice of Structural Equation Modeling, 3rd edn New
York: Guilford Press.
Kline, R.B. (2005). Principles and practice of structural equation modeling. 2nd ed. New
York: The Guilford Press.
Kline, T.J.B. & Klammer, J.D. (2001). Path model analyzed with ordinary least squares
multiple regression versus LISREL. Journal of Psychology Interdisciplinary and Applied,
135:213-225.
Ko, E., Hwang, Y.K, & Kim, E.Y. (2013). Green marketing' functions in building corporate
image in the retail setting. Journal of Business Research, 66(10), 1709– 1715.
Kolanchu, P.S. (2011). An Analysis of Community Awareness to Chemical Hazards in
Zamdela Township – Sasolburg. Masters in Disaster Management, Disaster Management
Training and Education Center for Africa, University of the Free State. Bloemfontein.
Kotler, P. & Levy, S.J. (1969). Broadening the concept of marketing. Journal of Marketing,
33(1): 10-15.
Kraaijenbrink, J., Spender, J. C., & Groen, A. J. (2010). The resource-based view: a review
and assessment of its critiques. Journal of management, 36(1), 349-372.
Kraja, Y. B., & Osmani, E. (2015). Importance of external and internal environment in
creation of competitive advantage to SMEs.(Case of SMEs, in the Northern Region of
Albania). European Scientific Journal, ESJ, 11(13), 120-130.
Krause D.R., Handfield R.B. & Tyler B.B. ( 2007), ‘The relationships between supplier
development, commitment, social capital accumulation and performance improvement’,
Journal of Operations Management, 25(2), 528–545.

266
Kroon, L., Vrijens, G., (1995), Returnable containers: an example of reverse logistics,
International Journal of Physical Distribution and Logistics Management, (25)2, 56-68.
Kumar, M., Agarwal, A., & Singh, P. (2017). Green Packaging and Marketing in Promoting
Agribusiness. Management, 3(1), 1-8
Kumar, M., Talib, S. A., & Ramayah, T. (2013). Business Research Methods. Selangor,
Malayisa: Oxford University Press.
Kumar, P. (2015). Green marketing innovations in small Indian firms. World Journal of
Entrepreneurship, Management and Sustainable Development, 11(3), 176-190.
Kumar, P., & Kumar, P. (2017). Intents of green advertisements. Asia Pacific Journal of
Marketing and Logistics, 29(1), 70-79.
Kumar, V., Aaker, D.A. & Day, G.S. (2002). Essentials of marketing research. 2nd ed. New
York: John Wiley & Sons.
Kumar, P.A., Kumar, B.D & Sandip, A. (2017). Green Initiatives for Business Sustainability
and Value Creation Advances in Business Strategy and Competitive Advantage. IGI Global,.
Kuo, S. C. (2007, October). Green manufacturing process—surface pre-treatment with micro
bubble cavitation. In: Semiconductor Manufacturing, 2007. ISSM 2007. International
Symposium (pp. 1-4). New York: IEEE.
Kurapatskie, B. & Darnall, N., (2013). Which corporate sustainability activities are
associated with greater financial payoffs?, Business Strategy and Environment 22, 49–61.
Lammers, W. J., & Badia, P. (2004). Fundamentals of behavioral research. Recording for the
Blind & Dyslexic.
Lampadarios, E. (2014). Challenges and success factors for SMEs in the chemical
distribution industry: a literature review. eprints.leedsbeckett.ac.uk.

267
Laroche, M., Bergeron, J. & Barbaro-Forleo, G. (2001). Targeting consumers who are willing
to pay more for environmentally friendly products, Journal of Consumer Marketing, 18(6),
503-20.
Lash, J. & Wellington, F. (2007), Competitive advantage on a warming planet, Harvard
Business Review, 85(3), 94-102.
Lau, J. W. (2014). Enriching stakeholder theory: Student identity of higher
education. American Journal of Industrial and Business Management, 4(12), 762-766.
Ledgerwood, J. (2014). Microfinance Handbook: An Institutional and Financial Perspective.
Washington, DC.: The World Bank.
Lee, J., & Kim, S. J. (2017). Curvilinear Relationship between Corporate Innovation and
Environmental Sustainability. Sustainability, 9(7), 1267.
Lei, P.W. & Wu, Q. (2007). Introduction to structural equation modeling: issues and practical
considerations. Instructional Topics in Educational Measurement: Issues and practice, 33-43.
Lekhanya, L. M. (2010). The use of marketing strategies by small, medium and micro
enterprises in rural KwaZulu-Natal (Master of Technology: Marketing dissertation). Durban
University of Technology, Durban, South Africa.
Lekhanya, L.M. (2014). The Level of awareness of green marketing and its managerial
implications amongst selected South African manufacturing Small, Medium and Micro
Enterprises (SMMEs) in KwaZulu–Natal. Journal of Economics and Behavioral Studies,
6(8), 625-635.
Leonidou, C.N., Katsikeas, C.S. and Morgan, N.A. (2013). Greening’ the marketing mix: do
firms do it and does it pay off?, Journal of the Academy of Marketing Science, 41(2), 151-
170.

268
Leonidou, L. C., Leonidou, C. N., Palihawadana, D., & Hultman, M. (2011). Evaluating the
green advertising practices of international firms: a trend analysis. International Marketing
Review, 28(1), 6-33.
Leonidou, N.C. & Leonidou, C.L. (2011). Research into environmental
marketing/management: a bibliography analysis. Journal of European marketing, 45(2): 68-
103.
Leste, A., Binns, T & Nel, E. (2014). South Africa, Past, Present and Future: Gold at the End
of the Rainbow? London: Routledge.
Lesuthu, K (2013). Job seekers’ perceptions about the pnet website as an e-recruitment tool
within South Africa. Master of Technology Degree in Human Resource Management. Vaal
University of Technology, Vanderbijlpark.
Levi-Jakšić, M. (Ed.). (2012). Proceedings of the XIII International Symposium SymOrg
2012: Innovative Management and Business Performance. University of Belgrade, Faculty of
Organizational Sciences.
Lin, R. J., Tan, K. H., & Geng, Y. (2013). Market demand, green product innovation, and
firm performance: evidence from Vietnam motorcycle industry. Journal of Cleaner
Production, 40, 101-107.
Lincoln, Y. S. Lynham, S. A. & Guba, E. G. (2011). Paradigmatic controversies,
contradictions, and emerging confluences, revisited in qualitative research. In Norman K.
Denzin & Yvonna S. Lincoln (Eds.), The Sage handbook of qualitative research (4th ed.,
pp.97-128). Thousand Oaks, CA: Sage.
Lindsey, K., Mauck, N., & Olsen, B. (2017). The Coming Wave of Business Succession: The
Role of Private Equity and Stakeholder Theory. doi.org/10.2139/ssrn.2925608
Liu, X.H., GE, Y.H. & Wang, Q. (2014). The effects of TMT interaction on enterprise
performance from the perspective of enterprise culture. African Journal of Business
Management, 8(4), 137-145.

269
Lohr, S. (2010). Sampling: Design and Analysis. New York: Brooks/Cole.
Longenecker, J., Petty. J., Palich, L & Loy. F. (2013). Small business management:
launching and growing entrepreneurial ventures. Stanford: Cengage Learning
Lose, T. (2016). The role of business incubators in facilitating the entrepreneurial skills
requirements of small and medium-size enterprises in the Cape metropolitan area, South
Africa. Masters dissertation, Cape Peninsula University of Technology. Cape Town. South
Africa.
Louw, L. & Venter, P. (2010). Strategic Management: Developing Sustainability in Southern
Africa. Cape Town: Oxford University Press.
Lucas, R. E., Diener, E. & Suh, E., (1996). Discriminant validity of well-being measures.
Journal of Personality and Social Psychology, 71(3), 616-268.
Luo, X. & Bhattacharya, C.B. (2006), Corporate social responsibility, customer satisfaction
and market value, Journal of Marketing, 70(4), 1-18.
Luo, Yadong, & Zhao, Hongxin. (2004). Corporate link and competitive strategy in
multinational enterprises: a perspective from subsidiaries seeking host market penetration.
Journal of International Management, 77-105.
Luotonen, D., & Hasselström, M. (2009). Subjective and objective performance assessment:
Performance pay at Trelleborg Forsheda AB. Internationella Handelshögskolan.
Ma, Y., Hou, G., & Xin, B. (2017). Green Process Innovation and Innovation Benefit: The
Mediating Effect of Firm Image. Sustainability, 9(10), 1-15
Macmillan, H. & Tampoe, M. (2000). Strategic Management. New York: Oxford University
Press.

270
Madhani, P. M. (2009). Resource Based View (RBV) of Competitive Advantages:
Importance, Issues and Implications. Issues and Implications. Indian Management Research
Journal, 1(2), 1-15
Mafini, C. (2014). The relationship between organisational resources and organisational
performance in a national government department (Doctoral dissertation). Vaal University of
Technology. Vanderbijlpark.
Mafini, C., & Muposhi, A. (2017). The impact of green supply chain management in small to
medium enterprises: Cross-sectional evidence. Journal of Transport and Supply Chain
Management, 11(1), 1-11.
Mahembe, B., Engelbrecht, A.S., & De Kock, F.S. (2013). A confirmatory factor analytic
study of a self-leadership measure in South Africa. SA Journal of Human Resource
Management/SA Tydskrif vir Menslikehulpbronbestuur, 11(1),
Majeed, S. (2011). The impact of competitive advantage on organizational performance.
European Journal of Business and Management, 3(4), 191-196.
Makhutla, E. N. (2014). The impact of fast moving consumer goods on green consumerism,
Masters in Communication Science dissertation, University of Zululand.
Malcolm, M. & Martin, C. (2003). Marketing: A Complete Guide. New York: Palgrave
Macmillan Ltd.
Manikandan, S. (2011). Frequency distribution. Journal of pharmacology &
pharmacotherapeutics, 2(1), 54-56.
Manikandan, S. (2011). Measures of central tendency: The mean. Journal of Pharmacology
and Pharmacotherapeutics, 2(2), 140-142.
Mansor, M.N.M & Ahmad, F.S (2014). Linking brand’s competitive advantage and customer
satisfaction in private chain clinic industry, Proceedings Book of ICETSR, 2014, Malaysia
Handbook on the Emerging Trends in Scientific Research.

271
Maphiri, M. C. (2015). Business rescue in South Africa and its practical application to
SME's (small to medium enterprises) (Master of Laws degree in approved courses and a
minor dissertation, University of Cape Town. South Africa.
Marcoux, A.M. (2000). "Balancing Act," in Contemporary Issues in Business Ethics, 4th
edition, edited by J. R. Desjardins & J. J. McCall (Wadsworth), pp. 92-100.
Maria, A.R. & Yusniza, K., (2016). Predictors of customer Loyalty in the Malaysian hotel are
outsourcing relationships. International Review of Management and Marketing, 6(S8),
205-211.
Mark, J., & Nwaiwu, J. N. (2015). Impact of political environment on business performance
of multinational companies in Nigeria. African Research Review, 9(3), 1-10.
Masitenyane,L.A.(2010).Examining customer-supplier relationships customer service quality
in a precast concrete manufacturing company, Magister Technologiae in Marketing, Vaal
University of Technology.
Mason, J. (2007). Qualitative Researching. (2nd Ed). London: Sage Publications.
Matchaba-Hove, T., Farrington, S. & Sharp, G. (2015). The entrepreneurial orientation-
performance relationship: A South African Small Business Perspective. Southern African
Journal of Entrepreneurship and Small Business Management, 7(2015), 36-68.
Matsheke, O.T. (2015). The Influence Of ntrepreneurial-Related Programmes On Student
Intentions To Venture Into New business Creation. Master of Technology Degree in Business
Administration dissertation, Vaal University of Technology. Vanderbijlpark.
Matsoso, M.L. (2014). Performance measures in supply chain management of small
manufacturing enterprises, Master of Technology: Cost and Management Accounting
dissertation, Cape Peninsula University of Technology, Cape Town.
Matsuno, K. & Mentzer, J.T. (2000). The effects of strategy type on the market orientation-
performance relationship. Journal of Marketing, 64(4),1-16.

272
Matthews, T. D., & Kostelis, K. T. (2011). Designing and conducting research in health and
human performance. Now York: John Wiley & Sons.
Matzler, K. & Renzl, B. 2006. The Relationship between interpersonal trust, employee
satisfaction, and employee loyalty. Total Quality Management and Business Excellence,
17(10),1261-1271.
Maupin, A. J., & Stauffer, L. A. (2010). A design tool to help small manufacturers reengineer
a product family. In ASME Design Engineering Technical Conference Proceedings,
DETC99/DTM (Vol. 14568).
Mbatha, S (2014). Development of competitive advantage strategy for the apparel
manufacturing industry of South Africa, Magister Technologiae: Fashion Design and
Technology, Tshwane University of Technology. Pretoria.
Mbizi, R., Hove, L., Thondhlana, A., & Kakava, N. (2013). Innovation in SMEs: A review of
its role in organisational performance and SMEs operations sustainability. Interdisciplinary
Journal of Contemporary Research in Business, 4(11), 370-389.
Mcmillan, J. H. & Schumacher, S. (2010). Research in Education: Evidence Based Inquiry.
7th ed. Boston: Pearson Education International.
McMillan, J. H. (2000). Essential assessment concepts for teachers and administrators (Vol.
1). New York: Corwin Press.
Mcquitty, S. 2004. Statistical power and structural equation models in business research.
Journal of Business Research, 57:175-183.
Meeus, M.T.H., and Edquist, C. (2006). Introduction to part 1: Product and process
innovation, In Hage, J. & Meeus, M. T. H. (Eds.), Innovation, science and institutional
change, Oxford: Oxford University Press.
Mello, J. & Flint, D.J. (2009). A refined view of grounded theory and its application to
logistics research. Journal of Business Logistics, 30(1):107-126.
273
Memon, M. A., Ting, H., Ramayah, T., Chuah, F., & Cheah, J. H. (2017). A review of the
methodological misconceptions and guidelines related to the application of structural
equation modeling: A Malaysian scenario. Journal of Applied Structural Equation
Modeling, 1(1). 1-13.
Merchant, K.A. & Stede, W.A. (2007). Management Control Systems: Performance
Measurement, Evaluation and Incentives. London: Pearson Education.
Mhlophe, B. (2015). Antecedents of Consumer Purchase Intentions towards Organic Food
Produces: A Case Study of the Johannesburg Municipality. Master of Commerce
(Marketing), School of Economic and Business Science, University of the Witwatersrand.
Miller, D.C. & Salkind, N. J. (2002). Handbook of research design and social measurement.
6th ed. Thousand Oaks: Sage Publication.
Miller, S, & Read. G. (1998). Questionnaire design. ESOMAR Handbook of Market and
Opinion Research.
Miryala, R.K & Mennakanti, J.P (2016). Responsible marketing for sustainable business,
New York: Zenon Academic publishing.
Mirzahassan, H. & Imani, F. H. (2013). The chain impact of customers’ value on
organizational performance: A customer-based perspective in a command economy. African
Journal of Business Management, 7(29), 2852-2862.
Mishra, S. & Suar, D. (2010). Does social responsibility influence firm performance of Indian
Company? Journal of Business Ethics, 95(4), 571–601.
Mita, G. O. (2017). Influence of generic strategies on performance of metal works SME
businesses in Naivasha town. International Academic Journal of Human Resource and
Business Administration, 2(3), 477-500.

274
Modimogale, L., & Kroeze, J. H. (2009). Using ICTs to become a competitive SME in South
Africa. Knowledge Management and Innovation in Advancing Economies: Analyses &
Solutions, 503-513.
Mogeni, L. M., & Kiarie, D. M. (2016). Effect of Green Logistics Practices on Performance
of Supply Chains in Multinational Organizations in Kenya. The International Journal of
Business & Management, 4(4), 189-198.
Mohabier, R. (2016). The Application of a Social Networking Learning Tool in a Primary
School within South Africa. Master of Business Administration Dissertation Regenesys
Business School, Sandton, South Africa.
Mohamed, S. N. S. (2016). The Factors of Practising Green Packaging Adoption among
Food Industry around Melaka, Project Report. Universiti Teknikal Malaysia Melaka UTeM,
Melaka, Malaysia.
Moloi, N. (2013). The sustainability of construction small-medium enterprises (SMEs) in
South Africa. Master of Science in building. The University of the Witwatersrand.
Johannesburg. South Africa.
Momba, K.C. (2016). Open innovation for manufacturing in small and medium enterprises.
M.Com. (Business Management) dissertation. University of Johannesburg, Johannesburg.
Mongan-Rallis, H. (2014). Guidelines for writing the Literature Review. Retrieved December
29, 2017 from. http://www.duluth.umn.edu/~hrallis/guides/researching/litreview.html.
Moonsamy, U. (2016). Open innovation in South African SMEs: A business model
perspective. The Gordon Institute of Business Science: University of Pretoria. South Africa
Moore, G. (1999). Tinged Shareholder Theory: Or What’s So Special About Stakeholders?’,
Business Ethics: A European Review, 8(2), 117–127.
Mora, M., Gelman, O., Steenkamp, A & Raisinghani, M.S (2012). Research methodologies:
Innovattions and philosophies in software system engineering and info systems. Hershey, PA:
IGI Global.
275
Morisky, DE, Ang, A & Krousel-Wood, M. (2008). Predictive Validity of a Medication
Adherence Measure in an Outpatient Setting. The Journal of Clinical Hypertension, 10(5),
348-354.
Mouton, J. (2011). How to succeed in your master’s and doctoral studies: A South African
guide and resource book. Pretoria: Van Schaik.
Mpatane, L. M. (2015). The impact of electricity supply on the manufacturing sector output
in South Africa. Masters of Commerce (Economics). North-West University, Mafikeng
Campus.
Mukonza, C. (2016). Analysis of Factors Influencing Green Entrepreneurship in South
Africa. Research, International Development Research Centre, Ottawa, Canada.
Mukwarami, S., Nyirenda, G., & Fakoya, M. B. (2017). Governance of corporate social
responsibility and return on assets in the South African mining firms. African Journal of
Public Affairs, 9(5), 137-153.
Mupemhi, S., Duve, R & Mupemhi, R. (2013). Factors Affecting the Internationalization of
Manufacturing SMEs in Zimbabwe, Investment Climate and Business Environment (ICBE)
Research Fund, Research Report N0. 62/13, pp6-40.
Murthy, S. N. & Bhojanna, U. 2010. Business research methods. 3rd ed. New Delhi: Excel
Books
Murthy, S. N., & Bhojanna, U. (2009). Business research methods. New Delhi: Excel Books
India.
Murthy, S.N. & Bhojanna, U. (2010). Business research methods. 3rd ed. New Delhi: Excel
Books.
Musara, M. (2012). Impact of Just-In-Time (JIT) inventory system on efficiency, quality and
flexibility among manufacturing sector, small and medium enterprises (SMEs) in South
Africa. African Journal of Business Management, 6(17), 5786-5791.

276
Mwaura, A. W., Letting, N., Ithinji, G., & Orwa, B. H. (2016). Green distribution practices
and competitiveness of food manufacturing firms in Kenya. International Journal of
Economics, 189-207.
Naidoo, R., & Urban, B. (2010). The relevance of operational skills towards business
sustainability: a focus on SMME manufacturers in the Vaal triangle region. Acta
Commercii, 10(1), 234-248.
Nanath, K., & Pillai, R. R. (2017). The influence of green IS practices on competitive
advantage: mediation role of green innovation performance. Information Systems
Management, 34(1), 3-19.
Naude, M. J. (2013). Supply chain challenges in the South African automotive sector: do
location, size and age matter? South African Journal of Economic and Management
Sciences, 16(4), 407-417.
Ncube, T. R. (2016). The intrinsic motivational factors of small and medium business
growth: a study on the furniture manufacturing sector in the Ethekwini Metropolitan area,
Master’s Degree in Management Sciences (Business and Administration). Durban University
of Technology, Durban, South Africa
Ndovela, S.M. (2016). An investigation into entrepreneurial intent amongst final year
commerce students at the Durban University of Technology. Master of Technology in
Business Administration dissertation. Durban University of Technology, Durban, South
Africa
Nelson, L, S. (2015). Quick Books 2015 All-in-One for Dummies. Hoboken, New Jersey:
John Wiley and Sons, Inc.
Nematatane, P. (2017). Supply Chain Partnership, Collaboration, Integration and
Relationship Commitment as Predictors Of Supply Chain Performance In South African
SMEs, Business and Social Sciences Journal, 2(1), 134-168.
Neto, J. F. D.R., Souza, C. C. D., Gallego, P. A. M., Pareira, F.D.A. R., Bono, J.A.M. &
Lopez, M. D. R. (2015). The organizational capabilities of rural enterprises, incremental
277
innovation, and the university’s contribution. African Journal of Agricultural Research,
10(21), 2203-2212.
Netshandama, K.P. (2001). The clothing and the textile industry in South Africa, 1945 to
2001: Developments, problems and prospects. Masters in public administration dissertation.
The University of the Western Cape. Bellville, Cape Town.
Neuman, L.W. (2006). Social research methods: qualitative and quantitative approaches.
6th ed. Boston MA: Pearson Education.
Newbert, S. L. (2008). Value, rareness, competitive advantage, and performance: A
conceptual-level empirical investigation of the resource-based view of the firm. Strategic
Management Journal, 29(7), 745–768.
Newby, P. (2014). Research Methods for Education. 2nd Ed.. New York: Routledge.
Nidumolu, R., Prahalad, C.K. & Rangaswami, M.R. (2009). Why sustainability is now the
key driver of innovation. Harvard Business Review 87, 56–64.
Nidumolu, R., Prahalad, C. K., & Rangaswami, M. R. (2015). Why sustainability is now the
key driver of innovation. IEEE Engineering Management Review, 43(2), 85-91.
Nusair, K. & Hua, N. 2010. Comparative assessment of structural equation modeling and
multiple regression research methodologies: E-commerce context. Tourism Management, 31,
314-324.
Nwaizugbo, I.C & Anukam, A.I (2014). Assessment of Entrepreneurial Marketing Practices
among Small and Medium Scale Enterprises in Imo State Nigeria: Prospects and Challenges,
Review of Contemporary Business Research, 3(1)77-98.
Nyilasy, G., Gangadharbatla, H., & Paladino, A. (2014). Perceived greenwashing: The
interactive effects of green advertising and corporate environmental performance on
consumer reactions. Journal of Business Ethics, 125(4), 693-707.

278
Nyirenda, G., Ngwakwe, C.C., & Ambe, C.M. (2013). Environmental management practices
and firm performance in a South African mining firm. Managing Global Transitions, 11(3),
243-249.
Nzawou, A. (2013). E-Commerce Strategies for SMME Sustained Growth in the
Manufacturing Sector. Master of Technology thesis in Business Information System, Cape
Peninsula University of Technology. Cape Town.
Nze, G. O. (2016). Exploring fast moving consumer goods (FMCG) small, medium and micro
enterprises (SMME) manufacturers need for innovation to achieve growth in KwaZulu-Natal,
Master’s Degree in Technology: Business Administration, Durban University of Technology.
Durban.
O’regan, N., Sims, M.A. & Gallear, D. (2008). Leaders, loungers, laggards: the strategic –
planning environment performance relationship re-visited in manufacturing SMEs. Journal of
Manufacturing Technology Management, 19(1), 6-21.
Obokoh, L. O., & Goldman, G. (2016). Infrastructure deficiency and the performance of
small-and medium-sized enterprises in Nigeria's Liberalised Economy. Acta
Commercii, 16(1), 1-10.
Ocloo, C.E. & Tsetse, E.K. (2013). Customer retention in the Ghanaian mobile
telecommunication industry. European Journal of Business and Social Sciences, 2(7), 136-
160.
Ofori, D.F., Nyuur, R.B. and S-Darko, M.D. 2014. Corporate social responsibility and
financial performance: Fact or fiction? A look at Ghanaian banks. Aosis Open Journal, 14(1),
1–11.
Ogiogio, G. (2005). Measuring performance of interventions in capacity building: some
fundamentals. The African Capacity Building Foundation Occasional Running Paper 4: 1-21.
Okusolubo, T. O. (2013). The Effect of Selection Processes on Employee Turnover In Small
And Medium Enterprises In Sunnyside, Pretoria, Masters Dissertation, Vaal University Of
Technology. Vanderbijlpark. South Africa.

279
Olatunji, O. S. (2015). The Impact of Information Communication Technology on Small and
Medium Scale Enterprises Productivity in Nigeria. Bachelor of Business Administration,
Vaasa University of applied science.
Olawale, F. & Garwe, D. (2010). Obstacles to the growth of new SMEs in South Africa: A
principal component analysis approach. African Journal of Business Management. 4(5):729-
738.
Omoruyi, O (2015). The Influence of Supply Chain Networks, Flexibility and Integration on
the Performance of Small and Medium Enterprises in the Southern Gauteng Region, Doctor
Technologiae in Business (Logistics). The Vaal University of Technology Vanderbijlpark.
Ongore, V.O. & Kusa, G.B. 2013. Determinants of financial performance of commercial
bank in Kenya. International Journal of Economics and Financial Issues, 3:257–252.
Orlitzky, M., Schmidt, F. and Rynes, S. (2003). Corporate social and financial performance:
A meta-analysis. Organization Studies, 24(3), 403–441.
Orsato, R. J. (2006). Competitive environmental strategies: When does it pay to be green?
California Management Review, 48(2), 127–143.
Ottman, J. A., Stafford, E. R., & Hartman, C. L. (2006). Avoiding green marketing myopia:
Ways to improve consumer appeal for environmentally preferable products. Environment:
Science and Policy for Sustainable Development, 48(5), 22-36.
Oualalou, F. (2012). Report on the role of Small and Medium-Sized Enterprises in the
Mediterranean. Third Plenary Session Bari.Oxford Dictionary. (2015a). Substitute.
http://www.oxforddictionaries.com/definition/english/substitute [150328].
Palalic, R. & Busatlic, S. (2015). Exploratory research on relationship between
entrepreneurial orientation dimensions and business performance and growth of fast and slow
growing small and medium enterprises in Bosnia and Herzegovina. International Journal of
Business and Management, 10(2), 15-30.
Pamacheche, R. (2015). The role played by management’s commitment, education and ethics
on organisational entrepreneurship in Gauteng non-profit organisations. Master of

280
Commerce (Marketing), School of Economic and Business Science, University of the
Witwatersrand.
Pamulu, M.S. (2010). Strategic management practices in the construction industry: A study
of Indonesian enterprises, Doctor of Philosophy thesis, Queensland University of
Technology.
Patterson, K & Winston, B (2016). Leading an African Renaissance: Opportunities and
Challenges. Palgrave Studies in African Leadership, London: Springer.
Pearl, J. (2011). Bayesian networks. Department of Statistics, UCLA.
Peattie, K. & Crane, A. (2005). Green marketing: legend, myth, farce or prophesy?
International Journal of Qualitative Market Research, 8(4),357- 370.
Peattie, K. (2001). Towards sustainability: The third age of green marketing. The Marketing
Review, 2(2), 129-146.
Peng, M. (2013). Global Strategy. Mason OH: Cengage Learning.
Peranginangin, J. (2015). A Conceptual Mapping Resource Advantage Theory, Competitive
Advantage Theory, and Transient Competitive Advantage. Expert Journal of Business and
Management, 3(2), 140-149.
Peston, R. (1996). Votes at stake over vision for economy. Financial Times, 11 January 1996,
p. 5.
Phau, I., & Ong, D. (2007). An investigation of the effects of environmental claims in
promotional messages for clothing brands. Marketing Intelligence & Planning, 25(7), 772-
788.
Phillips, R., Freeman, E & Wicks, A.C (2003). What Stakeholder Theory Is Not. Business
Ethics Quarterly, 13(4), 479-502.

281
Pillay, S. (2010). A critical analysis of the role of stakeholder engagement in establishing the
renewable energy sector in South Africa. Masters in Business Administration. The University
of Pretoria. Pretoria, South Africa.
Polit, DF & Hungler, BP. (2013). Essentials of Nursing Research: Methods, Appraisal, and
Utilization. 8th ed. Philadelphia: Wolters Kluwer/Lippincott Williams and Wilkins.
Pomerantz, A. M. (2016). Clinical psychology: Science, practice, and culture. Thousand
Oaks, CA.: Sage Publications.
Pooe, D., Mafini, C., & Loury-Okoumba, V.W. (2015). The influence of information sharing,
supplier trust and supplier synergy on supplier performance: The case of small and medium
enterprises. Journal of Transport and Supply Chain Management, 9(1), 1-11
Porter, M. E. (1985). Competitive advantage. New York: Free Press.
Porter, M. E. (2011). The competitive advantage of nations: creating and sustaining superior
performance. New York: Simon and Schuster.
Porter, M. E., & Van der Linde, C. (1995). Toward a new conception of the environment
competitiveness relationship. Journal of Economic Perspectives, 9(4), 97-118.
Porter, M.E. (2008). The Five Forces That Shape Competition. Harvard Business Review,
80(2), 2-23.
Pranee, C. (2010). Marketing ethical implication & social responsibility. International
Journal of Organizational Innovation, 2(3), 6-11.
Pratistha, B. (2016). The Influence of Strategic Control, Strategy Orientation, and Business
Environment on Competitive Strategy and Its Effect to Business Performance. Academy of
Strategic Management Journal, 15, 15-23.
Preacher, K. J., & Hayes, A. F. (2004). SPSS and SAS procedures for estimating indirect
effects in simple mediation models. Behavior research methods, instruments, &
computers, 36(4), 717-731.

282
Preacher, K. J., & Hayes, A. F. (2008). Asymptotic and resampling strategies forassessing
and comparing indirect effects in multiple mediator models. Behavior Research Methods,
40(3), 879-891
Preble, J. (2005). Towards a comprehensive model of stakeholder management. Business and
Society Review, 110 (4), 407-431.
Quoquab, F. Thurasamy, R & Mohammad, J. (2017). Driving Green Consumerism through
Strategic Sustainability Marketing. IGI Global.
Qureshi, S.M. & Kang, C.W. (2014). Analysing the organisational factors of project
complexity using structural equation modelling. International Journal of Project
Management. [Online]. Available at: <http://dx.doi.org/10.1016/j.ijproman.2014.04.006>.
Accessed: 17/01/2018.
Rahim, S. A., Fernando, Y., & Saad, R. (2016). Sustainable Green Supply Chain
Management and Impact on Organisations. Journal of Emerging Trends in Economics and
Management Sciences (JETEMS), 7(3), 147-155.
Ramani, G., & Kumar, V. (2008). Interaction orientation and firm performance, Journal of
Marketing, 72(1), 27-45.
Ramayah, T., Lee, J. W. C., & In, J. B. C. (2011). Network collaboration and performance in
the tourism sector. Service Business, 5(4), 411-428.
Rao, P.K., & Bhargav, V.R. (2016). A Study on Green Packaging-A Case Study Approach
With Reference To Dell Inc. International Educational Scientific Research Journal, 2(7), 83-
84.
Rea, L.M. & Parker, R.A. (2014). Designing and conducting survey research: A
comprehensive guide. New York: Wiley.
Reed, M.S. (2008). Stakeholder participation for environmental management: A literature
review. Biological Conservation, 141, 2417-2431.

283
Reinhardt F L (1998). Environmental Product Differentiation: Implications for Corporate
Strategy, California Management Review, 40(4), 43-73.
Renko, N., Sustic, I., & Butigan, R. (2011). Designing marketing strategy using the five
competitive forces model by Michael E. Porter-Case of Small Bakery in
Croatia. International journal of management cases, 13(3), 376-385.
Rennings, K., & Ziegler, A. (2004). Determinants of Environmental Innovations in Germany:
Do Organizational Measures Matter? A Discrete Choice Analysis at the Firm Level (No. 04-
30). ZEW Discussion Papers.
Rich, J., Jones, J., Heitger, D., Mowen, M., & Hansen, D. (2011). Cornerstones of Financial
and Managerial Accounting (2nd Ed). Boston:South western, Cengage Learning.
Rigdon, E. E. (1996). CFI versus RMSEA: A comparison of two fit indexes for structural
equation modeling. Structural Equation Modeling. A Multidisciplinary Journal, 3(4), 369-
379.
Robinson, L. (Ed.). (2014). Proceedings of the 2009 Academy of Marketing Science (ams)
Annual Conference. Berlin: Springer.
Robinson, H.S., Anumba, C.J., Carrillo, P.M. & Al-Ghassani, A.M. (2005). Business
performance measurement practices in construction engineering organisations. Measuring
Business Excellence, 9(1), 13-22.
Roche, M., Duffield, C. & White, E. (2011). Factors in the practice environment of nurses
working in impatient mental health: A partial least squares path modeling approach.
International Journal of Nursing Studies, 48:1475-1486.
Ross, S. A., Westerfield, R., Jordan, B.D. (2003). Fundamentals of Corporate Finance. 6th
ed. New York: McGraw-Hill.
Rossouw, D., Roux, S.J. & Groenewald, D. (2003). Strategic Management: An Applied South
African Perspective. Cape Town: New Africa Books (Pty) Ltd

284
Rothaermel, F. T. (2012). Strat.Mgmt.: Concepts and Cases. New York: McGraw-Hill/Irwin
Rumelt, R. P. (2003). What in the world is competitive advantage? Policy working
paper, 105, 1-5.
Russell, B., & Purcell, J. (2009). Online research essentials: designing and implementing
research studies. New York: John Wiley & Sons.
Russo, M. V., & Fouts, P. A. (1997). A resource-based perspective on corporate
environmental performance and profitability. Academy of Management Journal, 40(3), 534-
559.
Saad, R., & Abdullah, M. Z. (2013). Determining young people environmental consciousness
of green packaging in consumer product packaging. Elixir Marketing Mgmt, 57(1),14034-
14040
Sabir, R. I., Safdar, M., Khurshid, N., & Hafeez, I. (2014). Influence of Factors in Green
Advertising upon Purchase Intentions-A Study of Pakistani University
Students. International Review of Management and Business Research, 3(4), 2131.
Sahay, B.S, Stough, R.R, Sohal, & Goyal, S (2006). Green Business. Volume 1. Kolkota:
Allied Publishers.
Saini, M. (2014). Emerging Trends In Green Marketing. International Journal of Advanced
Engineering and Management (IJAEM), 1(1).1-4.
Sambu, F.K. (2016). Effect of green packaging on business performance in the manufacturing
in Nairobi County, Kenya International Journal of Economics, Commerce and Management,
4(2), 741-753.
Sanchez-Rodriguez, C., Hemsworth, D. & Martinez-Lorente, A.R. (2005).The effect of
supplier development initiatives on purchasing performance: A structural model. Supply
Chain Management: An International Journal, 10(4), 289–301
.

285
Sandada, M. (2013). Strategic Planning and its Relationship with the Performance of Small
and Medium sized enterprises in Gauteng. Unpublished Doctoral Dissertation. Vaal
University of Technology, Johannesburg. South Africa.
Sandada. M., Pooe. D., & Manilall. D. (2014). Strategic Planning and Its Relationship with
Business Performance among Small and Medium Enterprises in South Africa. International
Business & Economics Research Journal. 3, (3), 167- 183.
Santamaria, S., Nieto, M. J., & Miles, I. (2012). Service innovation in manufacturing firms:
Evidence from Spain. Journal Technovation, 32, 144-155.
Santos-Vijande, M, L., Lopez-Sanchez, J, A., & Trespalacios, J, A. (2012). How
organizational learning affects a firm’s flexibility, competitive strategy, and performance.
Journal of Business Research, 1079-1089.
Sari, L. A., & Hutagaol, Y. R. (2009). Debt to equity ratio, degree of operating leverage stock
beta and stock returns of food and beverages companies on the Indonesian stock
exchange. Journal of Applied Finance and Accounting, 2(1), 1-12.
Sarstedt, M., Ringle, C.M., Smith, D., Reams, R. & Hair, J.F. (2014). Journal of Family
Business Strategy, 5, 105-115.
Saunders, M., Lewis, P. & Thornhill, A. (2007). Research methods for business students. 4th
Ed. Essex: Prentice Hall.
Saunders, M., Lewis, P., and Thornhill, A. (2009). Research Methods for business students.
5th
ed. London: Prentice Hall.
Saunders, M.N., Saunders, M., Lewis, P & Thornhill, A (2011). Research Methods for
Business Students. (5th
ed.). New Delhi: Pearson Education.
Saurombe, M.D (2014). Talent Management As a Predictor of Positive Work Related
Outcomes for Academic Staff in South African HEIs. Master of Commerce in Human
Resource Management, North West University, Mafikeng Campus.

286
Schermelleh-Engel, K., & Moosbrugger, H. (2003). Evaluating the fit of structural equation
models: tests of significance and descriptive goodness-of-fit measures. Methods of
Psychological Research Online, 8(2), 23-74.
Schlegelmilch, B.B. (2002). Special Symposium on Shelby D. Hunt's "A general Theory of
Competition: Resources, Competences, Productivity Economic Growth" Part 1. Journal of
Marketing Management, 18, 221-227.
Schmuck, D., Matthes, J., Naderer, B., & Beaufort, M. (2017). The Effects of Environmental
Brand Attributes and Nature Imagery in Green Advertising. Environmental Communication,
1-16.
Schreiber, J.B., Stage, F.K., King, J., Nora, A., & Barlow, E.A. (2006). Reporting Structural
Equation Modeling and Confirmatory Factor Analysis Results: A review. The journal of
educational research, 99(6), 323-337.
Schriber, S., & Löwstedt, J. (2015). Tangible resources and the development of
organizational capabilities. Scandinavian Journal of Management, 31(1), 54-68.
Schulze, S. & Kamper, G. (2014). The use of mixed methods as reflected in two eminent
South African educational research journals. Journal for New Generation Sciences,
10(1),130-147.
.
Schumacker, R. E. & Lomax, R.G. (2004). A Beginner’s Guide to Structural Equation
Modeling. 2nd ed. Mahwah: Erlbaum.
Schumacker, R. E., & Lomax, R. G. (2010). A beginner’s guide to structural equation
modeling. New York: Routledge.
Schumacker, R. E., & Lomax, R. G. (2012). A beginner's guide to structural equation
modeling. New York: Routledge.
Schumacker, R.E. & Lomax, R.G. (2010). A beginner’s guide to structural equation
modeling. 3rd ed. New York: Routledge.

287
Schvaneveldt, S. J. (2003). Environmental performance of products: Benchmarks and tools
for measuring improvement. Benchmarking: An International Journal, 10(2), 137-152.
Majeed, S. (2011). The impact of competitive advantage on organizational performance.
European Journal of Business and Management, 3(4), 191-196.
Scotland, J. (2012). Exploring the Philosophical Underpinnings of Research: Relating
Ontology and Epistemology to the Methodology and Methods of the Scientific, Interpretive,
and Critical Research Paradigms. English Language Teaching; 5(9), 9-16.
Sedmark, M. & Longhurst, P. (2010). Methodological choices in enterprise systems research.
Business Process Management Journal, 16(1), 76-92.
Sefotho, M.M (2015). A Researcher’s Dilemma: Philosophy in Crafting Dissertations and
Theses. Journal of Social Sciences, 42(1, 2), 23-36.
Seggie, S. H., & Griffith, D. A. (2008). The resource matching foundations of competitive
advantage: An alternative perspective on the globalization of service firms. International
Marketing Review, 25(3), 262-275.
Sekaran, U & Bougie, R. (2013). Research Methods for Business. (6th
ed). Brighton, West
Sussex: John Wiley & Sons Ltd.
Sekaran, U. & Bougie, R. (2009). Research Methods for Business. A skills building approach.
London: SAGE.
Sekaran, U., & Bougie, R. (2011). Business Research Methods: A skill-building approach.
New York: McGraw-Hill
Sekaran, U., & Bougie, R. (2013). Research Methods for Business: A skills building
approach, Sixth Ed. Brighton: John Wiley & Sons Ltd.
Sekaran, U., & Bougie, R. (2016). Research methods for business: A skill building approach.
Brighton: John Wiley & Sons.

288
Sen, P.K., Bohidar, S.K, Shrivas, Sharma, Y & Modi, V (2015). Study On Innovation,
Research And Recent Development In Technology For Green Manufacturing, International
Journal of Mechanical Engineering and Robotics Research, 4(1), 185-194.
Sen, R. A. (2014). A Study of the Impact of Green Marketing Practices on Consumer Buying
Behavior in Kolkata. International Journal of Management and Commerce Innovations, 2(1),
61-70.
Sengfeng (2012). The Balanced Scorecard as an instrument to manage strategy in the Water
Board (MBA dissertation, North-West University (South Africa), Potchefstroom Campus).
Serebro and Creamers Media Research Council, (2010), South Africa’s Electricity Industry.
Available Online: http://http://www.engineeeringnews.co.za Assessed online [4 April 2017]
Shafi, A.A. (2016). The effects of access to finance on the productivity and profitability of
small and medium enterprises in the manufacturing sector of Ethiopia. Doctor Technologiae.
Tshwane University of Technology, Pretoria.
Shannon-Baker, J. (2016). Making Paradigms Meaningful in Mixed Methods Research.
Journal of Mixed Methods Research, 10(4), 319–334.
Shao, A.T. (2002). Marketing research: An aid to decision making. Cincinnati: South
Western Thompson Learning.
Shapfi, A.H.B.M (2015). The Influence of Green Product Innovation toward Business
Performance. Bachelor Degree of Technology Management in Innovation Technology
research report. Universiti Teknikal Malaysia Melaka
Sheehan, K., & Atkinson, L. (Eds.). (2016). Green Advertising and the Reluctant Consumer.
London: Routledge.
Sheehan, N. T., & Foss, N. J. (2009). Exploring the roots of Porter's activity-based
view. Journal of Strategy and Management, 2(3), 240-260.

289
Sibanda, M.M. (2013). Small Medium and Micro-Enterprises in Local Economic
Development: A South African Local Government Perspective: Journal of Public
Administration, 48(8), 656-670.
Siddique, M., Hayat, K., Akbar, I., & Cheema, K. U. R. (2013). Impediments of Green
Marketing in Pakistan. International Journal of Management & Organizational Studies, 2(1),
22-27.
Sihite, M. (2018). Competitive Advantage: Mediator of Diversification and Performance.
IOP Conference Series: Materials Science and Engineering 288(1), 012.
Sikhwari, T.M. (2015). The influence of supplier information sharing and information quality
on strategic partnerships and internal lean practices among small to medium enterprises in
South Africa (Master’s dissertation). Vaal University of Technology. Vanderbijlpark.
Silvestro, R. (2014) Performance topology mapping: understanding the drivers of
performance, International Journal of Production Economics, 156(1), 269-282.
Simon, D.H., & Gomez, M.I. (2005, May). The Competitive Causes and Consequences of
Customer Satisfaction. In American Agricultural Economics Association Annual Meeting,
Providence, Rhode Island, July.
Singh, B., Matthews, J., Mullineux, G., & Medland, T. (2009). Product development in
manufacturing SMES: Current state, challenges and relevant supportive techniques. In DS
58-6: Proceedings of ICED 09, the 17th International Conference on Engineering Design,
Vol. 6, Design Methods and Tools (pt. 2), Palo Alto, CA, USA, 24.-27.08. 2009.
Singh, M. P., Chakraborty, A., & Roy, M. (2016). The link among innovation drivers, green
innovation and business performance: empirical evidence from a developing economy. World
Review of Science, Technology and Sustainable Development, 12(4), 316-334.
Singh, P. B., & Pandey, K. K. (2012). Green marketing: Policies and practices for sustainable
development. Integral Review, 5(1), 22-30.

290
Singh, R.K., Garg, S.K. & Deshmukh, S.G. (2010). The competitiveness of SMEs in a
globalized economy: Observations from China and India. Management Research Review,
33(1), 54-65.
Sinha, G. (2012). Financial Statements Analysis. New Delhi. PHI learning private limited
Sitharam, S (2014). Factors Affecting the Performance of Small and Medium Enterprises in
Kwazulu-Natal. Master of Business Administration dissertation. University Of KwaZulu-
Natal, Durban.
Small Enterprise Development Agency (SEDA) (2012). Analysis of the needs, state and
performance of small and medium businesses in the Agriculture, Manufacturing, ICT and
Tourism Sectors in South Africa. Final report. Available online:
http://www.seda.org.za/Publications. [4 April 2017].
Smith, R. V., Densmore, L. D., & Lener, E. F. (2016). Graduate research: A guide for
students in the sciences. New York: Academic Press.
Solvalier, I. (2010). Green Marketing Strategies - Case Study about ICA Group AB, Master
Thesis in Business Administration and Economics Degree Thesis. Karlstad University
Karlstad Business School.
Somekh, B. & Lewin, C. (2005). Research methods in social sciences. London: Sage.
Steiger, J. H. & Lind, J.C. (1980). Statistically based tests for the number of common factors.
Paper presented at the annual Spring Meeting of the Psychometric Society, Iowa City, IA.
Steiger, J.H. (2007). Understanding the limitations of global fit assessment in structural
equation modeling. Personality and Individual differences, 42(5):893-898.
Stein, C.M., Morris, N.J. & Nock, N.L. (2012). Structural equation modeling. Methods in
Molecular Biology, 850,495-512.
Steinert, Y. (ed) (2014). Faculty Development in the Health Professions: A focus on
Research Practice. Montreal, QC: Springer.

291
Sternberg, E. (1997). The defects of stakeholder theory. Corporate Governance: An
International Review, 5(1), 3-10.
Sternberg, E. (2000). Just Business. New York: Oxford University Press.
Sternberg, E. (1996). The Defects of Stakeholder Theory, Corporate Governance 5(1), 3–10.
Stoelhorst, J. W., & Bridoux, F. (2007, June). Beyond competitive advantage: What can
theories of strategy explain? In Emory University Conference (pp. 14-16).
Stoppani, T. (2011). Paradigm Islands: Manhattan and Venice: Discourses on Architecture
and the City. New York:: Routledge.
Suhr, D.D. (2006). Exploratory or confirmatory factor analysis? (pp. 1-17). Cary:
SASInstitute.
Sumaedi, S., Bakti, I. G. M. Y., Astrini, N. J., Rakhmawati, T., Widianti, T., & Yarmen, M.
(2014). Public Transport Passengers’ Behavioural Intentions: Paratransit in Jabodetabek–
Indonesia. Springer Science & Business Media.
Sung-Hoea, K., Gyeong-Seokb, K., Seong-Sikc, C., Yung-Sungd, C & Seung-Neoe, S.
(2018). A Research on the Use Ofmobile Move Centers Service Using Structural Equation
Model (SEM). 4th
international conference of theory and practice. Asia Pacific Institute of
Advanced Research (APIAR), 45-53.
Sunjka, B.P., & Emwanu, B. (2015). Risk Management in Manufacturing SMEs in South
Africa. International Association for Management of Technology. IAMOT 2015 Conference
Proceedings, 1469-1486.
Swanson, A.R & Chermack, J.T (2013). Theory building in applied disciplines. San
Francisco: Berrett-Koehler Publishers, Inc.
Swenson, D. (2009). Society, spirituality, and the sacred: a social scientific introduction.
North York, Ontario: University of Toronto Press.

292
Synodinos, C. (2013). Black Generation Y Students’ Environmental Concerns, Attitudes
towards Green Advertising and Environmental Behaviour, Magister Commercii dissertation.
North-West University Vaal Triangle Campus.
Synodinos, C. (2014). Antecedents of green purchase behaviour amongst black Generation Y
students, PhD thesis, Faculty of Economic Sciences and Information Technology, North-
West University, Vaal Triangle Campus.
Synodinos, C., Bevan-Dye, A. L. & De-Klerk, N. (2013). Influence of conative attitudes
towards green advertising on black Generation Y students’ environmental behaviour.
Mediterranean Journal of Social Sciences, 4(3), 17-24.
Taasoobshirazi, G., & Wang, S. (2016). The performance of the SRMR, RMSEA, CFI, and
TLI: An examination of sample size, path size, and degrees of freedom. Journal of Applied
Quantitative Methods, 11(3), 31-40.
Tabachnick, B.G. & Fidell, L.S. (2007). Using multivariate statistics. 5th Ed. New York:
Allyn and Bacon.
Tan, Y., Zhang, Y., & Khodaverdi, R. (2017). Service performance evaluation using data
envelopment analysis and balanced scorecard approach: an application to automotive
industry. Annals of Operations Research, 248(1-2), 449-470.
Tangen, S. (2003). An overview of frequently used performance measures. Work study,
52(7): 347-354.
Tavakol, M., & Dennick, R. (2011). Making sense of Cronbach’s alpha. International
Journal of Medical Education, 2, 53-55.
Tehrani, N. (2011). Understanding green business. New York: AuthorHouse.
Tehseen, S., & Ramayah, T. (2015). Entrepreneurial competencies and SMEs business
success: The contingent role of external integration. Mediterranean Journal of Social
Sciences, 6(1), 50-59.

293
Teitelbaum, R.S., McDonald., K.S. & Brown. E. (1996). What’s Driving Return on Equity?
You Need to look Beyond the Single Number to Understand Why roe Is Booming.
cnnmoney, 29 April. http://www.uic .edu/classes/mba/mba501/Readings/ROE.htm
Teo, T., & Khine, M. S. (Editors.) (2009). Structural equation modeling in educational
research: Concepts and applications. Rotterdam, Netherlands: Sense Publishers.
Thibault, M. (2002). Factors influencing sales performance in small and medium-sized
enterprises. Master of Science thesis, The Faculty of Graduate Studies, The University of
Guelph.
Thota, H., & Munir, Z. (2011). Key concepts in innovation. London: Palgrave Macmillan.
Tias, R.A (2013). Analysis the Influence on Green Advertising and Green Product to
Consumer Involvement and Affect Purchasing Decision of Ades Mineral Water. Bachelor of
Economics research report. International Management Faculty of Economics and Business
State Islamic University Syarif Hidayatullah Jakart.
Tiwari, J. (2012). Green marketing in India: An Overview. In 2nd National Conference on
Value Based Management-Business for Value or Values in Business (pp. 34-40).
Toppo, L., & Prusty, T. (2012). From performance appraisal to performance
management. Journal of Business and Management, 3(5), 1-6.
Troup, J. N. (2010). Green marketing perceptions and opinions: An online comparative
company case study of communication strategies. Berlin: Lambert Academic Publishing.
Tuan, N. P., & Yoshi, T. (2010). Organisational capabilities, competitive advantage and
performance in supporting industries in Vietnam. Asian Academy of Management Journal,
15(1), 1-21.
Turkmen, H. (2013). Scientific review of the relational view theory and its contribution to
critical sourcing decisionmaking (Master's thesis, University of Twente).

294
Tustin, D., Ligthelm, A., Martins, D & Van Wyk, J. (2010). Marketing research in practice.
Pretoria: UNISA Press.
Tustin, D.R., Ligthelm, A.A., Martins, T.H. & van Wyk, H. (2005). Marketing research in
practice. .Pretoria: UNISA Press.
Uddin, R., Bose, T. K. & Yousuf, S. (2015). Entrepreneurial orientation (EO) and
performance of business in Khulna City, Bangladesh. Journal of Small Business and
Entrepreneurship, 27(4): 343-352.
UNIDO. (1999). SMEs in Africa survive against all odds. [Online]. Available at: Accessed:
08/06/2017.
Urban, B. & Naidoo, R. (2012). Business sustainability: Empirical evidence on operational
skills in SMEs in South Africa’, Journal of Small Business and Enterprise
Development 19(1), 146–163
USAID, (2012a). Energy Efficiency Finance: Supporting SME lending activities in South
Africa- A mapping study. Available Online: http://fspblog.finfindeasy.co,za/wp-
content/uploads/USAID-FSP-Energy-Efficiency-Finance-Mapping-Study.pdf Assessed
online [7 January 2017]
Van Auken, H., Madrid-Guijarro, A., & García-Pérez-de-Lema, D. (2008). Innovation and
performance in Spanish manufacturing SMEs. International Journal of Entrepreneurship and
Innovation Management, 8(1), 36-56.
Van den Berg, U., Labuschagne, J-P. & Van den Berg, H. (2013). The effects of greening the
supplier and innovation on environmental performance and competitive advantage, Journal
of Transport and Supply Chain Management, 7(1), 1-20.
van den Elzen, J. (2016). Consumers’ perception regarding sustainable packaging. Thesis for
the Marketing and Consumer Behaviour Group Wageningen University.
295
Van der Walt, J. (2010). Barriers to Exports faced by Manufacturing SME’s in South Africa,
Master of Business Administration dissertation, University of Pretoria. Pretoria.
Vazquez, R., Santos, M. L. & Alvarez, L. I.. (2001). Market orientation, innovation, and
competitive strategies in industrial firms. Journal of Strategic Marketing, 69-90.
Venkataraman, S. (2002). Stakeholder Value Equilibrium and the Entrepreneurial Process,
Business Ethics Quarterly, 3, 45–58.
Vigario, F. (2005). Managerial Finance. 3rd ed. Durban: LexisNexis Butterworths.
Vij, S., & Bedi, H. S. (2016). Are subjective business performance measures
justified? International Journal of Productivity and Performance Management, 65(5), 603-
621.
Viviers, S. (2009). Going green: A SMME perspective. The Southern African Journal of
Entrepreneurship and Small Business Management, 2(1) 30-49.
Vosloo, J.J. (2014). A sport management programme for educator training in accordance
with diverse needs of South African schools. Dissertation. North West University.
Vanderbijlpark.
Waddock, S.A. & Graves, S.B. (1997). The corporate social performance: Financial
performance link. Strategic Management Journal, 18(4),303–309.
Wagner, J. (2005). Potenciál účetních informací pro měření finanční výkonnosti. (in English:
Accounting Information Potential for Performance Measurement). Praha, University of
Economics, 2005, Doctoral Thesis.
Wahid, N. A., & Lee, T. T. (2011). Product, process and combined green innovations on
firm’s competitive advantages‖. Elixir Marketing Marketing, 38, 4330-4334.
Wahyuni, D. (2012). The research design maze: Understanding paradigms, cases, methods
and methodologies. Journal of Applied Management Accounting Research, 10(1),69-80.

296
Wang, X. (2014). What drives Chinese private colleges’ internationalization? African Journal
Business Management, 8(16), 671-680).
Webb, J. (2000). Questionnaires and their design. The Marketing review, 1(2), 197-218.
Wegner, T. (2000). Quantitative methods for marketing decisions. Cape Town: Juta.
Weiss, A. (1995). Cracks in the Foundations of Stakeholder Theory. Electronic Journal of
Radical Organizational Theory. http://www.mgnt.waikato.ac.nz/research/ejrot:Vol1_1
/weiss.pdf
Welman, C., Kruger, F. & Mitchell, B. (2005). Research methodology. Cape Town: Oxford
University Press.
Wen-Cheng, W., Chien-Hung, L & Ying-Chien, C. (2011). Types of competitive advantage
and analysis, International Journal of Business Management, 6(5), 100-105.
Wentzel, P.J (2012). Modelling Financial Services Adoption through an Intermediary in
South Africa: TAM and SEM Approach. Doctor of Philosophy thesis. University of Pretoria.
Pretoria
Wiid, J. & Diggines, C. (2011). Marketing Rresearch. Cape Town: Juta and Company.
Wijetunge, W. (2016). Service Quality, Competitive Advantage and Business Performance in
Service Providing SMEs in Sri Lanka. International Journal of Scientific and Research
Publication, 6(7), 720-728.
Williams, L.J., Vandenberg, R.J., & Edwards, J.R. (2009). Structural Equations Modeling in
management research: A guide for improved analysis. The Academy of Management Annals,
3(1), 543–604.
Williamson, K., Burstein, F. & McKemmish, S. (2002). The Two Major Traditions of
Research. In P. R. Harvey & D. S. Ferguson (Eds.), Research Methods for Students,
Academics and Professionals: Information Management and Systems (2nd ed.): Centre of
Information Studies, Charles Sturt University, Wagga Wagga, New South Wales

297
Wilson, J. (2010). Essentials of business research: a guide to doing your research project.
Thousand Oaks, CA.: Sage.
Wong, J. M. (2011). A relational view of resources-based theory: the case of
internationalization of Li & Fung group. The Journal of Human Resource and Adult
Learning, 7(2), 34-39.
Wongrassamee, S., Gardiner, P.D. & Simmons, J.E.L. (2003). Performance measurement
tools: the balanced scorecard and the EFQM excellence model. Measuring Business
Excellence, 7(1), 14-29.
World Economic Forum, (2016). Insight report: The global competitiveness report 2015–
2016, viewed 17 May 2017,
http://www3.weforum.org/docs/gcr/20152016/Global_Competitiveness_Report_2015-
2016.pdf
Wothke, W. (2010). Introduction to structural equation modelling course note. American
Institute of Research, 1-63.
Wu, I. L., & Chang, C. H. (2012). Using the balanced scorecard in assessing the
performance of e-SCM diffusion: A multi-stage perspective. Decision Support Systems, 52,
474–485.
Wu, M. (2013). Towards a stakeholder perspective on competitive advantage. International
Journal of Business and Management, 8(4), 20-29.
WU, W.W. (2010). Linking Bayesian networks and PLS path modeling for causal analysis.
Expert Systems with Applications, 37, 134-139.
Wu, Z. Choi, T.Y. & Rungtusanatham, M.J. (2010). Supplier–supplier relationships in buyer–
supplier–supplier triads: Implications for supplier performance, Journal of Operations
Management 28, 115–123.

298
Xie, X., Huo, J., Qi, G., & Zhu, K. X. (2016). Green Process Innovation and Financial
Performance in Emerging Economies: Moderating Effects of Absorptive Capacity and Green
Subsidies. IEEE Transactions on Engineering Management, 63(1), 101-112.
Yan, Y. K., & Yazdanifard, R. (2014). The concept of green marketing and green product
development on consumer buying approach. Global journal of commerce and management
perspective, 3, 33-38.
Yang, X. S., Nagar, A. K., & Joshi, A. (Eds.). (2017). Smart Trends in Systems, Security and
Sustainability: Proceedings of Ws4 2017 (Vol. 18). Berlin: Springer.
Yannopoulos, P. (2011). Defensive and offensive strategies for market success. International
Journal of Business and Social Science, 2(13), 1-12.
Yeboah-Boateng, E. O. (2013). Cyber-Security Challenges with SMEs in Developing
Economies: Issues of Confidentiality, Integrity & Availability (CIA). Aalborg: Institut for
Elektroniske Systemer, Aalborg Universitet.
Yee, H.P. (2016). Green Marketing Practice and Its Effect on Small and Medium Enterprises
Performance. Bachelor of Technopreneurship dissertation. Universiti Teknikal Malaysia
Melaka.
Yen, H.J & Chen, J. (2010). The Effects of Co-operation on Innovation Competence. 4th
International Conference on Operations and Supply Chain Management, Hong Kong &
Guangzhou, Jul.25 to Jul.31, 2010.
Yilmaz, C., Sezen, B. & Kabadayi, E.T. (2004). Supplier fairness as a mediating factor in the
supplier performance–reseller satisfaction relationship, Journal of Business Research 57,
854–863.
Yuan, Ke-Hai. (2005). Fit indices versus Test Statistics. Multivariate Behavioral Research.
40(1), 115- 148.

299
Zahari, F., & Thurasamy, R. (2012). Linking green product innovation, technological and
human resource capabilities: A conceptual model. In Innovation Management and
Technology Research (ICIMTR), 2012 International Conference on (pp. 162-167). New
York: IEEE.
Zahari, F.M & Ramaya, T. (2017). Green Innovation and Firm Performance: The Ecological
Modernization Perspective. Journal of Technology and Operations Management, 12 (1), 21-
31.
Zailani, S., Shaharudin, M. R., Govindasamy, V., Ismail, M., & Mahdzar, S. F. A. S. (2015).
The eco-efficiency practices of the sustainable packaging and its effect towards sustainable
supply chain performance. In Technology Management and Emerging Technologies
(ISTMET), 2015 International Symposium on (pp. 448-453). IEEE., August).
Zait, A. & Bertea, P. E. (2011). Methods for testing discriminant validity. Management and
Marketing, 9(2), 217-224.
Zeeman, R.C. (2013). Hedonic and Unitarian shopping motivations among South African
black generation Y students. MCom dissertation in Marketing Management. North West
University. Vaal Triangle.
Zhanglan, (2016). Green Marketing Practices and Competitive Advantage: A Case of
Commercial Real Estate Development Companies in Nairobi, Kenya. Master of Business
Administration (MBA), School of Business, University Of Nairobi.
Zhu, Q., Sarkis, J. & Lai, K. (2013). Institutional-based antecedents and performance
outcomes of internal and external green supply chain management practices, Journal of
Purchasing and Supply Management, 19(2), 106–117.
Ziegler, A., & Nogareda, J. S. (2009). Environmental management systems and technological
environmental innovations: Exploring the causal relationship. Research Policy, 38(5), 885-
893.
300
Zikmund, M., Babin, B.J., Carr, J.C. & Griffin, M. (2013). Business Research Methods. 8th
Ed. Mason: South Western.
Zikmund, W.G. & Babin, B.J. (2013). Essentials of marketing research. 5th ed. Mason:
SouthWestern Cengage Learning.
Zou, P.X.W., Sunindijo, R.Y. & Dainty, A.R.J. (2014). A mixed methods research design for
bridging the gap between research and practice in construction safety. Safety Science,
70:316–326.
Zulkiffli, S. & Perera, N. (2011). A literature analysis on business performance for SMES -
subjective or objective measures? 2011 SIBR Conference on Interdisciplinary Business and
Economics Research (pp. 1-9). Bangkok, Thailand: Society of Interdisciplinary Business
Research (SIBR).
Zulkiffli, S. N. A. (2014). Business performance for SMEs: Subjective or objective
measures. Review of Integrative Business and Economics Research, 3(1), 371-381.
Zulwayo, N.V. (2013). Correlation Between Coping Strategies And The Levels Of
Posttraumatic Stress Disorder And Depressive Symptoms Among Sexually Assaulted
Survivors In North West Province, South Africa. Masters of Curationis (Nursing Sciences) In
the Faculty of Agriculture, Science and Technology at North West University (Mafikeng
Campus).

301
APPENDIX A: ETHICAL CLEARANCE CERTIFICATE

302
APPENDIX B: CONSENT LETTER
I acknowledge that I understand the research and that the research has been fully explained to
me. I also understand that the information which I give to the researcher will be used in the
research report.
I further acknowledge that the researcher has promised me the following:
That my participation in this research is voluntary
That my personal details will remain anonymous throughout the research study as well as in
the research dissertation
That I can refuse to answer any questions which I feel uncomfortable with
I hereby consent to being a participant for the research study: The Impact of green
marketing practices on competitive advantage and business performance among
manufacturing small and medium enterprises (SMEs) in South Africa.
Signature (Please Sign with an X)
Date Signed _____________________

303
APPENDIX C: PARTICIPANT INFORMATION SHEET
23 July 2017
Dear Sir/Madam
My name is Eugine Tafadzwa Maziriri, and I am currently studying my Doctor of philosophy
(PhD) in Marketing at the University of the Witwatersrand, Johannesburg. I am conducting
research on the impact of green marketing practices on competitive advantage and business
performance among manufacturing small and medium enterprises (SMEs) in South Africa.
As a manager of a manufacturing small and medium enterprise, you are invited to take part in
this survey. The primary objective of this study is to determine the impact of green marketing
practices on competitive advantage as well as to determine how competitive advantage has an
impact on business performance of SMEs in the manufacturing sector of South Africa. The
results of the study will be a doctoral thesis, and will become available online after
completion of the research. Please take note that there are no right or wrong answers. This
survey is confidential and anonymous, which are both guaranteed by no need to enter your
name on the questionnaire. The participants’ involvement is solely answering the
questionnaire, and participation does not involve any risk or loss of benefits whether or not
you participate, neither when ambiguity arises, nor does the research does not under any
circumstance involve payment. In addition, your participation is completely voluntary, you
may chose not to participate in the study, not to answer any questions or withdraw at any time
without any penalty.
The first part of the survey captures some demographic data. Please tick whichever boxes are
applicable. The second part of the survey comprises 50 statements. Please indicate the extent
to which you agree with each statement, by ticking in the appropriate box. The entire survey
should take you 30 minutes to complete. Thank you for considering participation. Should
you have any questions, or should you wish to obtain a copy of the results of the survey,
please contact me on (081)-040 5090, or online via email at [email protected]. My
supervisor’s name and contact details are: Professor Richard Chinomona- to reach at

304
[email protected] (071)-024 7488. My co-supervisor’s name and contact details
are: Dr Norman Chiliya-to reach at [email protected] (060) 985 4838.
Kind regards,
Eugine Tafadzwa Maziriri
PhD Candidate: Division of Marketing
School of Economic and Business Science
University of the Witwatersrand, Johannesburg

305
APPENDIX D: QUESTIONNAIRE
SECTION A: DEMOGRAPHIC INFORMATION
This section seeks some background information about you. It is important to obtain this
information, as this will have a bearing on the results of the survey. Please tick whichever
boxes are applicable.
A1 Please indicate your gender
Male
Female Prefer not to say
A2 Please indicate your age category
18 to 30
years
31-39
years
40-49 years
50-59 years
60 years and
above
A3 What is your highest level of education?
No formal
education
Basic
Education
Diploma
Degree
Postgraduate
or equivalent
degree

306
A4 Is this a family business?
Yes
No
A5 Please indicate the number of employees working in your business?
Less than 10
employees
Between
10 and 50
employees
Between 50
and 100
employees
Between 100 and
200 employees
Above 200
employees
A6 How long have you been in business?
1-3 years 4-6years 7 to 10years 11-20years 21 years and
above
A7 In which area is your business situated
CBD
Outskirts Industrial
Other
SECTION B: Green packaging
Below are statements about green packaging you can indicate the extent to which you agree
or disagree with the statement by ticking the corresponding number in the 5 point scale
below:
1=strongly disagree 2= disagree 3= moderately agree 4= agree 5= strongly agree
Please tick only one number for each statement
GP1 The packaging of our products is non-
biodegradable
Strongly
disagree
1 2 3 4 5 Strongly
agree
GP2 The packaging of our products is reusable Strongly
disagree
1 2 3 4 5 Strongly
agree
GP3 We package most of our products in
recycle materials
Strongly
disagree
1 2 3 4 5 Strongly
agree

307
GP4 We substitute our unfriendly packaging
materials with friendly materials
Strongly
disagree
1 2 3 4 5 Strongly
agree
GP5 Our products have no excessive packaging Strongly
disagree
1 2 3 4 5 Strongly
agree
SECTION C: Green advertising
Below are statements about green advertising you can indicate the extent to which you agree
or disagree with the statement by ticking the corresponding number in the 5 point scale
below:
1=strongly disagree 2= disagree 3= moderately agree 4= agree 5= strongly agree
Please tick only one number for each statement
GA1 Our messages on sustainability focus on
environmental impact of the products
Strongly
disagree
1 2 3 4 5 Strongly
agree
GA2 Our messages on sustainability focus on
environmental benefits of the products
Strongly
disagree
1 2 3 4 5 Strongly
agree
GA3 Our messages on sustainability intend to
encourage environmentally responsible
behaviour among consumers
Strongly
disagree
1 2 3 4 5 Strongly
agree
GA4 Our messages on sustainability focus on
company’s values regarding impact on
environment
Strongly
disagree
1 2 3 4 5 Strongly
agree
GA5 Our messages on sustainability focus on
company’s mission regarding impact on
environment
Strongly
disagree
1 2 3 4 5 Strongly
agree
GA6 We make environmental claims based on
life expectancy of products (e.g. raw
material production, manufacturing)
Strongly
disagree
1 2 3 4 5 Strongly
agree
SECTION D: Green product innovation
Below are statements about green product innovation you can indicate the extent to which
you agree or disagree with the statement by ticking the corresponding number in the 5 point
scale below:
1=strongly disagree 2= disagree 3= moderately agree 4= agree 5= strongly agree
Please tick only one number for each statement

308
GPI1 Our firm often places emphasis on
developing new green-products through
new technologies to simplify their package.
Strongly
disagree
1 2 3 4 5 Strongly
agree
GPI2 Our firm often places emphasis on
developing new green-products through
new technologies to simplify their
construction.
Strongly
disagree
1 2 3 4 5 Strongy
agree
GPI3 Our firm often places emphasis on
developing new green-products through
new technologies to easily recycle their
components.
Strongly
disagree
1 2 3 4 5 Strongly
agree
GPI4 Our firm often places emphasis on
developing new green-products through
new technologies to easily decompose their
materials.
Strongly
disagree
1 2 3 4 5 Strongly
agree
GPI5 Our firm often places emphasis on
developing new green-products through
new technologies to use natural materials.
Strongly
disagree
1 2 3 4 5 Strongly
agree
GPI6 Our firm often places emphasis on
developing new green-products through
new technologies to reduce damage from
waste as much as possible.
Strongly
disagree
1 2 3 4 5 Strongly
agree
GPI7 Our firm often places emphasis on
developing new green-products through
new technologies to use as little energy as
possible.
Strongly
disagree
1 2 3 4 5 Strongly
agree
SECTION E: Green process innovation
Below are statements about green process innovatiomn you can indicate the extent to which
you agree or disagree with the statement by ticking the corresponding number in the 5 point
scale below:
1=strongly disagree 2= disagree 3= moderately agree 4= agree 5= strongly agree
Please tick only one number for each statement
GPRI1 The manufacturing process of the business
effectively reduces the emission of
hazardous substances or waste.
Strongly
disagree
1 2 3 4 5 Strongly
agree
GPRI2 The manufacturing process of the business
recycles waste and emission that allow
Strongly
disagree
1 2 3 4 5 Strongly
agree

309
SECTION F: Competitive advantage
Below are statements about competitive advantage you can indicate the extent to which you
agree or disagree with the statement by ticking the corresponding number in the 5 point scale
below:
1=strongly disagree 2= disagree 3= moderately agree 4= agree 5= strongly agree
Please tick only one number for each statement
CA1 Our products are difficult for
competitors to copy
Strongly
disagree
1 2 3 4 5 Strongly
agree
CA2 Our response to competitive moves in
the market place is good
Strongly
disagree
1 2 3 4 5 Strongly
agree
CA3 Our ability to track changes in customer
needs and wants is good
Strongly
disagree
1 2 3 4 5 Strongly
agree
CA4 We are quick to respond to customer
complaints
Strongly
disagree
1 2 3 4 5 Strongly
agree
CA5 Our collection of strategic information
about customers and competitors for
use with strategic planning is good
Strongly
disagree
1 2 3 4 5 Strongly
agree
CA6 Our speed of disseminating information
in-house about competitors is good
Strongly
disagree
1 2 3 4 5 Strongly
agree
CA7 Our analysis of customer satisfactions
with the products is good
Strongly
disagree
1 2 3 4 5 Strongly
agree
CA8 We make effort for products changes to
overcome customer dissatisfaction with
existing products
Strongly
disagree
1 2 3 4 5 Strongly
agree
them to be treated and re-used.
GPRI3 The manufacturing process of the business
reduces the consumption of water,
electricity, coal, or oil.
Strongly
disagree
1 2 3 4 5 Strongly
agree
GPRI4 The manufacturing process of the business
reduces the use of raw materials.
Strongly
disagree
1 2 3 4 5 Strongly
agree
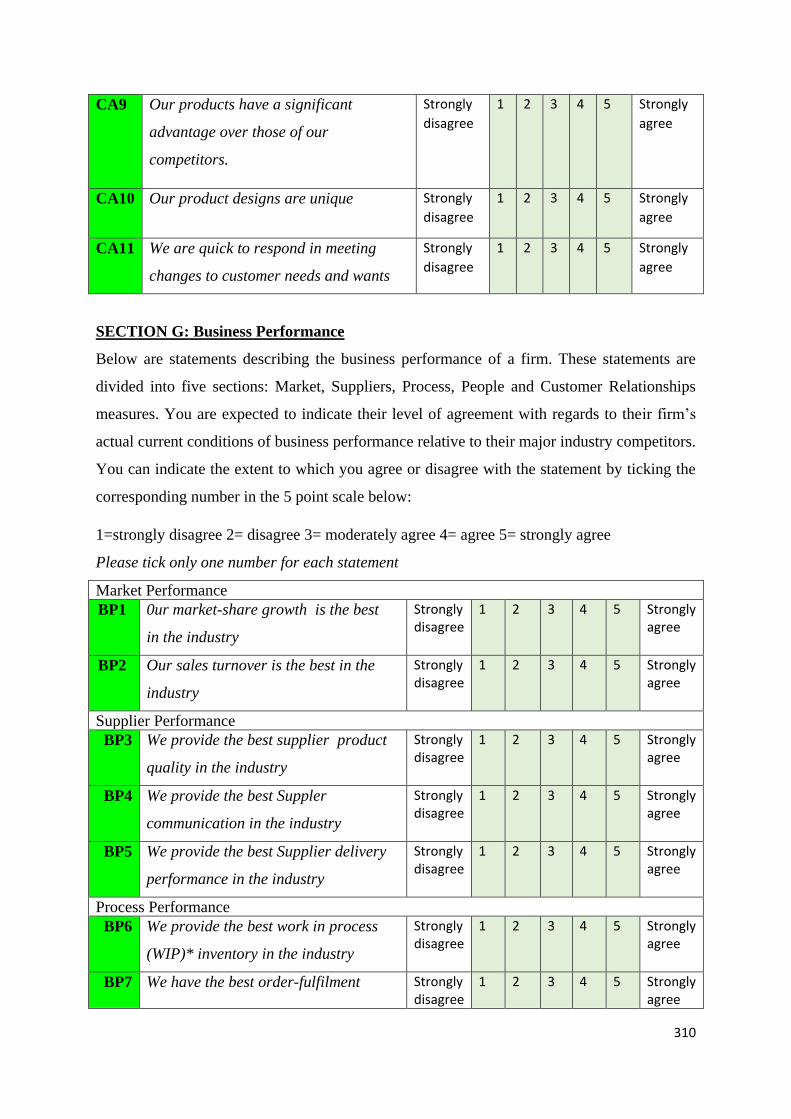
310
CA9 Our products have a significant
advantage over those of our
competitors.
Strongly
disagree
1 2 3 4 5 Strongly
agree
CA10 Our product designs are unique Strongly
disagree
1 2 3 4 5 Strongly
agree
CA11 We are quick to respond in meeting
changes to customer needs and wants
Strongly
disagree
1 2 3 4 5 Strongly
agree
SECTION G: Business Performance
Below are statements describing the business performance of a firm. These statements are
divided into five sections: Market, Suppliers, Process, People and Customer Relationships
measures. You are expected to indicate their level of agreement with regards to their firm’s
actual current conditions of business performance relative to their major industry competitors.
You can indicate the extent to which you agree or disagree with the statement by ticking the
corresponding number in the 5 point scale below:
1=strongly disagree 2= disagree 3= moderately agree 4= agree 5= strongly agree
Please tick only one number for each statement
Market Performance
BP1 0ur market-share growth is the best
in the industry
Strongly disagree
1 2 3 4 5 Strongly agree
BP2 Our sales turnover is the best in the
industry
Strongly disagree
1 2 3 4 5 Strongly agree
Supplier Performance
BP3 We provide the best supplier product
quality in the industry
Strongly disagree
1 2 3 4 5 Strongly agree
BP4 We provide the best Suppler
communication in the industry
Strongly disagree
1 2 3 4 5 Strongly agree
BP5 We provide the best Supplier delivery
performance in the industry
Strongly disagree
1 2 3 4 5 Strongly agree
Process Performance
BP6 We provide the best work in process
(WIP)* inventory in the industry
Strongly disagree
1 2 3 4 5 Strongly agree
BP7 We have the best order-fulfilment Strongly disagree
1 2 3 4 5 Strongly agree

311
lead time** in the industry
BP8 We have the best product-quality
development in the industry
Strongly disagree
1 2 3 4 5 Strongly agree
People performance
BP9 We have the best Performance-
appraisal results in the industry
Strongly disagree
1 2 3 4 5 Strongly agree
BP10 We have the best skill level
of employees in the industry
Strongly disagree
1 2 3 4 5 Strongly agree
BP11 We have the best departmenta
l communication in the industry
Strongly disagree
1 2 3 4 5 Strongly agree
Customer-Relationship Performance
BP12 Our resolution of customer complaints
is the best in the industry
Strongly disagree
1 2 3 4 5 Strongly agree
BP13 Our customer loyalty/retention
is the best in the industry
Strongly disagree
1 2 3 4 5 Strongly agree
BP14 Our quality reputation and
award achievement is the best
in the industry
Strongly disagree
1 2 3 4 5 Strongly agree
BP15 Our product returns rate is the best in
the industry
Strongly disagree
1 2 3 4 5 Strongly agree
BP16 Our speed of order handling
and processing is the best in
the industry
Strongly disagree
1 2 3 4 5 Strongly agree
*Work-in-Process (WIP) relates to the products or components that are no longer raw
material but have yet to become finished products.
**Lead time is the time between placement and receipt of an order.
THE END- Thank You

312
APPENDIX E: DATA ANALSYS RESULTS
SCALE RELIABILITY CHECK: GREEN PACKAGING SCALE
Reliability Statistics
Cronbach's
Alpha
Cronbach's
Alpha Based on
Standardized
Items
N of Items
.805 .806 5
Item Statistics
Mean Std. Deviation N
GP1 3.56 1.010 304
GP2 3.65 1.086 304
GP3 4.09 1.024 304
GP4 3.75 .986 304
GP5 3.92 1.039 304
Inter-Item Correlation Matrix
GP1 GP2 GP3 GP4 GP5
GP1 1.000 .716 .512 .574 .258
GP2 .716 1.000 .418 .595 .307
GP3 .512 .418 1.000 .435 .311
GP4 .574 .595 .435 1.000 .413
GP5 .258 .307 .311 .413 1.000
Inter-Item Covariance Matrix
GP1 GP2 GP3 GP4 GP5
GP1 1.019 .784 .529 .572 .270
GP2 .784 1.178 .465 .636 .346
GP3 .529 .465 1.048 .439 .330
GP4 .572 .636 .439 .972 .424
GP5 .270 .346 .330 .424 1.080
Summary Item Statistics
Mean Minimum Maximum Range Maximum /
Minimum
Variance N of
Items
Item Means 3.797 3.563 4.092 .530 1.149 .045 5
Item Variances 1.059 .972 1.178 .206 1.212 .006 5
Inter-Item .480 .270 .784 .514 2.900 .023 5

313
Covariances
Inter-Item
Correlations
.454 .258 .716 .458 2.777 .020 5
Item-Total Statistics
Scale Mean if
Item Deleted
Scale Variance
if Item Deleted
Corrected Item-
Total
Correlation
Squared
Multiple
Correlation
Cronbach's
Alpha if Item
Deleted
GP1 15.42 9.558 .690 .586 .737
GP2 15.33 9.246 .676 .566 .739
GP3 14.89 10.315 .536 .310 .784
GP4 15.23 9.775 .672 .462 .743
GP5 15.06 11.066 .397 .198 .825
Scale Statistics
Mean Variance Std. Deviation N of Items
18.98 14.888 3.858 5
SCALE RELIABILITY CHECK: GREEN ADVERTISING SCALE
Reliability Statistics
Cronbach's
Alpha
Cronbach's
Alpha Based on
Standardized
Items
N of Items
.786 .787 6
Item Statistics
Mean Std. Deviation N
GA1 3.52 1.152 304
GA2 3.77 1.002 304
GA3 3.72 1.042 304
GA4 3.73 1.044 304
GA5 3.80 1.033 304
GA6 3.84 1.054 304

314
Inter-Item Correlation Matrix
GA1 GA2 GA3 GA4 GA5 GA6
GA1 1.000 .320 .304 .415 .320 .337
GA2 .320 1.000 .529 .343 .266 .281
GA3 .304 .529 1.000 .416 .429 .375
GA4 .415 .343 .416 1.000 .520 .381
GA5 .320 .266 .429 .520 1.000 .483
GA6 .337 .281 .375 .381 .483 1.000
Inter-Item Covariance Matrix
GA1 GA2 GA3 GA4 GA5 GA6
GA1 1.326 .369 .365 .499 .380 .409
GA2 .369 1.005 .552 .358 .276 .296
GA3 .365 .552 1.085 .452 .462 .412
GA4 .499 .358 .452 1.090 .561 .419
GA5 .380 .276 .462 .561 1.067 .525
GA6 .409 .296 .412 .419 .525 1.110
Summary Item Statistics
Mean Minimum Maximum Range Maximum /
Minimum
Variance N of
Items
Item Means 3.729 3.520 3.842 .322 1.092 .013 6
Item Variances 1.114 1.005 1.326 .322 1.320 .012 6
Inter-Item
Covariances
.422 .276 .561 .286 2.036 .007 6
Inter-Item
Correlations
.381 .266 .529 .263 1.987 .007 6
Item-Total Statistics
Scale Mean if
Item Deleted
Scale Variance
if Item Deleted
Corrected Item-
Total
Correlation
Squared
Multiple
Correlation
Cronbach's
Alpha if Item
Deleted
GA1 18.86 13.986 .470 .238 .771
GA2 18.61 14.648 .483 .317 .765
GA3 18.65 13.786 .580 .395 .742
GA4 18.65 13.688 .593 .377 .739
GA5 18.58 13.882 .573 .393 .744
GA6 18.53 14.124 .521 .299 .757

315
Scale Statistics
Mean Variance Std. Deviation N of Items
22.38 19.357 4.400 6
SCALE RELIABILITY CHECK: GREEN PRODUCT INNOVATION SCALE
Reliability Statistics
Cronbach's
Alpha
Cronbach's
Alpha Based on
Standardized
Items
N of Items
.797 .798 7
Item Statistics
Mean Std. Deviation N
GPI1 3.56 1.088 304
GPI2 3.55 1.089 304
GPI3 3.64 1.017 304
GPI4 3.49 .985 304
GPI5 3.35 1.035 304
GPI6 3.41 1.148 304
GPI7 3.93 1.002 304
Inter-Item Correlation Matrix
GPI1 GPI2 GPI3 GPI4 GPI5 GPI6 GPI7
GPI1 1.000 .460 .269 .339 .314 .292 .240
GPI2 .460 1.000 .395 .299 .225 .331 .221
GPI3 .269 .395 1.000 .393 .405 .390 .421
GPI4 .339 .299 .393 1.000 .535 .367 .340
GPI5 .314 .225 .405 .535 1.000 .434 .450
GPI6 .292 .331 .390 .367 .434 1.000 .462
GPI7 .240 .221 .421 .340 .450 .462 1.000
Inter-Item Covariance Matrix
GPI1 GPI2 GPI3 GPI4 GPI5 GPI6 GPI7
GPI1 1.185 .545 .298 .363 .354 .365 .262
GPI2 .545 1.185 .438 .320 .254 .414 .241
GPI3 .298 .438 1.035 .394 .427 .456 .430
GPI4 .363 .320 .394 .970 .545 .415 .336
GPI5 .354 .254 .427 .545 1.072 .515 .467
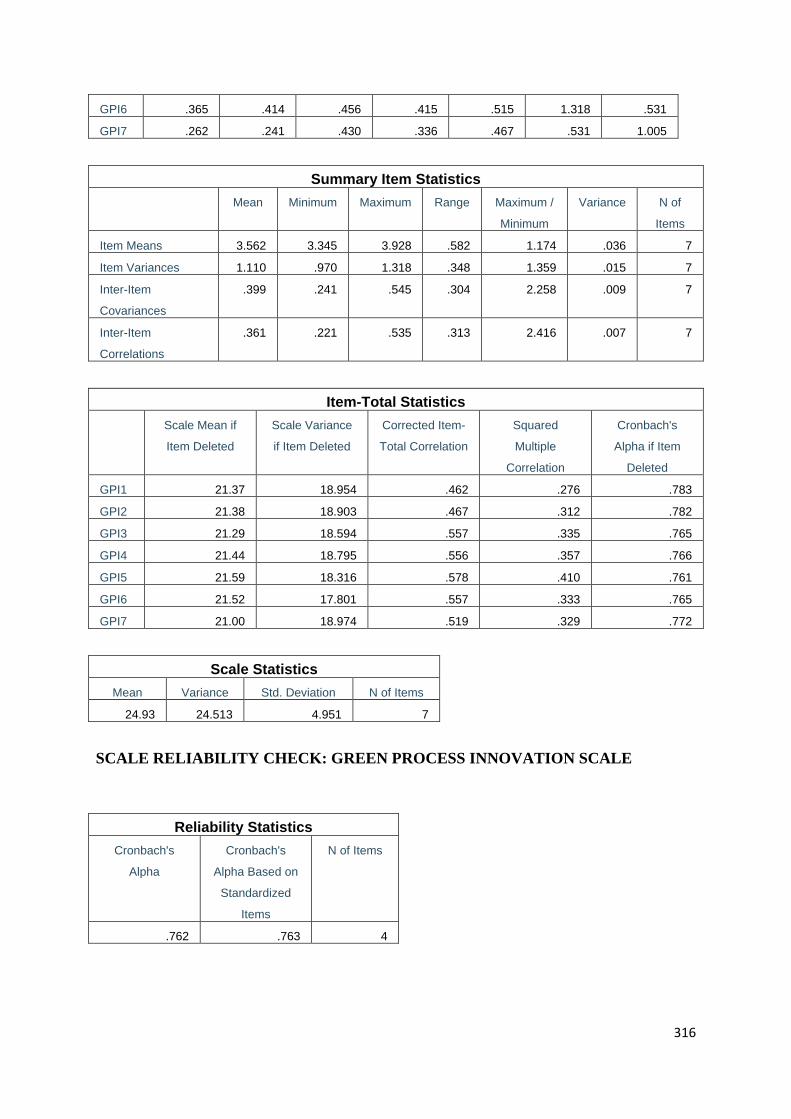
316
GPI6 .365 .414 .456 .415 .515 1.318 .531
GPI7 .262 .241 .430 .336 .467 .531 1.005
Summary Item Statistics
Mean Minimum Maximum Range Maximum /
Minimum
Variance N of
Items
Item Means 3.562 3.345 3.928 .582 1.174 .036 7
Item Variances 1.110 .970 1.318 .348 1.359 .015 7
Inter-Item
Covariances
.399 .241 .545 .304 2.258 .009 7
Inter-Item
Correlations
.361 .221 .535 .313 2.416 .007 7
Item-Total Statistics
Scale Mean if
Item Deleted
Scale Variance
if Item Deleted
Corrected Item-
Total Correlation
Squared
Multiple
Correlation
Cronbach's
Alpha if Item
Deleted
GPI1 21.37 18.954 .462 .276 .783
GPI2 21.38 18.903 .467 .312 .782
GPI3 21.29 18.594 .557 .335 .765
GPI4 21.44 18.795 .556 .357 .766
GPI5 21.59 18.316 .578 .410 .761
GPI6 21.52 17.801 .557 .333 .765
GPI7 21.00 18.974 .519 .329 .772
Scale Statistics
Mean Variance Std. Deviation N of Items
24.93 24.513 4.951 7
SCALE RELIABILITY CHECK: GREEN PROCESS INNOVATION SCALE
Reliability Statistics
Cronbach's
Alpha
Cronbach's
Alpha Based on
Standardized
Items
N of Items
.762 .763 4

317
Item Statistics
Mean Std. Deviation N
GPRI1 3.63 1.136 304
GPRI2 3.69 1.097 304
GPRI3 3.70 1.075 304
GPRI4 3.67 1.119 304
Inter-Item Correlation Matrix
GPRI1 GPRI2 GPRI3 GPRI4
GPRI1 1.000 .491 .494 .361
GPRI2 .491 1.000 .540 .353
GPRI3 .494 .540 1.000 .433
GPRI4 .361 .353 .433 1.000
Inter-Item Covariance Matrix
GPRI1 GPRI2 GPRI3 GPRI4
GPRI1 1.290 .612 .603 .458
GPRI2 .612 1.203 .636 .434
GPRI3 .603 .636 1.156 .521
GPRI4 .458 .434 .521 1.251
Summary Item Statistics
Mean Minimum Maximum Range Maximum /
Minimum
Variance N of
Items
Item Means 3.673 3.628 3.697 .069 1.019 .001 4
Item Variances 1.225 1.156 1.290 .135 1.117 .003 4
Inter-Item
Covariances
.544 .434 .636 .203 1.468 .007 4
Inter-Item
Correlations
.445 .353 .540 .186 1.527 .005 4
Item-Total Statistics
Scale Mean if
Item Deleted
Scale Variance
if Item Deleted
Corrected Item-
Total
Correlation
Squared
Multiple
Correlation
Cronbach's
Alpha if Item
Deleted
GPRI1 11.06 6.791 .565 .330 .703
GPRI2 11.00 6.861 .585 .365 .692
GPRI3 10.99 6.752 .630 .402 .668
GPRI4 11.02 7.353 .466 .225 .756

318
Scale Statistics
Mean Variance Std. Deviation N of Items
14.69 11.429 3.381 4
SCALE RELIABILITY CHECK: COMPETITIVE ADVANTAGE SCALE
Reliability Statistics
Cronbach's
Alpha
Cronbach's
Alpha Based on
Standardized
Items
N of Items
.837 .846 11
Item Statistics
Mean Std. Deviation N
CA1 3.76 1.040 304
CA2 3.62 1.065 304
CA3 3.78 1.102 304
CA4 4.02 .953 304
CA5 4.10 .884 304
CA6 3.84 1.038 304
CA7 4.07 .884 304
CA8 4.29 .850 304
CA9 4.33 .798 304
CA10 4.05 .819 304
CA11 3.93 .909 304
Inter-Item Correlation Matrix
CA1 CA2 CA3 CA4 CA5 CA6 CA7 CA8 CA9 CA1
0
CA1
1
CA1 1.00
0
.453 .280 .181 .238 .320 .240 .147 .234 .127 .121
CA2 .453 1.00
0
.536 .227 .181 .133 .279 .147 .175 .125 .131
CA3 .280 .536 1.00
0
.280 .296 .149 .147 .290 .118 .174 .096
CA4 .181 .227 .280 1.00
0
.515 .323 .434 .283 .536 .287 .272
CA5 .238 .181 .296 .515 1.00
0
.427 .469 .523 .483 .508 .321

319
CA6 .320 .133 .149 .323 .427 1.00
0
.623 .483 .513 .379 .313
CA7 .240 .279 .147 .434 .469 .623 1.00
0
.611 .662 .460 .429
CA8 .147 .147 .290 .283 .523 .483 .611 1.00
0
.472 .518 .288
CA9 .234 .175 .118 .536 .483 .513 .662 .472 1.00
0
.489 .410
CA1
0
.127 .125 .174 .287 .508 .379 .460 .518 .489 1.00
0
.440
CA1
1
.121 .131 .096 .272 .321 .313 .429 .288 .410 .440 1.00
0
Inter-Item Covariance Matrix
CA1 CA2 CA3 CA4 CA5 CA6 CA7 CA8 CA9 CA10 CA11
CA1 1.081 .501 .321 .179 .218 .345 .220 .130 .194 .108 .115
CA2 .501 1.135 .629 .231 .170 .147 .263 .133 .149 .109 .127
CA3 .321 .629 1.213 .294 .289 .170 .143 .272 .104 .157 .096
CA4 .179 .231 .294 .907 .434 .319 .365 .229 .407 .224 .236
CA5 .218 .170 .289 .434 .782 .392 .366 .393 .341 .368 .258
CA6 .345 .147 .170 .319 .392 1.077 .571 .426 .425 .322 .295
CA7 .220 .263 .143 .365 .366 .571 .781 .459 .467 .333 .345
CA8 .130 .133 .272 .229 .393 .426 .459 .723 .320 .361 .223
CA9 .194 .149 .104 .407 .341 .425 .467 .320 .636 .319 .298
CA10 .108 .109 .157 .224 .368 .322 .333 .361 .319 .670 .327
CA11 .115 .127 .096 .236 .258 .295 .345 .223 .298 .327 .826
Summary Item Statistics
Mean Minimum Maximum Range Maximum /
Minimum
Variance N of
Items
Item Means 3.980 3.615 4.326 .711 1.197 .049 11
Item Variances .894 .636 1.213 .577 1.907 .040 11
Inter-Item
Covariances
.284 .096 .629 .533 6.522 .015 11
Inter-Item
Correlations
.333 .096 .662 .566 6.878 .024 11
Item-Total Statistics
Scale Mean if
Item Deleted
Scale Variance
if Item Deleted
Corrected Item-
Total
Correlation
Squared
Multiple
Correlation
Cronbach's
Alpha if Item
Deleted

320
CA1 40.02 35.366 .377 .290 .836
CA2 40.16 35.055 .390 .446 .835
CA3 40.00 34.947 .380 .403 .837
CA4 39.76 34.366 .523 .420 .823
CA5 39.68 33.868 .627 .487 .814
CA6 39.94 33.207 .571 .466 .818
CA7 39.71 33.261 .693 .656 .809
CA8 39.49 34.495 .590 .530 .818
CA9 39.45 34.427 .646 .567 .814
CA10 39.73 35.183 .541 .432 .822
CA11 39.85 35.645 .427 .274 .830
Scale Statistics
Mean Variance Std. Deviation N of Items
43.78 41.110 6.412 11
SCALE RELIABILITY CHECK: BUSINESS PERFORMANCE SCALE
Reliability Statistics
Cronbach's
Alpha
Cronbach's
Alpha Based on
Standardized
Items
N of Items
.858 .856 16
Item Statistics
Mean Std. Deviation N
BP1 3.65 1.006 304
BP2 3.93 .959 304
BP3 4.09 .915 304
BP4 4.01 .921 304
BP5 4.19 .820 304
BP6 4.02 .966 304
BP7 4.23 .915 304
BP8 3.96 1.006 304
BP9 3.90 .995 304
BP10 3.86 .973 304
BP11 3.92 1.042 304
BP12 4.10 .956 304
BP13 3.79 1.170 304
BP14 3.60 1.268 304

321
BP15 3.72 1.148 304
BP16 3.86 1.041 304
Inter-Item Correlation Matrix
B
P
1
B
P
2
B
P
3
B
P
4
B
P
5
B
P
6
B
P
7
B
P
8
B
P
9
B
P
10
B
P
11
B
P
12
B
P
13
B
P
14
B
P
15
B
P
16
B
P
1
1.
00
0
.3
47
.3
30
.3
28
.3
58
.1
42
-
.0
46
-
.0
84
.0
76
-
.0
94
.0
54
.0
87
.1
46
.0
65
.1
38
-
.0
08
B
P
2
.3
47
1.
00
0
.5
15
.5
02
.4
34
.0
19
.1
39
.0
32
.1
28
.0
17
.0
41
.0
83
.0
54
.1
64
.0
95
.1
12
B
P
3
.3
30
.5
15
1.
00
0
.7
51
.6
51
.1
59
.2
40
.2
61
.2
66
.1
84
.1
52
.2
54
.1
99
.1
38
.2
08
.0
37
B
P
4
.3
28
.5
02
.7
51
1.
00
0
.6
66
.0
55
.0
33
.1
96
.1
09
.0
83
.0
08
.2
50
.0
72
.0
20
.1
27
.0
12
B
P
5
.3
58
.4
34
.6
51
.6
66
1.
00
0
.2
00
.1
29
.2
37
.2
13
.0
68
.1
33
.2
58
.2
63
.1
00
.1
29
.0
24
B
P
6
.1
42
.0
19
.1
59
.0
55
.2
00
1.
00
0
.3
54
.2
99
.4
51
.2
83
.1
49
.1
73
.3
53
.1
94
.1
83
.0
61
B
P
7
-
.0
46
.1
39
.2
40
.0
33
.1
29
.3
54
1.
00
0
.5
90
.4
05
.4
85
.3
30
.3
55
.4
43
.3
98
.3
48
.2
79
B
P
8
-
.0
84
.0
32
.2
61
.1
96
.2
37
.2
99
.5
90
1.
00
0
.4
35
.5
81
.4
19
.5
32
.4
09
.2
81
.3
85
.2
47
B
P
9
.0
76
.1
28
.2
66
.1
09
.2
13
.4
51
.4
05
.4
35
1.
00
0
.5
65
.4
41
.4
36
.4
76
.4
51
.2
36
.1
62
B
P
10
-
.0
94
.0
17
.1
84
.0
83
.0
68
.2
83
.4
85
.5
81
.5
65
1.
00
0
.5
10
.4
34
.4
12
.4
12
.2
92
.1
73
B
P
11
.0
54
.0
41
.1
52
.0
08
.1
33
.1
49
.3
30
.4
19
.4
41
.5
10
1.
00
0
.5
04
.4
98
.4
39
.4
56
.3
46
B
P
.0
87
.0
83
.2
54
.2
50
.2
58
.1
73
.3
55
.5
32
.4
36
.4
34
.5
04
1.
00
.6
35
.5
04
.5
27
.0
63

322
12 0
B
P
13
.1
46
.0
54
.1
99
.0
72
.2
63
.3
53
.4
43
.4
09
.4
76
.4
12
.4
98
.6
35
1.
00
0
.5
42
.6
09
.2
93
B
P
14
.0
65
.1
64
.1
38
.0
20
.1
00
.1
94
.3
98
.2
81
.4
51
.4
12
.4
39
.5
04
.5
42
1.
00
0
.5
66
.5
34
B
P
15
.1
38
.0
95
.2
08
.1
27
.1
29
.1
83
.3
48
.3
85
.2
36
.2
92
.4
56
.5
27
.6
09
.5
66
1.
00
0
.5
53
B
P
16
-
.0
08
.1
12
.0
37
.0
12
.0
24
.0
61
.2
79
.2
47
.1
62
.1
73
.3
46
.0
63
.2
93
.5
34
.5
53
1.
00
0
Inter-Item Covariance Matrix
B
P1
B
P
2
B
P
3
B
P
4
B
P
5
B
P
6
B
P
7
B
P8
B
P
9
B
P1
0
B
P1
1
B
P1
2
B
P1
3
B
P1
4
B
P1
5
B
P1
6
B
P1
1.
01
2
.3
3
5
.3
0
4
.3
0
4
.2
9
5
.1
3
8
-
.0
4
2
-
.0
85
.0
7
6
-
.0
92
.0
56
.0
84
.1
71
.0
83
.1
59
-
.0
08
B
P2
.3
35
.9
1
9
.4
5
2
.4
4
3
.3
4
1
.0
1
8
.1
2
2
.0
30
.1
2
2
.0
16
.0
41
.0
76
.0
61
.1
99
.1
05
.1
12
B
P3
.3
04
.4
5
2
.8
3
8
.6
3
3
.4
8
8
.1
4
1
.2
0
1
.2
41
.2
4
3
.1
64
.1
45
.2
23
.2
13
.1
60
.2
19
.0
35
B
P4
.3
04
.4
4
3
.6
3
3
.8
4
8
.5
0
3
.0
4
9
.0
2
7
.1
82
.1
0
0
.0
74
.0
07
.2
20
.0
78
.0
24
.1
35
.0
11
B
P5
.2
95
.3
4
1
.4
8
8
.5
0
3
.6
7
2
.1
5
9
.0
9
7
.1
95
.1
7
4
.0
54
.1
14
.2
02
.2
52
.1
04
.1
21
.0
20
B
P6
.1
38
.0
1
8
.1
4
1
.0
4
9
.1
5
9
.9
3
4
.3
1
3
.2
91
.4
3
4
.2
66
.1
50
.1
60
.4
00
.2
38
.2
03
.0
62
B
P7
-
.0
42
.1
2
2
.2
0
1
.0
2
7
.0
9
7
.3
1
3
.8
3
8
.5
43
.3
6
9
.4
32
.3
15
.3
11
.4
74
.4
62
.3
66
.2
66
B
P8
-
.0
.0
3
.2
4
.1
8
.1
9
.2
9
.5
4
1.
01
.4
3
.5
69
.4
39
.5
12
.4
81
.3
58
.4
45
.2
59

323
85 0 1 2 5 1 3 2 5
B
P9
.0
76
.1
2
2
.2
4
3
.1
0
0
.1
7
4
.4
3
4
.3
6
9
.4
35
.9
9
1
.5
48
.4
58
.4
15
.5
54
.5
69
.2
70
.1
68
B
P1
0
-
.0
92
.0
1
6
.1
6
4
.0
7
4
.0
5
4
.2
6
6
.4
3
2
.5
69
.5
4
8
.9
47
.5
17
.4
03
.4
68
.5
08
.3
26
.1
75
B
P1
1
.0
56
.0
4
1
.1
4
5
.0
0
7
.1
1
4
.1
5
0
.3
1
5
.4
39
.4
5
8
.5
17
1.
08
7
.5
03
.6
08
.5
80
.5
46
.3
76
B
P1
2
.0
84
.0
7
6
.2
2
3
.2
2
0
.2
0
2
.1
6
0
.3
1
1
.5
12
.4
1
5
.4
03
.5
03
.9
14
.7
11
.6
10
.5
79
.0
63
B
P1
3
.1
71
.0
6
1
.2
1
3
.0
7
8
.2
5
2
.4
0
0
.4
7
4
.4
81
.5
5
4
.4
68
.6
08
.7
11
1.
36
8
.8
04
.8
18
.3
57
B
P1
4
.0
83
.1
9
9
.1
6
0
.0
2
4
.1
0
4
.2
3
8
.4
6
2
.3
58
.5
6
9
.5
08
.5
80
.6
10
.8
04
1.
60
7
.8
24
.7
04
B
P1
5
.1
59
.1
0
5
.2
1
9
.1
3
5
.1
2
1
.2
0
3
.3
6
6
.4
45
.2
7
0
.3
26
.5
46
.5
79
.8
18
.8
24
1.
31
9
.6
60
B
P1
6
-
.0
08
.1
1
2
.0
3
5
.0
1
1
.0
2
0
.0
6
2
.2
6
6
.2
59
.1
6
8
.1
75
.3
76
.0
63
.3
57
.7
04
.6
60
1.
08
3
Summary Item Statistics
Mean Minimum Maximum Range Maximum /
Minimum
Variance N of
Items
Item Means 3.927 3.602 4.230 .628 1.174 .032 16
Item Variances 1.024 .672 1.607 .935 2.392 .054 16
Inter-Item
Covariances
.280 -.092 .824 .916 -8.968 .044 16
Inter-Item
Correlations
.271 -.094 .751 .845 -7.998 .037 16
Item-Total Statistics
Scale Mean if
Item Deleted
Scale Variance
if Item Deleted
Corrected Item-
Total Correlation
Squared
Multiple
Correlation
Cronbach's
Alpha if Item
Deleted
BP1 59.18 79.015 .199 .268 .863
BP2 58.91 77.718 .293 .392 .858

324
BP3 58.75 75.025 .487 .679 .849
BP4 58.83 77.152 .345 .711 .856
BP5 58.64 76.672 .435 .579 .852
BP6 58.82 76.609 .357 .327 .855
BP7 58.61 74.232 .540 .507 .847
BP8 58.88 72.776 .571 .618 .845
BP9 58.93 72.722 .581 .528 .845
BP10 58.98 73.775 .530 .556 .847
BP11 58.91 72.785 .546 .487 .846
BP12 58.74 72.523 .623 .707 .843
BP13 59.05 69.314 .662 .628 .839
BP14 59.24 69.521 .589 .621 .844
BP15 59.12 70.708 .598 .632 .843
BP16 58.98 75.976 .359 .600 .856
Scale Statistics
Mean Variance Std. Deviation N of Items
62.84 83.581 9.142 16
CFA TABLES: MODEL FIT SUMMARY
Model Fit Summary
CMIN
Model NPAR CMIN DF P CMIN/DF
Default model 143 548.674 385 .000 1.425
Saturated model 528 .000 0
Independence model 32 4765.390 496 .000 9.608
RMR, GFI
Model RMR GFI AGFI PGFI
Default model .053 .902 .865 .658
Saturated model .000 1.000
Independence model .248 .353 .312 .332
Baseline Comparisons
Model NFI
Delta1
RFI
rho1
IFI
Delta2
TLI
rho2 CFI
Default model .885 .852 .963 .951 .962
Saturated model 1.000
1.000
1.000
Independence model .000 .000 .000 .000 .000

325
Parsimony-Adjusted Measures
Model PRATIO PNFI PCFI
Default model .776 .687 .746
Saturated model .000 .000 .000
Independence model 1.000 .000 .000
NCP
Model NCP LO 90 HI 90
Default model 163.674 105.566 229.800
Saturated model .000 .000 .000
Independence model 4269.390 4051.843 4494.234
FMIN
Model FMIN F0 LO 90 HI 90
Default model 1.811 .540 .348 .758
Saturated model .000 .000 .000 .000
Independence model 15.727 14.090 13.372 14.832
RMSEA
Model RMSEA LO 90 HI 90 PCLOSE
Default model .037 .030 .044 .999
Independence model .169 .164 .173 .000
AIC
Model AIC BCC BIC CAIC
Default model 834.674 869.630 1366.209 1509.209
Saturated model 1056.000 1185.067 3018.591 3546.591
Independence model 4829.390 4837.212 4948.335 4980.335
ECVI
Model ECVI LO 90 HI 90 MECVI
Default model 2.755 2.563 2.973 2.870
Saturated model 3.485 3.485 3.485 3.911
Independence model 15.939 15.221 16.681 15.964
HOELTER
Model HOELTER
.05
HOELTER
.01
Default model 239 250
Independence model 35 37

326
Standardized Regression Weights: (Group number 1 - Default model)
Estimate
GP4 <--- GP .688
GP3 <--- GP .585
GP2 <--- GP .828
GP1 <--- GP .850
GA6 <--- GA .614
GA5 <--- GA .770
GA4 <--- GA .676
GA3 <--- GA .572
GPI7 <--- GPI .731
GPI6 <--- GPI .651
GPI5 <--- GPI .616
GPI4 <--- GPI .498
GPI3 <--- GPI .588
GPRI3 <--- GPRI .739
GPRI2 <--- GPRI .727
GPRI1 <--- GPRI .696
CA4 <--- CA .482
CA5 <--- CA .619
CA6 <--- CA .693
CA7 <--- CA .886
CA8 <--- CA .711
CA9 <--- CA .763
CA10 <--- CA .603
BP15 <--- BP .748
BP14 <--- BP .719
BP13 <--- BP .776
BP12 <--- BP .720
BP11 <--- BP .634
BP10 <--- BP .523
BP9 <--- BP .627
BP8 <--- BP .647
BP7 <--- BP .560
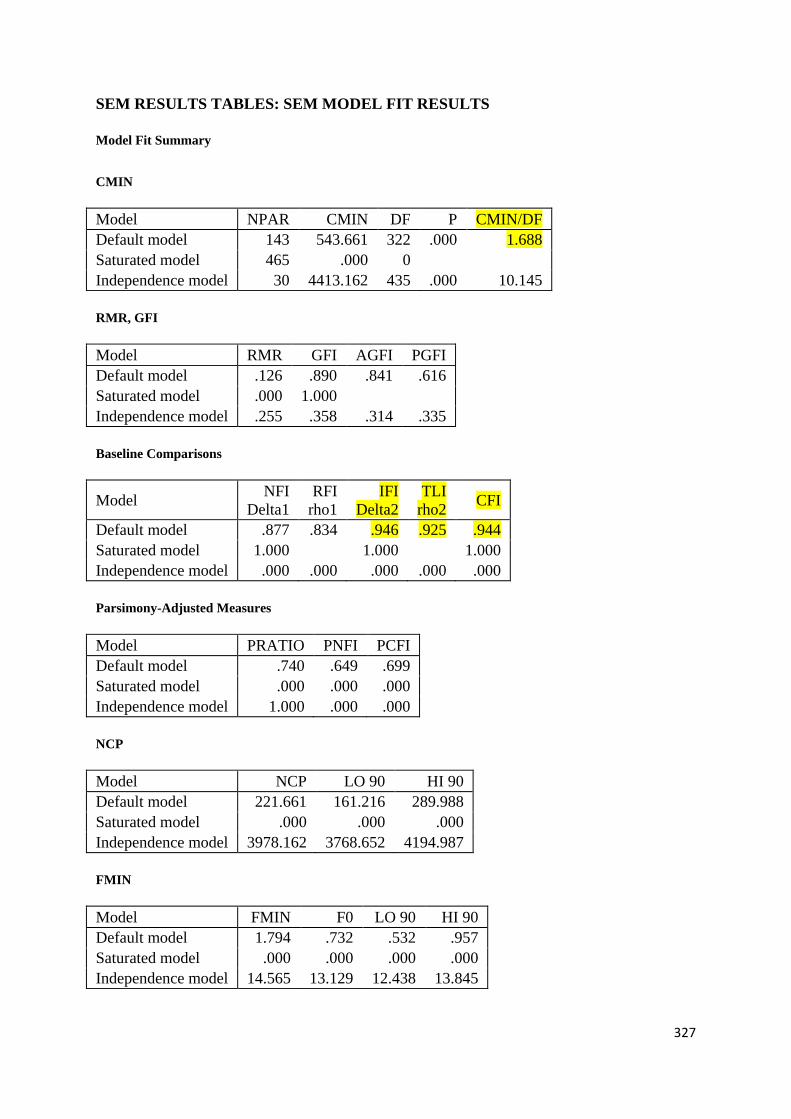
327
SEM RESULTS TABLES: SEM MODEL FIT RESULTS
Model Fit Summary
CMIN
Model NPAR CMIN DF P CMIN/DF
Default model 143 543.661 322 .000 1.688
Saturated model 465 .000 0
Independence model 30 4413.162 435 .000 10.145
RMR, GFI
Model RMR GFI AGFI PGFI
Default model .126 .890 .841 .616
Saturated model .000 1.000
Independence model .255 .358 .314 .335
Baseline Comparisons
Model NFI
Delta1
RFI
rho1
IFI
Delta2
TLI
rho2 CFI
Default model .877 .834 .946 .925 .944
Saturated model 1.000
1.000
1.000
Independence model .000 .000 .000 .000 .000
Parsimony-Adjusted Measures
Model PRATIO PNFI PCFI
Default model .740 .649 .699
Saturated model .000 .000 .000
Independence model 1.000 .000 .000
NCP
Model NCP LO 90 HI 90
Default model 221.661 161.216 289.988
Saturated model .000 .000 .000
Independence model 3978.162 3768.652 4194.987
FMIN
Model FMIN F0 LO 90 HI 90
Default model 1.794 .732 .532 .957
Saturated model .000 .000 .000 .000
Independence model 14.565 13.129 12.438 13.845

328
RMSEA
Model RMSEA LO 90 HI 90 PCLOSE
Default model .048 .041 .055 .705
Independence model .174 .169 .178 .000
AIC
Model AIC BCC BIC CAIC
Default model 829.661 862.257 1361.196 1504.196
Saturated model 930.000 1035.993 2658.418 3123.418
Independence model 4473.162 4480.001 4584.673 4614.673
ECVI
Model ECVI LO 90 HI 90 MECVI
Default model 2.738 2.539 2.964 2.846
Saturated model 3.069 3.069 3.069 3.419
Independence model 14.763 14.071 15.479 14.785
HOELTER
Model HOELTER
.05
HOELTER
.01
Default model 204 214
Independence model 34 35
Estimates (Group number 1 - Default model)
Scalar Estimates (Group number 1 - Default model)
Maximum Likelihood Estimates
Regression Weights: (Group number 1 - Default model)
Estimate S.E. C.R. P Label
CA <--- GP .069 .044 1.587 .113
CA <--- GA .065 .059 1.104 .270
CA <--- GPI .170 .066 2.579 .010
CA <--- GPRI -.007 .052 -.132 .895
BP <--- CA .338 .096 3.514 ***
BP <--- GP .224 .060 3.747 ***
BP <--- GA .085 .082 1.042 .298
BP <--- GPI .306 .088 3.478 ***
BP <--- GPRI .314 .079 3.982 ***
GP4 <--- GP .825 .060 13.701 ***
GP3 <--- GP .710 .063 11.332 ***
GP2 <--- GP 1.042 .062 16.759 ***

329
Estimate S.E. C.R. P Label
GP1 <--- GP 1.000
GA6 <--- GA 1.000
GA5 <--- GA 1.281 .138 9.286 ***
GA4 <--- GA 1.129 .126 8.988 ***
GA3 <--- GA .981 .120 8.147 ***
GPI7 <--- GPI 1.000
GPI6 <--- GPI 1.184 .136 8.723 ***
GPI5 <--- GPI 1.072 .119 9.031 ***
GPI3 <--- GPI .972 .118 8.210 ***
GPRI3 <--- GPRI 1.037 .115 8.991 ***
GPRI2 <--- GPRI 1.101 .123 8.933 ***
GPRI1 <--- GPRI 1.000
CA5 <--- CA 1.000
CA6 <--- CA 1.276 .123 10.386 ***
CA7 <--- CA 1.317 .114 11.545 ***
CA8 <--- CA 1.111 .103 10.731 ***
CA9 <--- CA 1.074 .099 10.862 ***
CA10 <--- CA .843 .083 10.191 ***
BP15 <--- BP 1.000
BP14 <--- BP 1.054 .087 12.070 ***
BP13 <--- BP 1.013 .081 12.555 ***
BP12 <--- BP .776 .069 11.253 ***
BP10 <--- BP .687 .077 8.972 ***
BP9 <--- BP .754 .083 9.130 ***
BP8 <--- BP .668 .068 9.761 ***
BP7 <--- BP .572 .064 8.955 ***
BP11 <--- BP .785 .071 11.006 ***
Standardized Regression Weights: (Group number 1 - Default model)
Estimate
CA <--- GP .103
CA <--- GA .072
CA <--- GPI .188
CA <--- GPRI -.009
BP <--- CA .231
BP <--- GP .228
BP <--- GA .065
BP <--- GPI .232
BP <--- GPRI .274
GP4 <--- GP .708
GP3 <--- GP .584
GP2 <--- GP .822
GP1 <--- GP .842

330
Estimate
GA6 <--- GA .602
GA5 <--- GA .776
GA4 <--- GA .684
GA3 <--- GA .591
GPI7 <--- GPI .654
GPI6 <--- GPI .655
GPI5 <--- GPI .649
GPI3 <--- GPI .600
GPRI3 <--- GPRI .702
GPRI2 <--- GPRI .738
GPRI1 <--- GPRI .647
CA5 <--- CA .648
CA6 <--- CA .693
CA7 <--- CA .847
CA8 <--- CA .746
CA9 <--- CA .771
CA10 <--- CA .591
BP15 <--- BP .747
BP14 <--- BP .701
BP13 <--- BP .742
BP12 <--- BP .685
BP10 <--- BP .600
BP9 <--- BP .650
BP8 <--- BP .568
BP7 <--- BP .526
BP11 <--- BP .634
Covariances: (Group number 1 - Default model)
Estimate S.E. C.R. P Label
e39 <--> e40 .238 .036 6.615 ***
e37 <--> e39 .179 .036 5.046 ***
e37 <--> e38 .145 .034 4.332 ***
e33 <--> e39 -.181 .037 -4.915 ***
e32 <--> e37 -.133 .035 -3.815 ***
e32 <--> e38 -.275 .036 -7.677 ***
e4 <--> e38 -.140 .035 -3.967 ***
e4 <--> e28 .125 .022 5.799 ***
e3 <--> e38 .197 .037 5.281 ***
e3 <--> e29 .129 .029 4.481 ***
e3 <--> e35 .112 .030 3.765 ***
e4 <--> e7 .081 .029 2.793 .005
e7 <--> e16 .085 .038 2.213 .027
e8 <--> e28 .031 .027 1.142 .254

331
Estimate S.E. C.R. P Label
e9 <--> e12 .087 .039 2.238 .025
e12 <--> e22 .249 .050 4.942 ***
e14 <--> e31 .086 .031 2.802 .005
e16 <--> e20 .142 .043 3.315 ***
e26 <--> e28 -.057 .021 -2.646 .008
e26 <--> e31 .074 .028 2.650 .008
e28 <--> e39 -.098 .021 -4.691 ***
e29 <--> e30 -.079 .020 -4.024 ***
e29 <--> e42 -.117 .029 -3.991 ***
e35 <--> e39 .124 .027 4.674 ***
e34 <--> e35 .155 .034 4.564 ***
e22 <--> e33 -.151 .047 -3.186 .001
e7 <--> e34 .102 .034 3.000 .003
e5 <--> e40 -.068 .025 -2.707 .007
e3 <--> e20 .127 .037 3.444 ***
e2 <--> e35 -.105 .028 -3.813 ***
e20 <--> e32 .122 .038 3.227 .001
e7 <--> e31 -.102 .028 -3.594 ***
e2 <--> e13 -.113 .039 -2.912 .004
e5 <--> e41 .072 .023 3.085 .002
e6 <--> e27 .109 .040 2.753 .006
e8 <--> e27 -.075 .040 -1.876 .061
e8 <--> e21 .126 .041 3.060 .002
e12 <--> e36 -.119 .036 -3.319 ***
e35 <--> e41 -.072 .022 -3.245 .001
e31 <--> e36 -.074 .028 -2.636 .008
e29 <--> e36 -.081 .026 -3.136 .002
e28 <--> e33 .042 .029 1.427 .153
e27 <--> e33 -.113 .039 -2.873 .004
e13 <--> e20 .152 .048 3.156 .002
e4 <--> e33 -.149 .036 -4.173 ***
e9 <--> e14 -.112 .044 -2.565 .010
e4 <--> e37 -.134 .028 -4.762 ***
e26 <--> e33 -.091 .034 -2.641 .008
e27 <--> e40 -.078 .030 -2.593 .010
e16 <--> e36 -.105 .038 -2.783 .005
e13 <--> e39 .098 .035 2.784 .005
e5 <--> e34 .099 .028 3.574 ***
e37 <--> e40 .122 .034 3.561 ***
e35 <--> e36 .054 .028 1.940 .052
e16 <--> e39 .083 .031 2.624 .009
e14 <--> e22 .168 .049 3.433 ***
e8 <--> e30 .068 .030 2.278 .023
e4 <--> e9 -.090 .033 -2.762 .006

332
Estimate S.E. C.R. P Label
e3 <--> e42 -.119 .041 -2.886 .004
e14 <--> e37 .070 .033 2.092 .036
e13 <--> e22 .149 .056 2.654 .008
e12 <--> e37 -.057 .031 -1.851 .064
e12 <--> e33 .088 .040 2.231 .026
e12 <--> e21 .089 .041 2.199 .028
e9 <--> e39 -.076 .032 -2.369 .018
e6 <--> e16 -.093 .044 -2.113 .035
e36 <--> e37 .109 .033 3.279 .001
e12 <--> e41 .047 .026 1.815 .069
e12 <--> e30 .045 .024 1.882 .060
e7 <--> e32 .089 .035 2.525 .012
e14 <--> e27 -.077 .036 -2.129 .033
e8 <--> e36 -.045 .035 -1.257 .209
e5 <--> e36 .089 .027 3.248 .001
e5 <--> e38 .086 .031 2.765 .006
Correlations: (Group number 1 - Default model)
Estimate
e39 <--> e40 .386
e37 <--> e39 .293
e37 <--> e38 .261
e33 <--> e39 -.253
e32 <--> e37 -.236
e32 <--> e38 -.508
e4 <--> e38 -.314
e4 <--> e28 .436
e3 <--> e38 .322
e3 <--> e29 .275
e3 <--> e35 .189
e4 <--> e7 .203
e7 <--> e16 .159
e8 <--> e28 .088
e9 <--> e12 .141
e12 <--> e22 .402
e14 <--> e31 .168
e16 <--> e20 .229
e26 <--> e28 -.181
e26 <--> e31 .170
e28 <--> e39 -.258
e29 <--> e30 -.279
e29 <--> e42 -.286
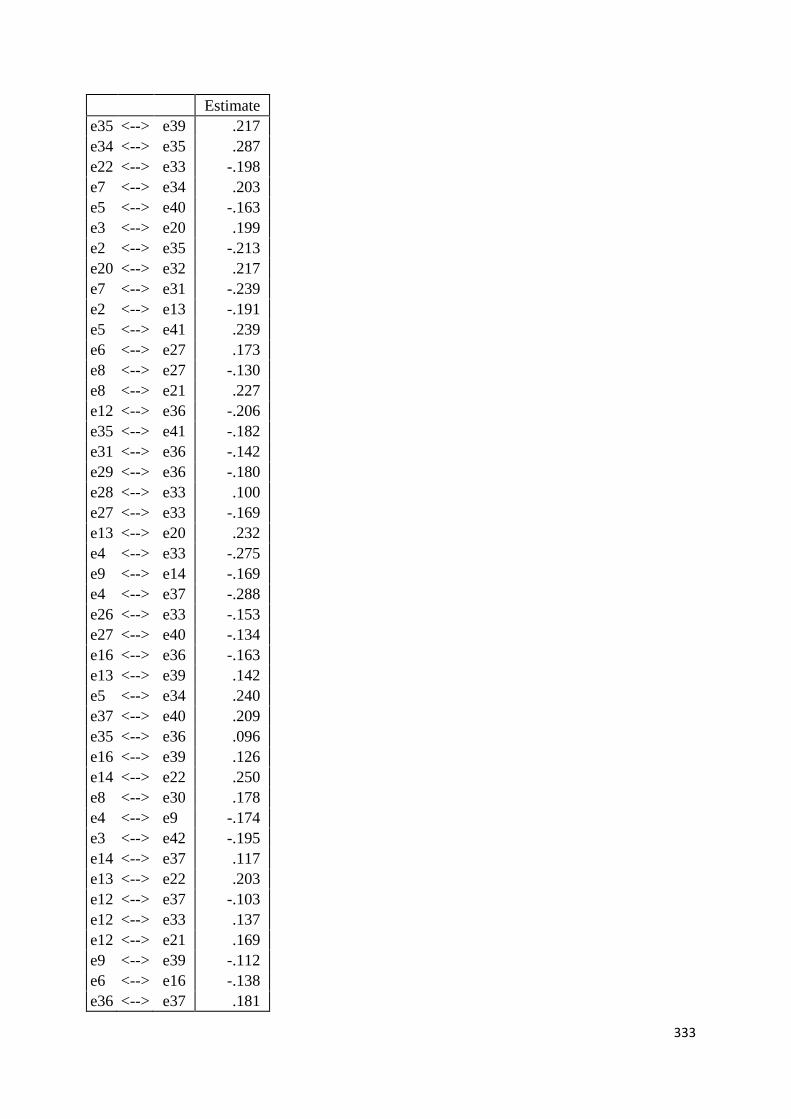
333
Estimate
e35 <--> e39 .217
e34 <--> e35 .287
e22 <--> e33 -.198
e7 <--> e34 .203
e5 <--> e40 -.163
e3 <--> e20 .199
e2 <--> e35 -.213
e20 <--> e32 .217
e7 <--> e31 -.239
e2 <--> e13 -.191
e5 <--> e41 .239
e6 <--> e27 .173
e8 <--> e27 -.130
e8 <--> e21 .227
e12 <--> e36 -.206
e35 <--> e41 -.182
e31 <--> e36 -.142
e29 <--> e36 -.180
e28 <--> e33 .100
e27 <--> e33 -.169
e13 <--> e20 .232
e4 <--> e33 -.275
e9 <--> e14 -.169
e4 <--> e37 -.288
e26 <--> e33 -.153
e27 <--> e40 -.134
e16 <--> e36 -.163
e13 <--> e39 .142
e5 <--> e34 .240
e37 <--> e40 .209
e35 <--> e36 .096
e16 <--> e39 .126
e14 <--> e22 .250
e8 <--> e30 .178
e4 <--> e9 -.174
e3 <--> e42 -.195
e14 <--> e37 .117
e13 <--> e22 .203
e12 <--> e37 -.103
e12 <--> e33 .137
e12 <--> e21 .169
e9 <--> e39 -.112
e6 <--> e16 -.138
e36 <--> e37 .181
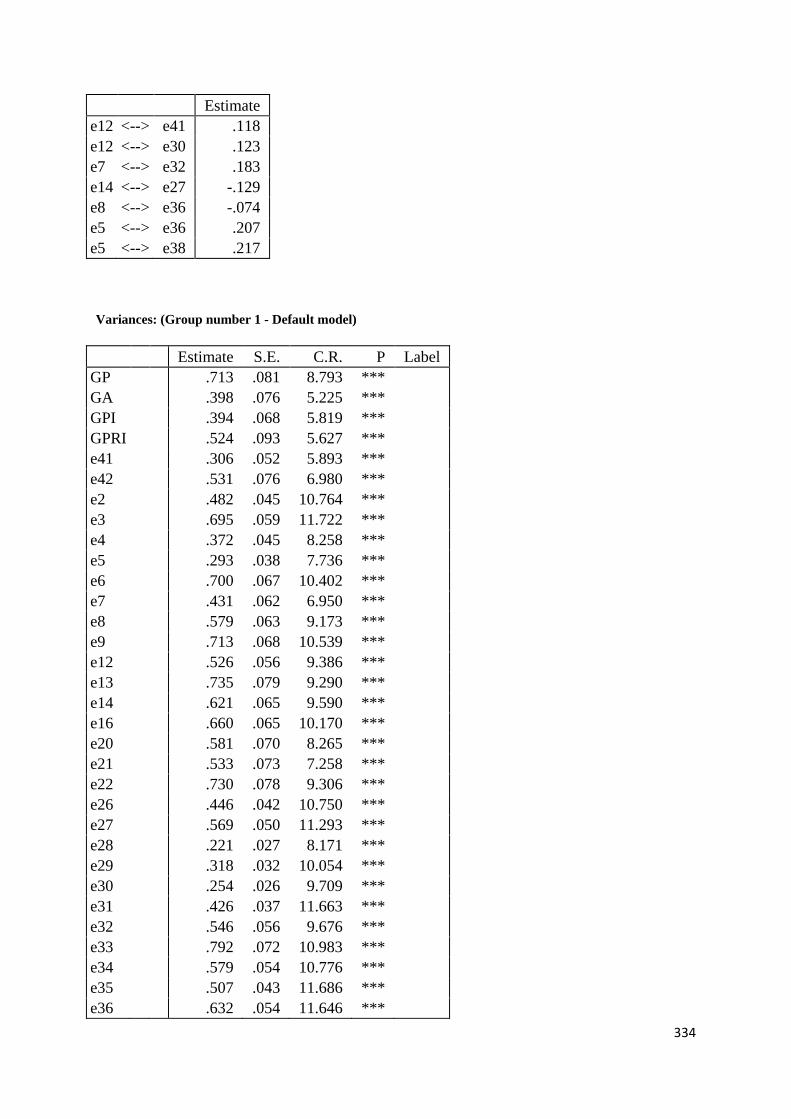
334
Estimate
e12 <--> e41 .118
e12 <--> e30 .123
e7 <--> e32 .183
e14 <--> e27 -.129
e8 <--> e36 -.074
e5 <--> e36 .207
e5 <--> e38 .217
Variances: (Group number 1 - Default model)
Estimate S.E. C.R. P Label
GP
.713 .081 8.793 ***
GA
.398 .076 5.225 ***
GPI
.394 .068 5.819 ***
GPRI
.524 .093 5.627 ***
e41
.306 .052 5.893 ***
e42
.531 .076 6.980 ***
e2
.482 .045 10.764 ***
e3
.695 .059 11.722 ***
e4
.372 .045 8.258 ***
e5
.293 .038 7.736 ***
e6
.700 .067 10.402 ***
e7
.431 .062 6.950 ***
e8
.579 .063 9.173 ***
e9
.713 .068 10.539 ***
e12
.526 .056 9.386 ***
e13
.735 .079 9.290 ***
e14
.621 .065 9.590 ***
e16
.660 .065 10.170 ***
e20
.581 .070 8.265 ***
e21
.533 .073 7.258 ***
e22
.730 .078 9.306 ***
e26
.446 .042 10.750 ***
e27
.569 .050 11.293 ***
e28
.221 .027 8.171 ***
e29
.318 .032 10.054 ***
e30
.254 .026 9.709 ***
e31
.426 .037 11.663 ***
e32
.546 .056 9.676 ***
e33
.792 .072 10.983 ***
e34
.579 .054 10.776 ***
e35
.507 .043 11.686 ***
e36
.632 .054 11.646 ***

335
Estimate S.E. C.R. P Label
e37
.579 .053 10.976 ***
e38
.537 .050 10.766 ***
e39
.646 .052 12.324 ***
e40
.590 .049 12.022 ***

336
APPENDIX C: LANGUAGE EDITING LETTER
CONFIRMATION OF PROOFREADING
This serves to confirm that I have proofread this thesis and have made the necessary corrections and
emendations:
The Impact of Green Marketing Practices on Competitive Advantage and Business Performance
among Manufacturing Small and Medium Enterprises (SMEs) in South Africa
By
Eugine Tafadzwa Maziriri
I have been proofreading Honours, Masters and Doctoral dissertations, research reports and theses
for the past 10+ years for, inter alia, the following institutions: University of the Witwatersrand;
GIBS; University of Cape Town; Milpark; Mancosa; University of KwaZuluNatal; University of
Johannesburg; Unisa; Tshwane University of Technology; Henley Business School, and more recently,
the Da Vinci Institute.
I have also undertaken proofreading for publishers, such as Oxford University Press and Juta &
Company, companies, institutions and non-governmental organisations.
I have a major in English, and excellent knowledge of Afrikaans.
Jennifer Croll
BA(Wits); H.Dip.Lib. (UCT); B.Tech(LIS), B.Inf.Sc.(Hons)(Unisa); MM(Research), MM(Strategic
Marketing)(Wits).
Email: [email protected]
Mobile: 072-351-7997
Date: 1st July 2018