the impact of hot lanes on carpools - texas a&m … impact of hot... · 1 the impact of hot...
TRANSCRIPT

1
The Impact of HOT Lanes on Carpools
Mark Burris, Professor, Zachry Department of Civil Engineering, 3136 TAMU, Texas A & M University, College Station, TX 77845 USA. Phone: 1-979-845-9875. E-Mail: [email protected] (Corresponding Author) Negin Alemazkoor, Graduate Research Assistant, Texas A&M Transportation Institute, 3135 TAMU, Texas A&M University, College Station, TX 77843 USA. Phone: 1-979-888-4028. Email: [email protected] Rob Benz, Research Engineer, Texas A&M Transportation Institute, 701 North Post Oak Suite 430, Houston, Texas 77024 USA. Phone: 1-713-613-9218. Email: [email protected] Nicholas S. Wood, Assistant Transportation Researcher, Texas A&M Transportation Institute, 505 E.
Huntland Drive Suite 455, Austin, TX 78752 USA. Phone: 512-467-0946. E-mail: [email protected]
Abstract
This research investigated the change in carpooling on U.S. roadways once high occupancy/toll (HOT)
lanes began on those roadways. HOT lanes generally allow carpools to travel on the lane for free while
charging a toll for single occupant vehicles (SOVs) to use the lane. In most cases these lanes were
previously high occupancy vehicle (HOV) lanes where carpools traveled for free and SOVs were not
allowed. Note that clean fueled SOVs were allowed in some cases. Thus carpoolers could now switch to
being a SOV and still access the benefits of the HOT lane – for a toll. This may cause some carpools to
break up and become SOVs, thus adding to the amount of traffic and emissions on the roadway.
Carpooling on eight roadways with HOT lanes was examined. As best as possible, data on the number of
carpools on the facility in the year before and the year after converting from HOV lanes to HOT lanes
was examined. Overall, carpooling decreased on most of the corridors, stayed the same on a couple of
corridors, and on the one corridor that added the HOT lanes (SR-91) carpooling increased. Despite these
results it is still difficult to draw definitive conclusions as (a) carpool preference tends to vary by facility,
(b) there were many exogenous factors also playing a role in the amount of carpooling, (c) there is
inherent difficulty obtaining occupancy counts and those counts can fluctuate a great deal day to day
and month to month. Overall though, it does appear that carpooling is often negatively impacted by
converting a HOV lane to a HOT lane.
Keywords: High-occupancy toll lanes, managed lanes, high-occupancy vehicle lanes, carpooling JEL Classification Codes: R40, R480
2
Introduction
This special issue of the journal of transportation economics is focused on road pricing projects in the
United States. The papers presented in this issue include a wide range of pricing projects, from parking
pricing, to toll bridges, high occupancy/toll (HOT) lanes, interstate tolling, and vehicle miles traveled
fees. Conversely, experience with road pricing in the United States has been focused mostly on HOT
lanes. Almost all of these HOT lanes were high occupancy vehicle (HOV) lanes prior to their conversion
to HOT lanes. An important aspect of this conversion, and something that is not well understood, is the
impact on carpools. This paper attempts to summarize findings from HOT lanes around the United
States in an effort to shed more light on the relationship between HOT lanes and carpools.
One factor that may mitigate the impact of HOT lanes on carpooling is that so many carpools are
comprised of family members. Commuting in America III estimated that 80 percent of 2-person
carpools are comprised of family members (Pisarski, 2006)
http://onlinepubs.trb.org/onlinepubs/nchrp/CIAIII.pdf. This estimate is similar to results from multiple
surveys the authors have conducted in Texas. It would be logical that the option to drive alone as an
SOV on the HOT lane would not be very enticing for this group of carpoolers.
The following sections of the paper examine individual HOT lanes from around the United States. When
available, data on the number of carpools the year before and the year after was examined. This
provided a snapshot of what happened to carpools on the facility in that timeframe – but any changes
could not always be attributed to the change from HOV to HOT lane. Despite this shortcoming the
following provides the most comprehensive assessment of the impact of HOT lanes on carpools to date
and will shed some light on this issue.
State Route 91 Express Lanes (SR-91X)
The California SR-91 Express Lanes run 10 miles (16 km) in the freeway median between the SR 91/SR 55
junction in Anaheim and the Orange/Riverside County Line. The toll facility has two lanes in each
direction, separated from four adjacent general purpose lanes (GPLs) in each direction, by a soft barrier
consisting of a painted buffer with plastic pylons. It is an express facility with no intermediate exits or
entrances. Only passenger cars and small trucks are allowed on the Express Lanes. Variable tolls
(http://www.91expresslanes.com/schedules.asp) are used to manage the Express Lanes to ensure that
traffic remains free flowing.
The SR-91X lanes is the only HOT lane that was not previously an HOV lane. It represented new
capacity. It also required HOV2s (high occupancy vehicles with 2 people in the vehicle) to pay a toll –
where many HOT lanes allow HOV2+ to travel for free. Despite these unique features there is much that
can be learned regarding the impact of these lanes on carpools. Particularly because the lanes
underwent changes in tolling of carpools during their existence:
3
Prior to the construction of the SR-91X lanes in 1996 all vehicles traveled for free on the
corridor,
During 1996, 1997 and part of 1998 HOV3+ traveled toll free on the Express Lanes, all other
vehicles paid a variable toll,
From May 1998 to 2002 HOV3+ paid 50 percent of the HOV2 and single occupancy vehicle (SOV)
toll rate,
From 2003 on HOV3+ were free except during peak times (defined as 4 p.m. to 6 p.m.
eastbound) when they pay 50 percent of the toll rate.
After one year of operation of the new SR 91X, there was a 40 percent increase in HOV3+ vehicles (496
to 725) in the 2-hour peak period on the SR 91 corridor. This large increase could be due to the low base
number of HOV3+ vehicles on the SR 91 corridor since there was previously no HOV lane. In addition,
average daily traffic rose 14 percent in the first year of Express Lane (EL) operation. Sixty percent of that
increase was new traffic. It is estimated that during the afternoon peak period, this induced traffic
contributed to a 39 percent increase in the pre-Express level of HOV3+ (Sullivan, 1998). Since SR 91 ELs
treat HOV2s as paying vehicles similar to SOVs, only 30 percent of HOV2s used the SR 91 Express Lanes
as compared to 60 percent in conventional HOV lanes and a small increase in the number of HOV2s was
observed (Sullivan, 1998).
In January 1998 when HOV3+ users were charged a 50 percent toll, about a third of the HOV3+ traffic
(about 2,000 vehicles per day) left the 91X lanes, and HOV3+ traffic in the GPLs increased by the same
amount. These changes occurred mostly during the shoulder hours and throughout the week, although
much less on Friday afternoon. Following these changes, the total p.m. peak HOV3+ traffic in the
corridor remained the same (Sullivan, 2000).
Jianling Li analyzed the effects of removing the toll for HOV3+ in 2003 (except for weekdays eastbound
from 4 p.m. to 6 p.m.) (unpublished work at UT Arlington in 2007). Due to constraints of available data,
the analysis focused only on the eastbound counts for May 2003. It was found that the average HOV3
hourly traffic counts for all hours of weekdays rose from 81 before the toll change to 99 after the toll
change (an increase of 22 percent, statistically significant at p<0.05). For the eastbound traffic during 4
p.m. and 6 p.m. where the toll remained for HOV3+ vehicles, the average hourly traffic counts for
HOV3+ decreased from 348 vehicles per hour to 337 vehicles per hour after the change. The toll
reduction encouraged use of the Express Lanes by HOV3+s and pushed a few into the afternoon
shoulder periods.
From examining traffic patterns on SR-91X lanes it is clear that HOV3+s are sensitive to the toll and shift
lanes and time of travel based on the toll. However, mode shifts due to the toll rate changes are less
well known. The 1998 tolling of HOV3+s found approximately the same number of additional HOV3+s in
the GPLs as left the ELs. Likely indicating minimal mode shifts.
4
I-15 Express Lanes in San Diego
The I-15 Express Lanes near San Diego have undergone multiple, significant, changes since they began in
1996. This report will focus on the early years of the project – when the lanes were an eight-mile, two-
lane, reversible facility in the median of I-15, extending from SR 163 to SR 56/Ted Williams Parkway.
The Phase I ExpressPass program ran from December 1996 through March 1998. During this phase, a
limited number of solo drivers paid a flat fee ($50 until February 1997 and $70 thereafter) for unlimited
use of the I-15 Express Lanes. HOV2+ vehicles could travel toll free as they had before the ExpressPass
program. In late March 1998, the program began Phase II I-15 FasTrak, which allowed solo drivers to
pay a per-trip fee to use the lanes. The fees were adjusted dynamically on the basis of traffic levels in
the I-15 Express Lanes as well as time of day. HOVs continued to use the lanes toll free. Additional
changes occurred in 2008 extending and widening the lanes. Since the focus of this paper is the
conversion from HOV to HOT we focus on the changes that happened in the late 1990s.
An attitudinal panel survey conducted in September and October 1997 (Golob et al., 1998) provides
insight into mode shifts of early users of the ELs. This survey was conducted during the Phase I
ExpressPass period. A total of 1,513 telephone surveys were completed. Respondents represented four
commuter segments: current ExpressPass users (users during the survey), former ExpressPass users,
other I-15 users (i.e., non-ExpressPass), and I-8 users representing the control corridor. Of ExpressPass
users who had driven on I-15 before the ExpressPass program, approximately 95 percent previously
drove alone while approximately 4 percent reported that they had previously carpooled. This result
indicates that very few carpools broke up as a result of the ExpressPass program. This result was
collaborated with traffic volume data from 1997 (see Table 1). However, 1998 and 1999 traffic volumes
show a much different impact.
Table 1. HOV Volumes on I-15 (source: Supernak, 2001)
Time of Day Year I-15 Main Lanes
I-15 Express Lanes
Total HOVs on I-15 Corridor
Morning Peak Period (6:00 a.m. to 9:00 a.m.)
1996 3,817 3,014 6,831
1997 3,579 3,732 7,311
1998 2,535 3,675 6,210
1999 1,268 2,937 4,206
Afternoon Peak Period (3:00 p.m. to 7:00 p.m.)
1996 3,346 4,795 8,141
1997 3,150 5,547 8,697
1998 3,345 5,136 8,481
1999 2,496 5,486 7,982
The I-15 corridor experienced a large increase in SOV volume and a corresponding decrease in HOV
volume during the a.m. peak period from 1997 to 1999 (see Table 1). This decline in HOV volume in I-15
was in contrast to the increasing HOV volume in control corridor I-8. This suggests that corridor specific

5
factors, possibly I-15 pricing project, are responsible for these differences (Supernak, 2001). During the
p.m. peak period the total number of HOVs changed little from 1996 to 1999 (see Table 1). There was a
substantial shift of the HOVs to the Express Lanes during the p.m. peak period.
The changes in HOV volumes in the a.m. peak period did not occur uniformly over the three year period.
From 1996 to 1997 there was a large increasing in HOVs in both the a.m. and p.m. peak periods. Thus,
the results from the 1997 attitudinal survey indicating little conversion from HOV to SOV seems
reasonable. Starting in 1998, and continuing in 1999, there was a sizable drop in HOV traffic in the a.m.
peak and a smaller drop in the p.m. peak. This corresponds to the ending of the ExpressPass program
and the beginning of allowing travelers to pay for the Express Lanes on a per use basis. All other HOT
lanes in the country currently use a pay per trip tolling model. Therefore, the decrease in HOVs on I-15
once SOVs had to start paying per trip was a potential issue for all HOT lanes around the county. Note
that total traffic on I-15 (see Table 2) remained relatively stable through these four years. Also note that
the total number of HOVs on the HOT lane increased from 1996 to 1999, but HOVs on the GPLs
decreased by even more, so the net result was a loss in HOVs. Because the loss in HOVs was on the
GPLs it is possible that the loss in HOVs was, at least in part, due to factors other than the change of the
HOV lanes to Express Lanes, such as the economic boom of the time. Without surveying the travelers it
is difficult to know the reason behind these changes.
Table 2: Total Traffic Volume on I-15 (source: Supernak, 2001)
Time of Day Year I-15 Main Lanes
I-15 Express Lanes
Total I-15
Corridor Traffic
Morning Peak Period (6:00 a.m. to 9:00 a.m.)
1996 30,397 3,650 34,048
1997 29,905 4,373 34,278
1998 31,765 5,185 36,950
1999 30,666 5,583 36,248
Afternoon Peak Period (3:00 p.m. to 7:00 p.m.)
1996 36,214 5,476 41,690
1997 35,055 6,113 41,168
1998 36,537 6,766 43,303
1999 35,850 7,904 43,754
I-394 Express Lanes in Minnesota
The I-394 HOV lanes were converted to HOT lanes (called MnPASS Express Lanes in Minnesota) in May
of 2005. The I-394 MnPASS Express Lanes stretch 11 miles from downtown Minneapolis to the western
suburbs. Dynamic pricing is used to ensure free flow speeds (50 to 55 mph) in the Express Lanes. The I-
394 Express Lanes include two different types of design. There is a 3 mile barrier-separated reversible
section with two lanes located directly to the west of downtown Minneapolis (from highway 100 to I-
94). There is also an 8 mile long portion that has one lane in each direction called the diamond lane
section. In the 3-mile section SOVs are always charged a fee. In the diamond lane section, SOVs are only

6
charged in rush hours. The tolls range from 25 cents to $8 and are typically $1 to $4 during rush hours
(Cambridge Systematics Inc., 2006).
Three waves of MnPASS Evaluation Panel Surveys were conducted by NuStats under subcontract to the
State and Local Policy Program at the Humphrey Institute of Public Affairs at the University of Minnesota
for the Minnesota Department of Transportation. The first wave of the Attitudinal Panel Survey was
conducted in November/December 2004 before I-394 MnPASS Express lane implementation. The
second wave was conducted about 6 months after MnPASS implementation in November/December
2005. Finally, the third wave was conducted in May/June 2006 (Zmud, 2006).
In Table 3, the usual modes of travel for the three I-394 waves are compared. It could be seen that the
differences in modes used by travelers between the three waves are very small (Zmud, 2006). The
survey also found that I-394 travelers were almost equally likely to switch from SOV to carpool (7%) as
they were to switch from carpool to SOV (8%). Therefore, the results from the surveys show that there
was not a noticeable shift from HOVs to SOVs after MnPASS Express lane implementation (Zmud, 2006).
Table 3. Usual Travel Mode for Survey Respondents (source: Zmud, 2006)
I-394 Wave 1 Results
(2004 – Before)
Wave 2 Results
(2005 – Just After
Implementation)
Wave 3 Results
(2006 - After)
FREQUENCY PERCENT FREQUENCY PERCENT FREQUENCY PERCENT
Drive alone 212 80% 177 76% 214 81%
Carpool 52 19% 54 23% 50 19%
Ride bus 2 1% 3 1% 1 0%
Total 266 100% 234 100% 265 100%
Vehicle occupancy counts were also conducted before and after MnPASS implementation to examine
the impacts of MnPASS on carpooling (see Table 4). Vehicle occupancy was counted over a 2-day period
in May and June 2004 for before data. After data was collected in two different periods during October
6-11, 2005 and May 9-10, 2006. Carpooling on I-394 decreased substantially after MnPASS
implementation. However, results from occupancy counts in the control corridor, I-35W, also showed a
substantial decrease. Northbound carpooling decreased by 14% and southbound decreased by 20% on I-
35W. Although the decrease in carpooling on I-394 seems to be larger than the decrease on I-35W, due
to the small number of HOVs in both the before and after periods and the fact that occupancy counts
were conducted manually, it cannot be statistically concluded that the decrease in carpooling on I-394
was greater than the decrease on I-35W (Cambridge Systematics Inc., 2006).
7
Table 4. Comparison of SOV and HOV Vehicle Volume on I-394 (2004 to 2006) (source: Cambridge
Systematics Inc., 2006)
I-394 @ Penn Eastbound - a.m. peak (6:00 a.m. to 9:00 a.m.)
2004 Share 2006 Share # Change %Change
MnPass Lanes
HOV Volume 3,322 96% 2,635 62% -687 -21%
SOV Volume 141 4% 1,599 38% 1,458 1034%
Total Volume 3,463 4,234 771 22%
General Purpose Lanes
HOV Volume 335 2% 375 3% 40 12%
SOV Volume 14,742 98% 14,107 97% -635 -4%
Total Volume 15,077 14,482 -595 -4%
Total All Lanes
HOV Volume 3,657 20% 3,010 16% -647 -18%
SOV Volume 14,883 80% 15,706 84% 823 6%
Total Volume 18,540 18,716 176 1%
I-394 @ Penn Westbound - p.m. peak (3:00 a.m. to 6:00 p.m.)
2004 Share 2006 Share # Change %Change
MnPass Lanes
HOV Volume 3,446 88% 2,578 63% -868 -25%
SOV Volume 226 6% 1,516 37% 1,290 571%
Total Volume 3,898 4,094 196 5%
General Purpose Lanes
HOV Volume 1,864 13% 884 6% -980 -53%
SOV Volume 12,782 87% 15,124 94% 2,342 18%
Total Volume 14,646 16,008 1,362 9%
Total All Lanes
HOV Volume 5,310 29% 3,462 17% -1,848 -35%
SOV Volume 13,008 71% 16,640 83% 3,632 28%
Total Volume 18,318 20,102 1,784 10%
I-394 @ Louisiana Eastbound - a.m. peak (6:00 a.m. to 9:00 a.m.)
2004 Share 2006 Share # Change %Change
MnPass Lanes
HOV Volume 2,054 89% 1,511 58% -543 -26%
SOV Volume 254 11% 1,083 42% 829 326%
Total Volume 2,308 2,594 286 12%
General Purpose Lanes
HOV Volume 369 3% 499 5% 130 35%
SOV Volume 11,322 97% 10,574 95% -748 -7%
Total Volume 11,691 11,073 -618 -5%
Total All Lanes
HOV Volume 2,423 17% 2,010 15% -413 -17%
SOV Volume 11,576 83% 11,657 85% 81 1%
Total Volume 13,999 13,667 -332 -2%
I-394 @ Louisiana Westbound- p.m. peak (3:00 p.m. to 6:00 p.m.)
2004 Share 2006 Share # Change %Change
MnPass Lanes
HOV Volume 2,376 76% 1,308 60% -1,068 -45%
SOV Volume 751 24% 870 40% 119 16%
Total Volume 3,127 2,178 -949 -30%
General HOV Volume 414 5% 1,029 7% 615 149%

8
Purpose Lanes
SOV Volume 7,805 95% 13,903 93% 6,098 78%
Total Volume 8,219 14,932 6,713 82%
Total All Lanes
HOV Volume 2,790 25% 2,337 14% -453 -16%
SOV Volume 8,556 75% 14,773 86% 6,217 73%
Total Volume 11,346 17,110 5,764 51%
SR 167 HOT Lanes
SR 167 HOT lanes began operating in May 2008. They extend about nine miles (11 miles in the
northbound direction and 8 miles in the southbound direction) from Renton to Auburn near Seattle.
There is a single HOT lane along with two general purpose lanes in each direction of travel. Two-person
carpools, vanpools, transit and motorcycles can use the HOT lanes for free. When extra space is
available in the HOT lane, SOVs are allowed to use HOT lane by paying a toll using a transponder.
Dynamic tolling is used to ensure a free flow condition on the HOT lanes; toll rates are between 50 cents
and $9. There are six northbound and four southbound access zones for the HOT lane. Toll rates are
posted at each access point and drivers are only charged once (with the toll that is displayed when the
vehicle enters the lane) (http://www.wsdot.wa.gov).
From 2007 to 2008, bus ridership increased by 17% in the corridor and by 23% in the region; this
increase in bus ridership was probably due to a rapid increase in the gas prices (American Public
Transportation Association, 2011). Ridership then decreased in 2009 which was attributed to a
reduction in the price of gas, recession and regional job loss. On the other hand, average daily tolled
trips on the HOT lanes increased by 46% in May through November 2009 as compared to May through
November 2008 (Goel and Burris, 2012).
Tuesday through Thursday HOT lane usage from May 2008 through April 2009 and monthly average gas
prices in Seattle are compared in Figure 1. It could be seen that carpool usage on the HOT lanes and gas
prices followed similar trends. Conversely, tolled vehicles generally increased as the gas price decreased.
This strongly suggests that the reduction in the gas price resulted in reduced carpooling and reduced the
bus ridership (Goel and Burris, 2012). Therefore, exogenous factors like gas price are likely to have a
significant impact on HOV travel – further complicating the analysis of HOV travelers on HOV lanes that
transition to a HOT lane.
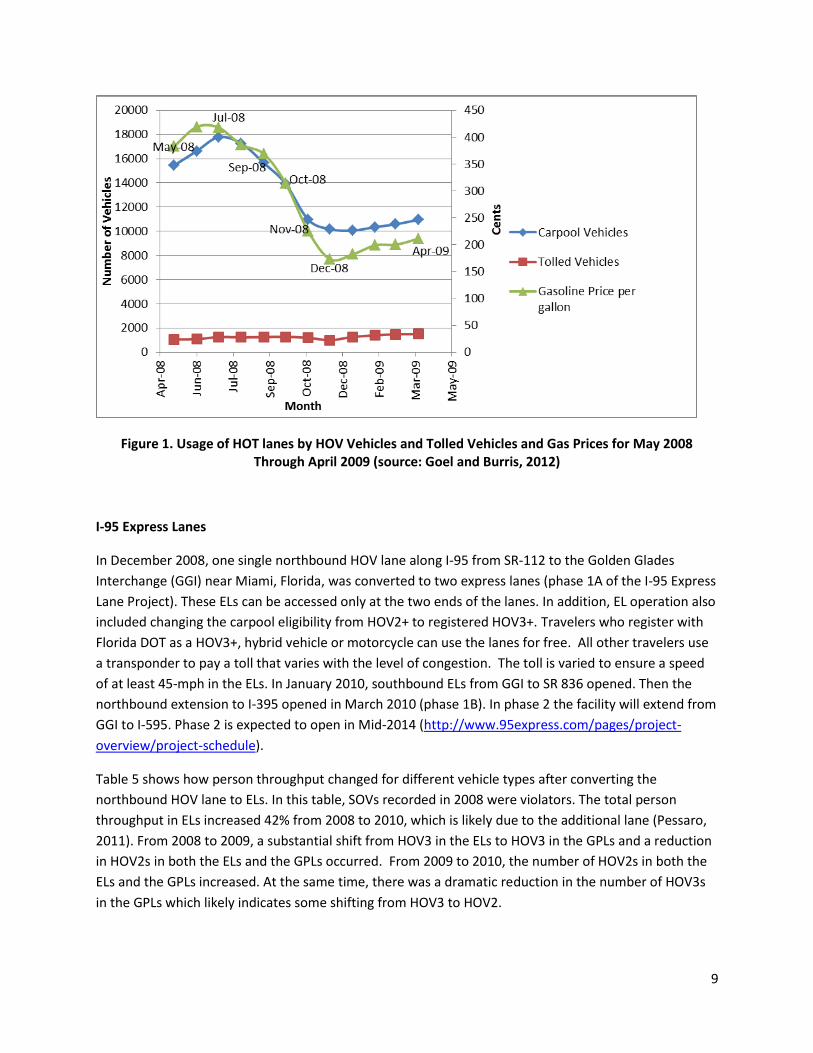
9
Figure 1. Usage of HOT lanes by HOV Vehicles and Tolled Vehicles and Gas Prices for May 2008 Through April 2009 (source: Goel and Burris, 2012)
I-95 Express Lanes
In December 2008, one single northbound HOV lane along I-95 from SR‐112 to the Golden Glades
Interchange (GGI) near Miami, Florida, was converted to two express lanes (phase 1A of the I-95 Express
Lane Project). These ELs can be accessed only at the two ends of the lanes. In addition, EL operation also
included changing the carpool eligibility from HOV2+ to registered HOV3+. Travelers who register with
Florida DOT as a HOV3+, hybrid vehicle or motorcycle can use the lanes for free. All other travelers use
a transponder to pay a toll that varies with the level of congestion. The toll is varied to ensure a speed
of at least 45-mph in the ELs. In January 2010, southbound ELs from GGI to SR 836 opened. Then the
northbound extension to I-395 opened in March 2010 (phase 1B). In phase 2 the facility will extend from
GGI to I-595. Phase 2 is expected to open in Mid-2014 (http://www.95express.com/pages/project-
overview/project-schedule).
Table 5 shows how person throughput changed for different vehicle types after converting the
northbound HOV lane to ELs. In this table, SOVs recorded in 2008 were violators. The total person
throughput in ELs increased 42% from 2008 to 2010, which is likely due to the additional lane (Pessaro,
2011). From 2008 to 2009, a substantial shift from HOV3 in the ELs to HOV3 in the GPLs and a reduction
in HOV2s in both the ELs and the GPLs occurred. From 2009 to 2010, the number of HOV2s in both the
ELs and the GPLs increased. At the same time, there was a dramatic reduction in the number of HOV3s
in the GPLs which likely indicates some shifting from HOV3 to HOV2.

10
Table 5. Person Throughput by Vehicle Type (northbound p.m. peak) (source: Pessaro, 2011)
Vehicle Type 2008 2009 2010
% Change 2008-2010
Express Lanes
SOV 1,061 3,778 3,686 274%
HOV 2 3,040 1,899 2,566 -16%
HOV 3 477 171 308 -35%
Transit 810 821 1,099 36%
Total 5,388 6,669 7,659 42%
General Purpose Lanes
SOV 8,080 8,428 9,300 15%
HOV 2 7,397 6,282 8,602 16%
HOV 3 1,858 2,387 108 -94%
Transit - - - -
Total 17,335 17,097 18,010 4%
Facility
SOV 9,141 12,206 12,986 42%
HOV 2 10,437 8,181 11,168 7%
HOV 3 2,335 2,558 416 -82%
Transit 810 821 1,099 36%
Total 22,723 23,766 25,669 13%
The p.m. peak period is from 4:00 p.m. to 7:00 p.m.
A May 2009 survey found that only 33 percent of HOV3+ in the ELs were registered carpools and the
rest paid the same toll as SOV and HOV2 vehicles. These data combined with the substantial decrease in
HOV3+s in the ELs, indicate that the strict registration requirement for free carpool use of the ELs was
likely a factor behind the mode shift away from HOV3. Table 6 contains responses from those who
indicated they used the ELs (Goel and Burris, 2012).
Table 6. Mode Shifts on I-95 by EL Users (source: Goel and Burris, 2012)
Usual Mode of Travel (Number of respondents)
SOV (n=2558)
HOV2 (n=158)
HOV3+ (n=120)
Current Mode
used to Access Express Lanes
Toll Paying (SOV/HOV2/Unregistered HOV3+)
94% 92% 61%
Registered HOV3+ 0% 3% 33%
Hybrid 5% 6% 1%
Vanpool 0% 0% 16%
Prior Mode on
I-95
Carpool in HOV 6% 71% 81%
Hybrid in HOV 4% 4% 2%
Not Carpool lanes 86% 24% 18%
Note: The percentages for current mode do not total 100 percent since the respondents could select more than one mode if they frequently used different modes to access the ELs.
11
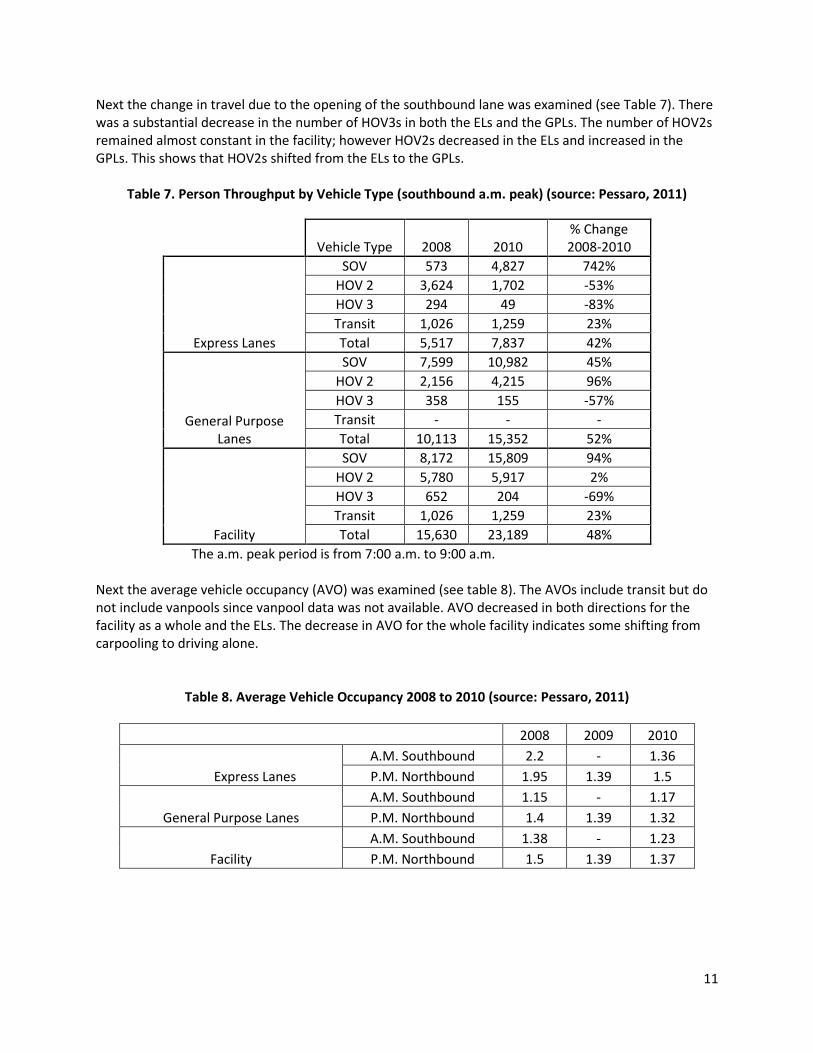
Next the change in travel due to the opening of the southbound lane was examined (see Table 7). There was a substantial decrease in the number of HOV3s in both the ELs and the GPLs. The number of HOV2s remained almost constant in the facility; however HOV2s decreased in the ELs and increased in the GPLs. This shows that HOV2s shifted from the ELs to the GPLs.
Table 7. Person Throughput by Vehicle Type (southbound a.m. peak) (source: Pessaro, 2011)
Vehicle Type 2008 2010
% Change 2008-2010
Express Lanes
SOV 573 4,827 742%
HOV 2 3,624 1,702 -53%
HOV 3 294 49 -83%
Transit 1,026 1,259 23%
Total 5,517 7,837 42%
General Purpose Lanes
SOV 7,599 10,982 45%
HOV 2 2,156 4,215 96%
HOV 3 358 155 -57%
Transit - - -
Total 10,113 15,352 52%
Facility
SOV 8,172 15,809 94%
HOV 2 5,780 5,917 2%
HOV 3 652 204 -69%
Transit 1,026 1,259 23%
Total 15,630 23,189 48%
The a.m. peak period is from 7:00 a.m. to 9:00 a.m. Next the average vehicle occupancy (AVO) was examined (see table 8). The AVOs include transit but do not include vanpools since vanpool data was not available. AVO decreased in both directions for the facility as a whole and the ELs. The decrease in AVO for the whole facility indicates some shifting from carpooling to driving alone.
Table 8. Average Vehicle Occupancy 2008 to 2010 (source: Pessaro, 2011)
2008 2009 2010
Express Lanes
A.M. Southbound 2.2 - 1.36
P.M. Northbound 1.95 1.39 1.5
General Purpose Lanes
A.M. Southbound 1.15 - 1.17
P.M. Northbound 1.4 1.39 1.32
Facility
A.M. Southbound 1.38 - 1.23
P.M. Northbound 1.5 1.39 1.37
12
Houston HOT Lanes
Katy Freeway Managed Lanes
The Houston, Texas metropolitan area has developed an extensive HOV system over the past 30 years.
This system began with a single contraflow lane on Interstate 45 and has evolved to over 100 miles of
HOV lanes (mostly barrier-separated) on six corridors. The length of each HOV lane ranges from 12 to
20 miles. HOV support facilities include more than 30 park and ride lots, 19 transit centers, and
approximately 20 miles of additional non-barrier separated diamond lanes.
In 2003 the Harris County Toll Road Authority (HCTRA), Metropolitan Transit Authority of Harris County
(METRO), and Texas Department of Transportation (TxDOT) cooperatively developed the Interstate 10
Katy Freeway Managed Lanes (KML) project, a four-lane tolled facility (two permanent lanes in each
direction) that allowed HOV’s and buses to ride for free during the peak periods. The Katy Managed
Lanes project coincided with the planned reconstruction of the Katy Freeway, completed in 2009. The
reconstruction project added capacity to the GPLs, added the managed lanes, and upgraded the entire
facility to current design standards.
The KML is a four-lane facility, 12 miles long, and is separated from the GPLs by flexible pylons and a 22
foot buffer. The KML has four entrances and exits in each direction at approximately four mile spacing
along with three toll plazas in each direction. HOV2+ and motorcycles are allowed free travel in both
directions during the weekday peak periods: 5 to 11 a.m. and 2 to 8 p.m. This is consistent with prior
HOV access policy (as a single-lane reversible HOV lane, there had previously been a 3+ occupancy
requirement during each of the a.m. and p.m. peak hours). At each toll plaza there are declaration
lanes. The inside lane is for HOV vehicles who do not pay a toll in the peak periods while the lane closer
to the GPLs is for SOVs who must pay a toll at all times. The facility is open in both directions, 24 hours,
7 days a week, and 365 days per year through use of electronic tolling for SOV customers. Tolls vary by
time of day and currently range from $0.30 to $7.00 depending on time of day and length of trip.
Maximum toll rates for the entire length started at $4.00 in 2009, were increased in 2012 to $5.00, and
as of September 2013 they are $7.00, with the increase intended to reduce demand and ease capacity
issues on the facility. The Katy Freeway and Managed Lanes serve the area known as the Energy
Corridor, which has seen substantial growth in the western portion of the area.
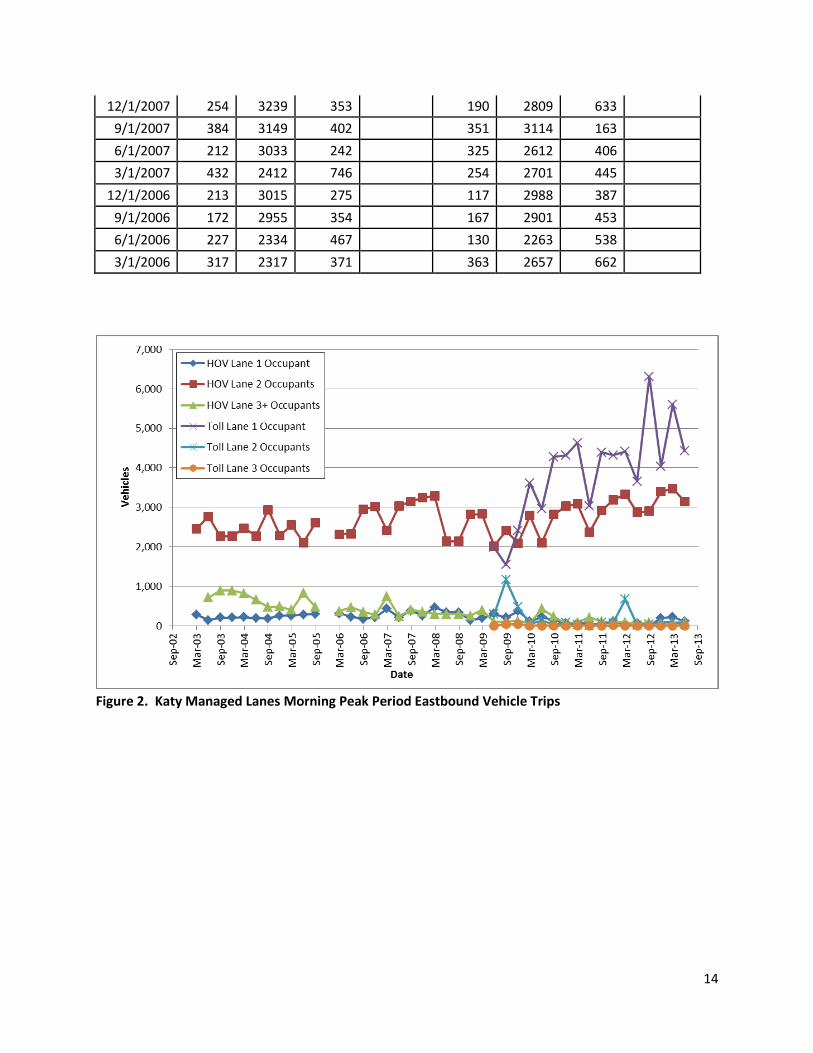
The Houston HOV system has been extensively studied over the past 25 years. Manual volume and
classification counts have been conducted before and after implementation of various projects and the
results are presented in the charts below. Note that these data are from manual counts collected on
one day each quarter. Therefore, the data is potentially subject to the exact day of the count being far
from a typical day.
Figures 2 and 3 depict the one-day count volumes along the Katy Managed Lanes by toll payment and
number of vehicle occupants. Note that when the ML facility first opened there were a significant
number of toll-paying HOVs. This meant many HOVs were driving in the lane that was for SOVs and all
vehicles had to pay a toll in that lane. This was likely due to confusion over which lane to use. This
quickly changed to where very few HOVs used the toll lane and paid a toll (they select the HOV lane).

13
However, in March 2012 there was a jump in HOV2s that paid a toll (HOV2 Toll Lane) – likely due to
some incident on the lanes but this was not recorded in the data collection.
There appears to be little change in HOV2 volume with the opening of the MLs. Immediately after SOV
tolled travel was allowed (early 2009) the number of HOV2s was similar to the prior year. Since that
time there appears to be a general upwards trend – as there is with most traffic along this corridor (see
Figure 2 and Table 9). However, there does appear to be a decrease in HOV3+ travel once the MLs
became operational. HOV3+ dropped from around 300 in the a.m. and 400 in the p.m. to less than 100
in the a.m. and p.m. Note that there are almost no HOV3s that pay a toll and thus the decrease in toll
free HOV3+ travel on the HOV lane represents the total change in HOV3+ travel on the MLs. These
vehicles may have shifted to the GPLs, but since the MLs were free for them and had a higher travel
speed that would be unlikely.
Table 9. Traffic Counts on Katy Freeway MLs
A.M. Peak Period (6:00 a.m.to 9:30 a.m.)
P.M. Peak Period (3:30 p.m.to 7:00 p.m.)
Free Lane Toll Lane Free Lane Toll Lane
Date SOV HOV 2 HOV3+ All Traffic SOV HOV 2 HOV3+ All Traffic
6/1/2013 106 3153 101 4472 149 2663 20 5496
3/1/2013 230 3473 81 5697 110 2757 183 4418
12/1/2012 197 3397 69 4127 168 3021 49 4301
9/1/2012 24 2905 91 6359 184 1886 38 4027
6/1/2012 77 2875 53 3674 338 2707 52 5101
3/1/2012 53 3331 87 5095 129 2830 53 4363
12/1/2011 111 3186 85 4413 38 2415 85 3980
9/1/2011 55 2915 106 4472 86 2618 74 3615
6/1/2011 43 2373 217 3034 69 2743 140 4003
3/1/2011 73 3085 87 4665 74 2642 64 3813
12/1/2010 64 3032 59 4399 73 2619 86 3896
9/1/2010 146 2815 235 4313 61 2367 220 3158
6/1/2010 225 2095 432 3097 99 2079 170 2388
3/1/2010 114 2789 67 3666 72 2110 185 2559
12/1/2009 378 2088 132 2950 280 1997 85 2091
9/1/2009 210 2406 105 2767 280 1997 85 2091
6/1/2009 309 2024 100 2283 308 1879 133 1427
3/1/2009 192 2830 396 516 2457 89
12/1/2008 146 2820 256 261 2401 165
9/1/2008 343 2143 297 462 2448 549
6/1/2008 343 2143 297 462 2448 549
3/1/2008 467 3294 297 323 2936 442
14
12/1/2007 254 3239 353 190 2809 633
9/1/2007 384 3149 402 351 3114 163
6/1/2007 212 3033 242 325 2612 406
3/1/2007 432 2412 746 254 2701 445
12/1/2006 213 3015 275 117 2988 387
9/1/2006 172 2955 354 167 2901 453
6/1/2006 227 2334 467 130 2263 538
3/1/2006 317 2317 371 363 2657 662
Figure 2. Katy Managed Lanes Morning Peak Period Eastbound Vehicle Trips

15
Figure 3. Katy Managed Lanes Afternoon Peak Period Westbound Vehicle Trips IH 45 Gulf Freeway HOT Lanes In 2011, Houston METRO began to implement HOT lanes on five existing HOV facilities (IH 45 North, IH
45 Gulf, US 59 Southwest, US 59 Eastex, and US 290 Northwest), with a new corridor planned to open
every four to six months. The HOT lane capability was retrofitted into the existing HOV lanes by
including declaration lanes at several locations to allow for multiple tolled declaration and access points
along each corridor. HOV 2+ travel continues to be toll-free on all facilities except from 6:45 a.m. to
8:00 a.m. on US 290, which has a HOV 3+ requirement for toll-free passage.
The HOT system allows SOV travelers to use the lanes for a toll except during the peak hour on each lane
when only HOVs can use the lane to protect operational speeds due to capacity constraints. Variable
tolls are charged by time of day and currently range from $1.00 to $5.00 per trip. The HOT lanes are
closed from 11:00 a.m. to 1:00 p.m. to reverse the direction of the lane. Currently, most HOT lanes are
also closed at night and on weekends, with some seasonal exceptions on the IH 45 Gulf Freeway facility
(open outbound on Saturdays and inbound on Sundays during the summer).
The IH 45 Gulf Freeway HOT lane was the first facility converted to HOT operation in February of 2012.
Therefore, it has over one-years’ worth of HOT lane data to examine. Plus, it is the only HOT lane where
the location of manual occupancy counts did not change. Therefore, this is the only one of the five
conversions examined in this research. There was little change in HOV volumes after the lanes started
16
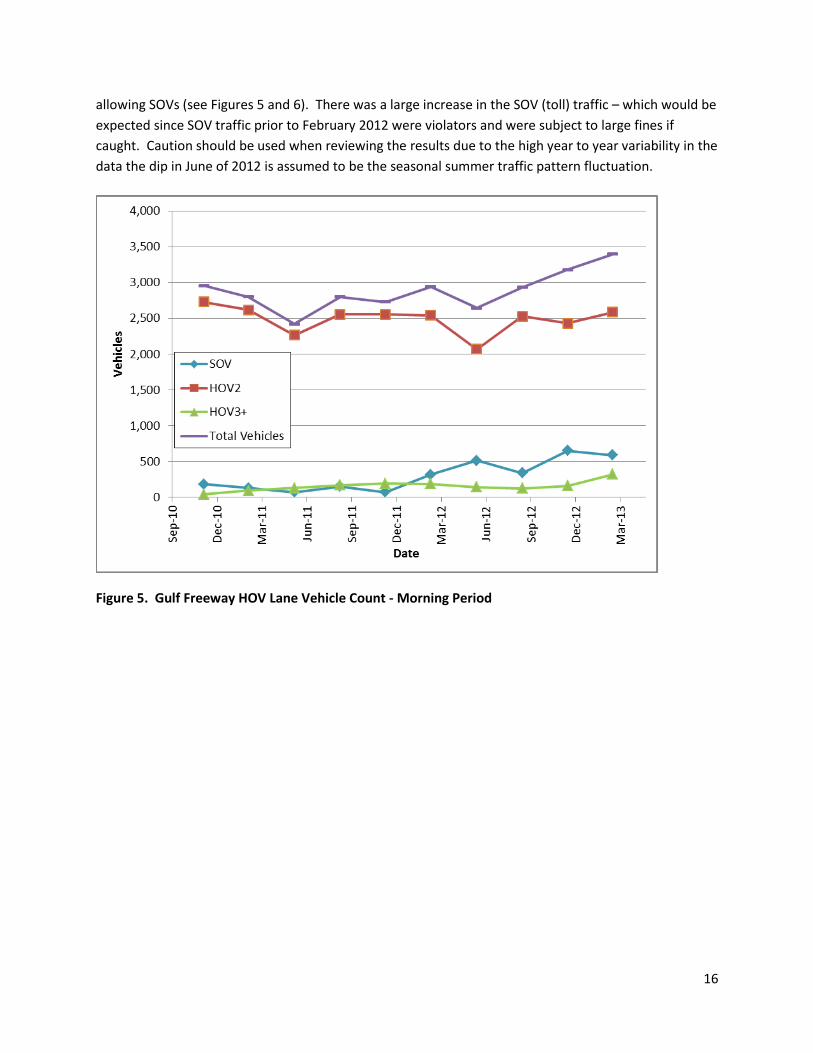
allowing SOVs (see Figures 5 and 6). There was a large increase in the SOV (toll) traffic – which would be
expected since SOV traffic prior to February 2012 were violators and were subject to large fines if
caught. Caution should be used when reviewing the results due to the high year to year variability in the
data the dip in June of 2012 is assumed to be the seasonal summer traffic pattern fluctuation.
Figure 5. Gulf Freeway HOV Lane Vehicle Count - Morning Period

17
Figure 6. Gulf Freeway HOV Lane Vehicle Count - Afternoon Period
I-85 Express Lanes in Atlanta
Approximately 16 miles of existing HOV lanes on I-85 in Atlanta, Georgia were converted to dynamically-
priced HOT lanes in October 2011. The HOT lanes were officially branded as the I-85 Express Lanes. The
project was the first HOV-to-HOT lane conversion that simultaneously introduced tolling while
increasing the occupancy requirement (from HOV2+ to HOV3+), but did not add additional lanes. At the
same time there was greatly expanded express bus service in the corridor along with limited outreach
and education to employers to encourage alternative commuting, including carpooling.
The Express Lanes use the existing footprint of the former HOV lane and kept most of the intermediate
access points where vehicles can enter and exit the lane. The toll segments that existed between each
access point ranged from 1.5 – 3.5 miles in length, creating five distinct tolling segments in both the
northbound and southbound directions. A double-white striped buffer separates the HOV lane from the
general purpose lanes. An automated enforcement system monitors where vehicles illegally crossed
the buffer by using a network of toll gantries installed at roughly 1/2-mile intervals along the corridor.
The toll rates change dynamically throughout both the morning (6-10 am) and afternoon (3-7 pm)
weekday peak periods, based on the toll segment with the highest demand. Rates outside of peak
periods during the midday period, at night, and on weekends are adjusted to be $0.01 per mile. All
other toll segments are charged the same per mile rate as the segment with the highest demand, but
18
rates differ between the northbound and southbound directions. HOVs and other toll exempt vehicles
(including motorcycles and alternatively-fueled vehicles) are required to register for a transponder
under the operating guidelines for the Express Lanes. Transponders were not needed to enter the
former HOV lane.
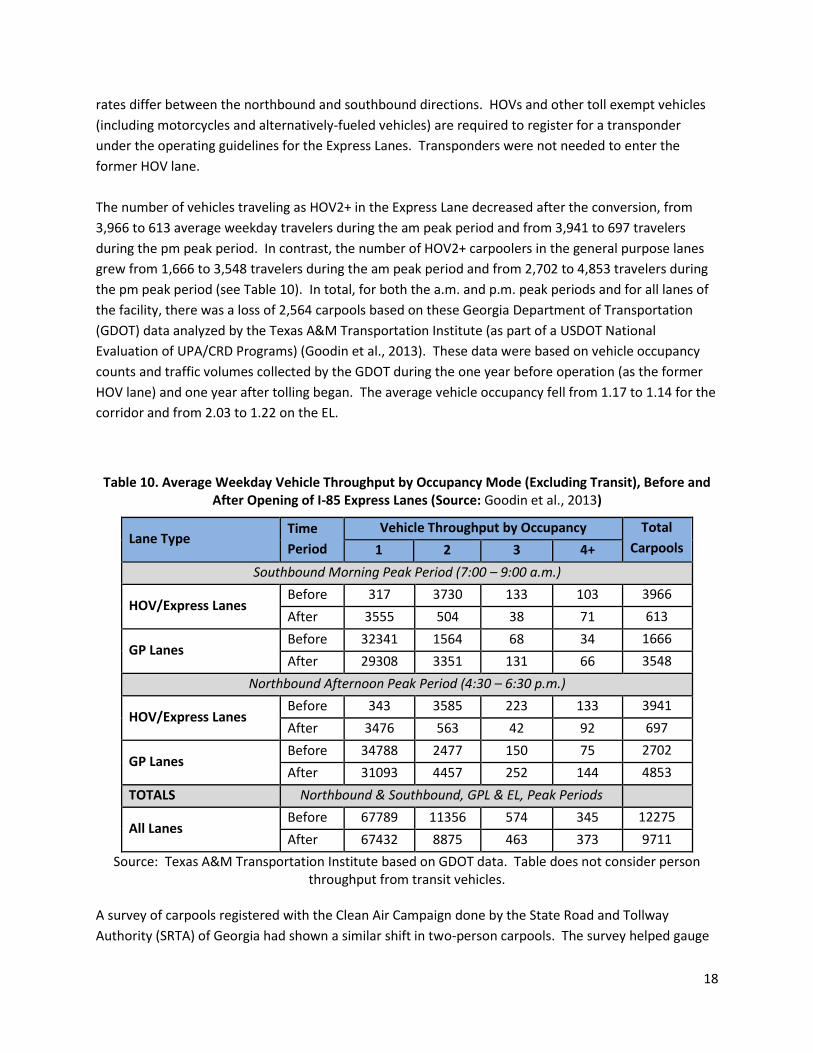
The number of vehicles traveling as HOV2+ in the Express Lane decreased after the conversion, from
3,966 to 613 average weekday travelers during the am peak period and from 3,941 to 697 travelers
during the pm peak period. In contrast, the number of HOV2+ carpoolers in the general purpose lanes
grew from 1,666 to 3,548 travelers during the am peak period and from 2,702 to 4,853 travelers during
the pm peak period (see Table 10). In total, for both the a.m. and p.m. peak periods and for all lanes of
the facility, there was a loss of 2,564 carpools based on these Georgia Department of Transportation
(GDOT) data analyzed by the Texas A&M Transportation Institute (as part of a USDOT National
Evaluation of UPA/CRD Programs) (Goodin et al., 2013). These data were based on vehicle occupancy
counts and traffic volumes collected by the GDOT during the one year before operation (as the former
HOV lane) and one year after tolling began. The average vehicle occupancy fell from 1.17 to 1.14 for the
corridor and from 2.03 to 1.22 on the EL.
Table 10. Average Weekday Vehicle Throughput by Occupancy Mode (Excluding Transit), Before and After Opening of I-85 Express Lanes (Source: Goodin et al., 2013)
Lane Type Time
Period
Vehicle Throughput by Occupancy Total
Carpools 1 2 3 4+
Southbound Morning Peak Period (7:00 – 9:00 a.m.)
HOV/Express Lanes Before 317 3730 133 103 3966
After 3555 504 38 71 613
GP Lanes Before 32341 1564 68 34 1666
After 29308 3351 131 66 3548
Northbound Afternoon Peak Period (4:30 – 6:30 p.m.)
HOV/Express Lanes Before 343 3585 223 133 3941
After 3476 563 42 92 697
GP Lanes Before 34788 2477 150 75 2702
After 31093 4457 252 144 4853
TOTALS Northbound & Southbound, GPL & EL, Peak Periods
All Lanes Before 67789 11356 574 345 12275
After 67432 8875 463 373 9711
Source: Texas A&M Transportation Institute based on GDOT data. Table does not consider person throughput from transit vehicles.
A survey of carpools registered with the Clean Air Campaign done by the State Road and Tollway
Authority (SRTA) of Georgia had shown a similar shift in two-person carpools. The survey helped gauge

19
the response of carpoolers to the HOV-to-HOT lane conversion. Some of the findings of the survey were
as follows:
9% stayed in the HOT lane as a two-person carpool
12% were originally HOV3+ carpools and continued as HOV3+
6% added a third period to their carpool to use the lane toll-free
4% switched to transit
39% switched to the general purpose lanes
30% switched to driving alone
Part of the reason for the retention of two-person carpools may be attributed to the HOV2+ lane that
still exists just to the south of the I-85 Express Lane corridor, extending to Downtown (Goodin et al.,
2013).
Note that transit ridership in the I-85 Express Lanes increased by 249 riders (21 percent) in the morning
peak period and 215 riders (17 percent) in the afternoon peak period. Most of the growth came from
the new Express Bus routes that were created as part of the project. Some of the growth could have
been from previous carpoolers as noted in the bullets above.
Conclusions
This research examined what happened to carpooling immediately after a HOV lane was converted to a
HOT lane. In theory, the added choice of traveling as a SOV on the HOV lane may result in some
carpools breaking up. The focus was to examine the change in carpools in the year following the
conversion to a HOT lane, but some data cover more than one year after the conversion.
The data were imperfect as there are some locations where counts were not taken. When counts are
undertaken, much of the data is from short term, even one-day counts of vehicles classified by number
of occupants. There is considerable fluctuation in these values from day to day and it is difficult to
accurately count the number of occupants in a vehicle – especially ones moving at freeway speeds
during periods of poor lighting. In addition, exactly what happened to carpools and why travelers may
have shifted modes is usually unknown. It is likely that some carpools changed for reasons other than
the HOT lane. For example, gas prices and employment likely have a significant impact on carpooling.
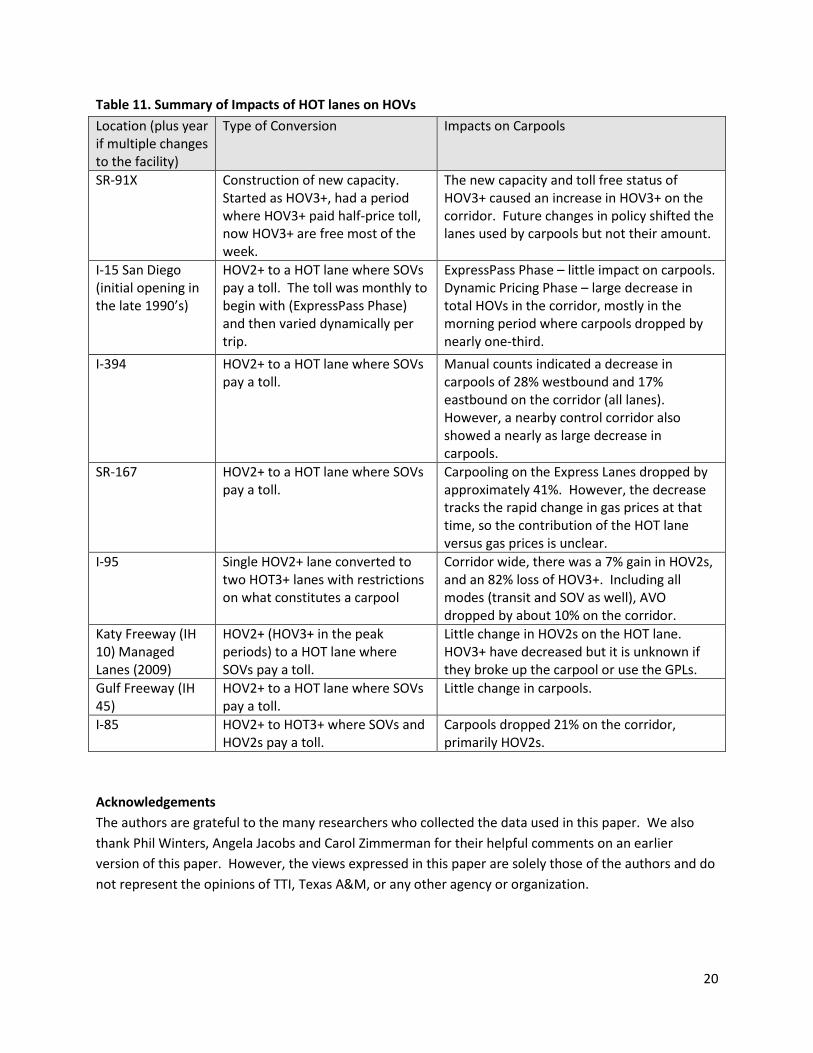
Despite these caveats, there is a general trend in the data from HOT lanes around the country as shown
in Table 11.
Overall, we see a pattern of substantial decreases in carpools on many of the HOT lanes. There are
exceptions to this, including the three locations with added capacity: SR-91X (entirely new capacity), I-95
(added a lane), I-10 (added a lane) and one location without new capacity: I-45. There also may be
unaccounted external/exogenous factors. There is a particularly strong case for this on I-394 (control
corridor also lost carpools) and SR-167 (gas price fluctuations). So, the evidence does not provide a clear
result, but it would appear HOT lanes have a negative impact on carpools, particularly HOT3+ lanes.
20
Table 11. Summary of Impacts of HOT lanes on HOVs
Location (plus year if multiple changes to the facility)
Type of Conversion Impacts on Carpools
SR-91X Construction of new capacity. Started as HOV3+, had a period where HOV3+ paid half-price toll, now HOV3+ are free most of the week.
The new capacity and toll free status of HOV3+ caused an increase in HOV3+ on the corridor. Future changes in policy shifted the lanes used by carpools but not their amount.
I-15 San Diego (initial opening in the late 1990’s)
HOV2+ to a HOT lane where SOVs pay a toll. The toll was monthly to begin with (ExpressPass Phase) and then varied dynamically per trip.
ExpressPass Phase – little impact on carpools. Dynamic Pricing Phase – large decrease in total HOVs in the corridor, mostly in the morning period where carpools dropped by nearly one-third.
I-394 HOV2+ to a HOT lane where SOVs pay a toll.
Manual counts indicated a decrease in carpools of 28% westbound and 17% eastbound on the corridor (all lanes). However, a nearby control corridor also showed a nearly as large decrease in carpools.
SR-167 HOV2+ to a HOT lane where SOVs pay a toll.
Carpooling on the Express Lanes dropped by approximately 41%. However, the decrease tracks the rapid change in gas prices at that time, so the contribution of the HOT lane versus gas prices is unclear.
I-95 Single HOV2+ lane converted to two HOT3+ lanes with restrictions on what constitutes a carpool
Corridor wide, there was a 7% gain in HOV2s, and an 82% loss of HOV3+. Including all modes (transit and SOV as well), AVO dropped by about 10% on the corridor.
Katy Freeway (IH 10) Managed Lanes (2009)
HOV2+ (HOV3+ in the peak periods) to a HOT lane where SOVs pay a toll.
Little change in HOV2s on the HOT lane. HOV3+ have decreased but it is unknown if they broke up the carpool or use the GPLs.
Gulf Freeway (IH 45)
HOV2+ to a HOT lane where SOVs pay a toll.
Little change in carpools.
I-85 HOV2+ to HOT3+ where SOVs and HOV2s pay a toll.
Carpools dropped 21% on the corridor, primarily HOV2s.
Acknowledgements
The authors are grateful to the many researchers who collected the data used in this paper. We also
thank Phil Winters, Angela Jacobs and Carol Zimmerman for their helpful comments on an earlier
version of this paper. However, the views expressed in this paper are solely those of the authors and do
not represent the opinions of TTI, Texas A&M, or any other agency or organization.
21
References
American Public Transportation Association, (2011). Potential Impact of Gasoline Price Increases on U.S.
Public Transportation Ridership. Washington, D.C. <
http://www.apta.com/resources/reportsandpublications/Documents/APTA_Effect_of_Gas_Price_Increa
se_2011.pdf> accessed on January 20, 2014.
Cambridge Systematics, Inc. (2006): I-394 MnPASS Technical Evaluation: Final Report. Minnesota
Department of Transportation.
Goel, R. and M.W. Burris (2012): ‘Hot Lane Policies and their Implications’. Transportation, 39, 1019-
1033.
Golob, J.M, J. Supernak, T.F. Golob, and K. Kawada (1998): ‘An Evaluation of a High Occupancy Toll (HOT)
Lane Demonstration Project In San Diego’. Proceeding of Seminar C held at the European Transport
Conference, Loughborough University: 225-270. PTRC, London.
Goodin, G., E. Schreffler, N. Wood, and C. Zimmerman. “White Paper: Impact of HOV-to-HOT
Conversions on Carpooling.” Federal Highway Administration, Office of Operations. Washington, D.C.
Draft Version, October 2013.
Li, Jianling. (2007) “Potential Users’ Perspective on Managed Lanes: Insights from a Focus Group Study,”
in the Journal of Public Works Management and Policy, Vol. 12, No. 2, pp. 416-430.
Pisarski, A. (2006). “COMMUTING IN AMERICA III - The Third National Report on Commuting Patterns
and Trends.” NCHRP REPORT 55O, National Cooperative Highway Research Program, TCRP REPORT 11O,
Transit Cooperative Research Program, National Academy of Science, Washington, D.C. <
http://onlinepubs.trb.org/onlinepubs/nchrp/CIAIII.pdf> accessed May 2013.
Pessaro, B. and C.V. Nostrand (2011): Miami Urban Partnership Agreement (UPA) Project: Phase 1
Transit Evaluation Report Final, FL-26-7110-02, U.S. Department of Transportation Federal Transit
Administration, Washington, DC.
Sullivan, E. (1998): Evaluating the Impacts of the SR91 Variable Toll Express Lane Facility: Final Report,
California Department of Transportation, Sacramento.
Sullivan, E. (2000): Continuation Study to Evaluate the Impacts of the SR91 Value-Prices Express Lanes:
Final Report, California Department of Transportation, Sacramento.
Supernak, J. (2001): I-15 Congestion Pricing Project Monitoring and Evaluation Services: Task 1, San
Diego Association of Governments, San Diego.

22
Zmud, J. (2006): MnPASS Evaluation Attitudinal Panel Survey Wave 3: Final Report. University of
Minnesota, Minneapolis.