the impact of indirect distribution strategies
TRANSCRIPT

The Impact of Indirect Distribution Strategieson Supply Chain Operations
by
Mark A. ParrishB.S., Operations Research Studies (Mechanical Engineering)
United States Military Academy, 1987
Submitted to the Department of Mechanical Engineeringand the Sloan School of Management in Partial Fulfillment of the Requirements
for the Degrees of
Master of Science in Mechanical Engineeringand
Master of Science in Management
in conjunction with theLeaders for Manufacturing Program
at theMassachusetts Institute of Technology
June 1995
0 1995 Massachusetts Institute of Technology. All rights reserved.
Signature of Author .
/1/Certified by
Certified by
1f
Department of Mechanical EngineeringSloan School of Management
May 12, 1995
Warren Sering, Professor of Mechanical EngineeringDepartmdit of Mechanical Engineering Thesis Advisor
.-- ..· it-- ht%
.-- _ .1 - ...... - -- ...... -Donald. osenfield, Senior Lecturer of Management
and Director, LFM Fellows ProgramSloan School of Management Thesis Advisor
I
Accepted byAin A. Sonin
Chairman, Graduate CommitteeMASSACHUSETS NSTITUPepartment of Mechanical Engineering
OF TECHNOLOGY
Swkr Fe.AUG 311995
LIBRARIES
I l
X At.

The Impact of Indirect Distribution Strategieson Supply Chain Operations
byMark A. Parrish
Submitted to the MIT Department of Mechanical Engineeringand the Sloan School of Management in Partial Fulfillment of the Requirements
for the Degrees ofMaster of Science in Mechanical Engineering
andMaster of Science in Management
ABSTRACT
Manufacturers deliver product to market through direct sales and distribution, indirectdistribution channels, or some mix of the two. But what of the challenge facing firmscommitted to changing from one distribution strategy to another? This thesis explores thisquestion in detail through an evaluation of the server market in the computer andelectronics industry. The objective of the thesis is to substantiate the hypothesis that achange in distribution strategies from direct to indirect channels significantly impactsbusiness practices and manufacturing processes.
Within the server market, indirect channel partners provide benefits to both manufacturersand end users alike. However, these benefits bring with them associated costs. One of thelargest of these costs, and the one most difficult to manage by corporations adoptingchannel strategies, lies in the area of quality assurance.
Server manufacturing occurs in three value-added stages-module manufacturing, systemconfiguration, and order consolidation. Current quality assurance strategies call fortesting to occur at the end of each stage. Such strategies are based on a "safety net"approach that relies upon later testing to capture escaped faults from earlier test steps.However, under an indirect distribution strategy this safety net is removed as productdeparts the manufacturing process prior to arriving at the later test station.
A mathematical model is created to determine the cost of lost quality associated withchanging distribution strategies. The results of this model indicate that traditional methodsof quality assurance, those that rely on increased test coverage to gain greater processyields, are incapable of meeting the challenge posed by an indirect distribution strategy.Manufacturers can only compete in the channels' arena by adopting a comprehensivestrategy that optimizes both business practices and manufacturing processes around itsdistribution model. Finally, to ensure success this strategy must be pursued with ademonstrated commitment to channel partners' success.
Thesis Advisors: Donald B. Rosenfield, Senior Lecturer of ManagementWarren Seering, Professor of Mechanical Engineering
2

ACKNOWLEDGMENTS
The research presented in this thesis was performed under the auspices of the MITLeaders for Manufacturing Program, a partnership between MIT and thirteen major U.S.manufacturing companies. I am grateful to the LFM partners for their support throughoutmy MIT experience. Their continued dedication to LFM and its ideals providesencouragement and inspiration to those committed to American manufacturing excellence.
Of these companies, I especially wish to thank Digital Equipment Corporation for itsunlimited support of my internship and this work. Within Digital I wish to extend apersonal word of gratitude to several key individuals.
Thank you, Joan Hurley, Hank Rauch, and Chris St.Cyr, for allowing me to engage thecompany early on in the process before my internship commenced. Thank you, EugeneMcCabe, for your willingness to pick up the supervisor responsibilities so late in myinternship. And thanks to the product development team for your energy, encouragement,and commitment to my endeavors.
I wish to extend a few very warm and special thanks to three individuals that made myDigital experience particularly rewarding. Thank you, John Doyle, for your counsel andfor always knowing where to go for corporate resources-truly a jack of all trades and amaster of many as well. Thank you, Dave Citorik, for your continued support throughoutthe internship and beyond. And thank you, Mary Doddy, for your supervision, yourseminal efforts at tying manufacturing to a channels strategy, and for your continuedfriendship even after departing the company. I have benefited immensely from ourassociation.
I wish to extend a word of gratitude to my advisors, Don Rosenfield and Warren Seering.Don, thank you not only for your support on the internship and thesis, but also for yourvenerable guidance throughout my LFM experience. I look forward to maintaining ourassociation as an alum And Warren, thank you for your leadership and for alwaysinsisting that I was the customer. Your guidance and project management skills haveprovided me as much insight into the world of management as your knowledge andexpertise have in engineering. I am grateful for your balance.
In closing, I would be remise if I failed to acknowledge those women most special to me.Thank you, Allison, for your understanding, patience, and unending words ofencouragement and praise. I look forward to now supporting your endeavors. And thankyou, Elizabeth and Emily, for your infinite smiles and hugs so graciously given. Throughyour innocence you continually remind me of how much I have yet to learn.
3

To my father-in-law, Col. Gaines M. Timberlake, USAF (Ret.),who departed this world for the next during my tenure as an intern at
Digital Equipment Corporation. Let it be written here for all to witness:
He fought the good fight.
We miss you dearly, Sir.
4

Table of Contents
CH APTER 1 INTRODUCTION ............................................................................................................ 7
1.1 COMPUrER AND ELECTRONIC S INDUSTRY EVOLuriON .......................................................................... 7
1.2 COMPANY BACKGROUND ..................................................................................................................... 8
1.3 STATEMENT OF THE PROBLEM............................................................................................................10
1.4 THEsis OBJECTIVES ........................................................................................................................... 101.5 SCOPE AND LIMITATIONS ................................................................................................................... 11
1.6 THESIS OVERVW ............................................................................................................................. 12
CHAPTER 2 PROJECT BACKGROUND .......................................................................................... 13
2.1 THE SERVER PRODUCT DEVEL OPMENT TEAM ..................................................................................... 13
2.2 THE SERVERM ARKET ........................................................................................................................ 14
2.3 LTrERATURE SEARCH ......................................................................................................................... 162.3.1 How Channels Impact the Manufacturing Discipline ................................................................172.3.2 Channels of Distribution: A Foundation ..................................................................................192.3.3 Thesis-Related Literature .......................................................................................................... 20
CHAPTER 3 SERVER CHANNELS OF DISTRIBUTION ................................................................ 23
3.1 SERVER CHANNEL PARTNERS ............................................................................................................. 23
3.1.1 Resellers ................................................................................................................................... 243.1.2 Distributors .............................................................................................................................. 243.1.3 Value Added Resellers (VAR) .................................................................................................... 253.1.4 Systems Integrators (SI) ............................................................................................................ 253.1.5 Original Equipment Manufacturers (OEM) ...............................................................................253.1.6 Independent Software Vendors (ISV) .........................................................................................25
3.2 CHANNEL BENEFrrs .......................................................................................................................... 26
3.3 CHANNEL PARTNERS AS CUSTOMERS .................................................................................................. 28
3.4 MEEiNG CHANNEL NEEDS THROUGH BUSINESS PRACTICES .................................................. 29
3.4.1 Pricing ...................................................................................................................................... 293.4.2 Training .................................................................................................................................... 303.4.3 Packaging ................................................................................................................................. 31
3.5 WHY CHANNELS NOW? ..................................................................................................................... 32
3.6 THE COST OF DOING BUSINESS WTrrH CHANNEL PARTNERS .................................................................. 33
CHAPTER 4 SERVER MANUFACTURING AT DIGITAL .............................................................. 34
4.1 STAGE 1: M ODu Em ANuFACrURG ................................................................................................ 344.2 STAGE 2: SYSTEM CONFIGURATION ................................................................................................... 36
4.3 STAGE 3: ORDER CONSOLIDATION .................................................................................................... 36
4.4 TESTING STRATEGY .......................................................................................................................... 374.4.1 StageI Testing ..........................................................................................................................374.4.2 Stage 2 Testing ......................................................................................................................... 384.4.3 The Testing "Safety Net" ......................................................................................................... 38
4.5 CHANNEL STRATEGY MAN ACTURING IMPLICATION ....................................................................... 39
4.5.1 How Channels M ight W ork at D igital .......................................................................................394.5.2 Module Quality Assurance Through Channels ..........................................................................404.5.3 A Modeling Approach ............................................................................................................... 42
CHAPTER 5 MATHEMATICAL MODEL OF SERVER QUALITY ............................................... 44
5.1 THE MODELINGPROCESS. .................................................................................................................. 445.1.1 Phase 1: Capturing and Normalizing the Donor Server Data ................................................... 46
5

5.1.2 Phase 2: Translating the Normalized Data .............................................................................. 485.1.3 Phase 3: Applying Current Test Detection Capabilities to the Translated Data ....................... 49
5.2 SUMMARY OF FINDINGS ............................................................................................ ........................ 49
5.3 OPTION 3: CAPITAL INVESTMENT INTEST STRATEGY REDESIGN ......................................................... 505.4 REVISITING THE OTHER OPTIONS ......................................................................... 5.............................. 1
5.5 CRITIQUE OF MODELING METHODOLOGY ........................................................................................... 53
CHAPTER 6 CONCLUSIONS AND RECOMMENDATIONS .......................................................... 55
6.1 THESIS SUMMARY ............................................................................................................................. 55
6.2 MAJOR CONCLUSIONS ....................................................................................................................... 55
6.3 RECOMMENDATIONS FOR FURTHER STUDIES.......................................................................................56
6.3.1 ChannelMigration ................................................................................................................... 566.3.2 Partners in the Life Cycle ......................................................................................................... 57
BIBLIOGRAPHY ................................................................................................................................. 59
APPENDIX A SAMPLE CHANNEL PARTNER NEEDS .................................................................. 63
A. 1 SE VARs (TIE D) ....................................................................................................................... 63A.2 VALUE ADDED RESElERS ................................................................................................................ 64A.3 FORTUNE 500 FOCUSED RESELLERS ................................................................................................. 64A.4 INDEPENDENT SOFTWARE VENDORS (ALSO KNOWN AS COMMERCLAL DEVELOPERS) ............................ 65
A.5 SYSTEM INTEG RATORS....................................................................................................................65
APPENDIX B SERVER MANUFACTURING PROCESS FLOW ..................................................... 66
APPENDIX C QUALITY MODEL SAMPLE DATA ......................................................................... 70
PHAE 1: CAFrURiNG AND NORMALIZING THE DONOR SERVER DATA ........................................................ 70
Actual Donor Module #1 Captured Data: ...........................................................................................70Actual Donor Module #2 Captured Data: ...........................................................................................71Actual Donor Module #3 Captured Data: ...........................................................................................72Sample Normalized Stage I Test Assembly Defect Rates (per million leads) ........................................ 73Sample Normalized Stage I Test Component Defect Rates (per million components) ........................... 74Sample Normalized Field Failure Module Defect Rates ......................................................................75Sample Calculation of Total Defect Opportunities and Complexity Scaling Factor .............................75
PHASE 2: TRANSLATING THE NORMALIZED DATA ..................................................................................... 76
Sample ofNew Server's Stage I, Module #1 Translated Defect RatesAcrossAll Failure Modes(Calculated from Normalized Donor Data) .........................................................................................76Sample Translation of New Server's Defect Per Module Rates from Normalized Donor Data for SixModules Across all Manufacturing Stages ..........................................................................................76
PHASE 3: APPLYING CURRENT TEST DETECTION CAPABILITIES TO THE TRANSLATED DATA TO ARRIVEAT
STAGE I ESCAPE RATES ............................................................................................................................ 77
Sample Calculation of New Server's Stage I, Module #1 Defect Escape Rates ....................................77
APPENDIX D INVENTORY CALCULATIONS ................................................................................ 78
6

CHAPTER 1INTRODUCTION
1.1 Computer and Electronics Industry Evolution
Darwin's theory of biological evolution postulates that genetic mutations occur in
response to environmental stimuli. These mutations propagate through a natural selection
process until they become characteristic of the species, by which time new stimuli have
initiated the next adaptation (Darwin, 9). I find this same adaptive evolution process an
effective descriptor of the events that have occurred in the computer and electronics
industry. Using this parlance, the industry is now entering its third generation of adaptive
evolution. I refer to the three as the Genesis, the Technology Proliferation, and the
Personal Computer (PC) Generations, respectively. Each generation is identified by a
unique business model, and each has stimulated a new breed of company that has led to its
demise.
International Business Machines (IBM) epitomizes the Genesis Generation. Spanning the
1940s and 50s, this era marked the dawning of the computer age. In response to
Remington Rand's introduction of the UNIVAC (1951), IBM fielded its first commercial
mainframe computer (the IBM 701, 1952). Through a direct distribution strategy reliant
upon a sales force renowned for its white shirts and dark suits, IBM triumphed time and
again with successes that spawned both subsequent generations (Hoover's Handbook
Database, IBM).
In 1953 MIT's Lincoln Laboratory loaned a young engineer named Ken Olsen to IBM
(Rifkin and Harrar, 22). Motivated by his sabbatical, Olsen gave life to the Technology
Proliferation Generation with his creation of Digital Equipment Corporation (also known
as DEC and Digital) in 1957. Spanning the 1960s and 70s, this generation avoided direct
competition with IBM by creating niches on the industry behemoths' periphery.
Characterized by Digital Equipment Corporation's business model and minicomputer
7
product line, companies succeeded by selling to end users both directly through a sales
force and indirectly through Original Equipment Manufacturers (OEMs).
IBM's widespread introduction of the personal computer in 1981, and Digital's ability to
leverage its distribution channels, provided the impetus for the PC Generation. Beginning
in the 1980s and continuing to the present, this generation's business model mutation
occurred in the area of product development and distribution. Where I classify the first
two as technology-driven, successful manufacturers of this third generation now provide
market-driven products to end users through indirect channels of distribution. Corporate
objectives focus on the optimization of business practices and manufacturing processes
rather than on the innovation of highly technical products. Companies like Compaq
Computer Corporation (Compaq), the world's number one manufacturer of PC-based
client servers, epitomize this era.
It is within the context of this latest generation that I conducted the research for my thesis
at Digital. The company hoped that I would join a host of others dedicated to its
successfidul transition from one generation to the next. This thesis explores the challenge of
such a transition from a manufacturing perspective by pursuing the impact of a best-in-
class distribution practice on Digital's value chain
1.2 Company Background
In 1988 Digital Equipment Corporation enjoyed the enviable position of being number two
(second only to IBM) in the computer and electronics industry while having one of its best
years ever. The workforce approached 130,000 employees, sales were booming at $12.7
billion by year's end, and net income cleared the invisible hurdle at $1.07 billion.
However, within a few tumultuous years the company found itself in the red and leading
the industry in layoffs and losses. Having faced rough times before, Digital dug in and
prepared for battle. To survive this onslaught, it chose to re-engineer its business
practices under the guide of a new leader, Robert Palmer.
8

In July of 1994 Palmer announced some of the latest re-engineering initiatives he wished
to pursue. Among these was a renewed emphasis on indirect channels of distribution.
What follows is an explanation of why.
As shown in Figure 1.1, Digital's customer profile tells an insightfil tale about the
economics of the company's direct sales coverage. As testimony to the eighty-twenty
rule, twenty percent of Digital's accounts contributed nearly eighty percent of its
revenues. Even more startling, however, is the fact that in terms of the cost of doing
business (as reflected in Sales, General and Administrative, or SG&A) these eighty percent
were achieved through a mere forty percent of burden. Some industry analysts reasoned
that Digital could literally become profitable over night if it simply stopped selling to the
most costly eighty percent of its accounts!
41 nnoL'
80%80%
60%
40%
20%
0%
Number of Revenue SG&AAccounts
Figure 1.1: Digital's Direct Coverage Economics (Palmer, 7)
A quick benchmarking calculation demonstrated that those companies relying upon
indirect sales had SG&A's some ten percent lower than Digital's in terms of percentage of
revenue (Digital=30%, Industry Standard=18-20%) (Pesatori, 14 Sep. 1994). Therefore,
an indirect distribution strategy that aggressively incorporated channel partners in reaching
the most costly accounts was proposed as a means of decreasing SG&A while maintaining
revenues. With his July announcement Palmer accepted this proposal. The question now
facing Digital was how to develop and build products that ensured profitability through
indirect channels of distribution.
9

1.3 Statement of the Problem
Within the manufacturing environment two schools of thought evolved around how best
to address the question of how to develop and build products for channels. One school
believed that change would only be necessitated in business practices and that the way
Digital builds products will remain unchanged despite the shift in emphasis to indirect
channels of distribution. The other school however, believed that a change in distribution
strategy, one that incorporated channel partners in the supply chain, brought with it a
major change in customer base. These new customers would add greater demands-
demands to be addressed not only through business practices but also through product and
manufacturing process design.
This second school of thought is the focus of this thesis. In it I evaluate the shif in
majority customer profile from end users to indirect channels partners. I substantiate the
hypothesis that this change in customer profile has a significant impact on the supply chain
with particular emphasis placed on the manufacturing link. This impact is, in fact, so
significant that traditional quality assurance techniques cannot compensate for it. Finally, I
accomplish both of these tasks through quantitative analysis based on my experiences as
an external consultant to the management team of a new product development initiative in
the server market.
1.4 Thesis Objectives
By writing this thesis I hope to accomplish three objectives. First, by circulating it within
the product development team (PDT) I hope to increase their awareness of how channels
affect their efforts. Second, by making it available throughout the rest of Digital and to
the other Leaders for Manufacturing Program sponsors I hope to facilitate a channels
discussion within the manufacturing community. Finally, I hope to bridge the gap between
manufacturing and other business disciplines through a single document that captures the
impact of business decisions on the manufacturing function of an enterprise.
10

This last objective is accomplished by gaining an understanding of Digital's current
manufacturing processes and then using a mathematical model to determine the impact
channels might have on them Although tailored to one specific product line in the
computer and electronics industry, the model can conceptually be adapted to any
manufacturing process, or industry for that matter, to assess the impact of indirect
distribution strategies on supply chain operations.
The thesis deliverables include:
1. a description of the channel's environment-the key players, their roles, and theirinterests,
2. a mathematical model for use in determining the expected quality of proposedproducts, and
3. a recommendation on where to best focus continued research on indirect channels ofdistribution.
1.5 Scope and Limitations
Within the thesis I describe in general terms the channels' environment and its importance
to manufacturers. However, the quantitative analysis I conduct is limited in scope to a
single server product within the computer and electronics industry. As such, its solution is
unique to both this market and the challenges Digital faces in it. Nevertheless, the
modeling process has numerous applications and lends itself to easy replication. Any
enterprise interested in assessing the impact of an indirect distribution strategy on its
supply chain management can conceptually adapt the model to its environment.
Because of the dynamic nature of the channels' environment there exists a temporal
limitation on the accuracy of this study. It is but a snapshot of a continually evolving
environment. The key channels players, their roles, and the resultant business models they
spawn change so rapidly that even during the course of this writing the industry terms
used to describe them varied. As the channels environment continues to evolve, so too
might the industry within which this evolution occurs, bringing with it a new generation of
business models and their associated challenges not addressed within this study.
11

Finally, this study only addresses in detail the channels' impact on manufacturing. As I
highlight later in the thesis, manufacturing is but one of many communities impacted by a
migration to indirect distribution. A thorough commitment to a channels strategy requires
that the entire manufacturing enterprise adopt a new mindset on how to successfully
conduct business with another company's profitability in mind.
1.6 Thesis Overview
I have divided the thesis by chapters and appendices into three sections. The first section
covers thesis background data and includes Chapter 2 and Chapter 3. In Chapter 2 I
discuss the background for my research. I include a description of the server market, my
PDT, and a review of current literature on both channels and electronic testing. In
Chapter 3 present the server market's channels of distribution. I elaborate on why they
are of significance now and what challenges manufacturers face in meeting their needs.
The second section covers the impact of indirect distribution strategies on supply chain
operations and includes Chapter 4 and Chapter 5. In Chapter 4 1 focus specifically on the
impact of channels on manufacturing. I detail server manufacturing and testing processes
and posit how they might change under an indirect distribution strategy. In Chapter 5 I
describe a quantitative model created to substantiate my assertions and then use its results
to calculate the additional investment in testing coverage needed to ensure quality through
channels. From these calculations I conclude that the implications to manufacturing of
pursuing an indirect distribution strategy are so significant that investment in traditional
processes alone is not enough.
Finally, the third section covers thesis conclusions and ancillary data and includes Chapter
6 and Appendices A through D. I close the thesis in chapter six by summarizing my
findings, presenting the conclusions drawn from them, and recommending areas for
continued research. Throughout the text I frequently reference the four appendices that
follow the chapters. In them I provide supplemental data and supporting documentation
that the reader may find of interest.
12

CHAPTER 2PROJECT BACKGROUND
This chapter provides the context for the thesis research. In Section 2.1 present the
internal project environment by describing the organizational landscape within which I
gathered data. In Section 2.2 I present the external project environment by providing an
overview of the server market. Finally, in Section 2.3 I provide the results of a literature
search on not only channels of distribution, but also on the thesis-relevant topics of
business process reengineering, lean manufacturing, vertical integration, and electronic test
strategy.
2.1 The Server Product Development Team
In response to the changes brought on by its reengineering efforts, Digital announced a
reorganization into six product and service divisions in July of 1994. The reorganization
chartered the Computer Systems Division (CSD) to provide the market with computer
systems through three worldwide business units. The CSD built each of these business
units around specific business models that reflected the purchasing patterns of the
customers they targeted. The Accounts Business Unit dealt directly with the largest
system accounts as illustrated in Figure 1.1. The PC Business Unit targeted the personal
computer market through indirect mediums, emphasizing catalogue and telephonic sales.
Finally, the Systems Business Unit (SBU) targeted the high-volume system market
through indirect channels of distribution (LIVEWIRE, 18 Jul. 1994).
The SBU's Alpha Systems Business Group is responsible for designing and manufacturing
computer systems based on Digital's proprietary Alpha chip technology. The proposed
server I address throughout this thesis falls into this category. The server PDT consisted
of numerous design and manufacturing engineers that reported directly to a management
team. This team consisted of representatives from each of the business group's
disciplines.
13
The role within which I conducted my research was as an external consultant to the
manufacturing representative to the PDT management team In accordance with the CSD
charter and the reengineering objectives laid out by Palmer in his announcement, the team
defined for itself the mission of designing the next server as a "channels ready" product.
Their intent was to incorporate channel partner needs directly into the server design,
manufacturing, and distribution processes. I was to facilitate the incorporation of these
needs into new product and process design by gathering data on 'Design for Channels"
principles. I would then use this data to assess the impact to manufacturing of switching
from a direct to an indirect distribution strategy in the server market. Part of my
assessment was to included recommended areas for additional investment. Methods of
data collection at my disposal included quantitative modeling, published literature,
customer interviews, benchmarking studies, on-site studies of the proposed manufacturing
facility for the new product, and the support of previous server PDTs.
2.2 The Server Market
Enterprises that purchased data processing capability during the Genesis and Technology
Proliferation Generations grew heavily reliant upon mainframes and minicomputers for
their needs. However, the Financial Times last year reported that ofthese companies
nearly half anticipate a shift to client-server computing in the next few years (Manchester,
3). Dataquest, Inc., a computer industry analyst, reports that server shipments will grow
in excess of eight percent per year through 1997. More noteworthy, however, is
Dataquest's forecast of the midrange server segment growth at greater than twenty
percent per year during the same period (Maltzman, 1). Why the projections of steady
server market growth, and what of this midrange server category and its amazingly
aggressive forecasts? Answers to these questions lie in the technology development and
purchasing patterns found throughout the industry.
Client-server technology conceptually parcels computer systems into two domains. First,
the client domain consists of the front-end, decentralized, user-interface components and
typically includes a keyboard, monitor, and processing unit. The server domain consists of
14

the back-end, centralized components and may include storage, memory and code
accessible by each of the client sites simultaneously (Manchester, 3). Analysts segment
the server market by processing capability and price into four categories:
mainframes/supercomputers, midrange servers, workstations, and personal computer
servers (Maltzman, 2).
This segmentation reflects the shift mentioned earlier from mainframe and minicomputer
processing to client-server computing. As the PC Generation evolved many large
companies purchased personal computers and relied upon them to meet their distributed
processing needs. However, as PC technology advanced the computing economies of
scale offered by volume-built PC, or low-end, servers enormously increased. As a result,
a pooling of these distributed PC resources into a network managed by low-end to
midrange servers occurred. Based on PC technologies, these servers are now as advanced
as many of the larger and more expensive systems they replaced.
From the largest customers' perspective servers offer affordable, no-frill mainframe
performance. For small to medium-sized enterprises unable to fully utilize a mainframe's
capabilities, servers offer an alternative solution. Finally, as Information Technology
proliferates the business landscape, servers become an attractive means of managing the
electronic networks that evolve. No matter whom the customer is, though, one fact is
certain: Gone are the days when hardware technology drove purchasing patterns. The
customer of today instead purchases business solutions, and is typically indifferent of the
platform or software upon which that solution is derived. This fact does not sit well with
manufacturers that differentiated themselves on hardware technology. As if that were not
enough, customers are no longer alone in their purchasing decisions. An entire army of
consultants has evolved with the market. For manufacturers these solution consultants
take the form of channel partners that drive not only customer purchasing patterns but also
manufacturers' business practices.
15

One of the companies most adept at dealing with channel partners in the server market is
Compaq. As a PC Generation corporation, Compaq from its inception relied heavily upon
channel partners. As its technology capabilities advanced and the popularity of servers
grew, Compaq expanded its business model to include the server market. Its success thus
far has been staggering and has established the best-in-class standard so many of its
competitors now pursue.
Where technology had for years driven product strategies in the industry, Compaq chose
to pursue product strategies driven by its distribution model (Raulerson, 1). Within two
years of committing itself to a "channel ready" product strategy the company had
increased net income 117 percent and captured over sixty-four percent of the PC Server
market (as measured by units shipped). Even more amazing is Compaq's best-in-class
SG&A following this model-an amazing 11.6% of revenue (King, 1). Compaq
accomplished these feats through an aggressive relationship-building initiative aimed at
ensuring channel partners' success. In chapter three I introduce channel-friendly actions
like those taken by Compaq that assure success through indirect distribution.
2.3 Literature Search
I divide the results of my literature search into three sections. In the first section I present
contemporary journal articles pertaining directly to the impact of indirect distribution
strategies on supply chain management, with particular emphasis given the manufacturing
link. These articles are critical references for those wishing to pursue a deeper
understanding of the impact of a channels strategy on supply chain management and the
manufacturing discipline. In the second section I present works that provide the
foundation for an understanding of the channels' environment. While more general in
nature, they address both the role and the management of channels. Finally, in the third
section I briefly present a collection of books and articles considered relevant but not
critical to a thorough understanding of the thesis.
16

2.3.1 How Channels Impact the Manufacturing Discipline
In his article entitled The Distribution Revolution," Tim Davis addresses the impact of
indirect distribution on the manufacturing discipline within several enterprises. Davis
asserts that enlightened manufacturing firms, those realizing the benefits to be gained by
partnering with channels, are learning new ways of adding value while cutting costs and
increasing delivery speed. This is especially critical in the manufacturing industry, where
the cost of direct distribution may be as much as forty percent of revenue. As evidence to
support his assertion he presents several case studies from within the industry. At
Tupperware, the distribution network has been incorporated into manufacturing via an
automated storage retrieval system By aggressively pursuing a more integrated approach
to supply chain management, Tupperware has realized huge gains in efficiency without
calling for workforce reductions. Finally, Davis offers Philips Consumer Electronics'
efforts at distribution integration as the epitome of the enlightened manufacturing firm.n
Philips completely reengineered its design, prototyping, and testing processes for new
products in order to shorten development times in support of its channel strategy (Davis,
43).
In his article entitled 'Reinventing the Warehouse," William C. Copacino elaborates on
Davis' assertion, claiming that companies now view their supply chains, and the role of
distribution within these chains, differently. Copacino argues that there are three driving
factors behind this change. First, technology is enabling firms to reengineer their business
processes. Second, product flows are being optimized by leveraging new transportation
service offerings. Finally, customer demands for lower costs, better customer service, and
faster response times are reshaping how manufacturers deliver product to market. In
response to this dynamic environment, some firms have chosen to redesign their supply
chain around the role of the distribution center, or warehouse. By introducing concepts
such as flexible manufacturing and flow-through distribution, and by outsourcing to
distribution channels what once were considered value-added manufacturing activities,
Copacino believes these responsive firms will leverage the logistics fimction as a powerful
competitive advantage (Copacino, 32).
17

Kistner et al., in their report entitled "An Integrated Approach to the Development of
Channel Strategy," point to the role of distribution channels in delivering satisfaction to
the customer through product and service delivery. They argue that manufacturing firms
cannot be successfuli without incorporating channel partners into both their strategic and
product planning processes. To facilitate this process, they present a distribution strategy
framework that manufacturing firms can use in seeking the optimal balance between
corporate strategic goals and the interests of channel partners. This framework requires
the manufacturer to view the channel as a customer, and to address the critical issues of
channel loyalty, effectiveness and conflict. They present emerging trends and
contemporary issues in industrial distribution as evidence to substantiate their strategic
framework (Kistner et al., 315).
The Electronic Business Buyer specifically focuses on the issue of new product
development that Kistner et al. alluded to in the above reference. In an article entitled
"Distributors' New Services Save Time and Money," the journal reports that cost
reduction efforts force manufacturers to outsource manufacturing activities. This results
in an even greater incentive to partner early in the product development cycle with indirect
channels of distribution. Early contact with the channels can result in lower development
costs, as these key players combine customer knowledge with new technology in
generating the right solution the first time. Fewer prototypes and on-time releases mean
lower development costs for the manufacturer. Once the product is launched, several
manufacturing tools can be extended to channel partners to facilitate their involvement in
the later stages of the product life cycle. Just-in-time delivery to channels is feasible
through inventory replenishment systems such as those mentioned in the Davis article.
Computer networks that permit distributors to access manufacturers' finished goods
inventories are growing in popularity. Finally, in-plant stores managed by channel partners
are presented as a growing trend aimed at reducing material handling and order
management costs ("Distributors"', S7).
18

Most recently, the Spring 1995 Sloan Management Review included an article entitled
'"Channel Partnerships Streamline Distribution." Although focused on the retailer-supplier
interface, the article provides a conceptual framework applicable to myriad channel
relationships. Buzzell and Ortmeyer describe the benefits of a cooperative supply chain
relationship between manufacturers and their channel partners. Among these benefits are
greater inventory turns, improved customer service, reduced need for markdowns, and
lower overall distribution costs. Aer outlining the key features of such a partnership, the
authors discuss the reasons for the rapid growth these relationships have experienced
throughout the decade. They close by presenting those facets considered requirements for
a successful channel partnership to evolve.
2.3.2 Channels of Distribution: A Foundation
While the references of Section 2.3.1 specifically addressed issues presented in this thesis,
the following works are more general in nature and provide a broader perspective on
distribution channels. The books presented below discuss the topics of channel
management and their benefits. The journal articles presented below address the
relationship between channels and manufacturing firms and the issue of channel conflict.
Stern and El-Ansary, Lewis, and Mallen all three provide excellent background research
needed for understanding the workings of channels. Their works describe role
specification, the use of power, and conflict management in the channels' environment.
Woodside explores in depth the firm's activities from the perspective of both the
manufacturer and the channel partner. Anderson and Weitz provide a study on the
importance of commitment to channels strategy, emphasizing that pledges to these
partners' successes can build and sustain critical relationships. Magrath and Hardy
acknowledge that conflict between manufacturers and channels is inevitable but need not
be unmanageable. They present strategies for coping with the issue of channel conflict.
Rosenbloom provides a management focus to channels, emphasizing the knowledge
needed to make more effective channel decisions. Finally, Urban and Hauser describe the
role of channels in new product development. They elaborate on relative power between
19

manufacturers and channels, channel contributions to innovation, pricing to ensure channel
partner success, and viewing channels as customers when developing product.
Forrest takes the Urban and Hauser argument one step further. He discusses the benefits
offered by channel partners throughout the product life cycle, arguing that leveraged
channels bring with them reduced development, production, order processing, and delivery
cycle times (Forrest, 23). Adler echoes these sentiments and adds that channels need not
fear competition from direct sales. He asserts that, although it is often difficult to prove
the impact of channels on manufacturing, channels directly and significantly impact market
share and revenues. Because of their knowledge of the market and the configuration
services they offer, channel partners are uniquely qualified to provide greater satisfaction
to a more sophisticated end user (Adler, "Direct" 151; "Soft," 249). There are numerous
other works on the management of channels. The above references, however, provide a
substantial basis of knowledge on the subject.
2.3.3 Thesis-Related Literature
The following references are considered relevant but not critical to a thorough
understanding of the thesis. As I present the thesis, there evolves a need to address
business process reengineering as a possible solution to the challenges posed by channels.
One must ask if reengineering is the result of poor processes, or whether it is simply
necessitated by outdated policies and practices? To answer this question, Hayes and
Wheelwright define reengineering as the necessary response manufacturers must take in
surviving environmental changes brought on by technological shifts. Because server
customers' expectations have grown with their technological sophistication, it is this
definition that is pertinent to the channel's environment. In their work entitled Restoring
Our Competitive Edge: Competing Through Manufacturing, the authors detail a strategy
that addresses production facilities, equipment and management system selection, supplier
relationships, and continuous improvement. Of particular importance, however, is their
presentation in Chapter 10 of the challenges of managing changes in manufacturing's
structure brought about by events such as a shift in distribution strategy.
20

Hammer and Champy, in their seminal work entitled Reengineering the Corporation: A
Manifesto for Business Revolution, introduce the reengineering of business processes as
the only way to sustain competitive advantage. They recommend changing mental models
about how business is conducted as the path to success, emphasizing specific areas within
the firm as ripe with reengineering opportunities. Williams provides a list of
recommendations tailored to the needs of manufacturing firms pursuing reengineering. In
her article "Ten Tips for Reengineering Manufacturing," she highlights fundamental
rehinking of the supply chain, not simply patchwork, as necessary for achieving an
optimal system solution (Williams, 12). Finally, Managing Office Technology, also
addresses reengineering from a manufacturer's perspective in answering the ten most
frequently asked questions pertaining to the topic ('Manufacturing," 22).
No presentation on supply chain management and optimization would be complete
without addressing the issue of leanness. In The Machine that Changed the World,
Womack et al. present a thorough study of the fundamental principles of lean
manufacturing through an analysis of the auto industry. Additionally, Sohal and
Egglestone capture what they consider are the core characteristics of world-class, lean
manufacturing and distribution management in a comprehensive survey of fifty one
Australian manufacturing firms (Sohal and Egglestone, 35).
Any firm considering farming out manufacturing tasks to channel partners must first
comprehend the dynamics of vertical integration. Stuckey and White discuss the
intricacies of such decisions in their article entitled "When and When not to Vertically
Integrate." Vertical integration is defined as the means of coordinating different stages of
the supply chain when inter-company partnerships are not beneficial. In this article, the
authors present four reasons for vertical integration: 1) there exists a risky and unreliable
market, 2) as a defense against market power, 3) to create and exploit market power, and
4) as a response to industry life cycle dynamics. Vertical integration is difficult to
implement and costly to fix if overdone. For these reasons the authors advise that it be
21

avoided unless absolutely necessary. They recommend that managers consider quasi-
integration strategies such as those addressed in this thesis before accepting the risk of full
vertical integration.
Finally, in his article entitled "When is Software Ready for Release?", Michael Foody
provides a commentary on the issue of quality assurance through testing. He elaborates
on increased stress testing, hardware and software bum-in, and factory installed software
testing coverage as a way of ensuring greater customer satisfaction (Foody, 35). The
pertinence of these last references on business process reengineering, leanness, and testing
strategies shall become more evident throughout the remainder of the thesis.
22

CHAPTER 3SERVER CHANNELS OF DISTRIBUTION
The manufacturer's role is to deliver customer satisfaction through a supply chain that
encompasses all activities from raw material acquisition to the shipment of products to
market. As the competition in maturing markets increases, leading manufacturers battle for
their share of ever-shrinking margins by optimizing each link of this chain. Evidence exists
that indicates optimization of the distribution link of the supply chain requires an intimate
relationship between indirect channel partners and the manufacturer. Moreover, this
evidence suggests that such a relationship is absolutely critical to business success in
today's competitive server environment.
Channel partners' ability to customize (sometimes at quality levels higher than the
manufacturer), deliver, and stock product, at costs below what manufacturers can achieve,
establishes them as valued manufacturer customers. As with any customer, manufacturers
must meet their needs through responsive Product (the 'P" signifies the customers'
perception of product as the aggregate of hardware, software and service) and process
design. In this chapter I introduce indirect channel partners in the server market. I
present their roles, interests, and the benefits they offer. I address the issue of why
channels have come to play such a significant role in today's server supply chain. Finally,
I address the impact to business practices that partnering imparts before transitioning to
the manufacturing impacts in Chapter 4.
3.1 Server Channel Partners
I divide server channel partners into two categories-those that deal directly with
manufacturers and those that do not. Both categories include multiple players that
differentiate themselves by business model. Figure 3.1 illustrates the interaction of these
channel partners as they facilitate the flow of product to market. The descriptions that
follow are the result of a coalescence of research and interview data from across the
industry. As the relationship between manufacturers and channel partners evolves so too
23

do the expected roles of channel participants. The details below are a snapshot of these
dynamic expectations taken at the time of this writing.
MANUFATURER
IDistributor TIJ ere
IV
Figure 3.1: Server Channels of Distribution (Partnering for Success, 7)
3.1.1 Resellers
Resellers pursue a volume-based business model.. They extend the manufacturer's reach
in the market by delivering high volumes of low-end, add-on, and upgrade products
directly to end users. Resellers also provide end users with services in accordance with
the terms and conditions identified in contractual agreements with the manufacturer. They
stock inventory for immediate fulfillment to end users, provide rapid and convenient
delivery, and aggressively solicit new accounts. Avnet, Wyle, and Pioneer Electronics are
examples of resellers (Schavone, 50) (Lawrence, 2) (TNSG, 4).
3.1.2 Distributors
Like resellers, distributors also pursue a volume-based business model. To achieve
volume sales distributors partner with value-added resellers in a two-tiered relationship.
Distributors solicit new VARs, provide them training on product configuration methods
and new product introductions, and manage them as valued resources of the manufacturer.
Hallmark, Intelligent Electronics, and Merisel are examples of distributors (Schavone, 50)
(Lawrence, 2) (TNSG, 12).
24

3.1.3 Value Added Resellers (VAR)
Unlike its predecessors, VARs pursue a value-based business model. VARs focus entirely
on designing, developing, and delivering complete business problem solutions to end
users. These solutions may include hardware, software, and services. VARs drive
manufacturing activities to align with market demands by completely customizing
solutions to the needs of each customer. Cerner, Innovative Interfaces, and Informatica
are examples of VARs (Schavone, 50) (Lawrence, 1) (TNSG, 18). The role ofthe tiered
VAR business model resembles that of the direct VAR but, because of its smaller volumes,
has been relegated to deal indirectly with the manufacturer through a distributor network.
3.1.4 Systems Integrators (SI)
System integrators pursue a value-added business model by fulfilling the role of full-
service consultant within the server market. They specialize in selling and integrating
products for complex solutions. SI activities include system requirements analysis,
configuration, installation, and service support. General Electric, Andersen Consulting,
and EDS are examples of firms possessing these capabilities (Schavone, 50) (Lawrence, 2)
(TNSG, 48)
3.1.5 Original Equipment Manufacturers (OEM)
OEMs pursue a value-added business model by imbedding the manufacturer's products
into larger systems, or "turn-key" solutions, to control processes or monitoring activities.
Typically the manufacturer's component represents a small portion of the total product
and often looses its brand identity. MTS Systems, Honeywell, and Fisher Controls are
examples of OEMs (Schavone, 50) (Lawrence, 2).
3.1.6 Independent Software Vendors (ISV)
ISVs pursue a value-based business model The ISV is a source of application solutions
and does not directly sell hardware platforms. However, they play a critical role in
influencing end user purchasing behavior by recommending such platforms. As such,
manufacturers must incorporate ISVs early in their product design phase to ensure
25

hardware and software compatibility. Oracle, Sybase, and Computer Associates are all
examples of ISVs (Schavone, 50) (Lawrence, 3) (TNSG, 35).
In closing this section I want to remind the reader that although the above descriptions are
particular to servers, these channel partners have counterparts in nearly every industry and
market. What any manufacturer must do in pursuing its particular channel's environment
is to first identify a target market segment for its product. Once this task is accomplished
the firm then determines the channels for its product based on several primary factors.
These factors include market maturity, product complexity, channel partners' buying and
selling approaches, level of end user sophistication, and product price points just to name
a few. Manufacturers can optimize the flow of their product to market by leveraging the
strengths of those partners most capable of dealing with these factors.
3.2 Channel Benefits
The manufacturer often has multiple sites responsible for delivering products to numerous
customers. From a macro perspective this is analogous to multiple firms delivering
products to numerous markets. Each of these deliveries has an associated transaction cost
that typically includes overhead accounted for in SG&A. As illustrated in Figure 3.2,
under a direct sales and distribution model these costs are multiplicative in nature.
ing Sites
$
Figure 3.2 Direct Distribution Transaction Costs (Hauser, Session 14)
The immediate and most direct benefit of channels manifests itself in decreased transaction
costs. Under an indirect distribution model a portion of the costs rolled up in SG&A are
26

additive rather than multiplicative. The go-between, or channel partner, provides
efficiencies of scale the manufacturer is otherwise unable to obtain (see Figure 3.3).
g Sites
Figure 3.3 Indirect Distribution Transaction Costs (Hauser, Session 14)
Additionally, the distribution efficiencies introduced by channels bring with them a
decreased burden cost as firms eliminate no longer needed portions of the direct sales
force. However, cost reduction is only a fraction of the benefits realized through channel
partnering.
Not only do manufacturers recognize direct and immediate reductions in SG&A, they also
benefit from economies of scale in a second way. As channel relationships evolve
manufacturers gain increasing market representation through what I call the 'feet on the
street" phenomenon. The hypothetical manufacturer possessing a sales force of one
thousand may, under an indirect distribution strategy, have ten times that many people
pushing its product in the market. The decreased transaction and overhead costs, when
combined with the feet on the street phenomena, actually result in increased market
coverage at a lower SG&A (Rines, 2). In addition to this win-win effect, channel partners
assist manufacturers by providing support services and local market knowledge while
managing costly end user relationships. Finally, they also increase product availability to a
loyal customer base by managing orders, inventory, and flfillment.
27

Although I have to this point only addressed indirect distribution benefits to
manufacturers, channels are also a source of greater end user satisfaction. Channel
partners assist end users by providing increased product availability through rapid
response and customization. They serve as consultants by advising end users on how to
use products. Through the terms and conditions of their partnering contracts they are
empowered to provide select warranty and guarantee services. Finally, they decrease
customer search costs through multi-vendor offerings (Hauser, Session 14). One can
imagine that with all this to offer both manufacturers and end users, channel partners can
be justifiably demanding in their inter-corporate dealings. The logical follow-on question
that becomes a major concern to manufacturing firms pursuing a channel strategy is,
"What are the needs of this powerfid new customer and how do I best meet them?"
3.3 Channel Partners as Customers
Not unlike any other customer, channel partners have particular needs that manufacturing
firms must address to be successful. In a recent study of the server market one study
captured numerous common values sought by channel partners (Hutchinson, 19). The
following is a list, in order of priority, of the business practices and product attributes a
large distributor listed as most valuable to a lucrative partnership.
1. product availability2. delivery performance3. ease of doing business4. return policies for faulty shipments5. credit policies6. relationships with sales people, account representatives, and customer service)7. price as reflected in favorable discount terms8. updated product information that is easily utilized9. easy to understand price book and structure10. breadth of product line and menu offerings11. technical support via phone hotlines12. pre and post-sale technical support programs13. vendor authorization assistance14. order integration and system configuration capability15. technical training programs from the vendor
1 I have included additional examples of channel partner needs in Appendix A, Sample Channel PartnerNeeds.
28

16. product training, especially for new products17. advertising support18. technical marketing programs19. general marketing support programs20. installation support as needed
I divide the above list of needs into issues manufacturing firms address through business
practices and manufacturing processes. Because the remainder of this thesis focuses on
manufacturing, I have chosen to briefly present here several best-in-class business
practices that address these needs.
3.4 Meeting Channel Needs Through Business Practices
When a firm commits to a channel strategy it no longer can simply concern itself with its
own profitability. It must now recognize its success relies upon a symbiotic, if not at times
precarious, relationship. One of the greatest signals a manufacturer can send a partner in
making the transition to channels is the minimization of channel conflict through its
business practices. Three channel-specific business practices, ones focused on the
minimization of channel conflict, are reflected in the manufacturer's training, and
packaging policies.
3.4.1 Pricing (Need #7)
Current server pricing practices rely on a discount off manufacturer's list price (MLP) in
establishing the transfer price between channel partners and their manufacturing vendors.
The vendor establishes the MLP through a market analysis that considers price-to-
performance metrics and consumer pricing sensitivities. This market-minus pricing
practice promotes channel conflict when the vendor's independent sales force, under the
pressures of end-of-quarter quotas, undercuts channel partners by offering similar
discounts directly to end users. Rather than being MLP based, channel pricing policies
must instead be based on a cost-plus model. Such a model would incorporate the end
user's perceived value of the product or its components no matter where in the supply
chain the value is added. One such approach available to manufacturers wishing to pursue
lucrative partner relationships is reflected in an economic value to the customer (EVC)
pricing policy.
29

EVC is a value-based policy that assigns the relative value (defined as benefits per cost) a
given product offers to its customers as that product's market price. This value equals the
maximum quantity the customer would pay for the product given perfect competitive
information (Forbis and Mehta, 233). If a manufacturer is efficient, the EVC price
consists of the actual manufacturing cost plus some reasonable value-added premium.
Under such a policy, no one player in the market feels victimized. The EVC market price
is the best value-benefits per cost-available to the consumer at the time of purchase.
I find it useful to extrapolate the EVC concept to channel-vendor transfer prices in
creating a cost-plus pricing policy under a channels strategy. Using this conceptual
framework, each value-added manufacturing activity in the supply chain would have an
associated economic value to the end user. This EVC would consist of the benchmarked,
best-in-class manufacturing cost plus some premium reflective of manufacturing
efficiencies. For those manufacturers approaching the best-in-class standard, this premium
would be higher. An EVC would be assigned each supply chain task no matter who in the
chain performed the step-the manufacturer or its channel partner. Under such a model,
when the manufacturer chooses to farm out supply chain tasks to its channels, the transfer
price the channel partner pays is simply a sum of the EVCs up to that point in the process.
No confusing discounting policy or convolution of MLP is necessary. This approach, by
assigning value-based prices to all supply chain activities regardless of who performs them,
altogether avoids the issue of channel conflict over pricing.
3.4.2 Training (Needs #6, 8, 11-13, 15, 16, 19 & 20)
Channels are in many ways a sales force for their vendors. As with any sales person, a
channel partner will gladly discuss with customers the product it knows most about in an
effort to avoid questions pertaining to those products about which it knows the least. As
manufacturers introduce a new product, partners feel left alone to figure out its inner
workings-a sink or swim approach to channel management. Using this sink or swim
analogy, such an approach to new product introductions results in many products sinking
30

at the channel level when, if partners had simply been made more aware of their attributes,
the new releases might have swam all the way to the customer's shore.
Throughout my interviews with channel partners I came to recognize the vast
opportunities afforded manufacturers by properly trained channel partners. With little
capital investment, manufacturers can completely alleviate concern over this issue while
building loyalty and product confidence with their partners through an aggressive training
program A comprehensive program, one that spans the product's life cycle, is easy to
manage and costs little to implement. The simplest and most inexpensive training program
involves continual discussions between design engineers, manufacturing engineers, and
channel representatives. This approach to training not only facilitates the product's
success but also creates fertile grounds for a burgeoning relationship.
3.4.3 Packaging (Needs #3 & 10)
Packaging refers to both the containers within which product is shipped and the menu
offerings that manufacturers provide channels. Many products are shipped in containers
that are disposed of upon arrival at the partner site. Pass-through packaging provides an
efficient means of avoiding these costs. Pass-through packaging incorporates each
channel player's needs in the original vendor container. As product arrives at the next link
in the supply chain this container is removed and temporarily stored while the partner adds
value to the system Then, in preparation for shipping, the system is repackaged in its
original container. This pass-through process requires little coordination and offers great
savings to the manufacturer in consumable packaging.
Manufacturers manage product packages, or offerings, through their menu management
policies. These practices are a source of channel conflict because they offer numerous,
often unsolicited, packages that reflect ease of manufacturing rather than customer needs.
A more sensitive packaging strategy, one reflective of channel partners' needs, must be
implemented to successfully convince these critical customers of the manufacturer's
commitment to their success.
31

3.5 Why Channels Now?
Consumer purchasing is a negotiation between the buyer and the seller. As with any
negotiation, the power sources available to participants play a significant role in the final
settlement. One such source available to the participants of a commercial negotiation is
market power. From a microeconomics perspective, market power may be defined as the
ability to influence the price consumers are willing to pay for a product.
Prior to 1985, computer manufacturers had market power over their customers. Price-
insensitive consumers, eager to explore the high-technology world, paid heavily for
immature hardware platforms based on complex designs. This complexity served as a
barrier to consumer knowledge and ensured that the lions share of market power stayed in
the hands of those participants capable of comprehending the intricacies of their systems-
the manufacturers. During this period relatively standardized application packages were
non-differentiable and provided few unique solutions. However, the situation was soon to
change.
By the mid 1980s the personal computer revolution was in full gear. One of the most
fundamental impacts of this era was that new participants entered market negotiations.
These new players were much more knowledgeable and demanding of the technologies in
the industry. At the same time, software applications began to blossom while hardware
technology matured. The result: applications became diverse, the complexity advantage
shifted to the buyer, and consumers rather than manufacaturers now held overall market
power (Burris, 3-4).
Product architectures soon began to reflect these changes. Where customers were once
tolerant of high-cost, high-margin systems based on proprietary standards, they now
demanded low-margin, high-volume, open systems based on common industry standards.
The computer and electronics industry had evolved from being technology driven to
market driven (Pesatori, 14 Sep. 1994).
32

The net result to the manufacturing firm of this market power shift was that margins
shrank and overhead reduction through business process reengineering became necessary
for survival. Part of this reengineering focused directly on the cost of distribution.
Because of the benefits to manufacturers cited in Section 3.2 above, channels became an
obvious solution for firms wishing to remain competitive under the stresses imposed by
their newly empowered customer base.
3.6 The Cost of Doing Business with Channel Partners
Although channels offer immense benefits to the market, they come at a cost. Dealing
with them requires time, coordination, and money. They potentially create a barrier
between manufacturers and the end users of their products, thereby preventing quick and
accurate assessments of customers' needs in a dynamic market. Rather than providing
more accurate market data, they potentially induce delivery variability through the mis-
management of their own business practices. Finally, there is the issue of quality
assurance through indirect distribution.2
I summarize the list of partner needs in Section 3.3 in two product attributes channel-
friendly packages must have. Manufacturers must design products that are: 1) easy to
sell, and 2) technologically comprehensible. They must then deliver these products to
market through partner relationships that mnimize channel conflict using the business
practices mentioned in Section 3.4. To summarize in a single word, quality is what makes
the difference to channels. Quality products are easy to sell. Quality products are through
DFX principles technologically comprehensible. Therefore, I assert that quality products,
ones designed using Design for Channels principles and manufactured using mature
process technologies, meet the needs of channel partners. For this reason I focus
specifically on the issue of the cost of quality to manufacturing under a channels strategy
throughout the remainder of the thesis.
21 wish to acknowledge Mark Coggin, Leaders for Manufacturing Fellow (Class of 1995), for hisinsightfuil comments pertaining to the issue of channel costs.
33

CHAPTER 4SERVER MANUFACTURING AT DIGITAL
Digital server manufacturing occurs in three value-added stages. Stage I, Module
Manufacturing, refers to the process whereby humans and machines populate printed
circuit boards with components. Stage II, System Configuration, refers to the compilation
of modules from Stage I with other subassemblies (backplanes, cabinets, etc.) to form fully
functioning systems. Finally, Stage III, Order Consolidation, refers to the merging of
systems into customer orders. In-house testing occurs at the end of Stage I and Stage II
(see Appendix B, Server Manufacturing Process Flow).
Components OrdersArrive from Stage I SI Stage [1 SII Stage m hipped to
rVendorso-- Modules Testing Configuration Testing Consolidation stoVendors ~~~~~~~~~~~~~~~~Customer
Figure 4.1: Digital's Server Manufacturing ModelUnder a Direct Distribution Strategy
Originally, the proponent organizations chartered with each of the above levels of value-
added activities were independent entities, sometimes dispersed between several
manufacturing sites. However, over the years Digital has consolidated the activities
associated with Stage I and II manufacturing such that the "consolidation centers" of old
are the only exceptions to a standing rule of co-location.
4.1 Stage 1: Module Manufacturing
Server module assembly occurs in three distinct phases. These phases correspond to the
orientation of the Printed Circuit Board (PCB, also known as Printed Wiring Boards)
during assembly. Phase one refers to the placement of Surface Mount Technology (SMT)
components on side one of the PCB. Phase two refers to SMT component placement on
PCB side two. Finally, phase three refers to through-hole component placement on PCB
side one.
34

Phase 1 begins with the deposition of solder paste onto the PCB surface. The placement
of SMT passive components through a chip shooting process follows the screen printing
process.3 A pick and place process for active SMT components and those components
possessing fine-pitched4 leads (tiny medal pins providing electronic connection between
component and PCB) follows the chip shooting process. Once all side one components
are in place, a technician visually inspects the board and routes it through an infrared oven.
This oven uses convection heat to reflow the solder paste, thereby creating the conductive
bond between each component and the PCB. A machine inverts the board and phase two
of Stage I assembly begins.
Phase two assembly differs from that of phase one only in the temporary adhesive used to
affix the components to the PCB. In preparation for the inverted wave soldering
operation of phase three, a tiny drop of epoxy holds each component in place. Epoxy
deposition takes the place of the screen printing process of phase one. The heat of the
reflow oven cures the epoxy just prior to through-hole component insertion.
During phase three assembly all non-machine placed SMT components and all insertable
through-hole components are hand-placed on the PCB. A machine again inverts the board
as it approaches the wave soldering process. Upon completion of wave soldering a
conductive connection has permanently attached all components to the PCB. Aer wave
soldering the boards receive an aqueous cleaning to remove all solder paste residue.
Skilled technicians then add by hand any components determined to be too sensitive to
undergo aqueous cleaning. Following a thorough visual inspection, the finished modules
enter an end of Stage I testing queue before moving on to Stage II assembly (Kanata
Manufacturing Team, 2-4).
3 Passive components contain no resident logic and include transistors, capacitors, and resistors.4 Fine-pitched leads are those where the spacing from lead center to adjacent lead center is less than 0.025inches.
35

4.2 Stage 2: System Configuration
Server system configuration is a compilation of both assembly and testing processes.
Workers assemble the basic cabinet (cab) from kitted parts' bins corresponding to
customer orders. Cab assembly includes the placement of buses, motherboards and power
supplies into the external case for the server. After assembly, a technician conducts a high
potential and ground continuity test to ensure compliance with Underwriter Laboratory's
electrical safety standards. Assemblers then custom configure the cab to the customer's
order. This process includes the installation of cables, the central processor, memory
modules and hardware options as specified by the customer. Following a power-on self-
test (POST), a technician configures the software and conducts an extended system test.
Once this test determines the system operational, the technician loads factory installed
software (FIS) and workers prepare the system's accessories for shipment. An audit is
conducted to verify the system configuration and customer order agree, then workers
package the order for shipment. This final step includes installing the external covers,
applying decals, cleaning, and crating the order (Kanata Manufacturing Team, 14-16).
4.3 Stage 3: Order Consolidation
Because customer orders include components from other manufacturing sites (keyboards,
monitors, etc.), the order is still incomplete after Stage II. Therefore, the last task to be
accomplished before a server reaches the customer is order consolidation. Currently there
are three ways Digital accomplishes this last task.
The first option is the use of consolidation centers. Through backward planning these
facilities drive the production plan such that they receive each order's components on the
same day. However, because of process variability Digital sometimes replaces this method
it with an in-transit merge. Contract carriers conduct an in-transit merge by pulling
together orders at the loading dock of either Digital or its customer. Finally, partial
shipments altogether avoid the issue of order consolidation. A partial shipment occurs
when the customer consents to the shipment of components in piecemeal fashion. This
36

can be a costly alternative since Digital incurs additional shipping costs with each
transaction.
4.4 Testing Strategy
Testing strategies are a fimunction of four coupled variables: 1) the level of product quality
desired, 2) the manufacturing cost of achieving this quality level, 3) the fault detection
capability (expressed as test coverage) needed to achieve this quality level, and 4) the time
required to achieve the desired quality level Testing is not a value-added manufacturing
process. Instead, I describe it as a value-restoration process. It is not something
manufacturers wish to do, but rather is a process required to overcome variability in
imperfect manufacturing processes. To accomplish this task in its server product line
Digital has adopted the end-of-stage strategy pictured earlier in Figure 4.1 and described
in detail below.
4.4.1 Stage I Testing
The first of five testing steps is the visual inspection for component presence that occurs at
the end of Stage I assembly. Those modules passing visual inspection enter step two, in-
circuit testing. With a goal of over ninety-five percent component coverage, this
automated "bed of nails" test detects and diagnoses assembly related defects such as
shorts, opens, and placement errors.5 After the bed of nails, technicians test the module's
functionality in step three, a five-minute quick verification process (QV1). Once again the
goal is coverage greater than ninety-five percent functionality. Those modules passing
QV1 undergo step four, the manufacturers stress analysis (MSA). During the MSA
technicians cycle ambient temperature to place the module under environmental stresses.
After the MSA, technicians verify functionality once again. QV2 is conducted exactly as
QV1 to identify those failures induced by the MSA. Modules surviving the above rigors
then enter the Stage II assembly process (Kanata Manufacturing Team, 6-9).
The testing community commonly refers to in-circuit testing as the beds of nails test because theequipment used resembles a small mattress having hundreds of nails protruding upward through itssurface.
37

4.4.2 Stage 2 Testing
After the basic cab assembly technicians conduct a safety test to ensure there are no
electrical current leaks or shock hazards to the end user. They next apply the Underwriter
Laboratory sticker and partially assemble the system to the customer order. Next, the
POST evaluates the kernel system (CPUs, motherboards, and memory). Finally,
technicians load additional software and conduct an extensive run-in test to ensure the
system performs as intended. At each test point the type of failure detected determines
where in the Stage II process a failed system returns. After completing Stage II testing,
workers package the server for shipping (Kanata Manufacturing Team, 14-16).
4.4.3 The Testing "Safety Net"
I call the above end-of-stage testing strategy a "safety net" approach to quality assurance.
As modules leave Stage I testing and enter Stage II assembly some potential faults remain
undetected. Fortunately, however, there exists a testing safety net at the end of Stage II
that presumably catches these faults. Impending failures left undetected after Stage II
testing remain so until they reach their most costly repair site-the customer. Figure 4.2
below diagrams this dilemma.
Figure 4.2: The "Safety Net" Testing Strategy Dilemma
The yield rates (or customer quality level) after each stage of manufacturing, then, are
actually dependent upon two factors, the yield rate of the previous stage and the test
coverage of the current stage. The problem with this yield convolution effect lies in its
implications to product quality under an indirect distribution strategy.
38
Possible FailuresPossible Failures
)
11.--- - -- - - - I

4.5 Channel Strategy Manufacturing Implications
Channel partners want quality products. One way manufacturers ensure this quality is
through their testing strategies. The safety net testing strategy, however, fails to address
the needs of channel partners because it is based on a direct distribution business model.
Under its direct distribution model Digital has optimized its manufacturing process for the
shipment of fully configured systems (review Figure 4.1). This practice permits faulty
systems to remain as work-in-process until Stage II testing discovers their flaws.
Although ensuring optimal "out-the-door" quality, this approach is sub-optimal under any
other manufacturing or distribution model. In shifting focus to an indirect distribution
strategy for its next generation of servers, Digital must now optimize manufacturing
around the shipping of modules and incomplete systems. This change requires rethinking
manufacturing's approach to quality assurance and may necessitate new testing and
inventory policies or an alternative supply chain testing strategy that incorporates channel
partners.
4.5.1 How Channels Might Work at Digital
Under an indirect distribution strategy some of the manufacturing practices once
conducted in Stages II and Ill are outsourced to channel partners filling end user orders.
Channel partners purchase modules as needed from Stage I manufacturing and perform
system configuration and order consolidation themselves (Figure 4.3).
ComponentsArrive fromVendors
OrdersShipped toCustomer
OrdersShipped toCustomers
Figure 4.3: The Server Manufacturing ModelUnder an Indirect Distribution Strategy
39

Under this approach there exists three tap-off points where product potentially departs
Digital manufacturing. The first tap-off point corresponds to the shipment of fully
configured systems to end users and mirrors the direct distribution model. For this reason
I did not consider it pertinent to my analysis. The second tap-off point corresponds to the
shipment of less than fully configured systems to channel partners after Stage II assembly.
Such systems would be minimally configured and would not contain modules likely to be
customized to customer orders. To achieve quality under the current testing strategy at
this tap-off point would require that systems be fully configured, tested, stripped of these
modules, and shipped to channel partners. This manner of quality assurance could actually
impart additional faults (bent leads and damaged electrical connections, for example) and
create material and labor costs not recognized in revenue. Furthermore, at this tap-off
point the quality of the system after a "build-test-strip-ship" cycle is still no more assured
than that of the individual modules departing Stage I manufacturing destined for later
configuration at the partner's site. Therefore, the only tap-off point to be considered as
pertinent to a channels strategy impact analysis is the end of Stage I point corresponding
to the shipment of fully assembled and tested modules to channel partners.
4.5.2 Module Quality Assurance Through Channels
Where the entire manufacturing link of the supply chain was previously internal, a channels
strategy requires that the enterprise now allow partners to perform some of the value-
added processes found in this link. With Stage II and Stage HII manufacturing outsourced,
the question facing manufacturing is how to ensure module quality without the safety net
of Stage II testing.
To address this question I define product quality as seen by the customer as a function of
several variables. The following relationship exists:
Q =Atp, i t,), where Q - quality, and is directly proportional to channel partner
satisfaction,
p manufacturing process capability,
i safety stock, where the objective of this inventory is to
40

minimize field failures and response time to them, and
t - the testing strategy employed.
Considering this relationship, manufacturers can ensure product quality under a channels
strategy through one of three options: Option 1, continuous investment in improved
manufacturing processes; Option 2, increased production in support of channel partner
safety stock inventories; and Option 3, capital investments in test strategy redesign. Each
of these options warrants comment.
The proposed server includes modules capable of being manufactured using familiar and
mature process technologies. Therefore, to facilitate rapid product introduction at the
lowest possible investment, the new server PDT has chosen to adopt the previous server
generation's manufacturing and testing processes. This kind of incremental process
improvement is not uncommon in industries focused on issues of cost, volume and
capacity (Utterback, xviii). The investment associated with researching and developing
new manufacturing processes, with no guarantee of returns on this investment, often
prevents cost-conscious manufacturing firms from pursuing this option. The result is that
it has little probability of being pursued in firms leveraging piece-part similarities between
product lines. Because of this low probability of implementation and its limited
applicability to the new server's efforts, I did not consider Option 1 as part of this analysis.
As the thesis progresses we will revisit this decision.
Option 2, increased production in support of channel partner inventories, is feasible
although it requires that channel partners willingly accept manufacturers' inventory.
However, channel partners are unwilling to hold server inventory because of upstream
manufacturing deficiencies. Says Ken Waters, president of MicroAge Inc., "None of us
can afford to become the manufacturers' warehouse..." John McKenna, chief executive of
Entex Information Services, Inc., echoed this sentiment at a national conference of Value
Added Resellers, saying, 'Most players in this room are ill-equipped to have excess
inventory" (Markowitz and Sweeney, 1). Therefore, although additional investment by
the manufacturer in finished goods inventory is feasible, it is unattractive because it
41

increases channel conflict through the loss of hard-earned goodwill and the shipment of
poor quality products. These conclusions lead to Option 3.
I assert that since manufacturing processes are relatively static, and because inventory
options are costly both in terms of money and relationships, manufacturers must achieve
greater product quality under a channels strategy through test strategy redesign that
incorporates increased functionality coverage. Although greater coverage results in higher
costs and often longer cycle times, the benefits achieved in long-term channel partner
relationships justify the investment.
4.5.3 A Modeling Approach
If manufacturers pursue test strategy redesign, the question one must ask is, "How much
money should the testing community be willing to invest in order to achieve channels
strategy quality?" The answer is that the testing community should be willing to invest up
to the amount spent if they had pursued the least costly of the alternatives. Since Option
1, perfecting the manufacturing process, was dismissed by the PDT, the only alternative I
pursued was Option 2, the inventory approach. With this in mind, the next logical
question one must ask is, "How much inventory investment is needed to support the new
server?" Once calculated, it is this inventory-equivalent dollar value that the manufacturer
should be willing to invest in increased test coverage to achieve channel partner
satisfaction. In fact, the break-even point actually exceeds this value because of the
opportunity cost of the goodwill loss that occurs as channels either increase their
inventories or cope with poor product quality. However, for purposes of this analysis I
considered only the inventory value for the proposed server.
To determine the dollar value of inventory needed to support the new product I created a
mathematical quality model of the server one year prior to its proposed fielding.6 The
output of the model is the module failure escape rate expected to occur if Digital employs
61 wish to acknowledge David Citorik, Digital Equipment Corporation, for his support in this endeavor.His knowledge of the manufacturing processes and proposed server technology proved instrumental incompleting the model.
42

its current server manufacturing process and testing strategy. From these escape rates,
and the forecasted volumes to be shipped through channels, I determined the level of
inventory investment required to remain competitive under a channels strategy. This
number then became the recommended additional investment in test coverage the testing
community should be willing to invest in order to achieve channels strategy quality.
43

CHAPTER 5MATHEMATICAL MODEL OF SERVER QUALITY
The objective of the mathematical quality model is to forecast the module faults that
channel partners will receive after Stage I testing if current server manufacturing processes
and test strategies are applied to the new product. This forecast is expressed as the end of
Stage I defect escape rate, or simply the escape rate, and is the percentage of total
modules shipped that are expected to be faulty. The findings of the modeling process are
startling and indicate that manufacturing is indeed significantly impacted by a channels
strategy. Based on the escape rates calculated, the model predicts that over thirty percent
of all servers shipped through channels may contain faults. After describing the model I
present its results and use them to then calculate the investment in inventory needed to
overcome this staggering hurdle. It is this dollar value that I recommend as the upper
bound for investing in increased test coverage to ensure channels strategy success.
5.1 The Modeling Process
I predicted the proposed server's faulty module detection and escape rates by
extrapolating actual statistical process control (SPC) fault detection data and escape rates
from a preceding server product (hereafter referred to as the donor). The data collected
follow the following relationship. The number of faulty modules that escape Stage I
testing is equal to the sum of the failures detected at Stage II testing and the number of
failures that escape Stage II undetected. The number of failures left undetected at the end
of Stage II is the number of field failures found at the customer site.7 It follows, then, that
the total number of module failures is equal to the sum of the failures detected at Stage I
testing, at Stage II testing, and by the customer. The following equations illustrate these
relationships.
7 This assumes that all failures occur on or shortly after system start-up at the customer site and thatcustomers have reported them to the manufacturer. Although some failures occur over the life cycle ofeach product, this assumption is based on empirical data demonstrating that a vast majority of failures dooccur at start-up.
44

Efaults = detectedfailuresstage I + escapesstage
escapesstage I = detectedfailuresstg. n + escapesstage
escapesstage E =fieldfailures
Therefore,
Efaults = detectedfailuresstage i + detectedfailuresstag, E+fieldfailures [Eqn. 5.1]
Continuing with the above nomenclature, a manufacturer's test strategy affects the overall
fault analysis as follows:
detectedfailuresstage i = XIPl, and
escapesstagi = Xl(l -P),
where,X1 -total defects at the end of Stage I, andP1 - the probability of defect detection at Stage I testing.
Similarly,
detectedfailuresstg = [Xl(l-PI) + X2]P2, and
fieldfailures = [X2 + X(l-P1)](-P2),
where,X2 - total defects at the end of Stage II, andP2 the probability of defect detection at Stage II testing.
The objective in modeling the new server is to obtain the end of Stage I defect escape rate,
or the quantity (l-P) in the derivation above.
The analysis to predict the detected faults, and subsequently the defect escape rates, for
each of the new server modules occurred in three phases. In the first phase I captured and
normalized fault and escape data from the donor server. In the second phase I
extrapolated this normalized data to create a representation of the proposed server
through a detailed translation process. Finally, in the last phase I applied the fault
detection capabilities of the current test process to the translated quality data in calculating
the detected and escaped module defects for the new server (see Appendix C: Quality
Model Sample Data).
45

5.1.1 Phase 1: Capturing and Normalizing the Donor Server Data
The objective of this step was to record and transform into useful data the failures for an
already existing server by taking a historical look at SPC reports and field failures. The
selection of this data-donating server was critically important because of the nature of
failure modes in electronic modules.
Module defects may be grouped into two categories. First, assembly defects occur when
the manufacturing process damages components. Second, component defects occur when
the materials being assembled are themselves faulty. Assembly defects include electrical
shorts, electrical opens, and component placement errors. Their frequency depends
greatly on the technical complexity of the component's packaging configuration (reflected
in its geometry: size, shape, corners, etc.) and lead formations. This dependency exists
because of a relationship between a component's technical complexity and its electrical
connectors. The number of leads that affix the component to the assembled module is
reflective of its complexity-the higher the lead count the greater the opportunity for
failures to occur. For purposes of this analysis I assumed this relationship to be linear.
Components having like packaging characteristics and lead formations pass through the
same assembly processes and experience similar assembly faults. Once compiled, these
faults become profiles that describe expected assembly failures for components possessing
like technologies. The new server design consists of components in five of these
technology-based, assembly failure profiles: active (logic) through-hole, connector
through-hole, active surface mount, passive surface mount, and active fine pitch. Like
assembly defects, the frequency of component defects also depends on technical
complexity. For components, however, this complexity is a function of the resident logic
found in each. Accordingly, components having like resident logic share similar
component failure profiles. In order to accurately predict the failures for the new product,
I selected a data-donating server possessing similar components dispersed throughout all
five assembly profiles.
46

To capture all five of the donor's assembly failure mode profiles I analyzed three of its
modules. I compiled the SPC reports covering a month of steady state production for
these three modules and determined the detected defects that occurred at each of the five
Stage I test steps for both assembly and component defects. Using the relationship in
Equation 5.2, I normalized the detected assembly defects to the lead level in an effort to
avoid any complexity differences between the donor and the new server.
Y. x10 6
Xik M k N [Eqn. 5.21
where,X - normalized detected assembly defects per million opportunities
for failure (or leads),Y detected assembly defects from SPC report,M a number of modules inspected by type,N - leads per type module inspected,i technology-based assembly failure profile,j assembly failure category (short, open, placement), andk test station (Visual, QV1, MSA, etc.).
These normalized, lead-level, detected defect rates represented the expected assembly
failures that would be uncovered at Stage I testing based on the number of leads, or
opportunities for failure, a component had independent of its type. Using the relationship
in Equation 5.3, I also normalized detected component failures to reflect detected defects
per million components independent of module type.
By x106
A P B x 106 [Eqn. 5.3]
where,A - normalized detected component defects per million opportunities
for failure (or components),B - detected component defects from SPC report,P - number of modules inspected by type,Q components per type module inspected,k test station (Visual, QV1, MSA, etc.), andm - component failure category (resistor, capacitor, etc.).
With this step I completed the detected defects' analysis for Stage I testing.
47

I next extracted the detected donor defects at Stage II directly from SPC data. However,
since only module failure data is reported during systems configuration, the lead-level
versus component-level break down is not as straight forward as that of Stage I. To
calculate the normalized lead-level detected defects rate for Stage I assembly and
component failures, I used the ratio of assembly to component detected defects from
Stage I. This same ratio was then applied to reported field failures to construct the break
down of assembly versus component failures there. At this point in the model the donor
fault story as illustrated in Equation 5.1 above was complete.
5.1.2 Phase 2: Translating the Normalized Data
Since the normalized Stage I lead-level assembly failure rates and component failure rates
calculated above are independent of component complexity or module type, I now could
apply them directly to the eleven modules in the proposed server. The objective of this
translation of the normalized donor data into new server defect rates is to determine the
actual defects per module type. For assembly defects this number is the product of the
normalized lead-level failure rate and the leads per module for all of the new server
modules. As shown in Equation 5.4, the expected defects per module type were
calculated at each test station for the three failure categories (shorts, opens, and placement
errors) in all five of the technology-based failure profiles.
T7k =LxX,, fx10 6 [Eqn.5.4]
where,Tijk -- translated expected defects per each module type found in the new
server,L _ new server's leads per type module, andXijk normalized detected assembly defects per million opportunities
for failure found in Equation 5.2.
For component defects this number is the product of the normalized component defect
rate and the number of components per module. It was determined for each of the
nineteen component types in the new design using calculations similar to those shown in
Equation 5.4 for assembly defects.
48

For Stage II and field failures I used a variant of this calculation to compensate for the
relative complexity level of the new server and the donor. Recall that the model began by
removing the complexity issue through data normalization at the lead-level. However,
because the complexity issue resurfaces in applying the normalized data to the new
product design, complexity must reenter the model as well. To deal with this issue I
calculated a complexity scaling factor (CF). This factor was created by comparing the
total defect opportunities (that is, the component count plus the lead count) of the new
server to that of the donor.
RCF=- [Eqn. 5.5]
D
where,CF - complexity scaling factor,R total new server opportunities for defects (components and leads), andD -- total donor server opportunities for defects.
This complexity factor, when multiplied by the normalized Stage II and field failure
detected defect rates described above, yields the defects per module expected to be
detected under the current test process.
5.1.3 Phase 3: Applying Current Test Detection Capabilities to the Translated Data
The last phase of the quality modeling process accounts for the limitations of the current
server test process. From Equation 5.1 the fault contribution of each of the three
manufacturing stages can be assessed as a fraction of total module faults in the donor.
Applying this contribution factor to the new product then provides a coverage factor
representing test detection capabilities at each manufacturing stage. Dividing the detected
defects by the test coverage factor yields the number of module defects left undetected
that are forwarded to the next manufacturing stage. Under a channels strategy this
number is the defect escape rate that affects inventory levels and test strategy investments.
5.2 Summary of Findings
The quality model described above yields the following defect escape rates for each of the
eleven modules in the new server design.
49

New ServerModule Number
1
23
45
678
910
11
Total Server
Expected End of Stage IDefect Escape Rate
.00508
.0020
.0740.0740.1150.0100.0010.0142.0050.0200.0155
.3357
5.3 Option 3: Capital Investment in Test Strategy Redesign
To determine the upper bound on the additional investment in test coverage redesign, I
next calculated the dollar vale of the inventory required to support the above escape rates.
Inventory is a function of the expected defect escape rate, cost, demand, and lead time for
each module (see Appendix D, Inventory Calculations). Through the quality model I
calculated the module escape rates. I extracted the cost of each module from the donors
manufacturing cost data. A five-day lead-time period was used and reflects the current
server manufacturing process and business practices. Finally, I applied a worse-case
assumption to demand to reflect the forecasted peak period over the projected product life
cycle. For the proposed server, the inventory required to support an indirect distribution
strategy may be found in the following table.
81 I use this module's escape rate calculation as an example throughout Appendix C. The other module'scalculations are identical. I chose to omit them from the appendix for sake of brevity.
50

New Server Inventory Required to SupportModule Number Defect Escape Rate9
1 $6,560.40
2 $2,163.123 $16,221.124 $20,905.305 $24,831.046 $519.007 $63.878 $3,614.279 $822.3610 $697.4811 $276.72
Total $76,674.68
What this finding means is that Digital should invest no more than $76,674.68 in increased
test coverage to ensure channels strategy success. At the current cost of test coverage
this only buys two percent greater product quality to the channels-on just one of the
eleven server modules! At first this number struck me as surprisingly trivial when
compared to the expected revenues to be generated from the sale of this server.
Following the logic of my model I prematurely hypothesized that maybe manufacturing
was impacted very little by channels. However, upon further scrutiny I realized a deeper
meaning to these findings.
5.4 Revisiting the Other Options
Remember from Chapter 4 that I defined quality as a function of manufacturing processes,
inventory policies, and testing strategies. I assumed throughout the modeling process that
these variables interacted to produce the customer's perceived product quality.
Furthermore, I assumed that an improvement in any of these manufacturing related areas
would bring about significant increases in overall quality. It followed from this logic that
the traditional approach of increased test coverage would lead to significantly improved
9 For further detail on these calculations see Appendix D, Safety Stock Inventory Calculations.
51

quality output and customer satisfaction. I then used inventory calculations in assessing
the additional testing investment justified by this rationale.
Under a direct distribution model the assumptions made above, and their follow-on
conclusions, may hold true. However, the inventory calculations for the new server
signaled that, under an indirect distribution strategy, these assumptions were no longer
valid. Said another way, additional investment in traditional methods of quality assurance
seemed insufficient in achieving channel partner and end user satisfaction.
I elaborate on the above server inventory calculations as evidence of this finding. In this
example, the significantly large Stage I defect escape rates, when paired with the justifiable
additional test coverage investment of a mere $76,674.68, are troubling to manufacturing.
Imagine for a moment that you are a product manager in a manufacturing firm Your task
is to determine the quality assurance strategy to pursue for a new product under an
indirect distribution strategy. If you pursue Option 2, increased production in support of
inventories, then only $76,674.68 worth of inventory needs to be kept on hand and the
issue seems trivial. This approach appears satisfactory until you realize that for every
module pulled from this inventory there is a returned module that had already been passed
on to the channels-channels on whom you have invested considerable time and money in
creating a relationship. In fact, thirty-four percent of the modules shipped through
channels will contain faults. Although it takes a relatively small quantity of inventory to
combat these effects, each of these replenishment transactions results in increased channel
conflict and loss of goodwill These unwanted and unnecessary results pose a significant
challenge to what may already be a tenuous relationship. So you, the product manager,
turn to the traditional method of achieving increased quality for product families-Option
3, investment in test strategy redesign. Following the thesis logic, you realize from the
same inventory calculations that this approach is also unsatisfactory. The justifiable
additional investment in test coverage is inadequate. The best quality achievable using this
approach is an intolerable sixty-eight percent-a mere two percent higher than the process
yield without the additional investment in coverage. You therefore conclude that Option
52

1, investment in manufacturing process redesign, is the only feasible solution to the
challenge of channel quality.
In reaching this conclusion, you also realize that this is not a typical approach to quality
for follow-on products where manufacturing processes are traditionally changed
incrementally to reflect product differences. Additionally, even if manufacturing improves
quality through product and process redesign, channel partners may neither recognize nor
benefit from the improvement if it remains buried beneath a facade of inefficient and
uncompetitive business practices. Opportunities for improvement in this area include the
channel-friendly pricing, training, and packaging approaches presented in Chapter 3.
From these thoughts you reason that the challenges a channels strategy imparts on a firm
are so significant that the manufacturing community alone is incapable of coping with
them
The critical issue for manufacturing firms pursuing an indirect distribution strategy,
therefore, lies in cushioning the impact of such a strategy through business practice and
manufacturing process redesign. By addressing both, firms can reach beyond the scope of
traditional quality assurance methods in delivering customer satisfaction. A holistic
perspective, one that incorporates business practices and manufacturing processes
designed around partner needs, is required to succeed in a channels' environment.
5.5 Critique of Modeling Methodology
SPC donor data was normalized to the lead level while conducting the fault analysis. To
do this I assumed a component's technical complexity in both resident logic and assembly
process to be proportional to its lead count. Although little evidence exists in the
literature to the contrary, there exists substantial evidence to support this assertion. Most
notable are Digital's own efforts at testing this relationship directly through empirical
analysis. To test this assumption Digital has conducted a retrospective study of the
mathematical quality model contained in this thesis. Using an approach similar to that
used here, analysts constructed a quality model based on the linearity assumption and an
53

already fielded product. Then actual data was collected to test this model's ability to
predict quality levels. The findings of this experiment were instrumental in substantiating
not only the assumption but also the modeling method itself. Based on this assumption
and field data from similar products, the model predicted to within four percent accuracy
the defect profile of the actual product (Fitzgerald and Griffin, 12).
I concerned myself early on in the modeling process with the issue of lead-level failure
independence, or what the industry refers to as clustering. After much research on the
issue I discovered that my concerns were unfounded. The technology-based failure mode
profiles upon which the model is based incorporate the effects of clustering by analyzing
like-effects across similar components. Lead-level dependency is present, in other words,
but occurs predictably and is compensated for in the technology-based failure profiles
taxonomy.
Finally, one must keep in mind that throughout the modeling process and the subsequent
inventory calculations, I focused on only one of several options proposed. From my
findings it becomes obvious that a blending of the three options is a feasible alternative
also worthy of analysis. Nonetheless, I feel comfortable in concluding that manufacturing
is significantly affected by an indirect distribution strategy reliant upon channels partners in
providing end users with quality products. Additionally, with this critique in mind, this
same model can be used with any new product introduction to conduct a similar
investment analysis under an indirect distribution strategy.
54

CHAPTER 6CONCLUSIONS AND RECOMMENDATIONS
6.1 Thesis Summary
Following the thesis introduction, I presented background data on both my research
environment and on channels of distribution. I then asserted that, although channel
partners provide many market benefits, they also have associated costs. After commenting
briefly on several best-in-class business practices used in coping with these channel costs, I
turned the focus of the thesis on the impact to manufacturing of pursuing an indirect
distribution strategy. I presented Digital Equipment Corporation's server manufacturing
process as a vehicle by which to explore the hypothesis that switching from a direct to an
indirect distribution strategy has significant impact on manufacturing operations. To
substantiate my claim, I then created a mathematical quality model of a product destined
for indirect distribution. This model demonstrated that channels do significantly impact
manufacturing operations. I will now close by presenting the thesis conclusions.
Following these conclusions I will recommend where manufacturers can best focus future
research efforts to succeed in a channels' environment.
6.2 Major Conclusions
Transitioning from a direct do an indirect distribution strategy significantly impacts the
entire supply chain. In particular, this change requires reengineering the way
manufacturing firms achieve customer satisfaction. Local optimization of manufacturing
processes to ensure quality product is no longer enough. A holistic perspective of the
entire supply chain, one that recognizes that the chain is only as strong as its weakest link,
is needed to remain competitive. Such a perspective requires recognition that the
manufacturing discipline cannot go it alone. It requires a cohesive effort resulting from
coordination between business practices and manufacturing processes to be successful in
the channel's arena. Finally, while partnering with channels creates lucrative business
opportunities, to be successful manufacturers must:
55

1. design channel ready products,2. minize channel conflict through efficient business practices, and3. maximize product quality through manufacturing processes that address channel
partner needs.
6.3 Recommendations for Further Studies
This research effort focused on the impact to manufacturing of changing from direct sales
to indirect channels of distribution through partnering. However, once the migration to a
channels strategy has occurred, the issue of dynamic channel's management arises.
Questions such as, '"What is the appropriate channel mix for my product?" and "Will our
channel mix change with the life cycle of the product?" must now be answered.
6.3.1 Channel Migration
Regarding the issue of channel's management, Peter Burris of IDC has proposed an
information-oriented approach that addresses both manufacturing and marketing
implications. Using this approach, the manufacturer can determine which channels to
design a product for (the mix issue), while also defining the key benefit statement most
appealing to each type (the marketing issue).
Burris begins by defining the role of channels in the market. Channels help meet customer
needs by delivering business problem solutions to market. These solutions may consist of
products, services, and information. As with any competitive market environment, certain
players are better at meeting some needs than others. Burris hypothesizes that, by
matching a proposed product's key benefit statement with the channel best equipped to
facilitate its sale, manufacturers can optimally and dynamically determine which channel
mix to pursue. This mix changes over the life cycle of the product as customer expenrience
and account sizes vary. Figure 6.1 illustrates this model.
56

complex
Key BenefitStatement
simple
CustomerAccount Size
none expertCustomer
Experience
Figure 6.1 Channel Migration (Burris, 18)
Additionally, one product may have several key benefit statements. The marketing value
in the above model lies in its recognition that one key benefit statement may be more
effective than another depending on the channel pursued. For manufacturers pursuing
numerous channels with a single product, the ability to correlate a key benefit statement
with its most effective channel is worthy of further research.
6.3.2 Partners in the Life Cycle
The research of Ray Schavone, Digital Equipment Corporation, also elaborates on the
issue of business practices as a reflection of product life cycle. Schavone hypothesizes
that channel selection dynamically evolves with product maturity in accordance with the
life cycle S-curve of Figure 6.2.
57

Customer Literacy
Simple
Eo0o
om0=C00
Complex
Simple
0C
co
00(D-na0
Complex
Technical Market
Support Program
Figure 6.2 Partners in the Life Cycle (Schavone, 52)
Other dimensions to be considered in optimizing the dynamic channel strategy include
product complexity, market support programs, and customer literacy.
Although the tools discussed in this section are insightful, they are but seminal efforts in
the field of channel's awareness studies. By pursuing such tools manufacturing firms
cannot help but become more knowledgeable in the field. However, knowledge is only
half the battle. To succeed in today's competitive channel's environment manufacturers
must continually display their commitment to their partners' success. Without such
commitment the findings these tools uncover shall remain artifacts of research rather than
keys to corporate success.
58

BIBLIOGRAPHY
Adler, Allan. "Direct vs. Channel Sales." Computer Reseller News 578, 16 May 1994:151,162.
Adler, Allan. "Soft Dollars and Sense." Computer Reseller News 579, 23 May 1994:249,256.
Anderson, Erin and Barton A. Weitz. The Use of Pledges to Build and SustainCommitment in Distribution Channels. Cambridge: Marketing Science Institute,1991.
Burris, Peter. "Systems Evolution in the Client/Server Environment." Marlborough:International Data Corporation, 25 Oct. 94.
Buzzell, Robert D. and Gwen Ortmeyer. "Channel Partnerships Streamline Distribution."Sloan Management Review Vol. 36 No. 3, Spring 1995: 85-96.
Copacino, William C. Reinventing the Warehouse." Traffic Management Vol. 33 Iss.11, Nov. 1994: 32.
Darwin, Charles Robert. The Origin of Species. New York: P.F. Collier and Son, 1909.
Davis, Tim R. V. "The Distribution Revolution." Planning Review Vol. 22, Iss. 2,Mar./Apr. 1994: 46-49.
'Distributors' New Services Save Time and Money." Electronic Business Buyer Vol. 20Iss. 5, May 1994: S7-S10.
Fitzgerald, Joan and Pat Griffin. "Defect Prediction Model Verification Process."Maynard: Digital Equipment Corporation, 30 Sep. 1992.
Forbis, John L. and Nitin T. Mehta. "Value-based Strategies for Industrial Products."Business Horizons May/Jun. 1981: 233-243.
Foody, Michael A. "When is Software Ready for Release?" UNIX Review Vol. 13 Iss. 3,Mar 1995: 35-41.
Forrest, David. "Quick Response Brings Retailers Up To Speed." Computing CanadaVoL 20 Iss. 11, 25 May 1994: 23.
Hammer, Michael and James Champy. Reengineering the Corporation: A Manifesto forBusiness Revolution 1st ed. New York: HarperBusiness, 1993.
59

Hauser, John. "Distribution Channels." 15.810 Introduction to Marketing Course Packet.Cambridge: Massachusetts Institute of Technology, 14 Dec. 1993, Session 14.
Hayes, Robert H. and Steven C. Wheelwright. Restoring Our Competitive Edge:Competing Through Manufacturing. New York: Wiley, 1984.
Hoover's Handbook Database. Austin: The Reference Press, Inc., 1994.
Hutchinson, Joseph. "Working with the Channel." Workstations and ServersDistribution. Marlborough: Digital Equipment Corporation, Sep. 1994.
Kaiser, Don. "Partnering for Success." Maynard: Digital Equipment Corporation, 13Dec. 1994.
Kanata Manufacturing Team. '"KAO Server Assembly and Test Plan," Digital EquipmentCorporation, 3 February 1994.
King, Michael. "Q3 Competitive Operational Results Summary." Maynard: DigitalEquipment Corporation, 2 May 1994.
Kistner, Leonard J., Anthony C. di Benedetto, and Sriraman Bhoovaraghavan. "AnIntegrated Approach to the Development of Channel Strategy." IndustrialMarketing Management Vol. 23 Iss. 4, Oct. 1994: 315-322.
Lawrence, Charles. "Business Partner Profiles." Marlborough: Digital EquipmentCorporation, 29 Nov. 1994.
Lewis, Edwin Henderson. Marketing Channels: Structure and Strategy. New York:McGraw Hill, 1968.
LIVEWIRE. '"New Computer Systems Division to Increase Focus on Core Systems,Simplify Structure, Meet Customer Demands." Worldwide News. 18 Jul. 1994.
Magrath, Allan J. and Kenneth G. Harding. A Strategic Framework for DiagnosingManufacturer-Reseller Conflict. Cambridge: Marketing Science Institute, 1988.
Mallen, Bruce E. Principles of Marketing Channel Management: InterorganizationalDistribution and Relations. Lexington: Lexington Books, 1977.
Maltzman, Alan. "Competitive Server Business Model." Maynard: Digital EquipmentCorporation, 11 Jul. 1994.
Manchester, Philip. "Strategic Shifti by Top Companies." Financial Times 31 May 1994:3111.
60

'Manufacturing Expert Answers Top Ten Questions About Reengineering." ManagingOffice Technology Vol. 39 Iss. 10, Oct. 1994: 22-24.
Markowitz, Elliot and Jack Sweeney. "Executives say they will not warehouse excessproduct." Computer Reseller News, 10 Oct. 1994: 1.
Palmer, Robert. "State of the Company Address." Maynard: Digital EquipmentCorporation, 16 Jul. 1994.
Pesatori, Enrico. "Landscape of the IT Industry." Cambridge: Digital EquipmentCorporation, 12 Sep. 1994.
Raulerson, Peter. "Compaq's Channel Marketing Strategies for Servers." Merrimack:Paratechnology, Inc., 15 Sep. 1994.
Rifkin, Glenn and George Harrar. The Ultimate Entrepreneur. Chicago: Contemporary,1988. ST: The Story of Ken Olsen and Digital Equipment Corporation.
Rines, David. 'Dealers in Transition: The Changing Dealer/End-user Relationship."Distribution Channels-Midrange Solutions. International Data Corporation, May1994.
Rosenbloom, Bert. Marketing Channels: A Management View 4th ed. Chicago: DrydenPress, 1991.
Schavone, Ray. '"Tools and Methods: Creating Customer Ready Products Using thePM&D Process." Maynard: Digital Equipment Corporation, 21 DEC 94.
Sohal, Amrik S. and Adrian Egglestone. '"Lean Production: Experience AmongAustralian Organizations." International Journal of Operations and ProductionManagement Vol. 14Iss. 11, 1994: 35-51.
Stern, Louis W. and Adel I El-Ansary. Marketing Channels. Englewood Cliffs: Prentice-Hall, 1977.
Stuckey, John and David White. "When and When Not to Vertically Integrate." SloanManagement Review Vol. 34 No. 3, Spring 1993: 71-83.
TNSG (The New Software Group). Channels Workbook. Maynard, Digital EquipmentCorporation, 1993.
Urban, Glen L. and John K Hauser. Design and Marketing of New Products 2d ed.Englewood Cliffs: Prentice-Hall, Inc., 1993.
61

Utterback, James M. Mastering the Dynamics of Innovation. Boston: Harvard BusinessSchool Press, 1994.
Williams, Kathy. "Ten Tips for Reengineering Manufacturing." Management AccountingVoL 76 Iss. 1, Jul. 1994: 12-13.
Womack, James P., Daniel T. Jones and Daniel Roos. The Machine that Changed theWorld. New York: HarperPerennial, 1990.
Woodside, Arch G., et al. Foundations of Marketing Channels. Austin: Austin Press,1978.
62

APPENDIX ASAMPLE CHANNEL PARTNER NEEDS
The following Pareto diagrams illustrate the relative importance of numerous relationship
dimensions between the manufacturer and the channel. This appendix is the result of a
collaborative research effort between Ray Schavone of Digital Equipment Corporation's
Offering Management Initiative and Paratechnology, Inc., a server market analyst located
in Belleview, Washington.
A.1 SME VARs (tiered)Product/Internal useTechnical support
Pre-softwareProduct expertsLeads Product trainingFuture direction
Pre-product for resale Training
Picing, SKUPartner base
White papersSuccess stories
Formal relationshipMarketing materialsOvercome objectionsPress releasesProdution certificationExpertise recognition
1 2 3 4 5 6Importance Ranking
63

A.2 Value Added ResellersProduct for resaleTechnical support
Pre-softwareLeads
Product trainingPricing, SKU
Future directionPartner base accessProduct experts
Marketing materialPress releasesProduct/Internal use
Marketing supportTrainingWhite papers
Overcome objectionsSuccess storiesFormal relationshipExpertise recognition
1 2 3 4 5 6
Importance Ranking
A.3 Fortune 500 Focused ResellersPricing, SKUProduct expertsFuture directionProduct/Internal usePre-softwareTechnical supportWhite papersFormal relationshipProduct for resaleTrainingLeadsPartner base
Success stories
Marketing materialsPress releasesMarketing supportExpertise recognitionProduct cerificationOvercome objectionsProduct training
1 2 3 4 5 6
Importance Ranking
64
I
I
II
I
I
I __ I
I �M
I
I
I

A.4 Independent Software Vendors(also known as Commercial Developers)
Product/Intemrnal use
Product for resalePricing, SKUProduct expertsFuture directionPre-softwareTechnical supportWhite papersTrainingPartner base accessSuccess storiesExpertise recognitionMarketing materialsMarketing supportProduct trainingPress releasesLeadsFormal relationshipOvercome objectionsProduct certification
I I
i I_~~~~~~~I IllI.~~ ~~~~~~~~~~ II l | l ll
|~~~~~~~~~~~~~~~~~~~~lll
|~~~~~~~~I I I
I IIIII III
-~~~~~~~~~~~~ I II_~~~~~~~~~~~~~~~~I II
3 4 5 6
Importance Ranking
A.5 Systems IntegratorsProduct/Internal use
Product for resalePricing, SKUProduct expertsFuture directionPre-softwareTechnical supportWhite papersTrainingPartner base access
Success stories
Expertise recognitionMarketing materialsMarketing supportProduct trainingPress releasesLeadsFormal relationshipOvercome objectionsProduct certification
1 2 3 4 5 6
Importance Ranldking
65
I
�0__ M

APPENDIX BSERVER MANUFACTURING PROCESS FLOW
Stage I: Module Manufacturing
o
X X
U................... . ....
Solder PasteScreen Print
. I
WaveSolder
Passive SMTComponentPlacement
AqueousClean
TManual
Thru-hole &Odd-FormComponentPlacement
I.,............................ ...................... .........
H
a) T
) a
Post WaveAssembly
Active SMT &Fine-PitchComponentPlacement
. .
>,QE0(D0
a) I
r-
-N0)w
-a
=Oco(00-
~I
EpoxyCure
FinalInspection
VisualComponentInspection
T
Active SMT &Fine-PitchComponentPlacement
SolderReflow
I-
Semi
Stage ITesting
.~~~~~~t Stg IIPassive SMTComponentPlacement
*
PCBInversion
EpoxyDispense
66
I
I
,..... .. ........ I........- ........... .... I.. ................
F
t
0.
I
......................... ............................ ........... :
.I
1

Stage H: System Configuration
Stageinm
Package
Audit
IuIL. .
Stage I
Basic CabAssembly
IZIHi Pot &Ground
Continuity Test
Configure toCustomer
Order
BagAccessories
Power-OnSelf-Test
Load FactoryInstalledSoftware
SoftwareConfiguration
ExtendedTesting(Run-In)
67
T

Stage I Test Flow
StageI
Assembly
RETEST
RETEST
FAIL
RETEST
FAIL
PASr/Field
( Stage II ( Service
68
In Circuit Test
IL
In CircuitDiagnostic
Quick Verify I Debug
MSAStress
Screening
Quick Verify II Debug
I,W
-

Stage II Test Flow
69

APPENDIX CQUALITY MODEL SAMPLE DATA
Phase 1: Capturing and Normalizing the Donor Server Data
Actual Donor Module #1 Captured Data:Module #1 Assembly Visual Final l-Circuit Quick Manufactui Quick Subtotal
Failure Codes Assembly Insp. Testing Verification #1 Stress Analysis Veridfication#2
Omitted fiomcount* 46 0 _ 0 0 46Unknown 64 115 85 0 1 265
1. AivePTH _--_ _- _____ 2 ___
A. Short 7 32 0 0 0 3B. O en 31 9 0 3C. Placement 0 57 1 0 C
. Connector _. _.. _.. _ .__A. Short 0 0 0 0 0B. Open 4 0 0 12
C. Placement 0 3 0 0 0 33. AciveSMT .................. _
A. Short 1 6' 2 0 0 29
B. Open 0 266: S 0 0 321C. Placement 31233 0, 0 148
4. Passive SMT .................. .SA _____ ______ _____ _ A. Short 1 7 C 0 8
B. Open 2 26 0 0 0 46C. Placement 1 09 260 6 1 37
5. Aive Fine-Pitch _ _ _ _
A. Short NA N/A N/A N/A N N/B. Open N/A N/A N/A N/A N/ N/C. Placement N/A N/A N/A NiA N/A N/
hi Resistor _ __ ___ _ ......6. Comp. Failure Co des __ _ _....................... ---------
A. U-Proc _0 0 6 0 0 6
B. VLSI 1 0 52 0 0 53
C. LSCustom o 5 3 , o _
D. 8SI 0 5 17 0 0 22
. SRAML 0 9 35 0 0 44F. FLASH 0 0 0 0 0 0
G. SROM 0 0 2 0 0 2VeEPROM . 1 2 0 :
I. PAL o 2 0 0 0 2J. Linear 0 2 o 0 0 2
K Osakator 0 1 5 0 0 6
L Transistor o 0 o 0 0Resistor 7 0 7
N. Capacitor 12 3 61 0 0 21
O. Diode 1 2 1 0 0 4P. Connector 0 2 17 0 0 19
Q. Etch 3 5 31 0 0 39IL Inductor 0 0 0 0 0 0
7. isagnosed Cmpo ent Failwres '-:-=__-_A. U-Proc 0 0 0 0 0 0
B. VLSI 0 0 0 0 0 oC. LSI/Custom 0 1 1 0 0 2
D. SSI 0 1 3 0 0 4. SRAM 8 0 0 9
F. FLASH 0 0 0 0 0 0
G. SROM 0 0 0 0]I EEPROM 0 0 0 0 0 0
L PAL 0 0 0 0 0 0J. Linear 0 o oIK Osciffat" 0 0 1 0 0 1L Transistor o o 0 o o oKL Resistor 0 0 0 0 0 0N. Capacitor 0 1 o 0 oO. Diode 0 I 0 0 0 1
P. Connector 0 0 0 0 0 0
Q. Etch o o . o o 0
R. Inductor 0 0 0 0 0 0SUBTOTAL 271 98S 390 0 2 1651Sample Size 3371 3420 3430 13 142 10376
* Comp. Vendor Unquat _
70

Actual Donor Module #2 Captured Data:Module #2 Assembly Failure Codes Visual Final In-Circuit Quick Manufactuuing Quick Subtotal
Assembly Insp. Testing Verification #1 Stress Analysis Verification #2Omitted (Glue Mis-application) 0 0 I 0 0 1Unknown 39 104 86 0 4 2331. Active PTH --- ._... .
A. Short N/A N/A N/A N/A N/A 0B. Open N/A N/A N/A N/A N/A 0C. Placement N/A N/A N/A N/A N/A 0
2. Connector PTH _ A. Short 11 18 0 0 0 29D. Open 1 1 11 0 0 13C. Placement 6 1 4 O 0 11
3. Active SMT IA. Short 2 6 o ol o 8B. Open 1 85 31 0 0 117C. Placement 0 37 2 0 0 3
4. Passive SMT ! . . . . . .:__El_ _A. Short 17 18 0 0 0 35B. Open 75 134 3 0 0 212C. Placmont 161 235 1 0 0 252
5. Active Fine-Pitch A. Short 0 44 I 0 0 45B. Open 0 369 161 0 0 535C. Placement 0 1701 1 0 171
6. Comp. Failure Codes . . . . .A. U-Proc 0 0 0 0 0B. VLSI 0 4 4 0 0C. LSI/Custom 0 2 _ 7 0 1D. SSI 0 3 0 0 0 3E. SRAM a o a o ,0o F. FLASH 0 0 19 0 3 22G. SROM 0 0 0 o o a_ EEPROM 0 0 1. 0 0 1
L PAL a 6 3 O 0 9J. Linear 0 0 K Oscillator 0 0 3 0 0 31L. Transistor 0 16 0 0 0 161M. Resistor 0 130 2 0 0 132N. Capacitor s 7 1 o 0 16O. Diode 0 0 0 0 0 0P. Connector 3 1 6 0 0 10Q. Etch o 1 2 0 0 3R. Inductor 2 O O O O 2S. Noise Filter 0 _ 1 0 01T. Transformnner 0 0 0 0 7. Misdiagnosed Comp. FailuresA U-Proc 0 0 0 0 0B. VLSI 0 o 1 0 0C. LSI/Custom 0 O O O _ _
D. SSI 0 1 0 0 0 1E. SRAM 0 0 0 0 0 0F. FLASH 0 0 0 0 0 G. ROM 0 0 0 0
i0 0G. SROM o o o o! o o
H. EEPROM C O O O O aL. PAL , o o o o
J. Linear 0 0 0 O _ 0K Oscillator 0 0 0 0 0 0L. Transistor C . 0 0 0 0 0M. Resistor 0 2 0 0 0 2N. Capacitor . .. 00 0 O. Diode 0 0 0 0 0 0P. Connector 0 0 0 0 0 0Q. Etch 0 0 0 0 0 0R Inductor 0 0 0 0 0 0S. Noise Filter 0 0 0 0 0 0T. Transfonnrmer 0 0 0 0 0 0
SUBTOTAL 181 1395 352 0 8 1936Sanmple Size 1728 1525 1685 3 94 5035
71

Actual Donor Module #3 Captured Data:Module #3 Assembly Failure Codes Visual Final In-Circuit Quick Manufacturing Quick Subtotal
Assembly Inspection Testing Verification#1 StressAnalysis Verification #2Unknosn 17 16 32 0 0 651. Activo PTH . ... ..XI X_ I_ X
A Short 24 0 0 0 0 24B. Open 6 0 0 0 0 6C. Placement 0 0 0 0 0.~~~~~~~~~~~~~~~~~~~~~~~~~~- --------- -- _ -_ X --
2. ConnectorPTHA Short 5 13 9 0 0 27B. Open 2 0 12 0 0 14C. Placement 9 4 20 0 15
3. Active SMT ch __.A Short 0 2 0 0 0 2B. Open 0 8 2 0 0 10C. Placement 1 1 0 0 4
4. Passive S r MTCdA. Short 0 1 0 0 0 1
B. Ope 1 2 0 0 0 3C. Placement 28 71 0 0 0 99
5. Aive Fine-Pitch ... __ _ _ _ . _A Short N/A N/A N/A N/ N/A _N/AB. Open N/A N/A N/A N/A N/A N/AC. Placement N/A N/A N/A NiA N/A N/A
6. Component Failure Codes .A. U-Proc N/A N/A N/A N/A N/A N/AB. VLSI 0 0 5 0 0 5C. LSl/Custom 0 0 0 0 0 0D. SSI 0 2 0 0 0 2E. SRAM 0 0 0 0 0 aF. FLASH 0 0 0 0 0 0G. SROM 0 0 0 0 0 0_IL EEPROM 0 0 0 0 0 0I. PAL 0 0 0 0 0 0I. Linear 0 0 0 0 0 0K Oscillator 0 1 2 0 0 3L. Transistor 0 0 0 0 0 0M. Resistor 0 12 1 0 0 13N. Capacitor 3 1 0 0 0 4O. Diode 0 3 0 0 0 3P. Connector 3 3 8 0 0 14Q. Etch 0 0 0 0 0 0R. Inductor 0 0 0 0 0 0
7. Misdiagnosed Comp. Failres ' 0A. U-Proc N/A N/A N/A N/A N/A N/AB. VLSI 0 0 0 0 0 0C. LSI/Custom 0 0 0 0 0 0 D. SSI 0 0 0 0 0 0E. SRAM 0 0 0 0 0 0F. FLASH 0 0 0 0 0 0G. SROM 0 0 0 0 0 0H. EEPROM 0 0 0 0 0 0L PAL 0 0 0 0 0 0
J. Linear 0 0 0 0 01 0K Oscillator 0 0 0 0 0 0L. Transistor 0 0 0 0 0 0M. Resistor 0 0 0 0 0 0N. Capacitor 0 0 0 0 0 0O. Diode 0 0 0 0 a 0P. Connector 0 0 0 0 0 0Q. Etch 0 0 0 0 0 0R. Inductor 0 0 0 0 0 0
SUBTOTAL 99 141 74 0 0 314Sample Size 985 881 1026 UNK 1i 2893
72

Sample Normalized Stage I Test Assembly Defect Rates (per million leads)
Failure Mode Profile
a) Shortsb) Opensc) Placement
a) Shortsb) Opensc) Placement
DonorModule #1
DonorModule #2
DonorModule #3
a) Shortsb) Opensc) Placement
a) Shortsb) Opensc) Placement
a) Shortsb) Opensc) Placement
1.
2.
70.8811.3269.4
N/AN/AN/A
3.640.918.5
N/AN/AN/A
3.
2.140.213.8
10.048.814.3
4.
10.680.8
139.5
2.07.3
81.2
8.510.717.5
0.91.9
66.3
5.
N/AN/AN/A
0
0
10.4
N/AN/AN/A
112.468.428.8
6.75.43.4
73

Sample Normalized Stage I Test Component Defect Rates (per million components)
Component #1
23
45
67
8
910
11
12
13
14
15
16
17
18
19
DonorModule #1
17497728212401292N/A583876585195
1750N/A
10
20130N/A
11390N/AN/A
DonorModule #2
N/A24981464
73
N/A10798N/A297440N/A594524643431
0-6110850
1843
0-41823594
DonorModule #3
N/A4873
0--3112378N/AN/AN/AN/A
0-*3112N/A1542N/A3920136317
0-43112N/AN/A
10 Where actual SPC detected defect rates were zero, an eighty-five percent confidence interval was
calculated from a Poisson distribution.
74

Sample Normalized Field Failure Module Defect Rates
Number Failed2228213
536
Number Shipped1402116911697251099140
Detected Defectspermillion modules
16000240002000180004800043000
Sample Calculation of Total Defect Opportunities and Complexity Scaling Factor
New Server DefectOpportmunities
239267693322565232403174
Donor Server DefectOpportunities
510577724090409096135105
Complexity Factor0.470.870.811.380.340.62
75
Module #1
23
45
6
Module #1
23
45
6
x A_
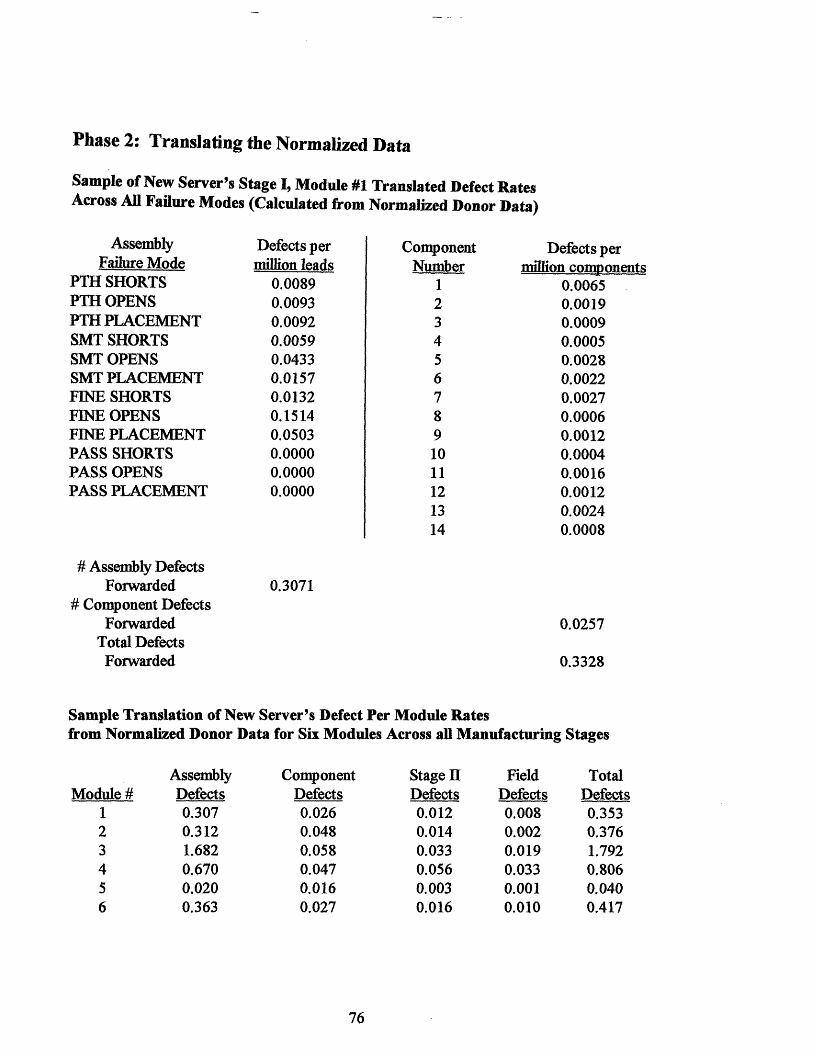
Phase 2: Translating the Normalized Data
Sample of New Server's Stage I, Module #1 Translated Defect RatesAcross All Failure Modes (Calculated from Normalized Donor Data)
AssemblyFailure Mode
PTH SHORTSPTH OPENSPTH PLACEMENTSMT SHORTSSMT OPENSSMT PLACEMENTFINE SHORTSFINE OPENSFINE PLACEMENTPASS SHORTSPASS OPENSPASS PLACEMENT
Defects permillion leads
0.00890.00930.00920.00590.04330.01570.01320.15140.05030.00000.00000.0000
ComponentNumber
1
23
45
67
8910
11
12
13
14
Defects permillion components
0.00650.00190.00090.00050.00280.00220.00270.00060.00120.00040.00160.00120.00240.0008
# Assembly DefectsForwarded
# Component DefectsForwarded
Total DefectsForwarded
0.3071
0.0257
0.3328
Sample Translation of New Server's Defect Per Module Ratesfrom Normalized Donor Data for Six Modules Across all Manufacturing Stages
AssemblyDefects0.3070.3121.6820.6700.0200.363
ComponentDefects0.0260.0480.0580.0470.0160.027
Stage IIDefects0.0120.0140.0330.0560.0030.016
FieldDefects0.0080.0020.0190.0330.0010.010
TotalDefects0.3530.3761.7920.8060.0400.417
76
Module #1
23
45
6

Phase 3: Applying Current Test Detection Capabilities to the TranslatedData to Arrive at Stage I Escape Rates
Sample Calculation
AssemblyFailure ModePTH SHORTSPTH OPENSPTH PLACESMT SHORTSSMT OPENSSMT PLACEFINE SHORTSFINE OPENSFINE PLACEPASS SHORTSPASS OPENSPASS PLACEComponent
1
23
45
678
910
11
12
1314
# AssemblyDefects Forwarded# ComponentDefects ForwardedTotal DefectsForwarded
of New Server's Stage I,Defects per million
opportunities (DPMO)forwarded to testing
0.00890.00930.00920.00590.04330.01570.01320.15140.05030.00000.00000.0000
0.00650.00190.00090.00050.00280.00220.00270.00060.00120.00040.00160.00120.00240.0008
0.3071
0.0257
0.3327
Module #1 Defect Escape Rates"
"Channel Impact"DPMO that escape DPMO that escapeIn- Circuit Testing QV1
0.0001 0.00010.0093 0.00060.0092 0.00010.0001 0.00010.0022 0.00040.0008 0.00020.0001 0.00010.0076 0.00150.0025 0.00050.0000 0.00000.0000 0.00000.0000 0.0000
0.00330.00190.00040.00000.00010.00010.00010.00000.00060.00000.00020.00060.00240.0008
0.0318
0.0106
0.0423
0.00030.00050.00000.00000.00010.00000.00010.00000.00000.00000.00010.00030.00000.0000
0.0036
0.0015
0.0050
11 The only detection capability rates pertinent to this analysis are the in-circuit and quick verificationtests of stage one.
77

APPENDIX DINVENTORY CALCULATIONS
I calculated the dollar value of inventory needed on hand to support the expected defect
escape rates for each of the new server's modules using the following formula:
inventory level = [(unit demand during lead-time x defect escape rate) + (2 x standarddeviation)] x module cost per unit
The table below shows these values calculated for each of the eleven modules of the
server. The following assumptions apply:
* lead-time is five days based on current manufacturing and business practices
* sixty percent of volume is sold through channels
* total unit demand during peak production is 740 units based on sales
projections
A B C D
and marketing
E
A =.60 x 740 units C=(AxB)+2 A/IxB
Peak Lead-TimeDemand Through
Channels
444
444
444
444
444
444
444
444
444
444
444
ConpcaentEscape Rate
From Quality Model
0.005
0.002
0.074
0.074
0.115
0.01
0.001
0.0142
0.005
0.02
0.0193
Upper Bound
Inventory Level1 2
5.34
2.87
44.32
44.32
65.35
8.65
1.86
11.33
5.34
14.84
14.42
12 The distribution is Poisson with a standard deviation equal to the square root of the product of the
number of units demanded and the escape rate. This upper bound represents a normal approximation, at a97.7% confidence level, which breaks down only when means are four or less. Therefore, for modules 1,2, 7, and 9 1 replaced the value in Column C by the actual Poisson upper bound (interpolated) at 98%.
~~78 ~ ) 3 i78 '~1 I
E=CxD
New ServerModule No.
1
2
3
4
5
6
7
8
9
10
11
Total
ModuleCost ($)
1228.54
753.70
366.00
471.69
379.97
60.00
34.34
319.00
154.00
47.00
19.19
InventoryCost ($)
6560.40
2163.12
16221.12
20905.30
24831.04
519.00
63.87
3614.27
822.36
697.48
276.72
76674.68
. _ _ . . _ _ _ _ . . _ _ _-.